Article

Interference Pattern Anomaly of an Acoustic Field Induced by Bottom Elasticity in Shallow Water

1
State Key Laboratory of Acoustics, Institute of Acoustics, Chinese Academy of Sciences, Beijing 100190, China
2
School of Physical Science and Engineering, Beijing Jiaotong University, Beijing 100044, China
*
Author to whom correspondence should be addressed.
J. Mar. Sci. Eng. 2023, 11(3), 647; https://doi.org/10.3390/jmse11030647
Submission received: 16 February 2023 / Revised: 8 March 2023 / Accepted: 18 March 2023 / Published: 20 March 2023
(This article belongs to the Section Physical Oceanography)

Abstract

:
This paper reports the interference pattern of an acoustic field in the 100–300 Hz frequency band observed in a shallow water experiment. Assuming there is a conventional fluid sea bottom, the observed interference pattern is first demonstrated to potentially be abnormal, as a measured waveguide invariant of 1.03 corresponding to the 200–300 Hz frequency band could indicate that the bottom sound speed is relatively high, which is inconsistent with another observation from the interference pattern that the sound field is dominated by only one mode if the frequency is lower than 150 Hz. The numerical analysis shows that, owing to the high bottom sound speed, the third mode can still strongly interfere with the first mode at a frequency of 150 Hz, at least. Accordingly, a dual-layer sea bottom model consisting of a fluid sediment layer and an underlying half-space elastic substrate was proposed to interpret the observed anomaly. The results reveal that the acoustic leakage attenuation due to the elastic substrate plays a major role in the observed dominance of one mode in the sound field occurring below a frequency of 150 Hz. Therefore, the deep bottom’s elasticity may have a significant impact on the interference characteristics of low-frequency acoustic fields in shallow water under certain conditions.

1. Introduction

Due to the existence of many kinds of inhomogeneities and fluctuations, sound propagation in the ocean is generally a very complex process. Therefore, for many years, studies have aimed to reveal the characteristics of ocean acoustic fields on large time and space scales [1]. However, with the development of underwater acoustic measurement technologies, more accurate observations of small-scale temporal and spatial changes have led to the discovery that the acoustic fields may exhibit stable interference characteristics. An acoustic interference phenomenon in the ocean generally features alternating bright and dark striations on the range-frequency images of the sound intensity (i.e., ‘sound intensity images’), the slope of which can be characterized using a single scalar parameter, the waveguide invariant (WI) [2,3]. Over the past few decades, ocean acoustic interference phenomena have aroused the interests of many research groups around the world. The use of such a highly informative scalar parameter can engender many applications, such as improving sound spatial correlation [4,5,6], passive localization [7,8,9], geoacoustic inversion [10,11,12], and fluctuation characterization [13,14].
Exploring the impacts of bottom characteristics and geoacoustic inversions constitute an important aspect of the theoretical and applied studies on WIs. Based on the Wentzel-Kramers-Brillouin (WKB) approximation, Shang et al. [15] derived a very simple analytical expression for the WI of a shallow water Pekeris waveguide, clearly revealing the effect of fluid sediments. In a recent WKB-based theoretical contribution [16], Byun et al. derived a closed-form expression of the WI of a Pekeris waveguide with a fluid bottom. Heaney et al. [10] studied the joint inversion of geoacoustic parameters based on the interference pattern of the sound field, pulse broadening, and transmission losses, and the method was also applied to high-frequency acoustic signals [11]. Knobles et al. [12] recently reported the maximum-entropy geoacoustic inversion using the WI value estimated from ship noise. Cho et al. [17] proposed the concept of the array invariant, which extends the concept of WI to a range-dependent environment with a mildly sloping bottom and developed a source depth estimation method based on it.
The present paper reports the sound field interference pattern observed in a shallow water experiment. Assuming there is a conventional fluid bottom, the observed interference pattern is first demonstrated to potentially be abnormal, as a measured WI of 1.03 corresponding to a 200–300 Hz frequency band may indicate that the bottom sound speed is relatively high, which is inconsistent with another observation from the interference pattern that the sound field is dominated by only one mode if the frequency is lower than 150 Hz. The numerical analysis shows that, owing to the high bottom sound speed, the third mode can still interfere strongly with the first mode at a frequency of 150 Hz, at least. To understand the observed anomaly, a dual-layer bottom model consisting of a fluid sediment layer and an underlying half-space substrate was proposed, and the detailed geoacoustic parameters of this model were inverted based on the measured spatial correlations of the sound field. Thereafter, numerical simulations based on the inverted geoacoustic parameters are performed to reasonably interpret the observed anomaly. To the authors’ knowledge, no studies on the ocean acoustic interference phenomenon and WI considering the impact of bottom elasticity have been reported. The results of the present study show that the elasticity of the deep bottom may significantly impact the interference characteristics of a low-frequency acoustic field in shallow water under certain conditions.
The rest of the paper is organized as follows: In Section 2, we present the fundamental theories of this work, including the basic derivations of WI theory, the computational method for extracting the WI from a sound intensity image, and some basics of sound spatial correlation theory. Section 3 presents the experimental results and the corresponding detailed fluid-bottom-based analysis demonstrating the existence of an interference pattern anomaly. In Section 4, we present the proposed dual-layer bottom model and the geoacoustic inversion scheme, followed by a detailed interpretation of the observed anomaly. Section 5 concludes the study.

2. Fundamental Theories

2.1. Waveguide Invariant Theory

According to normal mode theory, the sound pressure field excited by a point source in a horizontally invariant ocean waveguide can be expressed in the frequency domain as follows [18]:
P z s , z r , r , ω = m A m z s , z r , ω , r e i k m ω r ,
where zs and zr are the depth of the source and receiver, respectively; ω is the angular frequency of the sound; r is the distance between source and receiver; i is the imaginary unit; and A m and k m are the amplitude and eigenvalue of the mth normal mode, respectively, with A m expressed as
A m z s , z r , r , ω = 8 π r S ω ψ m z s , ω ψ m z r , ω k m ω e i π 4 γ m ω r .
Here, S is the complex-valued sound source function, and ψ m and γ m are the eigenfunction and attenuation coefficient of the mth normal mode, respectively.
Based on Equation (1), for sound intensity I = P 2 , we have
I z s , z r , r , ω = m A m 2 + m n m A m A n * e x p i k m ω k n ω r
= m A m 2 + m n m R e A m A n * c o s k m ω k n ω r m n m Im A m A n * s i n k m ω k n ω r ,
where R e X and I m X denote the operations for adopting the real and imaginary parts, respectively, of a complex number X . (Note that, in the numerical simulations of this study, the sound intensity is evaluated using Equation (3), and Equation (4) is provided here for the subsequent physical analysis). If the source and receiver depths remain unchanged, then the amplitudes of the normal modes on the right-hand side of Equation (3) are dependent on r and ω only. Thus, sound intensity I reduces to a bivariate function. In the context of ocean acoustics, the two-dimensional (2D) distribution of the sound intensity over a certain range-frequency window is generally referred to as the sound intensity image, as mentioned above. This kind of gray-scale image can be obtained by processing the broadband sound signals collected using a horizontal line array (HLA). Alternatively, a synthetic HLA formed by using the slow relative motion between the source and receiver can also be used to collect sound signals. In this study’s experiment, the interference pattern of the sound field was observed in just this way.
The coherent summation on the right-hand side of Equation (3) reflects the impact of the phase interference between different modes on the sound intensity. This intermodal interference can lead to the presence of alternating bright and dark oblique striations on a sound intensity image. Let us assume that Δ ω ω and Δ r r . Then, according to Equation (3), we further have
I z s , z r , r + Δ r , ω + Δ ω m A m 2 + m n m A m A n * e x p i k m ω k n ω r + i k m ω k n ω Δ r + i r d k m d ω d k n d ω Δ ω .
For the sake of convenience, only the interference between the mth and nth normal modes is considered here. If the sum of the last two terms in the braces on the right-hand side of Equation (5) equals zero (that is, there is no change in the phase difference between the two modes), then points (r, ω) and (r + Δr, ω + Δω) will lie on the same interference striation of the sound intensity image. Thus, the slope of the striation is Δωr, for which we have
Δ ω Δ r = β m n ω r ,
where the dimensionless quantity β m n is defined as
β m n = 1 v m p 1 v n p 1 v m g 1 v n g .
Here, v m p = ω k m and v m g = d k m d ω 1 , which denote the phase and group speeds of the mth mode, respectively. Equation (6) is the mode-pair-dependent definition of WI.
In an ideal ocean waveguide with an absolutely hard bottom, it is not difficult to prove that β m n = c o s θ m c o s θ n , with θ m denoting the grazing angle of the mth mode. Generally speaking, β m n can be impacted by many factors, such as the sound speed profile in water and the bottom characteristics, while, for a given ocean waveguide, β m n is still dependent on the mode number and frequency, and it will generally distribute around a certain central value [19,20]. If such distribution is centralized enough, then the WI can be approximately regarded as a constant.

2.2. Computational Method for Waveguide Invariant Extraction

In the present study, a widely used method is adopted to extract the WI from a sound intensity image obtained either experimentally or numerically. Here, we only present the major steps of this method. For detailed derivations, the readers can refer to [19,20]. First, a 2D Fourier transform is applied to the sound intensity image I r , ω as follows:
I ~ κ , τ = I r , ω e x p i κ r + ω τ d r d ω .
Note that, for the reason mentioned above, sound intensity I is now expressed as a bivariate function. Subsequently, based on the relation between the rectangular coordinates (κ, τ) and polar coordinates (L, φ), the integral expression of the angular distribution of an energy function E is obtained as
E φ = 1 2 π 2 I ~ L c o s φ , L s i n φ 2 L d L .
The WI β is related to angle φ as
β φ = r 0 ω 0 t a n φ ,
where r 0 and ω 0 are the median values of source receiver distance r and angular frequency ω , respectively. (In other words, the point ( r 0 , ω 0 ) is the center of the considered range-frequency window). Finally, in terms of Equations (9) and (10), we can obtain energy E, varying as a function of β. The optimal estimation of the WI is thus identified as the one that maximizes such an energy function.

2.3. Sound Spatial Correlation Theory

Spatial correlation describes the similarity between the two sound signals received using a pair of separated receivers. Let p1(t) and p2(t) denote the two sound signals. Their frequency spectra are represented by P1(ω) and P2(ω), respectively. Then, the normalized spatial correlation (i.e., spatial correlation coefficient) can be defined either in the time or frequency domains as
Γ = max τ p 1 t p 2 * t τ d t p 1 t 2 d t p 2 t 2 d t
= max τ ω 1 ω 2 P 1 ω P 2 * ω e i ω τ d ω ω 1 ω 2 P 1 ω 2 d ω ω 1 ω 2 P 2 ω 2 d ω ,
where [ω1, ω2] is the considered frequency band. To be more exact, p1(t) and p2(t) are in fact the time-domain signals obtained by filtering the original signals, with the specified passband being [ω1, ω2]. In the present study, the measured and simulated spatial correlation coefficients are evaluated by using Equations (11) and (12), respectively.
If the pair of receivers are just longitudinally separated, then spatial correlation is specifically referred to as longitudinal correlation (or range correlation). Based on normal mode theory, for a longitudinal correlation coefficient, we have [21,22]
Γ ( Δ r , ω 0 ) m A m ( ω 0 ) 2 e i k m ( ω 0 ) Δ r m A m ( ω 0 ) 2 .
Here, Δ r is the longitudinal separation, ω 0 the central angular frequency of the considered band, and, as defined above, A m is still the amplitude of the mth mode. Now, it is rewritten as a univariate function of frequency for convenience. The approximate Formula (13) conveys a clear physical interpretation, which demonstrates that the intermodal interference can lead to a reduction of sound correlation.
In shallow water, the dominant normal modes in a sound field are generally very few. They can strongly interfere with one another. Therefore, as will be shown in Section 4.2, the longitudinal correlation coefficient may vary as an oscillating function of the separation Δ r [4,5,22]. In the case of considering solely the mth and nth modes, the oscillating period can be roughly estimated as 2 π / k m k n . With increasing Δ r , the correlation coefficient does not monotonically decrease but rather oscillates between a minimum value of A m 2 2 A n 2 2 / A m 2 2 + A n 2 2 and 1. Thus, the minimum correlation coefficient is determined by the ratio between A m and A n . This ratio can be highly sensitive to the bottom characteristics.
Moreover, as a second-order moment of the sound field, the longitudinal sound correlation is robust to noise, inhomogeneities, and fluctuations in the ocean, and, unlike the waveform of a signal, it is irrelevant to the phase characteristics of the sound source function. Therefore, the oscillating structure of the longitudinal sound correlation curve measured using a large-aperture HLA laid in shallow water can be effectively utilized for geoacoustic inversion [22].

3. Experimental Results

3.1. Overview of the Experiment

In August 2003, an underwater acoustic experiment was conducted by the State Key Laboratory of Acoustics, Institute of Acoustics, Chinese Academy of Sciences. In order to accurately explain the observed acoustic phenomena, the experiment was designed to be conducted in a sea area with a relatively flat floor near Qingdao, a city in East China. The sound speed profile measured in this experiment, which has a thermocline, is shown in Figure 1. As mentioned above, the interference pattern of the sound field was observed using a synthetic HLA. A sketch of the experimental scheme is shown in Figure 2. An airgun was adopted as the sound source, which was suspended at a depth of 20 m and drifted slowly using an unanchored ship, while the motionless receiver was mounted on the sea floor. The airgun continuously emitted 32 sound pulses at a uniform time interval of 30 s. The source receiver distances corresponding to these sound pulses (r1, r2, …, r32 as defined in Figure 2) were recorded according to the GPS data. The median value of the source receiver distances was about 5.35 km. During the process, the sound source moved toward the receiver for about 132 m (i.e., r32r1 ≈ −132 m).
On the other hand, if the frequency was below 300 Hz, the acoustic coherence time measured in this experiment was much longer than the 930 s duration for the emission of the 32 sound pulses. As the source moved very slowly, the impact of the Doppler effect on the frequency of the received sound signal can be ignored. The 32 sound pulses received by a single receiver can be approximately regarded as being received simultaneously using a 32-element HLA with an aperture of 132 m, i.e., the synthetic HLA formed in this experiment. The longitudinal separation between the ith and first elements of the synthetical HLA is Δri, as shown in Figure 2.
Therefore, with the recorded 32 sound signals and their corresponding source receiver distances, we could experimentally obtain the sound intensity images and sound spatial correlations with high accuracy, provided that the frequency was lower than 300 Hz. The results are presented in the next subsection and in Section 4.2.

3.2. Sound Intensity Images and Waveguide Invariants

In order to obtain the sound intensity images, we need to transform the recorded acoustic signal corresponding to each source receiver distance into the frequency domain. A recorded acoustic signal generally consists of several broadened pulses with a very short total time duration (<0.3 s in the experiment). Hence, if it is directly fast-Fourier-transformed (FFTed), the frequency resolution of the obtained spectra should be larger than 1/0.3 ≈ 3.33 Hz. At the same time, we also have limited range resolution, which can be roughly estimated as 132/(32 − 1) ≈ 4.26 m. (As mentioned earlier, the aperture of the synthetic 32-element HLA in the experiment is about 132 m). With such low range and frequency resolutions, the striations in an obtained acoustic intensity image cannot be clearly observed; thus, we must attempt to improve them.
The range resolution can be improved by performing a spline interpolation. To improve the frequency resolution, prior to the FFT, the following preprocessing procedure is performed. First, the recorded acoustic signal is filtered. Then, we increase the signal length by using the simple zero-padding operation. (As is well known, the zero-padding operation generally cannot be used to improve the frequency resolution. However, based on the Whittaker-Kotelnikov-Shannon sampling theorem [23] and the short duration of the recorded acoustic signal, we found that it did work here. A more detailed explanation is provided in [24]).
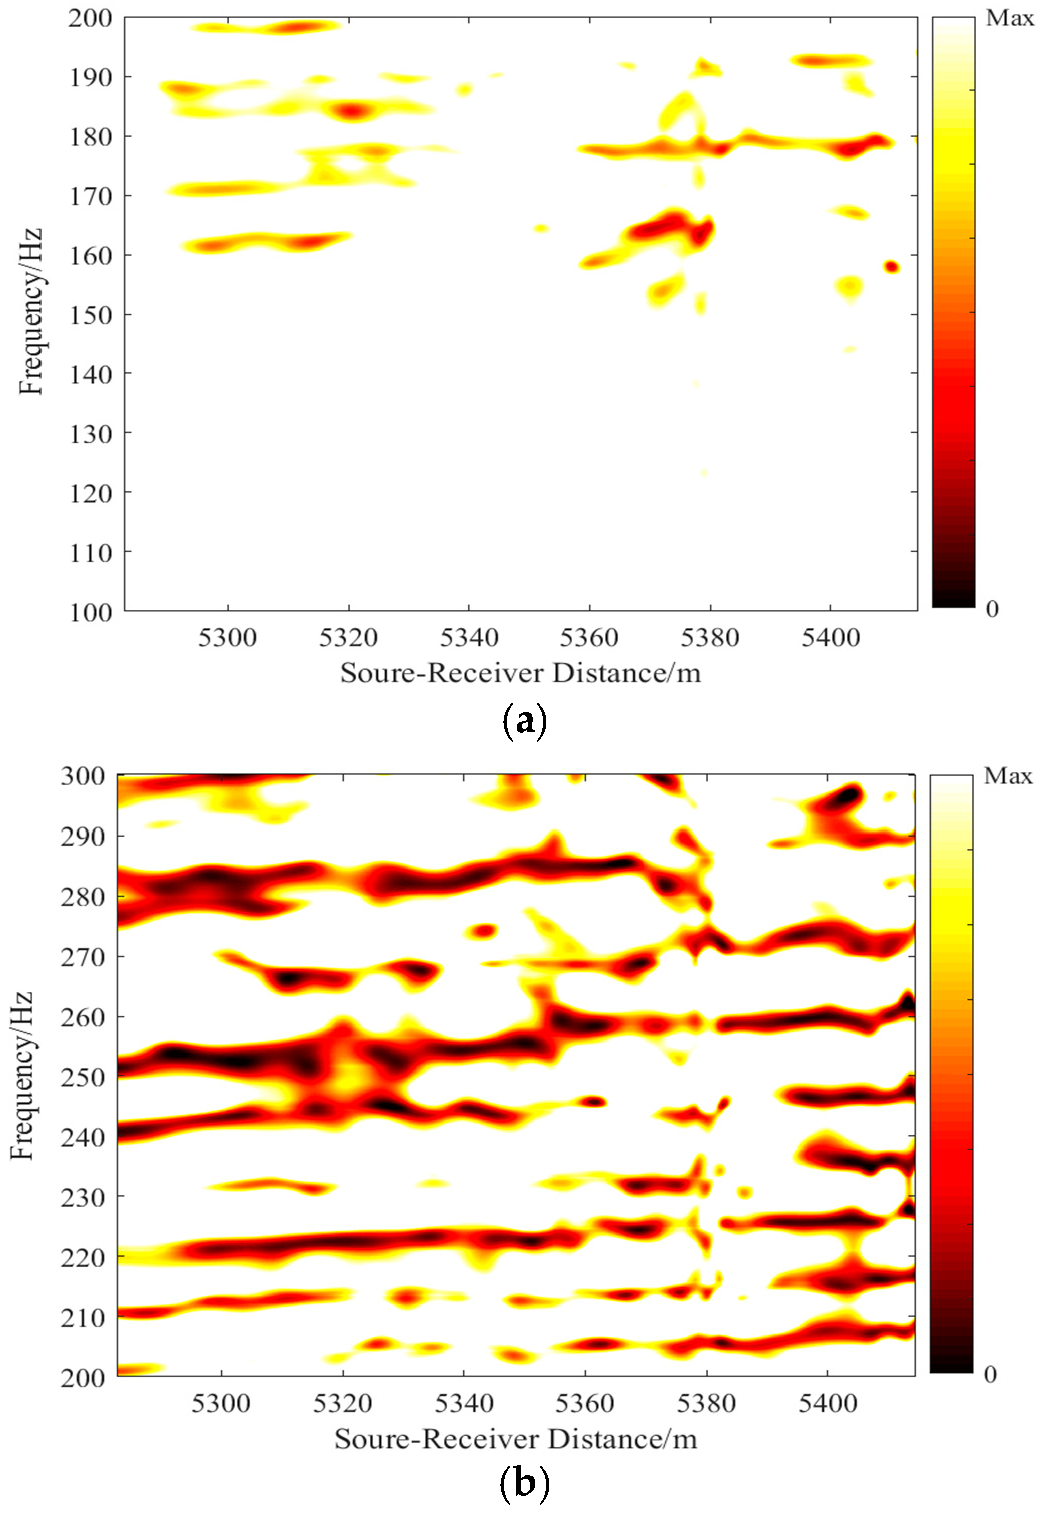
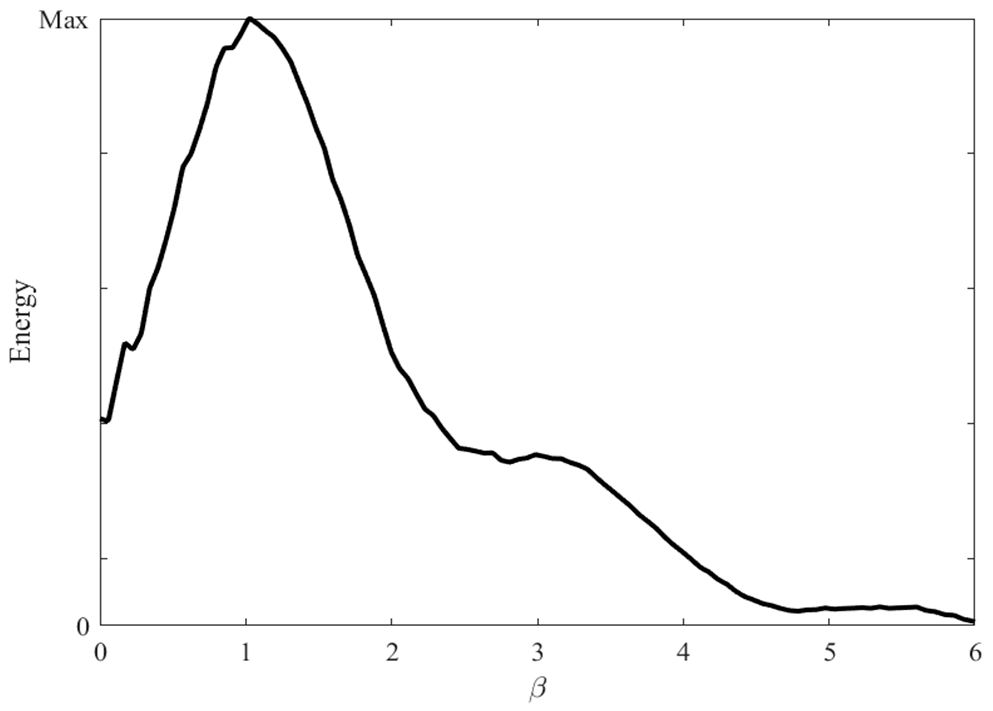
Using a range resolution of 0.1 m and a frequency resolution of 0.1 Hz, we finally obtain the sound intensity images corresponding to 100–200 and 200–300 Hz frequency bands, which are presented in Figure 3. Due to the relatively fine range and frequency resolutions, the striation pattern in the interpolated sound intensity image corresponding to the 200–300 Hz frequency band is clearly visible, while, in the image corresponding to the 100–200 Hz frequency band, only a few disconnected striations are present at frequencies above 150 Hz. The energy distribution of WI obtained by processing the sound intensity images shown in Figure 3b using the method introduced in Section 2.2 is presented in Figure 4.
It can be seen from Figure 4 that the WI values are distributed around a peak of approximately 1.03. As stated at the end of Section 2.1, many factors impact the WI’s energy distribution, including the bottom characteristics. However, the energy distribution width may be broadened by the inhomogeneities and fluctuations in the waveguide. While the peak value of the WI may be more robust, the effects of random factors on it can be smoothed out to some degree. Therefore, in the present study, the focus of modeling is on the peak value of WI.

3.3. Analysis Based on the Assumption of a Fluid Bottom

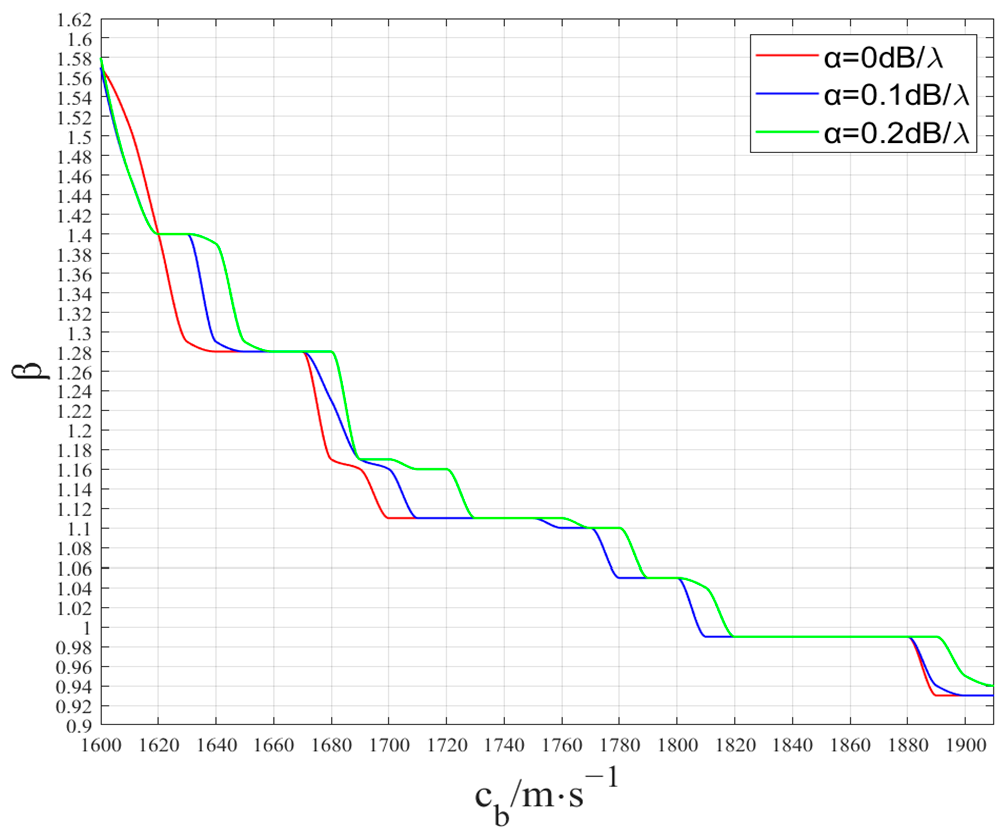
In order to analyze the experimental results, numerical simulations were performed based on the KRAKENC program [25]. A homogeneous fluid bottom model was first supposed. Then, for any assumed bottom sound speed, sound intensity images were simulated based on the measured sound speed profile, as shown in Figure 1. Figure 5 shows the variations with the bottom sound speed of the peak-value of the WI extracted from the simulated sound intensity image corresponding to the 200–300 Hz frequency band. The results are obtained for three values of bottom sound absorption: 0, 0.1, and 0.2 dB/λ, where λ denotes the sound wavelength. As the WI is generally not sensitive to the bottom mass density, it was invariably adopted as a typical value of 1.8 g/cm3 in the simulations.
An actual sea bottom may be inhomogeneous. However, from the perspective of an equivalent analysis, the results presented in Figure 5 can still be used as the basis for analyzing the impacts of the bottom sound speed on the WI in subsequent discussions. Figure 5 indicates that the WI decreases with the increasing bottom sound speed cb. However, when cb is larger than 1700 m/s, this trend gradually slows down, and, when the WI is close to 1.0, it becomes insensitive to cb. Nevertheless, a measured WI of 1.03 still indicates that cb is relatively large. Even if the WI adopts a larger value of 1.1, cb still must be larger than 1760 m/s. Such an inference will be inconsistent with the following analysis based on Figure 3a, which indicates that the equivalent bottom sound speed should not be so large.
As shown in Figure 3a, the part of the experimentally obtained sound intensity image below a frequency of 150 Hz is completely without striations. This indicates that, if the frequency is below 150 Hz, the sound field near the receiver is dominated by one normal mode only. Let us consider the first three normal modes in the sound field. Essentially, it is not necessary to account for the second normal mode, as a nodal point of its eigenfunction is found to be quite close to the source depth of 20 m. (Note that the position of the nodal point is not sensitive to the geoacoustic parameters and frequency. Figure 6 shows the calculated eigenfunctions of the second normal mode corresponding to frequencies of 150, 200, and 250 Hz. The geoacoustic parameters used for the calculations are provided in the figure caption).
In contrast, for the third normal mode, the calculations show that, if the frequency is 150 Hz and cb is large enough, its amplitude will not be significantly smaller than that of the first normal mode at a source receiver distance of 5.35 km, unless the bottom sound absorption is unreasonably large. Hence, the first and third normal modes can strongly interfere, which is not consistent with the lack of striations exhibited in Figure 3a. Therefore, the bottom sound speed cannot be so high, implying that the third normal mode is essentially cut off if the frequency is below 150 Hz.
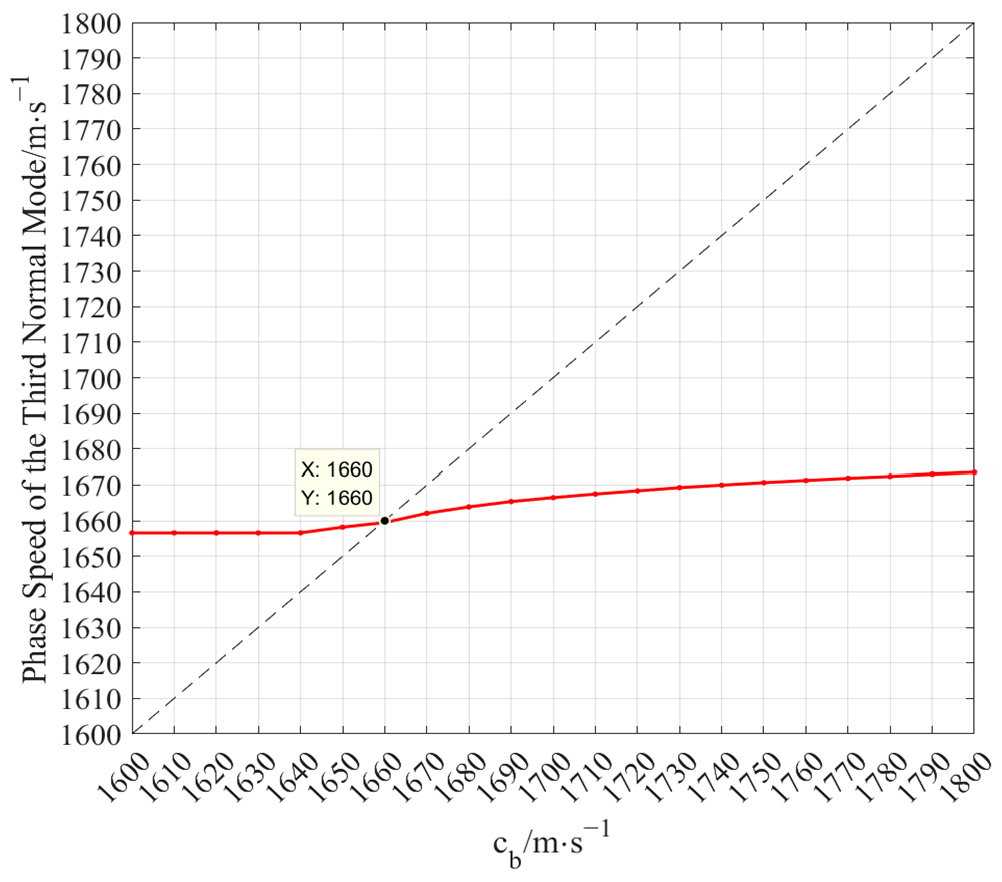
The solid red line in Figure 7 shows the variation of the calculated phase speed of the third normal mode with cb corresponding to a frequency of 150 Hz. (Note that such a phase speed is generally not sensitive to the geoacoustic parameters, the values for which are provided in the figure caption). The dotted dark line in this figure is the angular bisector of the first quadrant. The two lines intersect at a point close to (1660, 1660). This means that the third normal mode will be cut off at a frequency of 150 Hz if the equivalent bottom sound speed is lower than 1660 m/s. Needless to say, the smaller the equivalent bottom sound speed, the higher the cut-off frequency.
For the sound in the 200–300 Hz frequency band, due to a smaller penetration depth, the equivalent bottom sound speed may be even lower than 1660 m/s, as the sound speed in a horizontally stratified bottom generally increases with the depth. This is not consistent with the inference obtained above, which is that the equivalent bottom sound speed corresponding to this frequency band should be higher than 1760 m/s. According to Figure 5, if cb is lower than 1660 m/s, the WI corresponding to the 200–300 Hz frequency band should be larger than 1.28, which is significantly larger than the measured value of 1.03.

4. Physical Interpretations

According to the analysis in Section 3.3, a measured WI of 1.03 corresponding to the 200–300 Hz frequency band may indicate that the bottom sound speed should be high enough. Hence, the bottom may be composed of some hard materials with either large acoustic impedances or strong elasticity. Some relevant studies have shown that sound propagation impacted by an elastic bottom can exhibit some extraordinary behaviors, such as leakage attenuation [26,27,28]. For example, for the Pekeris waveguide with an elastic bottom, the sound speed in water is cw and the longitudinal and shear wave speeds of the bottom are cl and cs, respectively. Even though cl is generally higher than cw, it is quite likely that cs < cw. Then, under such a condition, the sound in the water layer may gradually leak into the bottom, even if the bottom absorption is not accounted for. The experimental results presented above were interpreted based on the following bottom model with an elastic substrate.

4.1. Sea Bottom Model

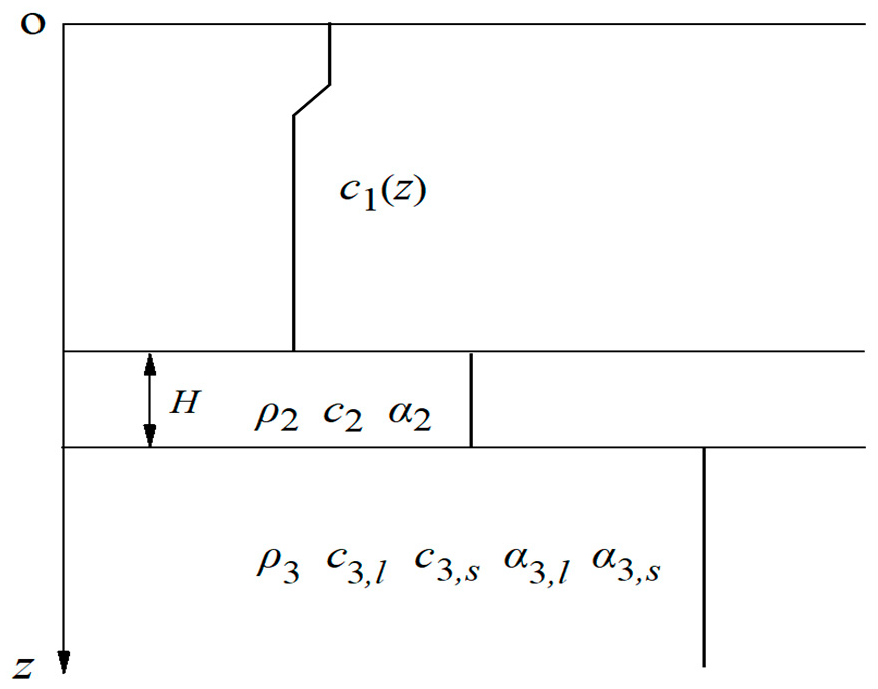
Generally, the elasticity of the shallow layer inside a bottom can safely be ignored, while that of the deep layer could have a more significant impact on the low-frequency sound. In the present study, a dual-layer bottom model consisting of a fluid sediment layer and an underlying half-space elastic substrate (Figure 8) is proposed to interpret the experimentally observed anomaly. The geoacoustic parameters of this model, defined in the caption of Figure 8, were inverted using the scheme introduced in the next subsection. As explained in Section 4.3, the experimentally observed weakening of the intermodal interference occurring at frequencies below 200 Hz is just attributable to the leakage attenuation induced by the elastic substrate.

4.2. Inversion of Geoacoustic Parameters

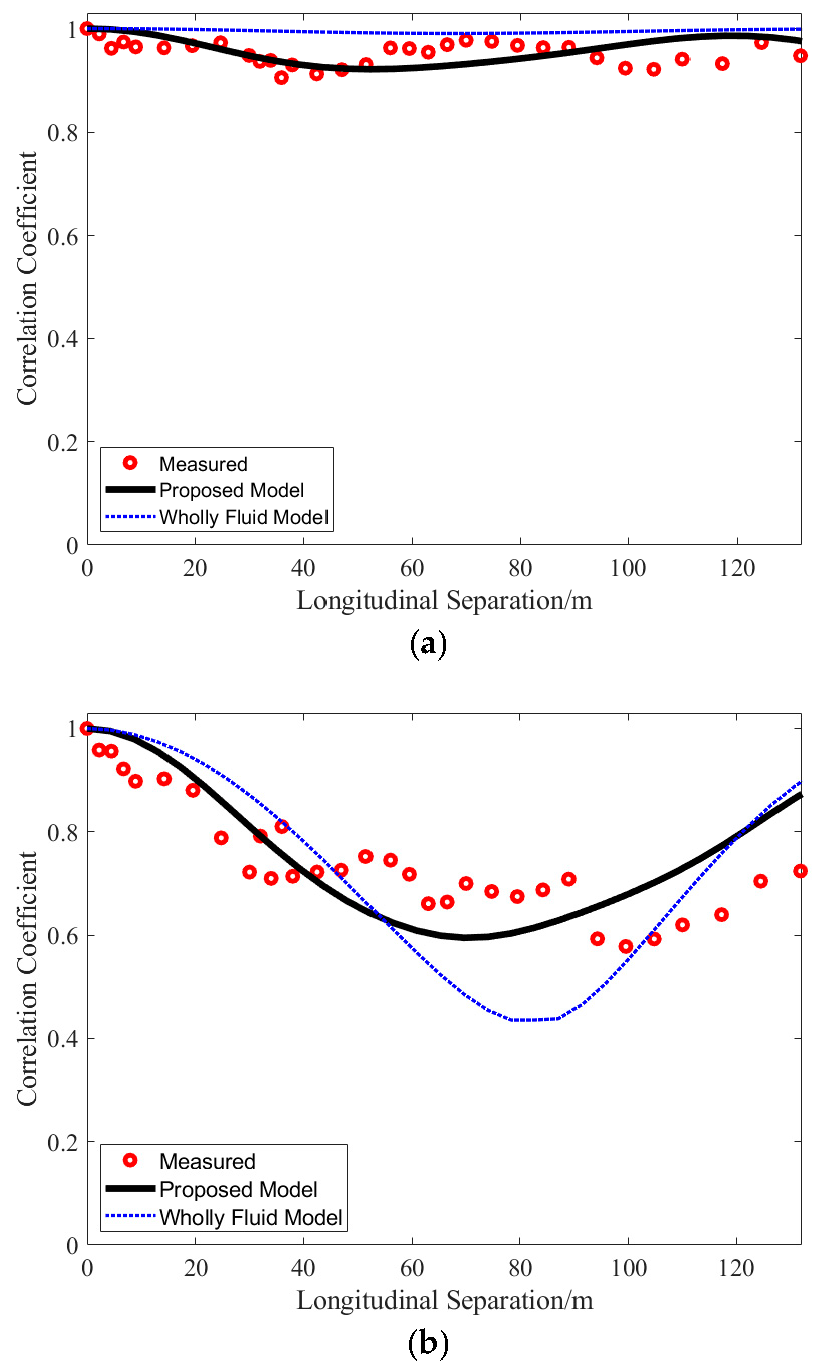
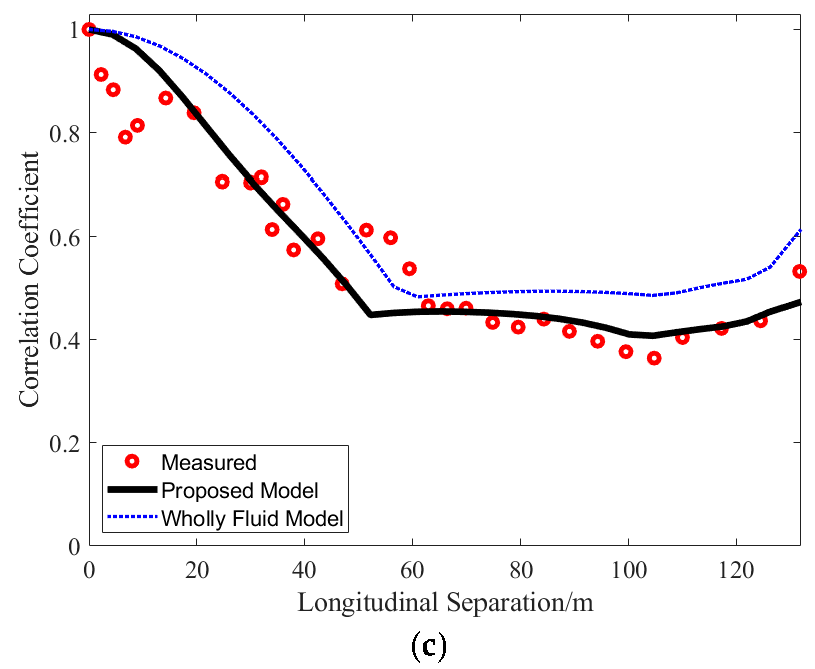
As stated in Section 3.3, if its value is close to 1.0, the calculated WI corresponding to the 200–300 Hz frequency band is not sensitive to the bottom sound speed. Therefore, in the present study, the geoacoustic inversion is based not on the measured WI but on the measured sound spatial correlations corresponding to three frequency bands: the 1/3 octaves of 150, 200, and 250 Hz. If the transverse correlation radius is assumed to be much larger than the longitudinal correlation radius, then the spatial correlation measured using the synthetic HLA in this experiment can be regarded as the longitudinal correlation. Figure 9 shows the measured spatial correlation coefficients versus the longitudinal separations for the three considered frequency bands.
The genetic algorithm (GA) was utilized as the inverse search scheme. The GA was directly implemented using the global optimization tool in MATLAB, which uses the fitness function based on the KRAKENC program. The optimization objective was to minimize the root mean-square-error (RMSE) between the measured and calculated spatial correlation coefficients corresponding to different longitudinal separations. It is defined exactly as:
R M S E = i = 1 N s j = 1 N f Γ ( C a l ) Δ r i , ω j Γ ( E x p ) Δ r i , ω j 2 N s N f .
Here, N s = 31 and N f = 3 , indicating the total numbers of the longitudinal separations and considered frequency bands, respectively; Γ ( C a l ) Δ r i , ω j and Γ ( E x p ) Δ r i , ω j represent the calculated and measured correlation coefficients, respectively, which correspond to the ith longitudinal separation Δ r i and jth band centered at the frequency ω j .
As the mass densities of the sediment layer and substrate are generally not a sensitive parameter, the value of both were adopted as a constant value of 1.8 g/cm3 in the inversion process, and the search scope of the other parameters is provided in the second column of Table 1. Note that, to ensure that the longitudinal wave speed c3,l of the substrate was larger than the sediment sound speed c2, we did not directly search the former but rather defined an alternative non-negative search variable, Δc23 = c3,lc2. Furthermore, to reduce the dimensions of the search space, the longitudinal and shear wave absorptions of the substrate were assumed to have the same value.
In the GA, the population size was 100, while the crossover and mutation probabilities were 0.9 and 0.05, respectively. The population evolved for 50 generations. The inverted geoacoustic parameters are listed in the last column of Table 1. The RMSE corresponding to the inversion results is 0.064.
The solid dark lines in Figure 9 are the longitudinal correlation curves corresponding to the three considered frequency bands calculated based on the inverted geoacoustic parameters. A moderately good agreement between the calculated and measured results can be seen when the central frequency is 150 and 250 Hz, respectively. In the case that the central frequency is 200 Hz, even though the measured results are more scattered around the calculated curve, they are still in agreement. In Figure 9b, the correlation curve has an obvious oscillating structure, which is a direct evidence of intermodal interference. If the longitudinal separation were extended to larger values, this kind of oscillating structures could also be observed in Figure 9c.
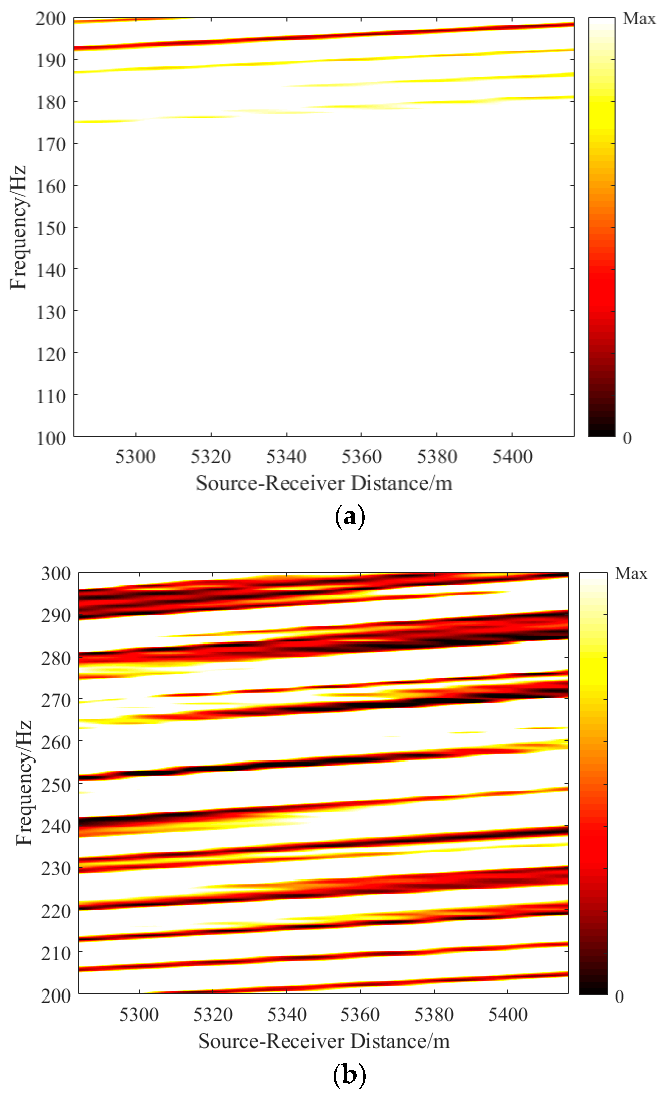
In order to further verify the inverted geoacoustic parameters, the sound intensity images corresponding to the 100–200 and 200–300 Hz frequency bands were simulated, and the results are presented in Figure 10. The algorithm introduced in Section 2.2 was used to process Figure 10b, obtaining WI 1.1 , which is not significantly different from the measured result of 1.03. Furthermore, Figure 10a shows the characteristics of the corresponding experimentally obtained result shown in Figure 3a. The striations rapidly disappear when the frequency is lower than 200 Hz.
We also performed the inversion based on a wholly fluid dual-layer bottom model, in which we kept the geoacoustic parameters defined in Figure 8 but disregarded c3,s and α3,s. The mass densities were still adopted as a constant value of 1.8 g/cm3. The search scope of the other geoacoustic parameters and inverted results are provided in Table 2. The search scopes of the bottom sound speeds and the thickness of the sediment layer are wider than those used for the proposed model. This time, a much larger RMSE of 0.12 was eventually obtained. The dashed blue lines in Figure 9 are the longitudinal curves acquired using the inverted geoacoustic parameters. The calculation agrees better with the measurement when the central frequency is 150 Hz. When the central frequency increases to 200 Hz, significant deviations between the calculation and measurement can be observed. Additionally, when the central frequency is 250 Hz, the calculated results are observably larger than measurement as a whole. At last, the WI corresponding to the 200–300 Hz frequency band was also calculated, obtaining a result of 1.46, which is 42% larger than the measurement.
To summarize, the obtained RMSEs and relative errors of the calculated WIs for both the proposed and wholly fluid bottom models are all listed in Table 3. All the comparisons presented above demonstrate the reasonableness of the proposed bottom model and the corresponding inverted results.

4.3. Analysis of Normal Mode Attenuations

To gain deeper insights into the underlying physics, the attenuation coefficients of the first three normal modes for frequencies of 150, 200, and 250 Hz were calculated using the geoacoustic parameters inverted based on the proposed bottom model. The obtained results are listed from the second to the fourth columns of Table 4. Neglecting the shear wave speed c3,s and without changing the other geoacoustic parameters, the quantities listed in Table 4 were recalculated and provided in Table 5. Evidently, the substrate elasticity can enlarge the attenuation coefficients of the normal modes by one order of magnitude, and the lower the frequency or the larger the mode number (i.e., the larger the penetration depth), the more pronounced the attenuation enlargement effect. Therefore, the lower the frequency, the shorter the source receiver distance at which the sound field is dominated by the normal modes with small order numbers. Such dominance will weaken the intermodal interference.
As stated in Section 3.3, the second normal mode was not effectively excited as the source depth was quite close to a nodal point. Therefore, among the first three modes, we only considered the interference between the first and third modes. According to Equation (1), for their amplitudes, A 1 and A 3 , we have
A 3 A 1 e Δ γ 31 r
Here, Δ γ 31 = γ 3 γ 1 and e Δ γ 31 r can be regarded as the relative amplitude attenuation corresponding to the two modes. Assuming that r = 5.35 km, the values of e Δ γ 31 r were calculated based on the inverted geoacoustic parameters for the three considered frequencies, and the obtained results are listed in the last column of Table 4. They are also recalculated by neglecting c3,s and the corresponding results are listed in the last column of Table 5. Without c3,s, the values of e Δ γ 31 r corresponding to the three considered frequencies are basically equal and not significantly smaller than 1.0. If c3,s is included, however, e Δ γ 31 r will decrease at all three frequencies; especially at the lowest frequency of 150 Hz, it decreases to 0.09, which is much smaller than the values for the two higher frequencies.
It can be seen from Table 4 that, at the frequency of 250 Hz, the impact of the bottom elasticity is not so significant that e Δ γ 31 r is still close to 0.5. Therefore, the first and third normal modes can still interfere strongly at this frequency, resulting in the clear striations in the sound intensity image corresponding to the 200–300 Hz frequency band. Meanwhile, a WI close to 1.0 is mainly attributable to the high sound speed of the sediment layer. At the frequency of 150 Hz, however, e Δ γ 31 r decreases to the very small value of 0.09, as the impact of the substrate elasticity becomes significant. Therefore, the interference between the two normal modes nearly vanishes, leading to the absence of striations in the part of the sound intensity image below the frequency of 150 Hz.

5. Concluding Remarks

A dual-layer sea bottom model consisting of a fluid sediment layer and an underlying half-space elastic substrate is proposed to physically interpret the interference pattern anomaly of acoustic fields observed in a shallow water experiment. Based on this bottom model, it can be found that, if the shear wave speed of the substrate is lower than the minimum sound speed in the water layer, the acoustic normal modes will be subject to leakage attenuation, which can be significantly larger than the inherent attenuation due to the bottom absorption. In general, the lower the frequency or the larger the mode number, the larger the leakage attenuation.
The numerical simulation results show that the experimentally observed significant weakening of intermodal interference occurring at frequencies below 200 Hz, could mainly be attributed to such leakage attenuation, which caused the sound field to be dominated by the first normal mode at the source receiver distance. However, the sound field in the 200–300 Hz frequency band was less impacted by the elastic substrate, and, thus, the observed intermodal interference was still quite strong. Furthermore, due to the high equivalent bottom sound speed, the WI value corresponding to this frequency band was close to 1.0.
The results obtained in the present study may provide a useful theoretical reference for applied studies such as remote target detection and geoacoustic inversion based on low-frequency underwater acoustic signals.

Author Contributions

Conceptualization, X.S. and J.Q.; methodology, X.S. and X.Y.; validation, X.Y.; formal analysis, X.S. and J.Q.; writing—original draft preparation, X.Y.; writing—review and editing, X.S. and J.Q.; funding acquisition, J.Q. All authors have read and agreed to the published version of the manuscript.

Funding

This work is supported by the Youth Innovation Promotion Association of Chinese Academy of Sciences (Project No. 2021023).

Institutional Review Board Statement

Not applicable.

Informed Consent Statement

Not applicable.

Data Availability Statement

Not applicable.

Conflicts of Interest

The authors declare no conflict of interest.

References and Note

  1. Zhang, R.H.; Wang, Q. Range and depth-averaged fields in ocean sound channels. J. Acoust. Soc. Am. 1990, 87, 633–638. [Google Scholar] [CrossRef]
  2. Gershman, S.G.; Tuzhilkin, Y.I. Interferece of wide band noise signals. Sov. Phys. Acoust. 1965, 11, 34–41. [Google Scholar]
  3. Chuprov, S.D.; Mal’tsev, N.E. An invariant of the spatial-frequency interference pattern of the acoustic field in a layered ocean. Proc. Russ. Acad. Sci. 1981, 257, 474–479. [Google Scholar]
  4. Zhang, R.H.; Su, X.X.; Li, F.H. Improvement of Low-Frequency Acoustic Spatial Correlation by Frequency-Shift Compensation. Chin. Phys. Lett. 2006, 23, 1838–1841. [Google Scholar]
  5. Su, X.X.; Zhang, R.H.; Li, F.H. Improvement of the longitudinal correlations of acoustical field by using the waveguide invariance. Acta Acust. 2006, 4, 305–309, (In Chinese with English abstract). [Google Scholar]
  6. Zhang, Y.J.; Li, F.H.; Su, X.X. Improvement of longitudinal correlation of explosive signals by using waveguide invariance. AIP Conf. Proc. 2010, 1272, 454–461. [Google Scholar]
  7. Thode, A.M. Source ranging with minimal environmental information. J. Acoust. Soc. Am. 2000, 108, 1582–1594. [Google Scholar] [CrossRef]
  8. Cockrell, K.L.; Schmidt, H. Robust passive range estimation using the waveguide invariant. J. Acoust. Soc. Am. 2010, 127, 2780–2789. [Google Scholar] [CrossRef] [Green Version]
  9. Qi, Y.B.; Zhou, S.H.; Zhang, R.H.; Ren, Y. A waveguide-invariant-based warping operator and its application to passive source range estimation. J. Comp. Acoust. 2015, 23, 1550003. [Google Scholar] [CrossRef] [Green Version]
  10. Heaney, K.D. Rapid geoacoustic characterization using a surface, ship of opportunity. IEEE J. Ocean. Eng. 2004, 29, 88–99. [Google Scholar] [CrossRef]
  11. Heaney, K.D. High-frequency rapid geo-acoustic characterization. AIP Conf. Proc. 2004, 728, 137–148. [Google Scholar]
  12. Knobles, D.P.; Neilsen, T.B.; Wilson, P.S.; Hodgkiss, W.S.; Bonnel, J.; Lin, Y.T. Maximum entropy inference of seabed properties using waveguide invariant features from surface ships. J. Acoust. Soc. Am. 2022, 151, 2885–2896. [Google Scholar] [CrossRef] [PubMed]
  13. Rouseff, D. Effect of shallow water internal waves on ocean acoustic striation patterns. Wav. Rand. Med. 2001, 11, 377–393. [Google Scholar] [CrossRef]
  14. Song, W.H.; Wang, N.; Gao, D.Z.; Wang, H.Z. The influence of mode coupling on waveguide invariant. J. Acoust. Soc. Am. 2017, 142, 1848–1857. [Google Scholar] [CrossRef] [PubMed]
  15. Shang, E.C.; Wu, J.R.; Zhao, Z.D. Relating waveguide invariant and bottom reflection phase-shift parameter P in a Pekeris waveguide. J. Acoust. Soc. Am. 2012, 131, 3691–3697. [Google Scholar] [CrossRef]
  16. Byun, G.; Song, H.C. The waveguide invariant for a Pekeris waveguide. J. Acoust. Soc. Am. 2022, 151, 846–851. [Google Scholar] [CrossRef] [PubMed]
  17. Cho, C.; Song, H.C. Iterative range estimation in a sloping-bottom shallow-water waveguide using the generalized array invariant. J. Acoust. Soc. Am. 2017, 142, 55–60. [Google Scholar] [CrossRef] [Green Version]
  18. Zhang, R.H.; Li, F.H. Beam-displacement ray-mode theory of sound propagation in shallow water. Sci. China (Ser. A) 1999, 42, 739–749. [Google Scholar] [CrossRef]
  19. Rouseff, D.; Spindel, R. Modelling the waveguide Invariant as a distribution, in Ocean acoustic interference phenomena and signal processing, edited by W.A.Kuperman and G.D.Spain. AIP Conf. Proc. 2002, 621, 137–148. [Google Scholar]
  20. Emmetière, R.; Bonnel, J.; Gehant, M.; Cristol, X.; Chonavel, T. Understanding deep-water striation patterns and predicting the waveguide invariant as a distribution depending on range and depth. J. Acoust. Soc. Am. 2018, 143, 3444–3454. [Google Scholar] [CrossRef] [PubMed] [Green Version]
  21. Wang, Q.; Zhang, R.H. Sound spatial correlations in shallow water. J. Acoust. Soc. Am. 1992, 92, 932–936. [Google Scholar] [CrossRef]
  22. Li, X. Research on the Characteristics and Applications of the Horizontal Longitudinal Coherence of the Sound Fields in Shallow Water. Ph.D. Dissertation, Institute of Acoustics, Chinese Academy of Sciences, Beijing, China, 2005. (In Chinese with English Abstract). [Google Scholar]
  23. Fang, G. Whittaker–Kotelnikov–Shannon sampling theorem and aliasing error. J. Appr. Theory 1996, 85, 115–131. [Google Scholar]
  24. During the experiment, the acoustic signal emitted by the low-frequency airgun source was recorded at a sampling frequency of 6000 Hz, which was adequate to capture the signal. Then, in terms of the Whittaker-Kotelnikov-Shannon sampling theorem, all the information of the original continuous-time acoustic signal is contained in the recorded discrete-time signal in principle. Moreover, the recorded acoustic signal generally fades away in a very short duration. Hence, its length can be safely increased by a simple zero-padding operation, after its ultralow-frequency trend is removed by a bandpass filtering operation. The frequency resolution of FFT can thus be improved.
  25. Porter, M.B. The KRAKEN Normal Mode Program (Technical Report); SACLANT Undersea Research Centre: La Spezia, Italy, 1992; pp. 75–91. [Google Scholar]
  26. Schneiderwind, J.D.; Collis, J.M.; Simpson, H.J. Elastic Pekeris waveguide normal mode solution comparisons against laboratory data. J. Acoust. Soc. Am. 2012, 132, EL182–EL188. [Google Scholar] [CrossRef] [PubMed]
  27. Nealy, J.L.; Collis, J.M.; Frank, S.D. Normal mode solutions for seismo-acoustic propagation resulting from shear and combined wave point sources. J. Acoust. Soc. Am. 2015, 139, EL95–EL99. [Google Scholar] [CrossRef] [PubMed] [Green Version]
  28. Zhang, H.G.; Piao, S.C.; Yang, S.E. Propagation of seismic wave caused by underwater infrasound. J. Harbin Eng. Univ. 2010, 31, 879–887, (In Chinese with English abstract). [Google Scholar]
Figure 1. Sound speed profile measured in experiment.
Jmse 11 00647 g001
Figure 2. Sketch of experimental scheme.
Jmse 11 00647 g002
Figure 3. Experimentally obtained sound intensity images corresponding to (a) 100–200 Hz and (b) 200–300 Hz frequency bands.
Jmse 11 00647 g003
Figure 4. Experimentally obtained energy distribution of waveguide invariant β corresponding to 200–300 Hz frequency band.
Jmse 11 00647 g004
Figure 5. Variations of waveguide invariant parameter β corresponding to 200–300 Hz frequency band with bottom sound speed cb calculated for different values of bottom sound absorption α.
Jmse 11 00647 g005
Figure 6. Calculated eigenfunctions ψ2(z) corresponding to frequencies of 150, 200, and 250 Hz (sound speed, mass density, and sound absorption of the bottom are adopted as 1700 m/s, 1.8 g/cm3, and 0.1 dB/λ, respectively).
Jmse 11 00647 g006
Figure 7. Variation of phase speed of third normal mode corresponding to frequency of 150 Hz with bottom sound speed (mass density and sound absorption coefficient of bottom are adopted as 1.8 g/cm3 and 0.1 dB/λ, respectively).
Jmse 11 00647 g007
Figure 8. Dual-layer bottom model consisting of a fluid sediment layer and an underlying half-space substrate. c1(z): sound speed in water layer; H: thickness of sediment layer; ρ2, c2, and α2: mass density, sound speed, and sound absorption coefficient of sediment layer, respectively; ρ3, c3,l, c3,s, α3,l, and α3,s: mass density, longitudinal wave speed, shear wave speed, longitudinal wave absorption, and shear wave absorption of elastic substrate, respectively.
Jmse 11 00647 g008
Figure 9. Measured sound spatial correlations corresponding to 1/3 octaves of (a) 150, (b) 200, and (c) 250 compared to simulation results. Solid dark and dashed blue lines were obtained by using geoacoustic parameters inverted based on proposed and wholly fluid bottom models, respectively.
Jmse 11 00647 g009aJmse 11 00647 g009b
Figure 10. Sound intensity images corresponding to (a) 100–200 Hz and (b) 200–300 Hz frequency bands obtained based on inverted geoacoustic parameters.
Jmse 11 00647 g010
Table 1. Search scopes of geoacoustic parameters for proposed bottom model and inverted results.
Geoacoustic ParametersSearch ScopesInverted Results
H (m)1–102.97
c2 (m∙s−1)1650–18501732.27
α2 (dB/λ)0–0.20.11
Δc23 (m∙s−1)0–200101.92
c3,l (m∙s−1)----1834.20
c3,s (m∙s−1)700–1000742.44
α3,l and α3,s (dB/λ)0.2–0.50.23
Table 2. Search scopes of geoacoustic parameters for wholly fluid bottom model and inverted results.
Geoacoustic ParametersSearch ScopesInverted Results
H/m1–2015.8
c2/m∙s−11600–18501619.9
α2/dB/λ0–0.20.15
Δc23/m∙s−10–20097.7
c3,l/m∙s−1----1707.6
α3,l/dB/λ0.2–0.50.25
Table 3. RMSEs (evaluated using Equation (14)) and relative errors of calculated WIs corresponding to geoacoustic parameters inverted based on proposed and wholly fluid bottom models.
Proposed ModelWholly Fluid Model
RMSE0.0640.12
Relative error of calculated WI6.8%42%
Table 4. Attenuation coefficients of first three normal modes calculated by using inverted geoacoustic parameters and relative amplitude attenuation e Δ γ 31 r corresponding to third and first normal modes (source receiver distance r = 5.35 km).
Frequency (Hz)γ1 (km−1)γ2 (km−1)γ3 (km−1) e Δ γ 31 r
1500.156410.429880.601320.09
2000.0674280.198220.321820.25
2500.0320970.0974380.163310.49
Table 5. Recalculated results of quantities listed in Table 4 obtained by neglecting shear wave speed c3,s and without changing the other geoacoustic parameters (source receiver distance r = 5.35 km).
Frequency (Hz)γ1 (km−1)γ2 (km−1)γ3 (km−1) e Δ γ 31 r
1500.0117020.0373900.0829870.70
2000.00822370.0255120.0474700.82
2500.00633400.0194890.0339250.86
Disclaimer/Publisher’s Note: The statements, opinions and data contained in all publications are solely those of the individual author(s) and contributor(s) and not of MDPI and/or the editor(s). MDPI and/or the editor(s) disclaim responsibility for any injury to people or property resulting from any ideas, methods, instructions or products referred to in the content.