Abstract
Both oil spill and microplastics (MPs) are major issues in marine environments. After a spill, the oil film may disperse into the water column as droplets under the function of sea waves. The oil dispersion may be affected due to the attachment of oil to MPs. In this paper, the impacts of salinity and temperature on the dispersion of spilled oil in the presence of MPs were individually studied by batch conical flask oscillation experiments. The results indicated that the rise in salinity or temperature displayed a more significant effect on promoting, rather than inhibiting, oil dispersion with MPs. When the salinity rose from 15% to 35%, the oil dispersion efficiency (ODE) with the 13 μm polyethylene (PE) and polystyrene (PS) MPs was increased by 10.4% and 12.9%, respectively; when the temperature rose from 10 °C to 25 °C, the corresponding ODE was increased by 15.6% and 12.7%, respectively. In addition, the volumetric mean diameter (VMD) of the dispersed oil droplets decreased with an increase in salinity or temperature. Furthermore, the 13 μm MPs showed a higher impact on the oil dispersion than 106 μm of MPs, and the ODE with PE MPs was greater than that with PS MPs. The findings of this study expanded the understanding of the migration of spilled oil in seawater in the presence of MPs and may further improve the capability of predicting the impact of oil spills by marine environment managers.
1. Introduction
Microplastics (MPs) are defined as plastic particles, such as fiber and fragments, smaller than 5 mm [1] that can have different shapes. MPs are the most common pollutants in seawater and can be found on the ocean surface [2,3], in the sediment [4], and even in polar marine environments [5,6]. Over the past 50 years, there have been 9.1 billion tons of plastic waste discarded into the environment, and this increase is expected to continue at an annual growth rate of 8.7% [7]. The analytical results of samples from the subtropical circulation area of the North Pacific and the Northwest Atlantic showed that the abundance of plastic waste was increasing [8,9]. The MP concentration on the sea surface of the Midwest Pacific Ocean ranges from 6028 to 95,335 particles/km2 [10], and the mean abundance of plastic debris on the sea surface of the Kuroshio Current of the western North Pacific was 100,376 counts/km2 [11]. Due to their small size, MPs are easily ingested by organisms [12], and they can be transferred to the food chain and enriched in high-trophic organisms. MPs have not only caused physical damage to marine organisms, but they also introduce potential chemical hazards that have had a negative impact on marine ecosystems [13,14].
More concerns have been raised concerning MPs as carriers of other pollutants in a marine environment [15]. Because of their porous hydrophobic structure and large specific surface area, MPs have a strong adsorption capacity for pollutants including heavy metals, such as Cd (II) and Pb (II) [16], polycyclic aromatic hydrocarbons (PAHs) [17,18], polychlorinated biphenyls (PCBs) [19,20], natural organic matters (NOMs) [21], humic acid (HA) [21], oil [22], etc. The oil absorption capacity of MPs is affected by surface roughness, specific surface area, hydrophobicity, oxidation functional group, etc. [23] A study on the adsorption behavior of various hydrophobic organic compounds on polypropylene (PP), polyethylene (PE), and polystyrene (PS) showed that different plastic fragments have different adsorption capacities for the same organic compounds, indicating that the molecular structure of the plastics has an impact on their adsorption [24]. In addition, the particle size of MPs also affects their adsorption ability. The adsorption capacity of polychlorinated biphenyls by nano-polystyrene particles was 1–2 orders of magnitude higher than that of micron-sized PE plastics [25]. The adsorption of organic pollutants by MPs is affected by salinity, which can change the strength of electrostatic interaction and the degree of ion exchange in the adsorption process. The increase in salinity may enhance the MP adsorption capacity for organic pollutants [26,27]. Changes in temperature can affect the crystalline structure and composition of MPs, as well as the solubility and fluidity of organic pollutants, thus affecting the intermolecular interaction between them. In general, within a certain range, MP adsorption capacity rises with an increase in temperature.
With the increasing demand for oil in various countries and the rapid development of the shipping industry, marine oil spills occur on occasion. Accidental leakage from tankers, drilling operations, and oil refineries are the major sources of oil pollution that cause serious ecological and economic consequences, along with other negative impacts [28,29]. Due to the widespread coexistence of oil and MPs in the oceans, the interaction between MPs and oil is an emerging problem. In the Gulf of Mexico, 780 million liters of crude oil were leaked in the Deepwater Horizon accident [30], and MPs were observed in the surrounding area [31]. Recent research has attempted to explore the interaction between MPs and oil. Due to their attraction potentials, MPs and oil may coalesce to form an MP–oil agglomerate (MOA) [32]. The existence of an MP–oil dispersant agglomerate (MODA) after the dispersant had been applied was confirmed [33], the formation of which was found to reduce the oil-dispersive efficiency in a marine environment [34]. The researchers further explored the formation mechanism of MODA and defined two types of MODA, i.e., MODA-1 (MP-in-oil) and MODA-2 (MP–oil droplet embedded), as a result of the surface-free-energy minimization principle [35]. The sorption capacity of PE MPs for crude oil in seawater was higher than that in the intestinal tract [36]. The C-O and C-H functional groups played vital roles in the interactions between oil and MPs, regardless of the MPs aging or oil type [37].
Recently, attention has been focused on the interaction between spilled oil and MPs when a dispersant is applied. Environmental conditions such as salinity and temperature were important factors that affected the dispersion and biodegradation of spilled oil [38]. High salinity led to the compression of the electric double-layer of MPs, which resulted in a low repulsive energy barrier between MPs [39,40], and it has been reported that the adsorption of lubrication oil via MPs was improved by increased salinity [41]. In addition, increases in salinity could transfer more dispersants to the oil–water interface, and thus improve the availability of the dispersants for oil dispersion [35]. However, the effect of salinity on the dispersion of crude oil in the presence of MPs has not been clarified without the application of a dispersant. The temperature may affect the oil transport by changing the viscosity and the random motion of the oil. The oil viscosity decreased with an increase in temperature, which enhanced the movement of the oil and resulted in more oil released from the MPs into the water column [36]. Moreover, changes in temperature may also impact the adsorption ability of MPs for oil. It was found that the higher the temperature, the more the oil the MPs could adsorb [22]. Currently, the net effect of the temperature on the oil dispersion in the presence of MPs has not yet been investigated in detail. The purpose of this study was to individually explore the ultimate effects of salinity and temperature on the quantity and the size of the dispersed oil in the presence of MPs in seawater through batch mixing-oscillation experiments.
2. Materials and Methods
2.1. Chemicals and Materials
Merey crude oil from Venezuela (API gravity 10.73, viscosity 3542.60 mm2/s at 20 °C, density 951.8 kg/m3) was the test oil due to its significantly import quantity in China, and it was provided by the China Certification & Inspection Group Co., Ltd. (Beijing, China) and was stored in sealed glassware before use. Sea salt was purchased from Jiangxi Yantong Technology Co., Ltd., Ji’an, China. Two types of MPs with equivalent diameters of 13 μm and 106 μm were selected: the PE MPs were purchased from Dongguan Huachuang Plastic Co., Ltd., Dongguan, China, while the PS MPs from Changzhou Ruixiang Plastic Co., Ltd., Changzhou, China. N-hexane was purchased from Tianjin Kermel Chemical Reagent Co., Ltd., Tianjin, China. Synthetic seawater with 5 salinity levels (i.e., 15%, 20%, 25%, 30%, and 35%) was prepared by dissolving 15, 20, 25, 30, and 35 g of sea salt, respectively, into 1 L of water.
2.2. Experimental Instruments and Equipment
The experimental instruments and equipment used in this study are summarized with their corresponding purpose in Table 1.

Table 1.
Summary of the experimental instruments and equipment.
2.3. Experimental Design
Since it would be difficult to explain the individual effects if both environmental factors were to be changed simultaneously, the impacts of salinity (Experiment 1) and temperature (Experiment 2) on the dispersion of spilled oil in the presence of MPs were separately investigated. The specific conditions and the parameters set for the experiments are listed in Table 2. In each experiment, 18 mg of 13 μm or 106 μm PE or PS MPs were added to a 500 mL baffled conical flask filled with 360 mL synthetic seawater to achieve an MP concentration of 50 mg/L. Then, 0.3 g of oil was added into the MP–seawater mixture. After that, the MP–oil–seawater mixture was shaken at a rate of 160 rpm for 120 min in an oscillating incubator (ZQTY-90V, Zhichu Instrument Co., Ltd., Shanghai, China) and then was stationary for 10 min. The salinity in Experiment 1 was set at 15%, 20%, 25%, 30%, and 35%, respectively, and the temperature was controlled at 20 °C; the temperature in Experiment 2 was set at 10, 15, 20, and 25 °C, respectively, while the salinity was fixed at 30%. For a given salinity and temperature, the oscillation experiment was conducted with three groups of parallel samples synchronously. A photograph of the oscillating incubator with the baffled flasks employed in the experiments is shown in Figure 1.
Table 2.
Conditions and parameters for the laboratory experiments.
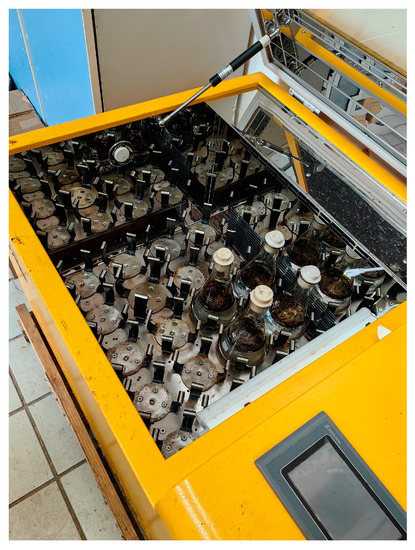
Figure 1.
Photograph of the oscillating incubator with baffled conical flasks employed in the experiments.
2.4. Determination of Oil Concentration
The oil concentration in the mixture was measured to evaluate the amount of dispersed oil droplets. In order to achieve this, the standard curve of petroleum hydrocarbons concentration was first obtained. A standard oil solution with a concentration of 200 mg/L was prepared. Amounts of 0, 0.25, 0.5, 0.75, 1.0, and 1.25 mL of the standard oil solution were diluted with n-hexane to 10 mL. A microplate spectrophotometer (BioTek Epoch2, Winooski, VT, USA) was employed to measure the absorbance of each oil solution (Ai) and a standard blank (A0) 3 times under a wavelength of 225 nm. The standard curve of petroleum hydrocarbons concentration (Coil) for Merey crude oil was fitted by the least-squares method as: Ai − A0 = 0.0297Coil − 0.0026 (R2 = 0.9996).
Before measuring the oil concentration in the synthetic seawater after each oscillation experiment, an absorbent felt was used to remove the floating oil on the surface without disturbing the solution in the conical flask. A total of 5 mL of the solution was transferred to separating funnels, and then 20 mL of n-hexane and sulfuric acid were added for extraction, shaken for 2 min, and then stood for 10 min. After extraction, the absorbance was measured by using an ultraviolet spectrophotometer at 225 nm, 3 times for each sample. Then, the oil concentration was calculated based on the average of the three measurements by using the standard curve, as described above.
2.5. Analytical Index
The oil dispersion efficiency (ODE) and volumetric mean diameter (VMD) were selected as indexes to represent the extent of oil dispersion. During the oscillation experiment, the amount of dispersed oil was calculated based on oil concentration:
where MD (mg) is the mass of dispersed oil; Ci (mg/L) is the oil concentration; Vw (mL) is the volume of seawater in the conical flask, 360 mL; Vs (mL) is the sample volume; and ω is the sample dilution ratio.
During the oscillation, the oil that remained on the wall of the conical flask was not included in the calculation of ODE. The remaining oil was transferred to a sample vial with an absorbent felt, extracted with 1 mL of n-hexane, and then measured. The calculation formula of the mass of the lost oil was the following:
where ML (g) is the mass of the lost oil; CL (mg/L) is the concentration of the lost oil; and Vw (mL) is the volume of seawater.
ML = CL × VL × ω
The ODE was calculated as follows:
where MA (g) is the total mass of the oil added.
The oil droplet size distribution, expressed as the volume fraction of oil droplets for each interval of the size range, was measured for each sample by laser diffraction (LISST-100X, Sequoia Scientific, Inc., Bellevue, WA, USA), with a detection range of 2.5–500 μm. The volumetric mean diameter (VMD) was adopted in this study to reflect the size of the dispersed oil droplets, and it was calculated by:
where V is the total volume concentration, and vi is the volume concentration of oil droplets within a size interval of average size di.
3. Results and Discussion
3.1. Effect of Salinity
In this study, the effect of salinity on oil dispersion was first investigated through the oscillation experiment for the MP–oil–seawater system. The oil dispersion efficiency (ODE) in the presence of 13/106 μm PE/PS MPs under different salinity conditions was plotted, as shown in Figure 2a. The ODE with all the MPs increased with the increase in salinity. When the salinity increased from 15% to 35%, the ODE in the presence of 13 μm PE and PS MPs increased by 10.4% and 12.9%, respectively, while it was slightly increased by 3.9% and 5.7%, respectively, with 106 μm PE and PS MPs. As mentioned in the Introduction, high salinity would greatly weaken the dispersion of the MPs by compressing the double electric layers and decreasing the repulsive energy barrier, so the total surface area of the available MPs for oil adsorption was reduced due to the enhanced aggregation of the MPs, which then increased in the amount of oil that was able to disperse into the water column [39]. The oil–water interfacial tension with the different MPs under different salinity conditions was further measured, and the results are shown in Figure 2b. We found that the interfacial tension decreased with an increase in salinity, for each case, which could be attributed to the diffusion of surface-active materials such as asphaltenes and naphthenic acids within the crude oil into the oil/water interface [42]. This observation was also consistent with our previous findings that the lower the oil–water interfacial tension was, the higher the oil dispersion efficiency would be [43,44].
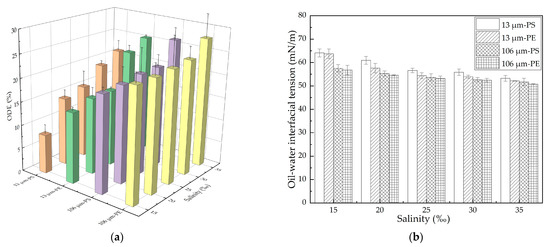
Figure 2.
Impact of salinity on oil dispersion in the presence of different MPs in the oscillation experiment: (a) ODE; (b) Oil–water interfacial tension. The error bar represents the standard deviation of the measurements of the three parallel samples. Orange, green, purple and yellow indicate 13 μm-PS, 13 μm-PE, 106 μm-PS, 106 μm-PE, represently.
For both the PE and PS MPs, the inhibition of the 13 μm MPs on the oil dispersion was more significant than that found with 106 μm MPs, as shown in Figure 2a. A previous study found that with the decrease in the size of MPs, the adsorption of the lubricating oil on the MPs increased significantly [45]. The oil concentration was the same under each salinity condition, but the 13 μm MPs with a higher concentration and a larger specific surface area than the 106 μm MPs were able to adsorb more oil under the disturbance condition; when the mixture returned to calm state, the refloating MPs carried more oil to the water surface and correspondingly reduced the amount of oil dispersed into the water column [35]. This was also indicated by the measurement of the oil–water interfacial tension, as shown in Figure 2b. The interfacial tension with the 13 μm MPs was greater than that with the 106 μm MPs at the same salinity. In addition, we found that the ODE with the PS MPs was smaller than that with PE MPs at the same salinity. We also found that the ODE of the aged MPs was larger than that of pristine MPs, due to the formation of hydrophilic functional groups [34]. The hydrophobic benzene ring contained by the PS resulted in a weaker oil dispersion by the PS than that by the PE. This was also consistent with the fact that the oil–water interfacial tension with the PS MPs was greater than that with PE MPs at the same salinity.
In general, the performance of the oil dispersion was reflected in both the ODE and the VMD. The more effectively the spilled oil was dispersed, the larger the quantity and the smaller size of the dispersed oil droplets formed. Figure 3 shows the volumetric mean diameter (VMD) of the dispersed oil droplets with different MPs under different salinity conditions. For the same MPs, the VMD of the dispersed oil droplets decreased with an increase in salinity because the decline of the oil–water interfacial tension favored the formation of relatively smaller oil droplets. When the salinity rose from 15% to 35%, the VMD for 13 μm PE and PS MPs decreased by 12.9 μm and 13.6 μm, respectively; while for 106 μm PE and PS MPs, it decreased by 12.7 μm and 8.8 μm, respectively. At the same salinity, the VMD with 13 μm MPs was larger than that with 106 μm MPs, and the VMD with the PS MPs was larger than that with the PE MPs. In this study, the higher ODE was matched well by the lower VMD under different experimental conditions.
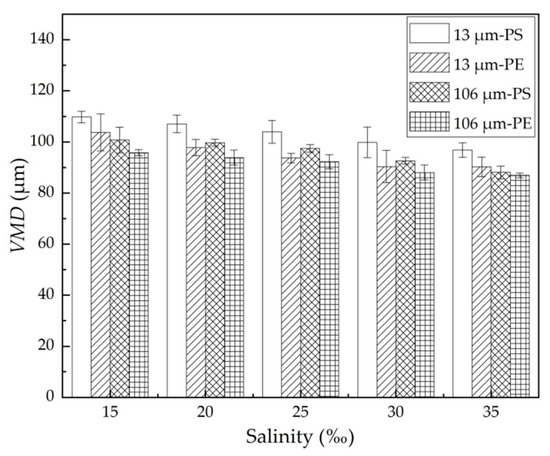
Figure 3.
VMD of the dispersed oil droplets with different MPs at different salinity. The error bar represents the standard deviation of the measurements of the three parallel samples.
Overall, the results of this study showed that the rise in the salinity had a more significant effect on promoting, rather than inhibiting, oil dispersion in the presence of MPs. A relatively higher salinity environment was conducive to improve the amount of dispersed oil and reduced the average size of the oil droplets by forming a lower oil–water interfacial tension with the MPs.
3.2. Effect of Temperature
Temperature may affect the oil dispersion via MPs through both positive and negative aspects. On one hand, both the viscosity and oil–water interfacial tension of oil have been shown to decrease with an increase in temperature [46,47]. The lower the viscosity and oil–water interfacial tension of the oil, the less the energy required for the oil film to break and disperse. The viscosity reduction enhances the movement of oil, resulting in more oil dispersed into the water column. On the other hand, an increase in temperature has also been shown to enhance the adsorption capacity of the MPs for oil [31], as they could adsorb more oil and carry it back to the water surface, thus reducing the oil concentration in the suspension. The net effect of temperature on oil dispersion was further investigated in this study. The oil dispersion efficiency with different MPs at different temperatures is shown in Figure 4a. The ODE with both the PE and PS MPs increased with increases in temperature. When the temperature rose from 10 to 25 °C, the ODE with 13 μm PE and PS MPs increased by 15.6% and 12.7%, respectively, while it increased by about 10.5% with either 106 μm PE or PS MPs. As shown in Figure 4b, the oil–water interfacial tension decreased with the increase in temperature for both types and both sizes of MPs.
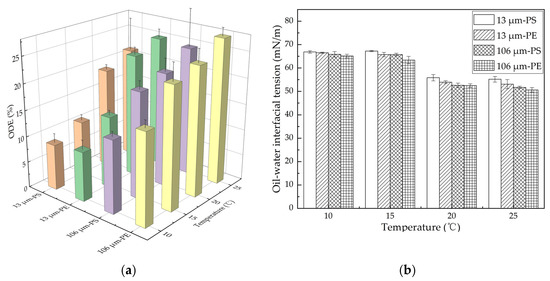
Figure 4.
Impact of temperature on oil dispersion with different MPs in the oscillation experiment: (a) ODE; (b) Oil–water interfacial tension. The error bar represents the standard deviation of the measurements of the three parallel samples. Orange, green, purple and yellow indicate 13 μm-PS, 13 μm-PE, 106 μm-PS, 106 μm-PE, represently.
Again, for both the PE and PS MPs, due to the larger concentration and specific surface area, the 13 μm MPs trapped more oil than the 106 μm MPs, and this resulted in a lower ODE at the same temperature; due to the hydrophobic benzene ring contained by the PS, the ODE with the PS MPs was lower than that with the PE MPs. This result was also supported by the measured oil–water interfacial tension, as shown in Figure 4b. At the same temperature, the interfacial tension with the 13 μm MPs was larger than that with the 106 μm MPs, and the interfacial tension with PE MPs was larger than that with PS MPs.
The volumetric mean diameter of the dispersed oil droplets formed in the oscillation experiments in the presence of MPs under different temperatures was plotted, as shown in Figure 5. We found that the VMD of the dispersed oil droplets decreased with an increase in temperature. When the temperature increased from 10 to 25 °C, the VMD of 13 μm PE and PS MPs declined from 101.7 and 107.0 μm to 89.1 and 96.1 μm, respectively; the VMD of 106 μm PE and PS MPs rose from 93.2 and 97.8 μm to 85.1 and 88.3 μm, respectively. At the same temperature, the VMD with 13 μm MPs was larger than that with 106 μm MPs, and the VMD with the PS MPs was larger than that with the PE MPs. Overall, the decreasing trend of the VMD was well supported by the decreasing trend of the oil–water interfacial tension, as shown in Figure 4b.
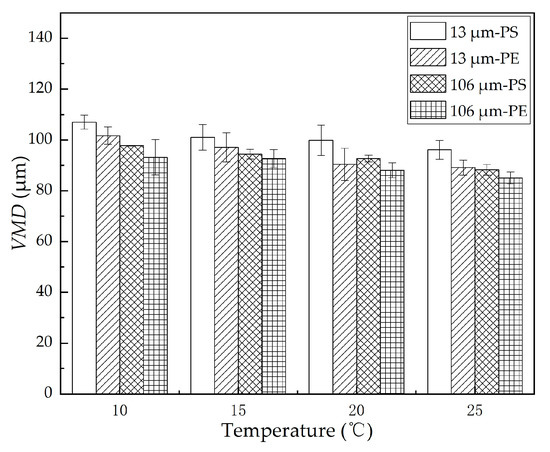
Figure 5.
VMD with different MPs at different temperatures. The error bar represents the standard deviation of the measurements of the three parallel samples.
Furthermore, the volumetric frequency distribution of the dispersed oil droplet sizes under different temperatures was plotted, as shown in Figure 6. The size distribution was unimodal for all cases. That is, changes in the temperature did not play a significant role in the droplet size distribution. The sizes of the dispersed oil droplets in the presence of MPs were generally within the range of 74.5–104 μm, and the droplet size corresponding to the peak volume frequency was close to the value of the VMD. The most frequent oil droplet sizes did not differ significantly among different sizes and different types of MPs, which indicated the stability of the oil droplets dispersed in the suspension, to some extent.
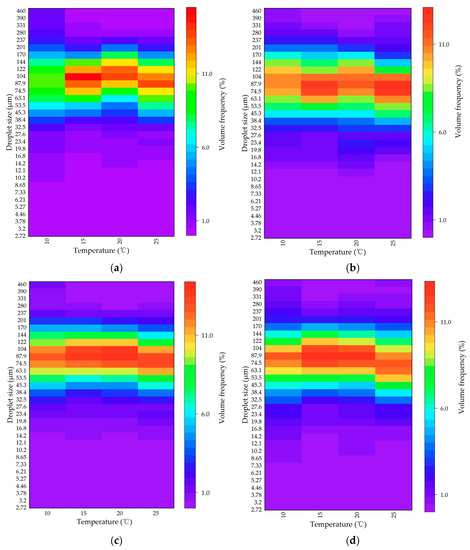
Figure 6.
Heatmap of the volumetric frequency distribution of the dispersed oil droplets under different temperatures with (a) 13 μm PS, (b) 13 μm PE, (c) 106 μm PS, and (d) 106 μm PE MPs.
The results indicated that the increases in temperature had a more significant impact on promoting, rather than inhibiting, oil dispersion in the presence of the MPs. A relatively warmer environment could enhance the extent of the oil dispersion by reducing the oil–water interfacial tension with the MPs.
4. Conclusions
This study explored the individual effects of salinity and temperature on the dispersion of spilled oil in the presence of MPs. Salinity affects the double electric layers of MPs as well as the oil adsorption by the MPs. Increases in salinity resulted in a more significant effect on promoting, rather than inhibiting, oil dispersion in the presence of MPs. When the salinity rose from 15% to 35% with 13 μm PE and PS MPs, the ODE increased by 10.4% and 12.9%, respectively, while the VMD decreased by 12.9 μm and 13.6 μm, respectively. Temperature affects oil dispersion by changing the viscosity of the oil as well as the oil adsorption ability of the MPs. Increases in temperature also showed a greater impact on enhancing, rather than inhibiting, oil dispersion with MPs. When the temperature rose from 10 to 25 °C in the presence of 13 μm PE and PS MPs, the ODE increased by 15.6% and 12.7%, respectively, while the VMD declined from 101.7 and 107.0 μm to 89.1 and 96.1 μm, respectively. For both the PE and PS MPs, because of the larger concentration and specific surface area, the 13 μm MPs showed a more significant impact on the oil dispersion than the 106 μm MPs, since the former could adsorb more oil and maintain it on the surface of the seawater. At the same salinity and temperature, the ODE with the PE MPs was greater than that with the PS MPs, likely due to the hydrophobic benzene ring contained by the latter. Moreover, the rise in ODE, the decrease in VMD, and the reduction in the oil–water interfacial tension matched very well with each other. The findings of this study expanded the understanding to the migration of spilled oil in seawater in the presence of MPs and provided fundamental data for modelling the outcome and transport of spilled oil, which could improve the capabilities of marine environmental protection departments when formulating oil spill countermeasures in the future.
Author Contributions
Conceptualization, H.G. and Z.Q.; methodology, Z.Q. and X.Y.; software, H.G.; validation, X.Y. and Y.A.; formal analysis, Z.Q. and H.G.; investigation, Z.L. and M.Y.; resources, D.X.; data curation, H.G. and X.Y.; writing—original draft preparation, H.G.; writing—review and editing, Z.Q.; supervision, Z.Q. and D.X.; project administration, Z.Q. and D.X.; funding acquisition, Z.Q. and D.X. All authors have read and agreed to the published version of the manuscript.
Funding
This research was funded by the National Natural Science Foundation of China (41807466, 42076167) and the Liaoning Provincial Natural Science Foundation of China (20170540099).
Institutional Review Board Statement
Not applicable.
Informed Consent Statement
Not applicable.
Data Availability Statement
Not applicable.
Conflicts of Interest
The authors declare no conflict of interest.
References
- Thompson, R.C.; Olsen, Y.; Mitchell, R.P.; Davis, A.; Rowland, S.J.; John, A.W.; McGonigle, D.; Russell, A.E. Lost at sea: Where is all the plastic? Science 2004, 304, 838. [Google Scholar] [CrossRef]
- Lin, W.; Li, X.; Yang, M.; Lee, K.; Chen, B.; Zhang, B. Brominated flame retardants, microplastics, and biocides in the marine environment: Recent updates of occurrence, analysis, and impacts. Adv. Mar. Biol. 2018, 81, 167–211. [Google Scholar]
- Eriksen, M.; Lebreton, L.C.; Carson, H.S.; Thiel, M.; Moore, C.J.; Borerro, J.C.; Galgani, F.; Ryan, P.G.; Resisser, J. Pullution in the World’s Oceans: More than 5 Trillion Plastic Pieces Weighing over 250,000 Tons Afloat at Sea. PLoS ONE 2014, 9, 111913. [Google Scholar] [CrossRef] [PubMed]
- Zhang, D.; Liu, X.; Huang, W.; Li, J.; Wang, C.; Zhang, D.; Zhang, C. Microplastic pollution in deep-sea sediments and organisms of the Western Pacific Ocean. Environ. Pollut. 2020, 259, 113948. [Google Scholar] [CrossRef]
- Amélineau, F.; Bonnet, D.; Heitz, O.; Mortreux, V.; Harding, A.M.; Karnovsky, N.; Walkusz, W.; Fort, J.; Gremillet, D. Microplastic pollution in the Greenland Sea: Background levels and selective contamination of planktivorous diving seabirds. Environ. Pollut. 2016, 219, 1131–1139. [Google Scholar] [CrossRef]
- Pakhomova, S.; Berezina, A.; Lusher, A.L.; Zhdanov, L.; Silvestrova, K.; Zavialov, P.; Bavel, B.V.; Yakushev, E. Microplastic variability in subsurface water from the Arctic to Antarctica. Environ. Pollut. 2022, 298, 118808. [Google Scholar] [CrossRef]
- Gao, Y.; Liu, Y. Removal of microplastics by coagulation treatment in waters and prospect of recycling of separated microplastics: A mini-review. J. Environ. Chem. Eng. 2022, 10, 108197. [Google Scholar] [CrossRef]
- Law, K.L.; Morétferguson, S.E.; Goodwin, D.S.; Zettler, E.R.; Deforce, E.; Kukulka, T.; Proskurowski, G. Distribution of surface plastic debris in the eastern Pacific Ocean from an 11-year data set. Environ. Sci. Technol. 2014, 48, 4732–4738. [Google Scholar] [CrossRef]
- Law, K.L.; Morét-Ferguson, S.; Maximenko, N.A.; Proskurowski, G.; Peacock, E.E.; Hafner, J.; Reddy, C.M. Plastic accumulation in the North Atlantic subtropical gyre. Science 2010, 329, 1185–1188. [Google Scholar] [CrossRef] [PubMed]
- Wang, S.; Chen, H.; Zhou, X.; Tian, Y.; Lin, C.; Wang, W.; Zhou, K.; Zhang, Y.; Lin, H. Microplastic abundance, distribution and composition in the mid-west Pacific Ocean. Environ. Pollut. 2020, 264, 114125. [Google Scholar] [CrossRef] [PubMed]
- Thushari, G.G.N.; Miyazono, K.; Sato, T.; Yamashita, R.; Takasuka, A.; Watai, M.; Yasuda, T.; Kuroda, H.; Takahashi, K. Floating plastic accumulation and distribution around Kuroshio Current, western North Pacific. Mar. Pollut. Bull. 2023, 188, 114604. [Google Scholar] [CrossRef] [PubMed]
- Cole, M.; Lindeque, P.; Halsband, C.; Galloway, T.S. Microplastics as contaminants in the marine environment: A review. Mar. Pollut. Bull. 2011, 62, 2588–2597. [Google Scholar] [CrossRef] [PubMed]
- Wright, S.L.; Thompson, R.C.; Galloway, T.S. The physical impacts of microplastics on marine organisms: A review. Environ. Pollut. 2013, 178, 483–492. [Google Scholar] [CrossRef]
- Rochman, C.M.; Tahir, A.; Williams, S.L.; Baxa, D.V.; Lam, R.; Miller, J.T.; Teh, F.; Werorilangi, S.; Teh, S.J. Anthropogenic debris in seafood: Plastic debris and fibers from textiles in fish and bivalves sold for human consumption. Sci. Rep. 2015, 5, 14340. [Google Scholar] [CrossRef]
- Westerhoff, P.; Zimmerman, J.B.; Field, J.; Lowry, G. Making Waves. Environ. Sci. Technol. 2020, 54, 6449–6450. [Google Scholar] [CrossRef] [PubMed]
- Lim, C.; Kim, N.; Lee, J.; Yoon, Y. Potential of Adsorption of Diverse Environmental Contaminants onto Microplastics. Water 2022, 14, 4086. [Google Scholar] [CrossRef]
- Wang, W.F.; Wang, J. Different partition of polycyclic aromatic hydrocarbon on environmental particulates in freshwater: Microplastics in comparison to natural sediment. Ecotoxicol. Environ. Saf. 2018, 147, 648–655. [Google Scholar] [CrossRef]
- Bao, Z.; Lu, S.; Wang, G.; Cai, Z.; Chen, Z. Adsorption of 2-hydroxynaphthalene, naphthalene, phenanthrene, and pyrene by polyvinyl chloride microplastics in water and their bioaccessibility under in vitro human gastrointestinal system. Sci. Total Environ. 2023, 871, 162157. [Google Scholar] [CrossRef]
- Llorca, M.; Ábalos, M.; Vega-Herrera, A.; Adrados, M.A.; Abad, E.; Farré, M. Adsorption and Desorption Behaviour of Polychlorinated Biphenyls onto Microplastics’ Surfaces in Water/Sediment Systems. Toxics 2020, 8, 59. [Google Scholar] [CrossRef]
- Rochman, C.M.; Hoh, E.; Hentschel, B.T.; Kaye, S. Long-Term field measurement of sorption of organic contaminants to five types of plastic pellets: Implications for plastic marine debris. Environ. Sci. Technol. 2013, 47, 1646–1654. [Google Scholar] [CrossRef]
- Zhang, J.; Zhan, S.; Zhong, L.B.; Wang, X.; Qiu, Z.; Zheng, Y.M. Adsorption of typical natural organic matter on microplastics in aqueous solution: Kinetics, isotherm, influence factors and mechanism. J. Hazard. Mater. 2023, 443, 130130. [Google Scholar] [CrossRef]
- Yap, K.Y.; Tan, M.C. Oil adsorption onto different types of microplastic in synthetic seawater. Environ. Technol. Innov. 2021, 24, 101994. [Google Scholar] [CrossRef]
- Gao, L.; Su, Y.; Yang, L.; Li, J.; Bao, R.; Peng, L. Sorption behaviors of petroleum on micro-sized polyethylene aging for different time in seawater. Sci. Total Environ. 2022, 808, 152070. [Google Scholar] [CrossRef]
- Lee, H.; Shim, W.J.; Kwon, J.H. Sorption capacity of plastic debris for hydrophobic organic chemicals. Sci. Total Environ. 2014, 470, 1545–1552. [Google Scholar] [CrossRef]
- Velzeboer, I.; Kwadijk, C.; Koelmans, A.A. Strong sorption of PCBs to nanoplastics, microplastics, carbon nanotubes, and fullerenes. Environ. Sci. Technol. 2014, 48, 4869–4876. [Google Scholar] [CrossRef]
- Wang, F.; Shin, K.M.; Li, X.Y. The partition behavior of perfluorooctanesulfonate (PFOS) and perfluorooctanesulfonmide (FOSA) on microplastics. Chemophere 2015, 119, 841–847. [Google Scholar] [CrossRef] [PubMed]
- Wu, C.X.; Zhang, K.; Huang, X.L.; Liu, J.T. Sorption of pharmaceuticals and personal care products care products to polyethylene debris. Environ. Sci. Pollut. Res. 2016, 23, 8819–8826. [Google Scholar] [CrossRef] [PubMed]
- Yu, Y.; Qi, Z.; Xiong, D.; Li, W.; Yu, X.; Sun, R. Experimental investigations on the vertical distribution and properties of oil-mineral aggregates (OMAs) formed by different clay minerals. J. Environ. Manag. 2022, 311, 114844. [Google Scholar] [CrossRef] [PubMed]
- Qi, Z.; Yu, Y.; Yu, X.; Li, W.; Fu, S.; Xiong, D. Effect of the concentration and size of suspended particulate matter on oilparticle aggregation. Mar. Pollut. Bull. 2020, 153, 110957. [Google Scholar] [CrossRef]
- Pan, Z.; Zhao, L.; Boufadel, M.C.; King, T.; Robinson, B.; Conmy, R.; Lee, K. Impact of mixing time and energy on the dispersion effectiveness and droplets size of oil. Chemosphere 2017, 166, 246–254. [Google Scholar] [CrossRef]
- Alvarez-Zeferino, J.C.; Ojeda-Benítez, S.; Cruz-Salas, A.A.; Martínez-Salvador, C.; Vázquez-Morillas, A. Microplastics in Mexican beaches. Resour. Conserv. Recy. 2020, 155, 104633. [Google Scholar] [CrossRef]
- Yang, M.; Zhang, B.; Xin, X.; Lee, K.; Chen, B. Microplastic and oil pollution in oceans: Interactions and environmental impacts. Sci. Total Environ. 2022, 838, 156142. [Google Scholar] [CrossRef] [PubMed]
- Yang, M.; Zhang, B.; Chen, Y.; Xin, X.; Lee, K.; Chen, B. Impact of Microplastics on Oil Dispersion Efficiency in the Marine Environment. Sustainability 2021, 13, 13752. [Google Scholar] [CrossRef]
- Yang, M.; Chen, B.; Xin, X.; Song, X.; Liu, J.; Dong, G.; Lee, K.; Zhang, B. Interactions between microplastics and oil dispersion in the marine environment. J. Hazard. Mater. 2021, 403, 123944. [Google Scholar] [CrossRef]
- Yang, M.; Zhang, B.; Xin, X.; Liu, B.; Zhu, Z.; Dong, G.; Zhao, Y.; Lee, K.; Chen, B. Microplastic-oil-dispersant agglomerates in the marine environment: Formation mechanism and impact on oil dispersion. J. Hazard. Mater. 2022, 426, 127825. [Google Scholar] [CrossRef] [PubMed]
- Shan, J.; Wang, J.; Zhan, J.; Liu, L.; Wu, F.; Wang, X. Sorption behaviors of crude oil on polyethylene microplastics in seawater and digestive tract under simulated real-world conditions. Chemosphere 2020, 257, 127225. [Google Scholar] [CrossRef] [PubMed]
- Feng, Q.; An, C.; Chen, Z.; Yin, J.; Zhang, B.; Lee, K.; Wang, Z. Investigation into the impact of aged microplastics on oil behavior in shoreline environments. J. Hazard. Mater. 2022, 421, 126711. [Google Scholar] [CrossRef] [PubMed]
- Xia, W.; Li, J.; Zheng, X.; Zhao, J. Influence of Environmental Factors on Biodegradation of Dispersed Diesel Oil in Seawater. Environ. Forensics 2009, 10, 354–358. [Google Scholar] [CrossRef]
- Gui, X.; Ren, Z.; Xu, X.; Chen, X.; Zhao, L.; Qiu, H.; Gao, X. Oil spills enhanced dispersion and transport of microplastics in sea water and sand at coastal beachheads. J. Hazard. Mater. 2022, 436, 129312. [Google Scholar] [CrossRef]
- Dong, Z.; Hou, Y.; Han, W.; Liu, M.; Wang, J.; Qiu, Y. Protein corona-mediated transport of nanoplastics in sea water-saturated porous media. Water Res. 2020, 182, 115978. [Google Scholar] [CrossRef]
- Hu, J.; Yang, S.Z.; Guo, L.; Xu, X.; Yao, T.; Xie, F. Microscopic investigation on the adsorption of lubrication oil on microplastics. J. Mol. Liq. 2017, 227, 351–355. [Google Scholar] [CrossRef]
- Mehraban, M.F.; Farzaneh, S.A.; Sohrabi, M. Debunking the Impact of Salinity on Crude Oil/Water Interfacial Tension. Energ. Fuel. 2021, 35, 3766–3779. [Google Scholar] [CrossRef]
- Qi, Z.; Sun, R.; Yu, Y.; Xiong, D.; Li, W.; Yu, X.; Fu, S. Performance of dispersed oil and suspended sediment during the oil-sediment aggregation process. Mar. Pollut. Bull. 2021, 168, 112455. [Google Scholar] [CrossRef] [PubMed]
- Yu, Y.; Qi, Z.; Xiong, D.; Sun, R.; Fu, S.; Li, W. Oil dispersion and aggregation with suspended particles in a wave tank. J. Environ. Manage. 2021, 278, 111572. [Google Scholar] [CrossRef]
- Chandrasekar, S.; Sorial, G.A.; Weaver, J.W. Dispersant effectiveness on oil spills—Impact of salinity. ICES J. Mar. Sci. 2006, 63, 1418–1430. [Google Scholar] [CrossRef]
- Gao, Y.; Zhao, X.; Ju, Z.L.; Yu, Y.; Qi, Z.X.; Xiong, D.Q. Effects of the suspended sediment concentration and oil type on the formation of sunken and suspended oils in the Bohai Sea. Environ. Sci.-Proc. Imp. 2018, 20, 1404–1413. [Google Scholar] [CrossRef]
- Yu, Y.; Qi, Z.; Li, W.; Fu, S.; Yu, X.; Xiong, D. Effects of physical parameters and chemical dispersant on the formation of oil-particle aggregates (OPAs) in marine environments. Mar. Pollut. Bull. 2019, 148, 66–74. [Google Scholar] [CrossRef]


Disclaimer/Publisher’s Note: The statements, opinions and data contained in all publications are solely those of the individual author(s) and contributor(s) and not of MDPI and/or the editor(s). MDPI and/or the editor(s) disclaim responsibility for any injury to people or property resulting from any ideas, methods, instructions or products referred to in the content. |
© 2023 by the authors. Licensee MDPI, Basel, Switzerland. This article is an open access article distributed under the terms and conditions of the Creative Commons Attribution (CC BY) license (https://creativecommons.org/licenses/by/4.0/).