1. Introduction
The development and utilization of clean and renewable energy provide a golden opportunity to reduce fossil energy consumption, and it is a key way to meet the requirement of the Paris Agreement on reducing greenhouse gas emissions [
1]. Wave energy is a kind of clean and renewable energy with abundant reserves, which has attracted the attention of scientists all over the world. Various wave energy converters (WECs) have been designed according to the energy capture methods with different principles, such as oscillating water columns (OWCs), wave-activated bodies, and overtopping devices. An ERWEC can be categorized as a wave-activated body type WEC, which has the capacity to absorb wave energy from all directions. The motion part of the ERWEC device is protected within the closed hull to avoid direct contact with the corrosive seawater, resulting in better survivability and lower maintenance costs.
To date, several ERWEC devices have been studied. In [
2], the technical and economical development over three generations of SEAREV WECs have been reviewed. The authors pointed out that the high levelized cost of energy was still the main reason preventing the devices from accessing a grid-connected utility electricity market. PeWEC was designed at Politecnico di Torino, which was a vertical pendulum-based floating WEC absorbing the wave energy from a uni-direction. The experimental tank testing and numerical modeling of a 1:12 scale PeWEC were described in [
3]. The results showed that the numerical model could be used for the design of the full-scale WEC device and optimization of the parameters of the system. Another typical example of the horizontal eccentric rotor device was the Penguin WEC developed by the Wello Oy company [
4]. The full-scale prototype has been tested in a real sea state, and the results showed the superiority of harnessing energy from all directions. The above are relatively mature ERWEC devices, and relevant theoretical research can be found in [
5,
6,
7,
8].
The WEC devices mentioned above are based on the direct mechanical drive PTO system, which has a relatively short lifetime, high maintenance cost, and poor output power stability [
9]. The direct linear drive system is an available energy conversion system, which has the ability to swap from motor to generator model at any given moment to provide reactive power for some control strategies [
10]. The hydraulic PTO is a mature energy conversion system, which is suited to absorbing energy under the condition of large load and slow speed, with the characteristics of effective shock absorption and easy energy storage. A large number of WEC proposals have incorporated hydraulic PTO systems in their designs, such as Pelamis WEC [
11]. In [
12], a critical comparison of load control algorithms for hydraulic system generator power converters was investigated and the proposed torque control algorithm proved to be suitable for hydraulic PTO. Liu et al. [
13] developed a latching control strategy for a raft-type WEC with a hydraulic PTO. To the best of our knowledge, such an application in an ERWEC device has not been performed. Meanwhile, the parameters of the PTO system are difficult to determine due to the complexity and coupling effect. An optimization process is necessary to obtain a reasonable PTO structure and optimal conversion efficiency. Aiming at the parameter optimization problem, some researchers have tried to improve the PTO system with advanced optimization algorithms. In [
14], to find the optimal PTO system parameters, several approaches are incorporated to solve the nonlinear optimization problem. Yu et al. [
15] developed a hydraulic PTO model to trade off mean captured power and power fluctuation using three different power smoothing methods. Neshat et al. [
16] proposed a hybrid cooperative co-evolution algorithm framework, which consisted of a symmetric local search plus Nelder-Mead and a cooperative co-evolution algorithm with a backtracking strategy for optimizing relative positions of buoys and PTO parameters for each buoy. Compared with other popular evolutionary algorithms, it showed that the above algorithm framework had better performance in both runtime and solving quality. Sheng et al. [
17] proposed a simple and fast-turnaround assessment method to optimize the linear PTO damping coefficient. This method was suitable in the early design stage of the WEC devices and had a similar effect with nonlinear PTO in optimizing the wave energy capture ability.
The accumulator is the critical part of the hydraulic PTO system, which affects the output power efficiency and stability. The hydraulic PTO, including a high-pressure hydraulic circuit and a gas accumulator, has been modeled in [
18], which laid a theoretical foundation for the design of a hydraulic PTO system with an accumulator. In the work of [
19], the influence of accumulator parameters, such as initial volume and pre-charge pressure, on the power conversion ability of the two-raft-type WEC has been analyzed and discussed. Hansen et al. [
20] have analyzed the influence of multiple accumulators on output energy. However, the influence of control parameters, such as trigger pressure and working duration of the accumulator, on the power conversion performance has not been fully studied. It has the potential to improve power generation and reduce costs significantly, combined with parameter optimization and advanced control strategies [
21,
22].
In this research, a novel application scheme of the hydraulic PTO system for ERWEC devices is proposed. The influence of accumulator control parameters on power conversion performance is analyzed experimentally, and the optimal parameter tuning method is proposed. This paper is structured as follows. In
Section 2, the novel hydraulic PTO system of the ERWEC is introduced in detail. In
Section 3, the experimental procedure is described, and the results are discussed. In
Section 4, the multi-objective optimization techniques used to determine optimal control parameters are proposed. In
Section 5, the main conclusions are summarized and suggestions for future research are made.
2. ERWEC System
2.1. Mechanical Structure of ERWEC
The schematic representation of the ERWEC is shown in
Figure 1a. The motion of the bottom case activated by wave excitation makes the eccentric rotor no longer located at the position with the lowest gravitational potential energy. With the help of gravity, the eccentric rotor will tend to move to the position with the lowest gravitational potential energy. The rotational motion of eccentric rotor around vertical axis could be used to generate electric energy. The 3D schematic diagram of the device designed according to the principle of ERWEC is shown in
Figure 1b. The hydraulic PTO is installed in a closed hull composed of a cover shell and a bottom case, to be completely isolated from seawater. Therefore, the corrosion caused by seawater and the damage caused by extreme waves to PTO are mostly avoided, and the reliability of the WEC will be enhanced significantly.
Furthermore, the 1:5 scaled model of the ERWEC, based on Froude similitude and made of steel plate, was developed, as illustrated in
Figure 1c. Two transparent silica gel observation windows are installed on the cover shell, which makes it convenient to observe the operation state of the internal hydraulic PTO system and weakens the shielding effect of the closed metal hull on the wireless data transmission between inside and outside electronic modules. Considering the size limitation of the scaled physical model, only one small hydraulic accumulator is used in the closed shell.
About the scaled model, the length of the bottom case is 1500 mm, the width is 1000 mm, the overall height is 862 mm, the draught is 320 mm, the center of buoyancy is 110 mm below the waterline, and the center of gravity is 60 mm above the waterline.
2.2. Principle of Hydraulic PTO
The schematic diagram of hydraulic PTO is presented in
Figure 2.
According to the components of hydraulic PTO, the hydraulic pump could convert low-pressure oil to high-pressure oil. In order to adapt to the change of the rotation direction of the eccentric rotor, the two-way gear hydraulic pump is used. Moreover, four check valves are used to compose the hydraulic rectifier circuit, which will make hydraulic oil enter the accumulator from the oil tank, no matter the rotation direction changes of the hydraulic pump. The pressure transmitter (a) is installed on the main oil circuit to monitor the oil pressure of the hydraulic accumulator, which is a key parameter to decide whether to open the electromagnetic switch valve. The hydraulic accumulator, with the help of the electromagnetic switch valve, is used to store the unstable high-pressure oil from the hydraulic pump, and drive the hydraulic motor as stably as possible. The hydraulic cylinder is used to adjust the eccentricity of the eccentric rotor. Benefited from the spring, the eccentricity can be adjusted automatically according to the oil pressure. The proportional flow control valve is designed to control the rotational speed of the hydraulic motor to make the output electric energy stable, which will be studied in the future. The hydraulic motor can be driven by high-pressure oil and then drive the electric generator to produce electricity. If the oil in the hydraulic circuit is too high, the relief valve will work to ensure the security of hydraulic PTO.
With the wave excitation, the eccentric rotor will rotate around the vertical axis (as shown in
Figure 1) and drive the input shaft of the speed increase gearbox to rotate, which results in a larger speed of the output shaft and drives the hydraulic pump to rotate. When the hydraulic pump rotates clockwise, the hydraulic oil flows to the hydraulic accumulator through check valve (d) and check valve (b), in sequence. On the contrary, the hydraulic oil flows to the hydraulic accumulator through check valve (a) and check valve (c), in sequence, when the hydraulic pump rotates counterclockwise. Thus, the two-way rotation of the eccentric rotor is able to drive the PTO system to generate electricity through the hydraulic circuit formed by the four check valves.
Under the same wave excitation, the increased eccentricity will increase the force arm and the torque acting on the central shaft. Then, a large rotation speed of the eccentric rotor can be obtained, which will make a large output flow and a large output pressure of the hydraulic pump. When the wave conditions change, the pressure of hydraulic oil entering the rod cavity of hydraulic cylinder through port B (as shown in
Figure 2) increases with the increasement of the speed of the hydraulic pump, causing the reduction in the rotor eccentricity as the spring is compressed and the piston rod retracts. The reduced eccentricity results in a lower speed of the eccentric rotor. On the contrary, if the hydraulic pump has a low speed, the eccentricity will be increased due to the difference between the spring force and the force from hydraulic oil pressure. Hence, the eccentric rotor will be sped up. With the help of the spring in the rodless chamber of the hydraulic cylinder, the hydraulic PTO system implements the sea state adaptive energy capture process of the ERWEC. The active control module of the hydraulic PTO system consists of electromagnetic switch valve and proportional flow valve. The former is used to control the energy accumulation and release of the hydraulic accumulator, and the latter has the capacity for real-time adjustment of the PTO damper. The coordination of the two valves can achieve the regulation of PTO under complex working conditions.
2.3. Physical Model of Hydraulic PTO System
On the basis of the schematic diagram of the hydraulic PTO system, the physical model has been constructed, as shown in
Figure 3.
The data collector could acquire the measurement values of the pressure transmitter in the hydraulic PTO system and the output power values of the electric generator, such as output voltage and output current. The collected data could be transferred to a computer wirelessly. In the computer terminal, the control parameters could be sent to the controller to generate a control signal, and then the control process of the electromagnetic switch valve could be achieved. The state of the electromagnetic switch valve could directly affect the process of energy accumulation and release of the hydraulic accumulator. Thus, the control signal of the electromagnetic switch valve is equivalent to the control signal of the hydraulic accumulator. The electric generator is connected with a fixed resistance in series to measure the output current and the load on the electric generator is unchanged. The oil tank is used to store the oil needed to ensure the work of the hydraulic system.
In order to analyze the effects of control parameters of the accumulator on the energy conversation performance, the natural parameter of each hydraulic component in the PTO system should be determined. According to scale factor and energy input capacity, the rated power of the electric generator was set as 50 W. Considering the relation between output efficiency and rotational speed of hydraulic motor, the rated speed electric generator was set as 500 r/min, which was the reasonable value to make most hydraulic motors achieve optimal efficiency. In terms of hydraulic pump, the optimum rotational speed was about 1000 r/min. The rotational speed of the eccentric rotor was not high, from about 10 r/min to 50 r/min, so the speed increase gearbox with a large ratio was needed. The ratio of speed increase gearbox was set as 40:1. Under the artificial input motion conditions, the hydraulic pressure was from about 3 MPa to 5 MPa. Then, the displacement of the hydraulic pump can be calculated by the equation of
P =
pq/60, where
P and
p can be set as 50 W and 3 MPa, respectively, and the calculated result of displacement was 1 cc/rev. According to mass conservation law, the displacement of the hydraulic motor was about 2 cc/rev. Considering the space limitation of the physical model, the volume of the accumulator was set as 6.3 L. According to the manual of hydraulic components, the output pressure of the appropriated hydraulic pump was 10 MPa considering the displacement and efficiency, and the parameters of the hydraulic components in the PTO system are shown in
Table 1.
In this research, the influences of hydraulic accumulator control strategy on the energy conversion process were emphasized, and that of eccentricity was negligible. In the experiment process, the eccentricity was mechanically set at 250 mm.
3. Experimental Process and Result
3.1. Control Strategy of Hydraulic Accumulator
The physical model experiment of the hydraulic PTO system was carried out on land. The dry experiment has been widely used to analyze the dynamics of the proposed PTO as well as its feasibility and reliability. Due to the lack of wave excitation conditions, artificial excitation was used to make the eccentric rotor oscillate in the horizontal plane, as shown in
Figure 4.
The oscillating angle variation law of the eccentric rotor can be defined as
where the values of
π/2 rad and 2.25 s represent the oscillating angle amplitude and period, respectively,
tw is the oscillating time,
A(
tw) and
T(
tw) are the disturbances of oscillating angle amplitude and oscillating period, respectively. Both
A(
tw) and
T(
tw) are imprecise terms produced by artificial excitation, which can be used to simulate the motion of the pendulum with uncertain disturbance and analyze the energy conversion effect of the hydraulic PTO system.
During the experiments, when the electromagnetic switch valve 6 was always in the open state, the energy accumulation and release process of the hydraulic accumulator could not be actively controlled. The output power time history curve of the electric generator is shown in
Figure 5.
It can be seen from
Figure 5 that the output power of the electric generator is unstable. The maximum power is about 9 W, the minimum peak power is about 5 W, the minimum power is 0 W, and the change period is about 1.1 s.
The accumulator, which is employed as an energy storage device, has the capacity of stabilizing the flow and pressure of the hydraulic PTO system. The desired power-smoothing effect is subject to several constraints, such as volumes and pressures [
14,
18]. Aiming to improve the adaptive capacity of the device, an electromagnetic switch valve is employed to control the energy storage process of the accumulator. Three parameters, i.e., trigger pressure, delay time, and open state duration are particularly important to achieve the optimal power-smoothing and conversion. A reasonable control strategy of the hydraulic accumulator has been designed, as shown in
Figure 6.
When the pressure value monitored by pressure transmitter 17 (a) reaches the trigger pressure p, the controller generates a trigger signal to open the electromagnetic switch valve. After delay time t, the electromagnetic switch valve will be opened, and the accumulator begins to release the accumulated energy. Then, Step (2) is executed.
After the electromagnetic switch valve remains open for the time of open state duration dt, Step (3) will be executed.
To determine whether the pressure value is higher than p repeatedly. If the pressure value is still higher than p, repeat Step (2). Otherwise, Step (4) will be performed.
To close the electromagnetic switch valve, the accumulator will switch to the state of energy accumulation. Repeat Steps (1–3) successively after the pressure value reaches p.
Therefore, the trigger pressure p, the delay time t between the generation of the trigger signal and the release of the accumulated energy, and the open state duration dt of the electromagnetic switch valve keeping the open state are selected as the control variables. During the experiments, the trigger pressure p was set to 2.5 MPa, 3.0 MPa, 3.5 MPa, and 4.0 MPa, respectively, the delay time t was set to 0.5 s, 1.0 s, 1.5 s, and 2.0 s, respectively, and the open state duration dt was set to 3.0 s, 4.0 s, 5.0 s, and 6.0 s, respectively. Then, the influences of control variables on output power were analyzed.
The total amount value of output power produced by the electric generator over a certain period and the stability of output power are important indicators to evaluate the energy conversion performance of the hydraulic PTO system. Therefore, the average output power and power fluctuation index are used to measure the amount value and the stability of output power, respectively.
The average output power of the electric generator at
t duration can be defined as
The average value of the first-order differential cumulant of output power is adopted as the power fluctuation index, which can be defined as
where
pi,
pi−1 are the power at time
i and
i−1, respectively,
n is the number of time intervals,
is the average output power defined in Equation (2), and
pe is the power fluctuation index. The difference in output power reflects the continuous change in output power. It has the capacity of capturing periodic stability of output power approximating a square wave. Therefore, Equation (3) is used to reflect the characteristic of stability.
3.2. Influence of Trigger Pressure on Output Power
The delay time
t and the open state duration
dt are fixed at 1.0 s and 4.0 s, respectively. The trigger pressure is changed to analyze its influence on the output power of the electric generator. The time history curves of output power obtained from the experiment are shown in
Figure 7. The time history curves of pressure values recorded by transmitters 17 (a) and 17 (b) when the trigger pressure is 4 MPa are taken as an example, as shown in
Figure 8, which is related to
Figure 7d. It can be seen that the output power is obtained one second after the pressure value at transmitter 17 (a) reached the trigger pressure. Meanwhile, the pressure value at transmitter 17 (a) decreases lightly, and the pressure value at transmitter 17 (b) increases greatly. The energy output process lasts for four seconds. Then, the pressure value at transmitter 17 (b) decreases to zero suddenly, and the pressure value at transmitter 17 (a) increases lightly. Thus, the pressure changing curve illustrates the power changing curve clearly.
The average values of output power and power fluctuation index under different trigger pressure conditions are shown in
Figure 9.
It can be seen from
Figure 9 that the average power has a tendency of decreasing first and then increasing. The average power reaches a low point at a trigger pressure of 3.0 MPa. As the trigger pressure increases, the power fluctuation index gradually drops to its lowest point. When the trigger pressure is 4 MPa, the average output power reaches the maximum and the power fluctuation index is the minimum, indicating that the output energy of the hydraulic PTO system is large and that the power conversion process is stable under this condition.
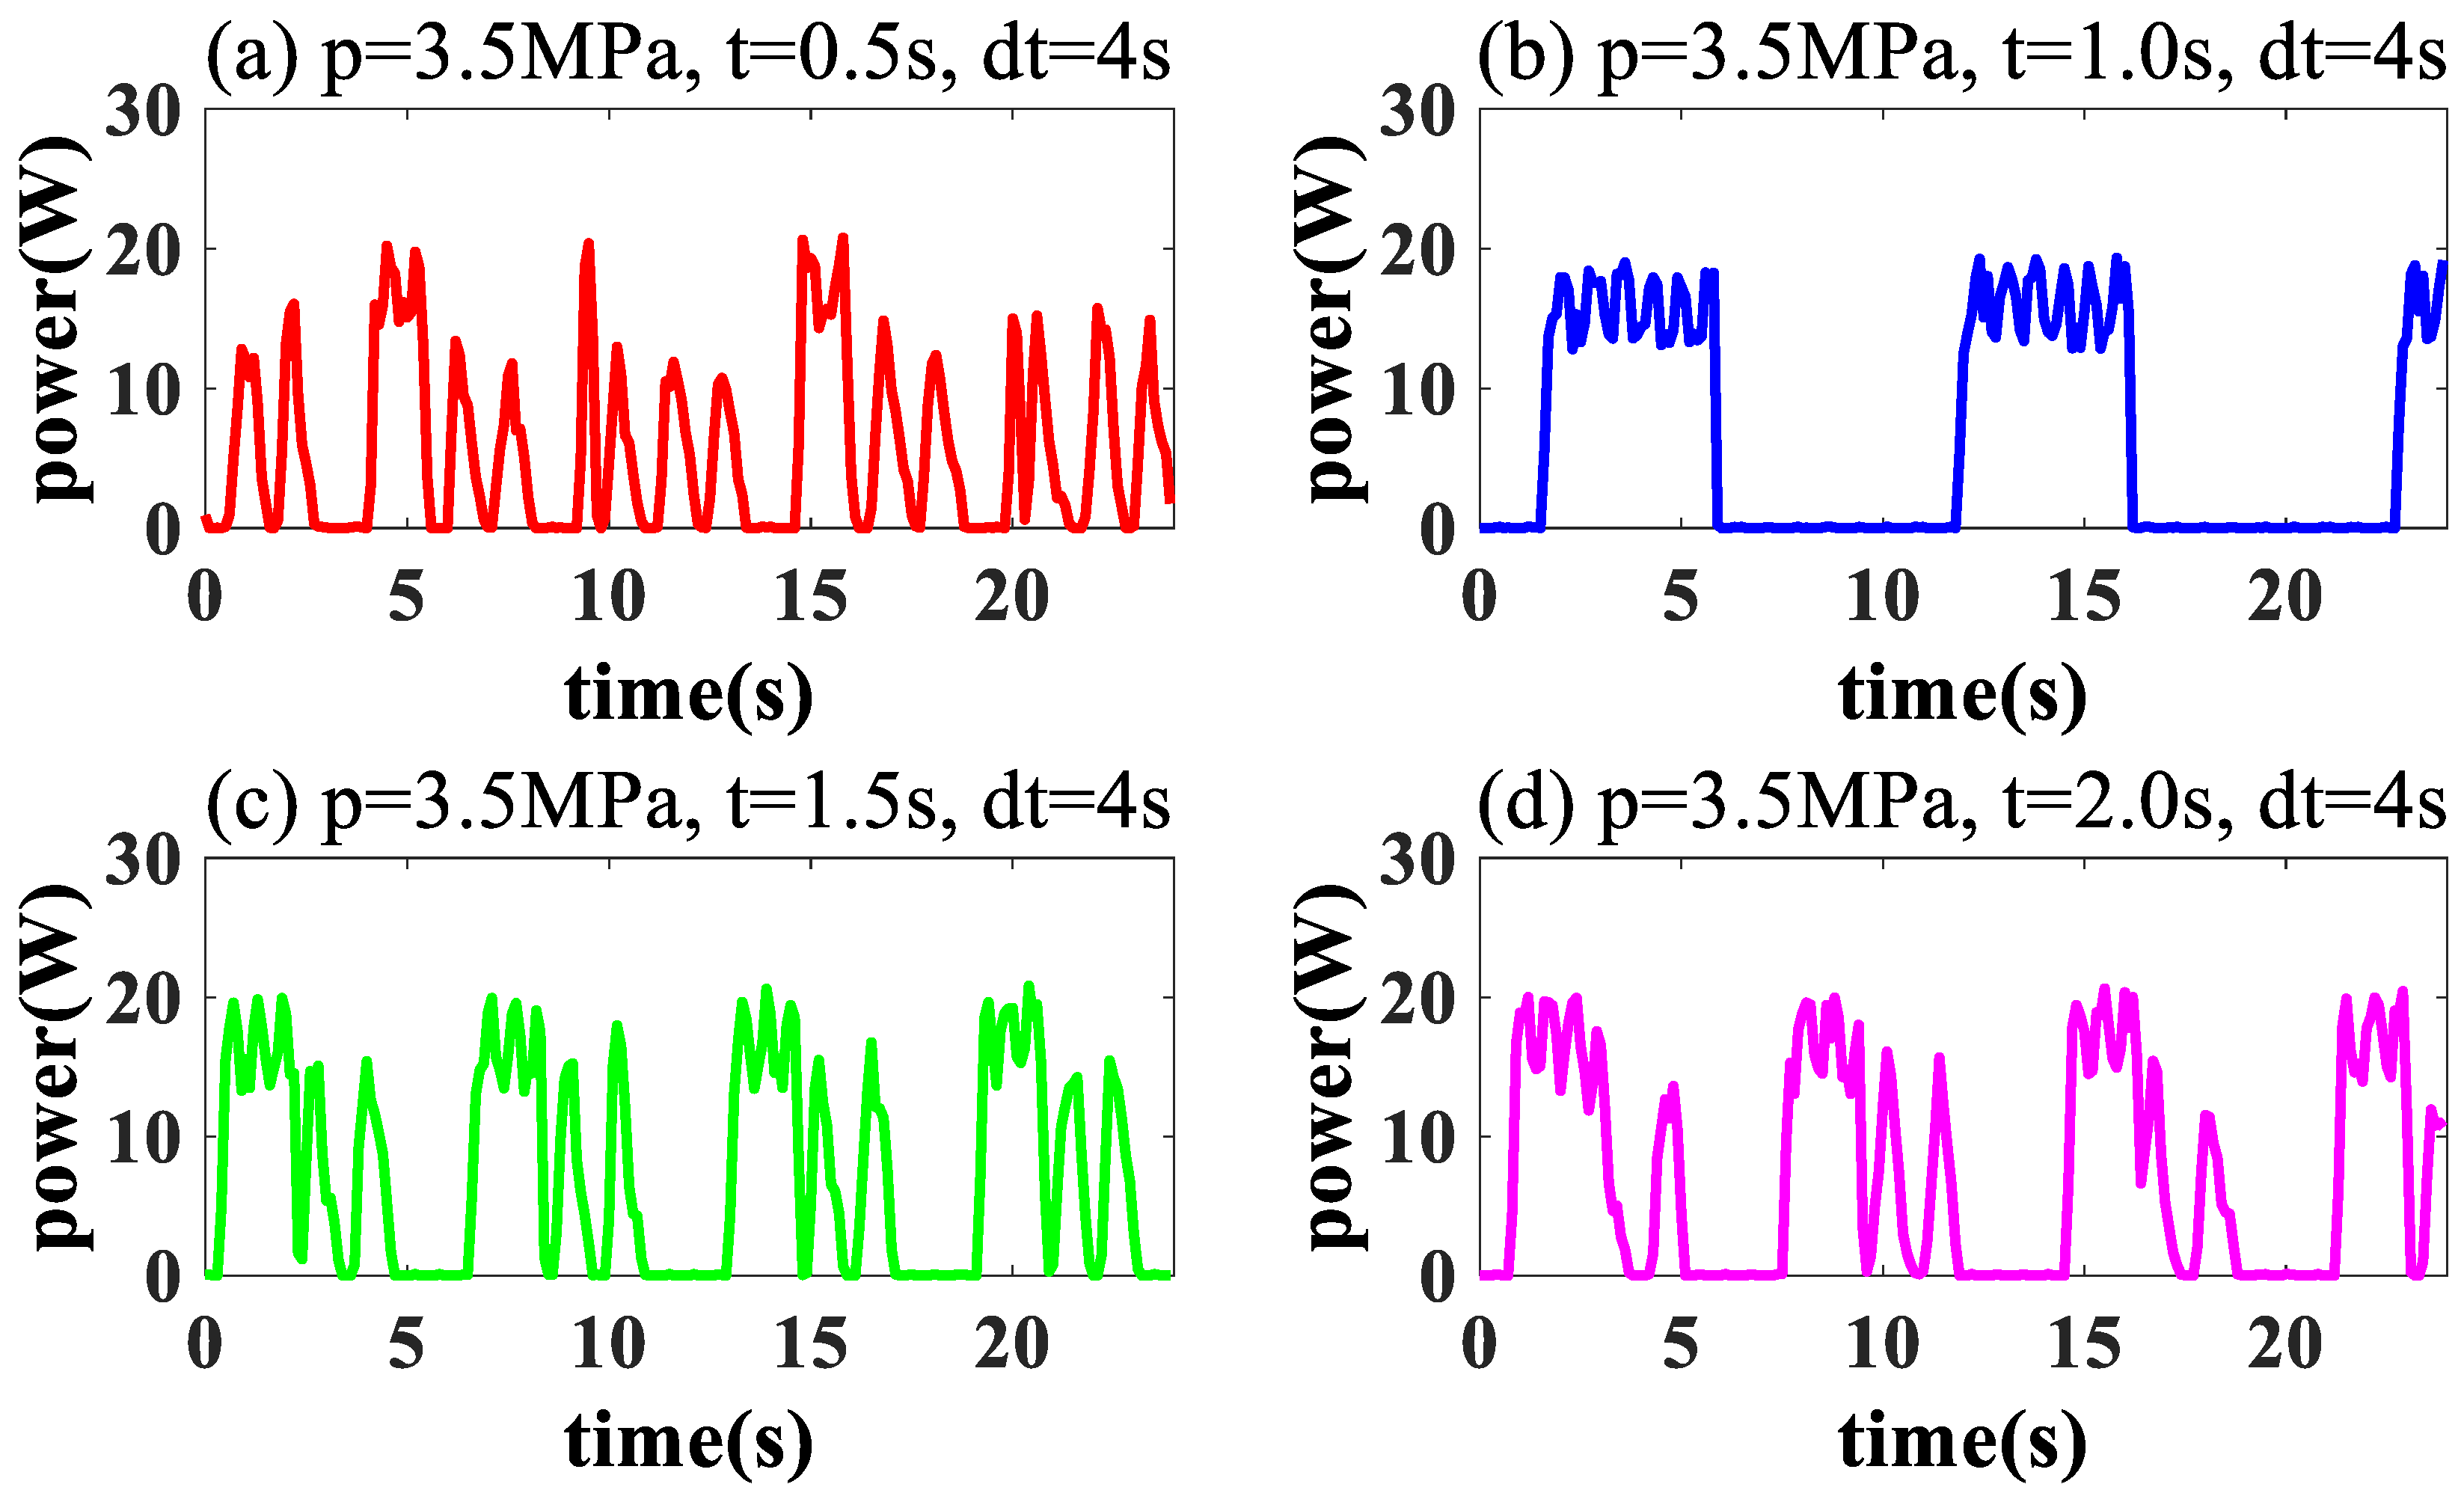
3.3. Influence of Delay Time on Output Power
The trigger pressure
p is kept at 3.5 MPa, and the open state duration
dt is kept at 4.0 s to analyze the influence of delay time
t on the output power. The time history curves of output power obtained from the experiments are shown in
Figure 10.
The average output power and power fluctuation index under different delay times are shown in
Figure 10.
It can be seen from
Figure 11 that the average output power has the smallest value when the delay time is 0.5 s; meanwhile, the power fluctuation index is at its maximum, which indicates that the hydraulic PTO system has bad output energy ability and poor power conversion stability. When the delay time reaches 1.0 s, the power fluctuation index is the minimum, but the average output power value is not large. The average output power reaches the maximum point at a delay time of 1.5 s, but the power fluctuation index has a larger value as well. When the delay time is 2.0 s, a relatively large average output power, and a small power fluctuation index can be obtained, indicating that the performance of the hydraulic PTO system is acceptable under this condition.
Furthermore, the open state duration
dt is maintained at 4.0 s, and the trigger pressure
p is increased to 4.0 MPa. The influence of delay time
t on the output power of the electric generator is analyzed. The time history curves of output power, the average output power, and the power fluctuation index under different delay time conditions are shown in
Figure 12 and
Figure 13.
It can be seen from
Figure 11 and
Figure 13 that the average output power increases and the power fluctuation index decreases visibly after increasing the trigger pressure. The power fluctuation index is at a lower level and does not change as the delay time increases. This phenomenon reveals that the power fluctuation index is not sensitive to delay time under the trigger pressure of 4.0 MPa.
3.4. Influence of Open State Duration on Output Power
The influence of open state duration
dt on the output power of the electric generator is analyzed at the trigger pressure
p of 3.5 MPa and the delay time
t of 1.0 s. The time history curves of output power obtained from the experiment are shown in
Figure 14.
The average output power of the electric generator and power fluctuation index under different open state durations is shown in
Figure 15.
It can be seen from
Figure 15 that the average output power remains roughly constant at around 7 W. However, the power fluctuation index changes significantly with the open state duration. This shows that the average value of output power under this condition is not sensitive to the open state duration, while the power fluctuation index is the opposite.
Moreover, the delay time
t is maintained at 1.0 s and the trigger pressure
p is increased to 4.0 MPa to analyze the influence of the open state duration
t on the output power. The time history curves of output power obtained from the experiment are shown in
Figure 16.
As shown in
Figure 17, when the open state duration is 4.0 s, the average output power falls to a low point, and it reaches the peak at the open state duration of 6.0 s. The power fluctuation index does not change with the increase in the open state duration, indicating that the power fluctuation index is not sensitive to the open state duration under this condition.
3.5. Analysis of Experimental Results
Based on the experimental results, it can be seen that the trigger pressure is the most significant factor affecting the output power amount and stability of the hydraulic PTO system. More energy will be accumulated if the trigger pressure has a larger value. Then, the role of the accumulator in reducing flow and pressure fluctuation will be amplified to make the output power more stable. However, the internal pressure of the accumulator also acts on the outlet of the hydraulic pump to cause resistance torque, which will affect the rotational motion of the eccentric rotor. When the internal pressure of the accumulator is too large, it may even make the eccentric rotor unable to oscillate. Therefore, a large trigger pressure does not mean good power performance. A reasonable range of trigger pressure should be determined to optimize the power conversion of hydraulic PTO.
Under different trigger pressures, the effects of delay time on average output power are similar, but the effects on the power fluctuation index are rather different. By setting the delay time, it is possible to reduce the spurious triggering phenomenon on the electromagnetic switch valve caused by the pressure fluctuation of the hydraulic PTO system. When the trigger pressure is small, the pressure fluctuation is more likely to cause the spurious triggering phenomenon and make the accumulator enter the energy-releasing state in advance. Therefore, a longer delay time should be set. However, a too-long delay time also has the possibility of making the high-pressure energy in the hydraulic PTO system unable to be released in time. The oscillation of the eccentric rotor will be affected due to the increase in the internal pressure of the hydraulic accumulator. Therefore, a reasonable delay time should be selected under the determined trigger pressure.
Similar to the influences of delay time, under different trigger pressure conditions, the influence of the open state duration of the electromagnetic switch valve on the average output power is small, but there is a significantly different effect on the power fluctuation index. By setting the open state duration, the amount of energy released from the accumulator can be controlled. If the open state lasts for a short time, the energy of the accumulator cannot be fully released, resulting in the low energy conversion efficiency of the hydraulic PTO. If the open state lasts for a long time, the accumulator cannot reach a high energy storage pressure under the open state of the electromagnetic switch valve after the energy of the accumulator is completely released. That will weaken the energy storage effect. Therefore, there is also an optimal range for the open-state duration of the electromagnetic switch valve.
Compared to the studies in [
23,
24], the results show that the proposed PTO system has the capacity of increasing the stability of output power in the power generation phase. In addition, it can be seen from the experimental results that the influences of the three factors of trigger pressure, delay time, and the open state duration have a coupled relationship with the output power performance. Therefore, it is necessary to use an intelligent optimization algorithm to obtain the optimal value range of three control parameters of the hydraulic accumulator.
5. Conclusions
In this paper, the novel energy conversion principle of a hydraulic PTO system with an accumulator of an ERWEC is presented. The experiments are conducted with the physical model of the hydraulic PTO system to study the effects of trigger pressure, delay time, and open state duration on average output power and power fluctuation index. Additionally, a numerical method for deriving optimal control parameters of the hydraulic accumulator to maximize output power and stability is put forward. The following significant and useful conclusions can be obtained from the presented results:
(1) The effects of trigger pressure, delay time, and open state duration on average output power and power fluctuation index of the hydraulic PTO system are strongly coupled. Among them, trigger pressure has the largest weight factor. Thus, in the process of setting control parameters, trigger pressure, namely the maximum working pressure of the hydraulic accumulator, should be determined first, and then delay time and open state duration could be set.
(2) The experimental examples are designed based on OLHS, and the nonparameterized agent model between control parameters of accumulator and output power indices is established based on GPR. The sensitivity analysis indicates that the coupled effect of delay time and open state duration on the power fluctuation index is greater than that on average output power. The delay time and open state duration should be considered at the same time to improve the stability of output power.
(3) NSGA-III is an effective method to obtain optimal control parameters of hydraulic accumulator with the objectives of average output power and power fluctuation index. The output power and stability are improved through the optimized control parameters.
The research results of this paper will provide bases for parameter settings and real-time control of hydraulic PTO system with accumulators. In the future, the completed physical model of ERWEC will be developed to verify the control parameters optimization effect of the accumulator in the real wave excitation conditions, the effects of accumulator volume and precharge on power conversion performance will be further analyzed, and the real-time control of the PTO system will be achieved as well.


