Article

Towards Digital Twinning of Fabrication Lines in Shipyards

Faculty of Mechanical Engineering and Naval Architecture, University of Zagreb, Ivana Lučića 5, 10000 Zagreb, Croatia
*
Author to whom correspondence should be addressed.
J. Mar. Sci. Eng. 2023, 11(5), 1053; https://doi.org/10.3390/jmse11051053
Submission received: 17 April 2023 / Revised: 2 May 2023 / Accepted: 11 May 2023 / Published: 15 May 2023
(This article belongs to the Section Ocean Engineering)

Abstract

:
The digital twinning concept stands as a remarkable opportunity to integrate sophisticated mathematical models within the context of existing manufacturing systems. Such models may provide shipyard management with predictive analytics, improving the final results at the strategic, tactical, and operational levels. Therefore, the possibility of integrating the Markovian-framework-based finite-state method into the context of ship production is presented in this study, including its outline, digital thread, and factory-floor data reliance. First, the predictive analytics problem is addressed by the finite-state method in the case of the shipyard’s fabrication line, and the obtained results are validated afterward using a numerical model through discrete-event theory. The predictive analytics indicate an almost ideal balancing of the fabrication line, except for the buffers storing stiffeners before the coat-dying and marking operations. In addition, the improvability analysis of the shipyard’s fabrication lines extended the scope of the predictive analytics using bottleneck identification and affecting the key performance indicators through a digital thread, as well as by improved maintenance strategies.

1. Introduction

Modern society is all about digitalization, and new advancements are introduced at an almost daily level. Similarly, the advent of Industry 4.0 and the digitalization of manufacturing processes have stood, for more than a decade, as key enablers underpinning emerging concepts such as factories of the future, the Internet of Things, digital twinning, augmented and virtual reality, and others [1]. However, not all manufacturing processes are prone to these new trends, particularly those of a more intricate nature, such as the ship production process. Nevertheless, although challenging, the digitalization of complex manufacturing processes stands as an opportunity to involve digital twinning, unlocking the potential of predictive analytics, and enabling the knowledge-driven management of production systems at the operational, tactical, and strategic levels [2]. Presently, the digital twinning of the ship production process is seldom addressed in the research literature and, when it is, it remains at the level of simulations, often yielding immeasurable results. Therefore, the main goal of the present paper is to develop and present the digital twinning of fabrication lines in shipyards based on Markovian modeling and the powerful finite-state method [3]. This approach can be employed as an efficient way to perform predictive analytics and, consequently, enhance the decision-making processes at different stages of ship production planning and implementation.
According to the definition provided by the National Aeronautics and Space Administration (NASA), a digital twin is an integrated multiphysics, multiscale, and probabilistic simulation of an as-built system that employs the available data to mirror the operation of its ‘living’ twin [1]. This still-emerging technology stands as a promising way to bring forth the factories of the future. For example, digital twins of manufacturing processes can be used at the strategic (long-term) level (that is, before actual implementation) to identify the technology requirements, arrangements of production lines, storage capacities, or workloads in terms of the key performance indicators. Moreover, decisionmakers, practitioners, engineers, and managers can benefit from digital twinning, as it has the potential to tackle issues at the tactical and operational levels (medium and short terms) regarding job scheduling, the suitability of the workplace, maintenance planning, information flows, and others. However, much work is still ahead in terms of reliable data transfer from and to physical systems, as well as in terms of algorithms twinning the realistic (probabilistic) behavior of the systems and providing predictive analytics [2]. This is particularly valid in the case of the ship production process.
The ship production process is distinctive in its complexity and the significant time required to reach the final product: a ship or offshore structure, typically of a large scale and with uniquely tailored properties. Despite this, it can be decomposed into subprocesses, such as fabrication and assembly lines yielding standard structural elements, or subassemblies that are incorporated into the hull later on at the construction site. Each production line is composed of working stations, such as plate straightening, surface conditioning, surface protection, oxy-fuel and plasma cutting, forming machines, and welding, which are typically connected by heavy-duty conveyors, transporters, or cranes of suitable capacities. However, the layout of working stations, transport systems, and production lines, in general, largely depends on the specifics of each shipyard, its production capacity, as well as the market niche to which it is directed. Consequently, huge differences may be present when comparing production lines in different shipyards.
This kind of process is traditionally considered extremely complex, as it involves huge investments running thousands of activities constrained by similar amounts of conditions and relationships, making it impossible for people to set up reliable schedules that would prevent delays and, consequently, unwanted financial losses. Therefore, an obvious requirement for a more sophisticated approach through mathematical modeling is present [4]. Usually, such approaches rely on discrete-event-driven simulations in variations ranging from hierarchical to detailed modeling that are used to control labor resources, scheduling, and production costs [5,6]. However, this kind of numerical approach suffers from rather demanding modeling that has to be performed by an expert using specialized software. Due to its complexity, it is not suitable for short-term modifications or improvability, or for lean design considerations [7]. Consequently, this kind of approach is presently not robust to constant changes in the factory-floor environment typical for the ship production process and is thus not suitable for digital twinning, particularly as it lacks critical aspects of predictive analytics.
Given this, a novel approach to the digital twinning of the ship production process is presented in this paper. The mathematical modeling relies on the application of the Markovian framework and the finite-state method that mimic the realistic behavior of stochastic systems and can be used to construct simple and user-friendly digital twins. The reliability of the mathematical approach has already been proven in cases of serial production lines, splitting lines, and assembly systems, including both theoretical and industrial cases, such as wood processing [3], automotive component fabrication [7], and power transformer manufacturing [8]. In each case, the Markovian framework was applied to evaluate the associated key performance indicators attributed to the steady-state response of systems, and the obtained results were compared with the ones acquired on the factory floor. In such a context, this paper represents an important step forward in relating the realistic ship production environment to its digital replicant by employing the efficient algorithms of the finite-state method and yielding predictive analytics that are critical for decision making in both the short and long terms.
Therefore, the remainder of the paper is structured as follows: A brief literature review is presented in the next subsection. Efficient algorithms of the finite-state method are outlined in the second section, including propositions for the digital twinning of production processes. The presented theory is then applied in the third section by considering a fabrication line in a shipyard, including working stations for plate straightening, surface treatment, metal cutting, and metal forming. The obtained results are compared and validated against the corresponding data obtained using a numerical (simulation) model of the same line. The main conclusions and prospects for further research are outlined in the fourth section.

Brief Literature Review

The concepts of digital twinning have been present in the international scientific literature for approximately two decades. Thus, this is a rather novel research area, merging sophisticated nonlinear multiscale and multiphysics models into a single system and twinning its realistic response conditioned to environmental conditions. The first reference to digital twinning dates back to 2002 in the works of Michel Grieves on the idea that a digital informational construct of a physical system could be created as an entity on its own. This concept was first introduced in the case of product lifecycle management [9,10], and it was extended later on to include lean concepts, the product producer, and customer demands within the entire product lifecycle, including the designing, building, sustaining, and disposing of the product [11]. The framework of digital twinning was adopted upon this by NASA, and it was discussed in more detail in the case of an aircraft structural life prediction [12]. Moreover, digital twinning quickly found its application in the domain of structural integrity, where as-built specimens were twinned to solve the crack-path ambiguity problem rather than referring to statistical sets of possible outcomes [13]. Following this, digital twinning has been discussed in the context of autonomous systems orchestrating the execution of physical actions without human interaction and conditioned to access realistic models of the current state of the process, including its interaction with the real-world environment. This sharp increase in the complexity of ensuring the proper system behavior during the course of production can be successfully achieved only by the extensive use of model-based simulation [14]. These concepts were extended later on to simulations merging physical and virtual worlds in all lifecycle phases in the case of mechatronic systems [15], marine fouling monitoring [16], wind turbines [17], underwater vehicles [18], ship operation in waves [19], and others. Except for simulation, the importance of the digital thread, as a tissue connecting digital twins and physical objects, is stressed in the context of Industry 4.0 [20], while a distinction between digital models, digital shadows, and digital twins is pointed out in [21]. Thus, efficient digital threading is mandatory to transform the information provided by digital twins into meaningful and useful knowledge interchanged between digital and physical objects.
Digital twinning, although a highly promising technology, still requires further research and development, particularly regarding two aspects of the manufacturing industry: its integration within a broader context of cyber-physical production concepts and efficient simulation tools yielding reliable predictive analytics. Cyber-physical concepts of production systems stand for a broad set of technologies enhancing profit gains through the design of manufacturing networks, adaption to local market requirements, low-cost and high-customer-value solutions, and frugal product customization [22]. This, in turn, can be accomplished by applying product and production lifecycle simulation tools, supply chain simulations, and the framework of the Fourth Industrial Revolution, including augmented and virtual reality, as well as the Internet of Things and cloud computing [23]. Thus, some of the most recent applications of digital twinning integration within the manufacturing industry include the following: digital twinning supporting the lightweight design of assemblies in composite materials concerning deviations and process signatures [24]; the knowledge-driven and intelligent planning of aviation parts manufacturing, including the optimization of the process parameters [25]; the full lifecycle representation of complex systems using cognitive technologies [26]; agile decision making in the case of in-house logistics [27]; and zero-defect manufacturing concepts [28,29]. In addition, the possibility to enhance the workers’ manufacturing activities through the framework of Industry 4.0 is discussed in [30,31], focusing on the new ‘Operator 4.0’ concept.
All of these cyber-physical systems rely on supporting algorithms of different complexities and reliabilities that provide predictive analytics in the process background. Thus, such algorithms represent the ‘consciousness’ of production systems, by which their actual behavior is mapped into digital space. Efficient algorithms are therefore a prerequisite to the existence of digital twins. Otherwise, one is dealing with a mere database that fails to meet the digital twin concept to a large extent. As a consequence, the cyber-physical system at hand will not benefit from a predictive analysis at all. Unfortunately, this fact, according to the best of the authors’ knowledge, is pointed out rather seldomly in the existing scientific literature. Therefore, there is a clear need for a closer relationship between cyber-physical concepts and the methods of production system engineering. Some of them include random processes, semi-random processes, queuing network models, stochastic networks, Petri nets, process algebra, diodic algebraic models, and others [32]. Of these, Markov chains stand out as a common approach to the performance evaluation of production systems.
Indeed, much work has been conducted in the field of production system engineering during the last three decades to bring Markov chains into play, especially regarding the modeling of complex and large-scale systems, such as serial lines, splitting lines, assembly systems, job shops, flexible manufacturing cells, re-entrant lines, and others, including quality checks, reworking stations, customer demands, lean design, improvability, bottleneck identification, and different machine reliability formulations [33]. Typically, these problems are tackled using semi-analytical approaches based on the Markovian framework, such as the decomposition technique [34], aggregation procedure [35], or finite-state method [36], as the analytical solution has proven to be highly sensitive to the scale of the state space [37]. Regardless of the method, the underlying goal of such mathematical models is the evaluation of the overall equipment efficiency [38,39] and key performance indicators, such as the production rate, throughput, work-in-process, probability of starvation, probability of blockage, and residence time [33].
The mathematical modeling and performance evaluation of the ship production process has a relatively short record as compared to the other fields of the manufacturing industry, and it is referred to in the existing literature to a considerably smaller extent. The majority of the research is focused on the application of simulation tools evaluating different aspects of the ship production process and aimed toward more reliable production scheduling and cost control [4]. Nevertheless, the tendency toward the adoption of the Industry 4.0 concepts and their integration within the ship production process can be noticed, particularly in the recent literature sources. Examples of the discrete-event simulation of material fabrication are presented in [5,6] at the strategic level. Similarly, discrete-event simulation was applied later on in the cases of the block erection process [40], ship hull job assignment [41], a robotized profile-cutting workshop [42], panel block production [43], and the panel assembling process [44]. The challenges and opportunities related to the transition from the conventional shipbuilding concepts to Shipbuilding 4.0 are discussed in [45], emphasizing the need for a reduction in production costs while increasing production efficiency. One possibility to improve industrial processes in the case of a shipyard is presented in [46], introducing augmented reality as one of the key Industry 4.0 paradigms to the ship production process. Similar technology has been presented in [47], considering the possibility of measuring the schedule performance using the Internet of Things and marker-based image processing. Moreover, the importance of data-mining and analysis techniques to create effective cost and performance estimates is pointed out in [48], while a methodology to integrate discrete-event simulations into production planning is presented in [49]. Furthermore, the approximative, aggregation-based algorithm was employed in [50] in the case of the bottleneck identification and improvability analysis of the fabrication lines in a shipyard, while a digital twinning concept and its application in the case of naval ship repair management were considered in [51], emphasizing the importance of resource management, project priorities, performance, and productivity affected by possibly counterintuitive factors. The same concept has been applied in the context of a shipyard’s pipe machining production line [52]. Finally, an Industry 4.0 concept of a shipyard and the associated digital twin/thread framework are presented in [53], aiming toward more reliable data management, information traceability, and operation efficiency.
Given such a determinant of the ship production research, as well as the broader context of the Industry 4.0 concepts, the main contribution of this research paper is the development of a digital twinning framework based on efficient mathematical methods mimicking the real-life behavior of manufacturing systems subjected to factory-floor conditions. This kind of approach is applied in the case of a fabrication line typical for the ship production process. It is expected that this research will encourage the formulation of more realistic digital twins yielding reliable predictive analytics, not only in the case of shipyards, but also in the case of the broad spectrum of manufacturing industries.

2. Mathematical Modeling

As already pointed out, the efficient mathematical modeling of manufacturing systems is a mandatory prerequisite for transforming a traditional model into a digital twin that yields reliable predictive analytics and agile feedback conditioned to the real-time and factory-floor data feed, as well as to the overall effects of the production system, usually expressed in terms of financial benefits. Generally, mathematical modeling relies on queuing theory or random processes, where the former is typically employed in cases of numerical models, while the latter is used to formulate analytical models of different complexities. Here, a brief outline of the random-process-based finite-state method is presented, as it is employed later to construct a digital twin of fabrication lines. Further details regarding the development and verification of the finite-state method in different cases are available in the existing literature (e.g., [3]).

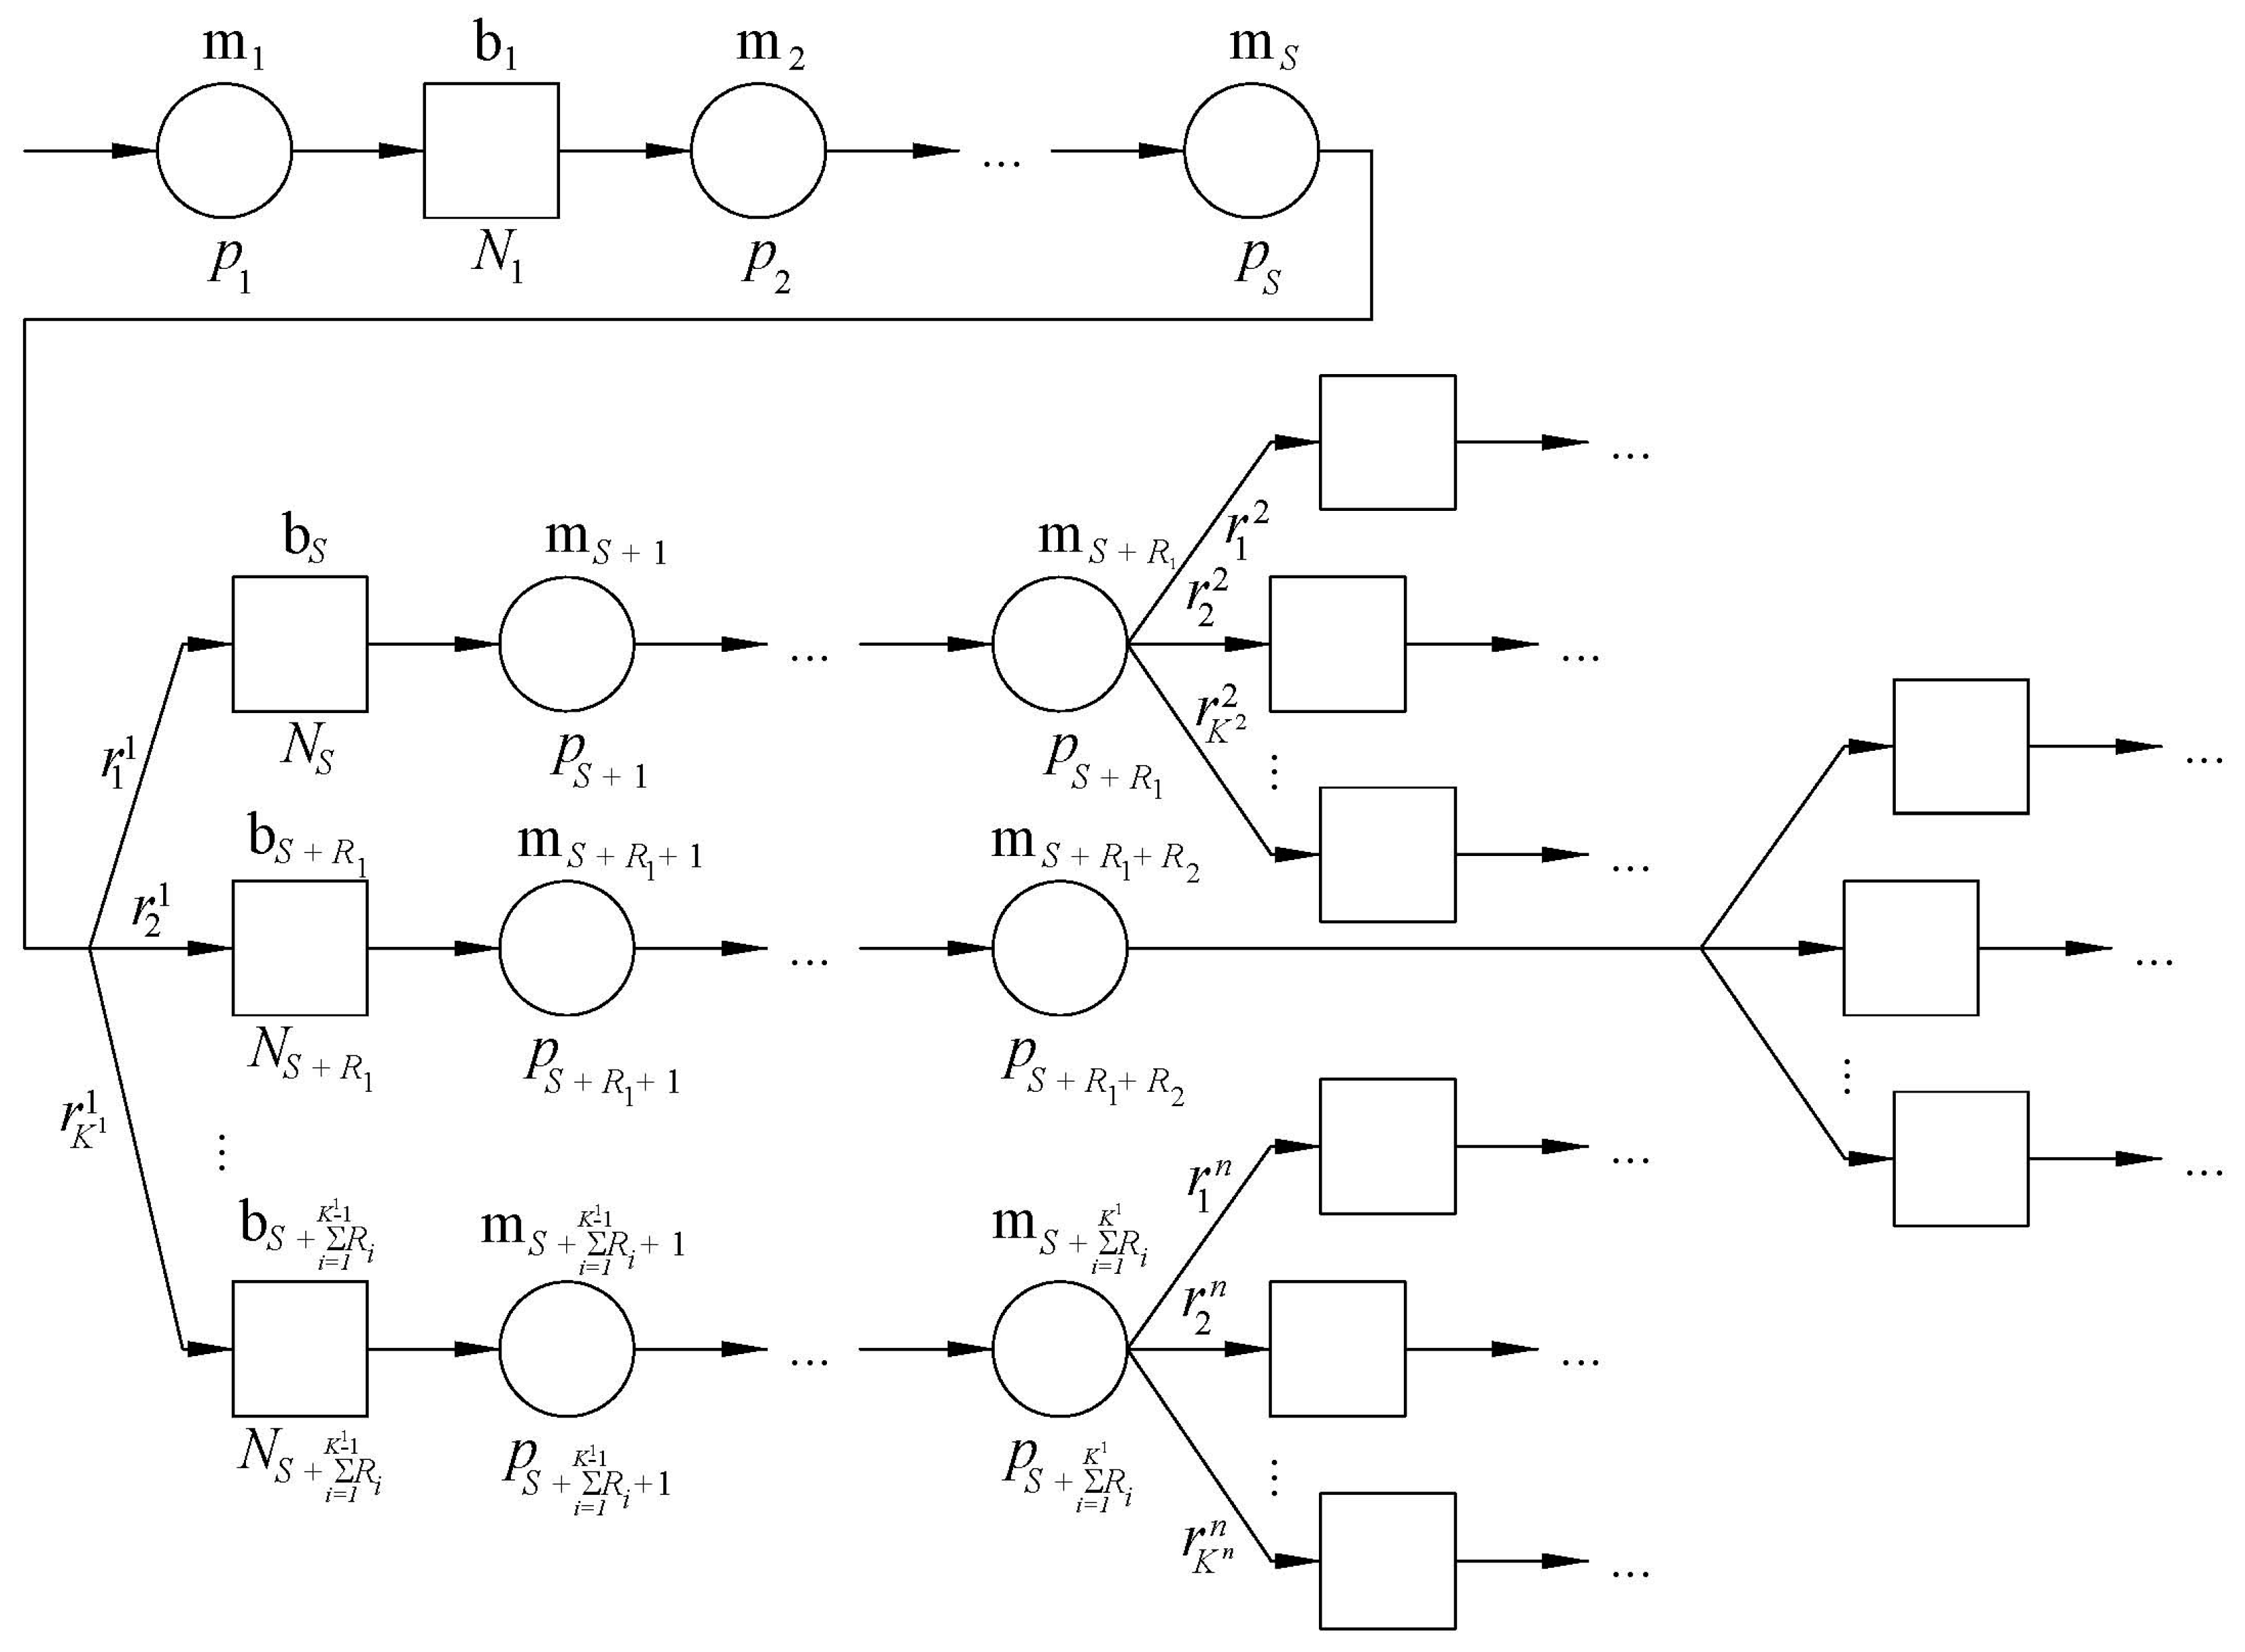
2.1. The Finite-State Method

The stochastic modeling of manufacturing systems, depending on their propositions, is based on the application of discrete-time Markov chains or continuous-time Markov processes describing their steady-state or transient behavior within the associated state spaces defined by the capacities of buffers [33]. However, the associated closed-form analytical modeling quickly becomes rather cumbersome and unsolvable in terms of the present computing power and memory storage, particularly if we are concerned with the transition-rich and dense Markov chains of a large scale that potentially include myriads of mutually communicating states. Hence, a simpler way to evaluate the key performance indicators using approximative procedures is necessary. One possibility is to employ the finite-state method as an analytically based procedure that, as compared to other approaches, conserves the functional relationships between the properties of the production system and the associated key performance indicators, extending, in such a way, the scope of predictive analytics.
A typical shipyard’s fabrication line can be characterized as a splitting production system composed of one primary flow and split flows generated out of the preceding ones at the rate r i n ,   i = 1 , 2 , ... , K n , where Kn is the total number of split flows of the nth order and i = 1 K n r i n = 1 (Figure 1). The primary flow is composed of S machines and S−1 buffers, where S stands for a machine that performs the flow splitting, while the total numbers of machines and buffers in a line equal M and M−1, respectively. Each machine (mi, I = 1, 2, …, M) is of the Bernoulli reliability ( p i B e r n o u l l i p i ), and it is thus in the state {up} with the probability pi and in the state {down} with the probability 1−pi. Each buffer (bi, i = 1, 2, …, M−1) is of the capacity Ni, where NiN. The system at hand obeys the mass conservation law; thus, material can enter it only at the first machine, while it exits the system only at the last machine of a particular branch. In addition, the usual assumptions on the infinite capacities of supply and delivery storage, as well as the homogeneity of the machine cycles, hold.
The structure of the finite-state elements obeys the structure of the system concerning the weakest machines of the primary flow and secondary flows of the nth order. Thus, to formulate the finite-state elements, it is necessary to identify the weakest machine (mm) of the primary flow and the weakest machine m i n m associated with the ith secondary flow of the nth order. Hence, its reliability ( p i n m ) equals
p i n m = min p m n 1 , p ζ ,   n > 1 ,
where i = 1, 2, …, Kn and p m 0 = min p 1 , p 2 , ... , p S , while pζ stands for a set of machines that form the ith secondary flow of the nth order. Once the weakest machines have been identified, M−1 finite-state elements can be established. An example of the finite-state element arrangement along the hypothetical splitting line concerning the weakest machines is presented in Figure 2, where their general classification into upstream and downstream elements can be noted.
The associated steady-state probability distribution of the eth element ( P e ), where e = 1, 2, …, M−1, is the number of the element, can be determined using the analytical solution of the simplest problem of a line composed of two machines and one buffer [33], as follows:
P e = P 0 1 α 1 p R α 2 1 p R ... α N e 1 p R ,
where
P 0 = 1 p L 1 α 1 p L p R α N e ,   α = p L 1 p R p R 1 p L ,
and Ne is the total capacity of buffer be, while pL and pR stand for the reliabilities of the left-hand-side and right-hand-side machines of the two-machine–one-buffer problem. Thus, in the case of upstream elements, pL always equals pe, while pR amounts to p i n m . Conversely, in the case of downstream elements, pL equals p i n m , and pR amounts to pe. Once the distributions P e are known, the system-level steady-state probability distribution ( P ) can be determined by assuming the independence of events at each buffer. Therefore, the probability that the production system at hand is in the state h, h = 1, 2, …, D, where D = i = 1 M 1 N i + 1 , equals
P h = P h 1 h 2 ... h M 1 = e = 1 M 1 P h i e ,
where hi, i = 1, 2, …, M−1, is the state of the buffer bi. Equation (4) is also known as the system-level steady-state probability distribution.

2.2. Key Performance Indicators

The key performance indicators (KPIs), such as the production rate, work-in-process, and probabilities of blockage and starvation, can be evaluated upon the formulation of the system-level steady-state probability distribution (Equation (4)). Because a detailed formulation of the key performance indicators is available in the literature [3,7,33,37], only their final form will be outlined here for clarity reasons. Thus, the production rate (PRξ), as an expected number of finished products per cycle time, equals
P R ξ = p ξ 1 h 1 = 0 N 1 h 2 = 0 N 2 ... h ξ 2 = 0 N ξ 2 h ξ = 0 N ξ ... h M 1 = 0 N M 1 P h 1 h 2 ... h ξ 2 0 h ξ ... h M 1 ,
where x is a set of machines delivering final products. Similarly, the work-in-process (WIPi) can be determined as follows:
W I P i = h 1 = 0 N 1 h 2 = 0 N 2 ... h M 1 = 0 N M 1 h i P h 1 h 2 ... h M 1 ,
while at the level of the production system, it equals
W I P = i = 0 M 1 W I P i .
The probability of the blockage (BLi) of machines other than those performing the splitting of the material flows is equal to
B L i = p i 1 p i + 1 + B L i + 1 h 1 = 0 N 1 h 2 = 0 N 2 ... h i 1 = 0 N i 1 h i + 1 = 0 N i + 1 ... h M 1 = 0 N M 1 P h 1 h 2 ... h i = N i ... h M 1 ,   i < M ,
where by definition, BLM = 0. However, the probability of blockage is more complex in the case of splitting machines, as it is influenced by events originating from different secondary flows. Thus, BLψ, where ψ = {S, S + R1, S + R1 + R2, …}, equals
B L ψ = i = 1 K n p ψ r i n 1 p χ i + 1 + B L χ i + 1 A ,
where
A = h 1 = 0 N 1 h 2 = 0 N 2 h χ i 1 = 0 N χ i 1 h χ i + 1 = 0 N χ i + 1 h M 1 N M 1 P h 1 h 2 ... h χ i 1 N χ i h χ i + 1 ... h M 1 ,
and χi, i = 1, 2, …, Kn, is a set of buffers corresponding to the ith secondary flow and placed immediately after the splitting point (χ) in the system. Finally, the probability of starvation (STi) of the ith machine in the system (except the first one that is, by definition, never starved) takes a simpler form:
S T i = p i h 1 = 0 N 1 h 2 = 0 N 2 ... h i 1 = 0 N i 1 h i + 1 = 0 N i + 1 ... h M 1 = 0 N M 1 P h 1 h 2 ... h i = 0 ... h M 1 ,   1 < i M .

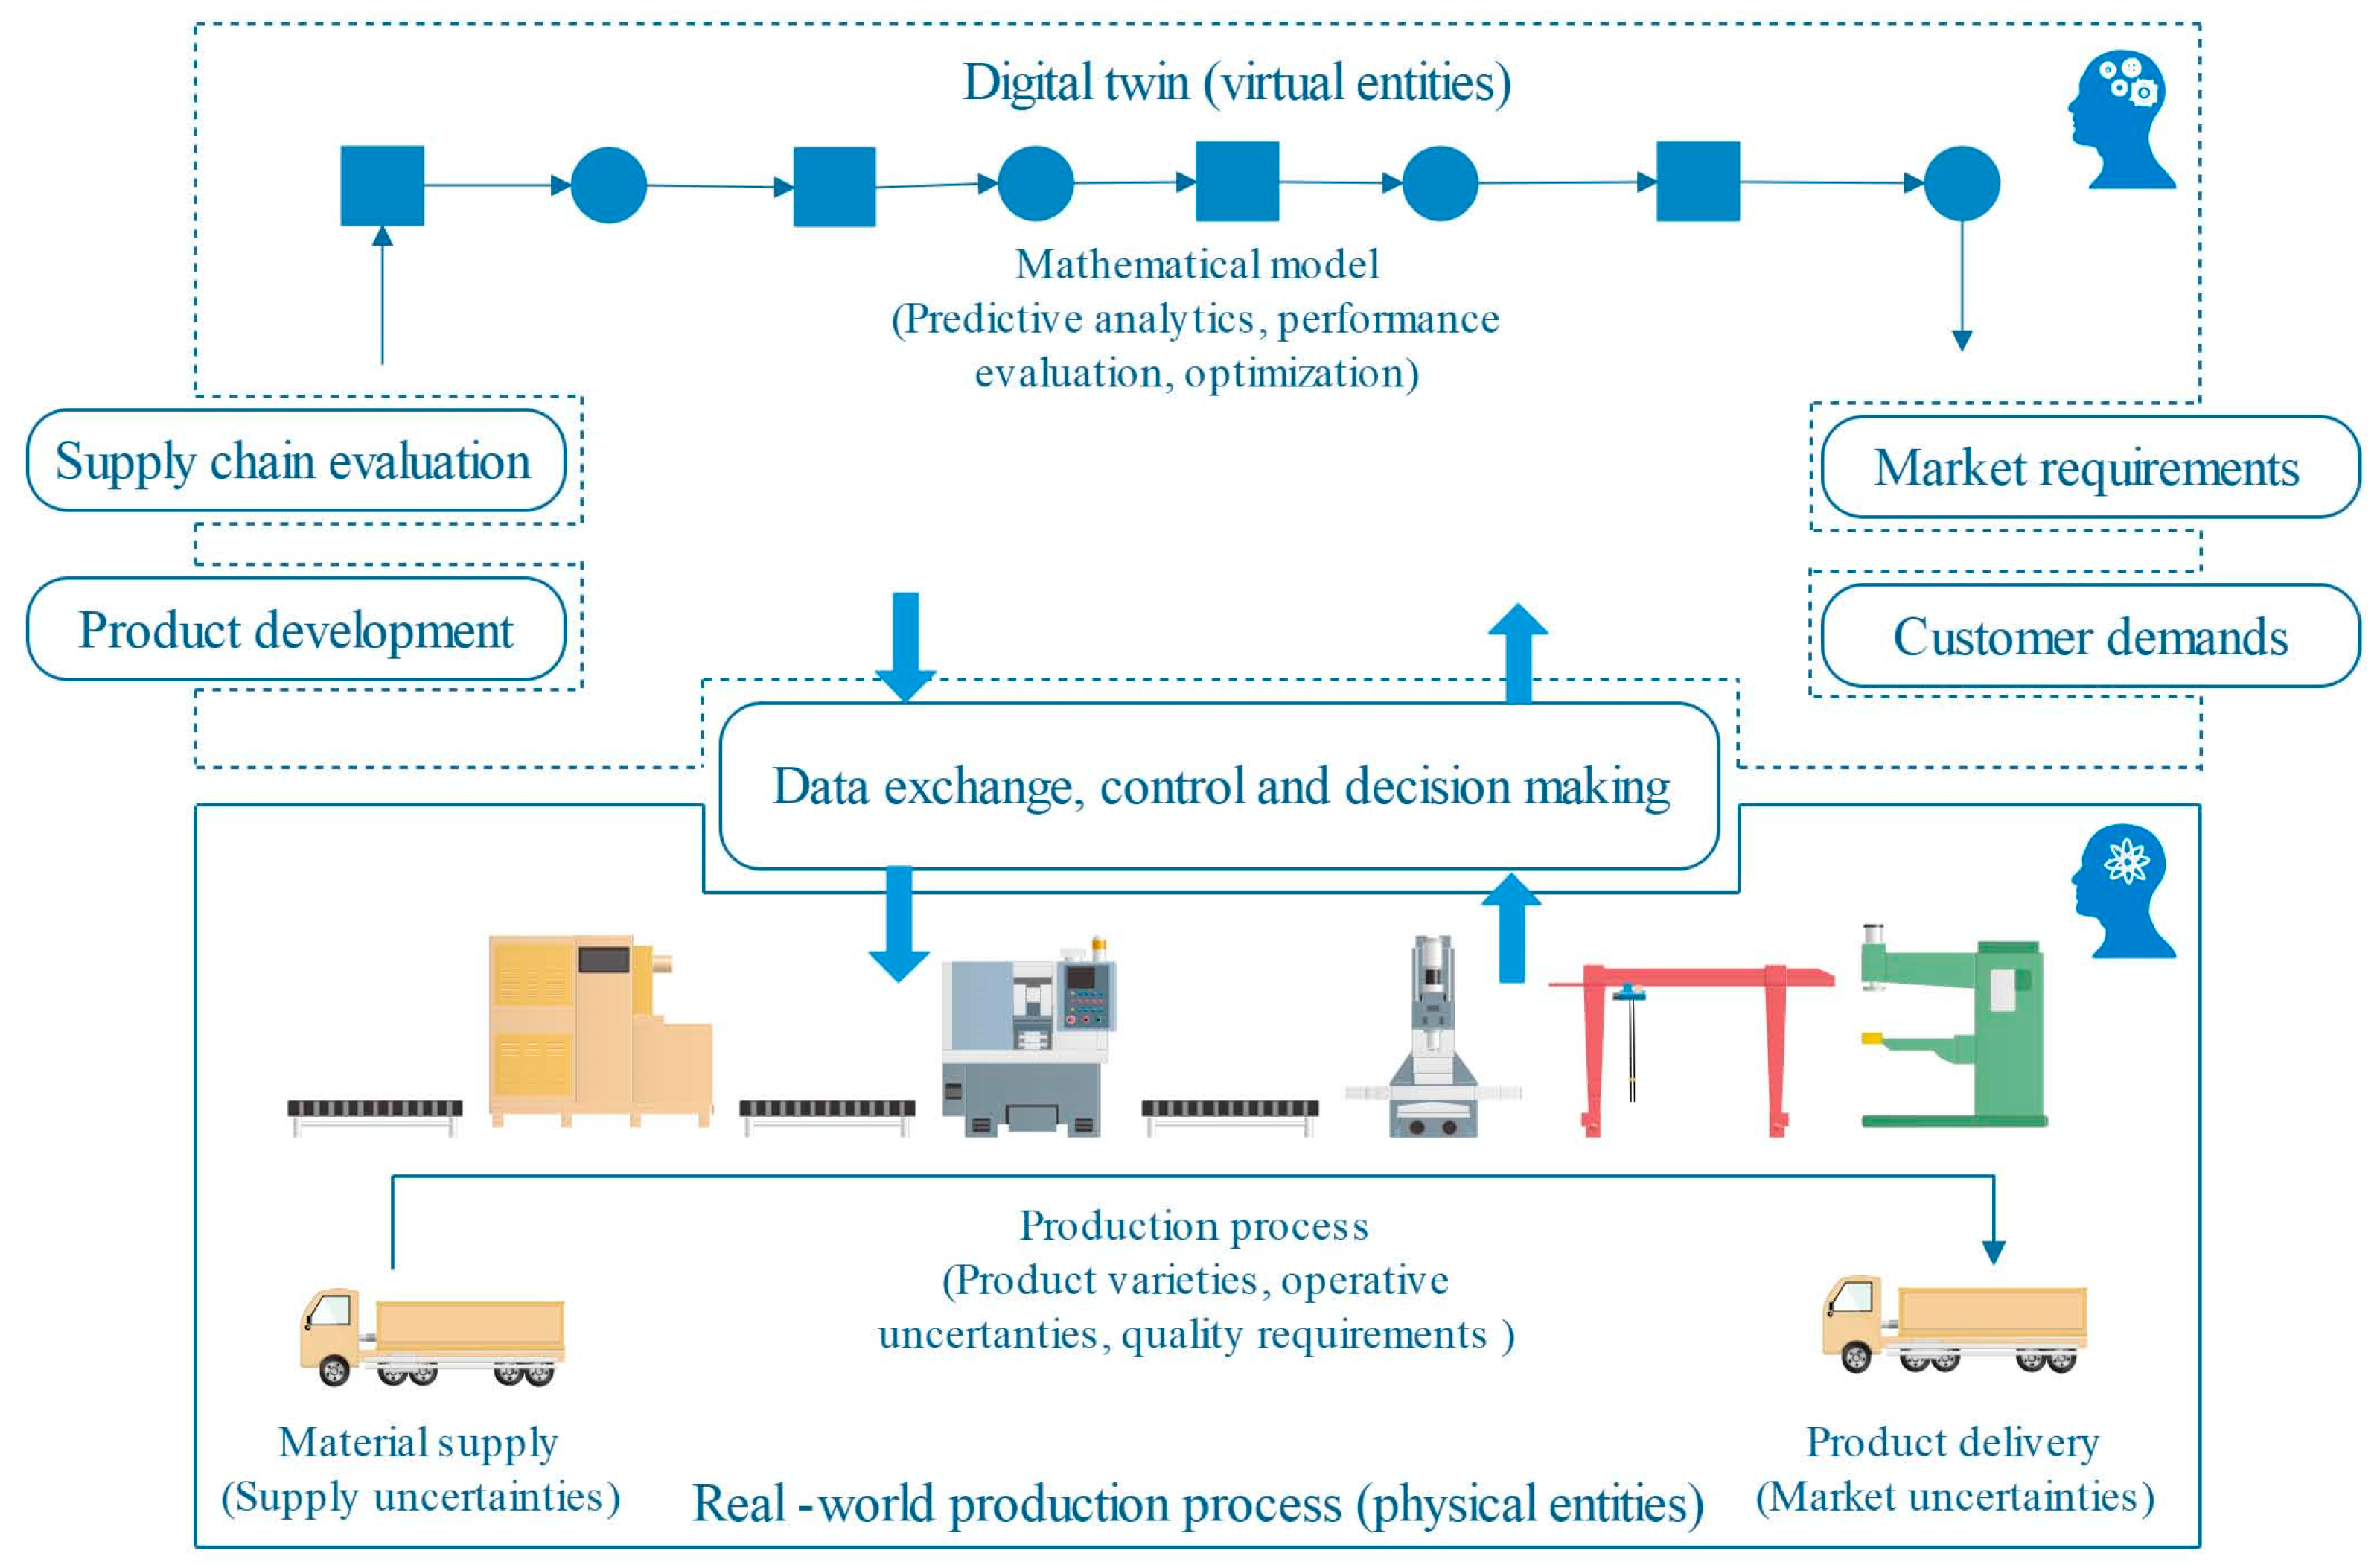
2.3. Digital Threading

Once the digital twin of a production process is established, a digital thread has to be provided to enable the efficient exchange of data between the real and virtual assets (Figure 3). Thus, the digital thread stands for a framework enabling the controlled interplay of the factory floor and simulation data, with the ability to access, integrate, transform, and analyze data descending from various sources. Governing data sources include the production process, product properties, material supply network, market propositions, and customer requirements. The data flow between the physical and virtual entities of the production process thus includes the reliability of each machine, the capacities of the associated buffers, the specific cycle time, the time elapsed from the last maintenance, machine failure and buffer occupancy logs, energy requirements, the consumption of consumable materials, production scheduling, and the KPI analytics used for the short-term process adjustments, as well as for the medium-term and strategic decision making.
Similarly, product development, as well as market and consumer monitoring, represent elements of the digital thread that provide data on the product properties, compliance with standards, material supply uncertainties, product delivery requirements, market demands, and consumer satisfaction levels. These kinds of data are strongly affected by the constraints originating from the production process. Thus, as in the case of the physical–virtual relationship between entities, two-way data exchange through a digital thread is mandatory to ensure the targeted profitability level of the company [21]. A digital thread between the physical and virtual entities of the production process will be considered here within the Markovian framework, with the main goal of establishing an efficient tool for KPI analytics dedicated to company management. Further extensions of the model to include material supply and market uncertainties will not be considered here due to the assumptions of the mathematical model (infinite capacity of supply and delivery storage) presented in Section 2. Thus, such extensions of the digital twin require modifications to the mathematical model, which must be considered in a separate paper.

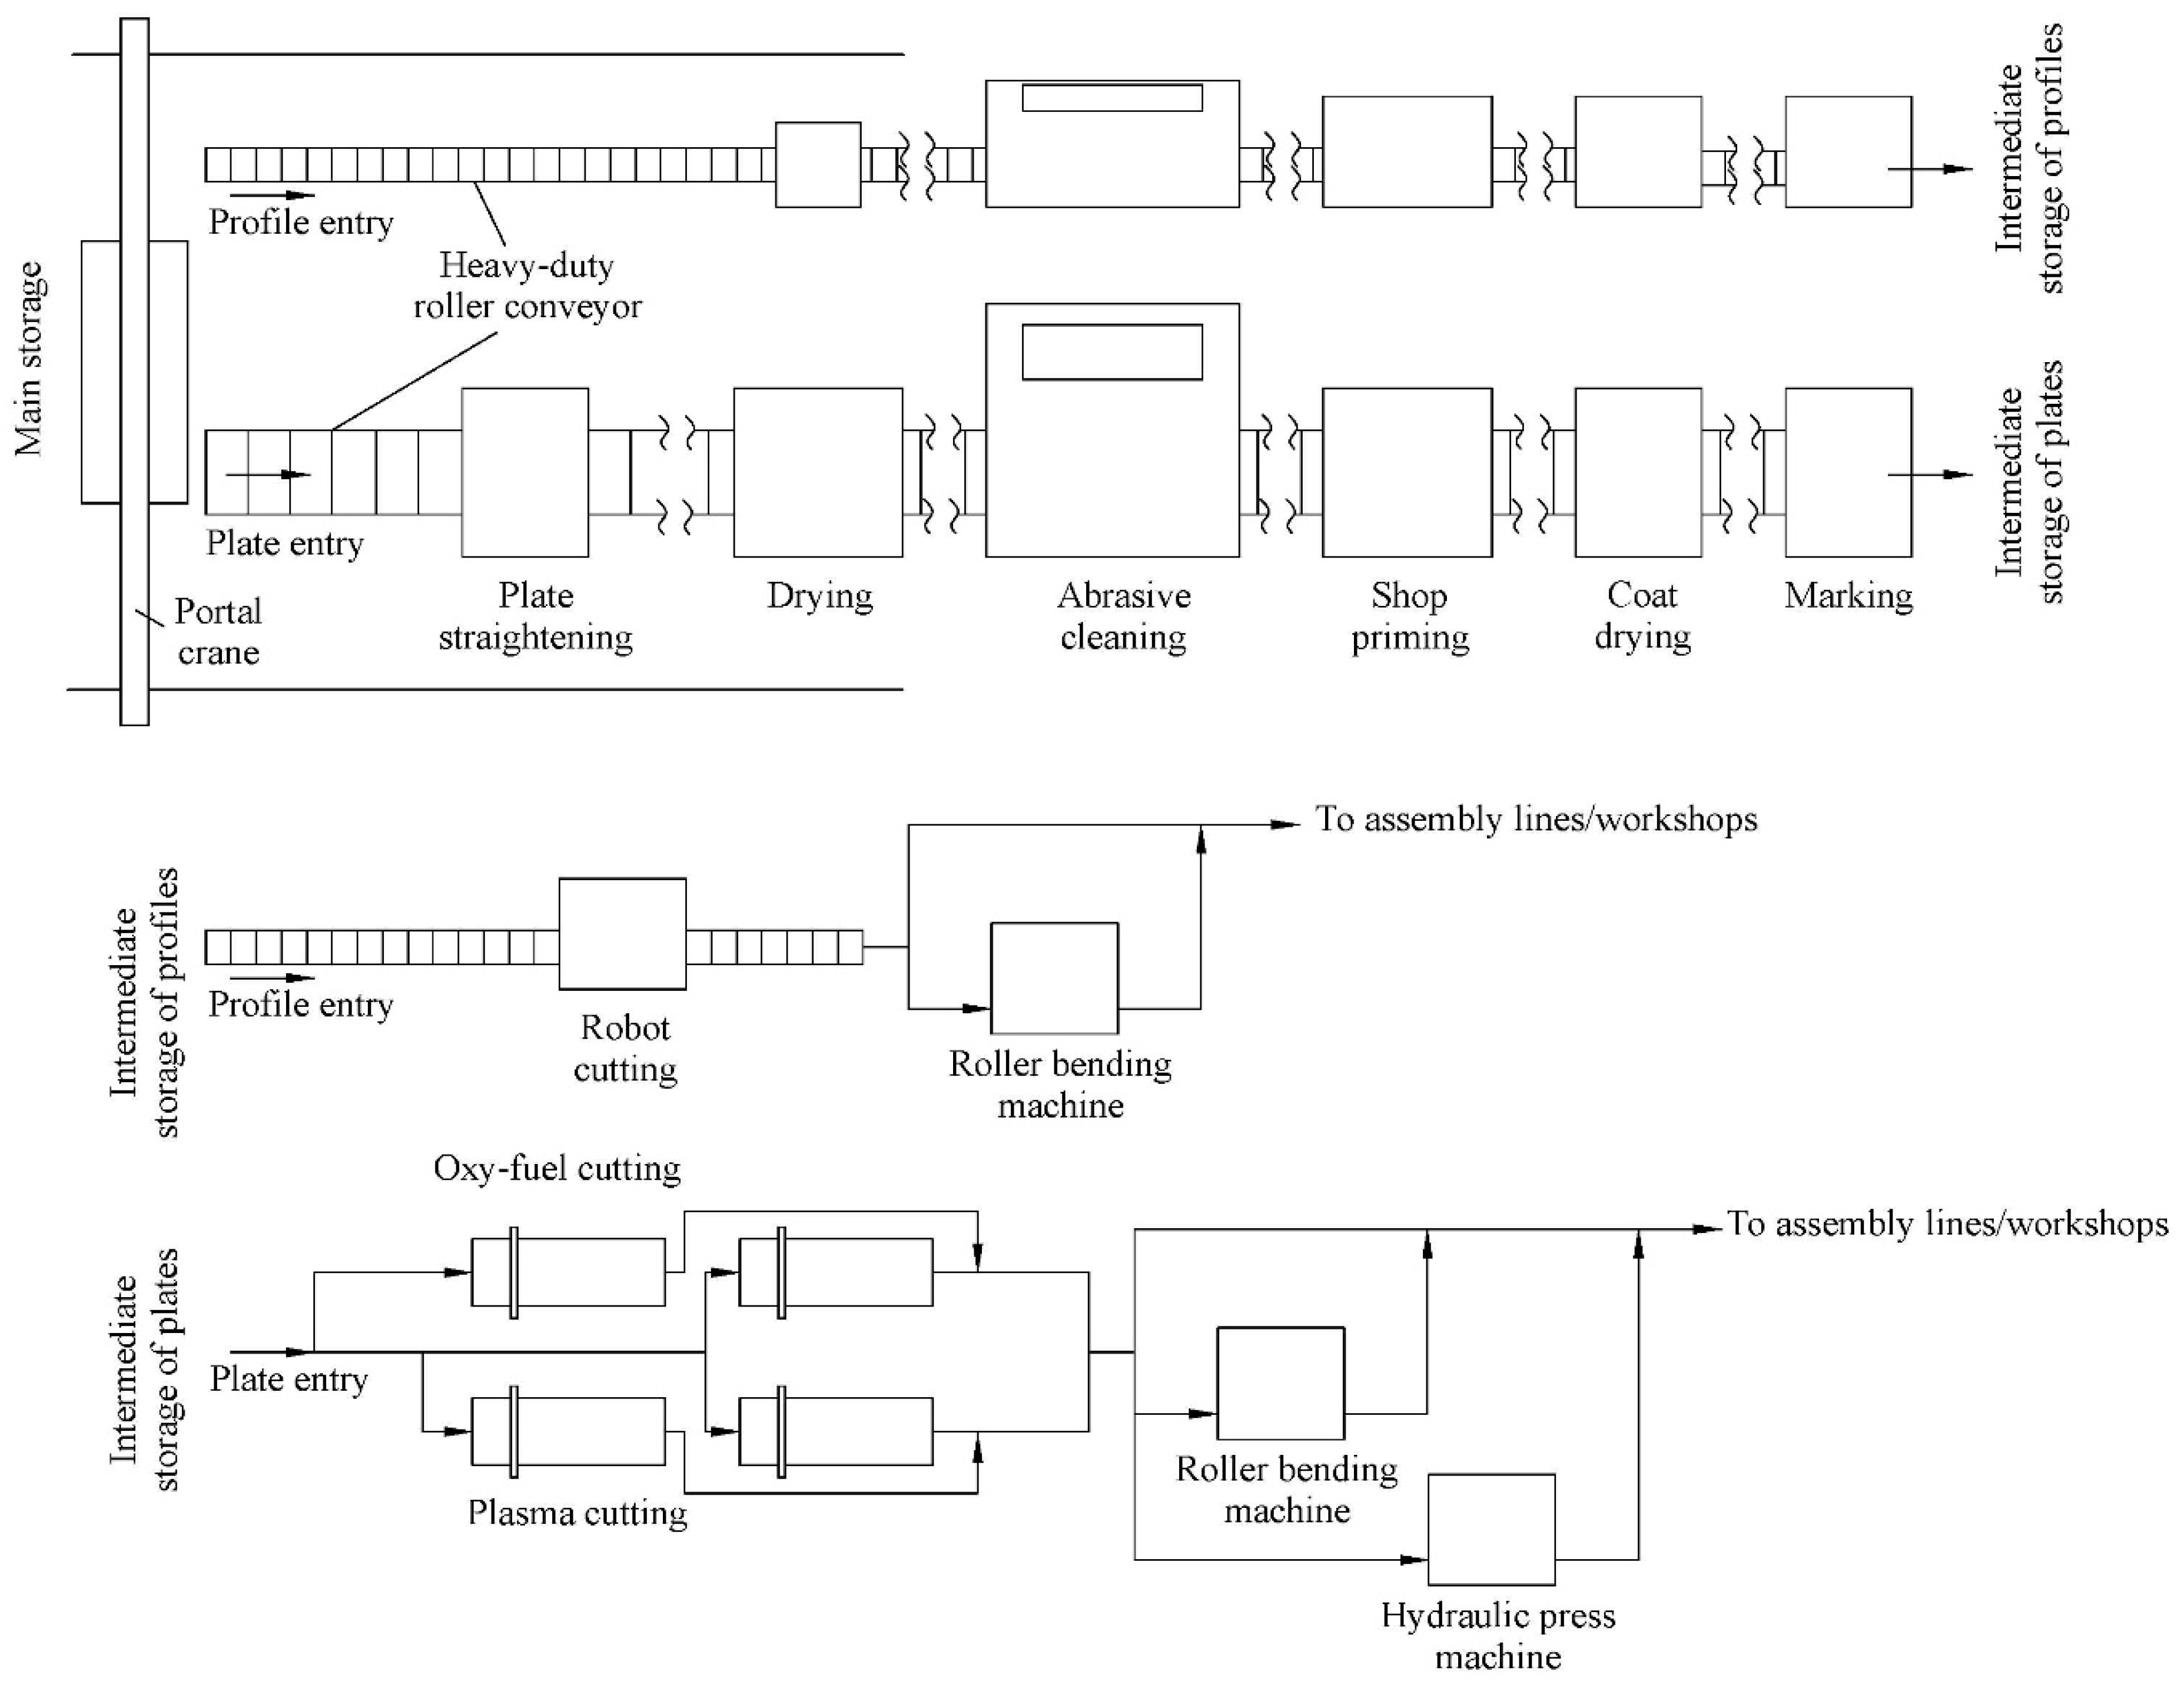
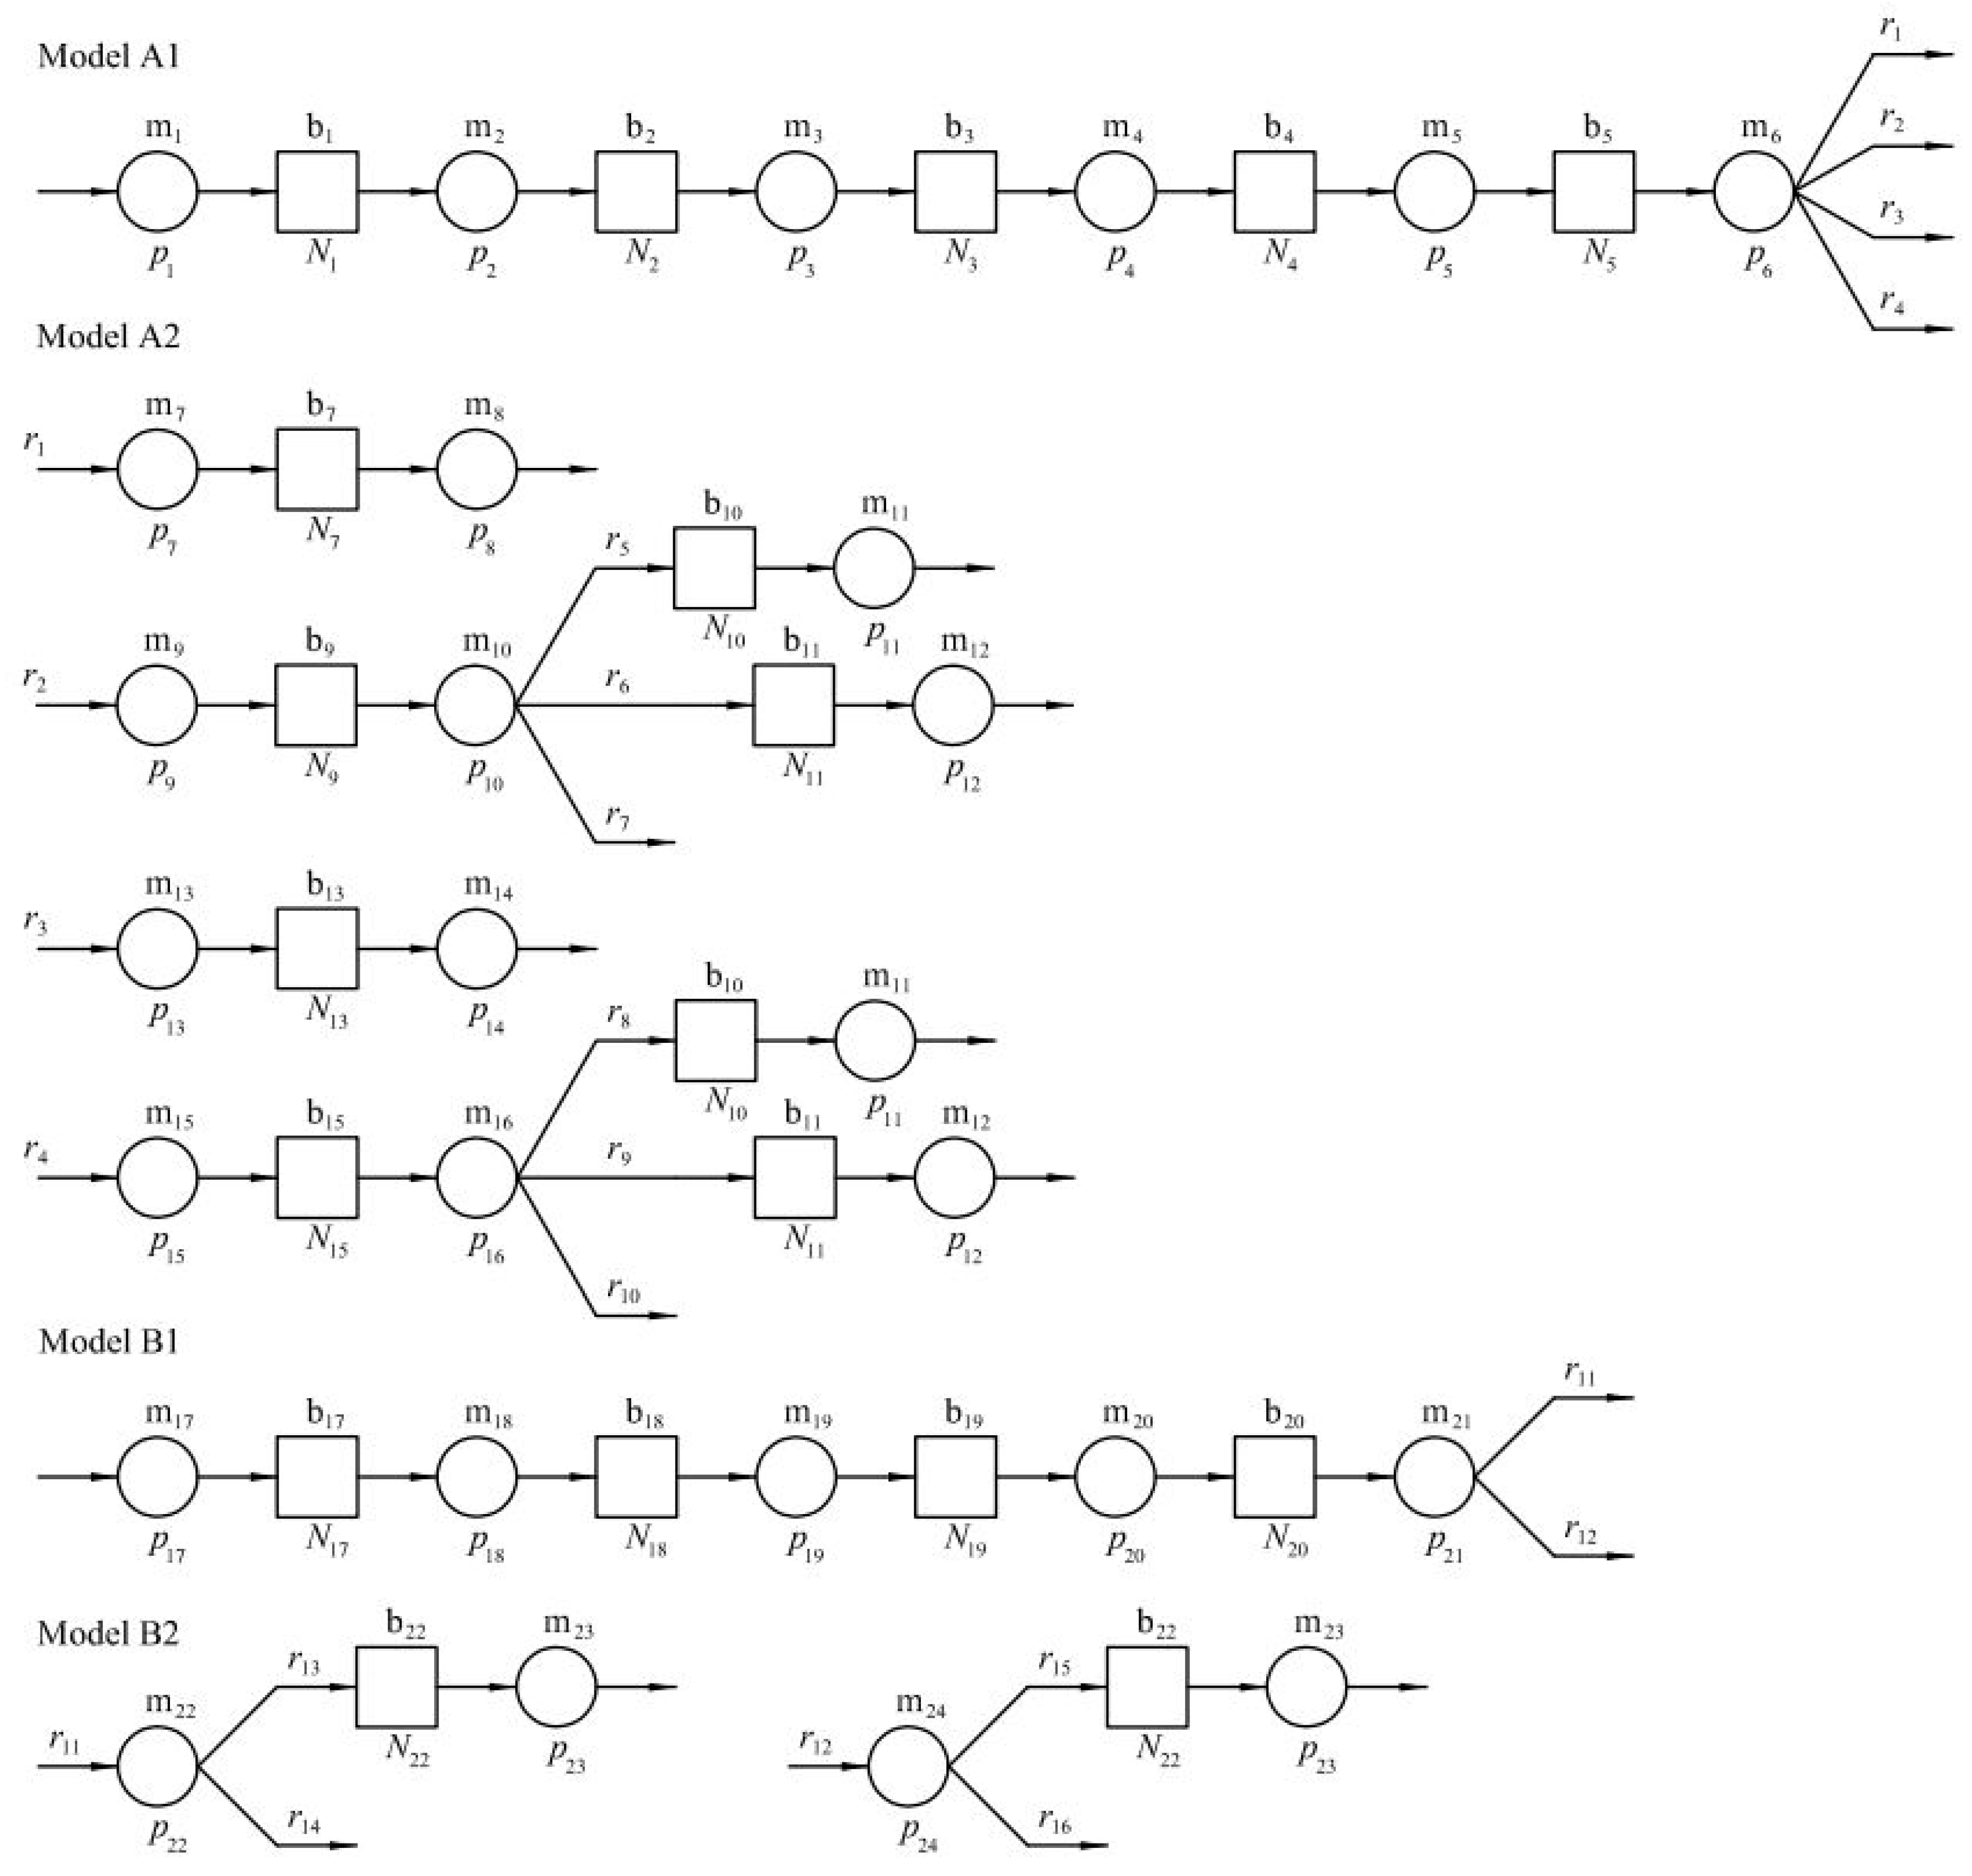
3. Application of the Developed Theory

A typical shipyard’s fabrication line is composed of working stations, where different kinds of metal processing are performed depending on the material properties. Thus, separate fabrication lines are provided for steel sheets and profiles (Figure 4). The processing of steel sheets commences with plate straightening and is followed by surface conditioning through drying and abrasive cleaning, shop priming, coat drying, and marking. During this phase of fabrication, steel sheets are delivered to each working station using a heavy-duty roller conveyor and are stored at intermediate storage for further processing and the fabrication of the ship structural elements on plasma-cutting or oxy-fuel machines, and subsequently on a roller-bending machine or hydraulic press, if applicable. Once fabricated, the structural elements are transferred by cranes to corresponding lines or workshops where appropriate ship structure units (e.g., stiffened panel, section, block, module) are assembled. Similarly, the processing of profiles is performed through the same operations at specialized machines and working stations, as profiles have considerably different geometrical properties compared to steel sheets (Figure 4).
The developed model was applied in the case of the digital twinning of fabrication lines in a shipyard. First, a concept of digital twinning in the case of a typical shipyard’s fabrication line is presented, along with data accessed through the digital thread. Then, the same system is developed in the context of numerical modeling using Enterprise Dynamics 10.3 [54] to enable further comparison and the validation of the proposed approach. Finally, the considered KPIs are presented, along with a discussion on the possibility of enhancement through the digital twinning framework.
To evaluate the KPIs of the presented fabrication lines (Equations (5)–(11)), mathematical models, or digital twins, of production systems have to be established based on the theory outlined in Section 2.1. In each case, a mathematical model can be additionally simplified by attributing an infinite capacity to the intermediate storages of plates and profiles. This assumption complies with the factory-floor conditions, as the capacities of these buffers are considerably larger compared to other buffers, leading to no-blockage and no-starvation conditions of the marking (machines m6 and m21) and cutting (machines m7, m9, m13, m15, m22, and m24) operations, respectively. Thus, in total, four separate models can be formulated, two of them corresponding to plate fabrication (models A1 and A2), and two in the case of profile processing (models B1 and B2) (Figure 5). A detailed list of the operations attributed to each machine is presented in Table 1, along with the pertaining reliability data. Moreover, a breakdown of the buffering capacities is listed in Table 2. The machine reliability data were determined on the shipyard’s floor using a digital thread in such a way that each working station was related to a dedicated database storing operative logs and indicating the time that each machine spent in the states {up} and {down}. Recall that the state {down} stands for the portion of time spent in breakdown, repair, or maintenance. Thus, the probability that the machine (mi) is in the state {up} (pi) equals T up / T Total , where T{up} is the time spent in the state {up}, and TTotal is the time elapsed since the beginning of data collection.
In addition, it is quite important to determine the rates (ri) attributed to each split flow based on the final product that will be assembled out of the fabricated structural elements. Thus, the rates (ri) are highly sensitive to the final properties of the product, including its scale, shape, material, geometrical properties, and assembly sequence. In the case considered in this study, two typical cruise ship sections were evaluated: the ship fore and midship sections (Figure 6). Therefore, the rates (ri) were determined according to data and technical documentation provided by the shipyard (Table 3). It can be seen that in the present case, the shipyard is employing only the plasma cutting of plates and the manual cutting of stiffeners, as r3, r4, r8, r9, r10, r12, r15, and r16 take zero values.
The same production lines were modeled using Enterprise Dynamics 10.3 software [54] (Figure 7). The complete system consisted of standard atoms (source, server, queue, and sink atoms) representing particular operations of the machines. The probability of a machine being in the states {up} and {down} was established using the feature mean time to failure (MTTF) and mean time to repair (MTTR). Because a Bernoulli reliability assumption was employed by the FSM, the MTTF equals pT, where T is the cycle time taking the unit value. Similarly, the MTTR amounts to (1 − p)T. Queue atoms are used to model buffers, including the feature capacity equal to the pertaining capacity. Finally, the throughput of the production system is determined using the sink atoms employed to count the number of products passing each production station. The simulation running time was set to 36,000 s, including the initial warm-up period and transient effects, which diminished quite soon upon initialization, as the cycle time equals the unit value.

Results and Discussion

The input data (Table 1, Table 2 and Table 3) were employed within the mathematical model (MM) outlined in Equations (5)–(11) to determine the KPIs of the production processes, and the results are compared with the KPIs obtained using the numerical model (NM) in Table 4 and Table 5 and Figure 8. Generally, a good agreement between the results can be noted, especially in the cases of the production rate and probabilities of blockage and starvation, while the work-in-process demonstrates some discrepancies. This fact occurs as a consequence of the round-off procedure of the simulation program when determining the number of pieces contained in each buffer. Consequently, it can be concluded that the good agreement with the numerical model affirms the finite-state method as a reliable yet simple, intuitive, and efficient modeling approach.
It can be seen that both the steel and stiffener fabrication processes (models A1 and B1) yield significant production rates (PR6 and PR21) of 0.78 plates and 0.8 stiffeners per cycle, with rather low levels of blockage and starvation probabilities, except in the case of the drying and abrasive cleaning of plates, where some blockage may be expected. Moreover, the capacity of the buffers in the case of model A1 is quite balanced, as the values of the work-in-process occupy almost all of the available storage space. However, this is not true in the case of buffers b19 and b20 (model B1), which are of significantly larger capacity compared to the expected number of stiffeners lined for the coat-drying and marking operations. This fact indicates that model B1 has a capacity for improvements toward leaner solutions. Conversely, models A2 and B2 remain quite sensitive to the splitting rates, yielding lower production rates, taking values of 0.64 (PR8, plasma cutting), 0.04 (PR11 and PR12, plate-forming operations), 0.54 (PR10r3, plasma cutting), 0.15 (PR22r14, stiffener forming), and 0.62 (PR23, stiffener cutting). In addition, they demonstrate more pronounced starvation probabilities, especially in the case of the plate- and stiffener-forming operations, reaching 0.81 and 0.78, respectively. However, this can be expected, as a rather low number of structural elements, as compared to the total number of structural elements, is expected to be formed using roller-bending machines or a hydraulic press. Similar to the case of model B1, it can be seen that production lines A2 and B2 demonstrate an almost adequate balancing of the buffering capacity. However, some improvement capacity towards leaner solutions may be identified in the cases of buffers b10, b12, and b22.
While considerations of the optimum buffering capacities are relevant for long-term and strategic decision making, the identification of bottlenecks remains the most interesting and operational-level-based aspect of digital twinning. Thus, according to [7], the application of the unconstrained improvability of the production system at hand may lead to an increase in the production rate and may impact other KPIs, such as the work-in-process and probabilities of blockage and starvation. This concept of improvability is suitable for implementation within the digital twinning framework, as it may alter the properties of the production system at a daily level based on real-time factory-floor data. Hence, the reliability of the machines (Table 1), according to [7], suggests that the bottlenecks concerning the production rate are the most unreliable machines in the line. Therefore, the increase in the production rate can be achieved if the reliabilities of operations m4, m7, m19, and m22 are improved through an improved maintenance strategy, investments, and better working conditions. This will also positively affect the complete production system through a decrease in blockages BL1, BL2, BL3, BL17, and BL18. Conversely, a slight increase in the probabilities of starvation may be expected. However, generally, they are at a rather low level (except for the specific cases of ST11, ST12, and ST23), and no significant impact on the complete production system can be expected.

4. Conclusions

Digitalization and digital twinning are key enablers of Industry 4.0 and factories of the future. Such concepts unlock the inclusion of predictive analytics at the strategic, tactical, and operational levels of decision making. While some production processes have managed to quickly adapt to these new trends and opportunities, others remain operating according to traditional production concepts. This is especially valid for complex production systems, such as ship production processes. Therefore, the possibility of the digital twinning of the fabrication lines in a shipyard is considered in this paper as the first step toward the development of an integrated ship production monitoring and management system based on production system engineering principles. As such a concept is employed for the first time in the case of a ship production process, it is expected that this will motivate the broader inclusion of predictive analytics in the context of other complex production systems as well.
The developed digital twin of steel processing lines in a shipyard is based on the finite-state method as a reliable method originating from the framework of Markov processes. The finite-state method is outlined in the context of digital twinning and threading, along with the definitions of the key performance indicators, such as the production rate, work-in-process, and probabilities of blockage and starvation. The considered fabrication lines proved to be moderately efficient, with production rates ranging between 0.62 and 0.80, depending on the material properties and geometric characteristics of the ship structural elements. Moreover, rather low production rates of about 0.04 and 0.15 are attributed to the forming of steel plates and profiles, respectively, due to the considerably lower amounts of the processed structural parts. Furthermore, the obtained results indicate the steel sheet processing line to be a balanced production system, while the profile fabrication system demonstrated a significant capacity for leaner solutions, especially due to the considerably larger capacity of the buffers compared with the expected number of processed parts. Therefore, the improvability approach is employed to extend the scope of the developed concept through the identification of bottlenecks and directions for system enhancements through tailored maintenance strategies and target investments.
Finally, it may be concluded that additional work is still ahead of the development and research of digital twinning, both in the context of ship production as well as in the context of the general manufacturing industry. In the first case, future work should consider the inclusion of assembly systems into digital twins of complete shipyards. In addition, aspects related to energy requirements, environmental friendliness, and production costs should be employed as well. In the second case, further research on digital twinning should take more sophisticated mathematical models into account, rather than databases only. This will enable more reliable predictive analytics, and it will also provide physical entities with instructions leading to improvements in production outputs.

Author Contributions

Conceptualization, N.H. and V.L.; methodology, N.H.; software, V.L.; validation, V.L., N.H. and T.O.; formal analysis, N.H.; investigation, T.O.; resources, R.K. and T.O.; data curation, R.K.; writing—original draft preparation, N.H.; writing—review and editing, V.L., T.O. and R.K.; visualization, V.L.; supervision, N.H.; project administration, N.H.; funding acquisition, N.H. All authors have read and agreed to the published version of the manuscript.

Funding

The research was supported by the Croatian Science Foundation, project UIP-2019-04-6573 ANTYARD (Advanced Methodologies for Cost-Effective, Energy Efficient, and Environmentally Friendly Ship Production Process Design).

Institutional Review Board Statement

Not applicable.

Informed Consent Statement

Not applicable.

Data Availability Statement

The data that support the findings of this study are available from the corresponding author upon reasonable request.

Acknowledgments

We would like to express our gratitude to the Brodosplit Shipyard, Slit, Croatia, for granting us the shipyard-floor data.

Conflicts of Interest

The authors declare no conflict of interest.

References

  1. Mourtzis, D. Simulation in the design and operation of manufacturing systems: State of the art and new trends. Int. J. Prod. Res. 2020, 58, 1927–1949. [Google Scholar] [CrossRef]
  2. Dolgui, A.; Sgarbossa, F.; Simonetto, M. Design and management of assembly systems 4.0: Systematic literature review and research agenda. Int. J. Prod. Res. 2021, 60, 184–210. [Google Scholar] [CrossRef]
  3. Hadžić, N.; Ložar, V.; Opetuk, T.; Andrić, J. The Bernoulli splitting line: Analytical and semi-analytical evaluation of the steady-state performance. Int. J. Prod. Res. 2021, 60, 5912–5936. [Google Scholar] [CrossRef]
  4. Dain, O.; Ginsberg, M.; Keenan, E.; Pyle, J.; Smith, T.; Stoneman, A.; Pardoe, I. Stochastic Shipyard Simulation with Simyard. In Proceedings of the 2006 Winter Simulation Conference, Monterey, CA, USA, 3–6 December 2006; pp. 1770–1778. [Google Scholar] [CrossRef]
  5. Ljubenkov, B.; Đukić, G.; Kuzmanić, M. Simulation Methods in Shipbuilding Process Design. J. Mech. Eng. 2008, 54, 131–139. Available online: https://www.sv-jme.eu/article/simulation-methods-in-shipbuilding-process-design/ (accessed on 13 December 2022).
  6. Hadjina, M. Simulation Modelling Based Methodology for Shipbuilding Production Process Design. Strojarstvo 2009, 51, 547–553. Available online: https://hrcak.srce.hr/50589 (accessed on 14 December 2022).
  7. Hadžić, N.; Ložar, V.; Opetuk, T.; Andrić, J. A Finite State Method in improvement and design of lean Bernoulli serial production lines. Comput. Ind. Eng. 2021, 158, 107449. [Google Scholar] [CrossRef]
  8. Hadžić, N.; Ložar, V.; Opetuk, T.; Kunkera, Z. The Bernoulli Assembly Line: The Analytical and Semi-Analytical Evaluation of Steady-State Performance. Appl. Sci. 2022, 12, 12447. [Google Scholar] [CrossRef]
  9. Grieves, M.W. Product lifecycle management: The new paradigm for enterprises. Int. J. Prod. Dev. 2005, 2, 71–84. [Google Scholar] [CrossRef]
  10. Grieves, M.W. Product Lifecycle Management; McGraw-Hill: Nova Iorque, Brazil, 2006. [Google Scholar]
  11. Grieves, M.W. Virtually Perfect: Driving Innovative and Lean Products through Product Lifecycle Management; Space Coast Press: Cocoa Beach, FL, USA, 2011. [Google Scholar]
  12. Tuegel, E.J.; Ingraffea, A.R.; Eason, T.G.; Spottswood, S.M. Reengineering Aircraft Structural Life Prediction Using a Digital Twin. Int. J. Aerosp. Eng. 2011, 2011, 154798. [Google Scholar] [CrossRef] [Green Version]
  13. Cerrone, A.; Hochhalter, J.D.; Heber, G.; Ingraffea, A.R. On the Effects of Modeling As-Manufactured Geometry: Toward Digital Twin. Int. J. Aerosp. Eng. 2014, 3, 39278. [Google Scholar] [CrossRef]
  14. Rosen, R.; Von Wichert, G.; Lo, G.; Bettenhausen, K.D. About The Importance of Autonomy and Digital Twins for the Future of Manufacturing. IFAC-PapersOnLine 2015, 48, 567–572. [Google Scholar] [CrossRef]
  15. Boschert, S.; Rosen, R. Digital Twin—The Simulation Aspect. Mechatron. Futures 2016, 59–74. [Google Scholar] [CrossRef]
  16. Coraddu, A.; Oneto, L.; Baldi, F.; Cipollini, F.; Atlar, M.; Savio, S. Data-driven ship digital twin for estimating the speed loss caused by the marine fouling. Ocean. Eng. 2019, 186, 106063. [Google Scholar] [CrossRef]
  17. Wang, M.M.; Wang, C.Y.; Hnydiuk-Stefan, A.; Feng, S.Z.; Atilla, I.; Li, Z. Recent progress on reliability analysis of offshore wind turbine support structures considering digital twin solutions. Ocean. Eng. 2021, 232, 109168. [Google Scholar] [CrossRef]
  18. Kutzke, D.T.; Carter, J.B.; Hartman, B.T. Subsystem selection for digital twin development: A case study on an unmanned underwater vehicle. Ocean. Eng. 2021, 223, 108629. [Google Scholar] [CrossRef]
  19. Lee, J.H.; Nam, Y.S.; Kim, Y.; Liu, Y.M.; Lee, J.; Yang, H. Real-time digital twin for ship operation in waves. Ocean. Eng. 2022, 266, 112867. [Google Scholar] [CrossRef]
  20. Wasserman, S. What is the Digital Twin and Why Should Simulation and IoT Experts Care? 2017. Available online: https://www.engineering.com/story/what-is-the-digital-twin-and-why-should-simulation-and-iot-experts-care (accessed on 10 January 2023).
  21. Kritzinger, W.; Karner, M.; Traar, G.; Henjes, J.; Sihn, W. Digital Twin in manufacturing: A categorical literature review and classification. IFAC-PapersOnLine 2018, 51, 1016–1022. [Google Scholar] [CrossRef]
  22. Mourtzis, D.; Vlachou, E.; Giannoulis, C.; Siganakis, E.; Zogopoulos, V. Applications for Frugal Product Customization and Design of Manufacturing Networks. Procedia CIRP 2016, 52, 228–233. [Google Scholar] [CrossRef] [Green Version]
  23. Gebhardt, M.; Kopyto, M.; Birkel, H.; Hartman, E. Industry 4.0 technologies as enablers of collaboration in circular supply chains: A systematic literature review. Int. J. Prod. Res. 2021, 60, 6967–6995. [Google Scholar] [CrossRef]
  24. Polini, W.; Corrado, A. Digital twin of composite assembly manufacturing process. Int. J. Prod. Res. 2020, 58, 5238–5252. [Google Scholar] [CrossRef]
  25. Li, J.J.; Zhou, G.H.; Zhang, C. A twin data and knowledge-driven intelligent process planning framework of aviation parts. Int. J. Prod. Res. 2021, 60, 5217–5234. [Google Scholar] [CrossRef]
  26. Zheng, X.; Lu, J.; Kiritsis, D. The emergence of cognitive digital twin: Vision, challenges and opportunities. Int. J. Prod. Res. 2021, 60, 7610–7632. [Google Scholar] [CrossRef]
  27. Coelho, F.; Relvas, S.; Barbosa-Póvoa, A.P. Simulation-based decision support tool for in-house logistics: The basis for a digital twin. Comput. Ind. Eng. 2021, 153, 107094. [Google Scholar] [CrossRef]
  28. Psarommatis, F.; Sousa, J.; Mendonça, J.P.; Kiritsis, D. Zero-defect manufacturing the approach for higher manufacturing sustainability in the era of industry 4.0: A position paper. Int. J. Prod. Res. 2022, 60, 73–91. [Google Scholar] [CrossRef]
  29. Psarommatis, F.; May, G. A literature review and design methodology for digital twins in the era of zero defect manufacturing. Int. J. Prod. Res. 2022, 1–21. [Google Scholar] [CrossRef]
  30. Dornelles, J.A.; Ayala, N.F.; Frank, A.G. Smart Working in Industry 4.0: How digital technologies enhance manufacturing workers’ activities. Comput. Ind. Eng. 2022, 163, 107804. [Google Scholar] [CrossRef]
  31. Segura, A.; Diez, H.V.; Barandiaran, I.; Arbelaiz, A.; Álvarez, H.; Simões, B.; Posada, J.; García-Alonso, A.; Ugarte, R. Visual computing technologies to support the Operator 4.0. Comput. Ind. Eng. 2022, 139, 105550. [Google Scholar] [CrossRef]
  32. Papandopulos, C.T.; Li, J.; O’Kelly, M.E.J. A classification and review of timed Markov models of manufacturing systems. Comput. Ind. Eng. 2019, 128, 219–244. [Google Scholar] [CrossRef]
  33. Li, J.; Meerkov, S.M. Production System Engineering; Springer: New York, NY, USA, 2009. [Google Scholar]
  34. Gershwin, S.B. An Efficient Decomposition Method for the Approximate Evaluation of Tandem Queues with Finite Storage Space and Blocking. Oper. Res. 1987, 35, 291–305. [Google Scholar] [CrossRef] [Green Version]
  35. Jacobs, D.; Meerkov, S.M. Asymptotically reliable serial production lines with a quality control system. Comput. Math. Appl. 1991, 21, 85–90. [Google Scholar] [CrossRef] [Green Version]
  36. Ložar, V.; Hadžić, N.; Opetuk, T.; Slapničar, V. Accuracy of Semi-Analytical and Numerical Approaches in Evaluation of Serial Bernoulli Production Lines. Mathematics 2021, 9, 1461. [Google Scholar] [CrossRef]
  37. Hadžić, N. Analytical solution of the serial Bernoulli production line steady-state performance and its application in the shipbuilding process. Int. J. Prod. Res. 2019, 56, 1052–1065. [Google Scholar] [CrossRef]
  38. Aminuddin, N.A.B.; Garza-Reyes, J.A.; Kumar, V.; Antony, J.; Rocha-Lona, L. An analysis of managerial factors affecting the implementation and use of overall equipment effectiveness. Int. J. Prod. Res. 2016, 54, 4430–4447. [Google Scholar] [CrossRef]
  39. Foulloy, L.; Olivine, V.; Berrah, L. A fuzzy temporal approach to the Overall Equipment Effectiveness measurement. Comput. Ind. Eng. 2019, 127, 103–115. [Google Scholar] [CrossRef]
  40. Caprce, J.D.; Da Silva, C.T.; Rigo, P.; Pires, F.C.M. Discrete Even Production Simulation and Optimisation of Ship Block Erection Process. In Proceedings of the 10th International Conference on Computer Applications and Information Technology in the Maritime Industries 2011, Como, Italy, 20–21 June 2011; pp. 271–282. [Google Scholar]
  41. Son, M.J.; Kim, T.W. Job Assignment Simulation of Ship Hull Production Design in Consideration of Mid-Term Schedule. J. Soc. Nav. Archit. Korea 2013, 50, 334–342. [Google Scholar] [CrossRef] [Green Version]
  42. Hadjina, M.; Fafandjel, N.; Matulja, T. Shipbuilding production process design methodology using computer simulation. Brodogradnja 2015, 66, 77–91. Available online: https://hrcak.srce.hr/140058 (accessed on 14 December 2022).
  43. Wang, C.; Mao, P.; Mao, Y.; Shin, J.G. Research on scheduling and optimization under uncertain conditions in panel block production line in shipbuilding. Int. J. Nav. Archit. Ocean. Eng. 2016, 8, 398–408. [Google Scholar] [CrossRef] [Green Version]
  44. Oliveira, A.; Gordo, J.M. Lean tools applied to a shipbuilding panel line assembling process. Brodogradnja 2018, 69, 53–64. Available online: https://hrcak.srce.hr/207743 (accessed on 14 December 2022). [CrossRef]
  45. Stanić, V.; Hadjina, M.; Fafandjel, N.; Matulja, T. Toward Shipbuilding 4.0–An Industry 4.0 changing the face of the shipbuilding industry. Brodogradnja 2018, 69, 111–128. Available online: https://hrcak.srce.hr/201162 (accessed on 14 December 2022). [CrossRef]
  46. Vidal-Balea, A.; Blanco-Novoa, O.; Fraga-Lamas, P.; Vilar-Montesions, M.; Fernández-Caramés, M. Creating Collaborative Augmented Reality Experiences for Industry 4.0 Training and Assistance Applications: Performance Evaluation in the Shipyard of the Future. Appl. Sci. 2020, 10, 9073. [Google Scholar] [CrossRef]
  47. Choi, T.; Seo, Y. A Real-Time Physical Progress Measurement Method for Schedule Performance Control Using Vision, an AR Marker and Machine Learning in a Ship Block Assembly Process. Sensors 2020, 20, 5386. [Google Scholar] [CrossRef] [PubMed]
  48. Bilen, U.; Helvacioglu, S. Data driven performance evaluation in shipbuilding. Brodogradnja 2020, 71, 39–51. [Google Scholar] [CrossRef]
  49. Lee, Y.G.; Ju, S.H.; Woo, J.H. Simulation-based planning system for shipbuilding. Int. J. Comput. Integr. Manuf. 2020, 33, 626–641. [Google Scholar] [CrossRef]
  50. Hadžić, N.; Ložar, V.; Opetuk, T.; Cajner, H. Improvability of the fabrication line in a shipyard. Brodogradnja 2021, 72, 13–28. [Google Scholar] [CrossRef]
  51. Price, J.R.; Trost, C.S.; Bespolka, C.; Xie, T. Productivity Management Insights and Lessons from Naval Ship Repair. Nav. Eng. J. 2021, 133, 77–90. [Google Scholar]
  52. Wu, Q.; Mao, Y.; Chen, J.; Wang, C. Application Research of Digital Twin-Driven Ship Intelligent Manufacturing System: Pipe Machining Production Line. J. Mar. Sci. Eng. 2021, 9, 338. [Google Scholar] [CrossRef]
  53. Pang, T.Y.; Pelaez Restrepo, J.D.; Cheng, C.T.; Yasin, A.; Lim, H.; Miletic, M. Developing a Digital Twin and Digital Thread Framework for an ‘Industry 4.0’ Shipyard. Appl. Sci. 2021, 11, 1097. [Google Scholar] [CrossRef]
  54. Incontrol Simulation Solutions (2021) Enterprise Dynamics Tutorial; InControl: Utrecht, The Netherlands, 2021.
Figure 1. A structure of the splitting line in the general case.
Jmse 11 01053 g001
Figure 2. The finite-state elements in the case of a splitting line.
Jmse 11 01053 g002
Figure 3. A framework of the digital thread (arrows indicate data flows).
Jmse 11 01053 g003
Figure 4. Fabrication lines in the case of the considered shipyard.
Jmse 11 01053 g004
Figure 5. Mathematical models (digital twins) of the considered fabrication lines: models A1 and A2—fabrication of plate elements; models B1 and B2—fabrication of stiffeners.
Jmse 11 01053 g005
Figure 6. Fore and midship sections of a cruise ship in construction.
Jmse 11 01053 g006
Figure 7. A numerical model of the fabrication line in a shipyard: (1) prefabrication of steel plates; (2) prefabrication of profiles; (3) plasma cutting of plates; (4) manual cutting and forming of profiles; (5) robotic cutting of profiles; (6) oxy-fuel cutting of plates; (7) plate forming.
Jmse 11 01053 g007
Figure 8. A comparison of KPIs obtained using the mathematical model (MM) and numerical model (NM): (a) production rate (PR); (b) work-in-process (WIP); (c) probability of blockage (BL); and (d) probability of starvation (ST).
Jmse 11 01053 g008
Table 1. List of operations and related reliability data.
imiModelOperationpi
1m1A1Plate straightening0.90
2m2Drying0.91
3m3Abrasive cleaning0.98
4m4Shop priming0.80
5m5Coat drying0.91
6m6Marking0.96
7m7A2Plasma tracing and cutting0.70
8m8Plasma marking0.77
9m9Plasma tracing and cutting0.71
10m10Plasma marking0.77
11m11Plate-forming–roller-bending machine0.85
12m12Plate forming–hydraulic press0.85
13m13Oxy-fuel tracing and cutting0.70
14m14Oxy-fuel marking0.77
15m15Oxy-fuel tracing and cutting0.71
16m16Oxy-fuel marking0.77
17m17B1Drying0.91
18m18Abrasive cleaning0.98
19m19Shop priming0.80
20m20Coat drying0.91
21m21Marking0.96
22m22B2Oxy-fuel manual cutting0.77
23m23Stiffener-forming–roller-bending machine0.93
24m24Oxy-fuel robotic cutting0.81
Table 2. Capacities of buffers.
BC *b1b2b3b4b5b7b9b10b11b13b15b17b18b19b20b22
Ni4111122222288884
* Buffer capacities.
Table 3. Splitting rates determined based on the properties of the ship sections.
Splitting Rater1r2r3r4r5r6r7r8r9r10r11r12r13r14r15r16
ri0.50.5000.050.050.9000100.20.800
Table 4. KPIs of production processes: production rate (PRi (pieces/cycle)), work in process (WIPi (pieces)), residence time (RTi = WIP/PRi (cycle)).
A1 PR6 WIP1WIP2WIP3WIP4WIP5RT6
MM0.78 3.350.930.980.810.818.82
NM0.80 4.001.001.000.000.007.50
A2 PR8 WIP7 RT8
MM0.64 1.18 1.84
NM0.70 0.00 n/a
PR11PR12PR10r3WIP9WIP10WIP11 RT11RT12RT10r3
MM0.040.040.641.200.040.04 31311.87
NM0.040.040.630.000.000.00 n/an/an/a
B1 PR21 WIP17WIP18WIP19WIP20 RT21
MM0.80 7.357.911.450.99 22.12
NM0.80 7.989.990.000.00 22.46
B2 PR22r14PR23 WIP22 RT22r14RT23
MM0.150.62 0.17 /0.27
NM0.150.62 0.00 /n/a
MM: mathematical model; NM: numerical model.
Table 5. KPIs of production processes: the probability of blockage (BLi) and the probability of starvation (STi).
A1 BL1BL2BL3BL4BL5ST2ST3ST4ST5ST6
MM0.170.240.270.080.030.000.070.010.170.19
NM0.100.110.180.000.000.000.000.000.110.16
A2 BL7 ST8
MM0.06 0.13
NM0.00 0.07
BL9BL10 ST10ST11ST12
MM0.060.00 0.120.810.81
NM0.000.00 0.070.810.81
B1 BL17BL18BL19BL20 ST18ST19ST20ST21
MM0.110.180.000.00 0.000.000.110.16
NM0.110.180.000.00 0.000.000.110.16
B2 BL22BL23 ST23
MM0.000.00 0.78
NM0.000.00 0.78
Disclaimer/Publisher’s Note: The statements, opinions and data contained in all publications are solely those of the individual author(s) and contributor(s) and not of MDPI and/or the editor(s). MDPI and/or the editor(s) disclaim responsibility for any injury to people or property resulting from any ideas, methods, instructions or products referred to in the content.

