Article

An Absolute Displacement Measurement Method and Its Application in Ship Motion Measurement

Logistics Engineering College, Shanghai Maritime University, Shanghai 201306, China
*
Author to whom correspondence should be addressed.
J. Mar. Sci. Eng. 2023, 11(5), 931; https://doi.org/10.3390/jmse11050931
Submission received: 22 March 2023 / Revised: 18 April 2023 / Accepted: 25 April 2023 / Published: 27 April 2023
(This article belongs to the Section Ocean Engineering)

Abstract

:
Due to the fact that there is no static reference point in ocean space, relative measurement sensors such as laser sensors cannot be applied to the measurement of ship motion. In order to collect the motion signal of a ship in the ocean more accurately, an absolute measurement method for the motion of a ship is proposed. Firstly, the acceleration signal in the heave direction of the ship is obtained by using an acceleration sensor; secondly, the time–frequency domain integration algorithm is used to avoid the problem of the quadratic trend item and the influence of the low-frequency signal, and the ship’s heave displacement value is obtained by integration; finally, the displacement signal measured by the laser sensor and the integrated displacement signal of the acceleration sensor are compared with each other to verify the effectiveness of the absolute measurement of the heave displacement of the ship based on the acceleration sensor. At the same time, an angle sensor is used to measure the roll angle and pitch angle in the motion of the ship, form an absolute measurement system for the motion of the ship, and verify that the measurement points are arranged on the ship, which proves that the system can collect data from the ship in sea areas far from the coast. Motion signals are more advantageous.

1. Introduction

As the world is rapidly developing, the pace of global energy transformation is also accelerating, and renewable energy has entered a stage of rapid development. According to the “Renewables 2022 Global Status Report” published by the United Nations Environment Programme, global energy power is mainly generated from non-renewable energy sources, such as oil and coal, and renewable energy power generation accounts for only 26.2% [1]. At present, wind power, as an important source of renewable energy with mature technology and environmental friendliness, has achieved large-scale development and application all over the world, and the number of offshore wind power stations is gradually increasing. However, the installation and maintenance of offshore wind turbines are inseparable from ship transportation. During the process of transporting the tower and fan blades of the wind turbine, a ship is affected by the wave force, resulting in six degrees of freedom motion of heave, roll, pitch, yaw, sway, and surge. The movement of the ship has a great impact on offshore operations: affecting the safety of construction crews, slowing down construction efficiency, and causing even more serious damage to wind turbine equipment, resulting in incalculable economic losses. Therefore, it is necessary to accurately measure the motion of a ship under the action of sea waves and use wave compensation technology to offset the ship motion caused by sea waves, so as to promote the installation of offshore wind turbines more safely and quickly [2].
The influence of the ship’s movement on the force generated by the carried wind turbine equipment is mainly in the three degrees of freedom of heave, roll, and pitch [3,4,5,6,7]. Among them, the ship motion measurement technology of the two degrees of freedom of ship roll and pitch is very mature, mainly using angle sensors, inclination gyroscopes, and other equipment as effective means of real-time measurement [8]. The heave displacement measurement of a ship is still the main difficulty in ship motion measurement. At present, the measurement of the heave displacement of a ship is generally divided into two types: relative measurement and absolute measurement. Traditional displacement measurement methods mainly use relative measurement methods, such as laser ranging sensors and radars, and provide static reference objects for measurement based on reefs or other fixed objects in the ocean. Due to the mature technology, the traditional relative measurement method is widely used in areas with static reference systems such as offshore areas and those near ports [9,10]. However, there is no static reference system in areas of the sea far from the coast, and the measurement of ship heave displacement mainly relies on absolute measurement equipment, such as acceleration sensors and gyroscopes.
For the measurement method of ship heave motion, Abankwa N O and Johnston S J presented a novel motion measurement system that used a Raspberry Pi with a wireless module and an inertial measurement unit (IMU) sensor to measure a vessel’s motions [11]. J.-M. Godhavn believed that heave measurements can be calculated using on-line methods for real-time heave computation and off-line methods for post-processing. Heave can be computed from GPS RTK height measurements and from vertical accelerations measured by linear accelerometers, but processing speed cannot be guaranteed [12]. Many scholars presented a method to estimate sea state characteristics from the time series of 6-DOF ship motions using machine learning [13,14,15,16]. At present, relative measurement methods are more widely used to collect ship motion, but their application scenarios are limited [17,18,19,20]. There are relatively few studies on the use of absolute measurement methods to collect ship motion, and most of them have used high-precision gyroscopes and other equipment [21,22,23]. Stredulinsky D C addressed the issue of performance during a field test of the system as being under development by Next Ocean enabling such predictions, based on using an off-the-shelf (non-coherent) navigation radar system as a remote wave observer. This prediction system was used in a field test on the North Sea near the Dutch coast on a 42 m patrol vessel [24]. However, absolute measurement is mostly used in the production and manufacture of grating measurement, medical imaging, and small machinery industry, and not much research has been conducted in the field of ship measurement [25,26,27,28,29,30].
In this paper, in order to solve the problem of the relative measurement method being unable to measure a ship’s motion on the sea far away from the coast, an absolute measurement method for the heave displacement of the ship is proposed and, combined with the angle sensor to measure the roll angle and pitch angle of the ship, the absolute measurement of the three degrees of freedom of the ship in heave, roll, and pitch is realized. The absolute measurement method of the ship’s heave displacement obtains the ship’s heave displacement signal by performing Kalman filter denoising on the original acceleration signal and performing quadratic integration in the time–frequency domain. At the same time, the secondary conversion of analog signal to digital signal and then to analog signal is completed, and finally an analog signal that is convenient for control is obtained. In order to verify the accuracy of the absolute measurement method, we imitate the heave motion of the ship with different amplitudes and frequencies on the laboratory platform and compare the displacement signal measured by the acceleration sensor with the displacement signal measured by the laser sensor in the host computer. It was found that the accuracy of the absolute measurement method was [90–93%], which verified the validity and reliability of this method. At the same time, we use acceleration sensors and angle sensors to build absolute measurement systems on ships in the South China Sea and collect ship three-degree-of-freedom motion data on the sea far from the coast. The data results show that the absolute measurement system of the ship motion based on the acceleration sensor has more advantages than the relative measurement method in measuring ship motion on the sea far away from the coast.
The main contributions of this paper are as follows:
  • A time–frequency domain quadratic integration algorithm is proposed that can avoid the problem of error accumulation in time domain integration and low-frequency integration offset in frequency domain integration. Firstly, the acceleration time domain signal is integrated into the velocity time domain signal through time domain integration, and the least-squares method is used to remove the trend item so that the influence of the trend item of the second integration in the time domain is reduced. Secondly, the velocity time domain signal is Fourier transformed to obtain the velocity frequency domain value, integrated into the frequency domain, and inverse Fourier transformed to finally obtain the displacement signal, which avoided the problem of low precision of quadratic integration of low-frequency data in the frequency domain.
  • A ship motion measurement system is proposed based on an acceleration sensor. The system uses an acceleration sensor and an angle sensor and performs Kalman filter denoising on the sensor data, which made it possible to make absolute measurements of ship motion at sea far from shore.
The subsequent sections of this manuscript are organized as follows: Section 2 presents the limitations of quadratic integration of acceleration signals in the time domain and quadratic integration in the frequency domain. Section 3 introduces the proposed time–frequency domain integration algorithm based on the least-squares detrending term and its system composition in detail. Section 4 designs experiments to verify the effectiveness of the absolute measurement method for ship heave displacement and builds an absolute measurement system on the ship and collects three-degree-of-freedom motion signals of the ship. Section 5 presents conclusions and makes recommendations for future work.

2. Preliminary Work

In order to obtain the displacement signal of the ship’s heave, it is necessary to integrate the collected acceleration signal into displacement data. At present, there are two primary integration methods for discrete acceleration signals: time domain integration and frequency domain integration [31,32,33].

2.1. Time Domain Integration

Since the acceleration signal sampled by the sensor is discrete data, the time domain integral of the discrete acceleration signal is usually calculated by summing and accumulating, which is also commonly called rectangular integral.
The integral formula of the speed signal is:
v ( t ) = 0 + a ( t ) d t lim Δ t 0 n = 1 N a ( n ) Δ t + a ( 0 )
Among them, v ( t ) is the velocity signal, a ( t ) is the acceleration signal, and a ( n ) is the discrete acceleration signal.
The integral formula of the displacement signal is:
s ( t ) = 0 + v ( t ) d t lim Δ t 0 n = 1 N v ( n ) Δ t + v ( 0 )
Among them, s ( t ) is the displacement signal, v ( t ) is the velocity signal, and v ( n ) is the discrete velocity signal.
Ideally, the closer the sampling time interval Δ t is to 0, the more accurate the integrated value of the acceleration signal will be. However, in actual working conditions, the selected acceleration sensor is limited by the sampling frequency, which leads to the existence of an integral error. As time goes by, the integral error will gradually increase, as shown in Figure 1.
In order to reduce the error term produced by time domain integration, the two methods of trapezoidal integration and Simpson integration are usually used. Trapezoidal integrals are rectangular integrals that replace sums in a trapezoidal area approximation. The Simpson integral is a quadratic approximation that replaces rectangular or trapezoidal integrals.
The formula for calculating the trapezoidal integral is:
a b f ( x ) d x b a 2 [ f ( a ) + f ( b ) ]
The formula for the Simpson integral is:
a b f ( x ) d x 1 6 ( b a ) [ f ( a ) + 4 f ( a + b 2 ) + f ( b ) ]
After using the above method to integrate the discrete acceleration signal once and twice in the time domain, the error term of the integration will still continue to accumulate. Additionally, the error generated by the first integration will be added to the second integration in turn, and finally the velocity data and displacement data will be seriously offset. Therefore, it is difficult to accurately calculate the displacement using quadratic integration in the time domain.

2.2. Frequency Domain Integration

For the frequency domain integration of discrete acceleration signals, firstly, Fourier transform is performed on the acceleration data, and then integrated, where the integral property of Fourier transform is:
F [ t f ( t ) d t ] = F ( ω ) j ω
Here, F represents Fourier transform.
According to the integral nature of the Fourier transform, the integral operation of the discrete acceleration data is converted into a division operation, and finally the inverse Fourier transform is performed to obtain the velocity data and displacement data in the time domain.
The frequency domain value A ( ω ) of the acceleration is obtained by performing Fourier transform on the acceleration data a ( n ) :
A ( ω ) = F [ t a ( t ) d t ] = n = 0 N 1 a ( n ) e j ω n
The frequency domain value V ( ω ) of the velocity is obtained by once integrating the frequency domain value A ( ω ) of the acceleration:
V ( ω ) = A ( ω ) j ω = n = 0 N 1 1 j ω Δ f H ( k ) a ( n ) e j ω n
The frequency domain value S ( ω ) of the displacement is obtained by quadratic integration of the velocity frequency domain value V ( ω ) :
S ( ω ) = V ( ω ) ( j ω ) 2 = n = 0 N 1 1 ( ω Δ f ) 2 H ( k ) a ( n ) e j ω n
By performing inverse Fourier transform on V(ω) and S(ω), respectively, the corresponding velocity data and displacement data can be obtained. After calculation, it is found that the frequency domain integration can avoid the error accumulation of the trend item in the time domain integration process. However, the ω value corresponding to the low-frequency acceleration data is small, and the integration causes the denominator to become larger. Moreover, the accelerometer has difficulty controlling the accuracy of low-frequency data, so that small errors in the measurement process will also cause large calculation deviations; therefore, it is difficult to accurately calculate the displacement by quadratic integration in the frequency domain.

3. The Proposed Method

3.1. Time–Frequency Domain Integration Algorithm Based on Least-Squares Detrending Term

Aiming at the problems of the accumulation of trend items in time domain integration leading to larger errors and the low-frequency signal in frequency domain integration affecting the accuracy, a method of time–frequency domain integration based on least squares is proposed.
Firstly, it is integrated into the time domain, and the calculation formula of the time domain integral of the discrete acceleration signal is as follows:
v ( n ) = 1 2 f s [ a ( n ) + a ( n 1 ) ] + v ( n 1 )
where n is the nth sampling time, v is the velocity value after integration, a is the acceleration signal, and f s is the sampling frequency.
Secondly, due to the limitation of the sampling frequency, an error occurs when the acceleration signal a ( n ) is integrated into the velocity signal v ( n ) point by point, and the error here accumulates into a trend item. We use the least-squares method to fit the polynomial trend item generated in the velocity signal v ( n ) . The specific steps are as follows: for the speed signal v ( n ) , in the statistical method of scientific experiments, it is necessary to find the functional relationship f ( n ) = a n + b between n and v ( n ) . It is not required that the function relationship f ( n ) = a n + b passes through all the speed signal v ( n ) points, but only at a given value n , so that the error δ n = f ( n ) v ( n ) , ( n = 0 , 1 , 2 , 3 , , n ) meets the requirements and reaches the minimum. The arithmetic square root of the sum of squared errors δ n is used herein. Therefore, it is only necessary to fit the functional relationship that minimizes the sum of squared errors; that is, the trend item generated when the acceleration signal is integrated is obtained.
Next, Fourier transform is performed on the velocity data v ( n ) after the detrending item to obtain the frequency domain value V ( ω ) of the velocity data:
V ( ω ) = n = 0 N 1 v ( n ) e j ω n
Next, an integration is performed in the frequency domain:
S ( ω ) = V ( ω ) j ω = n = 0 N 1 1 j ω Δ f H ( k ) v ( n ) e j ω n
where H ( k ) = { 1 , f d Δ f f u 0 , e l s e , Δ f is the frequency resolution, f d and f u are the lower limit and upper limit of the cut-off frequency, respectively, n is the nth sampling frequency, and ω is the frequency corresponding to the Fourier component.
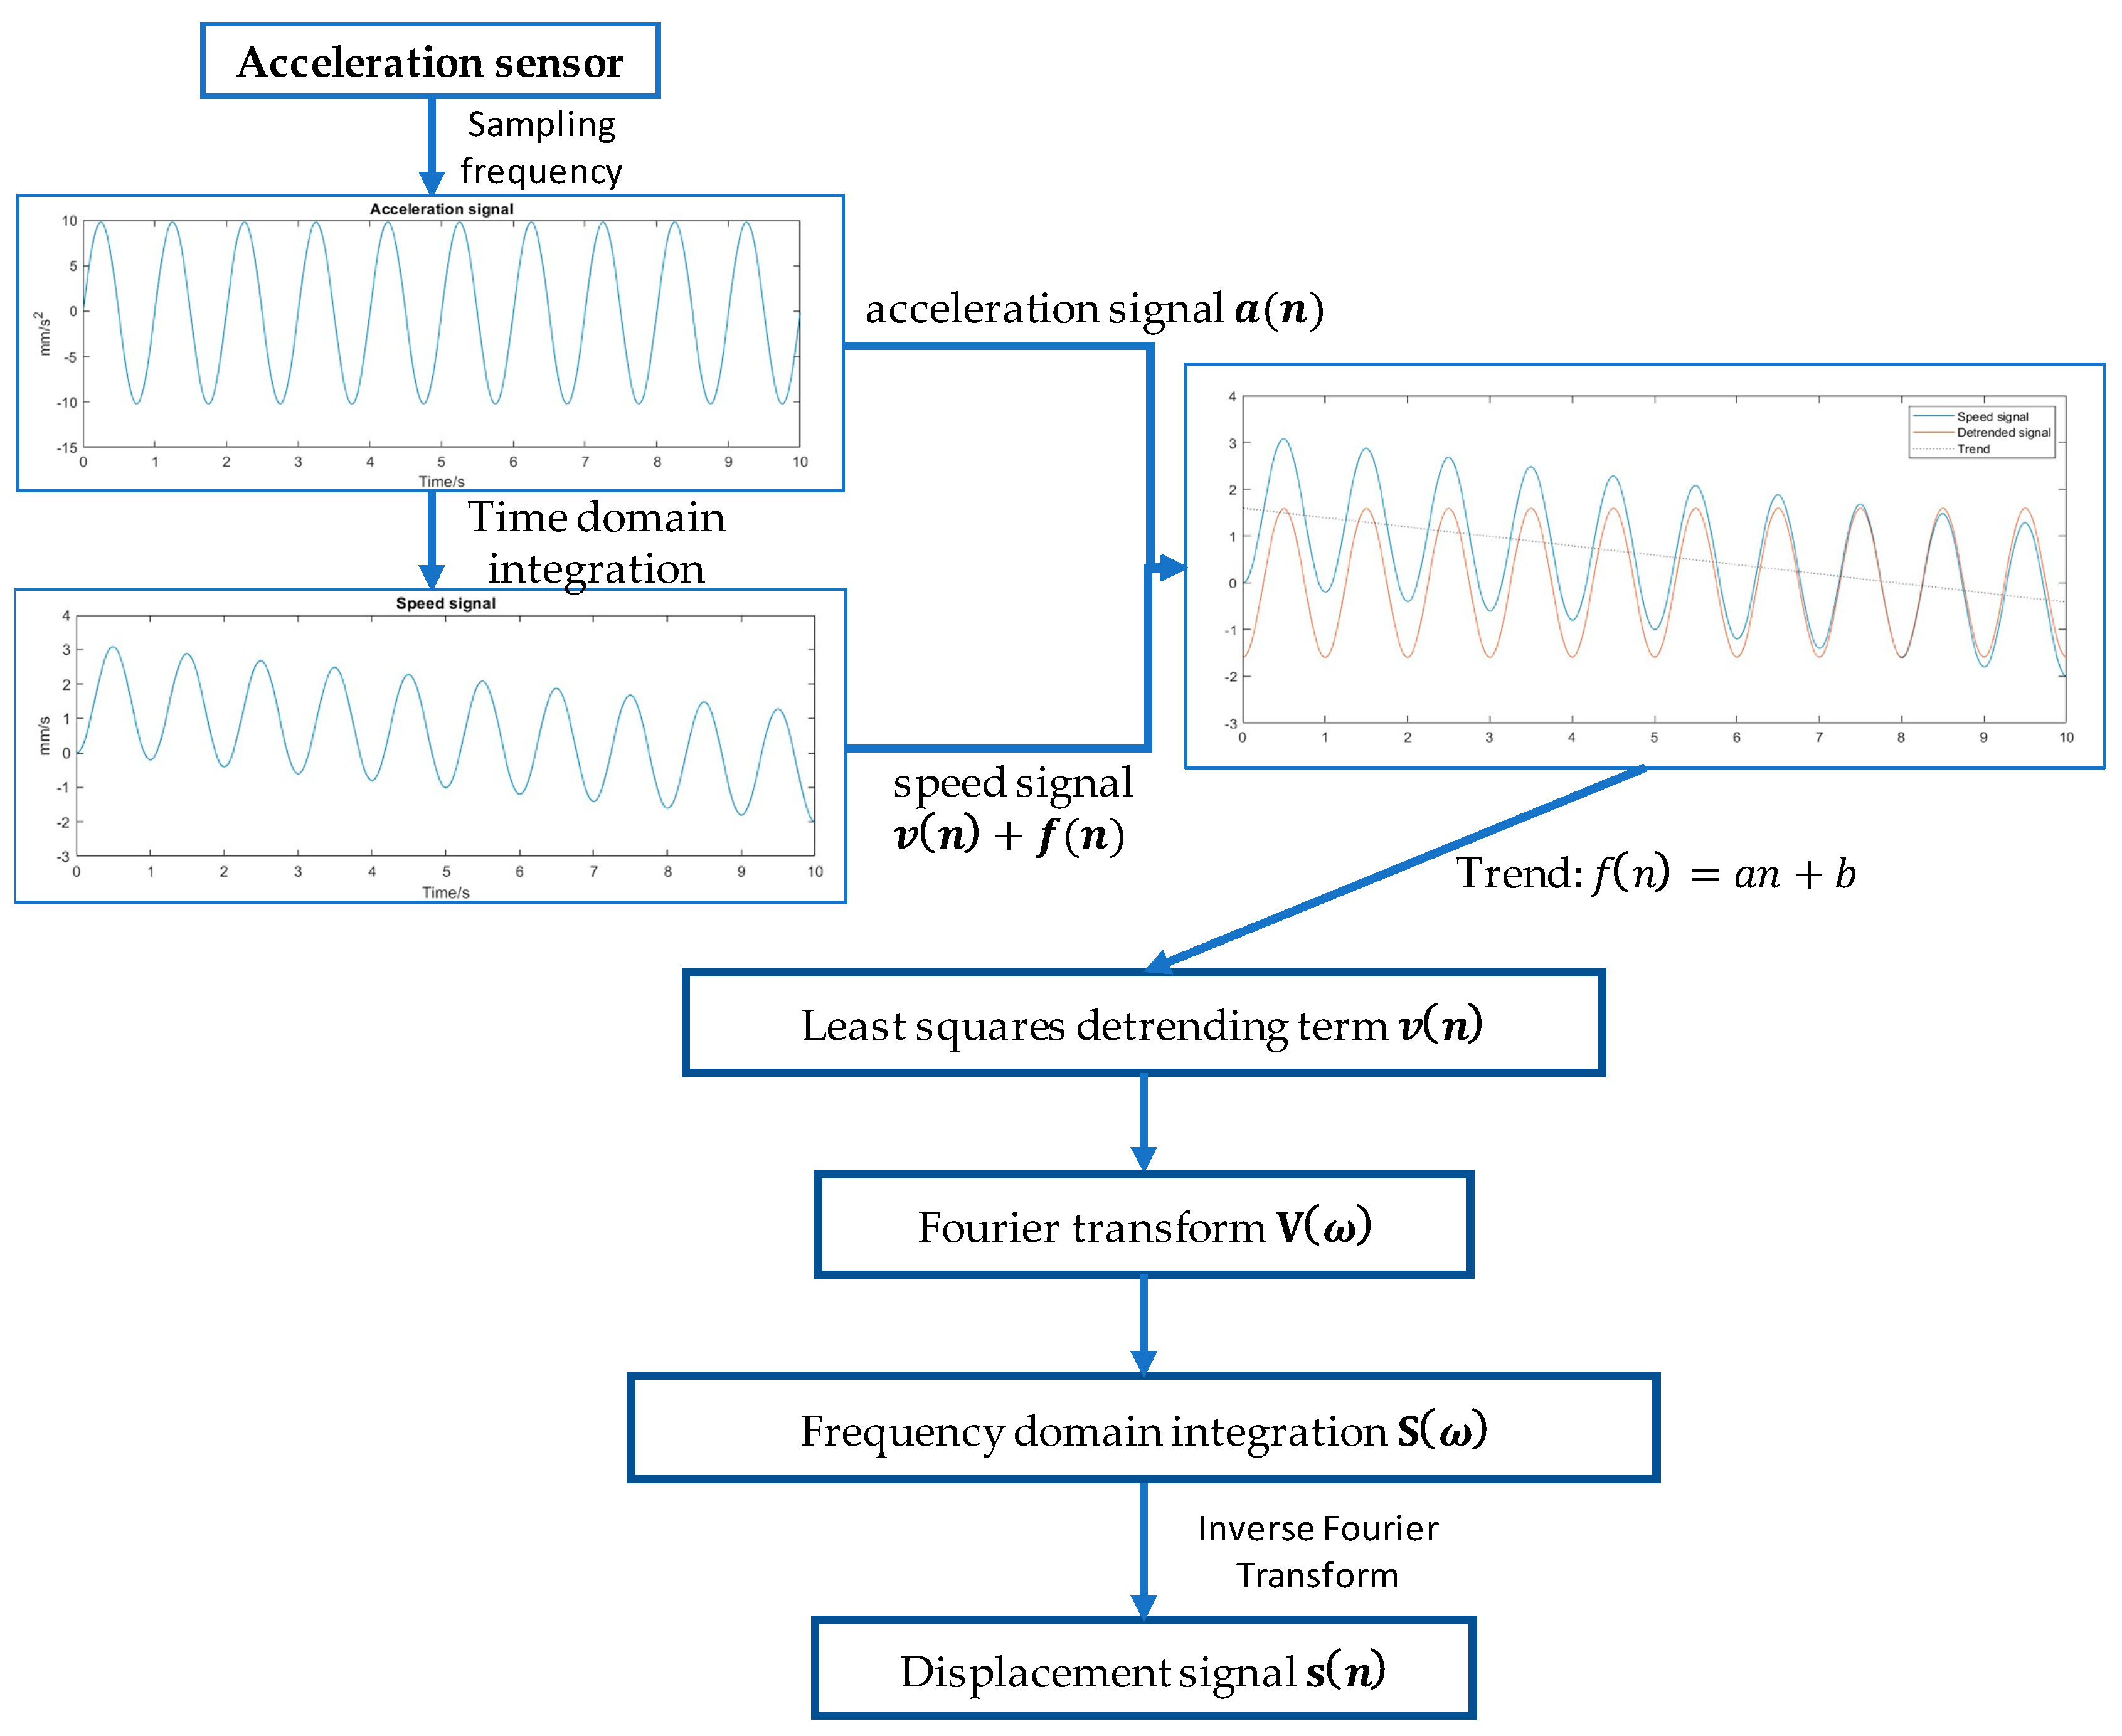
Finally, inverse Fourier transform is performed on the frequency domain value S ( ω ) of the displacement signal to obtain the displacement signal s ( n ) . This method not only avoids the problem of the quadratic trend item in the time domain integration, but also avoids the influence of low-frequency acceleration data on the calculation results. The flow chart of the time–frequency domain calculation algorithm is shown in Figure 2.

3.2. Absolute Measurement System of Ship Motion Based on Acceleration Time–Frequency Domain Integration

The absolute measurement system of ship motion based on acceleration time–frequency domain integration is mainly composed of an acceleration measurement module, signal conditioning module, time–frequency domain integration module, angle measurement module, and data acquisition module. The structure flow chart of the system is shown in Figure 3.
When the ship is in motion, the acceleration sensor collects the analog signal of the ship’s heave motion. Since the value of the original analog voltage signal is too small and there is noise, the signal needs to be preprocessed by the signal conditioner. The preprocessing first performs a Kalman filter on the acceleration signal and secondly scales the acceleration signal according to the upper and lower limits of the voltage value of the data collector. Then, the conditioned acceleration signal is integrated in the time–frequency domain in the quadratic integration module, and the corresponding velocity signal and displacement signal are calculated, respectively. Next, the angle sensor collects the variation of the ship’s roll and pitch angles, and, finally, the data collector collects the analog values of acceleration signals, velocity signals, and displacement signals, and displays real-time waveforms in the host computer software and stores them.

3.2.1. Acceleration Measurement Module

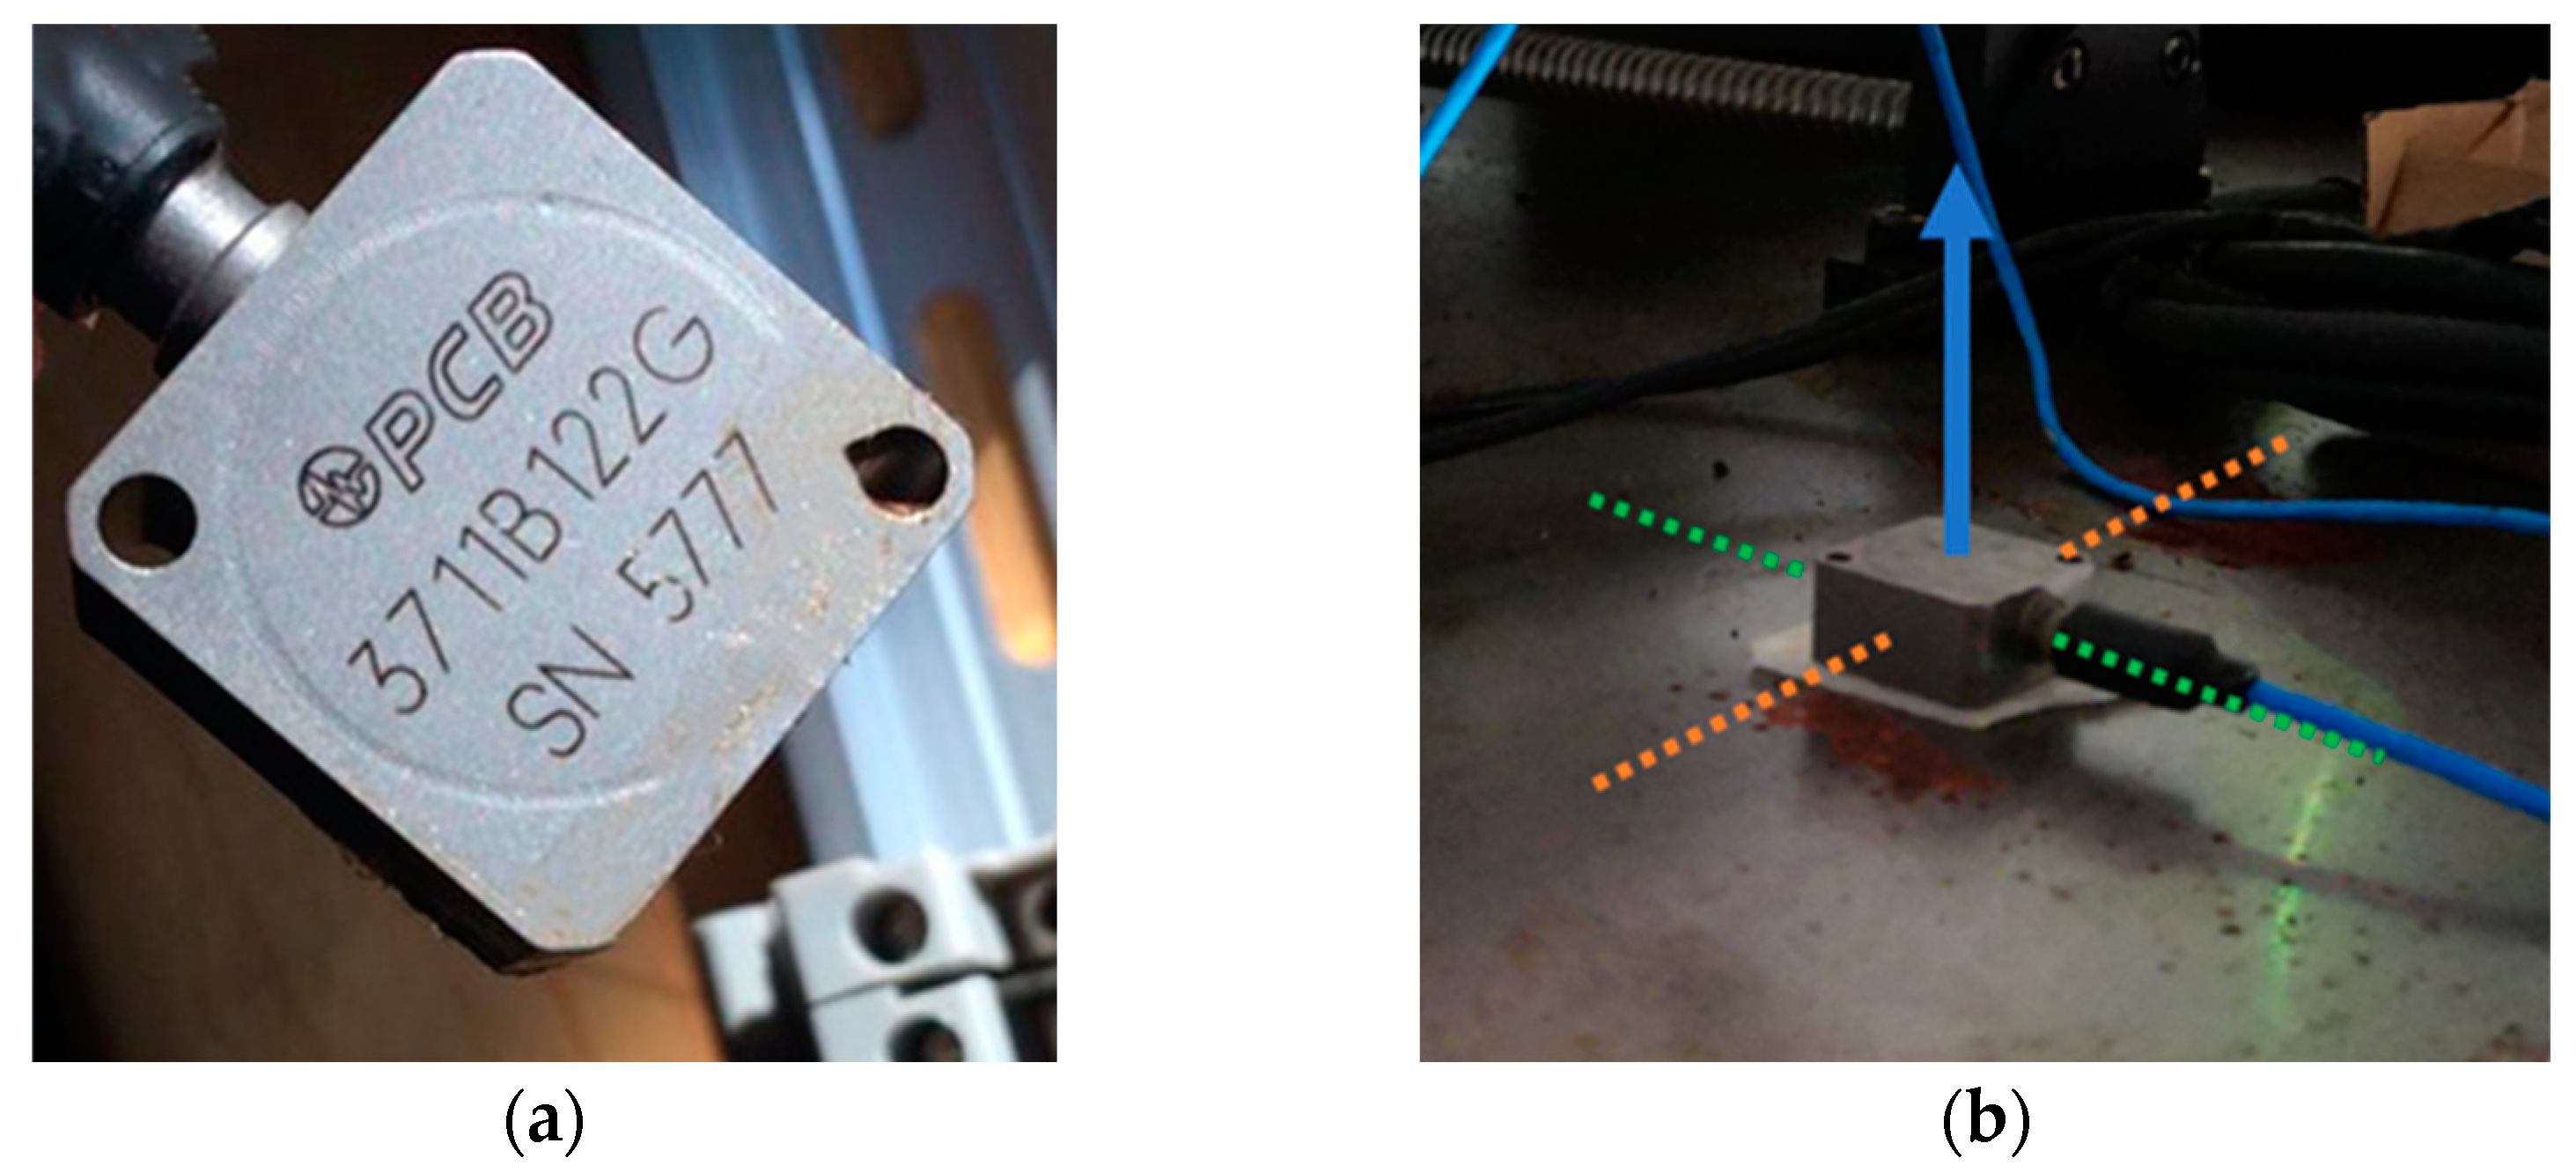
Acquisition of ship acceleration has high requirements for sensors. A high-precision acceleration sensor of PCB Piezotronics company in the laboratory was selected, the model is 3711B122G, as shown in Figure 4. This type of sensor has a built-in high-precision piezoelectric sensing device, and the sensing unit has high precision and strong interference ability. In addition, the sensor also has the characteristics of low noise, small temperature drift, and high sampling frequency. It is suitable for working in sea environments far from the coast and meets the requirements of ship acceleration collection.

3.2.2. Angle Measurement Module

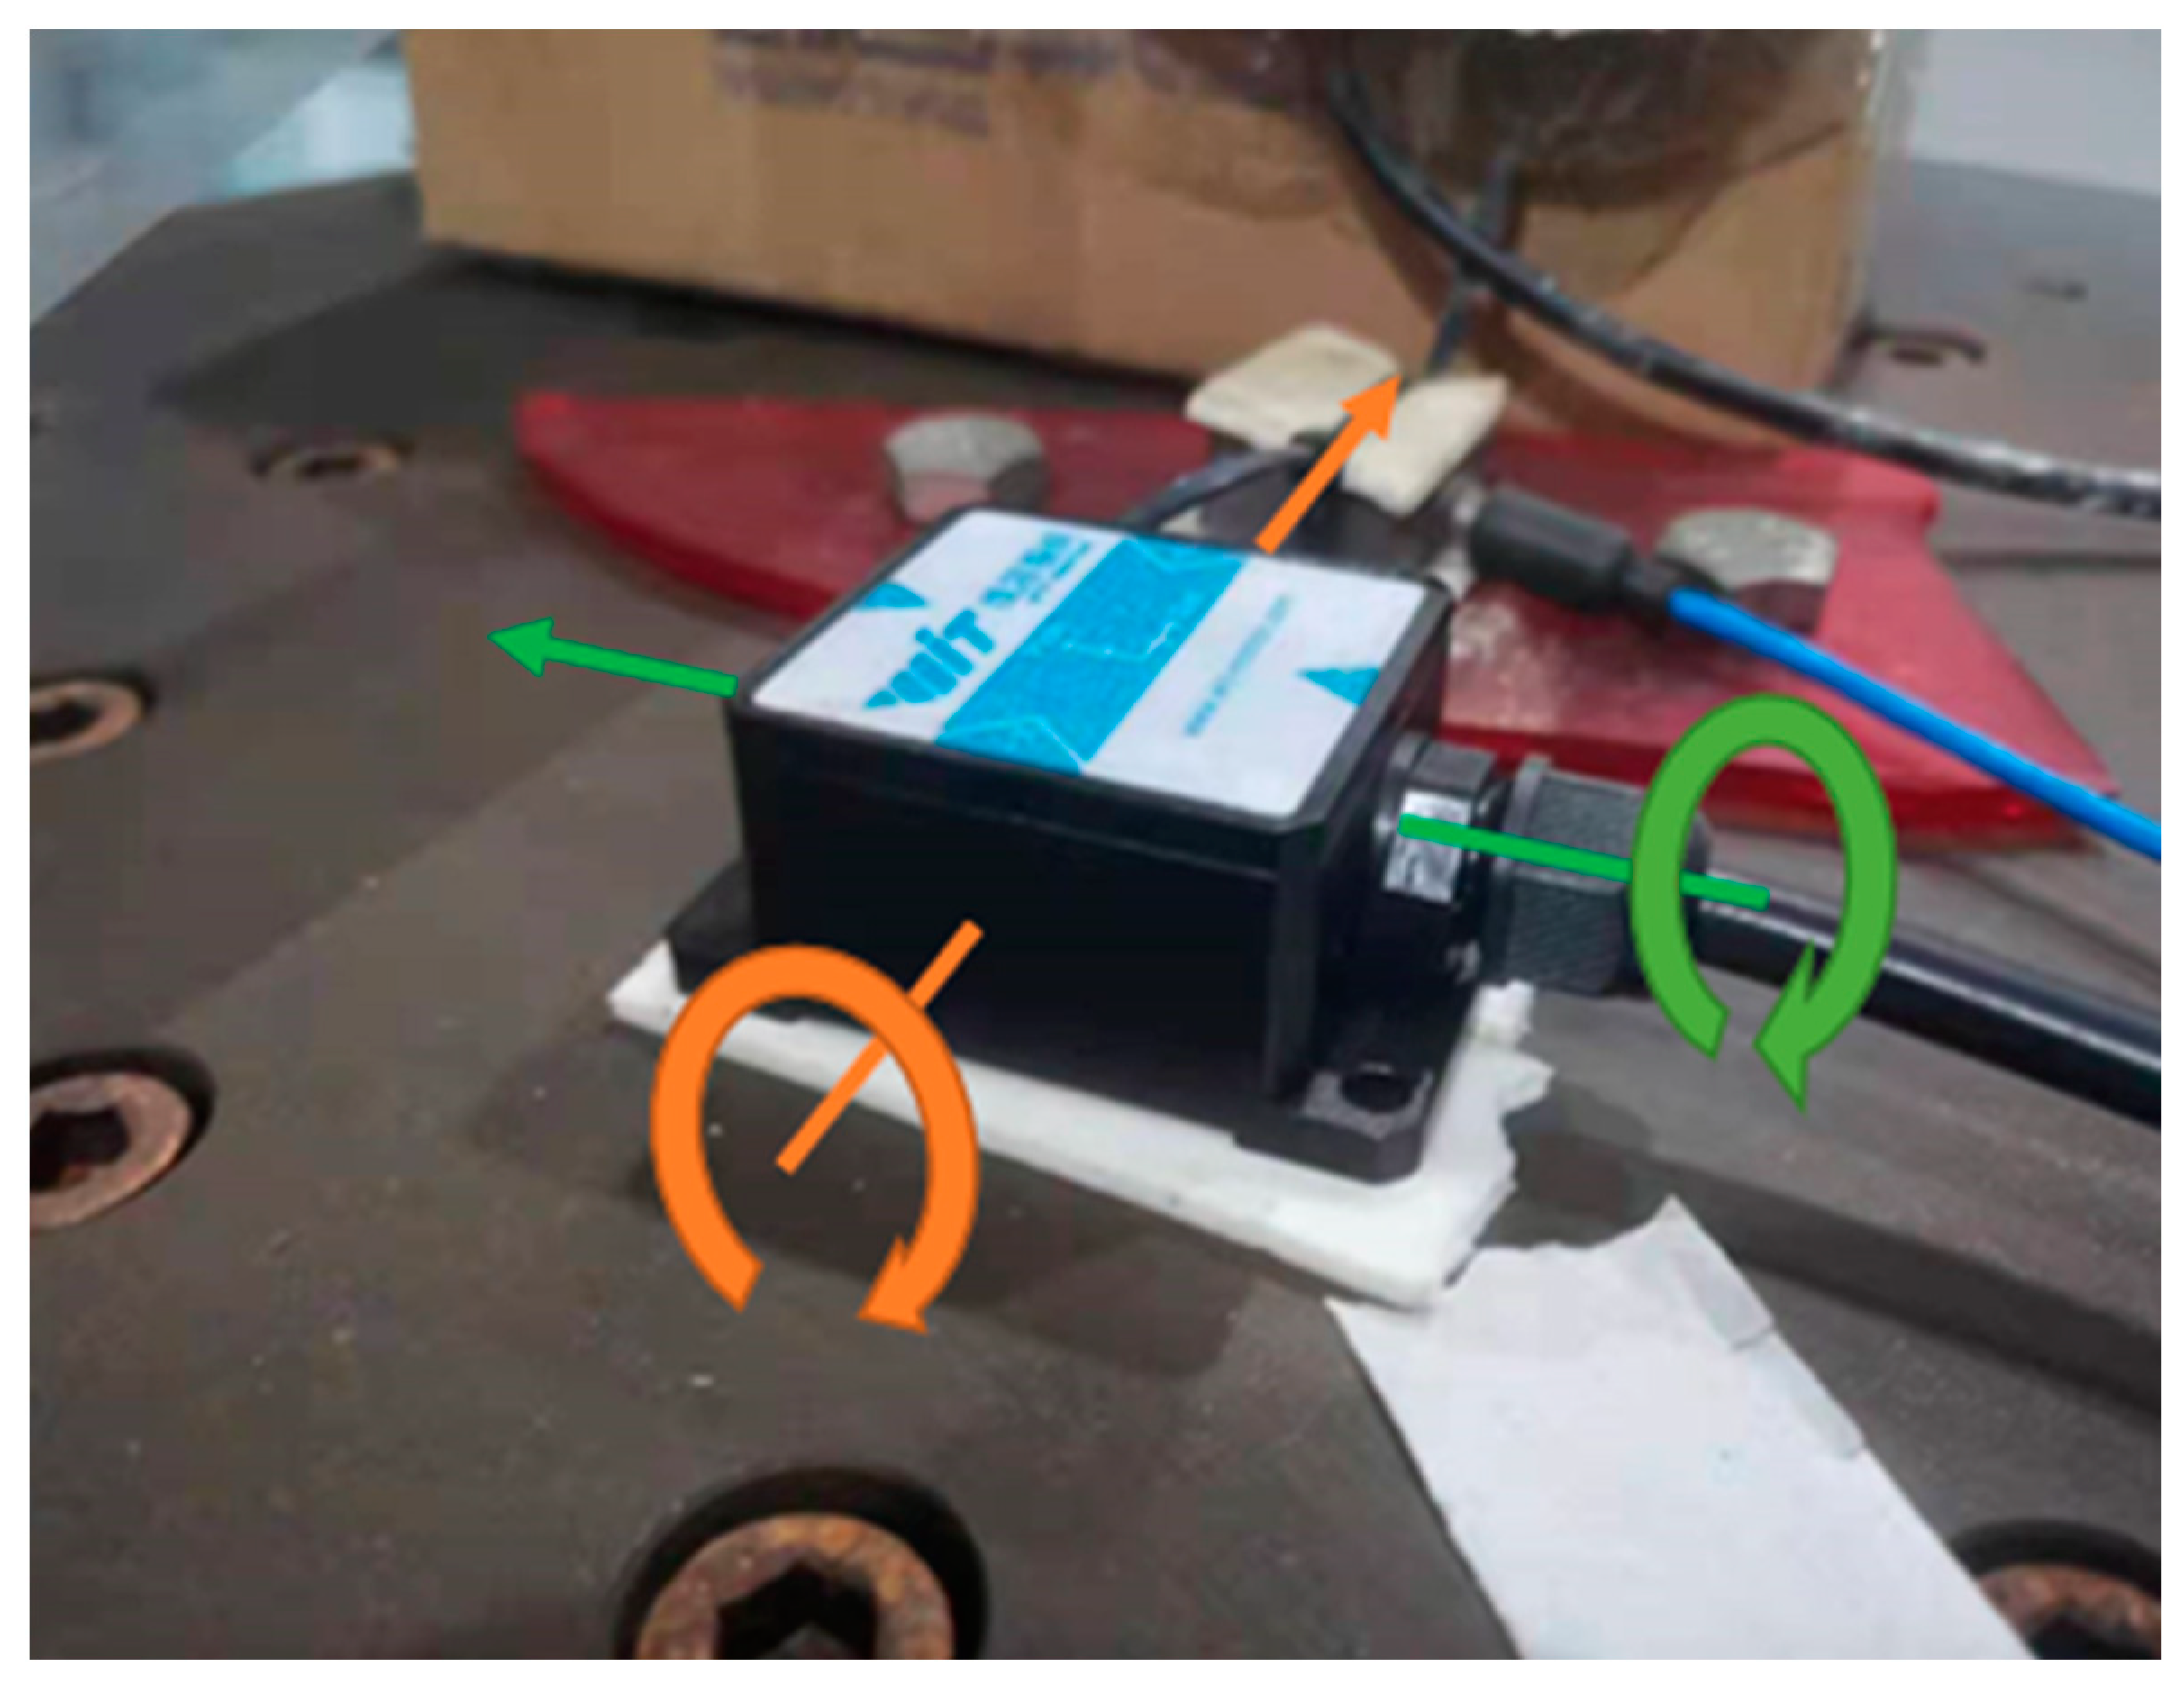
The measurement of the angle transformation on the two degrees of freedom of the ship’s roll and pitch uses the existing high-precision voltage-type inclination sensor (SINVT-232) in the laboratory. The gyroscope uses a MEMS high-precision module that can directly output the inclination. The inclination data can be viewed through the host computer or serial port tool. The SINVT series is a small-volume low-cost dual-axis voltage output inclination sensor with an output voltage of 0–5 V. With a built-in high-precision tilt unit and low power consumption, it is a high-precision tilt switch. The X-axis and Y-axis have two analog voltage outputs and the angle range is −90° to +90°. Its installation method and measurement direction are shown in Figure 5.

3.2.3. Acceleration Conditioning Module

Since the signal collected by the acceleration sensor has noise interference and the voltage value of the analog quantity is relatively small, the acceleration signal needs to be adjusted. In order to realize the accurate collection of weak acceleration signals, the system is equipped with a high-precision signal conditioner. First, the Kalman filter is used to perform Kal filter on the original acceleration signal to remove the noise interference in the original signal. Secondly, according to the range of the ship’s heave displacement and the upper and lower limits of the voltage value of the data collector, the acceleration signal can be scaled by different multiples, avoiding the flat top phenomenon caused by the excessive heave displacement of the ship.

3.2.4. Acceleration Quadratic Integral Module

Generally, the design of an integrator is mainly composed of an integrating circuit, an instrumentation amplifier, and an electronic switch. Because the amplifiers and capacitors used in the analog integration circuit are not ideal devices, there is an error between the actual integration circuit and the ideal integration circuit, and in severe cases, the integrator loses its integration effect on the signal. Based on this, this system adopts the digital integrator based on FPGA. First, the input signal is collected by A/D and then the level of the I/O port is switched. Second, the integral signal is processed, accumulated, and shifted in the digital circuit to obtain the integral value of the integrator; finally, the digital signal in the circuit is converted into an analog signal for control, which is convenient for the data collector to collect.

3.2.5. Data Acquisition Module

This system adopts a DT-7017S multi-function data acquisition card, which is based on the RJ-45 Ethernet port, supports standard Modbus/TCP protocol, and has a sampling accuracy of up to 16 bits. The acquisition card allows differential 16-channel analog voltage input, which can realize a synchronous acquisition of multi-channel analog quantities and can simultaneously acquire acceleration signals, velocity signals, displacement signals, and roll and pitch angles, meeting the acquisition requirements of ship motion. The data acquisition card is connected to the host computer, and the acquisition signal can be displayed in the host computer in real-time.

4. Experimental Results and Analysis

4.1. Case 1: Absolute Measurement of Laboratory Platform Heave Displacement

4.1.1. Experimental Platform Introduction

In order to test the effectiveness of the absolute measurement system, an experiment was carried out on the existing heave motion platform in the laboratory. The angle sensor has been widely used in the field of construction machinery at present, the technology is mature, and the result is reliable, so it will not be verified here. This case mainly verifies the absolute measurement results of the heave of the ship by the acceleration sensor.
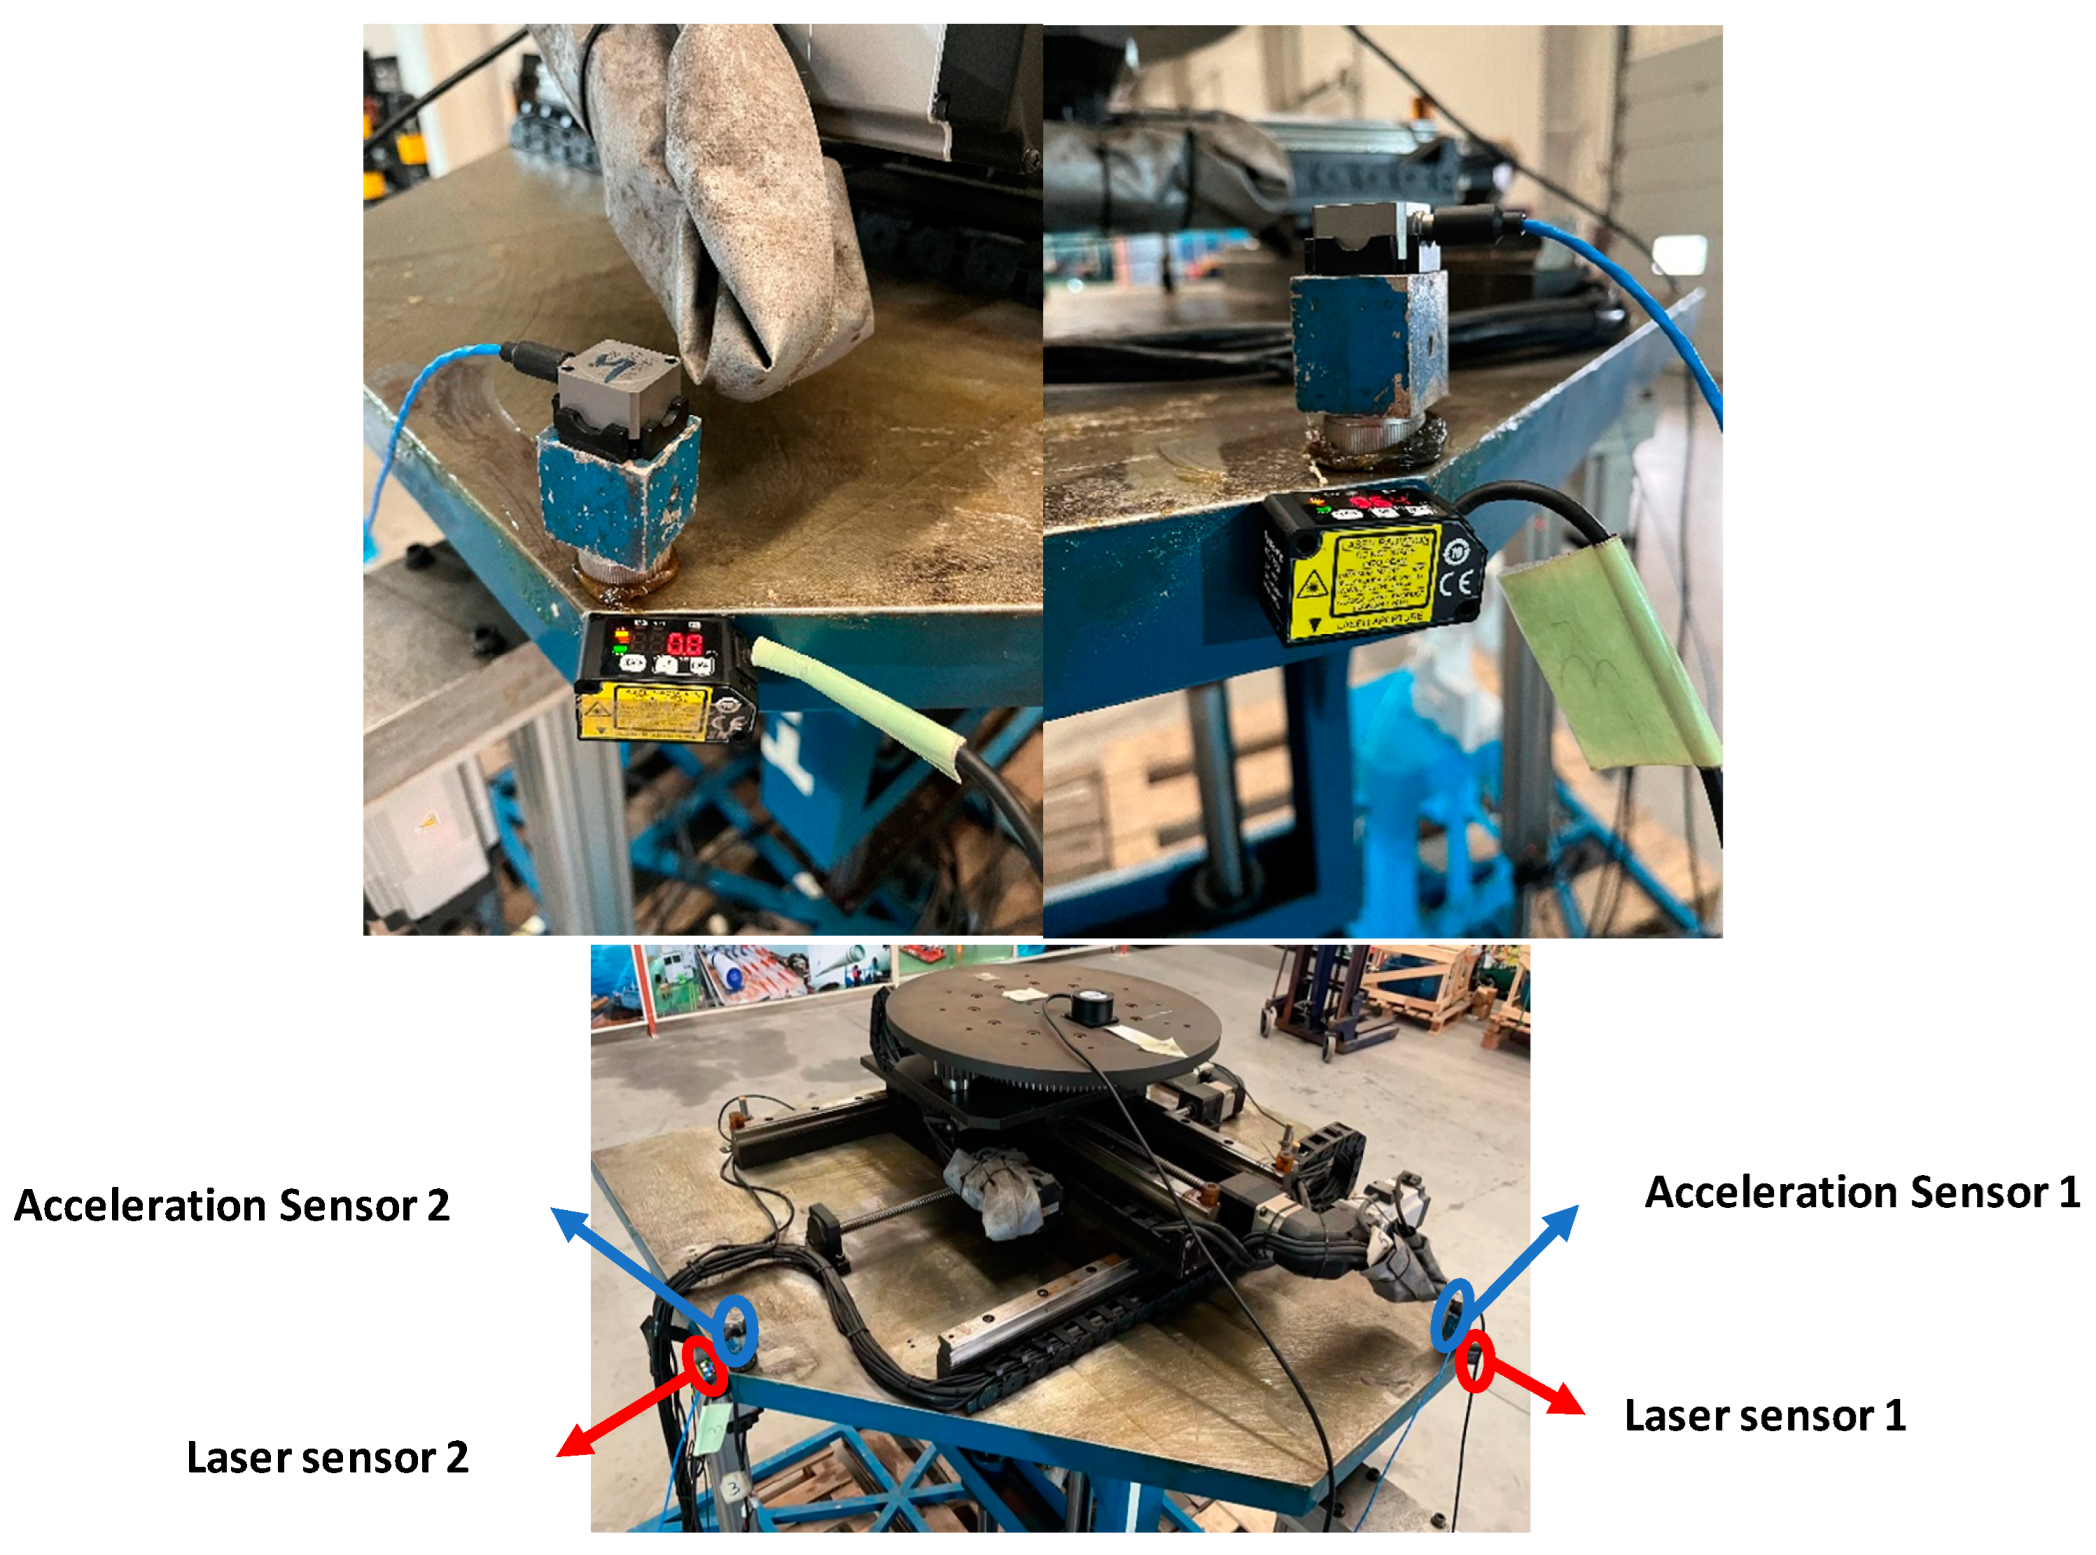
The experimental process is as follows: First, the heave motion platform was excited to move with different sine waves by controlling the heave motion platform. Second, two sets of laser sensors and acceleration sensors were used, which were, respectively, installed on the upper platform of the three-free motion platform, and the displacement error caused by the sensor size was negligible. Next, the acceleration sensor was filtered and processed in the time–frequency domain integration module to obtain the displacement signal. Then, the upper limit of the sampling frequency of the collector is 2.5 kHz, the sampling frequency was set to 200 Hz and the sampling time to 100 s, and the displacement signal of the laser sensor and the integrated displacement signal of the acceleration sensor were collected. Finally, the displacement waveform of the laser sensor and the integrated displacement waveform of the acceleration sensor were compared and analyzed in the host computer. The installation positions of the laser sensor and the acceleration sensor are shown in Figure 6, and the experimental flow chart is shown in Figure 7.

4.1.2. Experiment Settings

In order to approach the real motion of the ship as much as possible, the platform was set to perform six groups of sinusoidal function excitation motions with different amplitudes and frequencies. The amplitude of the function was in the range of [50–70 mm], and the frequency was in the range of [0.12–0.15 hz], as shown in Table 1.
The number of analog acquisition channels of the data collector corresponds to the sensor category, as shown in Table 2.
The data collector converts the analog signal collected by the sensor and the integrated analog signal into a digital signal and connects with the host computer.

4.1.3. Experimental Results and Analysis

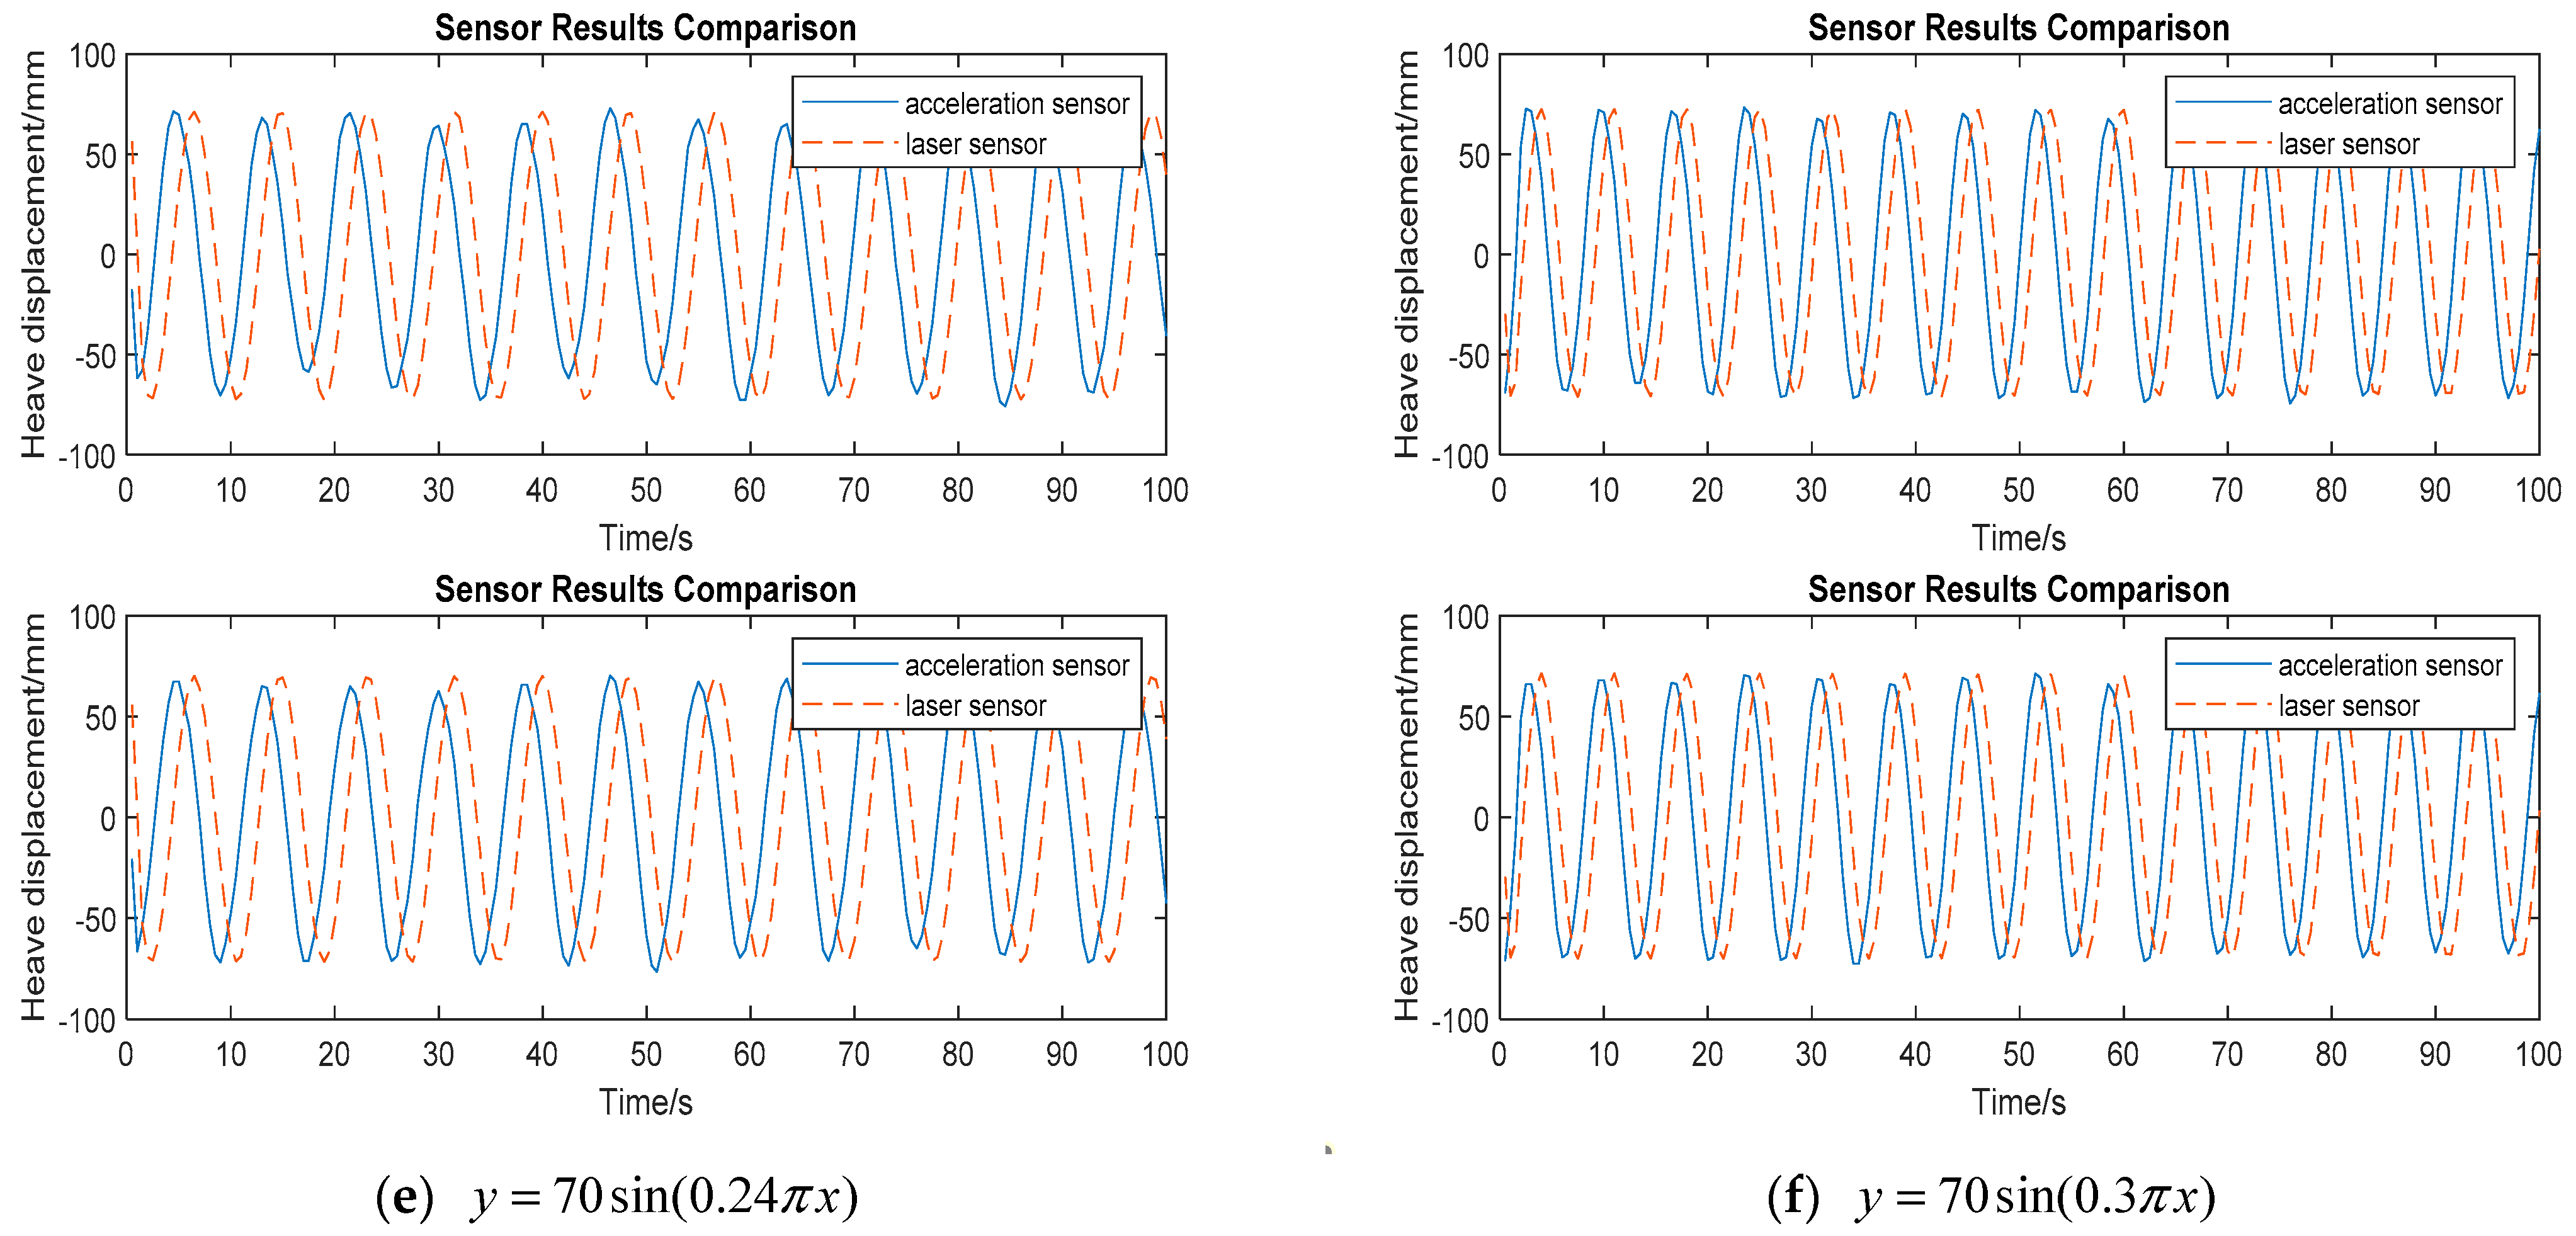
The laser sensor signal collected by the host computer was compared with the signal after acceleration time–frequency domain integration, and the comparison result is shown in Figure 8.
When the computer time signal of the upper computer was used as the time reference, it was found that the signal acquisition time of the laser sensor was basically the same as the actual movement time of the platform after measurement, so the displacement signal of the laser sensor was used as the absolute reference. Through the analysis of Figure 8, it can be found that the amplitude of the displacement signal collected by the absolute measurement system and the displacement signal collected by the laser sensor are very close, but there is a relatively obvious phase difference. The original analysis of its phase difference is as follows: The signal collected by the acceleration sensor was denoised by the Kalman filter of the conditioner, and the delay was generated by the filter calculation. After that, the signal was integrated in the time–frequency domain, and the integral calculation also generated a delay. These signal processing steps led to a delay in the final displacement signal compared with the acquisition time, causing the signal waveform after acceleration integration to lag behind the signal waveform of the laser sensor.
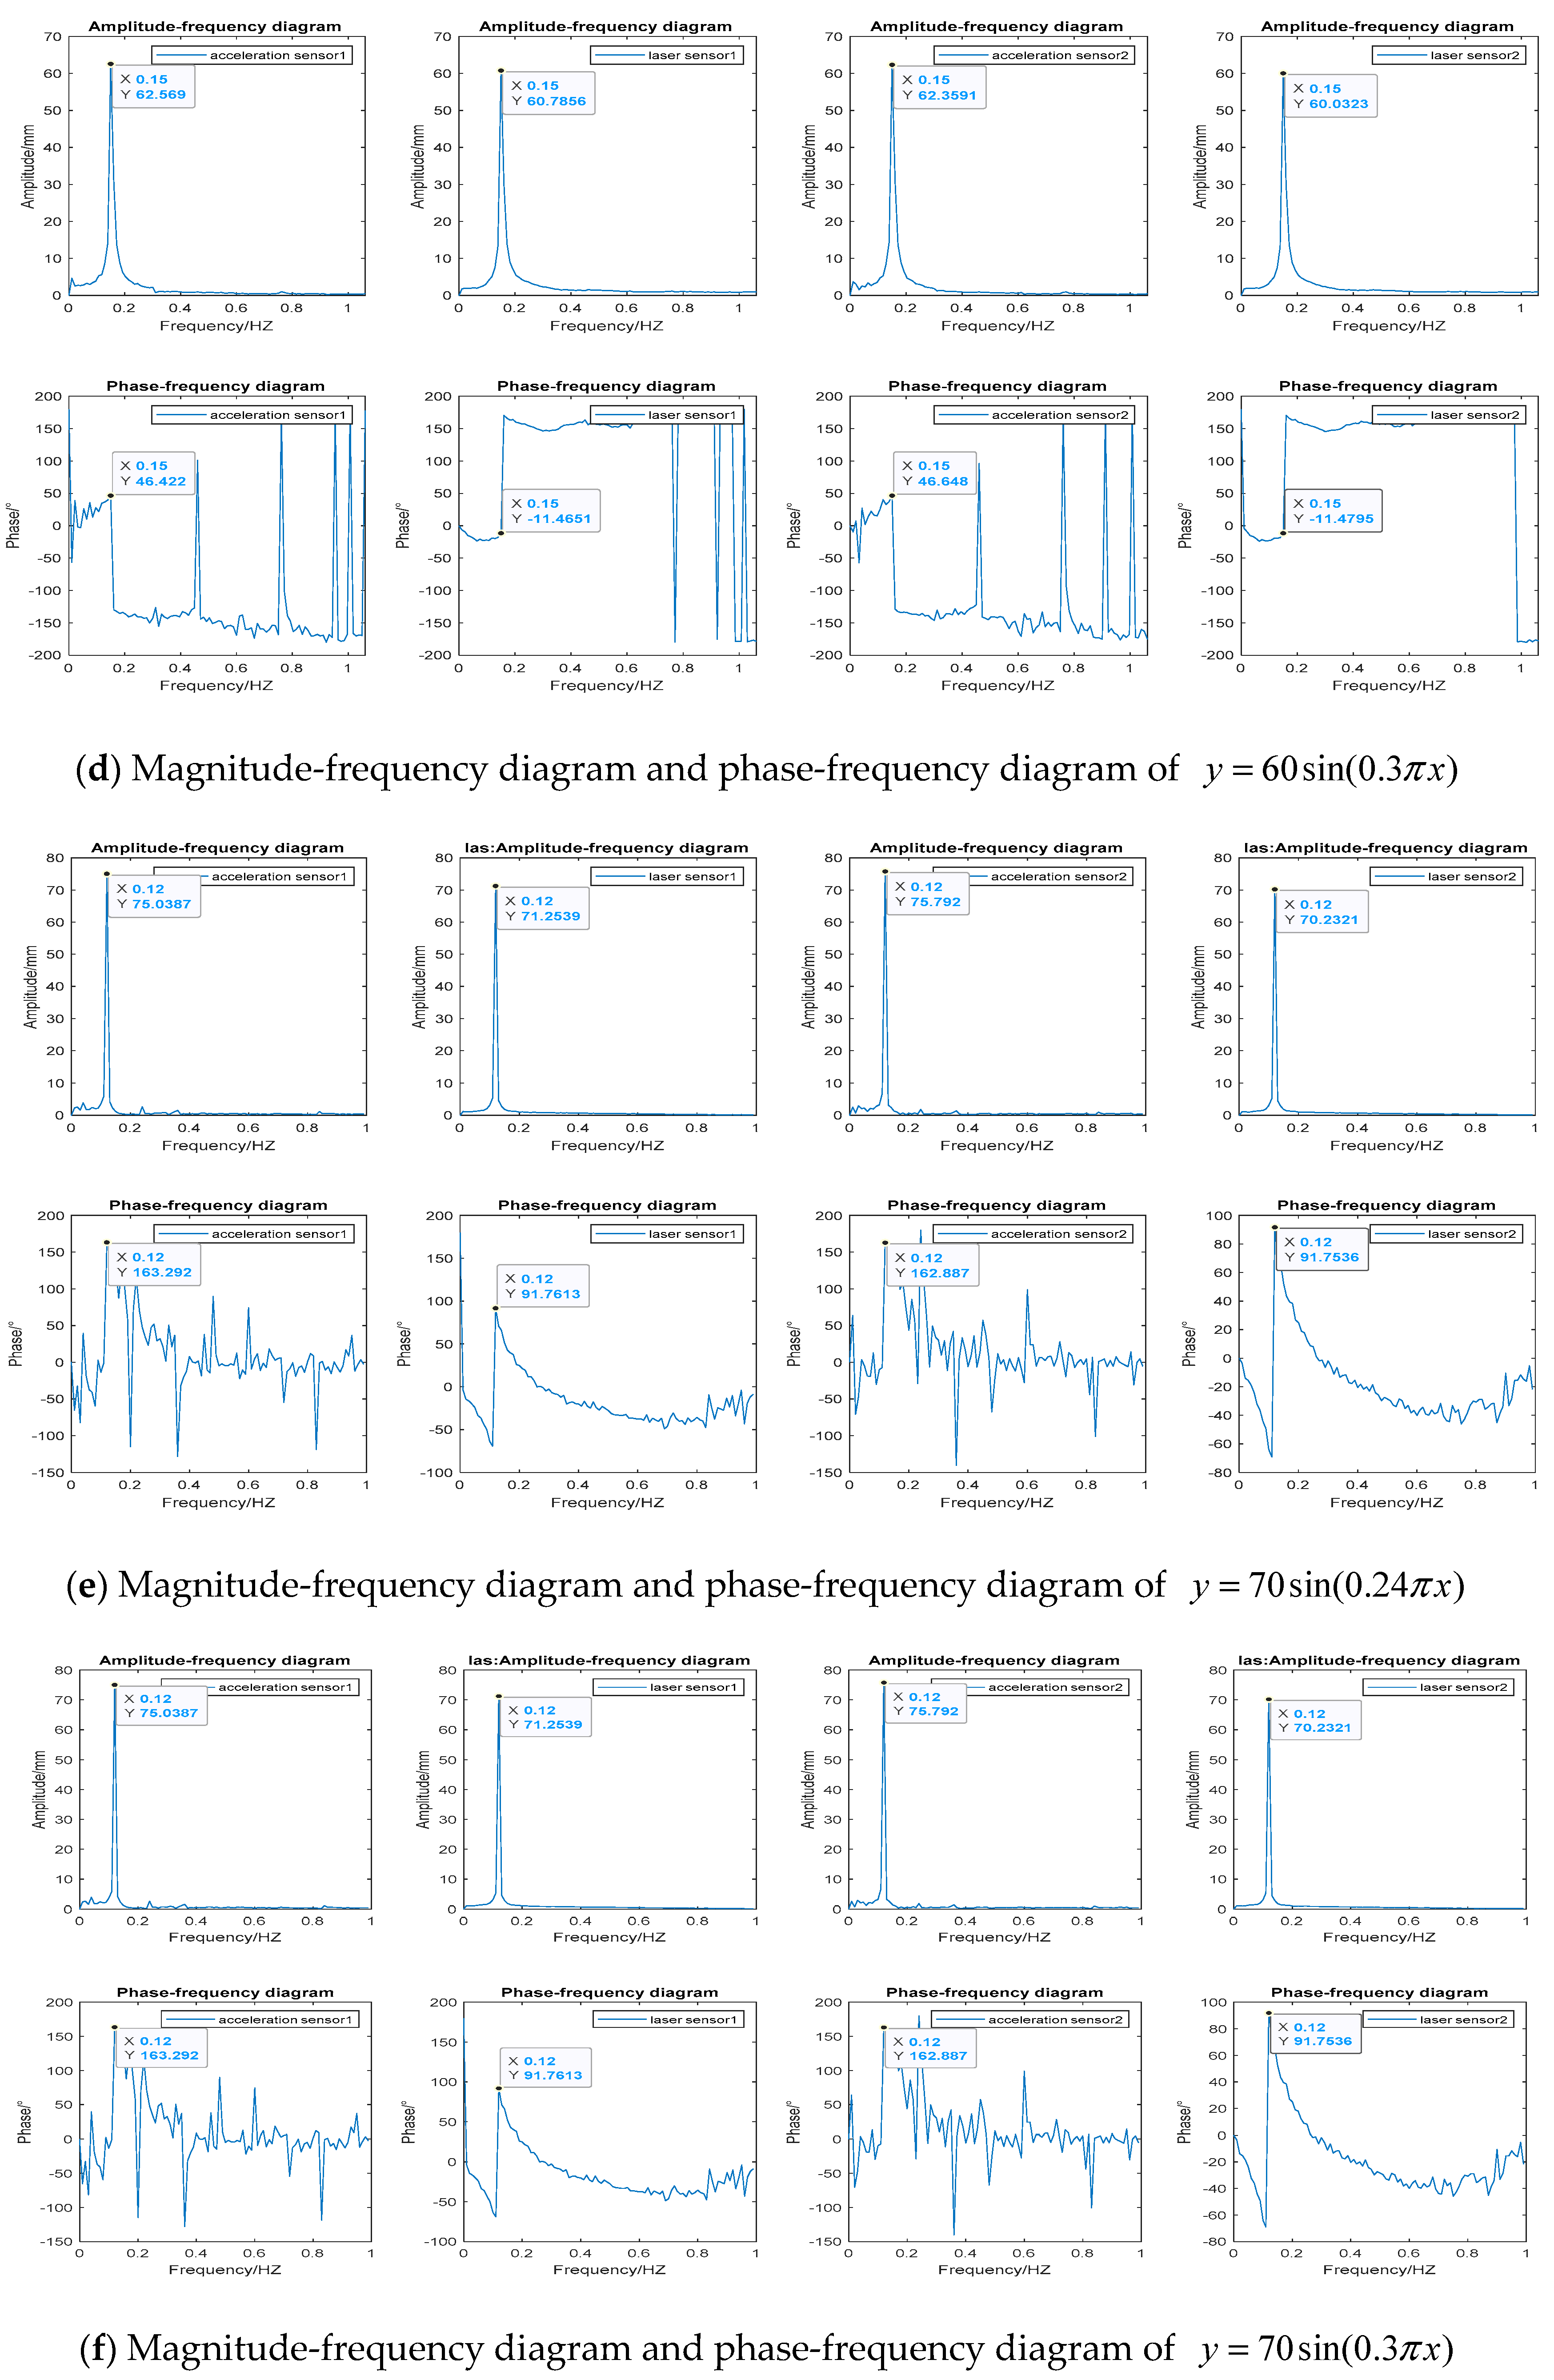
In order to obtain a waveform closer to the laser displacement signal, it is necessary to correct the displacement signal collected by the absolute measurement system. It can be seen from the experimental results that the amplitude of the displacement signal after integrating the acceleration signal and the displacement signal collected by the laser sensor were approximately equal, and the frequency was also approximately equal. Therefore, the discrete Fourier transform was used to solve the phase difference between the laser displacement signal and the acceleration integral displacement signal. The discrete Fourier transform results of displacement signals with different amplitudes are shown in Figure 9.
The amplitude–frequency characteristics and phase–frequency characteristics of the displacement signals of the laser sensor and the acceleration sensor after the discrete Fourier transform are shown in Table 3.
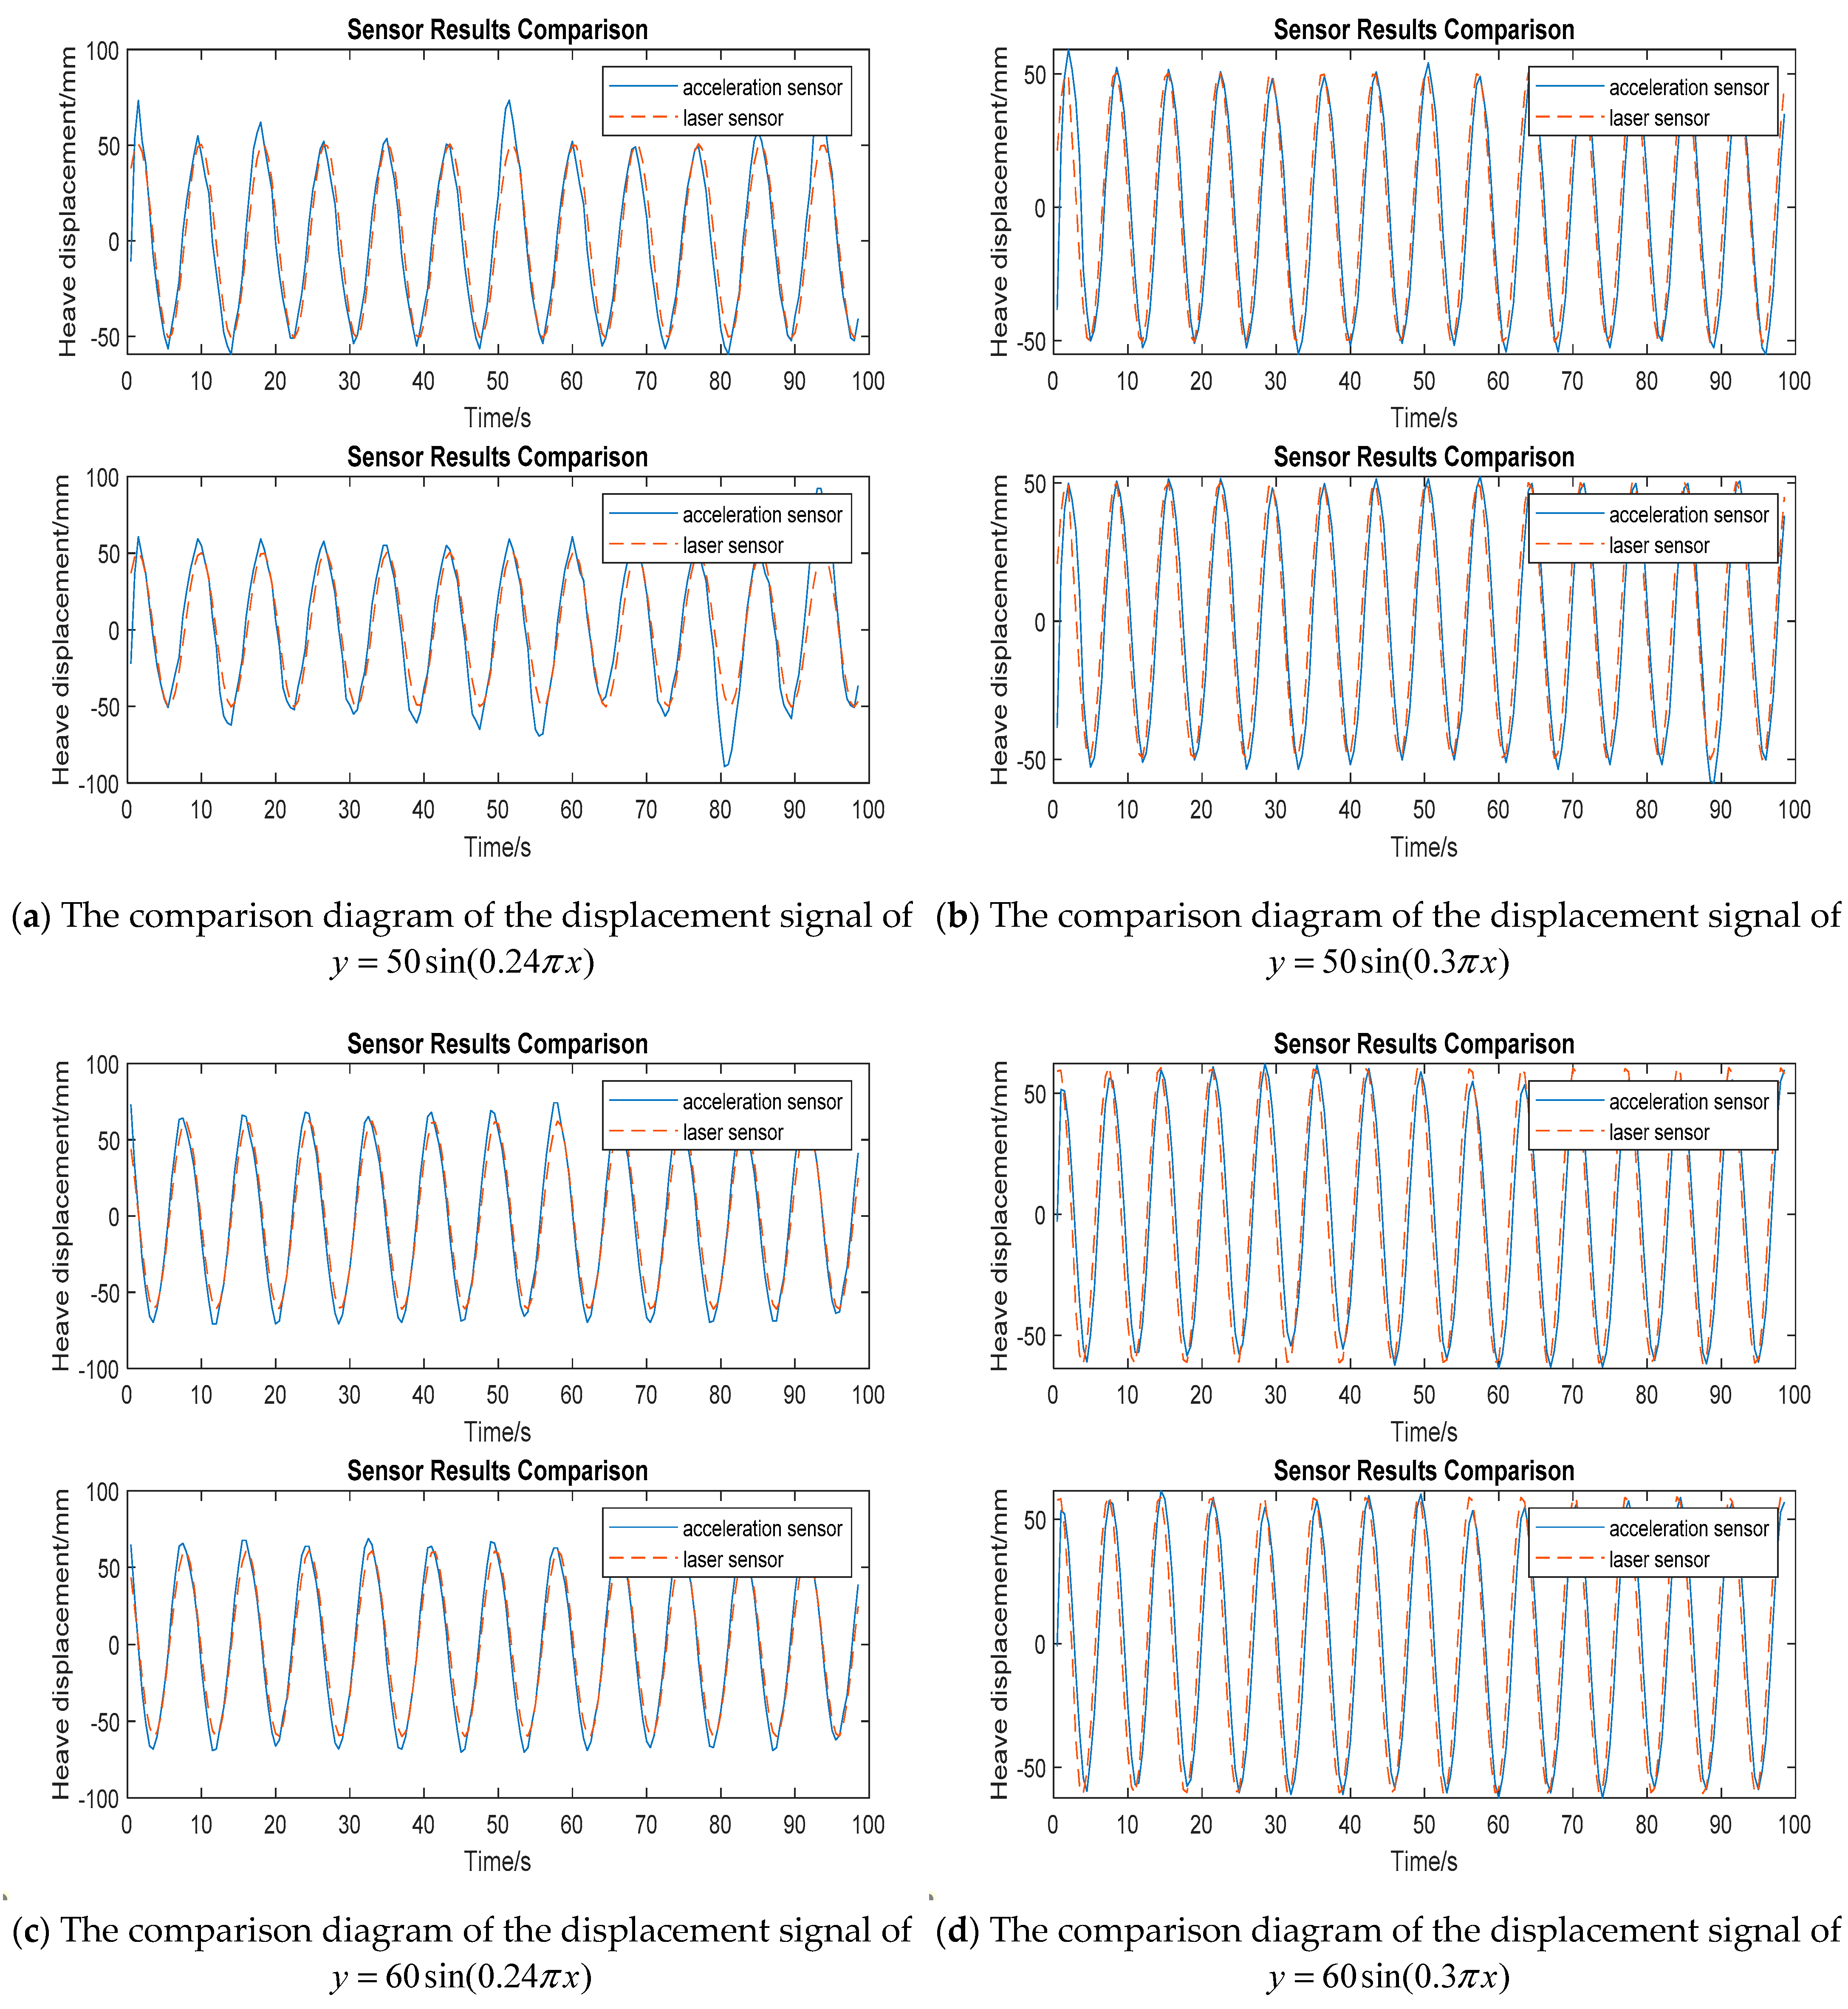
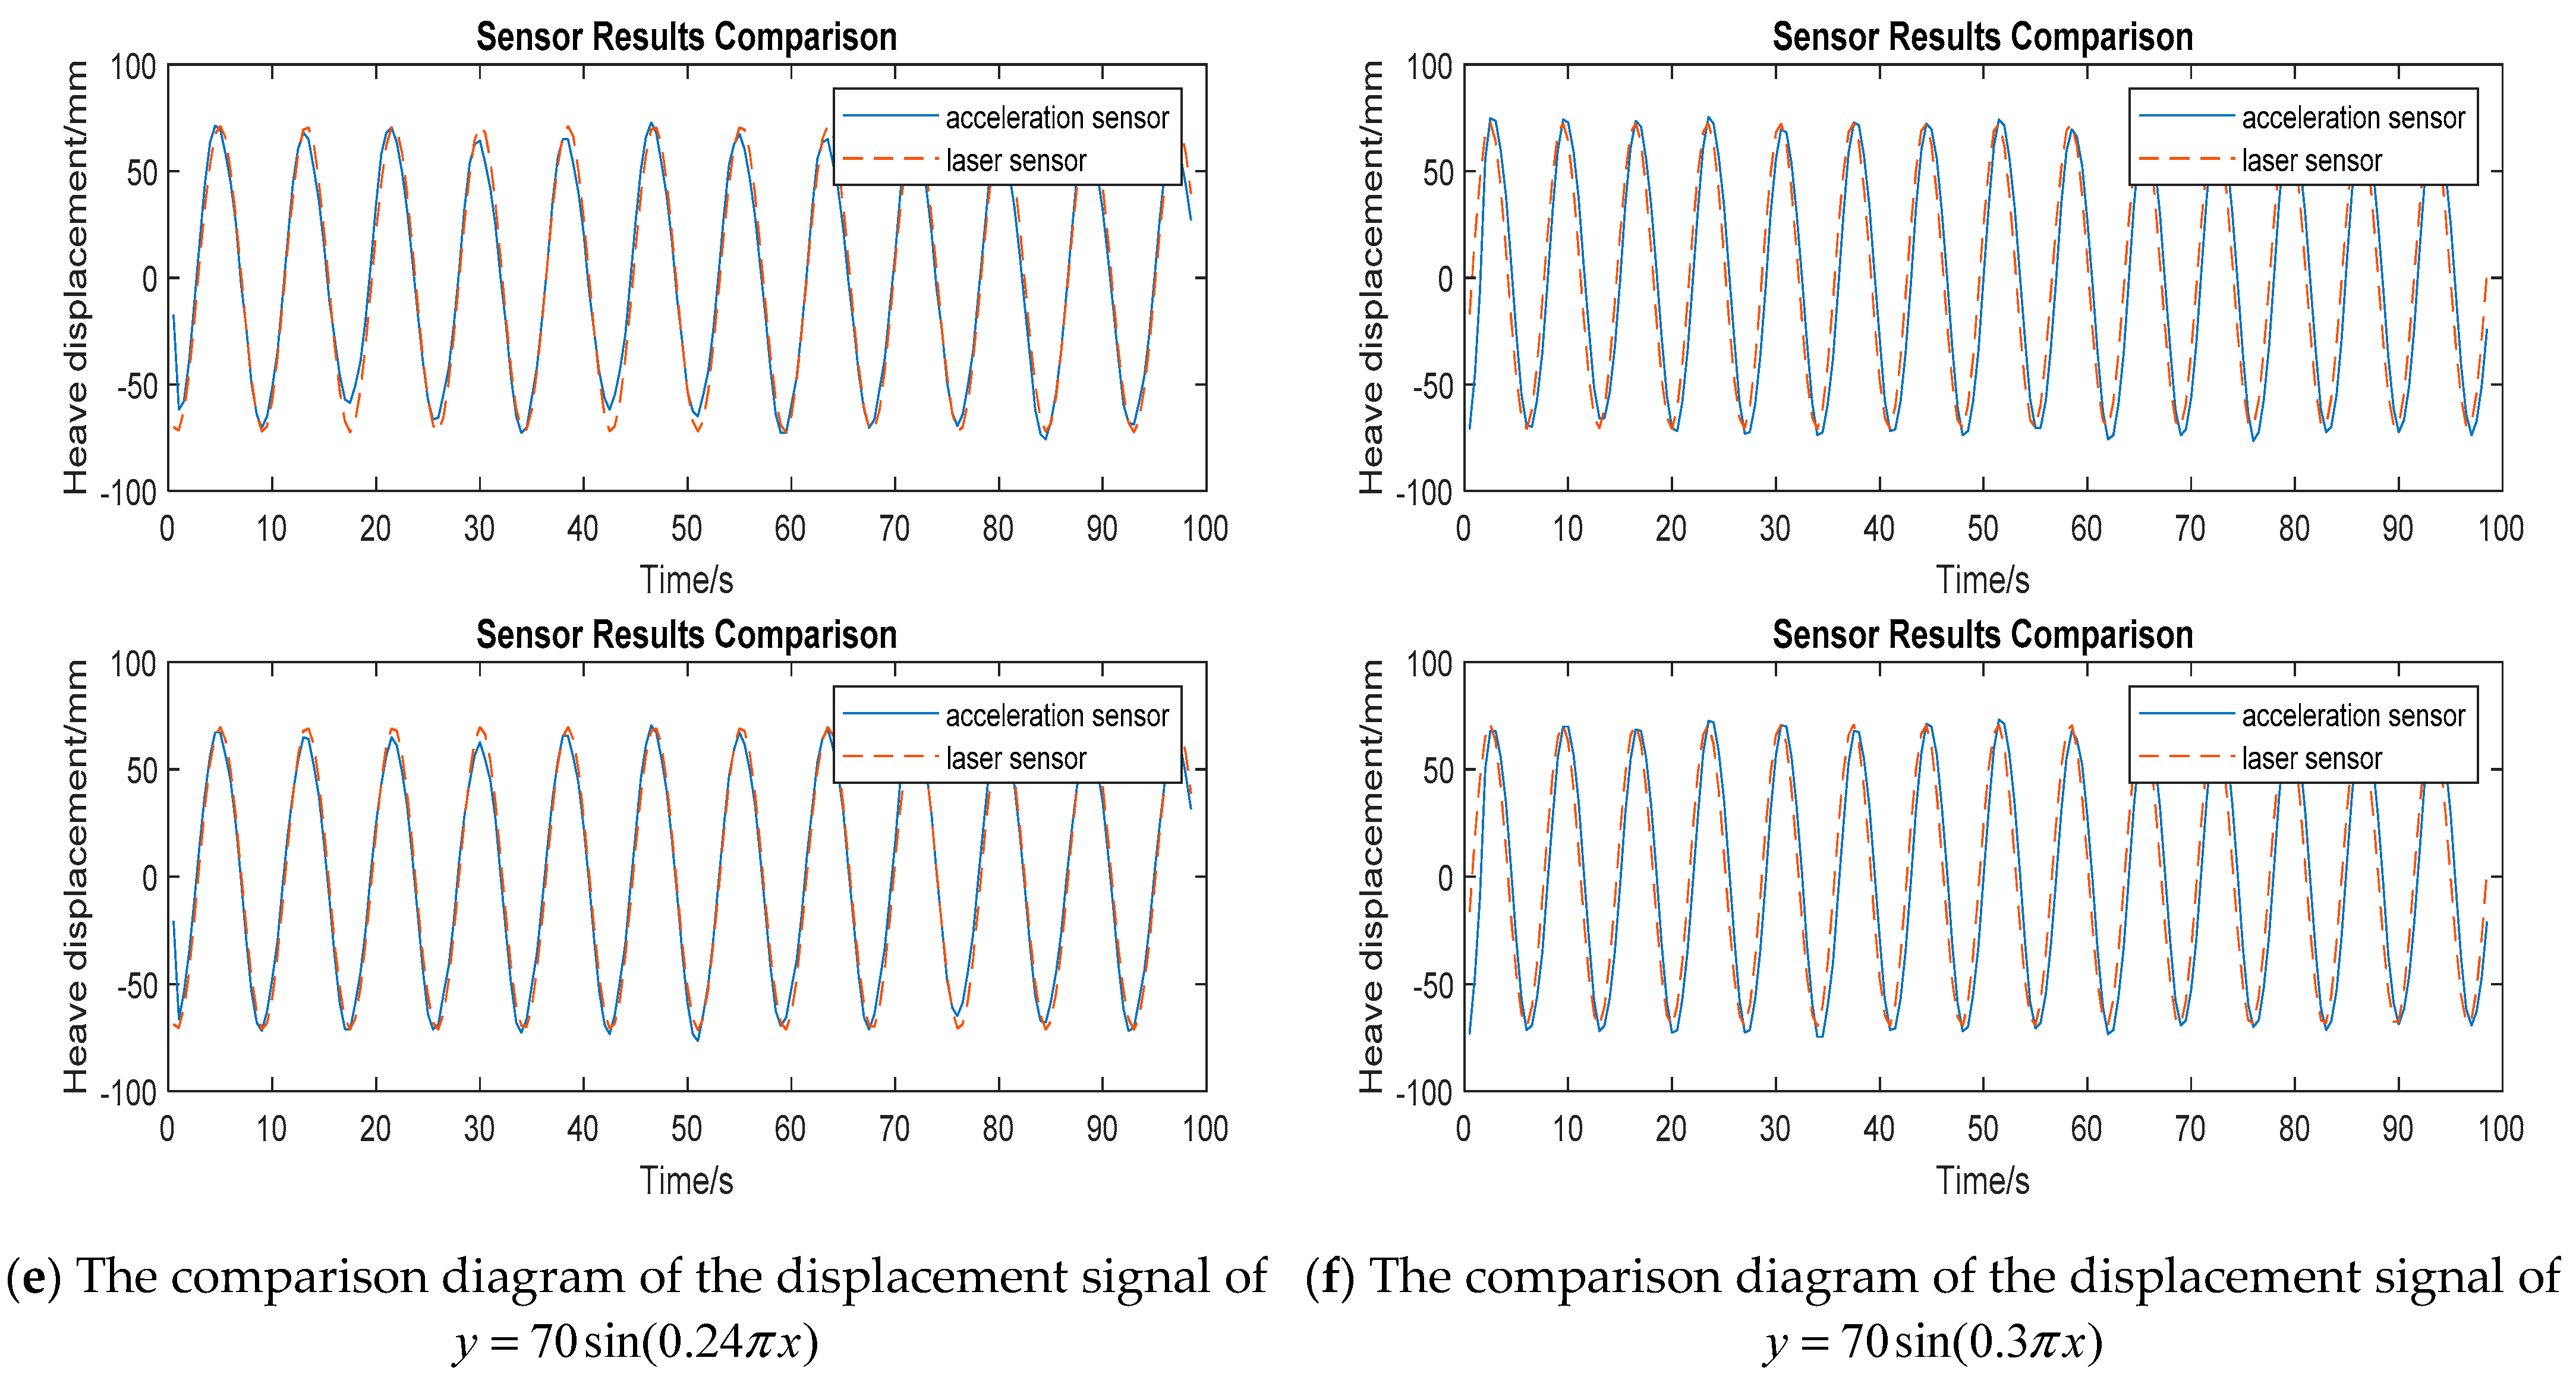
After calculation, the amplitude–frequency characteristics of the displacement signal of the laser sensor and the integrated displacement signal of the acceleration sensor were basically consistent, and the frequency and amplitude were basically consistent with the platform motion function. The amplitude of the integrated displacement signal is close to the set motion amplitude of the platform. When the displacement signal of the laser sensor is used as the evaluation standard, the amplitude errors of the integrated displacement signal of the acceleration sensor were as follows: [99.2%, 99.7%], [96.5%, 97.6%], [99.2%, 99.5%], [97.0%, 96.1%], [94.6%, 92.0%], and [96.6%, 96.8%]. From the phase–frequency characteristics, it was calculated that the phase difference was in the range of [57.88–76.85°], and the average phase difference was determined to be 66.52°. The displacement signal after acceleration integration was corrected by the average phase difference, and the signal after correcting the phase difference was compared with the laser displacement signal again. The result of the comparison is shown in Figure 10.
After calculation and analysis, it was found that when the platform performed heave displacements excited by sinusoidal functions of different amplitudes and periods, the errors of the absolute measurement system based on the acceleration sensor and the laser sensor were as follows: [4.2685 mm, 5.3184 mm], [4.7461 mm, 4.9408 mm], [4.0281 mm, 3.7590 mm], [6.4506 mm, 6.1796 mm], [3.2945 mm, 2.9519 mm], and [7.8092 mm, 7.8564 mm]. The experiment proves that the integrated displacement signal of the acceleration sensor was very close to the laser displacement signal, and the effective rate was [88.77–95.78%], which can effectively replace the relative measurement method to collect the ship heave displacement signal.

4.2. Case 2: Absolute Measurement of Ship Three-Degree-of-Freedom Motion

4.2.1. Ship Introduction

A catamaran with a length of 23 m, a width of 9 m, and a weight of 200 tons was selected as the experimental vessel in the port of Guangdong Province, China. When the ship traveled to an area of the sea far away from the coast, the absolute measurement system was used to collect the motion of the ship.

4.2.2. Experiment Settings

Three sets of acceleration sensors and one set of angle sensors were installed on the deck of the ship. Five channels of a data collector were used to collect data, which corresponded to the following:
  • Displacement data integrated by acceleration sensor 1;
  • Displacement data integrated by acceleration sensor 2;
  • Displacement data integrated by acceleration sensor 3;
  • Angle sensor pitch data;
  • Angle sensor roll data.
The sensor layout and installation location are shown in Figure 11.

4.2.3. Experimental Results and Analysis

The integrated displacement signals of the three groups of acceleration sensors, the roll signals, and the pitch signals of the angle sensors were collected by the collector, converted into digital signals, and displayed on the host computer. Some results are shown in Figure 12.
The results show that the absolute measurement system of ship motion based on the acceleration sensor can also effectively collect the heave displacement motion of the ship in actual working conditions, which meets the requirements of the ship motion acquisition system in wave compensation technology. Compared with the traditional absolute sensor, this system adopts the absolute measurement method, which can accurately measure the motion of the ship in the sea area without a static reference point, and it is more advantageous to collect the motion signal of the ship on the sea far away from the coast.

4.3. Experimental Discussion

After the discussion, it is concluded that by controlling the motion platform to perform multiple groups of sinusoidal motions in the laboratory, it can be verified that the time–frequency domain integration algorithm based on least squares can effectively integrate the acceleration signal into the displacement signal.
At the same time, the discrete Fourier transform is performed on the displacement signal collected by the laser sensor and the integrated displacement signal of the acceleration sensor. According to the amplitude–frequency characteristics of the two groups of sensors, the accuracy of the integral amplitude of the acceleration sensor is verified.
According to the phase–frequency characteristic, the phase difference of two sets of displacement signals is obtained. The effective rate after correcting the phase difference of the integral displacement signal of the acceleration sensor is [87.46–94.82%], which proves that the absolute measurement system of the ship motion based on the acceleration sensor can effectively replace the relative measurement method to collect the ship heave displacement signal.
Finally, combined with the angle sensor, the three-degree-of-freedom absolute measurement system of the ship is used on a ship far away from the coast, making it possible to accurately measure the ship’s motion in areas of the sea without a static reference point.

5. Conclusions

This paper proposes a time–frequency domain integration algorithm. Based on this algorithm, the acceleration sensor is used to collect the acceleration signal of the ship, and the acceleration signal is integrated after Kalman filtering. After the integration, the heave displacement signal of the ship is obtained. Combined with the angle sensor, the changes in the ship’s roll and pitch angles are collected. An absolute measurement system is formed by using an acceleration sensor and an angle sensor, which realizes the measurement of the ship’s motion in three degrees of freedom of heave, roll, and pitch.
The advantage of this method is that it can also accurately measure the three-freedom motion of the ship in areas without a static reference system. The ship movement signals collected on the sea far away from the coast can ensure validity and accuracy and improve the safety of ocean transportation of wind power generation equipment. The disadvantage of this method is that due to the calculation of steps such as Kalman filtering to remove noise and time–frequency domain integration, the heave displacement signal obtained by acceleration integration is delayed, which is lagged compared with the real heave displacement.
In the present work, the system we built is based on the absolute measurement system of three acceleration sensors and one angle sensor. In future work, we will further arrange measuring points from multiple locations of the ship to collect acceleration signals and displacement signals from as many places as possible. At the same time, we will add more types of absolute measurement sensors, fusion vision sensors, and deep-learning vision algorithms. When arranging multiple vision sensors at the edge of the ship, the images collected by the vision sensors should include the ship’s deck plane and sea level. According to the transformation of the pixel coordinates of the ship plane and the pixel coordinates of the coastline, the scale between the pixel and the real length is calculated, the pixel change is converted into the heave of the ship, and the sensor signals are fused from multiple dimensions.
Secondly, in view of the delay phenomenon generated by the integration step, we will predict the ship’s motion and predict the waveform of the response time according to the inherent delay of the system hardware. At the same time, in order to accurately predict the waveform of the ship in a short time step, it will focus on function fitting and neural network technology.

Author Contributions

Conceptualization, C.H. and X.H.; methodology, C.H.; software, C.H.; writing—original draft preparation, C.H.; writing—review and editing, X.H.; supervision, X.H. All authors have read and agreed to the published version of the manuscript.

Funding

This research was funded by the National Natural Science Foundation of China, grant number 31300783.

Institutional Review Board Statement

Not applicable.

Informed Consent Statement

Not applicable.

Data Availability Statement

The original data contributions presented in the study are included in the article; further inquiries can be directed to the corresponding authors.

Conflicts of Interest

The authors declare no conflict of interest.

References

  1. Winter, N. Renewables 2022 Global Status Report United States of America Factsheet, REN21. France. 2022. Available online: https://policycommons.net/artifacts/2471826/renewables-2022-global-status-report-united-states-of-america-factsheet/3493831/ (accessed on 21 March 2023).
  2. Thomsen, K. Offshore Wind: A Comprehensive Guide to Successful Offshore Wind Farm Installation; Academic Press: Cambridge, MA, USA, 2014; ISBN 0124095941. [Google Scholar]
  3. Dongyang, W.; Yuchen, P.; Zupeng, Z.; Bo, W. Design and Kinematic Performance Analysis of a Ship Shell Plate Spraying Manipulator. Proc. Inst. Mech. Eng. C J. Mech. Eng. Sci. 2023, 09544062221141331. [Google Scholar] [CrossRef]
  4. Taz Ul Mulk, M.; Falzarano, J. Complete Six-Degrees-of-Freedom Nonlinear Ship Rolling Motion. J. Offshore Mech. Arct. Eng. 1994, 25, 191–201. [Google Scholar] [CrossRef]
  5. Ke, Z.; Zhang, Y. Heat Transfer Enhancement in a Rectangular Channel with Flow-Induced Pitching, Heaving or Surging of an Airfoil. Int. Commun. Heat Mass Transf. 2023, 142, 106657. [Google Scholar] [CrossRef]
  6. Paulling, J.R.; Rosenberg, R.M. On Unstable Ship Motions Resulting from Nonlinear Coupling. J. Ship Res. 1959, 3, 36–46. [Google Scholar] [CrossRef]
  7. Xiang, W.; Bing, H.; Lu, L.; Shun-ying, J. Discrete element analysis of ice resistances and six-degrees-of-freedom motion response of ships in ice-covered regions. Eng. Mech. 2023, 40, 243–256. [Google Scholar]
  8. Yang, G.; Liang, H.; Wu, C. Deflection and Inclination Measuring System for Floating Dock Based on Wireless Networks. Ocean Eng. 2013, 69, 1–8. [Google Scholar] [CrossRef]
  9. Kim, Y.-K.; Kim, Y.; Jung, Y.S.; Jang, I.G.; Kim, K.-S.; Kim, S.; Kwak, B.M. Developing Accurate Long-Distance 6-DOF Motion Detection with One-Dimensional Laser Sensors: Three-Beam Detection System. IEEE Trans. Ind. Electron. 2012, 60, 3386–3395. [Google Scholar]
  10. Sanden, S.; Pawlus, W.; Hovland, G. Real-Time 6-DOF Vessel-to-Vessel Motion Compensation Using Laser Tracker. In Proceedings of the OCEANS 2017-Aberdeen, Aberdeen, UK, 19–22 June 2017; IEEE: Piscataway, NJ, USA, 2017; pp. 1–9. [Google Scholar]
  11. Abankwa, N.O.; Johnston, S.J.; Scott, M.; Cox, S.J. Ship Motion Measurement Using an Inertial Measurement Unit. In Proceedings of the 2015 IEEE 2nd World Forum on Internet of Things (WF-IoT), Milan, Italy, 14–16 December 2015; IEEE: Piscataway, NJ, USA, 2015; pp. 375–380. [Google Scholar]
  12. Godhavn, J.-M. High Quality Heave Measurements Based on GPS RTK and Accelerometer Technology. In Proceedings of the OCEANS 2000 MTS/IEEE Conference and Exhibition. Conference Proceedings (Cat. No. 00CH37158), Providence, RI, USA, 11–14 September 2000; IEEE: Piscataway, NJ, USA, 2000; Volume 1, pp. 309–314. [Google Scholar]
  13. Mak, B.; Düz, B. Ship as a Wave Buoy: Estimating Relative Wave Direction from in-Service Ship Motion Measurements Using Machine Learning. In Proceedings of the International Conference on Offshore Mechanics and Arctic Engineering, Glasgow, UK, 9–14 June 2019; American Society of Mechanical Engineers: New York, NY, USA, 2019; Volume 58882, p. V009T13A043. [Google Scholar]
  14. Tannuri, E.A.; Sparano, J.V.; Simos, A.N.; Da Cruz, J.J. Estimating Directional Wave Spectrum Based on Stationary Ship Motion Measurements. Appl. Ocean. Res. 2003, 25, 243–261. [Google Scholar] [CrossRef]
  15. Pennino, S.; Angrisano, A.; Corte, V.D.; Ferraioli, G.; Gaglione, S.; Innac, A.; Martellato, E.; Palumbo, P.; Piscopo, V.; Rotundi, A. Sea State Monitoring by Ship Motion Measurements Onboard a Research Ship in the Antarctic Waters. J. Mar. Sci. Eng. 2021, 9, 64. [Google Scholar] [CrossRef]
  16. Xu, J.; Haddara, M.R. Estimation of Wave-Induced Ship Hull Bending Moment from Ship Motion Measurements. Mar. Struct. 2001, 14, 593–610. [Google Scholar] [CrossRef]
  17. Gong, B.; Wang, S.; Li, S.; Li, X. Review of space relative navigation based on angles-only measurements. Astrodynamics 2023, 7, 131–152. [Google Scholar] [CrossRef]
  18. Pascoal, R.; Perera, L.P.; Soares, C.G. Estimation of Directional Sea Spectra from Ship Motions in Sea Trials. Ocean Eng. 2017, 132, 126–137. [Google Scholar] [CrossRef]
  19. Lu, L.-F.; Sasa, K.; Sasaki, W.; Terada, D.; Kano, T.; Mizojiri, T. Rough Wave Simulation and Validation Using Onboard Ship Motion Data in the Southern Hemisphere to Enhance Ship Weather Routing. Ocean Eng. 2017, 144, 61–77. [Google Scholar] [CrossRef]
  20. Duz, B.; Mak, B.; Hageman, R.; Grasso, N. Real Time Estimation of Local Wave Characteristics from Ship Motions Using Artificial Neural Networks. In Proceedings of the Practical Design of Ships and Other Floating Structures: Proceedings of the 14th International Symposium, PRADS 2019, Yokohama, Japan, 22–26 September 2019; Springer: Berlin/Heidelberg, Germany, 2021; Volume III 14, pp. 657–678. [Google Scholar]
  21. Wang, Y.; Soltani, M. Ship Attitude Prediction Based on Input Delay Neural Network and Measurements of Gyroscopes. In Proceedings of the 2017 American Control Conference (ACC), Seattle, WA, USA, 24–26 May 2017; IEEE: New York, NY, USA, 2017; pp. 4901–4907. [Google Scholar]
  22. Ware, C.; Trites, A.W.; Rosen, D.A.S.; Potvin, J. Averaged Propulsive Body Acceleration (APBA) Can Be Calculated from Biologging Tags That Incorporate Gyroscopes and Accelerometers to Estimate Swimming Speed, Hydrodynamic Drag and Energy Expenditure for Steller Sea Lions. PLoS ONE 2016, 11, e0157326. [Google Scholar] [CrossRef]
  23. Ten Pas, S. Vessel Motion Sensing: With Absolute Reference Measurement. 2017. Available online: https://repository.tudelft.nl/islandora/object/uuid:bfb117d5-abe6-49c0-8645-9ad250930c25?collection=education (accessed on 21 March 2023).
  24. Naaijen, P.; Van Oosten, K.; Roozen, K.; van’t Veer, R. Validation of a Deterministic Wave and Ship Motion Prediction System. In Proceedings of the International Conference on Offshore Mechanics and Arctic Engineering, Madrid, Spain, 17–22 June 2018; American Society of Mechanical Engineers: New York, NY, USA, 2018; Volume 51272, p. V07BT06A032. [Google Scholar]
  25. Wang, Y.; Qin, Y.; Chen, X.; Tang, Q.; Zhang, T.; Wu, L. Absolute Inductive Angular Displacement Sensor for Position Detection of YRT Turntable Bearing. IEEE Trans. Ind. Electron. 2022, 69, 10644–10655. [Google Scholar] [CrossRef]
  26. Paredes, F.; Herrojo, C.; Moya, A.; Berenguel Alonso, M.; Gonzalez, D.; Bruguera, P.; Delgado Simao, C.; Martín, F. Electromagnetic Encoders Screen-Printed on Rubber Belts for Absolute Measurement of Position and Velocity. Sensors 2022, 22, 2044. [Google Scholar] [CrossRef]
  27. Wu, L.; Tong, P.; Wang, X.; Su, R. An Absolute Linear Displacement Sensor Based on Orthogonal Dual Traveling Wave Magnetic Field. IEEE Sens. J. 2022, 22, 6019–6026. [Google Scholar] [CrossRef]
  28. Hashmi, S.Z.; Butler, B.; Johnson, D.; Wun, K.; Sherman, A.; Summers, H.; Stover, M. Accuracy of Radiographic Displacement Measurement in a Pelvic Ring Injury Model. J. Am. Acad. Orthop. Surg. 2022, 30, e173–e181. [Google Scholar] [CrossRef]
  29. Cho, J.; Lee, J.; Lee, B. Application of UAV Photogrammetry to Slope-Displacement Measurement. KSCE J. Civ. Eng. 2022, 26, 1904–1913. [Google Scholar] [CrossRef]
  30. Yu, H.; Wan, Q.; Zhao, C.; Han, Q.; Mu, Z. Error Compensation for Low-Density Circular Gratings Based on Linear Image-Type Angular Displacement Measurements. IEEE Trans. Ind. Electron. 2022, 69, 13736–13743. [Google Scholar] [CrossRef]
  31. Thong, Y.K.; Woolfson, M.S.; Crowe, J.A.; Hayes-Gill, B.R.; Jones, D.A. Numerical Double Integration of Acceleration Measurements in Noise. Measurement 2004, 36, 73–92. [Google Scholar] [CrossRef]
  32. Zheng, W.; Dan, D.; Cheng, W.; Xia, Y. Real-Time Dynamic Displacement Monitoring with Double Integration of Acceleration Based on Recursive Least Squares Method. Measurement 2019, 141, 460–471. [Google Scholar] [CrossRef]
  33. Guan, J.; Yan, S.; Jin, J.-M. An Accurate and Efficient Finite Element-Boundary Integral Method with GPU Acceleration for 3-D Electromagnetic Analysis. IEEE Trans. Antennas Propag. 2014, 62, 6325–6336. [Google Scholar] [CrossRef]
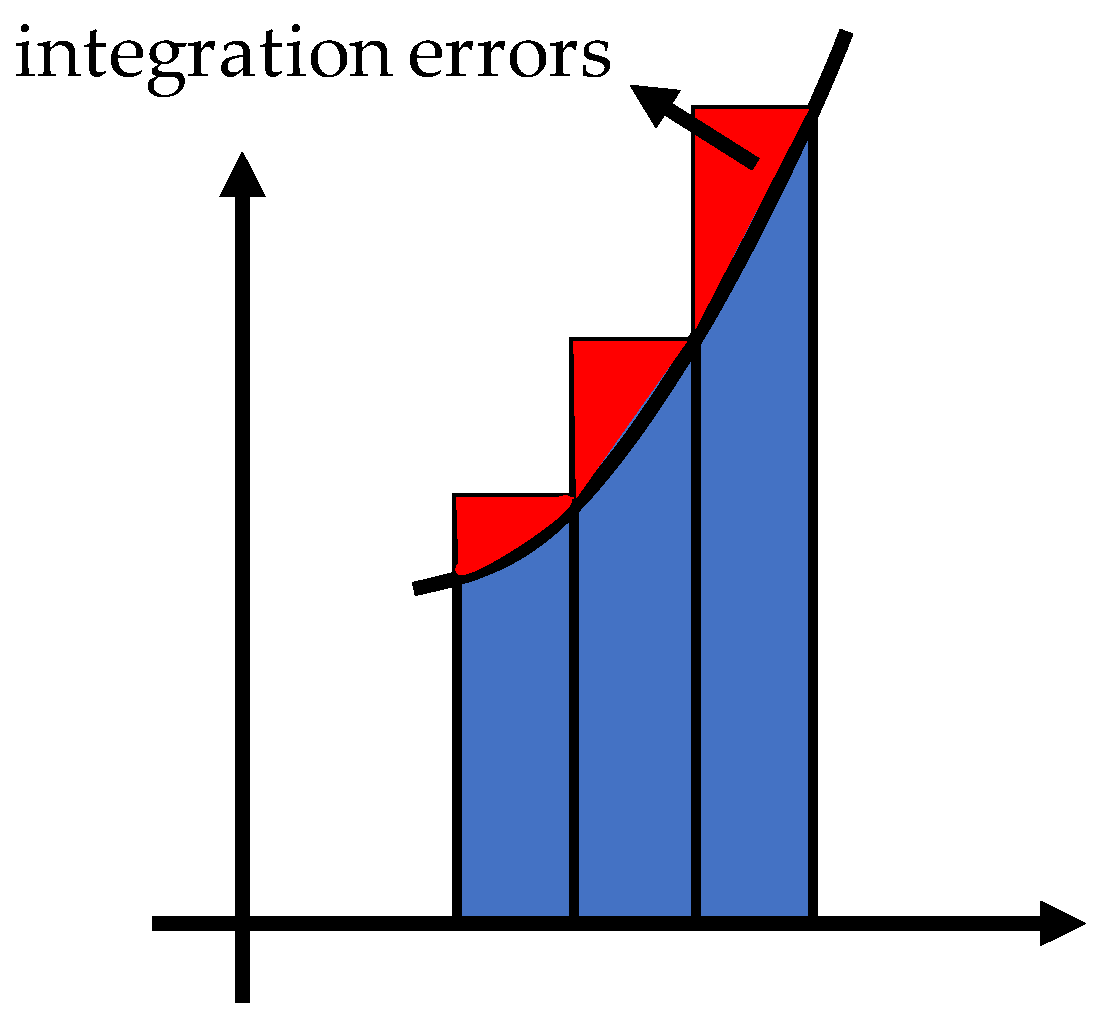
Figure 1. Schematic diagram of sources of integration errors during time domain integration.
Jmse 11 00931 g001
Figure 2. Schematic diagram of time–frequency domain integration algorithm based on least squares.
Jmse 11 00931 g002
Figure 3. Structural flowchart of an absolute measurement system of ship motion based on acceleration time–frequency domain integration.
Jmse 11 00931 g003
Figure 4. Acceleration measurement module. (a) the acceleration sensor and its model. (b) Schematic diagram for the installation of the acceleration sensor.
Jmse 11 00931 g004
Figure 5. Schematic diagram of angle sensor installation and measurement angle.
Jmse 11 00931 g005
Figure 6. The schematic diagram of the installation of the acceleration sensor and the laser sensor on the laboratory platform in experimental Case 1.
Jmse 11 00931 g006
Figure 7. Experimental Case 1 flow chart.
Jmse 11 00931 g007
Figure 8. Schematic diagram of the comparison of the signal integrated by the acceleration sensor and the signal collected by the laser sensor when the platform moves with different sine functions. Among them, the amplitude is [50–70 mm] and the frequency is [0.12–0.15 Hz].
Jmse 11 00931 g008aJmse 11 00931 g008b
Figure 9. The magnitude–frequency diagram and phase–frequency diagram after discrete Fourier transform of the signals collected by two groups of acceleration sensors and two groups of laser sensors under different sine functions. Among them, the amplitude is [50–70 mm] and the frequency is [0.12–0.15 Hz].
Jmse 11 00931 g009aJmse 11 00931 g009b
Figure 10. The comparison diagram of the displacement signal after correcting the phase difference of the acceleration integral displacement signal and the displacement signal of the laser sensor. Among them, the amplitude is [50–70 mm] and the frequency is [0.12–0.15 Hz].
Jmse 11 00931 g010aJmse 11 00931 g010b
Figure 11. Installation position diagram of sensors on ships.
Jmse 11 00931 g011
Figure 12. Absolute measurement results of ship three-degree-of-freedom motion.
Jmse 11 00931 g012
Table 1. Table of motion platform sine function motion.
Number of
Experiments
Sine FunctionAmplitude (mm)Frequency (Hz)
1 y = A sin 2 π T x 50 mm0.12 Hz
260 mm0.12 Hz
370 mm0.12 Hz
450 mm0.15 Hz
560 mm0.15 Hz
670 mm0.15 Hz
Table 2. Table of motion platform sine function motion.
Number of Channels of
the Data Collector
Sensor Type
1Acceleration sensor 1
2Acceleration sensor 2
3Laser sensor 1
4Laser sensor 2
Table 3. Table of amplitude–frequency characteristics and phase–frequency characteristics of signals.
NoSine Motion FunctionSensorFrequencyAmplitudePhase Difference
1 y = 50 sin ( 0.24 π x ) Acceleration10.12 Hz51.17 mm76.85°
Laser10.12 Hz50.77 mm
Acceleration20.12 Hz50.18 mm75.98°
Laser20.12 Hz50.32 mm
2 y = 50 sin ( 0.3 π x ) Acceleration10.15 Hz49.65 mm61.62°
Laser10.15 Hz51.44 mm
Acceleration20.15 Hz49.66 mm61.27°
Laser20.15 Hz50.85 mm
3 y = 60 sin ( 0.24 π x ) Acceleration10.12 Hz60.30 mm73.29°
Laser10.12 Hz60.74 mm
Acceleration20.12 Hz60.23 mm73.21°
Laser20.12 Hz59.96 mm
4 y = 60 sin ( 0.3 π x ) Acceleration10.15 Hz62.56 mm57.88°
Laser10.15 Hz60.78 mm
Acceleration20.15 Hz62.35 mm58.11°
Laser20.15 Hz60.03 mm
5 y = 70 sin ( 0.24 π x ) Acceleration10.12 Hz75.03 mm71.53°
Laser10.12 Hz71.25 mm
Acceleration20.12 Hz75.79 mm71.13°
Laser20.12 Hz70.23 mm
6 y = 70 sin ( 0.3 π x ) Acceleration10.15 Hz72.49 mm59.08°
Laser10.15 Hz70.13 mm
Acceleration20.15 Hz71.21 mm58.38°
Laser20.15 Hz69.05 mm
Disclaimer/Publisher’s Note: The statements, opinions and data contained in all publications are solely those of the individual author(s) and contributor(s) and not of MDPI and/or the editor(s). MDPI and/or the editor(s) disclaim responsibility for any injury to people or property resulting from any ideas, methods, instructions or products referred to in the content.