Abstract
In the marine coastal environment, freshwater and seawater coalescing communities are facing a complex set of abiotic and biotic cross-influences. This study aimed at evaluating the respective influences of blending and prokaryotic dynamics on community structure. For that, the surface salinity gradient of a nutrient-rich estuary (Arno River, Mediterranean Sea, Italy) was sampled at regular salinity intervals. When considering the whole length of the estuary and community-scale beta diversity metrics, a relatively smooth transition from freshwater to the sea was observed. Abiotic variability associated with salinity was the predominant constraint on the community structure, and the distribution of most taxa reflected their blending. However, while most of the dissolved substances enriched in freshwater experienced progressive dilution with seawater, heterotrophic prokaryotes demonstrated an important growth at intermediate salinity, interpreted as a heterotrophic assimilation of freshwater inputs by a few opportunistic marine taxa. The distribution of a number of taxa was significantly affected by variations in heterotrophic prokaryotes abundance, suggesting a putative influence of competitive interactions at intermediate salinities. A succession of different bacterial winners was observed from upstream to downstream, as well as losers represented by freshwater copiotrophs accompanied by some marine oligotrophs. Hence, coalescence drove a localized but major functional response of heterotrophic bacteria at intermediate salinity, hidden behind a majority of passively mixed bacterial taxa. This work paves the way for a stronger consideration of the trophic requirements of bacterial taxa to better understand community assembly in estuaries.
1. Introduction
Estuaries represent the interface between continental freshwater and marine sea water and feature unique biotic and abiotic characteristics making them one of the most complex and dynamic ecosystems [1,2,3,4]. The mixing of these two physically, chemically, and biologically different waters allows the establishment of strong biological and physical–chemical gradients, including salinity, organic matter concentration and quality, oxygen availability, chemical pollution, and microbial trophic behaviors [5,6]. Among these, the salinity gradient is usually considered the main parameter structuring prokaryotic communities [1,7,8]. Nevertheless, in the literature, correlation analyses rather than direct causality have been presented [7]. For example, organic matter concentration and quality gradients are often the equivalent of the salinity gradient, such covariability hampering the distinction of the real influences these two environmental parameters exert on the prokaryotic community along the estuary [3]. An estuary is also a place where different prokaryotic communities (i.e., freshwater and marine ones) meet along with the mixing of their environmental matrices [7], a process known as community coalescence, which contributes to shaping estuarine microbial assemblages [9]. When physically and/or chemically contrasted water bodies mix, their respective microbial communities coalesce while numerous abiotic parameters are shifting. As a result, various interactions, such as competition for available niches and trophic interactions, take place, while microbial species also respond to abiotic environmental stresses and filtering [10]. The resulting community could either be structured like a mosaic made up of members of the various initial communities, like one of the initial communities, or present a new alternative structure [11,12]. To date, most of the work dealing with prokaryotic assembly in estuaries reports the descriptive observations of community structures. In the light of the coalescence concept, a comprehensive view linking distribution to the ecological requirements of prokaryotic species thriving in estuaries is now required. The ecological responses of prokaryotes could help us understand the hierarchy of influences on community assembly and the variability in community responses to estuarine mixing reported in the literature.
In this context, this study aimed at evaluating the respective influences of end-members blending and active prokaryotic responses on community structure along the salinity gradient of a nutrient-rich estuary (Arno River, Mediterranean Sea, Italy), extending from 11 km inland to 2 km off the coast. The heterotrophic prokaryotes’ abundance and prokaryotic community structure, based on 16S v4–v5 metabarcoding, were investigated in summer during low discharge and compared to the distribution of nutrients and organic matter along the salinity gradient. The ecological interpretation of community structure shifts along with bulk community abundance and alpha diversity metrics, allowing us to capture end-members’ blending, as well as an opportunistic behavior at intermediate salinity. This study provides interesting grounds for future modelling efforts of community assembly in estuaries.
2. Materials and Methods
2.1. Sample Collection along the Salinity Gradient
This study was carried out at the Arno River mouth (Tyrrhenian Sea, Italy). The Arno River is 241 km long, and its watershed is under strong human influence because of the occurrence of agricultural and industrial areas, as well as big cities. The estuary is 11 km long and presents an average discharge of ~80 m3 s−1 [13]. The Arno estuary was sampled on 27 September, 2015, at the end of the dry season. At that time, it presented a clear vertical stratification with a salt-wedge intruding inland up to Pisa town center and a very low riverine discharge, ~10 m3 s−1 [13,14]. In such an estuary, freshwater flowing in the surface is progressively modified by the addition of underlying seawater through mixing and diffusion [15,16]. This usual process explains the increase in salinity observed from Pisa up to the sea. The surface water of the estuary was sampled by boat within half a day. The sampling was designed to target regular salinity intervals in the upper mixed layer in order to better cover the surface salinity gradient and properly reflect the progressive variations of associated abiotic factors. The upstream station was located under the Ponte della Cittadella bridge in Pisa town center and was chosen as the freshwater endmember of the coalescence. The downstream station was taken outside of the river plume, about 1 km off the coast, at maximal salinity, and was chosen as the marine endmember of the coalescence (Figure 1). The vertical profiles of temperature, dissolved O2, pH, salinity, and chlorophyll a were measured with a Hydrolab DS5 OTT probe to avoid sampling in or below the halocline. Once the targeted salinity was found in the subsurface (−1 m), water was collected using a 2.2-L horizontal sampler (Wildco), previously acid-cleaned and rinsed with Milli-Q water. Targeting sub-surface water was useful in limiting the influence of atmospheric deposits but could have led to sample at different distance from the halocline along the estuary. The salinity was measured again with the same probe on a small aliquot (~200 mL) of the collected sample to make sure that the value matched the expected one. Ten milliliters of water were filtered through a 90-µm nylon filter, fixed with 0.25% (final concentration) glutaraldehyde in 15-mL centrifuge tubes (Falcon) and stored on dry ice in darkness until they were placed at −80 °C back in the lab. Water for DOC analysis was collected in acid-washed 250 mL polycarbonate bottles rinsed with MilliQ water and with the sample before being filled and stored at 4 °C and in the dark. The remaining water was transferred in a fluorinated ethylene propylene (FEP) bottle (Nalgene), previously acid-washed, rinsed with Milli-Q water and water from the site. FEP bottles were stored in darkness at ambient temperature until further processing for phosphate, dissolved nitrogen, and suspended matter (SPM) analyses.
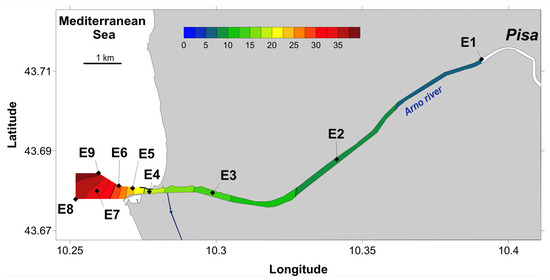
Figure 1.
Representation of the salinity gradient observed and the sampling sites along the Arno estuary. Color scale represents salinity and labels (E1–E9) identify sampling stations.
Back in the lab (within a few hours), the samples for DOC analysis were immediately filtered through a 0.2 μm nylon filter and analyzed. Subsamples for phosphate analysis were stored at −18 °C in LDPE bottles and kept frozen until analysis. For dissolved nitrogen concentration measurement, subsamples were filtered through a 0.2 µm acetate cellulose filter, and 24 mL of filtrate were acidified with 25 µL of HCl (trace metal grade, Fisher Scientific). For SPM measurement, 40 to 210 mL was filtered through pre-combusted (4 h at 450 °C) and weighed GF/F filters (Whatman, 0.7 µm, 25 mm of diameter), using a pre-combusted (4 h at 450 °C) glass set of filtration. Finally, 1 L of each sample was filtered through hydrophilic polyethersulfon membranes (0.22 µm pore size, 47 mm, Millipore, Burlington, MA, USA). Filters were stored at −20 °C until DNA extraction for prokaryotic diversity evaluation.
2.2. Phosphate Concentration
Frozen samples were thawed overnight in the fridge. Phosphate concentrations were measured using the classical spectrophotometric molybdate-blue method. Measurements were performed using 10 cm quartz cuvettes. The quantification was performed using daily calibrations. Instead of measuring absorbance at a single wavelength (889 nm), to have a better control on the absorbance signals, a scan was performed from 400 to 1100 nm. The LOD of the method is 0.15 µgP L−1.
2.3. Dissolved Nitrogen Concentration
In order to evaluate potential nitrogen-rich resource availability for heterotrophic prokaryotes, dissolved nitrogen (DN) concentration was considered as a measurement, including both organic and inorganic substances. For that, the DN concentration was determined by high-temperature combustion at 720 °C, which converted all N to NO. Then, NO was mixed with ozone chemiluminesces and was detected by a photomultiplier using a TOC-VCSH analyzer (Shimadzu, Kyoto, Japan) coupled with TNM-1 detector (Shimadzu). The calibration was performed using EDTA solutions from 0.05 to 5 mgN·L−1. Quality control was checked by the determination of element concentration in a “Lake Water Reference Material” (SUPER-05, Environment and Climate Change Canada). The certified value was 0.43 mgN·L−1. The obtained values for the whole dataset agreed with certified value within 5%.
2.4. Dissolved Organic Carbon Concentration
The DOC was measured by high-temperature catalytic oxidation, using a Shimadzu Total Organic Carbon analyzer (TOC-Vcsn) [17]. Three to five replicate injections were performed to reach an analytical precision of ±1 μM. The DOC Reference Material [18] was used to verify the instrument performance (CRM Batch #13 nominal concentration of 41–44 μM; measured concentration 43.7 ± 0.8 μM, n = 8).
2.5. Suspended Particulate Matter Characterization
GF/F filters were rinsed with milli-Q water to remove salts; then they were air dried overnight and oven dried for 24 h at 60 °C before weighing. SPM was then determined by weight difference and expressed as mg·L−1. From dried GF/F filters, particulate organic carbon (POC) and particulate nitrogen (PN) contents were determined using a Flash 2000 NC Soil Analyzer (Thermo Scientific®, Waltham, MA, USA). GF/F filters were previously treated to remove inorganic carbon under HCl fumes during 4 h in a glass desiccator. Filters were then placed under a fume hood for 3 h and overnight in an oven at 60 °C [19] before the analyses. C and N were measured by flash combustion at 930 °C in tin capsules. The limit of detection was, respectively, 5 µg and 1 µg for C and N, and the calibration curve ranged, respectively, from 10 to 1100 µg and 1 to 100 µg for C and N. Filtered volumes were used to express POC and PN concentrations in mg·L−1, while SPM weights were used to determine particulate content in POC (henceforth referred to as pPOC) and PN (henceforth referred to as pPN). The ratio between pPOC and pPN was calculated and will henceforth be referred to as the C:N ratio.
2.6. Distribution of Heterotrophic Prokaryotes
Heterotrophic prokaryotes (HP) were enumerated by flow cytometry using an Accuri C6 flow cytometer (BD), as described previously [20]. Briefly, glutaraldehyde-fixed samples were thawed, stained with SYBR green (1× final concentration) and analyzed under blue light excitation (488 nm). Acquisition rates were kept below 1000 events·s−1 by diluting the corresponding samples in 0.2 µm filtered NaCl solution with a concentration mimicking the salinity of the samples. HPs were discriminated from other particles and background noise by the following properties: high green fluorescence, small size, low complexity, and low red fluorescence. Heterotrophic prokaryotes’ abundance (HPA) was expressed as a number of cells per mL (cell·mL−1).
2.7. Taxonomic Diversity of the Prokaryotic Community
The composition and structure of the HP community were assessed by metabarcoding. The filters were thawed, cut into small pieces under sterile conditions, and DNA was then extracted in alkaline lysis buffer by mechanical disruption (using NucleoSpin Bead Tubes type A (Macherey-Nagel) for 15 min at ambient temperature on a vortex), followed by chemical digestion with lysozyme, SDS, and proteinase K, as described previously [21]. After phenol-chloroform purification and ethanol precipitation [22], DNA concentration and purity were assessed by using the NanoDrop ND 1000. DNA extracts were then stored at −20 °C upon downstream utilization.
Amplification of the v4–v5 region of the 16S rRNA gene from bacteria and archaea was performed using primers 515F-Y/926R [23]. Reaction mixtures contained up to 15 ng of DNA, 2× GoTaq Long PCR Master Mix (Promega, Madison, WI, USA) and 0.4 µM of each primer, in a final volume of 60 µL. The PCR program included an initial heating step of 2′ at 95 °C, followed by 25 cycles of 95 °C for 30″, 50 °C for 45″ and 72 °C for 45″, and a final extension of 10′ at 72 °C. The PCR amplification efficiency and specificity were checked after the migration of 5 µL of PCR products on a 1.5% agarose gel. Extraction blank performed with MilliQ water and no-template PCR control did not provide an amplification product. Amplicons were then paired-end sequenced (2 × 300 bp) with an Illumina MiSeq sequencer by Eurofins Genomics. Sequencing reads were deposited in the National Center for Biotechnology Information Sequence Read Archive (NCBI SRA) under the accession number PRJNA684972.
MiSeq raw reads were analyzed with DADA2 [24] in RStudio (version 1.2.5033, R-3.6.3, [25]). Filtering and trimming were performed using the following parameters: truncQ = 10, truncLen = 0, trimLeft = 80, trimRight = 20, maxLen = Inf, minLen = 20, maxN = 0, maxEE = Inf, rm.phix = TRUE, and compress = TRUE. Standard parameters were used for the others steps (dereplication, sample inference, chimera identification, and merging of paired-end reads). The taxonomy assignments of the ASVs were performed with the IdTaxa taxonomic classification method available via the DECIPHER Bioconductor package [26] and SILVA v.132 database [27,28]. From the ASV.biom file that was obtained, singleton ASVs, low-abundance ASVs (<0.005%), chloroplast sequences, and mitochondria sequences were filtered using QIIME1 [29]. After drawing rarefaction curves (SI.1), samples were randomly rarefied to 19,000 sequences using QIIME1.
2.8. Statistical Analyses and Graphical Representations
To represent the salinity gradient along the estuary and to locate the sampling sites (Figure 1), a contour map was created from the salinity measurements and geographical coordinates of the sampling sites using Surfer software (version 9.0), a default kriging algorithm for interpolation and manual color scale.
All other graphical representations were performed in RStudio [25]. Smoothed polynoms for non-linear regression analyses and corresponding correlation coefficients were obtained with the polynom [30] and ggplot2 [31] packages in R. Correlation analyses between environmental variables or between abiotic parameters and flow cytometry data were performed using the Hmisc package [32] with Spearman’s correlation tests. The ComplexHeatmap package [33] was used to draw the heatmaps.
Concerning sequencing data, rarefaction curves were drawn with the ggrare function of the phyloseq package [34]. Alpha diversity metrics (Observed OTU, Equitability, Shannon, Simpson reciprocal) were calculated with the function “alpha_diversity.py” from QIIME1, then represented with the ggplot2 package. Beta-diversity was assessed at all taxonomic levels from Phylum to ASV using non-metric dimensional scaling (nMDS) from Bray–Curtis dissimilarity matrices, calculated as distances using the R packages stats, vegan [35], and ecodist [36]. A redundancy analysis (RDA) and variation partitioning analysis were performed in order to determine the contribution of environmental variables to community structure variation (at ASV level) using the vegan R package. Principal component analyses (PCA) were performed at all taxonomic levels, from phylum to ASV, using the R package FactoMineR [37]. After observing a similar sample discrimination, the family level was chosen for deeper analysis as a trade-off between information quantity and quality. The major bacterial family taxa contributing to Axis 1 and to Axis 2 of the PCA were visualized using the function fviz_contrib of package factoextra [38]. The first fifty families for each axis were selected, and eighty-seven families contributing to Axis 1 and/or to Axis 2 were obtained. The distribution of these families along the estuary were visualized using the pheatmap R package [39]. In order to analyze the specificity of the prokaryotic community at Station E3, we focused on all the families and genera that were specifically more or less abundant in this station. For this purpose, comparisons of families’ and genera’s relative variation between Stations E2/E3 and E3/E4 were performed. Families or genera presenting similar behavior in others sites along the estuary were excluded.
3. Results
3.1. Abiotic Environment
Sampling the estuary surface waters resulted in covering the salinity gradient from 5.5 in Pisa town center to 37.7, approximately 1 km off the coast, with a maximum difference of 5.9‰ between two consecutive sampling sites (Figure 1). From the river to the sea, the temperature, oxygen saturation, and C:N ratio of particulate organic matter (POM) increased and were significantly positively correlated with salinity (ρ > 0.87, p < 0.003; Figure S2). The temperature increase was limited to 1.3 °C, while oxygen saturation increased from 63 to 102%, and C:N ratio showed a 68% increase (Table S1).
The mixing of nutrient-rich freshwater into nutrient-poor seawater was demonstrated by the linear decrease in SPM, POC, PN, DN, PO43−, and DOC with increasing salinity (ρ < −0.95, p < 0.0003; Figure S2). These variables showed a marked decrease ranging from 64% for SPM to 99.5% for PO43− (Table S1). Although being significantly and negatively correlated with salinity (ρ < −0.76, p < 0.03; Figure S1), pPOC and pPN demonstrated remarkable maximum values at intermediate salinity (station E3, S = 13.3; Figure 2A,B) independently from any other abiotic variable.
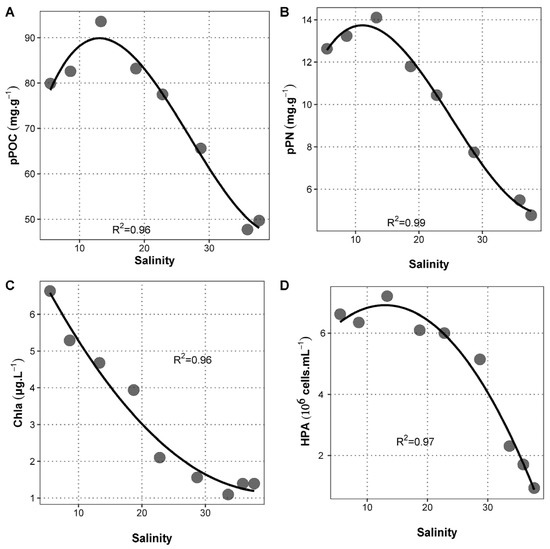
Figure 2.
Relationship between salinity and some abiotic or biotic parameters. Dots represent measurements from Station E1 (lower salinity) to Station E9 (highest salinity) for (A) pPOC, (B) pPN, (C) chla, and (D) HPA. No pPOC and pPN data could be collected for site E7.
The sole abiotic parameter that did not show any significant trend along the estuary was pH. It showed very limited variations between 7.70 and 7.87 (Figures S2 and 3).
3.2. Microbial Biomass
Chlorophyll a (chl a) concentration was used as a proxy of phytoplankton biomass. It presented a decreasing trend from the river to the sea (Figure 2C) and was strongly correlated with salinity (ρ = −0.95, p = 1.2 × 10⁻⁴; Figure S2). Differently from phytoplankton biomass, HPA did not follow conservative dilution but reached maximal values at intermediate salinity (Station E3) prior to decreasing strongly toward the sea (Figure 2D). From Station E3 to the sea, HPA presented values higher than expected by linear mixing at Stations E5 and E6 (corresponding to a salinity of 22.8 and 28.7, respectively). The abiotic parameter showing the strongest correlation with HPA was pPN (ρ = 0.98, p = 3.3 × 10⁻⁵; Figure S2), also peaking at Station E3 irrespective of salinity (Figure 2B).
3.3. Taxonomic Diversity Pattern of Heterotrophic Prokaryotes along the Estuary
Sequencing the prokaryotic community yielded 1610 ASVs from 1.18 × 10⁶ sequences. Rarefaction curves demonstrated that the richness was well covered since a plateau was reached quickly for all samples (Figure S1). The observed richness per sample ranged between 254 and 649 ASVs and was particularly low at Stations E3 and E9 (Figure 3A). The computation of equitability, Shannon and reciprocal Simpson indexes (Figure 3B–D) resulted in far lower values at Station E9 than at the other sites. Station E3 presented more contrasted trends, with the highest equitability but a lower Shannon value. Lastly, a peak in reciprocal Simpson was recorded at Station E6. Neither the observed richness nor the computed diversity indexes were significantly related to any of the environmental parameter considered in this study (p > 0.05).
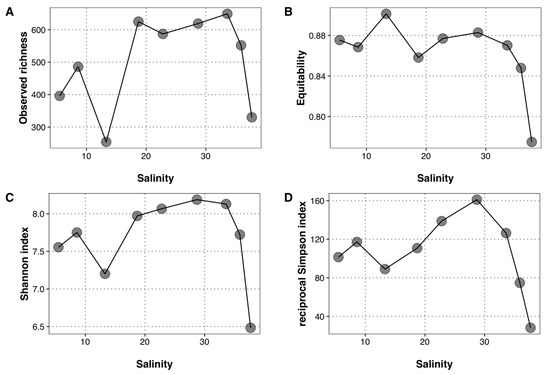
Figure 3.
Alpha diversity indices along the salinity gradient. (A) Observed richness, (B) equitability, (C) Shannon index, and (D) reciprocal Simpson index. Each dot represents a sampling station, from E1 (lower salinity) to E9 (highest salinity).
The ASVs belonged to 25 phyla and 42 classes. Only 21 ASVs were affiliated to archaeal lineages, and represented less than 0.06% of the total dataset. The most abundant phyla corresponded to bacteria and more specifically to Proteobacteria (39–48%), Bacteroidetes (15–27%), Actinobacteria (5–18%) and Cyanobacteria (4–17%). Considering the class taxonomic level, the most abundant were Gammaproteobacteria (10–30%), Alphaproteobacteria (10–35%), Bacteroida (15–21%), Oxyphotobacteria (3–17%), Actinobacteria (0.04–12%) and Planctomycetacia (5–10%). Nine families had a relative abundance above 5% at least in one site. Burkholderiaceae was the most abundant at Stations E1, E2, E3, E4, and E5 (8.8 to 11.5%) and represented more than 5% of the community at Stations E5 and E6. More than 5% of Sporichthyaceae were observed at Stations E1 and E2. Pirellulaceae represented more than 5% at Stations E1, E2, E5, E6, and was the more abundant family at Station E6. More than 5% of Xanthomonadaceae were observed at Stations E1, E3, and E4. Rhodobacteraceae represented more than 5% at Stations E7, E8, and E9. Flavobacteriaceae were the most abundant at Station E7, and represented more than 5% at Stations E7, E8, and E9. Cyanobiaceae represented more than 5% at Stations E7, E8, and E9, and were the most abundant at Station E9. SAR11-Clade_I was the most abundant at Station E8, and represented more than 5% at Stations E7, E8, and E9. Actinomarinaceae relative abundance only exceeded 5% at Station E9.
Non-metric dimensional scaling (nMDS) based on Bray–Curtis dissimilarity (Figure 4) demonstrated a continuum in community structure from Station E1 to Station E9, captured along the first axis. The largest dissimilarities along this first axis were observed between Stations E6 and E7 and between Stations E8 and E9, when mixing no longer occurred inland. Interestingly, the dissimilarity between Stations E2 and E3 corresponded to the largest differentiation along the second axis, suggesting a specific differentiation at Station E3. Similar results were observed whatever the taxonomic result, from phylum to genus. Variation partitioning based on RDA analysis highlighted the strong contribution of salinity in these structure shifts; this factor explains up to 55% of the community structure variability along this estuary. Multiple collinearity analysis showed that there is no other significantly contributing environmental factor.
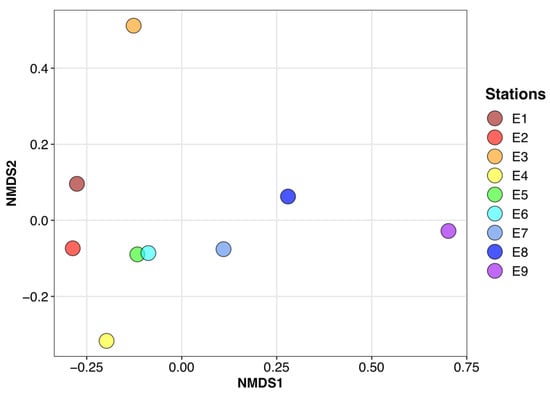
Figure 4.
Bray–Curtis dissimilarity at the ASV level along the Arno estuary represented by non-metric dimensional scaling (NMDS). Stress value = 0.005.
3.4. Specific Distribution Patterns and Their Relationships to Environmental Changes and Competition
Principal component analysis (PCA) based on relative abundances of prokaryotic families in samples demonstrated highly similar sample discrimination, as opposed to nMDS (Figure S3). The 87 families, contributing to Axis 1 and/or to Axis 2 of PCA analysis and explaining the structure shifts observed along the estuary, were clustered according to their distribution patterns (Figure S4). A first cluster (C1) was represented by families that were relatively more abundant from Stations E1 to E6, thus favored in the inland part exposed to progressive dilution. Given the large range of salinity from E1 to E6 (from ~5 to 29), the spatial distribution of the families in C1 was poorly related to salinity variations. The second cluster (C2) corresponded to bacterial families relatively more abundant at the lowest salinities (<10‰), and suddenly far less represented at Station E3, where prokaryotic net growth was the highest. The third cluster (C3) corresponded to families specifically relatively more abundant at intermediate stations (E2 to E7). Interestingly, a succession of dominant families was observed from Station E2 to Station E7. The fourth cluster (C4) was represented by families that were rare upstream but became relatively more abundant from Station E7 to Station E9, sometimes reaching more than 10% of the community. An extensive listing of the families corresponding to each cluster and their relative abundances is provided in Table S2.
Looking for relationships between the members of these four clusters and abiotic variables, families from Clusters C1 and C2 showed positive correlations with dissolved resources (DOC, DN, and phosphates) and particles characteristics (SPM, POC, PN, pPOC, and pPN); all parameters showing a decrease from the river to the ocean. The same families were negatively related to salinity, O2 and C/N, which were higher in seawater. Interestingly, families from C1, the cluster showing the most conservative distribution along the salinity gradient, presented the strongest relationships with abiotic variables (Figure 5A,B). Bacterial families from Cluster C3 were weakly correlated with abiotic variables, having only positive strong correlations with pPOC and pN (Figure 5C). Contrary to what was observed for families from Clusters C1 and C2, families from Cluster C4 presented positive and strong correlations with marine tracers (O2, S, and C/N) and strong negative correlations with parameters showing higher values in freshwater (Figure 5D).
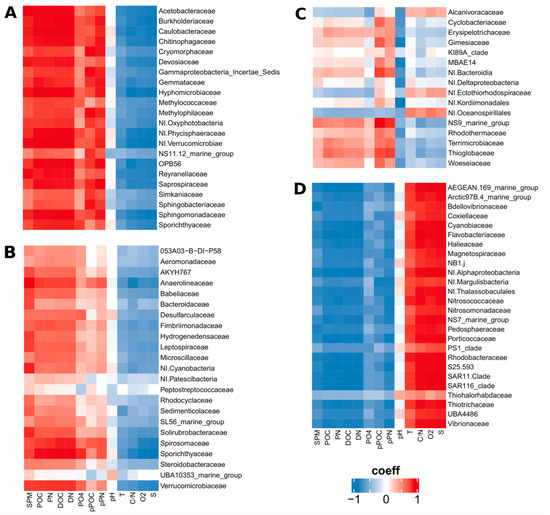
Figure 5.
Heatmap representing Spearman’s correlations between environmental variables and prokaryotic families clustered according to their distribution in the estuary. (A) Cluster C1, (B) Cluster C2, (C) Cluster C3, and (D) Cluster C4.
The analyses also highlighted a distinct behavior of bacterial community at Station E3. In fact, the relative abundance of families at this specific site drives the split-up between Clusters C1, C2, and C3. Bacterial taxa showing specific variations at E3 compared to E2 and/or E4 were sorted at the family and genus level. Firstly, taxa specifically underrepresented at Station E3 belonged to 16 phyla, 38 families, and 53 genera (Table S3). Seventy-one percent of these families were found in the four clusters described above, belonging mainly to Cluster C2 (70%). Others families belonged to Clusters C1 (15%) and C4 (15%). Excluded taxa were mainly rare or scarce, only a few families being abundant in at least 1 site (Actinomarinaceae, Mycobacteriaceae, Pirellulaceae, Beijerinckiaceae, Nitrosomonadaceae, and Verrucomicrobiaceae). Secondly, taxa specifically overrepresented at Station E3 belonged to 8 phyla, 24 families, and 38 genera (Table S3). Sixty-seven percent of these families were found in the clusters described above, belonging mainly to Cluster C1 (75%). Others families were clustered in C3 (19%) and C4 (6%). The selected taxa presented a wide range of relative abundance, from rare to very abundant. Finally, for seven families, inconsistent behavior was observed with both the selected and excluded representing genera. These families (Chitinophagaceae, Saprospiraceae, Crocinitomicaceae, Flavobacteriaceae, Erysipelotrichaceae, Burkholderiaceae, and Verrucomicrobiaceae) belonged to four phyla (Bacteroidetes, Firmicutes, Proteobacteria, and Verrucomicrobia).
4. Discussion
4.1. A Strong Growth at Intermediate Salinity Related to Heterotrophic Processing of River Inputs
This study was focused on an estuary where nutrient-rich freshwater meets the oligotrophic Mediterranean seawater. While most nutritive resources were nearly conservatively diluted from freshwater to seawater, HP abundance peaked at intermediate salinity, highlighting a strong net heterotrophic growth. This net growth was not related to net in situ phytoplanktonic growth at the same sites, since chlorophyll a concentration linearly decreased, while salinity increased. Moreover, DOC, POC, and inorganic nutrients decreased linearly with the increasing salinity. Padan et al. [40] recently reported optical properties of DOM within the same sampling campaign and did not highlight any specific qualitative change in the area of the net HP growth we observed. Taken altogether, these observations suggest that this net HP growth was related to any punctual resource input along the estuary and was mainly driven by freshwater inputs. They are in agreement with the shift toward a more important heterotrophic base of the pelagic food web, less dependent on coastal phytoplanktonic production, already observed in diverse estuarine contexts [41,42,43], and highlighting a functional consequence of this coalescence context.
The net HP growth observed coincided with a strong enrichment of particles in C and N. This enrichment suggests that, while the allochthonous POM from the river was progressively diluted in seawater, autochthonous estuarine POM was produced. Two mechanisms could have contributed to this production. The first one is the salinity-induced flocculation of DOM, occurring at intermediate salinities and modifying the quality of the whole POM pool [44,45,46,47]. From this point of view, HP growth could be the result of this abiotically driven POM qualitative change. The second mechanism would be a fast assimilation of DOM by HP. Indeed, an experimental work performed with samples from the same estuary taken at the same period has demonstrated the ability of estuarine HP to quickly assimilate estuarine DOM [48]. Thus, microbial heterotrophic assimilation, incorporating freshwater C and N inputs into POM, could also contribute to POM qualitative changes. Whatever the exact causal relationship between microbial assimilation and POM qualitative changes, the net HP growth observed highlights a strong coupling between heterotrophic prokaryotic communities’ responses to coalescence and biogeochemical processes in estuaries. The resulting changes in prokaryotic community diversity can provide a better comprehension of the underlying processes.
4.2. Community Diversity Suggests Different Drivers of Bacterial Assembly in This Estuary
The coincidence of a reduced alpha diversity and HP net growth at intermediate salinity suggested more subtle hidden microbial responses to estuarine coalescence. Such an observation is not frequent in the literature, but Crump et al. [5] reported a shortened doubling time of estuarine bacteria in summer, and [49] observed reduced alpha diversity at intermediate salinities. The salinity corresponding to such bacterial development varies strongly in the literature, as already discussed in [50]; considering bacterial growth rates, strongly suggests that our ability to observe bacterial development in estuaries strongly depends on the water residence time [5].
In our study, these observations corresponded to a very peculiar community structure. We identified two opposite trends of bacterial taxa distribution alongside the bulk abundance increase and drop in alpha diversity. First, a restricted number of fast growing taxa (Cluster C3) was selected at intermediate salinity, as observed in other contexts for opportunistic taxa [51,52]. Hidden in the rare biosphere of either or both end-members of this coalescence, the origin of these opportunists cannot be clearly depicted. Previous research also evidenced what was called unique estuarine diversity from fingerprint methods [5,50]. The inflow of nutrient-rich freshwater into Mediterranean coastal waters represented a combination of two environmental filters: nutrient depletion and increase in salinity. Yet, we hypothesize that the input in nutrients and the lower tolerance of freshwater taxa to increased salinity [53] could have lowered the competition for resources and favored the growth of opportunistic marine bacteria initially thriving in a more oligotrophic environment. Terrestrial inputs have already been related to the selection of opportunistic marine bacterial taxa during both in situ observation campaigns and lab experiments [54,55,56], and marine opportunistic bacteria are known for their ability to respond very quickly (from a few minutes, thanks to chemotaxis, to a few hours for growth) to increases in nutritive resource availability in their surroundings [57,58].
We also observed a large number of bacterial taxa that were diluted from freshwater into seawater (Cluster C1), and whose growth was very locally promoted at intermediate salinity. This distribution strongly suggests that these bacteria would be copiotrophic, and thus, need abundant resources to develop. At intermediate salinity, their slight increase in relative abundance demonstrates a good tolerance to salinity increase, and could be related to DOM flocculation mentioned above. Indeed, POM patches provide more nutrient-rich habitats and are known to contribute to the development of copiotrophic patch-associated bacteria [59]. Moreover, Rocca et al. [12] noticed that some freshwater taxa were able to grow in brackish waters after coalescence, and patch-formation through flocculation represents a possible underlying mechanism to explore.
Taking into consideration the whole salinity gradient, the distribution of most of the taxa along the salinity gradient was reflected in the fraction of their original environment in the mixing. This suggests a dominance of passively transported prokaryotes, driven by the mixing of freshwater and marine water. We observed maximal values of alpha diversity for salinity ranging from 15 to 35. They are in agreement with previous observations in different regions of the world (e.g., [49,50,60]). It has been proposed that in estuaries, the mixing of freshwater and seawater increases the diversity of substrate for heterotrophic prokaryotes, thus increasing the available niches and supporting high diversity [60,61]. While we do not dispute this possibility, high throughput sequencing clearly evidenced in our study that increased diversity resulted from the co-occurrence of opportunists specifically enriched at intermediate salinities (Cluster C3), upstream taxa that were facing dilution into seawater (Clusters C1 and C2), and marine taxa that were more present (Cluster C4).
At the marine end of the estuary, a drop in alpha diversity was observed with a drop in reciprocal Simpson index, thus indicating a strong dominance in the community [62,63]. Such low diversity, associated with the dominance of Cyanobacteria and SAR11 clades, is commonly observed in oligotrophic seawaters, such as in NW Mediterranean [61,64,65,66,67]. This observation further emphasizes the diversification of the marine coastal prokaryotic community under the influence of the Arno River, downstream from the transient development of bacterial opportunists.
4.3. Taxa-Specific Behaviours during Estuarine Coalescence Are Related to Their Ecological Requirements
Understanding the environmental constrains influencing the balance between passive blending and environmental sorting during community coalescence is a key point for predicting the outputs of estuarine mixing. Instead of focusing on the most abundant taxa, we used a statistical approach to identify the ones contributing the most to community structure variation irrespective of their relative abundance. This approach allowed us to highlight the interesting distribution patterns of many taxa, including rare ones that significantly contributed to community structure variations.
Most bacterial taxa composing each end-member community in our study were blended, with distributions strongly correlated with salinity. Blended taxa originating from the freshwater community formed Cluster C1. They had previously been encountered in freshwater habitats only (e.g., OPB56 clade, Erysipelotrichaceae, Gemmataceae, Reyranellaceae, Terrimicrobiaceae; [68,69,70,71,72]), or in both freshwater and coastal environments under continental influence (e.g., Sporichthyaceae, Saprospiraceae, Chitinophagaceae, Cryomorphaceae, NS11–12 marine group, Methylococcaceae, OPB56, Phycisphaeraceae; [68,72,73,74,75,76,77,78,79,80]). According to the literature, representatives of Cluster C1 seem to be generalists, able to use a wide range of carbon sources, such as low molecular weight molecules, complex organic matter, plastics, aromatic compounds, xenobiotics, chitin, HP-derived DOM or dimethylsulphide [73,80,81,82,83,84,85,86,87]. Copiotrophic taxa associated with algae or promoted during algal blooms, such as Saprospiraceae, Cryomorphaceae, and Phycisphaeraceae, were also represented in Cluster C1. Being generalists should not prevent these taxa from developing in the estuary. Being copiotrophic, however, makes them less competitive when mixing in a less nutritive environment. The transient and limited development recorded for some of these groups at intermediate salinity could reflect the affinity of bacterial copiotrophs for POM patches [57,88] that are strongly suspected to form by freshwater DOM flocculation, as explained above. Thus, we hypothesize that their trophic quantitative requirements, i.e., their copiotrophic characteristic, are important drivers of their distribution in case of dilution of nutrient-rich freshwater into oligotrophic seawater.
Concerning the marine end-members, taxa that appeared relatively more abundant close to the marine end composed Cluster C4. The two most abundant families in this cluster were the SAR 11 clade and Rhodobacteraceae. Both families are usually encountered in the oligotrophic coastal ocean [65,66,89] and were recently described as outcompeted by copiotrophs along an offshore-to-coast gradient [64]. Members of the SAR 11 clade are known for their small and streamlined genome, in which very few transcription regulators have been identified (Cottrell and Kirchman, 2016 [88]). Their specific transcriptional activity was demonstrated to progressively increase from intermediate salinity to seawater [49]. More generally, oligotrophs are described as unable to quickly respond to abrupt environmental changes and, thus, as slow growers [57,90]. In the context of a rather fast mixing between nutrient-rich freshwater and oligotrophic seawater, such adaptation to oligotrophic environments could explain the lack of development of these groups at intermediate salinity. Taken altogether, these observations suggest that the distribution of most bacterial end-members during this estuarine coalescence reflects the life history of their initial communities and especially the resulting dominant strategy to use resource supply through the selection of oligotrophic or copiotrophic taxa. A different observation could be expected with a more eutrophic coastal environment, and repetition of such studies is now requested to test this hypothesis. It opens intriguing questions about the exact combination of the driving factors of microbial assembly in estuaries; the physiological constrains that salinity represents for bacteria should be furthered, compared to constrains related to resources availability.
A minority of bacterial taxa was more strongly affected by environmental sorting at intermediate salinity. The important bulk community growth resulted in both the depletion of taxa unable to respond quickly and the selection of adapted fast growing taxa. Depleted taxa belonged mainly to Cluster C2 and seemed to be more abundant upstream but were all scarce or rare in the community. About half of them had previously been observed in anaerobic environments or are known as anaerobic or facultative anaerobic bacteria (e.g., Anaerolineaceae, Peptostreptococcaceae, Hydrogenedensaceae, Patescibacteria, Desulfarculaceae, 053A03-B-DI-P58, Aeromonadaceae, Rhodocyclaceae, and Sedimenticolaceae; [69,91,92,93,94,95,96,97]). As a consequence, these taxa appear very few adapted to physical–chemical characteristics at the surface of estuarine environment, and their depletion suggest competitive exclusion. Then, enriched taxa belonged to Cluster C3, and 75% of them are known as marine bacteria (e.g., Cyclobacteriaceae, Rhodothermaceae, uncultured Kordiimonadales, Ectothiorhodospiraceae, KI89A clade, MBAE14, uncultured Oceanospirillales, Alcanivoracaceae, and Woeseiaceae; [98,99,100,101,102,103,104,105,106]). They have often been encountered in nutrient-rich marine habitats, such as superficial sediments, estuaries, and salterns [101,107,108], or are associated with sponge, coralline algae, and algal blooms [109,110,111]. Families from Cluster C3 are generalists, using various carbon sources, such as cellulose, xylan, hydrocarbon, and plastics [100,112,113]. It is noteworthy that their enrichment at intermediate salinity corresponded to the suspected flocculation of freshwater DOM. Among the taxa specifically enriched at intermediate salinity (Station E3), we observed uncultured Microtrichales; this order contains the genus Candidatus Microthrix, which is a filamentous bacterium that causes sludge bulking in activated sludge systems worldwide [114]. The enrichment in this taxon could be the result of or contribute to DOM flocculation. DOM flocculation may create POM patches, and thus, increase related available niches. Marine copiotrophs are well known for both their high growth rates and their affinity for particles [57,88]. Last but not least, we observed the selection of Bdellovibrionaceae and Bacteriovoracaceae, which are obligatory bacterial predators belonging to Bdellovibrio and like organisms (BALOs) [115,116]. The role of BALO-related predation in the cycling of nutrients is not clear [116]. Nevertheless, predation contributes to the regulation of dominant taxa [117], especially opportunistic species that are known to be more sensitive to top-down pressure [57,118]. Such predation could contribute to the succession of different dominant taxa in the downstream part of the estuary. As a consequence, we propose that the environmental filtering occurring in the studied estuarine coalescence results in both the competitive exclusion of taxa unable to grow in ambient physical–chemical conditions and the selection of the most reactive and adapted opportunists, mainly widespread marine bacteria. Opportunistic development then paves the way for new biotic interactions that rapidly shape the prokaryotic community.
5. Conclusions
The bulk growth, reduced diversity, and specific structure of the prokaryotic community at intermediate salinity demonstrated that salinity gradient can be an important but not a unique factor driving prokaryotic dynamics during microbial coalescence at the continent–ocean transition. In fact, the salinity gradient could be seen as a tracer of blending prokaryotic taxa during coalescence but we have demonstrated that the active responses of a few taxa have the potential to alter community structure and biogeochemical functioning. The mixing of environmental matrices creates new niches at intermediate salinity and corresponds to a powerful environmental filter. In the studied estuarine mixing, it allowed the dynamic response of some opportunistic taxa, probably according to modified competition for resources and delayed top-down regulations that remain to be specified. This transient response of a few taxa was related to detectable geochemical changes in the estuary, and future investigations of the consequences of these complex interactions for the functionality of the community could help in establishing causal relationships.
Supplementary Materials
The following supporting information can be downloaded at: https://www.mdpi.com/article/10.3390/jmse11050933/s1, Figure S1: Rarefaction curves obtained for the nine samples; Figure S2: Heatmap representing Spearman’s correlations between abiotic parameters, chlorophyll a, and heterotrophic prokaryotes abundance; Figure S3: Principal component analysis showing the multivariate variation among nine samples in terms of community structure at the family level; Figure S4: Clustered heatmap showing the distribution along the Arno estuary of families selected through PCA analysis; Table S1: Range of environmental variables and quantitative biological descriptors; Table S2: Full taxonomic affiliation and distribution along the estuary of families constituting Clusters C1 to C4; Table S3: Families and genera affected by the prokaryotic growth and community structure alteration at intermediate salinity (E3).
Author Contributions
Conceptualization, C.S., S.R.B. and B.M.; methodology, C.S., S.R.B., O.R., G.D., C.G. and B.M.; formal analysis, C.S., S.R.B., G.D. and B.M.; investigation, B.M. and E.N.; writing—original draft preparation, E.N.; writing—review and editing, E.N., C.S., S.R.B., G.D., O.R. and B.M.; funding acquisition, C.S., O.R., C.G. and B.M. All authors have read and agreed to the published version of the manuscript.
Funding
This work was funded by the CARTT of the Institut Universitaire Technologique from Toulon University and by the French program COMECOM-MERMEX, supported by the Envi-Med project.
Institutional Review Board Statement
Not applicable.
Informed Consent Statement
Not applicable.
Data Availability Statement
Raw sequence reads and essential metadata are deposited in the SRA (BioProject PRJNA684972).
Acknowledgments
We are grateful to Dario Omanović for his contribution in field sampling and phosphate analysis. We also thank Aurélie Portas and Emilie Paséro for their contributions to DNA extraction and amplification. This work is dedicated to our late friend and colleague Cedric Garnier, who made this collaboration possible but passed away way too soon to enjoy it.
Conflicts of Interest
The authors declare no conflict of interest.
References
- Aguirre, M.; Abad, D.; Albaina, A.; Cralle, L.; Goñi-Urriza, M.S.; Estonba, A.; Zarraonaindia, I. Unraveling the Environmental and Anthropogenic Drivers of Bacterial Community Changes in the Estuary of Bilbao and Its Tributaries. PLoS ONE 2017, 12, e0178755. [Google Scholar] [CrossRef]
- Chauhan, A.; Cherrier, J.; Williams, H.N. Impact of Sideways and Bottom-up Control Factors on Bacterial Community Succession over a Tidal Cycle. Proc. Natl. Acad. Sci. USA 2009, 106, 4301–4306. [Google Scholar] [CrossRef]
- Chen, X.; Wei, W.; Wang, J.; Li, H.; Sun, J.; Ma, R.; Jiao, N.; Zhang, R. Tide Driven Microbial Dynamics through Virus-Host Interactions in the Estuarine Ecosystem. Water Res. 2019, 160, 118–129. [Google Scholar] [CrossRef]
- Ming, H.; Jingfeng, F.; Liu, J.; Jie, S.; Zhiyi, W.; Yantao, W.; Dongwei, L.; Mengfei, L.; Tingting, S.; Yuan, J.; et al. Full-Length 16S RRNA Gene Sequencing Reveals Spatiotemporal Dynamics of Bacterial Community in a Heavily Polluted Estuary, China. Environ. Pollut. 2021, 275, 116567. [Google Scholar] [CrossRef]
- Crump, B.C.; Hopkinson, C.S.; Sogin, M.L.; Hobbie, J.E. Microbial Biogeography along an Estuarine Salinity Gradient: Combined Influences of Bacterial Growth and Residence Time. Appl. Environ. Microbiol. 2004, 70, 1494–1505. [Google Scholar] [CrossRef]
- Zhang, H.; Zheng, S.; Ding, J.; Wang, O.; Liu, F. Spatial Variation in Bacterial Community in Natural Wetland-River-Sea Ecosystems. J. Basic Microbiol. 2017, 57, 536–546. [Google Scholar] [CrossRef]
- Mehrshad, M.; Amoozegar, M.A.; Ghai, R.; Shahzadeh Fazeli, S.A.; Rodriguez-Valera, F. Genome Reconstruction from Metagenomic Data Sets Reveals Novel Microbes in the Brackish Waters of the Caspian Sea. Appl. Environ. Microbiol. 2016, 82, 1599–1612. [Google Scholar] [CrossRef]
- Wu, Q.L.; Zwart, G.; Schauer, M.; Kamst-van Agterveld, M.P.; Hahn, M.W. Bacterioplankton Community Composition along a Salinity Gradient of Sixteen High-Mountain Lakes Located on the Tibetan Plateau, China. Appl. Environ. Microbiol. 2006, 72, 5478–5485. [Google Scholar] [CrossRef] [PubMed]
- Rillig, M.C.; Antonovics, J.; Caruso, T.; Lehmann, A.; Powell, J.R.; Veresoglou, S.D.; Verbruggen, E. Interchange of Entire Communities: Microbial Community Coalescence. Trends Ecol. Evol. 2015, 30, 470–476. [Google Scholar] [CrossRef] [PubMed]
- Castledine, M.; Sierocinski, P.; Padfield, D.; Buckling, A. Community Coalescence: An Eco-Evolutionary Perspective. Philos. Trans. R. Soc. B Biol. Sci. 2020, 375, 20190252. [Google Scholar] [CrossRef] [PubMed]
- Mansour, I.; Heppell, C.M.; Ryo, M.; Rillig, M.C. Application of the Microbial Community Coalescence Concept to Riverine Networks. Biol. Rev. 2018, 93, 1832–1845. [Google Scholar] [CrossRef]
- Rocca, J.D.; Simonin, M.; Bernhardt, E.S.; Washburne, A.D.; Wright, J.P. Rare Microbial Taxa Emerge When Communities Collide: Freshwater and Marine Microbiome Responses to Experimental Mixing. Ecology 2020, 101, e02956. [Google Scholar] [CrossRef]
- Retelletti Brogi, S.; Balestra, C.; Casotti, R.; Cossarini, G.; Galletti, Y.; Gonnelli, M.; Vestri, S.; Santinelli, C. Time Resolved Data Unveils the Complex DOM Dynamics in a Mediterranean River. Sci. Total Environ. 2020, 733, 139212. [Google Scholar] [CrossRef]
- Retelletti Brogi, S. Spatial and Temporal Dynamics of Dissolved Organic Matter in Rivers and Coastal Areas: The Arno River and Tyrrhenian Sea Case; Università di Pisa: Pisa, Italy, 2017. [Google Scholar]
- Delaval, A.; Duffa, C.; Pairaud, I.; Radakovitch, O. DRACAR an Estuarine Transfer Function to Predict Dissolved Pollutant Fluxes to the Sea. In Application for Radionuclides; Springer: Singapore, 2021. [Google Scholar]
- Verri, G.; Pinardi, N.; Bryan, F.; Tseng, Y.; Coppini, G.; Clementi, E. A Box Model to Represent Estuarine Dynamics in Mesoscale Resolution Ocean Models. Ocean Model. 2020, 148, 101587. [Google Scholar] [CrossRef]
- Santinelli, C.; Follett, C.; Retelletti Brogi, S.; Xu, L.; Repeta, D. Carbon Isotope Measurements Reveal Unexpected Cycling of Dissolved Organic Matter in the Deep Mediterranean Sea. Mar. Chem. 2015, 177, 267–277. [Google Scholar] [CrossRef]
- Hansell, D.A. Dissolved Organic Carbon Reference Material Program. Eos Trans. Am. Geophys. Union 2005, 86, 318. [Google Scholar] [CrossRef]
- Lorrain, A.; Savoye, N.; Chauvaud, L.; Paulet, Y.-M.; Naulet, N. Decarbonation and Preservation Method for the Analysis of Organic C and N Contents and Stable Isotope Ratios of Low-Carbonated Suspended Particulate Material. Anal. Chim. Acta 2003, 491, 125–133. [Google Scholar] [CrossRef]
- Layglon, N.; Misson, B.; Durieu, G.; Coclet, C.; D’Onofrio, S.; Dang, D.H.; François, D.; Mullot, J.-U.; Mounier, S.; Lenoble, V.; et al. Long-Term Monitoring Emphasizes Impacts of the Dredging on Dissolved Cu and Pb Contamination along with Ultraplankton Distribution and Structure in Toulon Bay (NW Mediterranean Sea, France). Mar. Pollut. Bull. 2020, 156, 111196. [Google Scholar] [CrossRef] [PubMed]
- Ghiglione, J.-F.; Conan, P.; Pujo-Pay, M. Diversity of Total and Active Free-Living vs. Particle-Attached Bacteria in the Euphotic Zone of the NW Mediterranean Sea. FEMS Microbiol. Lett. 2009, 299, 9–21. [Google Scholar] [CrossRef]
- Misson, B.; Sabart, M.; Amblard, C.; Latour, D. Benthic Survival of Microcystis: Long-Term Viability and Ability to Transcribe Microcystin Genes. Harmful Algae 2012, 13, 20–25. [Google Scholar] [CrossRef]
- Parada, A.E.; Needham, D.M.; Fuhrman, J.A. Every Base Matters: Assessing Small Subunit RRNA Primers for Marine Microbiomes with Mock Communities, Time Series and Global Field Samples. Environ. Microbiol. 2016, 18, 1403–1414. [Google Scholar] [CrossRef]
- Callahan, B.J.; McMurdie, P.J.; Rosen, M.J.; Han, A.W.; Johnson, A.J.A.; Holmes, S.P. DADA2: High-Resolution Sample Inference from Illumina Amplicon Data. Nat. Methods 2016, 13, 581–583. [Google Scholar] [CrossRef] [PubMed]
- RStudio Team. RStudio: Integrated Development for R. RStudio; PBC: Boston, MA, USA, 2020. [Google Scholar]
- Murali, A.; Bhargava, A.; Wright, E.S. IDTAXA: A Novel Approach for Accurate Taxonomic Classification of Microbiome Sequences. Microbiome 2018, 6, 140. [Google Scholar] [CrossRef]
- Pruesse, E.; Quast, C.; Knittel, K.; Fuchs, B.M.; Ludwig, W.; Peplies, J.; Glöckner, F.O. SILVA: A Comprehensive Online Resource for Quality Checked and Aligned Ribosomal RNA Sequence Data Compatible with ARB. Nucleic Acids Res. 2007, 35, 7188–7196. [Google Scholar] [CrossRef]
- Quast, C.; Pruesse, E.; Yilmaz, P.; Gerken, J.; Schweer, T.; Yarza, P.; Peplies, J.; Glöckner, F.O. The SILVA Ribosomal RNA Gene Database Project: Improved Data Processing and Web-Based Tools. Nucleic Acids Res. 2013, 41, D590–D596. [Google Scholar] [CrossRef]
- Caporaso, J.G.; Kuczynski, J.; Stombaugh, J.; Bittinger, K.; Bushman, F.D.; Costello, E.K.; Fierer, N.; Peña, A.G.; Goodrich, J.K.; Gordon, J.I.; et al. QIIME Allows Analysis of High-Throughput Community Sequencing Data. Nat. Methods 2010, 7, 335–336. [Google Scholar] [CrossRef]
- Venables, B. Polynom: A Collection of Functions to Implement a Class for Univariate Polynomial Manipulations—Yahoo Search—Actualités. Available online: https://fr.search.yahoo.com/search?fr=mcafee&type=E210FR91082G0&p=polynom%3A+A+Collection+of+Functions+to+Implement+a+Class+for+Univariate+Polynomial+Manipulations (accessed on 9 November 2021).
- Wichkam Ggplot2: Elegant Graphics for Data Analysis. Available online: https://ggplot2.tidyverse.org/ (accessed on 9 November 2021).
- Harrel, F.E.; Dupont, C. Hmisc: Harrell Miscellaneous. 2022. Available online: https://cran.r-project.org/web/packages/Hmisc/index.html (accessed on 22 April 2023).
- Gu, Z.; Eils, R.; Schlesner, M. Complex Heatmaps Reveal Patterns and Correlations in Multidimensional Genomic Data. Bioinformatics 2016, 32, 2847–2849. [Google Scholar] [CrossRef] [PubMed]
- McMurdie, P.J.; Holmes, S. Phyloseq: An R Package for Reproducible Interactive Analysis and Graphics of Microbiome Census Data. PLoS ONE 2013, 8, e61217. [Google Scholar] [CrossRef]
- Oksanen, J.; Blanchet, F.G.; Friendly, M.; Kindt, R.; Legendre, P.; McGlinn, D.; Minchin, P.R.; O’Hara, R.B.; Simpson, G.L.; Solymos, P. Vegan: Community Ecology Package. R Package Version 2.5-6. 2019. Available online: https://cran.r-project.org/web/packages/vegan/index.html (accessed on 22 April 2023).
- Goslee, S.C.; Urban, D.L. The Ecodist Package for Dissimilarity-Based Analysis of Ecological Data. J. Stat. Softw. 2007, 22, 1–19. [Google Scholar] [CrossRef]
- Lê, S.; Josse, J.; Husson, F. FactoMineR: An R Package for Multivariate Analysis. J. Stat. Softw. 2008, 25, 1–18. [Google Scholar] [CrossRef]
- Kassambara, A.; Mundt, F. Factoextra: Extract and Visualize the Results of Multivariate Data Analyses. 2020. Available online: https://cran.r-project.org/web/packages/factoextra/index.html (accessed on 22 April 2023).
- Kolde, R. Pheatmap: Pretty Heatmaps. 2019. Available online: https://cran.r-project.org/web/packages/pheatmap/pheatmap.pdf (accessed on 22 April 2023).
- Pađan, J.; Marcinek, S.; Cindrić, A.-M.; Santinelli, C.; Retelletti Brogi, S.; Radakovitch, O.; Garnier, C.; Omanović, D. Organic Copper Speciation by Anodic Stripping Voltammetry in Estuarine Waters with High Dissolved Organic Matter. Front. Chem. 2021, 8, 628749. [Google Scholar] [CrossRef]
- Barrera-Alba, J.J.; Gianesella, S.M.F.; Moser, G.A.O.; Saldanha-Corrêa, F.M.P. Influence of Allochthonous Organic Matter on Bacterioplankton Biomass and Activity in a Eutrophic, Sub-Tropical Estuary. Estuar. Coast. Shelf Sci. 2009, 82, 84–94. [Google Scholar] [CrossRef]
- Jonsson, S.; Andersson, A.; Nilsson, M.B.; Skyllberg, U.; Lundberg, E.; Schaefer, J.K.; Åkerblom, S.; Björn, E. Terrestrial Discharges Mediate Trophic Shifts and Enhance Methylmercury Accumulation in Estuarine Biota. Sci. Adv. 2017, 3, e1601239. [Google Scholar] [CrossRef]
- Wikner, J.; Andersson, A. Increased Freshwater Discharge Shifts the Trophic Balance in the Coastal Zone of the Northern Baltic Sea. Glob. Chang. Biol. 2012, 18, 2509–2519. [Google Scholar] [CrossRef]
- Asmala, E.; Bowers, D.G.; Autio, R.; Kaartokallio, H.; Thomas, D.N. Qualitative Changes of Riverine Dissolved Organic Matter at Low Salinities Due to Flocculation. J. Geophys. Res. Biogeosci. 2014, 119, 1919–1933. [Google Scholar] [CrossRef]
- Bauer, J.E.; Cai, W.-J.; Raymond, P.A.; Bianchi, T.S.; Hopkinson, C.S.; Regnier, P.A.G. The Changing Carbon Cycle of the Coastal Ocean. Nature 2013, 504, 61–70. [Google Scholar] [CrossRef]
- Jilbert, T.; Asmala, E.; Schröder, C.; Tiihonen, R.; Myllykangas, J.-P.; Virtasalo, J.J.; Kotilainen, A.; Peltola, P.; Ekholm, P.; Hietanen, S. Flocculation of Dissolved Organic Matter Controls the Distribution of Iron in Boreal Estuarine Sediments. Biogeosci. Discuss. 2017. [Google Scholar] [CrossRef]
- Sholkovitz, E.R. Flocculation of Dissolved Organic and Inorganic Matter during the Mixing of River Water and Seawater. Geochim. Cosmochim. Acta 1976, 40, 831–845. [Google Scholar] [CrossRef]
- Retelletti Brogi, S.; Casotti, R.; Misson, B.; Balestra, C.; Gonnelli, M.; Vestri, S.; Santinelli, C. DOM Biological Lability in an Estuarine System in Two Contrasting Periods. J. Mar. Sci. Eng. 2021, 9, 172. [Google Scholar] [CrossRef]
- Campbell, B.J.; Kirchman, D.L. Bacterial Diversity, Community Structure and Potential Growth Rates along an Estuarine Salinity Gradient. ISME J. 2013, 7, 210–220. [Google Scholar] [CrossRef]
- Goñi-Urriza, M.S.; Point, D.; Amouroux, D.; Guyoneaud, R.; Donard, O.F.X.; Caumette, P.; Duran, R. Bacterial Community Structure along the Adour Estuary (French Atlantic Coast): Influence of Salinity Gradient versus Metal Contamination. Aquat. Microb. Ecol. 2007, 49, 47–56. [Google Scholar] [CrossRef]
- Mou, X.; Sun, S.; Edwards, R.A.; Hodson, R.E.; Moran, M.A. Bacterial Carbon Processing by Generalist Species in the Coastal Ocean. Nature 2008, 451, 708–711. [Google Scholar] [CrossRef] [PubMed]
- Nelson, C.E.; Wear, E.K. Microbial Diversity and the Lability of Dissolved Organic Carbon. Proc. Natl. Acad. Sci. USA 2014, 111, 7166–7167. [Google Scholar] [CrossRef] [PubMed]
- Ewert, M.; Deming, J.W. Sea Ice Microorganisms: Environmental Constraints and Extracellular Responses. Biology 2013, 2, 603–628. [Google Scholar] [CrossRef]
- Lindh, M.V.; Lefébure, R.; Degerman, R.; Lundin, D.; Andersson, A.; Pinhassi, J. Consequences of Increased Terrestrial Dissolved Organic Matter and Temperature on Bacterioplankton Community Composition during a Baltic Sea Mesocosm Experiment. Ambio 2015, 44 (Suppl. 3), 402–412. [Google Scholar] [CrossRef] [PubMed]
- Luria, C.M.; Amaral-Zettler, L.A.; Ducklow, H.W.; Repeta, D.J.; Rhyne, A.L.; Rich, J.J. Seasonal Shifts in Bacterial Community Responses to Phytoplankton-Derived Dissolved Organic Matter in the Western Antarctic Peninsula. Front. Microbiol. 2017, 8, 2117. [Google Scholar] [CrossRef]
- Sipler, R.E.; Kellogg, C.T.; Connelly, T.L.; Roberts, Q.N.; Yager, P.L.; Bronk, D.A. Microbial Community Response to Terrestrially Derived Dissolved Organic Matter in the Coastal Arctic. Front. Microbiol. 2017, 8, 1018. [Google Scholar] [CrossRef]
- Kirchman, D.L. Growth Rates of Microbes in the Oceans. Annu. Rev. Mar. Sci. 2016, 8, 285–309. [Google Scholar] [CrossRef]
- Stocker, R.; Seymour, J.R.; Samadani, A.; Hunt, D.E.; Polz, M.F. Rapid Chemotactic Response Enables Marine Bacteria to Exploit Ephemeral Microscale Nutrient Patches. Proc. Natl. Acad. Sci. USA 2008, 105, 4209–4214. [Google Scholar] [CrossRef]
- Luo, H.; Moran, M.A. How Do Divergent Ecological Strategies Emerge among Marine Bacterioplankton Lineages? Trends Microbiol. 2015, 23, 577–584. [Google Scholar] [CrossRef]
- Hewson, I.; Fuhrman, J.A. Richness and Diversity of Bacterioplankton Species along an Estuarine Gradient in Moreton Bay, Australia. Appl. Environ. Microbiol. 2004, 70, 3425–3433. [Google Scholar] [CrossRef] [PubMed]
- Salter, I.; Galand, P.E.; Fagervold, S.K.; Lebaron, P.; Obernosterer, I.; Oliver, M.J.; Suzuki, M.T.; Tricoire, C. Seasonal Dynamics of Active SAR11 Ecotypes in the Oligotrophic Northwest Mediterranean Sea. ISME J. 2015, 9, 347–360. [Google Scholar] [CrossRef]
- Herrera, A.; Héry, M.; Stach, J.E.M.; Jaffré, T.; Normand, P.; Navarro, E. Species Richness and Phylogenetic Diversity Comparisons of Soil Microbial Communities Affected by Nickel-Mining and Revegetation Efforts in New Caledonia. Eur. J. Soil Biol. 2007, 43, 130–139. [Google Scholar] [CrossRef]
- Zhou, J.; Xia, B.; Treves, D.S.; Wu, L.-Y.; Marsh, T.L.; O’Neill, R.V.; Palumbo, A.V.; Tiedje, J.M. Spatial and Resource Factors Influencing High Microbial Diversity in Soil. Appl. Environ. Microbiol. 2002, 68, 326–334. [Google Scholar] [CrossRef] [PubMed]
- Coclet, C.; Garnier, C.; Durrieu, G.; Omanovic, D.; D’Onofrio, S.; Le Poupon, C.; Mullot, J.-U.; Briand, J.-F.; Misson, B. Changes in Bacterioplankton Communities Resulting from Direct and Indirect Interactions with Trace Metal Gradients in an Urbanized Marine Coastal Area. Front. Microbiol. 2019, 10, 257. [Google Scholar] [CrossRef]
- Fuhrman, J.A.; Cram, J.A.; Needham, D.M. Marine Microbial Community Dynamics and Their Ecological Interpretation. Nat. Rev. Microbiol. 2015, 13, 133–146. [Google Scholar] [CrossRef]
- Gilbert, J.A.; Steele, J.A.; Caporaso, J.G.; Steinbrück, L.; Reeder, J.; Temperton, B.; Huse, S.; McHardy, A.C.; Knight, R.; Joint, I.; et al. Defining Seasonal Marine Microbial Community Dynamics. ISME J. 2012, 6, 298–308. [Google Scholar] [CrossRef]
- Morris, R.M.; Rappé, M.S.; Connon, S.A.; Vergin, K.L.; Siebold, W.A.; Carlson, C.A.; Giovannoni, S.J. SAR11 Clade Dominates Ocean Surface Bacterioplankton Communities. Nature 2002, 420, 806–810. [Google Scholar] [CrossRef]
- Andrei, A.-Ş.; Salcher, M.M.; Mehrshad, M.; Rychtecký, P.; Znachor, P.; Ghai, R. Niche-Directed Evolution Modulates Genome Architecture in Freshwater Planctomycetes. ISME J. 2019, 13, 1056–1071. [Google Scholar] [CrossRef]
- Huang, X.; Dong, W.; Wang, H.; Feng, Y. Role of Acid/Alkali-Treatment in Primary Sludge Anaerobic Fermentation: Insights into Microbial Community Structure, Functional Shifts and Metabolic Output by High-Throughput Sequencing. Bioresour. Technol. 2018, 249, 943–952. [Google Scholar] [CrossRef]
- Pagnier, I.; Raoult, D.; La Scola, B. Isolation and Characterization of Reyranella massiliensis Gen. Nov., Sp. Nov. from Freshwater Samples by Using an Amoeba Co-Culture Procedure. Int. J. Syst. Evol. Microbiol. 2011, 61, 2151–2154. [Google Scholar] [CrossRef]
- Reddy, B.; Dubey, S.K. River Ganges Water as Reservoir of Microbes with Antibiotic and Metal Ion Resistance Genes: High Throughput Metagenomic Approach. Environ. Pollut. 2019, 246, 443–451. [Google Scholar] [CrossRef] [PubMed]
- Shilei, Z.; Yue, S.; Tinglin, H.; Ya, C.; Xiao, Y.; Zizhen, Z.; Yang, L.; Zaixing, L.; Jiansheng, C.; Xiao, L. Reservoir Water Stratification and Mixing Affects Microbial Community Structure and Functional Community Composition in a Stratified Drinking Reservoir. J. Environ. Manag. 2020, 267, 110456. [Google Scholar] [CrossRef] [PubMed]
- Ávila, M.P.; Brandão, L.P.M.; Brighenti, L.S.; Tonetta, D.; Reis, M.P.; Stæhr, P.A.; Asmala, E.; Amado, A.M.; Barbosa, F.A.R.; Bezerra-Neto, J.F.; et al. Linking Shifts in Bacterial Community with Changes in Dissolved Organic Matter Pool in a Tropical Lake. Sci. Total Environ. 2019, 672, 990–1003. [Google Scholar] [CrossRef] [PubMed]
- Becker, C.; Hughen, K.; Mincer, T.J.; Ossolinski, J.; Weber, L.; Apprill, A. Impact of Prawn Farming Effluent on Coral Reef Water Nutrients and Microorganisms. Aquac. Environ. Interact. 2017, 9, 331–346. [Google Scholar] [CrossRef]
- Bowman, J.P. Out From the Shadows—Resolution of the Taxonomy of the Family Cryomorphaceae. Front. Microbiol. 2020, 11, 795. [Google Scholar] [CrossRef]
- Chen, S.; Wang, P.; Liu, H.; Xie, W.; Wan, X.S.; Kao, S.-J.; Phelps, T.J.; Zhang, C. Population Dynamics of Methanogens and Methanotrophs along the Salinity Gradient in Pearl River Estuary: Implications for Methane Metabolism. Appl. Microbiol. Biotechnol. 2020, 104, 1331–1346. [Google Scholar] [CrossRef]
- Lee, D.-H.; Cha, C.-J. Flavihumibacter sediminis sp. Nov., Isolated from Tidal Flat Sediment. Int. J. Syst. Evol. Microbiol. 2016, 66, 4310–4314. [Google Scholar] [CrossRef]
- Paver, S.F.; Muratore, D.; Newton, R.J.; Coleman, M.L. Reevaluating the Salty Divide: Phylogenetic Specificity of Transitions between Marine and Freshwater Systems. mSystems 2018, 3, e00232-18. [Google Scholar] [CrossRef] [PubMed]
- Saw, J.H.W.; Yuryev, A.; Kanbe, M.; Hou, S.; Young, A.G.; Aizawa, S.-I.; Alam, M. Complete Genome Sequencing and Analysis of Saprospira Grandis Str. Lewin, a Predatory Marine Bacterium. Stand Genom. Sci. 2012, 6, 84–93. [Google Scholar] [CrossRef]
- Zhang, R.; Liu, W.; Liu, Y.; Zhang, H.; Zhao, Z.; Zou, L.; Shen, Y.; Lan, W.-S. Impacts of Anthropogenic Disturbances on Microbial Community of Coastal Waters in Shenzhen, South China. Ecotoxicology 2021, 30, 1652–1661. [Google Scholar] [CrossRef] [PubMed]
- Alteio, L.V.; Schulz, F.; Seshadri, R.; Varghese, N.; Rodriguez-Reillo, W.; Ryan, E.; Goudeau, D.; Eichorst, S.A.; Malmstrom, R.R.; Bowers, R.M.; et al. Complementary Metagenomic Approaches Improve Reconstruction of Microbial Diversity in a Forest Soil. mSystems 2020, 5, e00768-19. [Google Scholar] [CrossRef] [PubMed]
- Dixon, J.L.; Sargeant, S.; Nightingale, P.D.; Colin Murrell, J. Gradients in Microbial Methanol Uptake: Productive Coastal Upwelling Waters to Oligotrophic GyRes in the Atlantic Ocean. ISME J. 2013, 7, 568–580. [Google Scholar] [CrossRef] [PubMed]
- Eyice, Ö.; Namura, M.; Chen, Y.; Mead, A.; Samavedam, S.; Schäfer, H. SIP Metagenomics Identifies Uncultivated Methylophilaceae as Dimethylsulphide Degrading Bacteria in Soil and Lake Sediment. ISME J. 2015, 9, 2336–2348. [Google Scholar] [CrossRef] [PubMed]
- Kesy, K.; Oberbeckmann, S.; Kreikemeyer, B.; Labrenz, M. Spatial Environmental Heterogeneity Determines Young Biofilm Assemblages on Microplastics in Baltic Sea Mesocosms. Front. Microbiol. 2019, 10, 1665. [Google Scholar] [CrossRef] [PubMed]
- Rambo, I.M.; Dombrowski, N.; Constant, L.; Erdner, D.; Baker, B.J. Metabolic Relationships of Uncultured Bacteria Associated with the Microalgae Gambierdiscus. Environ. Microbiol. 2020, 22, 1764–1783. [Google Scholar] [CrossRef] [PubMed]
- Shao, Q.; Lin, Z.; Zhou, C.; Zhu, P.; Yan, X. Succession of Bacterioplankton Communities over Complete Gymnodinium-Diatom Bloom Cycles. Sci. Total Environ. 2020, 709, 135951. [Google Scholar] [CrossRef] [PubMed]
- Silva, S.G.; Lago-Lestón, A.; Costa, R.; Keller-Costa, T. Draft Genome Sequence of Sphingorhabdus Sp. Strain EL138, a Metabolically Versatile Alphaproteobacterium Isolated from the Gorgonian Coral Eunicella Labiata. Genome Announc. 2018, 6, e00142-18. [Google Scholar] [CrossRef]
- Cottrell, M.T.; Kirchman, D.L. Transcriptional Control in Marine Copiotrophic and Oligotrophic Bacteria with Streamlined Genomes. Appl. Environ. Microbiol. 2016, 82, 6010–6018. [Google Scholar] [CrossRef]
- Gilbert, J.A.; Field, D.; Swift, P.; Newbold, L.; Oliver, A.; Smyth, T.; Somerfield, P.J.; Huse, S.; Joint, I. The Seasonal Structure of Microbial Communities in the Western English Channel. Environ. Microbiol. 2009, 11, 3132–3139. [Google Scholar] [CrossRef]
- Ho, A.; Di Lonardo, D.P.; Bodelier, P.L.E. Revisiting Life Strategy Concepts in Environmental Microbial Ecology. FEMS Microbiol. Ecol. 2017, 93, fix006. [Google Scholar] [CrossRef] [PubMed]
- Carlström, C.I.; Lucas, L.N.; Rohde, R.A.; Haratian, A.; Engelbrektson, A.L.; Coates, J.D. Characterization of an Anaerobic Marine Microbial Community Exposed to Combined Fluxes of Perchlorate and Salinity. Appl. Microbiol. Biotechnol. 2016, 100, 9719–9732. [Google Scholar] [CrossRef] [PubMed]
- Chouari, R.; Le Paslier, D.; Daegelen, P.; Ginestet, P.; Weissenbach, J.; Sghir, A. Novel Predominant Archaeal and Bacterial Groups Revealed by Molecular Analysis of an Anaerobic Sludge Digester. Environ. Microbiol. 2005, 7, 1104–1115. [Google Scholar] [CrossRef] [PubMed]
- Gonçalves Pessoa, R.B.; de Oliveira, W.F.; Marques, D.S.C.; dos Santos Correia, M.T.; de Carvalho, E.V.M.M.; Coelho, L.C.B.B. The Genus Aeromonas: A General Approach. Microb. Pathog. 2019, 130, 81–94. [Google Scholar] [CrossRef]
- Herrmann, M.; Wegner, C.-E.; Taubert, M.; Geesink, P.; Lehmann, K.; Yan, L.; Lehmann, R.; Totsche, K.U.; Küsel, K. Predominance of Cand. Patescibacteria in Groundwater Is Caused by Their Preferential Mobilization From Soils and Flourishing Under Oligotrophic Conditions. Front. Microbiol. 2019, 10, 1407. [Google Scholar] [CrossRef]
- Hu, Z.-Y.; Wang, Y.-Z.; Im, W.-T.; Wang, S.-Y.; Zhao, G.-P.; Zheng, H.-J.; Quan, Z.-X. The First Complete Genome Sequence of the Class Fimbriimonadia in the Phylum Armatimonadetes. PLoS ONE 2014, 9, e100794. [Google Scholar] [CrossRef]
- Puig-Castellví, F.; Cardona, L.; Bouveresse, D.J.-R.; Cordella, C.B.Y.; Mazéas, L.; Rutledge, D.N.; Chapleur, O. Assessment of the Microbial Interplay during Anaerobic Co-Digestion of Wastewater Sludge Using Common Components Analysis. PLoS ONE 2020, 15, e0232324. [Google Scholar] [CrossRef]
- Shin, B.; Kim, M.; Zengler, K.; Chin, K.-J.; Overholt, W.A.; Gieg, L.M.; Konstantinidis, K.T.; Kostka, J.E. Anaerobic Degradation of Hexadecane and Phenanthrene Coupled to Sulfate Reduction by Enriched Consortia from Northern Gulf of Mexico Seafloor Sediment. Sci. Rep. 2019, 9, 1239. [Google Scholar] [CrossRef]
- Alonso-Sáez, L.; Díaz-Pérez, L.; Morán, X.A.G. The Hidden Seasonality of the Rare Biosphere in Coastal Marine Bacterioplankton. Environ. Microbiol. 2015, 17, 3766–3780. [Google Scholar] [CrossRef]
- Chen, L.; Hu, B.X.; Dai, H.; Zhang, X.; Xia, C.-A.; Zhang, J. Characterizing Microbial Diversity and Community Composition of Groundwater in a Salt-Freshwater Transition Zone. Sci. Total Environ. 2019, 678, 574–584. [Google Scholar] [CrossRef]
- Delacuvellerie, A.; Cyriaque, V.; Gobert, S.; Benali, S.; Wattiez, R. The Plastisphere in Marine Ecosystem Hosts Potential Specific Microbial Degraders Including Alcanivorax Borkumensis as a Key Player for the Low-Density Polyethylene Degradation. J. Hazard. Mater. 2019, 380, 120899. [Google Scholar] [CrossRef]
- Du, Z.-J.; Wang, Z.-J.; Zhao, J.-X.; Chen, G.-J. Woeseia Oceani Gen. Nov., Sp. Nov., a Chemoheterotrophic Member of the Order Chromatiales, and Proposal of Woeseiaceae Fam. Nov. Int. J. Syst. Evol. Microbiol. 2016, 66, 107–112. [Google Scholar] [CrossRef] [PubMed]
- Kim, J.-G.; Gwak, J.-H.; Jung, M.-Y.; An, S.-U.; Hyun, J.-H.; Kang, S.; Rhee, S.-K. Distinct Temporal Dynamics of Planktonic Archaeal and Bacterial Assemblages in the Bays of the Yellow Sea. PLoS ONE 2019, 14, e0221408. [Google Scholar] [CrossRef] [PubMed]
- Kwon, K.K.; Lee, H.-S.; Yang, S.H.; Kim, S.-J. Kordiimonas gwangyangensis Gen. Nov., sp. Nov., a Marine Bacterium Isolated from Marine Sediments That Forms a Distinct Phyletic Lineage (Kordiimonadales Ord. Nov.) in the ‘Alphaproteobacteria’. Int. J. Syst. Evol. Microbiol. 2005, 55, 2033–2037. [Google Scholar] [CrossRef] [PubMed]
- Nakajima, Y.; Yoshizawa, S.; Park, S.; Kumagai, Y.; Wong, S.-K.; Ogura, Y.; Hayashi, T.; Kogure, K. Draft Genome Sequence of Rubricoccus Marinus SG-29T, a Marine Bacterium within the Family Rhodothermaceae, Which Contains Two Different Rhodopsin Genes. Genome Announc. 2017, 5, e00990-17. [Google Scholar] [CrossRef]
- Tourova, T.P.; Spiridonova, E.M.; Berg, I.A.; Slobodova, N.V.; Boulygina, E.S.; Sorokin, D.Y.Y. Phylogeny and Evolution of the Family Ectothiorhodospiraceae Based on Comparison of 16S RRNA, CbbL and NifH Gene Sequences. Int. J. Syst. Evol. Microbiol. 2007, 57, 2387–2398. [Google Scholar] [CrossRef]
- Wei, Y.; Mao, H.; Wang, K.; Yao, H.; Zhang, Y.; Cao, J.; Xie, Z.; Fang, J. Algoriphagus Litoralis Sp. Nov., Isolated from the Junction between the Ocean and a Freshwater Lake. Antonie Van Leeuwenhoek 2019, 112, 1545–1552. [Google Scholar] [CrossRef]
- León, M.J.; Rodríguez-Olmos, Á.; Sánchez-Porro, C.; López-Pérez, M.; Rodríguez-Valera, F.; Soliveri, J.; Ventosa, A.; Copa-Patiño, J.L. Spiribacter Curvatus Sp. Nov., a Moderately Halophilic Bacterium Isolated from a Saltern. Int. J. Syst. Evol. Microbiol. 2015, 65, 4638–4643. [Google Scholar] [CrossRef]
- Mußmann, M.; Pjevac, P.; Krüger, K.; Dyksma, S. Genomic Repertoire of the Woeseiaceae/JTB255, Cosmopolitan and Abundant Core Members of Microbial Communities in Marine Sediments. ISME J. 2017, 11, 1276–1281. [Google Scholar] [CrossRef]
- Baquiran, J.I.P.; Nada, M.A.L.; Posadas, N.; Manogan, D.P.; Cabaitan, P.C.; Conaco, C. Population Structure and Microbial Community Diversity of Two Common Tetillid Sponges in a Tropical Reef Lagoon. PeerJ 2020, 8, e9017. [Google Scholar] [CrossRef]
- Krüger, K.; Chafee, M.; Ben Francis, T.; Glavina del Rio, T.; Becher, D.; Schweder, T.; Amann, R.I.; Teeling, H. In Marine Bacteroidetes the Bulk of Glycan Degradation during Algae Blooms Is Mediated by Few Clades Using a Restricted Set of Genes. ISME J. 2019, 13, 2800–2816. [Google Scholar] [CrossRef]
- Valdespino-Castillo, P.M.; Bautista-García, A.; Favoretto, F.; Merino-Ibarra, M.; Alcántara-Hernández, R.J.; Pi-Puig, T.; Castillo, F.S.; Espinosa-Matías, S.; Holman, H.-Y.; Blanco-Jarvio, A. Interplay of Microbial Communities with Mineral Environments in Coralline Algae. Sci. Total Environ. 2021, 757, 143877. [Google Scholar] [CrossRef] [PubMed]
- Bacosa, H.P.; Erdner, D.L.; Rosenheim, B.E.; Shetty, P.; Seitz, K.W.; Baker, B.J.; Liu, Z. Hydrocarbon Degradation and Response of Seafloor Sediment Bacterial Community in the Northern Gulf of Mexico to Light Louisiana Sweet Crude Oil. ISME J. 2018, 12, 2532–2543. [Google Scholar] [CrossRef]
- Liew, K.J.; Teo, S.C.; Shamsir, M.S.; Sani, R.K.; Chong, C.S.; Chan, K.-G.; Goh, K.M. Complete Genome Sequence of Rhodothermaceae Bacterium RA with Cellulolytic and Xylanolytic Activities. 3 Biotech 2018, 8, 376. [Google Scholar] [CrossRef]
- Fan, N.-S.; Qi, R.; Huang, B.-C.; Jin, R.-C.; Yang, M. Factors Influencing Candidatus Microthrix Parvicella Growth and Specific Filamentous Bulking Control: A Review. Chemosphere 2020, 244, 125371. [Google Scholar] [CrossRef] [PubMed]
- Müller, F.D.; Beck, S.; Strauch, E.; Linscheid, M.W. Bacterial Predators Possess Unique Membrane Lipid Structures. Lipids 2011, 46, 1129–1140. [Google Scholar] [CrossRef] [PubMed]
- Williams, H.N.; Chen, H. Environmental Regulation of the Distribution and Ecology of Bdellovibrio and Like Organisms. Front. Microbiol. 2020, 11, 2670. [Google Scholar] [CrossRef]
- Johnke, J.; Fraune, S.; Bosch, T.C.G.; Hentschel, U.; Schulenburg, H. Bdellovibrio and Like Organisms Are Predictors of Microbiome Diversity in Distinct Host Groups. Microb. Ecol. 2020, 79, 252–257. [Google Scholar] [CrossRef]
- Cram, J.A.; Parada, A.E.; Fuhrman, J.A. Dilution Reveals How Viral Lysis and Grazing Shape Microbial Communities. Limnol. Oceanogr. 2016, 61, 889–905. [Google Scholar] [CrossRef]


Disclaimer/Publisher’s Note: The statements, opinions and data contained in all publications are solely those of the individual author(s) and contributor(s) and not of MDPI and/or the editor(s). MDPI and/or the editor(s) disclaim responsibility for any injury to people or property resulting from any ideas, methods, instructions or products referred to in the content. |
© 2023 by the authors. Licensee MDPI, Basel, Switzerland. This article is an open access article distributed under the terms and conditions of the Creative Commons Attribution (CC BY) license (https://creativecommons.org/licenses/by/4.0/).