Article

Experimental Study of the Hydrodynamic Characteristics of a Submerged Floating Tunnel under Freak Wave (II: Time-Frequency Domain Study)

1
National Engineering Research Center of Port Hydraulic Construction Technology, Tianjin Research Institute for Water Transport Engineering, M.O.T., Tianjin 300456, China
2
State Key Laboratory of Coastal and Offshore Engineering, Faculty of Infrastructure Engineering, Dalian University of Technology, Dalian 116024, China
*
Author to whom correspondence should be addressed.
J. Mar. Sci. Eng. 2023, 11(5), 971; https://doi.org/10.3390/jmse11050971
Submission received: 20 March 2023 / Revised: 20 April 2023 / Accepted: 28 April 2023 / Published: 2 May 2023

Abstract

:
A freak wave is a spike in a random wave series and hence the local characteristics in the time-domain are of key importance. When freak waves act on moored floating structures, the dynamic responses of the structures in the time and frequency domains change interdependently in a short period of time. It is difficult to comprehensively and accurately describe this physical process using a single-dimensional analysis method, such as time-domain statistical analysis or frequency-domain spectral analysis. The wavelet analysis method, which can simultaneously provide the time-domain and frequency-domain joint information of the physical process, is used to discuss the time-frequency joint variation characteristics of the dynamic responses of a two-dimensional submerged floating tunnel under a freak wave. The time-frequency characteristics of the dynamic responses induced by the freak wave and the differences from the action under random waves are investigated, with a particular emphasis on the ‘convex variation’ characteristics of the dynamic responses under a freak wave. The results show that: (1) The wavelet analysis method can effectively describe the basic characteristics of the dynamic responses of the SFT under a freak wave and clearly distinguish the differences in dynamic responses under freak and random waves. (2) Freak waves have dynamic amplification effects, which are related to the freak wave parameter α1, on a two-dimensional SFT. Following the action of freak waves on a two-dimensional SFT, significant energy concentration occurs in the time-frequency spectrum of the dynamic response in a certain time and frequency range. The degree of energy concentration increases nonlinearly with an increase in α1, and a certain high-frequency energy appears in the time-frequency spectrum of the motion response. The maximum values of the time-frequency spectra of the dynamic responses under a freak wave are much larger than those under a random wave with the identical wave spectrum. (3) Following the action of a freak wave on a two-dimensional SFT, the generalised energy spectra of surge, heave, pitch, and mooring tensions have convex peak values, which occur simultaneous with the occurrence of the freak wave, and the convex parts significantly increase as α1. (4) The time lengths of the influence of a freak wave on the dynamic responses exceeded the freak wave period. With an increase in α1, the time ranges of the large values of the time-frequency spectra of surge, heave, pitch, and mooring tensions increase nearly linearly.

1. Introduction

In recent decades, more and more occurrences of freak waves have been recorded and reported in oceanographic observations globally [1]. In the meantime, many maritime accidents have demonstrated that freak waves are a serious hazard to offshore vessels and structures [2]. Numerous studies have been conducted on the freak wave, including the definition and external characteristics, generation mechanisms, probability of occurrence, numerical simulation, physical model experimental techniques [3,4,5,6,7], and freak wave-structure interactions. With the exploitation and utilisation of the ocean to the deep water, deep-water floating structures have gained increasing attention in recent years. Freak waves, as typical catastrophic waves, have drawn significant attention in the study of their interaction with floating marine structures. The wave loads, mooring tensions, motion responses, and influencing factors were investigated.
Through a model test and time-domain simulations, Clauss et al. [8] examined the motion responses and impact forces of a semi-submersible GVA4000 platform under a freak wave. It was discovered that the freak wave height determined the maximum reaction, although the increase in motion response was significantly smaller than the increase in the wave height. Rudman et al. [9,10] found that the mooring system has a significant effect on the motion responses of semi-submersibles under a freak wave, and the platform moored by the Tension Leg Platform (TLP) system generates a stronger surge and a smaller heave than that moored by the Taut Spread Mooring (TSM) system; however, the pitch is basically the same for both systems. Furthermore, Rudman and Cleary [11] revealed that the wave incident angle and pretension critically impact the maximum tension and ‘slack’ phenomenon of the semi-submersible under a freak wave. Bennett et al. [12] investigated the influence of freak waves on the motion response of a Leander-class frigate sailing at normal speed. According to the research, the accelerations of the frigate under a freak wave exceed the standard value of Lloyd’s register. The motion response of the frigate was proportional to the speed. The heave steadily increased as the frigate speed increased, whereas the pitch decreased as the frigate speed increased. Pan et al. [13] compared the differences on the dynamic responses of a moored rectangular cylinder under freak and random waves with identical wave spectra. It was discovered that the maximum motion of the cylinder significantly differs under freak and random waves, and this difference is related to the relative wave height, relative period, and freak wave parameter α1. However, the significant and average values of the cylinder motion have no difference in engineering significance.
The preceding studies were primarily concerned with the time-domain characteristics of wave loads, mooring tensions, and motion responses of floating structures under freak waves. To investigate the impact of freak waves on the frequency domain characteristics of the dynamic response of moored floating structures further, Shen et al. [14] used the hydrodynamic analysis software DeepC to calculate the motion responses of a semi-submersible platform with a working depth of 500 m under a freak wave by the nonlinear time-domain coupling method. The study shows that the platform surge is dominated by low-frequency motion, and the motion in the wave frequency is a small oscillation based on the low-frequency motion before the freak wave occurs. Following the occurrence of the freak wave, the platform first produces a large-amplitude reverse oscillation (opposite to the direction of wave propagation) and then oscillates in a large-amplitude and completely low-frequency form (the motion in the wave frequency disappears), which can last for dozens of wave periods, with a positive maximum motion occurring after approximately eight wave periods. Chandrasekaran and Koshti [15] numerically simulated the dynamic response characteristics of a TLP under ‘New Year wave’ and ‘Beihai freak wave’ based on the improved Morison equation and the rigid body motion equation. The results show that the surge of the TLP is controlled by the first-order wave force (wave frequency) and second-order drift force (much lower than the wave frequency), and is dominated by low-frequency motion. The peak frequencies of the heave and pitch were close to their natural frequencies. Based on a physical model experiment, Pan et al. [16,17] compared the differences on the dynamic responses of a moored rectangular cylinder under freak and random waves with identical wave spectra in frequency domain characteristics. According to the findings, a freak wave has a significant dynamic amplification effect on the frequency domain responses of the cylinder, which is reflected in the low-frequency responses of surge and mooring tension, implying that freak waves induce low-frequency oscillations in the system. The low-frequency responses of the system are superimposed by the low-frequency oscillation caused by the second-order drift force and the low-frequency oscillation induced by the freak wave.
Existing studies on the effects of freak waves on floating structures have revealed the complexities of the dynamic responses induced by freak waves (i.e., the wave loads and motion responses of various types of floating structures under freak waves exceed those induced by random waves in the time and frequency domains). However, freak waves have mutability in the time domain, causing the dynamic responses of moored floating structures in the time and frequency domains to change interdependently over a short period of time. It is difficult to comprehensively and accurately describe this physical process using a single-dimensional analysis method, such as time-domain statistical analysis or frequency-domain spectral analysis. Meanwhile, most studies have focused on several specific types of floating structures, such as offshore semi-submersible platforms, TSM or TLP platforms, FPSO vessels, crane vessels, and three-legged jack-up platforms. Studies on submerged floating structures are not common.
Based on the work of Pan et al. [16,17], this study investigated the dynamic responses of a two-dimensional submerged floating tunnel (2D SFT) through a model test. The wavelet analysis method, which can simultaneously provide the time-domain and frequency-domain joint information of the physical process, is used to discuss the time-frequency joint characteristics of the dynamic responses of 2D SFT under freak waves. The time-frequency joint characteristics of the dynamic responses under freak waves and their differences from the action of random waves with an identical spectrum are investigated, with a particular emphasis on the ‘convex variation’ characteristics and variation laws of the dynamic responses under freak waves.

2. Experiments

2.1. Experimental Equipment and Instruments

The experiment was performed in a large-wave-current flume at the State Key Laboratory of Coastal and Offshore Engineering at the Dalian University of Technology. The flume has a length of 60 m, a width of 2 m, and a depth of 1.8 m. The wave generation system is a hydro-servo random wave maker system and can generate waves with periods ranging from 0.5 s to 5.0 s. Multi-layer energy dissipation equipment was installed at the end of the flume to eliminate wave reflection.
The motion of moored square cylinders were measured by a contactless 6DOF (degree of freedom) measurement system, consisting of dual-CCD cameras and a data acquisition system. To track the motions, three light markers on top of the cylinder were arranged in a plane. The images of markers were acquired continuously by the dual-CCD at 30 Hz.
The mooring tension was measured by a tension sensor with an accuracy of ±0.1 N. The wave heights were collected by a DS30 wave measuring system which can control 64 wave gauges synchronously.

2.2. Model Parameters and Layout

The engineering background is the submerged floating tunnel used in the conceptual design of the SFT by the China Communications Construction (CCCc) SFT Technical Joint Research Team. The outer diameter of the tunnel was 12 m, and the interval between the cables along the longitudinal direction of the tunnel was 120 m. It should be noted that the SFT is considerably long (km level). A finite-length section (120 m) was intercepted and simplified into a rigid submerged horizontal cylinder for two-dimensional experiments in this study. The tunnel model was made of organic glass. The geometric scale of the structure was determined as λ = 60 based on equipment conditions, the geometrical dimension of the model, and the boundary effect. In the model, clump weights were placed to adjust the centre of gravity (COG) and buoyancy weight ratio (BWR). The length of the tunnel model was designed to be 1.96 m (the flume width was 2.0 m), and smooth universal balls were mounted on both ends of the model to prevent the tunnel section from colliding with the flume side wall during the test. Table 1 lists the hydrodynamic parameters of the model.
The cable prototype was made of a steel cable with a diameter of 174 mm, and the cable model was simulated using a combination of wire rope, a fixed-length spring, and a unit counterweight. Based on the Wave Model Test Regulation (JTJ/T234-2001), to simulate the model mooring line, not only the length and weight are scaled, but the curve of tension (Tm)–deformation (Δs) should also be matched. The elastic characteristics of the prototype and model cables satisfied the following equation:
T m = C p d p 2 ( Δ S / S ) n λ 3
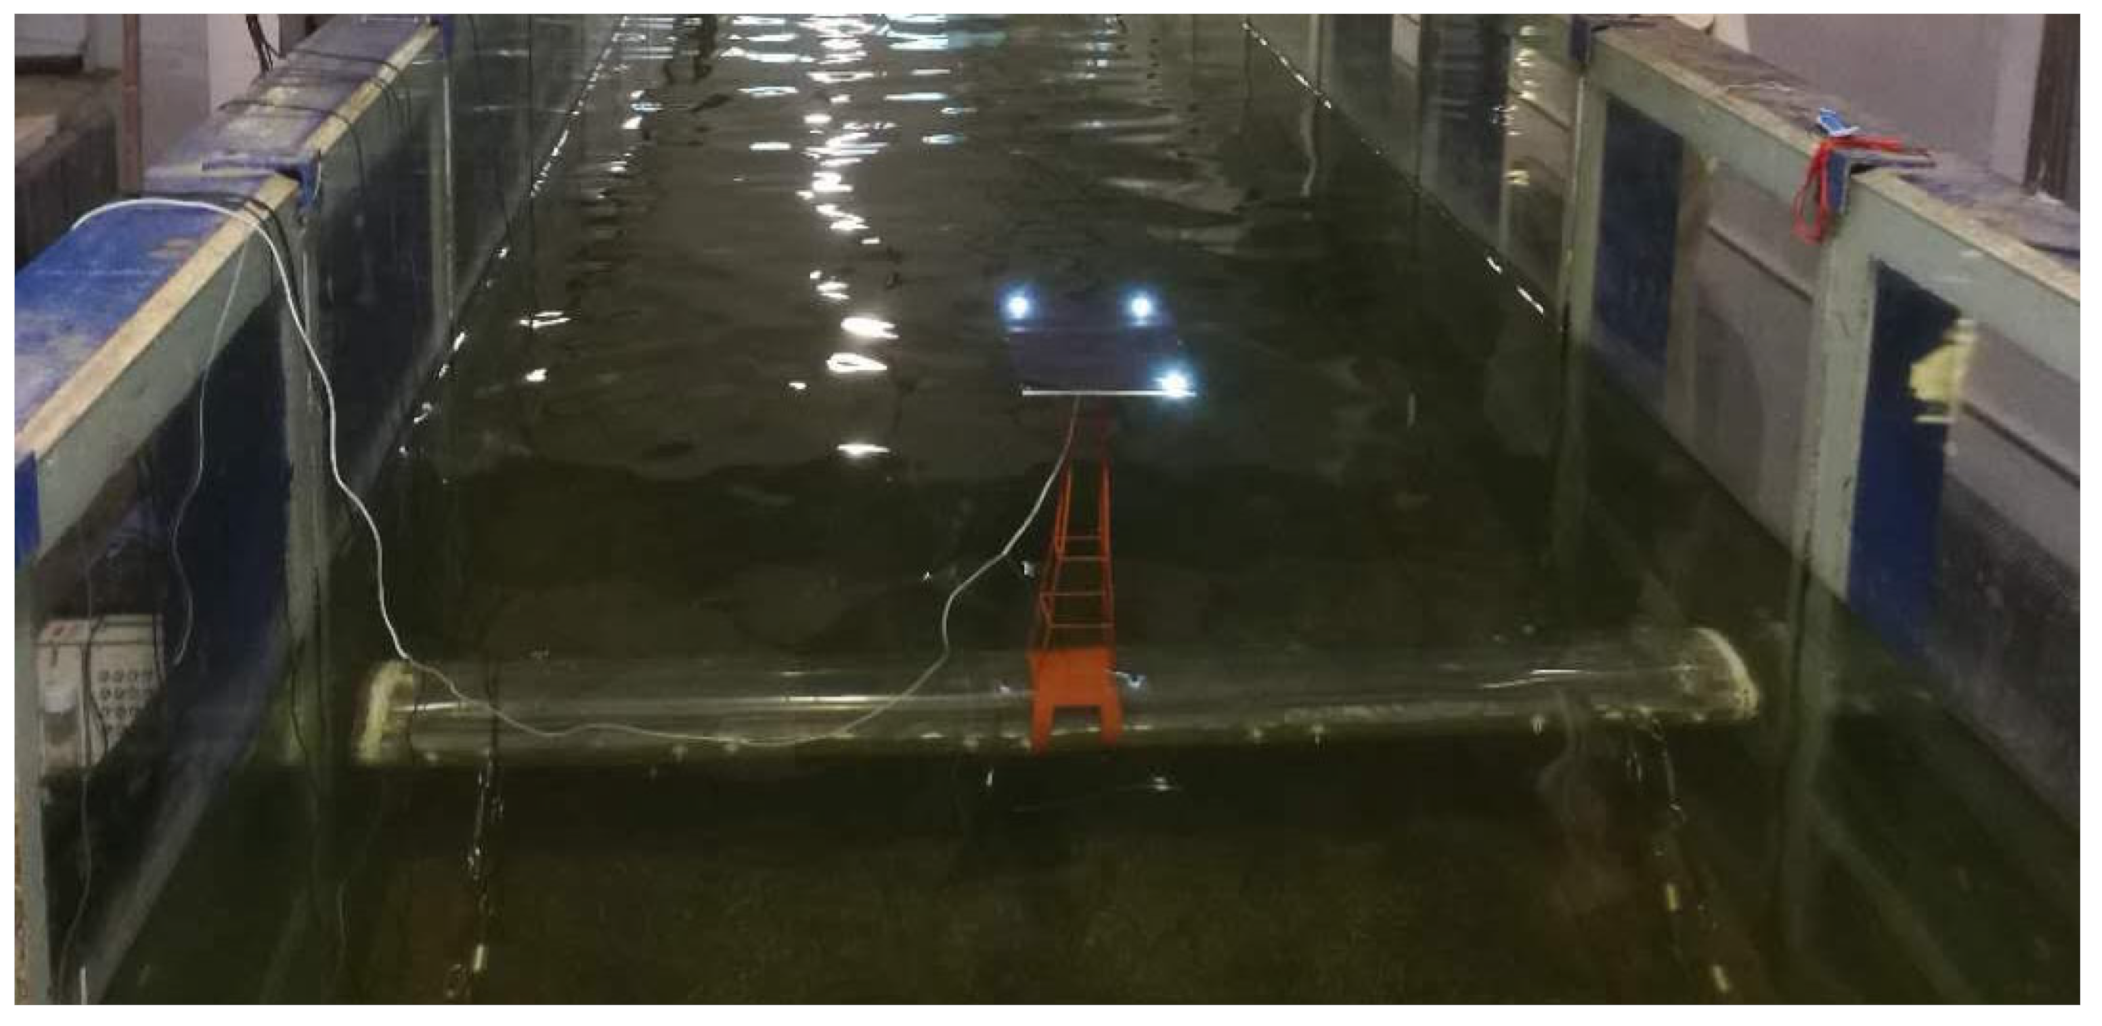
where Tm is the mooring tension of the model cable (N), Cp is the elasticity coefficient of the prototype cable (for steel cable Cp = 26.97 × 10⁴ MPa, dp is the diameter of the prototype cable (m), ΔS/S is the relative elongation of cable, and n is the index with steel cable adopting n = 1.5. The simulation of mooring lines matches both elastic and gravity similarity. An example of theoretical tension-deformation curve and measured scatters are presented in Figure 1. It shows that excellent agreement was achieved. Figure 2 shows the layout and mooring pattern of the model in a wave flume, 1#~4# indicate the number of the cable. and Figure 3 shows the moored SFT in a wave tank. Four cables at one end of the tunnel section (the other end was the same) were parallel to each other in an inclined configuration (both inclined angles were 45°). The system is in equilibrium when the initial tension of each cable is F0 = 13 N.
The two-dimensional SFT model was arranged 24 m from the wave maker where the freak wave occurred. The coordinate system is shown in Figure 4. The origin of the coordinate system is defined at the center of the model. Positive x is along the wave propagation, positive z is vertical up along the water depth, and positive y is determined by the right-hand rule. For a two-dimensional case, three motion components were investigated: surge, heave and pitch. Surge is the longitudinal motion along the x-axis (wave propagation direction is +); heave is the vertical motion along the z-axis (vertical up is +); and pitch is the rotation around the y-axis (clockwise direction is +).

2.3. Experimental Parameters and Methods

2.3.1. Experimental Parameters

The experiments were divided into four sections: tests for the natural frequency of motion components (free decay tests in still water), tests for the response amplitude operators (RAO test) of motion and mooring tension (regular waves), and tests for the time history of the motion and mooring tension (freak and random waves).
The water depth was fixed at d = 1.2 m, the submerged depth was d0 = 42 cm (d0/d = 0.35, d0/D = 2.1), and the initial mooring tension was F0 = 13 N. The average wave height was set to H = 4.0 cm. The average period range was T = 0.8~2.0 s, and the period interval for each test was 0.2 s. The experimental parameters are summarised in Table 2.
To investigate the effect of the freak wave parameter α1 (α1 = Hmax/Hs [18], ranges from 1.90 to 2.59) on the dynamic responses of the SFT, where Hmax and Hs represent the maximum wave height and significant wave height, respectively, the relative wave height and relative period were fixed (Hs/d0 = 0.095, TP/T0S = 1.25, TP/T0H = 1.23, TP/T0P = 2.96, where TP represents the spectral peak period, and T0S, T0H, and T0P are the natural frequencies of surge, heave, and pitch, respectively). The experimental parameters are summarised in Table 3.

2.3.2. Experimental Method

In the present study, the freak wave was generated at the target location using a random wave train combined with two transient wave trains, which was proposed and used by Pei et al. [19]. With the linear superposition method, the wave surface can be expressed as Equation (2), where, η denotes the elevation of the water surface above the mean water level; A1i is the amplitude of the random wave; A2i and A3i are amplitudes of the transient waves; tc and xc represent the time and space location of freak wave generation; ki is the wave number of the component wave, ωi is the circular frequency of the component wave, and εi is the random phase of the component wave, which is evenly distributed between 0 and 2π.
η x , t = η 1 x , t + η 2 x , t + η 3 x , t = i = 1 M A 1 i cos k i x + ω i t + ε i + i = 1 M A 2 i cos k i x x c + ω i t t c + i = 1 M A 3 i cos k i x x c + ω i t t c
To compare the experimental results measured under freak waves and random waves, the same spectrum with identical spectral parameters was applied. As to the wave surface, besides the significant wave height HS and spectral peak period TP, the statistical parameters such as H1/10, TH1/10, average period and average wave height are almost the same.
In the experiments, the P-M spectrum was applied as:
S ω = A ω 5 e x p B ω 4
A = 173 H s 2 T 0.1 4
B = 691 T 0.1 4
where Hs and T0.1 are the significant wave height and the average period calculated from the spectral moment, respectively.
The model was installed and moored with an initial tension of 13 N where the freak wave occurred. The measurement for each test typically lasted for more than 200 waves, and were performed two or three times to ensure repeatability.

2.3.3. Wavelet Analysis Method

The wavelet analysis method has clear advantages over the traditional Fourier analysis method. It can display the energy spectrum density of each frequency in the time domain, especially for the variation at a specific moment, which is extremely necessary for the freak waves characterized as “short-lived” [20,21,22].
Therefore, the wavelet analysis method is an appropriate choice for energy analysis of the dynamic response characteristics of floating structures under freak waves. In this study, the continuous wavelet transform method was employed to calculate the time-frequency parameter spectra of the dynamic responses of the SFT under freak waves, and their time-frequency parameter structure characteristics and variation rules were studied. For convenience of description, the time-frequency parameter spectrum obtained by wavelet analysis is referred to as the “time-frequency energy spectrum”.
The Morlet wavelet was selected as the mother wavelet, which can be expressed as
Ψ τ = π 1 / 4 e τ 2 / 2 e i w 0 τ
where ω0 is the non-dimensional frequency, here taken to be 6 to ensure a good balance between time and frequency localization [23], τ is also a non-dimensional parameter which equals to t/s, where t is the time and s is the wavelet scale, sj = s02jδj, j = 0, 1, 2, …, J, where s0 is the smallest resolvable scale and J determines the largest scale, and, in this study, s0 = 2δt and δj = 0.25, which can provide an adequate sampling in scale.
The continuous wavelet transform of a discrete sequence xn is defined as the convolution of xn with a scaled and translated version of Ψ t :
W n s = n N 1 x n ψ * n n δ t s
where the “*” indicates the complex conjugate. This is calculated by varying the wavelet scale s and translating along the localized time index n. It is considerably faster to do the calculations in Fourier space. By using the convolution theorem, the wavelet transform is the inverse Fourier transform of the product:
W n s = k = 0 N 1 x ^ k ψ ^ * s w k e i w k n δ t
where k = 0 … N − 1 is the frequency index; the Fourier transform of a function is given by ψ ^ s w k ; and the angular frequency is defined as:
w k = 2 π k N δ t k N 2 ; w k = 2 π k N δ t k > N 2
The spectral density S(f,t) of time-frequency spectrum (wavelet spectrum) is defined as:
S f , t = W s , t 2
The spectral density S(f,t) describes the variation of a physical parameter from the time domain and frequency domain. For the surge, heave and pitch of a moored square cylinder, we can determine the variation of time-frequency domain characteristics following the occurrence of freak waves and the maximum wave of a random wave. In order to investigate the variation quantitatively, the following parameters are defined:
① Time range Δt and frequency range Δf for the large value of the time-frequency spectrum.
The time and frequency ranges within which the large value of the time-frequency spectrum under freak wave exceeds the maximum value of the time-frequency spectrum under random waves are recorded as the time range Δt and frequency range Δf under a freak wave.
② “Generalized energy spectrum” E(t)
The time-frequency spectrum of a physical quantity integrated in the frequency at any time and the result can be regarded as a time history of “generalized energy spectrum”, which is denoted as E(t); Its time average is denoted as Etmean:
E t = j S i , j f j
E t m e a n = i j S i , j f j / i t i
The “generalized” total energy of each frequency component of a physical quantity when the freak wave (or the maximum wave of random wave) occurred is denoted as Ec = E (t)|t=c
E c = j S c , j f j
③ The energy concentration degree δEt
The ratio of the “generalized energy spectrum” E(t) of a physical quantity to its time average Etmean is defined as energy concentration parameter δEt:
δEt = E(t)/Etmean
The energy concentration δEt represents the concentration of the “generalized energy” at a certain moment.
The energy concentration δE when the freak wave (or the maximum wave of random wave) occurred is denoted as:
δE = Ec/Etmean
④ Time distribution parameter of energy concentration ΔTE
We are concerned with the variation and difference in the dynamic response of SFT under freak and random waves with identical spectra.
The maximum value of the “generalized energy spectrum” E(t) of a physical quantity under random wave is denoted as EImax;
For the freak wave, TEmin is the starting time of E(t) ≥ EImax after the occurrence of a freak wave. TEmax is the ending time of E(t) ≥ EImax; the response time of the freak wave is defined as ΔTE:
ΔTE = (TEmaxTEmin)/TP
The relative time ΔTE of the dynamic response under a freak wave is a dimensionless time. This parameter reflects the amount of time that a response parameter’s “generalised energy spectrum” under freak waves exceeds the maximum value of the “generalised energy spectrum” under co-spectral random waves.
mE: generalised energy spectrum area within TEmax~TEmin
After obtaining the time distribution parameter of energy concentration ΔTE of the dynamic response under a freak wave, the generalised energy spectrum area in the corresponding period TEmax~TEmin is defined as mEf, and the generalised energy spectrum area in the same period under a random wave with identical spectra is recorded as mEi.

3. Results and Discussions

3.1. Time-Frequency Spectra Characteristics of Dynamic Response

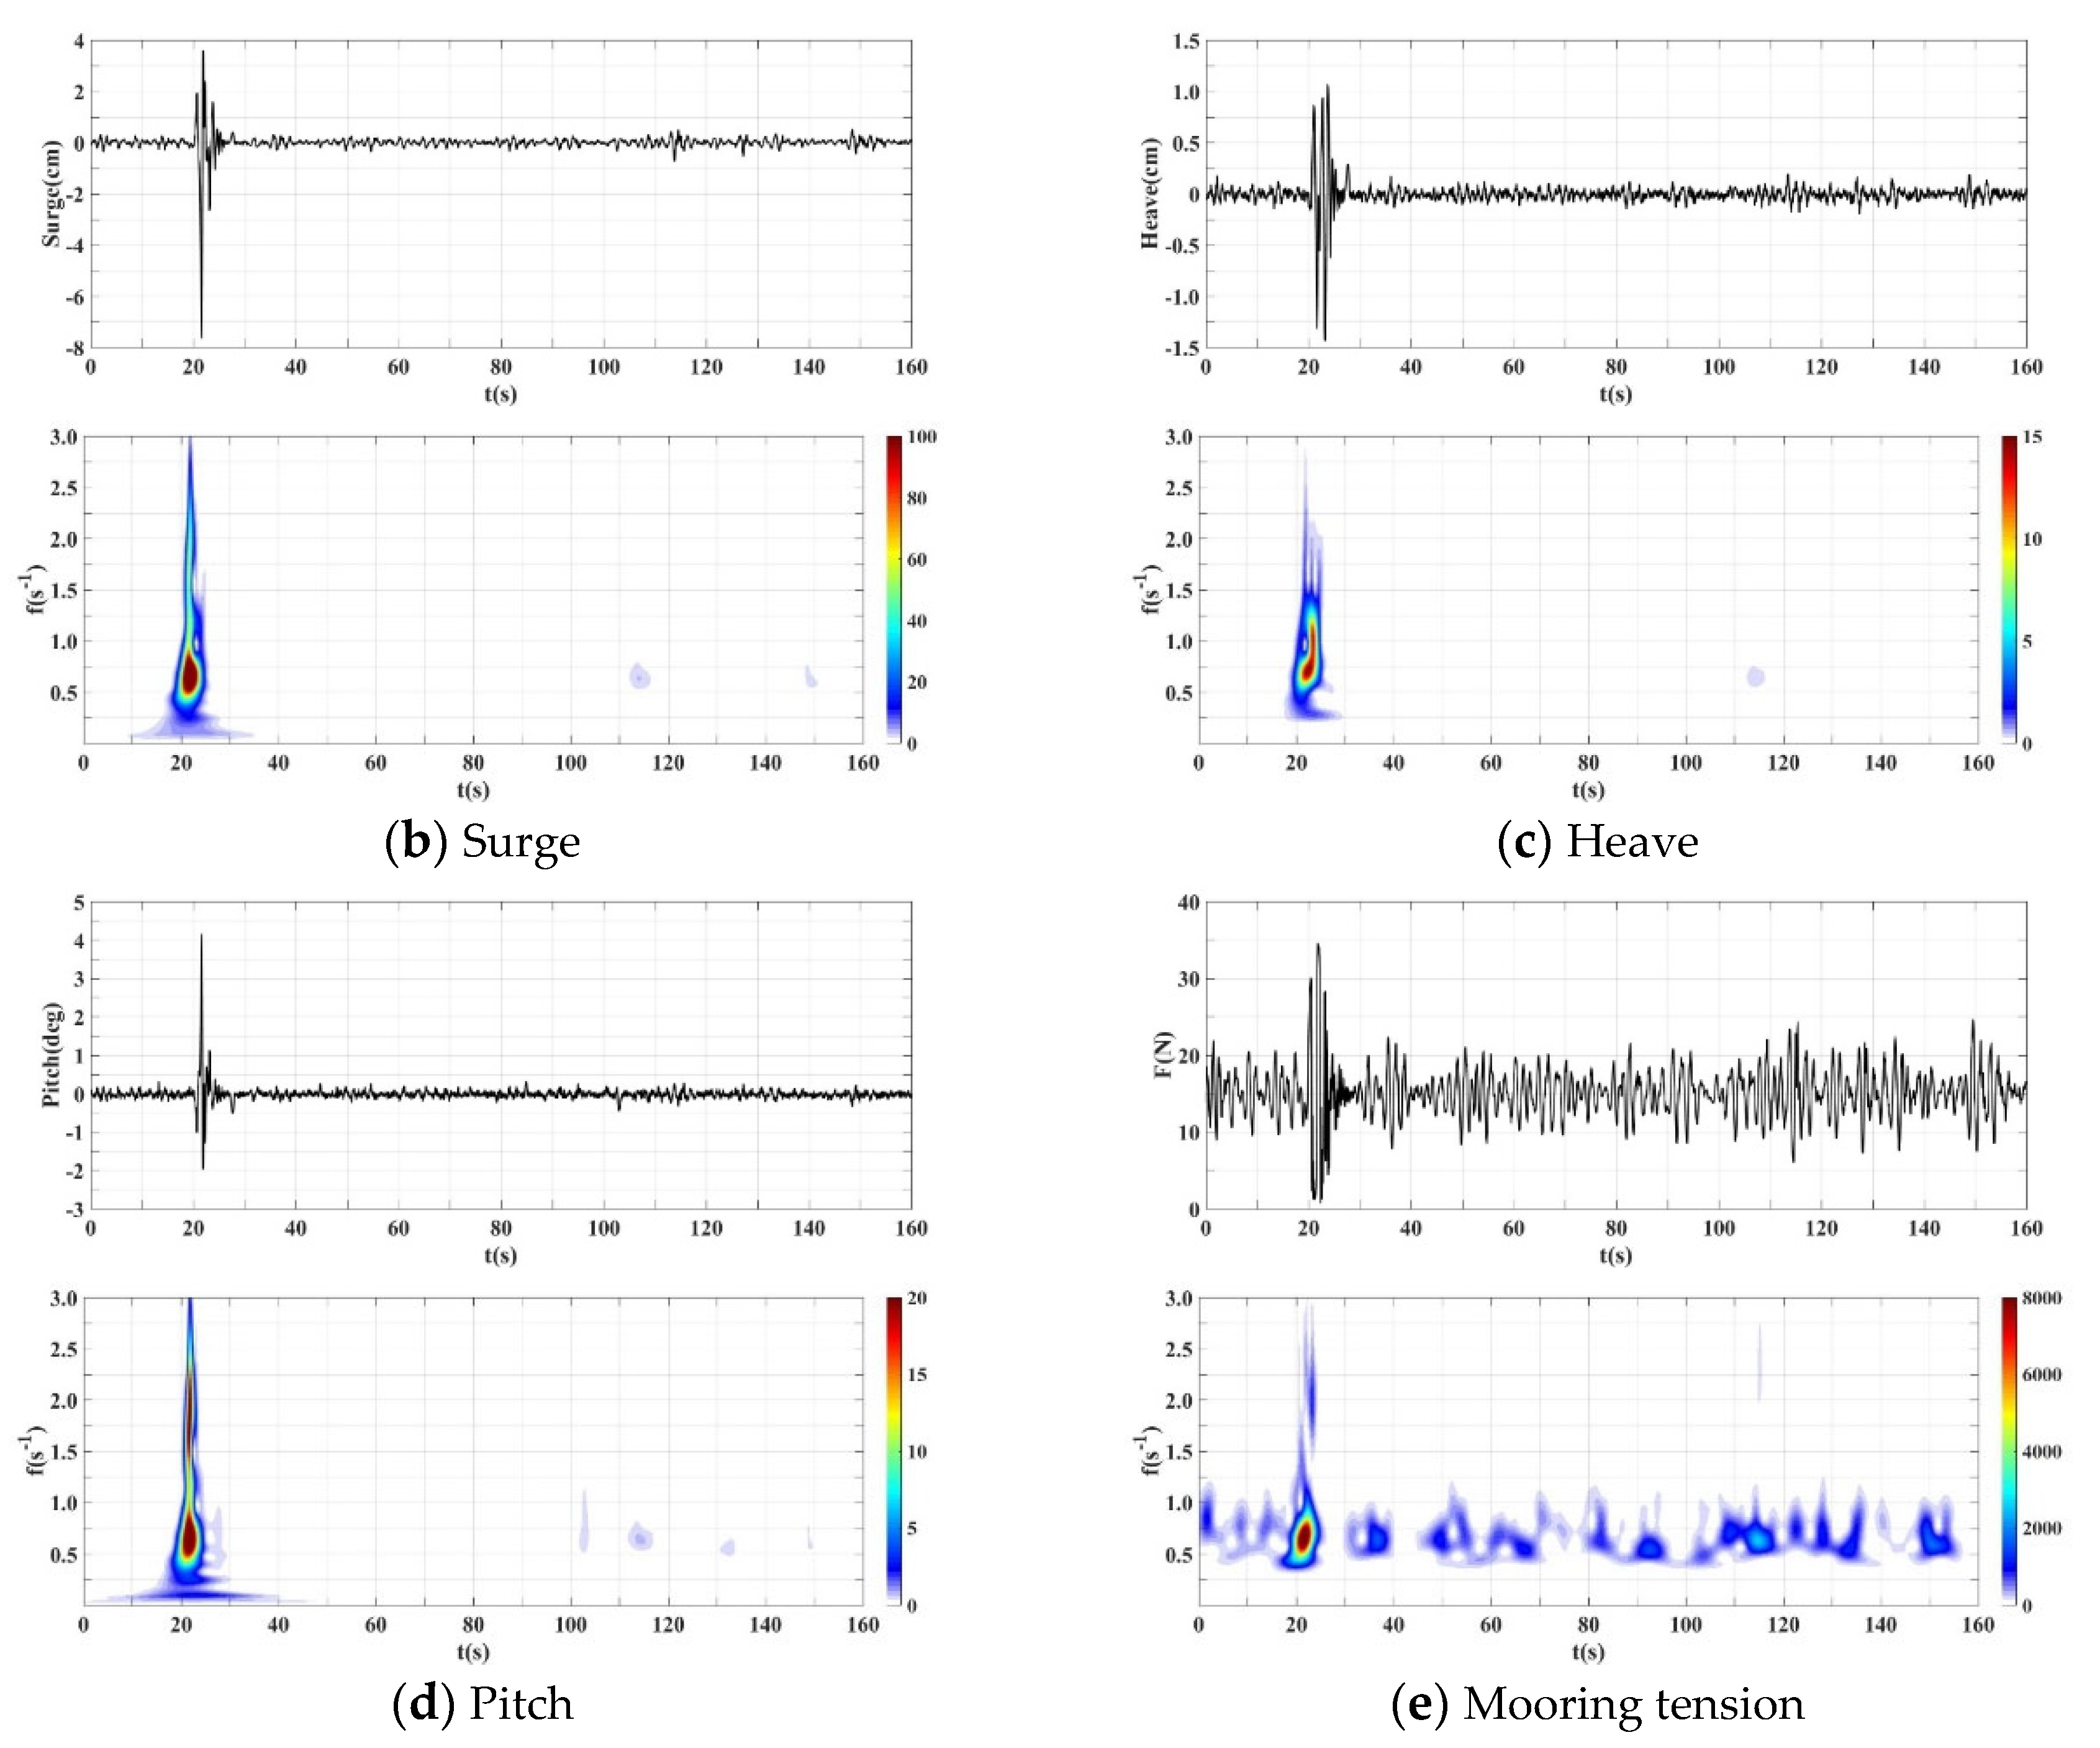
This section analyses the fundamental characteristics of the time-frequency spectra of the dynamic responses of SFT under a freak wave under the conditions of specified mooring mode, cable stiffness, and submerged depth. Figure 5 shows a set of time histories and the corresponding time-frequency spectra of the wave elevation and dynamic responses (surge, heave, pitch, and mooring tension of the upstream cable) of SFT under freak waves. In this example, the freak wave parameters are α1 = 2.52, α2 = 1.94, α3 = 2.19, and α4 = 0.65, the significant wave height is HS = 5.12 cm, and the spectral peak period is TP = 1.6 s. In addition, the arrival time of the freak wave is tc ≈ 20 s, and the relative submerged depths are d0/Lp ≈ 0.11, d0/d = 0.3, d0/Hs = 8.2, and d0/Hmax = 3.3.
As shown in Figure 5, after a freak wave acts on the 2D SFT, the characteristics of the time-frequency spectra of the surge, heave, and pitch are similar, with a high degree of energy concentration. In terms of the time dimension, the time-frequency spectrum energy concentration of the motion is strictly consistent with the occurrence of the freak wave (approximately five spectral peak periods). From the perspective of the frequency dimension, except for the significant energy concentration (near the spectral peak frequency), there is high-frequency energy in the time-frequency spectrum of the dynamic response (particularly in the surge and pitch). The reason for the significant dynamic responses of the 2D SFT under a freak wave can be explained in terms of energy propagation: the freak wave has a strong nonlinearity and the wave energy rapidly accumulates during freak wave generation, and the energy density is the highest, which has an “impact” effect on the structure and causes it to vibrate. After several wave periods, the time-frequency spectra of the dynamic responses were negligible in comparison to the freak wave action period.
The time-frequency spectrum of mooring tension exhibits a significant energy concentration, but it differs slightly from the time-frequency spectra of motions. In terms of the time dimension, the time-frequency spectrum of the mooring tension is manifested throughout the wave train action time, implying that the time-frequency spectrum outside the freak wave action period cannot be ignored. The high-frequency component produced by the freak wave in the mooring tension’s time-frequency spectrum is not as apparent as that in the motion time-frequency spectrum in terms of the frequency dimension.
In contrast to the dynamic characteristics of the mooring rectangular cylinder under a freak wave investigated by Pan et al. [16,17], which is characterised by significant low-frequency characteristics in the time-frequency spectra of the surge and mooring tension and the time-frequency spectra of the heave and pitch affected by their respective natural frequencies, the time-frequency spectra of the surge and mooring tension of the 2D SFT have no low-frequency components, but have significant high-frequency components, and the energy concentration period is significantly less than the corresponding result of the rectangular cylinder. The frequencies of the energy concentration areas in the time-frequency spectra of the surge, heave, and pitch are distributed near the spectral peak frequency of the wave spectrum. The difference between the dynamic response characteristics of a mooring rectangular cylinder and the SFT under a freak wave is mainly due to the difference in the stiffness and initial tension of the cable. The rectangular cylinder was moored with a soft mooring configuration and an initial tension of F0 = 1.1 N, while the SFT was moored with a tight mooring configuration and an initial tension of F0 = 13 N.
The time-frequency spectra of the dynamic response suddenly increases with the occurrence of the freak wave. When the freak wave passes, the energy rapidly decreases, indicating that the occurrence of the freak wave is transient. The action time of the freak wave can be intuitively captured by observing the change in the time-frequency spectrum.
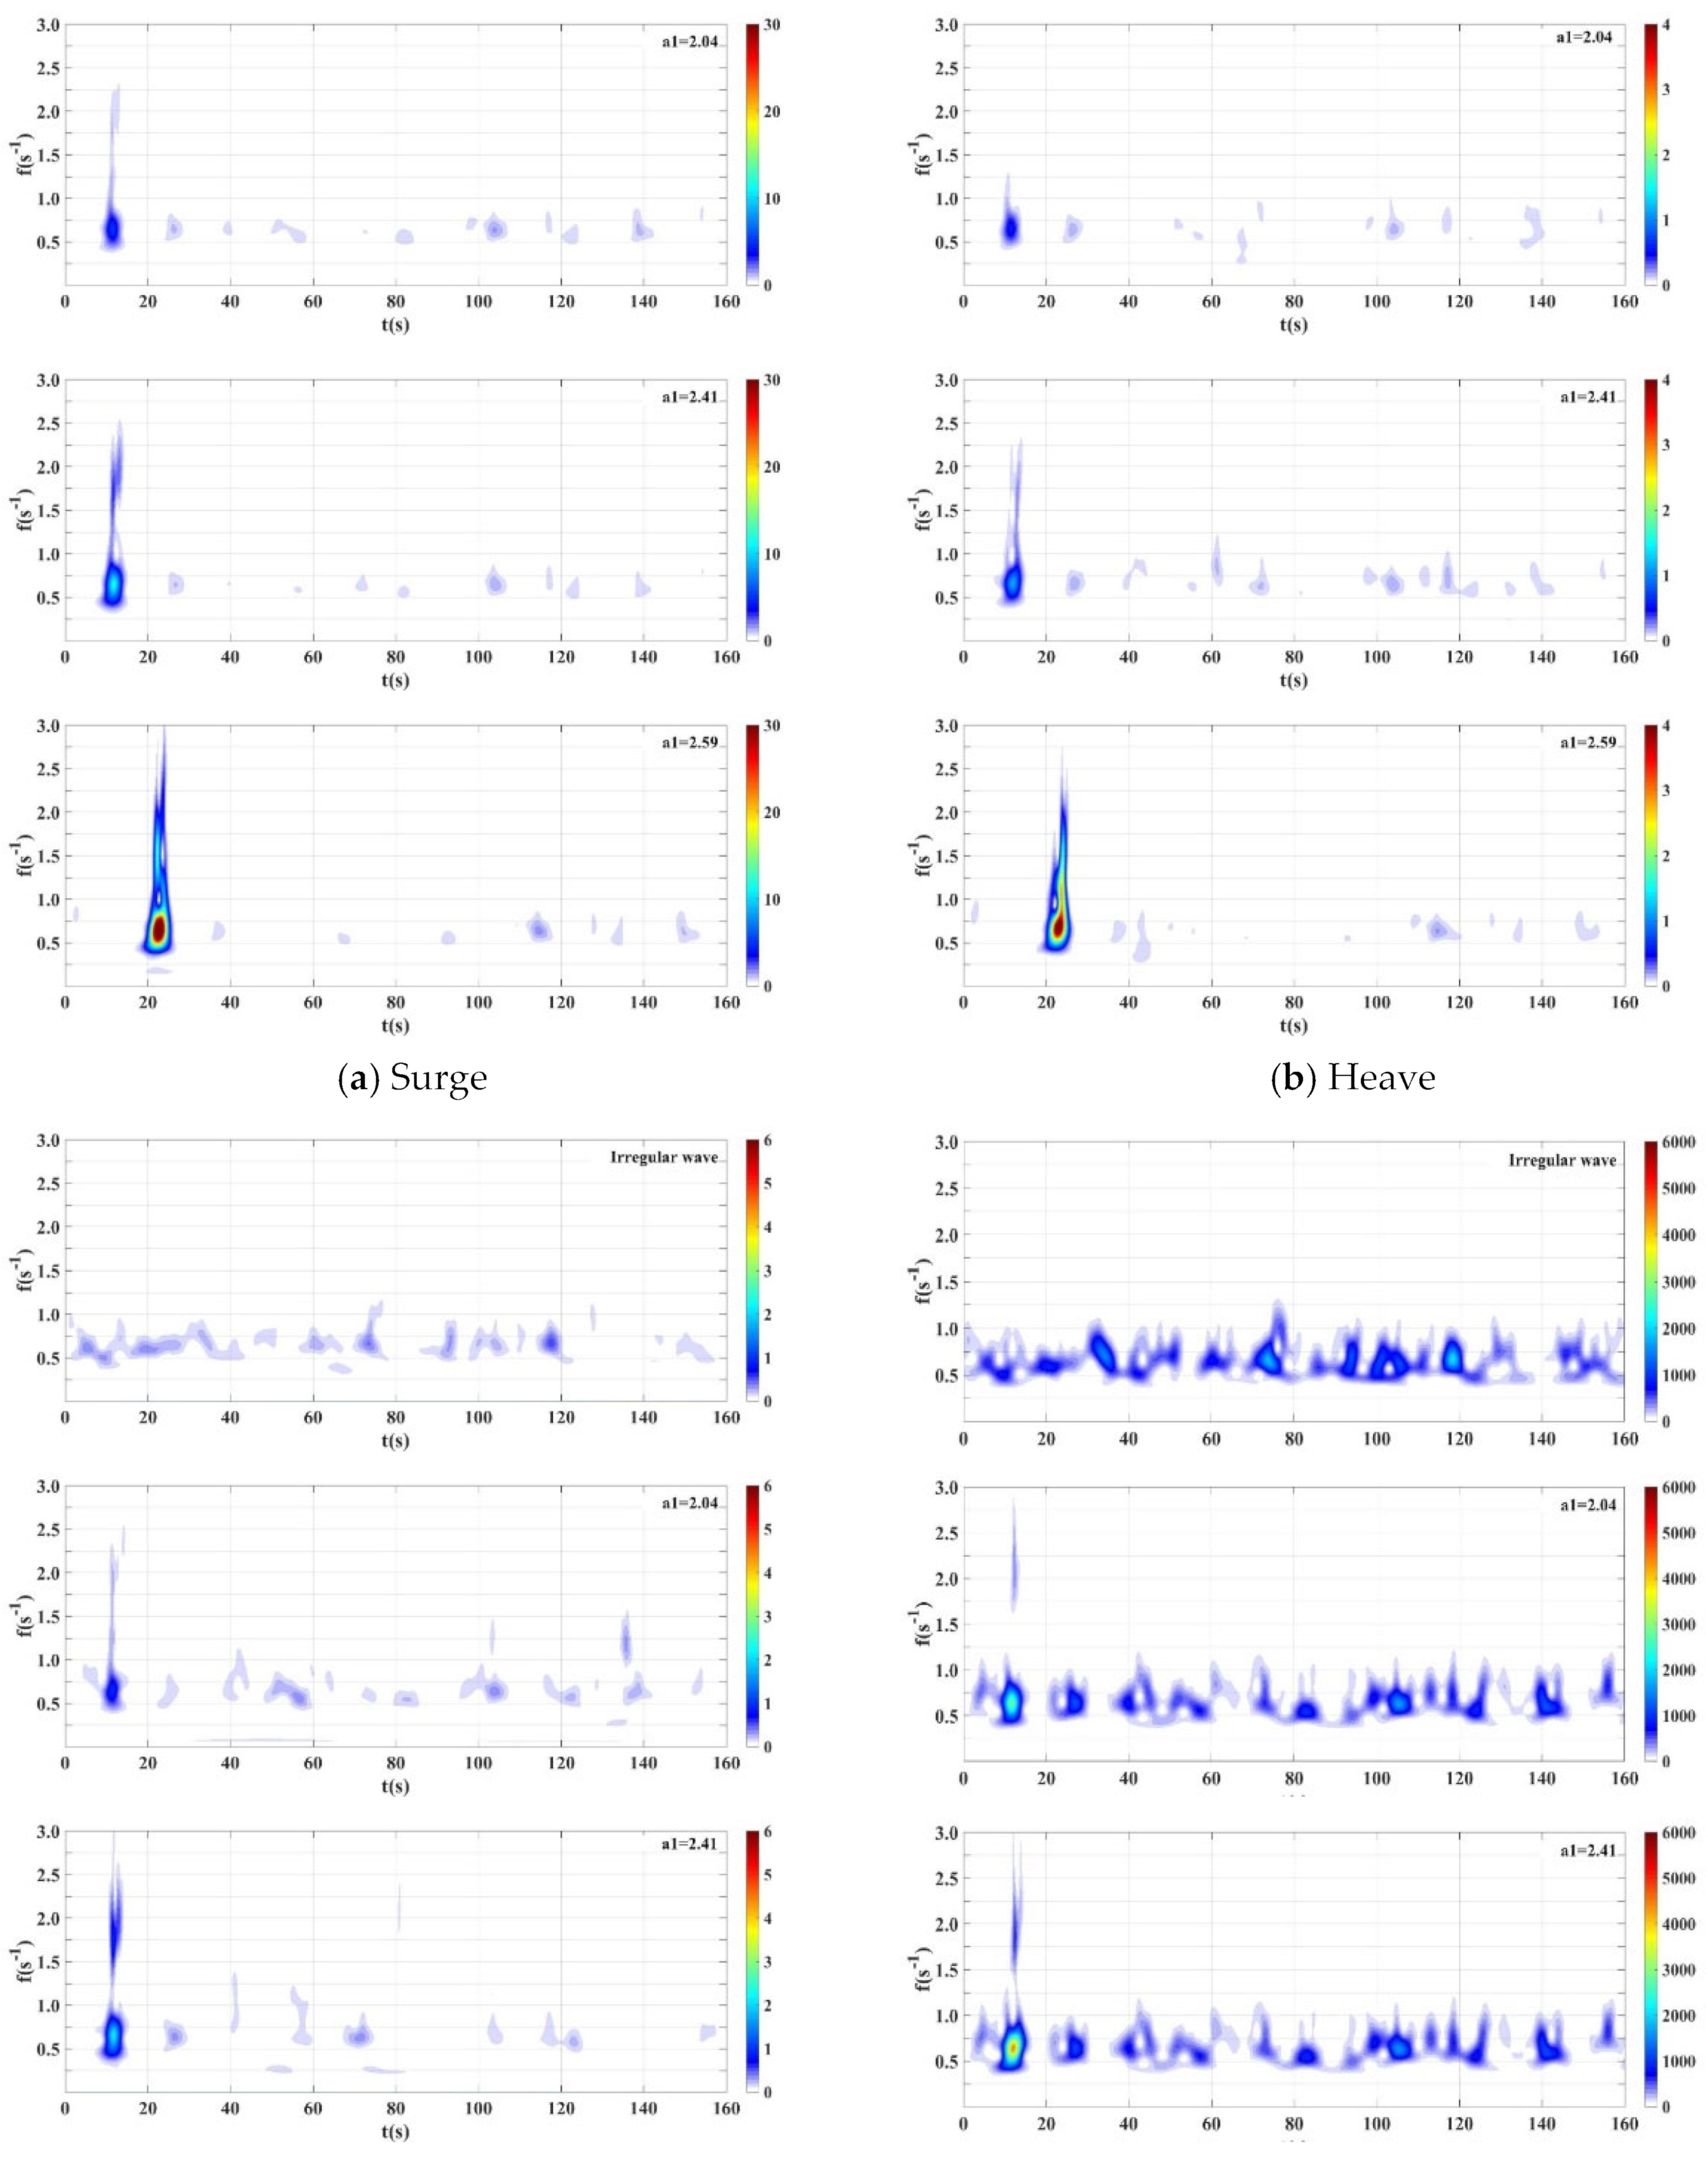
Figure 6 shows the time-frequency spectra of the dynamic responses under a freak wave with different α1 (the same spectrum). In the three examples, the freak wave parameters for α1 were 2.04, 2.41, and 2.59, respectively. The relative wave height is fixed as HS/d0 = 0.1, and the spectral peak period is set to TP = 1.6 s (TP/T0S = 1.25, TP/T0H = 1.23, TP/T0P = 2.96, and d0/Lp = 0.11). An example of the time-frequency spectrum of the dynamic response under a random wave with the identical spectrum as a freak wave is also provided for comparison.
As shown in Figure 6, the energy distribution characteristics of the time-frequency spectra are basically the same under freak waves with different α1 (the same spectrum). The time range of the time-frequency spectrum energy concentration area was approximately 3–5 spectral peak periods before and after the occurrence of the freak wave, and the frequency range was near the spectral peak frequency. With an increase in α1, the peak of the time-frequency spectrum of the dynamic response significantly increases, and there are apparent high-frequency components. The maximum value of the time-frequency spectrum density of the dynamic responses under a freak wave was significantly greater than that under random waves with an identical spectrum. There is no energy concentration and no high-frequency component in the time-frequency spectra of the dynamic responses caused by the random wave.
Based on the preceding examples, the basic characteristics of the time-frequency spectra of the dynamic responses of the 2D SFT under a freak wave are as follows: ① the time and frequency ranges of the energy concentration area of the dynamic responses in the time-frequency spectrum are almost identical, all occurring near the occurrence of the freak wave. ② The time-frequency spectra of the surge, heave, pitch, and mooring tension exhibit significant energy concentration phenomena with the occurrence of the freak wave, with the maximum value of the time-frequency spectrum density being significantly greater than that caused by the co-spectral random wave. ③ From the frequency dimension, the time-frequency spectra of the dynamic responses have high-frequency energy, which is significantly correlated with the freak wave parameter α1.

3.2. Time-Frequency Structure Analysis of Dynamic Response

3.2.1. Time-Frequency Spectrum Parameter Analysis

The experiment simulated six sets of freak-wave trains and six sets of random-wave trains based on the same wave spectrum. The freak wave parameter α1 changes in the range of 1.90~2.59, and other parameters are fixed as follows: the water depth d = 120 cm, submerged depth d0 = 42 cm, relative submerged depth d0/d = 0.35, initial tension F0 = 13 N, spectral peak period TP = 1.6 s (relative period TP/T0S = 1.25, TP/T0H = 1.23, TP/T0P = 2.96), and significant wave height Hs = 4.0 cm (the relative wave height Hs/d0 = 0.10).
Table 4, Table 5, Table 6 and Table 7 summarise the results of the peak value Smax, time range Δt, and frequency range Δf for large values of the time-frequency spectra of the dynamic responses under a freak wave with a different α1.
The variation law of the time range for a large value of the time-frequency spectra of the dynamic responses with α1 are shown in Figure 7a. The abscissas of the curves were α1, and the ordinate was the time range Δt for the large value of the time-frequency spectra dimensionless with the spectral peak period. The variation law of the frequency range for the large value of the time-frequency spectra of the dynamic responses with α1 are shown in Figure 7b. The abscissas of the curves were α1 and the ordinate was the frequency range Δf for large values of the time-frequency spectra that are dimensionless with respective natural frequencies of the motion responses. The Δf of the mooring tension was dimensionless with the natural frequency of the surge. The variation law of the ratio of the maximum value of the time-frequency spectrum under freak and random waves with α1 are shown in Figure 7c. The abscissas of the curves were α1, and the ordinate was the ratio of the maximum value of the time-frequency spectrum under freak and random waves. Subscripts ‘S’, ‘H’, ‘P’, ‘T’ represent the surge, heave, pitch and mooring tension, respectively.
Figure 7a shows that the time range Δt for a large value of the time-frequency spectra of surge, heave, pitch, and mooring tension increases with an increase in α1 (nearly linear). The large values of the time-frequency spectra of surge, heave, pitch, and mooring tension appear in the range of 2.8–5.4 TP, 1.9–4.3 TP, 0.4–4.6 TP, and 1.8–2.8 TP, respectively, and the Δt of the surge is slightly larger than that of the others. These results show that the time length of the freak wave affecting the dynamic responses of the SFT is longer than that of the freak wave period, but less than the time length of the surge and mooring tension of the moored square cylinder under a freak wave [16,17], which include dozens of wave spectrum peak periods.
Figure 7b shows that the frequency range Δf for a large value of the time-frequency spectra of surge, heave, and pitch increase rapidly (nonlinearly) with an increase in the α1, especially for a surge. The Δf of mooring tension increases slightly with an increase in α1, which is significantly smaller than the growth trends of the motion responses. In the range of α1 = 2.0–2.59, the frequency ranges Δf of surge, heave, pitch, and mooring tension are 0.6–3.0 f0S, 0.3–2.2 f0H, 0.1–1.3 f0P, and 0.3–0.6 f0S, respectively.
Figure 7c shows that the maximum values of the time-frequency spectra of surge, heave, pitch, and mooring tension under freak waves are significantly larger than those under a random wave, particularly the surge and mooring tension. The ratio of the maximum values of the time-frequency spectra of the motion responses under freak and random waves increases rapidly (nonlinearly) with an increase in α1, especially for a surge. The ratio of the mooring tension slightly increases as α1 increases, which is significantly less than the growth trends of the motion responses. In the range of α1 = 2.0–2.59, the ratios of the maximum values of the time-frequency spectra of the surge, heave, pitch, and mooring tension are 2.7–22.6, 1.5–11.7, 1.7–12.4, and 1.5–3.11, respectively.
In summary, the variations in the time-frequency spectra and spectral parameters of the dynamic responses under freak wave with α1 are as follows: ① When a freak wave acts on the 2D SFT, the time-frequency spectra of the dynamic responses exhibit significant energy concentration phenomena in a time and frequency range, and the degree of energy concentration increases nonlinearly as α1. The maximum value of the time-frequency spectrum under a freak wave was significantly greater than that caused by the co-spectral random wave. ② The time and frequency ranges of the energy concentration in the time-frequency spectrum of the dynamic responses are almost identical, all occurring near the occurrence time of the freak wave in the time domain and the wave peak frequency in the frequency domain. ③ From the frequency dimension, the time-frequency spectra of the dynamic response have a high-frequency energy that is significantly correlated with α1. Furthermore, the high-frequency component of the mooring tension is not as significant as that of the motion responses.

3.2.2. Generalized Energy Spectrum and Spectral Parameter Analysis

(1)
Basic characteristics of the generalized energy spectrum
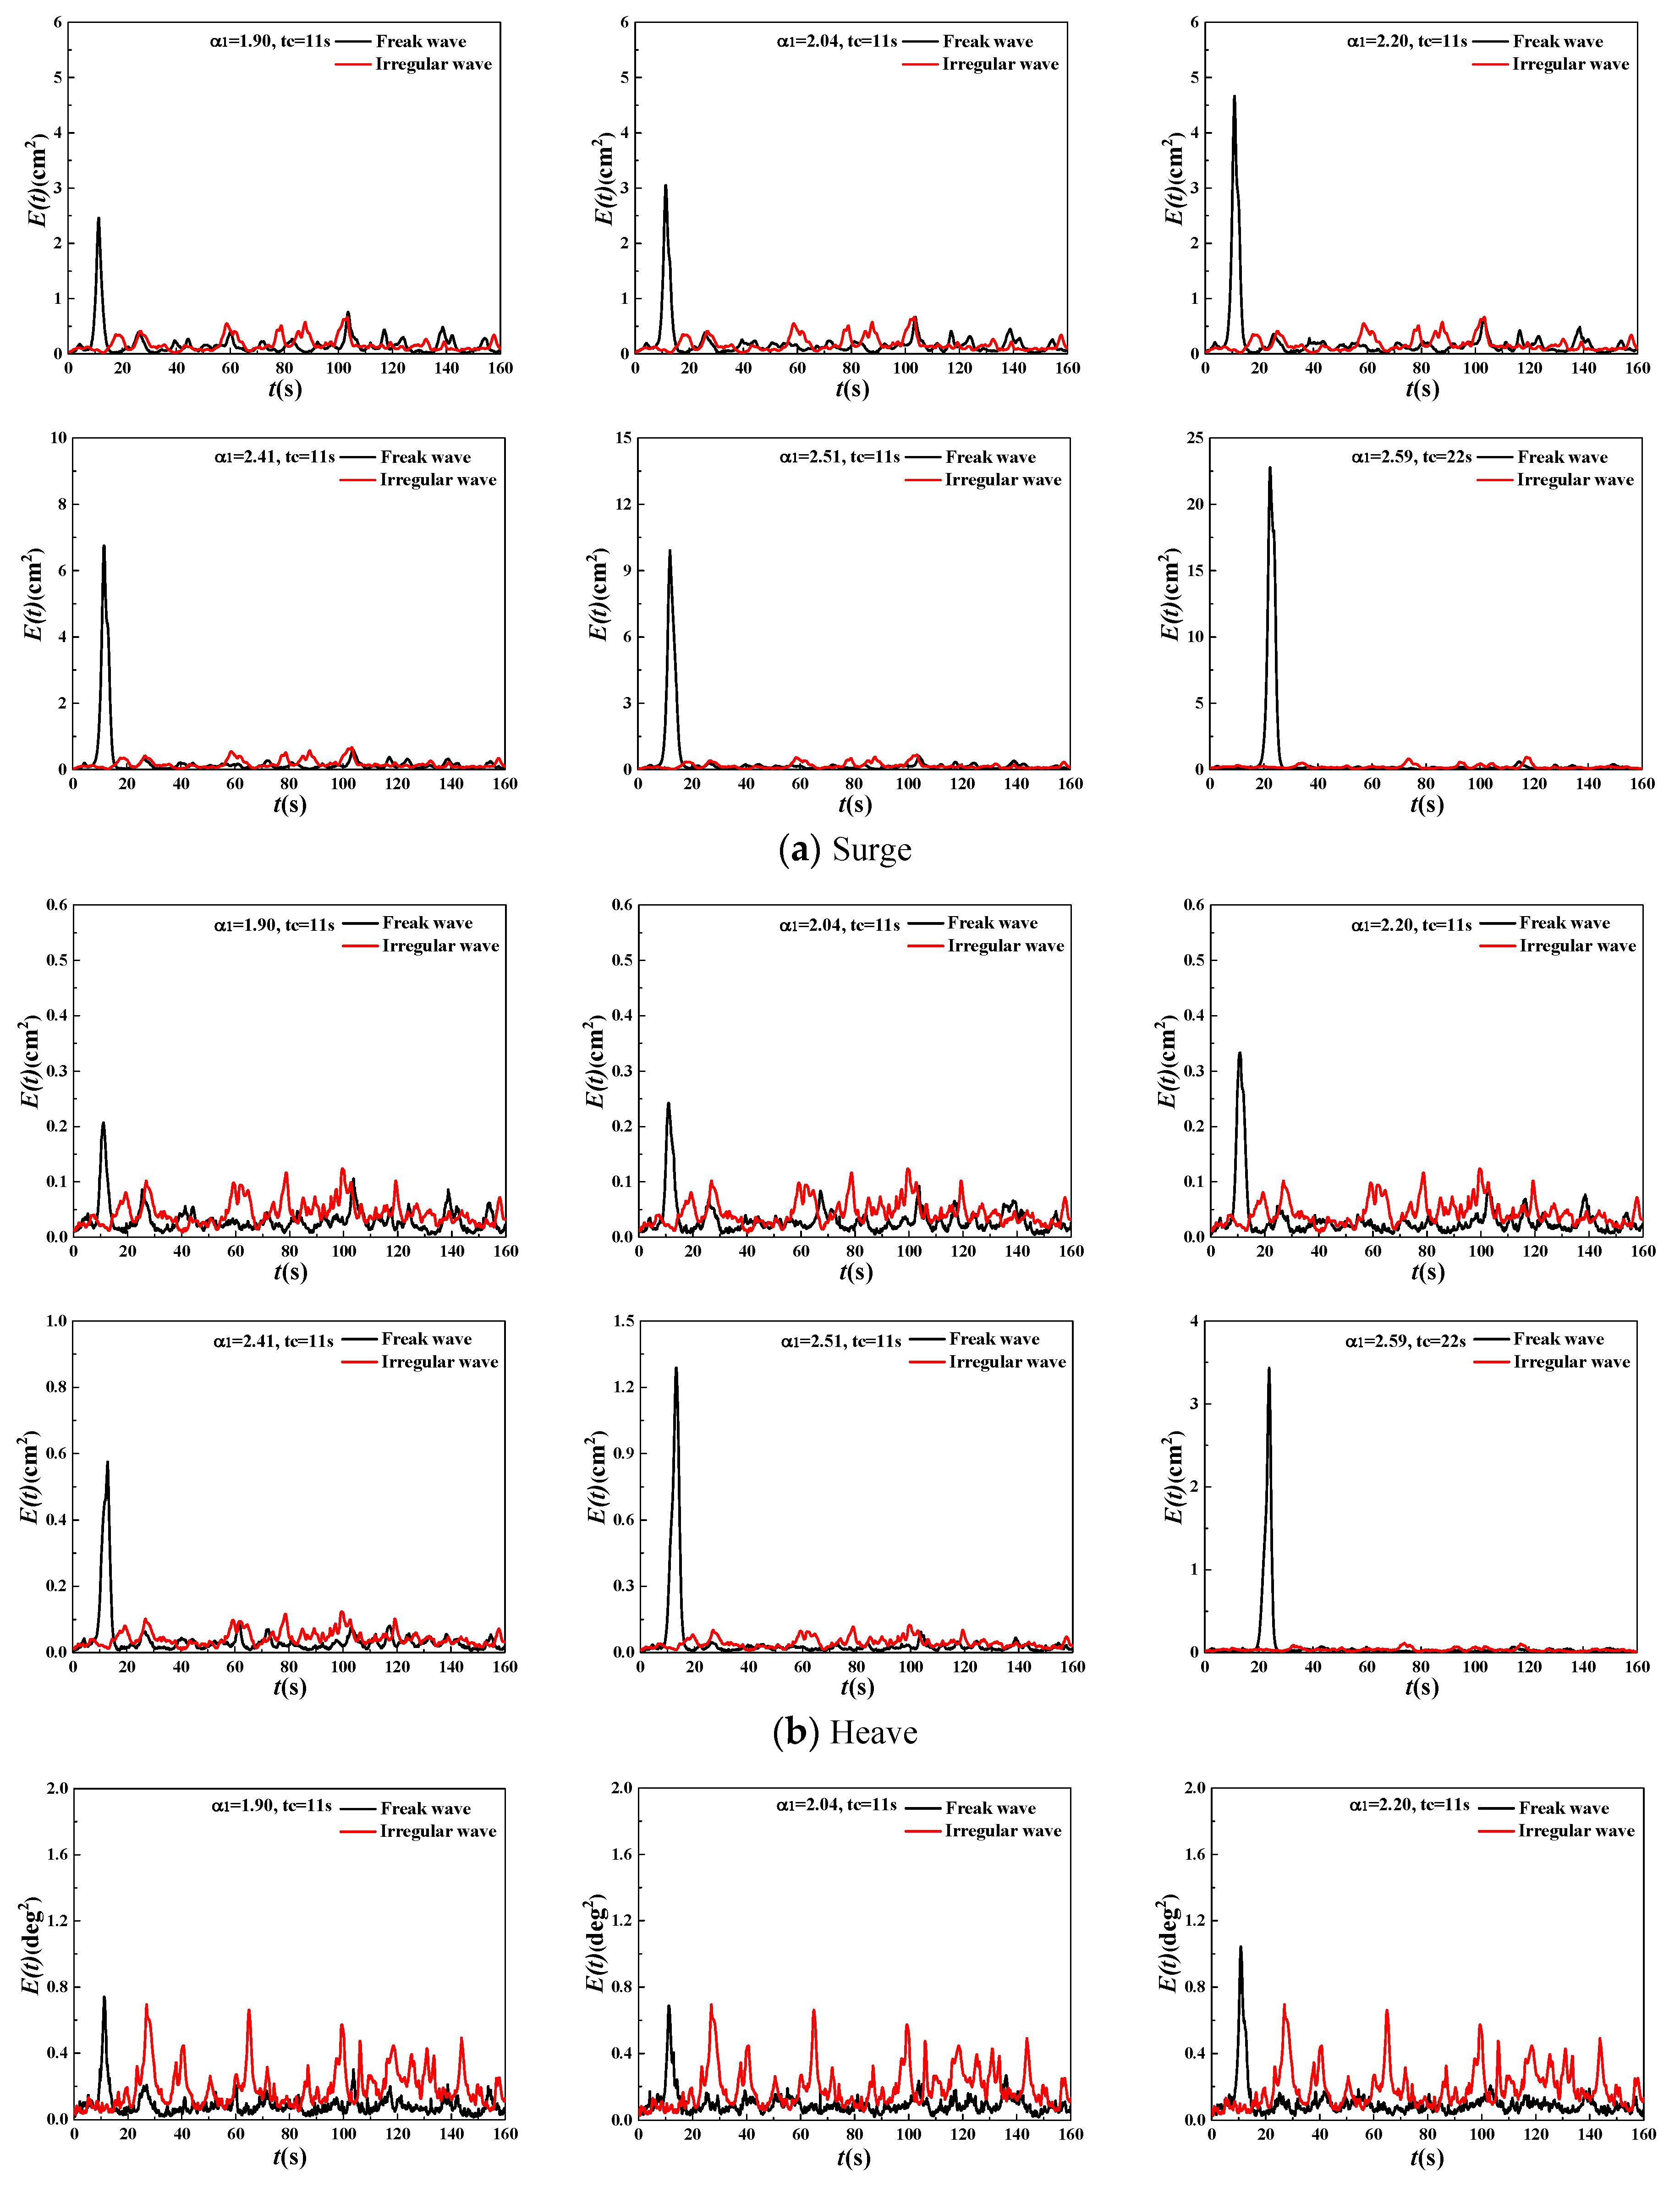
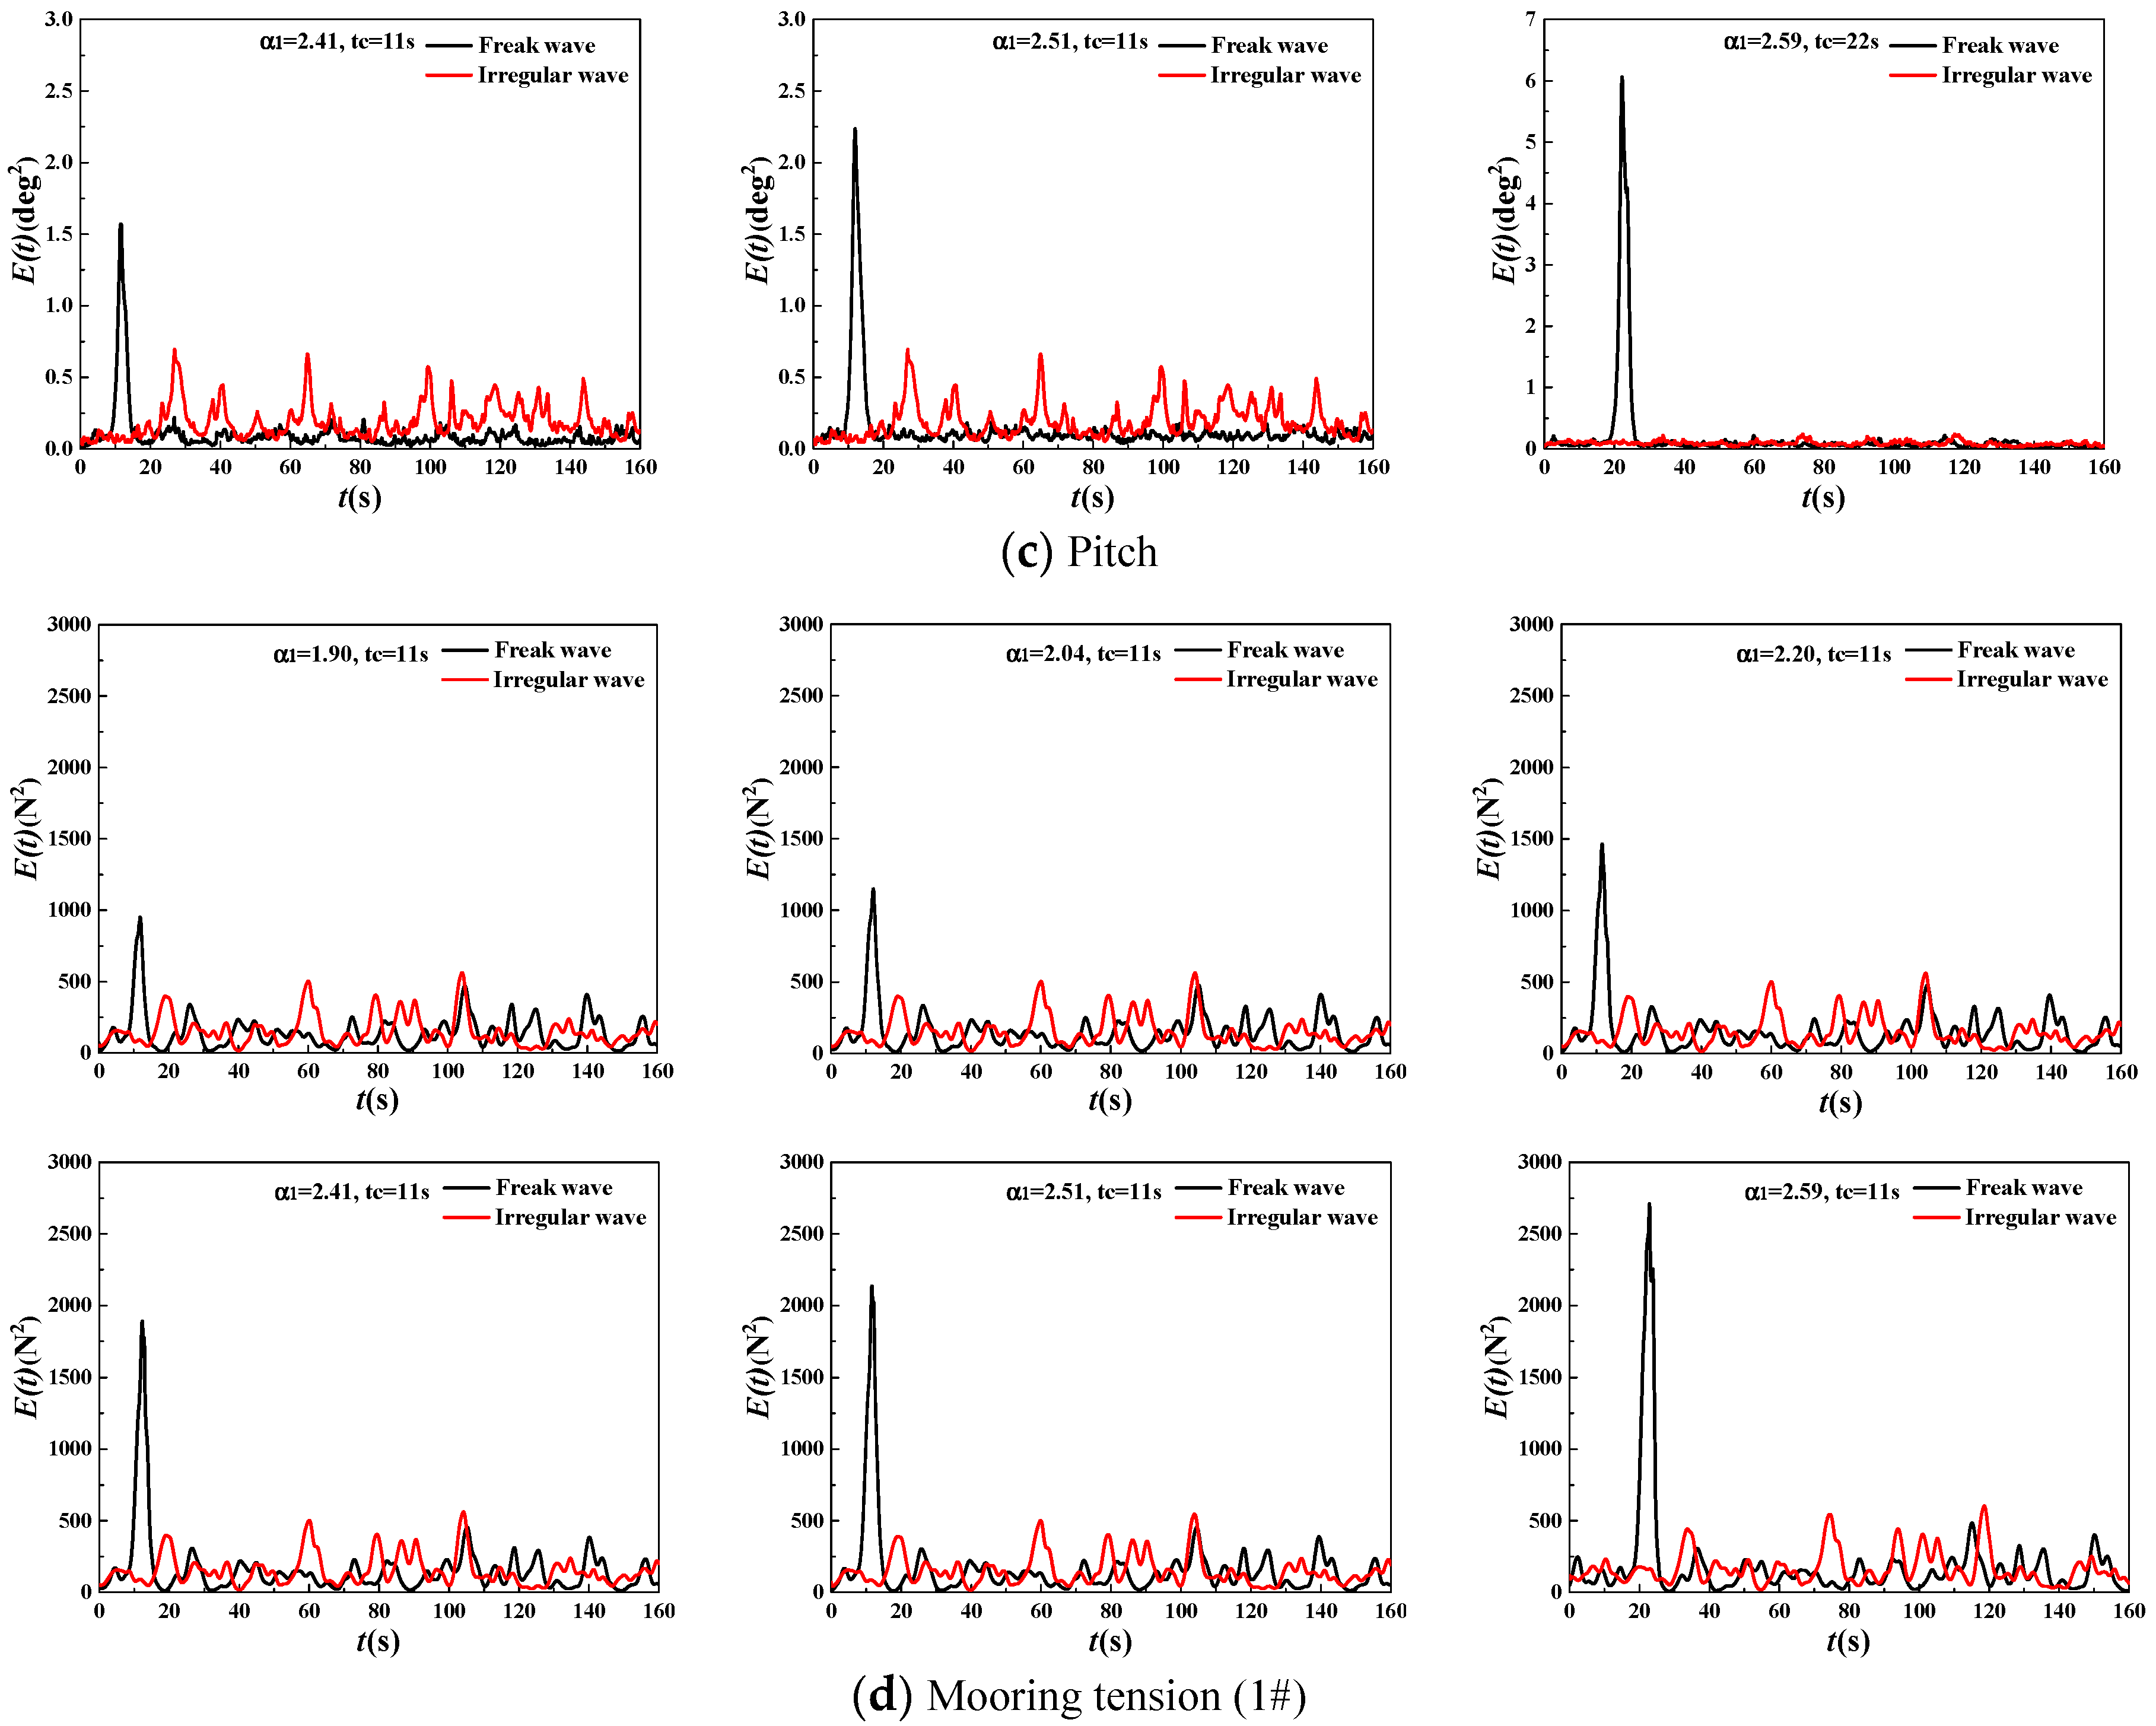
Figure 8 shows the results of the “generalised energy spectrum” E(t) of the surge, heave, pitch, and mooring tension under freak wave with different α1. In addition, the results for same-spectrum random waves are presented for comparison. Figure 6 shows the following:
① The “generalised energy spectrum” E(t) of dynamic responses of the 2D SFT under a freak wave have “convex” peak values that appear simultaneously with the occurrence of freak wave, indicating that they are completely “affiliated” with the freak wave. These findings are consistent with the phenomenon revealed by the dynamic response time histories. In comparison to the direct time-domain description, the generalised energy spectrum can more sensitively capture dynamic responses of the SFT under freak waves.
② The “convex” parts in the generalised energy spectra of the dynamic responses under freak wave significantly grow as the freak wave parameter α1 increases, and the “convex” peak values are significantly larger than those of the generalized energy spectrum under random waves with identical spectra. These differ from the results of the moored square cylinder [16,17], in which the “convex” parts of the surge and mooring tension significantly increase as α1 increases, while the heave and pitch do not.
③ The time ranges of the “convex” peak values in the generalised energy spectra of the surge, heave, pitch, and mooring tension are almost identical. These differ from those of the moored square cylinder [16,17], in which the time range of “convex” parts of the surge and mooring tension is much longer than the freak wave period.
(2)
Generalised energy spectrum parameters
Table 8, Table 9, Table 10 and Table 11 summarise the results of the generalised energy spectrum parameters, such as the energy concentration degree δE, maximum value of the generalised energy spectrum Emax, mE (generalised energy spectrum area within TEmax~TEmin), and the time distribution parameter of energy concentration ΔTE under a freak wave with various α1 and random waves with identical spectra.
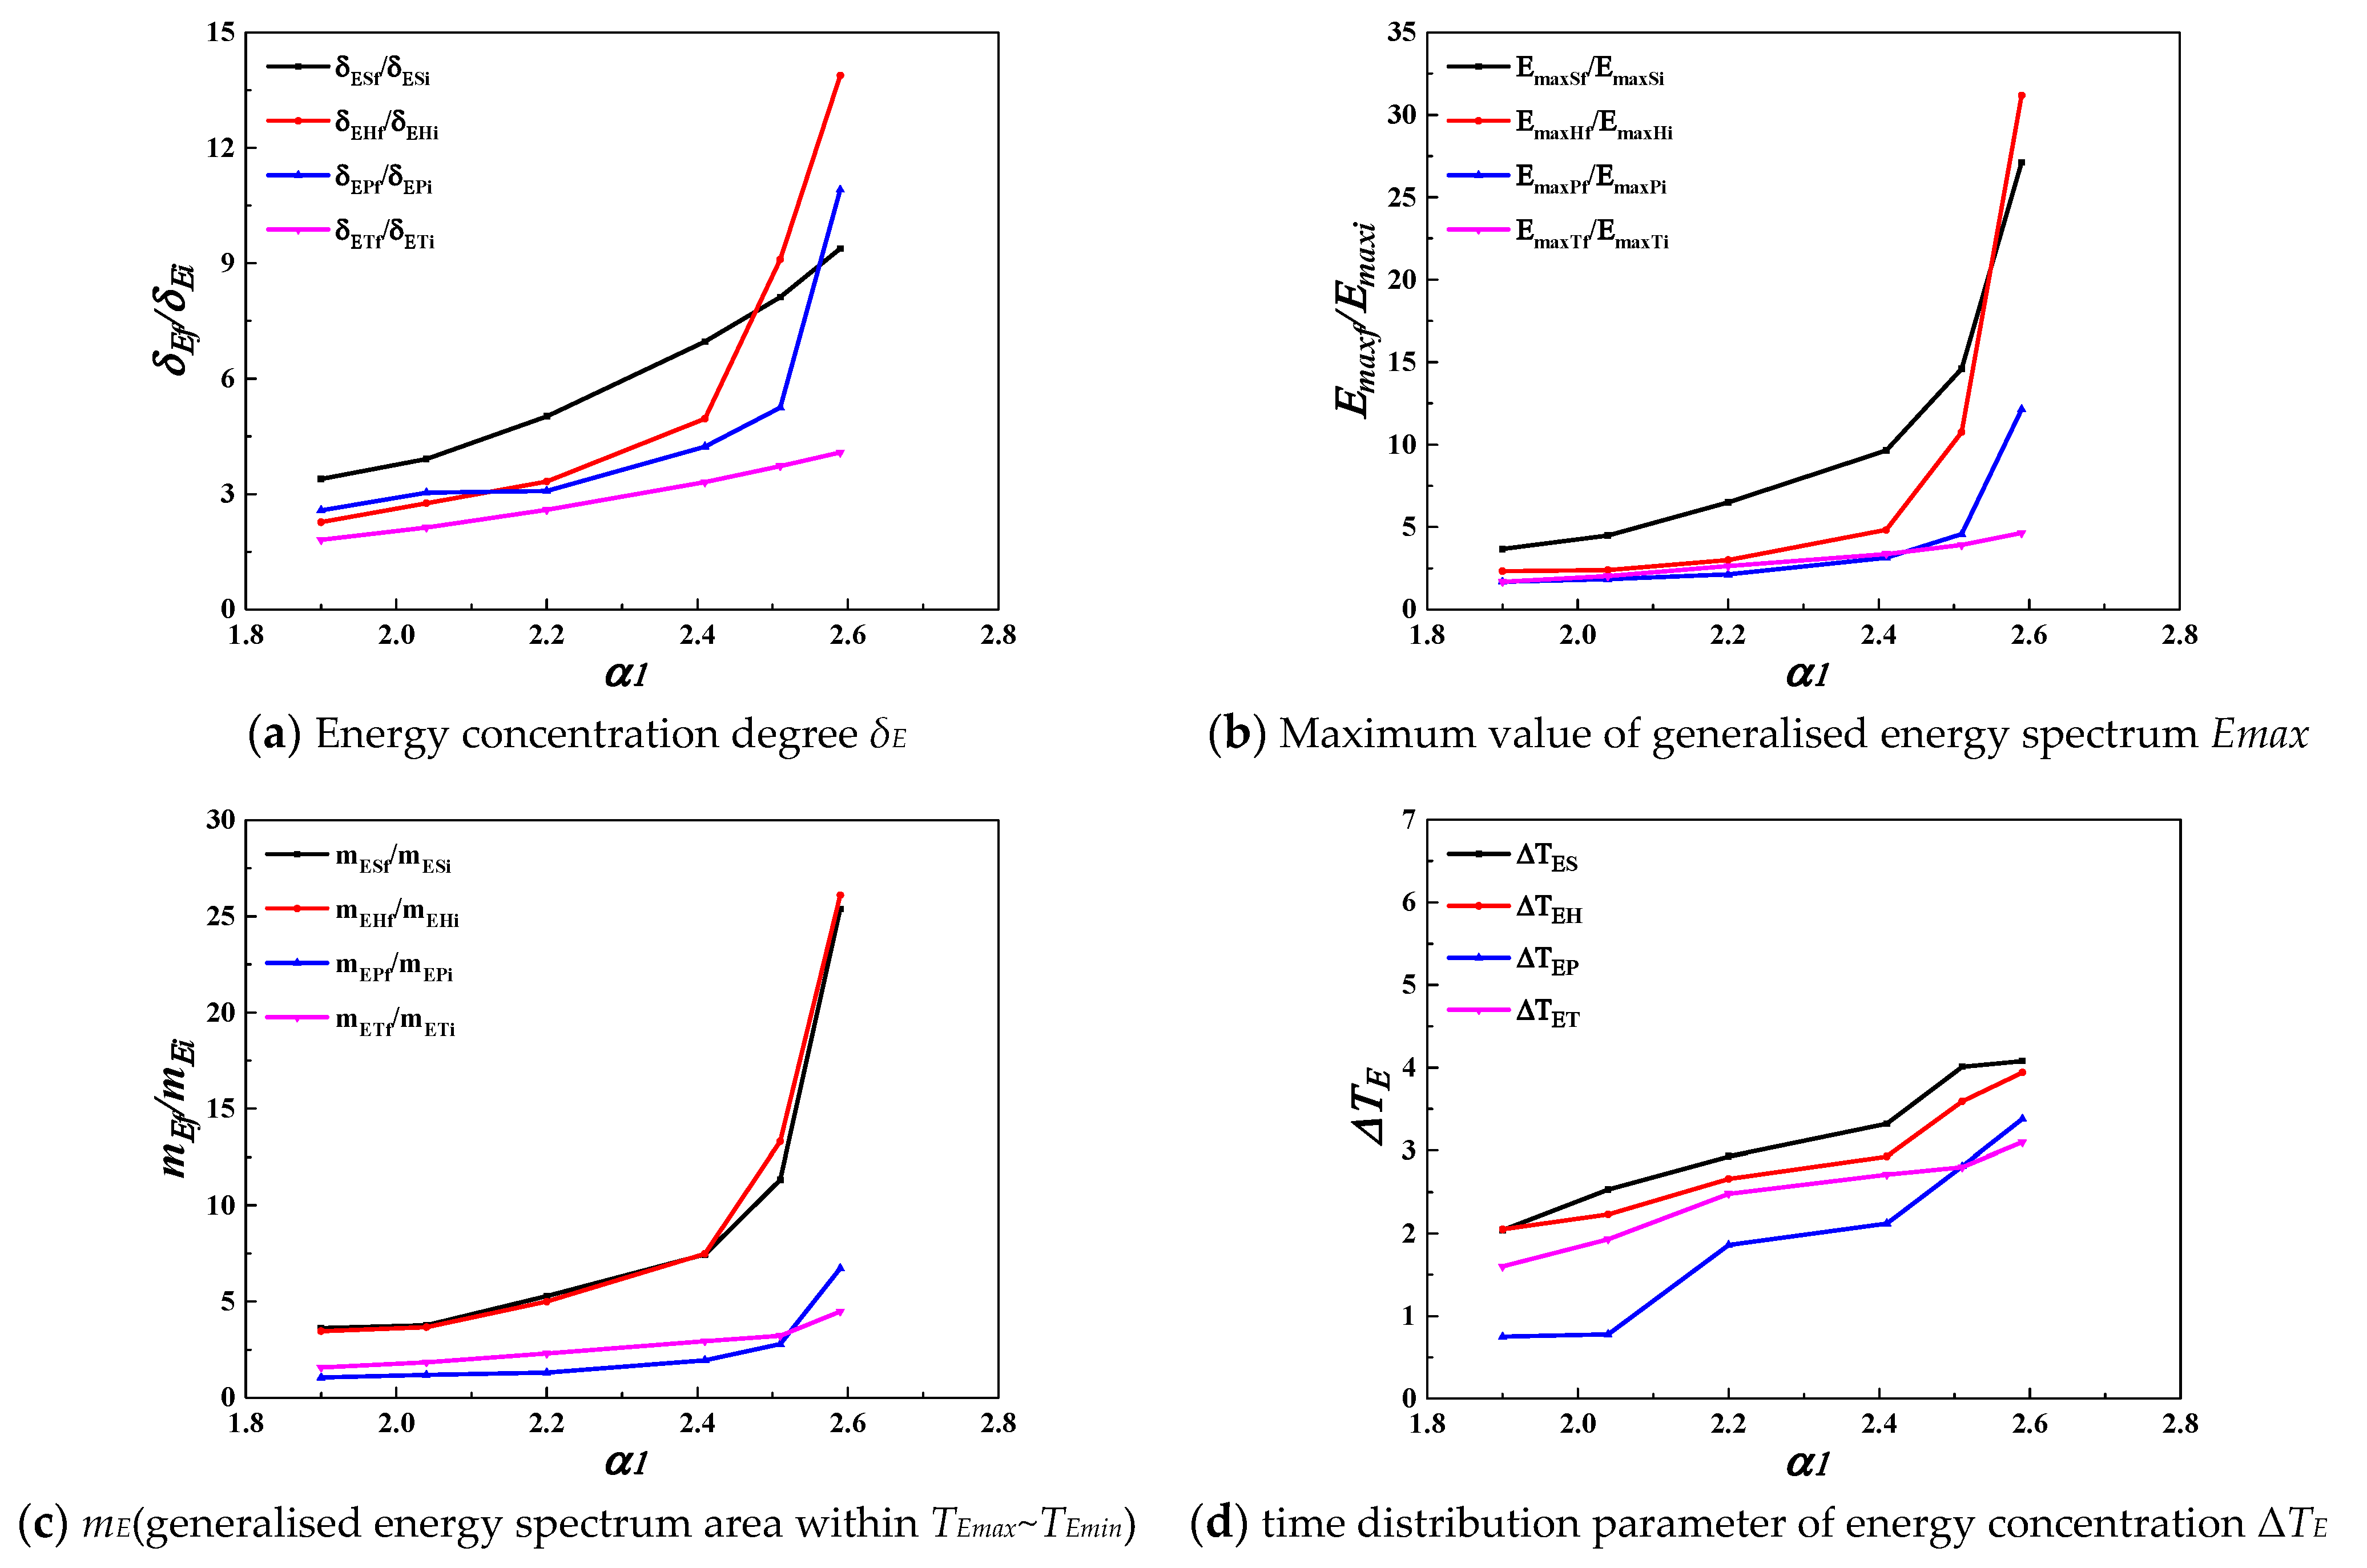
The ratio of the energy concentration degree δE of dynamic response under freak and random waves with α1 are shown in Figure 9a. The abscissas of the curves were α1, and the ordinate were the ratio of the energy concentration degree δE of dynamic response under freak and random waves. Similarly, the ordinate in Figure 9b represents the ratio of the maximum value of the generalised energy spectrum, and the ordinate in Figure 9c shows the ratio of the mE (generalised energy spectrum area within ΔTE). In Figure 9d, the ordinate represents the time distribution parameter of energy concentration ΔTE under a freak wave.
In Figure 9a, with an increase in α1, the ratio of the energy concentration degree of motion response of the 2D SFT under freak and random waves with identical spectra rapidly increases (nonlinearly), whereas the ratio of the energy concentration degree of mooring tension increases linearly and at a much slower rate than that for the motion. In the range of α1 = 2.0–2.59, the ratio of the energy concentration degree of surge, heave, pitch, and mooring tension varies in the range of 3.9–9.4, 2.8–13.9, 3.0–10.9, and 2.1–4.1, respectively. These results indicate that there is a significant energy-concentration phenomenon in the dynamic responses of the SFT under a freak wave, and the energy concentration degree is significantly correlated with α1.
As shown in Figure 9b, as α1 increases, the ratio of the maximum value of the generalised energy spectrum Emax of the motion response under freak and random waves with identical spectra rapidly increases (nonlinearly), especially for the surge and heave, whereas the ratio of the maximum value of the generalised energy spectrum of the mooring tension slightly increases, and at a much slower rate than that of the motions. However, the maximum value under a freak wave remains higher than that under a random wave with identical spectra. In the range of α1 = 2.0–2.59, the ratio of the maximum value of the generalised energy spectrum of the surge, heave, pitch, and mooring tension varies in the ranges of 4.5–27.1, 2.4–31.2, 1.8–12.1, and 2.0–4.6, respectively. These results are consistent with the phenomenon observed in the generalised energy spectrum E(t) in Figure 6.
According to Figure 9c, the variation law of the ratio of mE with α1 is consistent with the variation law of the ratio of the maximum value of the generalised energy spectrum Emax. In the range of α1 = 2.0–2.59, the ratio of mE of the surge, heave, pitch, and mooring tension varies in the range of 3.8–25.4, 3.7–26.1, 1.2–6.7, and 1.8–4.5, respectively.
According to Figure 9d, the time distribution parameter of energy concentration ΔTE of the dynamic responses all increase nearly linearly as α1 increases. In the range of α1 = 2.0–2.59, the ΔTE of the surge, heave, pitch, and mooring tension vary in the range of 2.5–4.1, 2.2–3.9, 0.8–3.4, and 1.9–3.1Tp, respectively.
In summary, the variation laws of the generalised energy spectra and spectral parameters of the dynamic responses under freak waves with α1 are as follows: ① The “generalised energy spectrum” E(t) of dynamic responses of the 2D SFT under freak wave have “convex” peak values that appear simultaneously with the occurrence of a freak wave. ② The “convex” parts in the generalised energy spectra of the dynamic responses under a freak wave grow significantly as the freak wave parameter α1 increases, and the “convex” peak values are significantly larger than those of the generalized energy spectrum under random waves with identical spectra. ③ The time ranges of the “convex” peak values in the generalised energy spectra of the surge, heave, pitch, and mooring tension are almost identical. These differ from those of the moored square cylinder [16,17], in which the time range of “convex” parts of the surge and mooring tension is much longer than the freak wave period. ④ The generalised energy spectrum parameters of the dynamic responses of SFT under a freak wave increase as α1 increases.

4. Conclusions

The dynamic response characteristics of a two-dimensional submerged floating tunnel (SFT) under freak and random waves were investigated in the present study. The wavelet analysis method, which can simultaneously provide the time-domain and frequency-domain joint information of the physical process, was used to discuss the time-frequency characteristics of the dynamic responses. The following main conclusions were obtained.
(1) The wavelet analysis method is effective in investigating the dynamic response of the SFT under a freak wave. Compared with statistical or spectral analysis, wavelet analysis can very successfully demonstrate the typical characteristics of dynamic response on the floater under the freak wave. It can obtain the energy spectral density and energy distribution of each frequency in a time domain, especially the instantaneous physical change with the occurrence of a freak wave. It was found that a freak wave has a significant effect on the time-frequency domain characteristics of the dynamic response compared to the random wave, and it is more straightforward to distinguish the effect of freak and random waves.
(2) Freak waves have dynamic amplification effects on the two-dimensional submerged floating tunnels, and the effects are related to the freak wave parameter α1 and near “impact” when α1 ≥ 2.5. After a freak wave acts on the 2D SFT, the time-frequency spectra of the dynamic responses exhibit significant energy concentration phenomena in a certain time and frequency range, and the energy concentration degree increases nonlinearly as α1. The maximum values of the time-frequency spectra under a freak wave are significantly greater than those under a random wave with identical spectra. There are significant high-frequency components in the time-frequency spectra of the dynamic responses under a freak wave.
(3) The “generalised energy spectrum” E(t) of dynamic responses of the 2D SFT under a freak wave have “convex” peak values that appear simultaneously with the occurrence of a freak wave. The “convex” parts in the generalised energy spectra of the dynamic responses under a freak wave grow significantly as the freak wave parameter α1 increases.
(4) The time range of the freak wave affecting the dynamic responses of the SFT is longer than that of the freak wave period. The time range for the large value of the time-frequency spectra of the dynamic responses increases as α1 increases (it is nearly linear). In the range of α1 = 2.0–2.59, the large values of the time-frequency spectra of surge, heave, pitch, and mooring tension appear in the range of 2.8–5.4 TP, 1.9–4.3 TP, 0.4–4.6 TP, and 1.8–2.8 TP, respectively, and the time range of the surge is slightly larger than it is for the others.

Author Contributions

Validation, analysis, investigation, writing—original draft preparation and editing, W.P.; conceptualization, methodology, investigation, writing—review and editing, C.C.; visualization, analysis, writing—original draft preparation and editing, M.H. All authors have read and agreed to the published version of the manuscript.

Funding

This research was funded by the National Natural Science Foundation of China (51509120).

Institutional Review Board Statement

Not applicable.

Informed Consent Statement

Not applicable.

Data Availability Statement

The data presented in this study are available from the corresponding author upon reasonable request.

Conflicts of Interest

The authors declare that they have no conflict of interest.

References

  1. Kharif, C.; Pelinovsky, E. Physical mechanisms of the rogue wave phenomenon. Eur. J. Mech. B Fluids 2003, 22, 603–634. [Google Scholar] [CrossRef]
  2. Kimura, A.; Ohta, T. Probability of the freak wave appearance in a 3-dimensional sea condition. In Proceedings of the 24th International Conference on Coastal Engineering, Kobe, Japan, 23–28 October 1994; Part 1 (of 3). ASCE: New York, NY, USA; Kobe, Japan, 1995; pp. 356–369, ISBN 08938717. [Google Scholar]
  3. Fochesato, C.; Grilli, S.; Dias, F. Numerical modeling of extreme rogue waves generated by directional energy focusing. Wave Mot. 2007, 44, 395–416. [Google Scholar] [CrossRef]
  4. Pelinovsky, E.; Talipova, T.; Kharif, C. Nonlinear-dispersive mechanism of the freak wave formation in shallow water. Phys. D Nonlinear Phenom. 2000, 147, 83–94. [Google Scholar] [CrossRef]
  5. Cui, C.; Pan, W.-B. Experimental Study on the Wavelengths of Two-Dimensional and Three-Dimensional Freak Waves. China Ocean Eng. 2023, 37, 154–164. [Google Scholar] [CrossRef]
  6. Gibson, R.S.; Swan, C. The evolution of large ocean waves: The role of local and rapid spectral changes. Proc. R. Soc. A Math. Phys. Eng. Sci. 2007, 463, 21–48. [Google Scholar] [CrossRef]
  7. Akhmediev, N.; Ankiewicz, A.; Soto-Crespo, J.M.; Dudley, J.M. Rogue wave early warning through spectral measurements? Phys. Lett. Sect. A Gen. Solid State Phys. 2011, 375, 541–544. [Google Scholar] [CrossRef]
  8. Clauss, G.F.; Schmittner, C.E.; Stutz, K. Freak wave impact on semisubmersibles-time-domain analysis of motions and forces. In Proceedings of the 13th International Offshore and Polar Engineering Conference, Honolulu, HI, USA, 25–30 May 2003; International Society of Offshore and Polar Engineers: Honolulu, HI, USA, 2003. [Google Scholar]
  9. Rudman, M.; Leontini, J.; Cleary, P.; Sinnott, M.; Prakash, M. Rogue wave impact on a semi-submersible offshore platform. In Proceedings of the 27th International Conference on Offshore Mechanics and Arctic Engineering, OMAE 2008, Estoril, Portugal, 15–20 June 2008; OMAE: Estoril, Portugal, 2008; pp. 887–894, ISBN 9780791848227. [Google Scholar]
  10. Paul, P.W.; Rudman, M. Extreme wave interaction with a floating oil rig: Prediction using SPH. Prog. Comput. Fluid Dyn. 2009, 9, 332–344. [Google Scholar]
  11. Rudman, M.; Cleary, P.W. Rogue wave impact on a tension leg platform: The effect of wave incidence angle and mooring Line tension. Ocean Eng. 2013, 61, 123–138. [Google Scholar] [CrossRef]
  12. Bennett, S.S.; Hudson, D.A.; Temarel, P. The influence of forward speed on ship motions in abnormal waves: Experimental measurements and numerical predictions. J. Fluids Struct. 2013, 39, 154–172. [Google Scholar] [CrossRef]
  13. Pan, W.; Zhang, N.; Huang, G.; Ma, X. Experimental study on motion responses of a moored rectangular cylinder under freak waves (I: Time-domain study). Ocean Eng. 2018, 153, 268–281. [Google Scholar] [CrossRef]
  14. Shen, Y.G.; Yang, J.M.; Li, X. Numerical investigation on the motion response of semisubmersible platform under extreme waves. Ocean. Eng. 2013, 31, 9–17. (In Chinese) [Google Scholar]
  15. Chandrasekaran, S.; Koshti, Y. Dynamic analysis of a tension Leg platform under extreme waves. J. Nav. Archit. Mar.Eng. 2013, 10, 59–68. [Google Scholar] [CrossRef]
  16. Pan, W.; Liang, C.; Zhang, N.; Huang, G. Experimental study on hydrodynamic characteristics of a moored square cylinder under freak wave (II: Frequency-domain study). Ocean Eng. 2021, 219, 108452. [Google Scholar] [CrossRef]
  17. Pan, W.; Zhang, N.; Zeng, F.; Huang, G. Time-frequency domain characteristics on the dynamic response of a moored floater under a freak wave by wavelet analysis. Int. J. Offshore Polar Eng. 2021, 31, 160–168. [Google Scholar] [CrossRef]
  18. Klinting, P.; Sand, S. Analysis of prototype freak waves. In Coastal Hydrodynamic; ASCE: New York, NY, USA, 1987; pp. 618–632. [Google Scholar]
  19. Pei, Y.G. The Generation of Freak Waves and Its Behaviors; Dalian University of Technology: Dalian, China, 2008. [Google Scholar]
  20. Abroug, I.; Abcha, N.; Jarno, A.; Marin, F. Laboratory study of non-linear wave-wave interactions of extreme focused waves in the nearshore zone. Nat. Hazards Earth Syst. Sci. 2020, 20, 3279–3291. [Google Scholar] [CrossRef]
  21. Gao, J.; Ma, X.; Zang, J.; Dong, G.; Zhu, Y.; Zhou, L. Numerical investigation of harbor oscillations induced by focused transient wave groups. Coast. Eng. 2020, 158, 103670. [Google Scholar] [CrossRef]
  22. Cui, C.; Zhang, N.C.; Yu, Y.X.; Li, J.B. Numerical study on the effects of uneven bottom topography on freak waves. Ocean Eng. 2012, 54, 132–141. [Google Scholar] [CrossRef]
  23. Grinsted, A.; Moore, J.C.; Jevrejeva, S. Application of the cross wavelet transform and wavelet coherence to geophysical time series. Nonlinear Process. Geophys. 2004, 11, 561–566. [Google Scholar] [CrossRef]
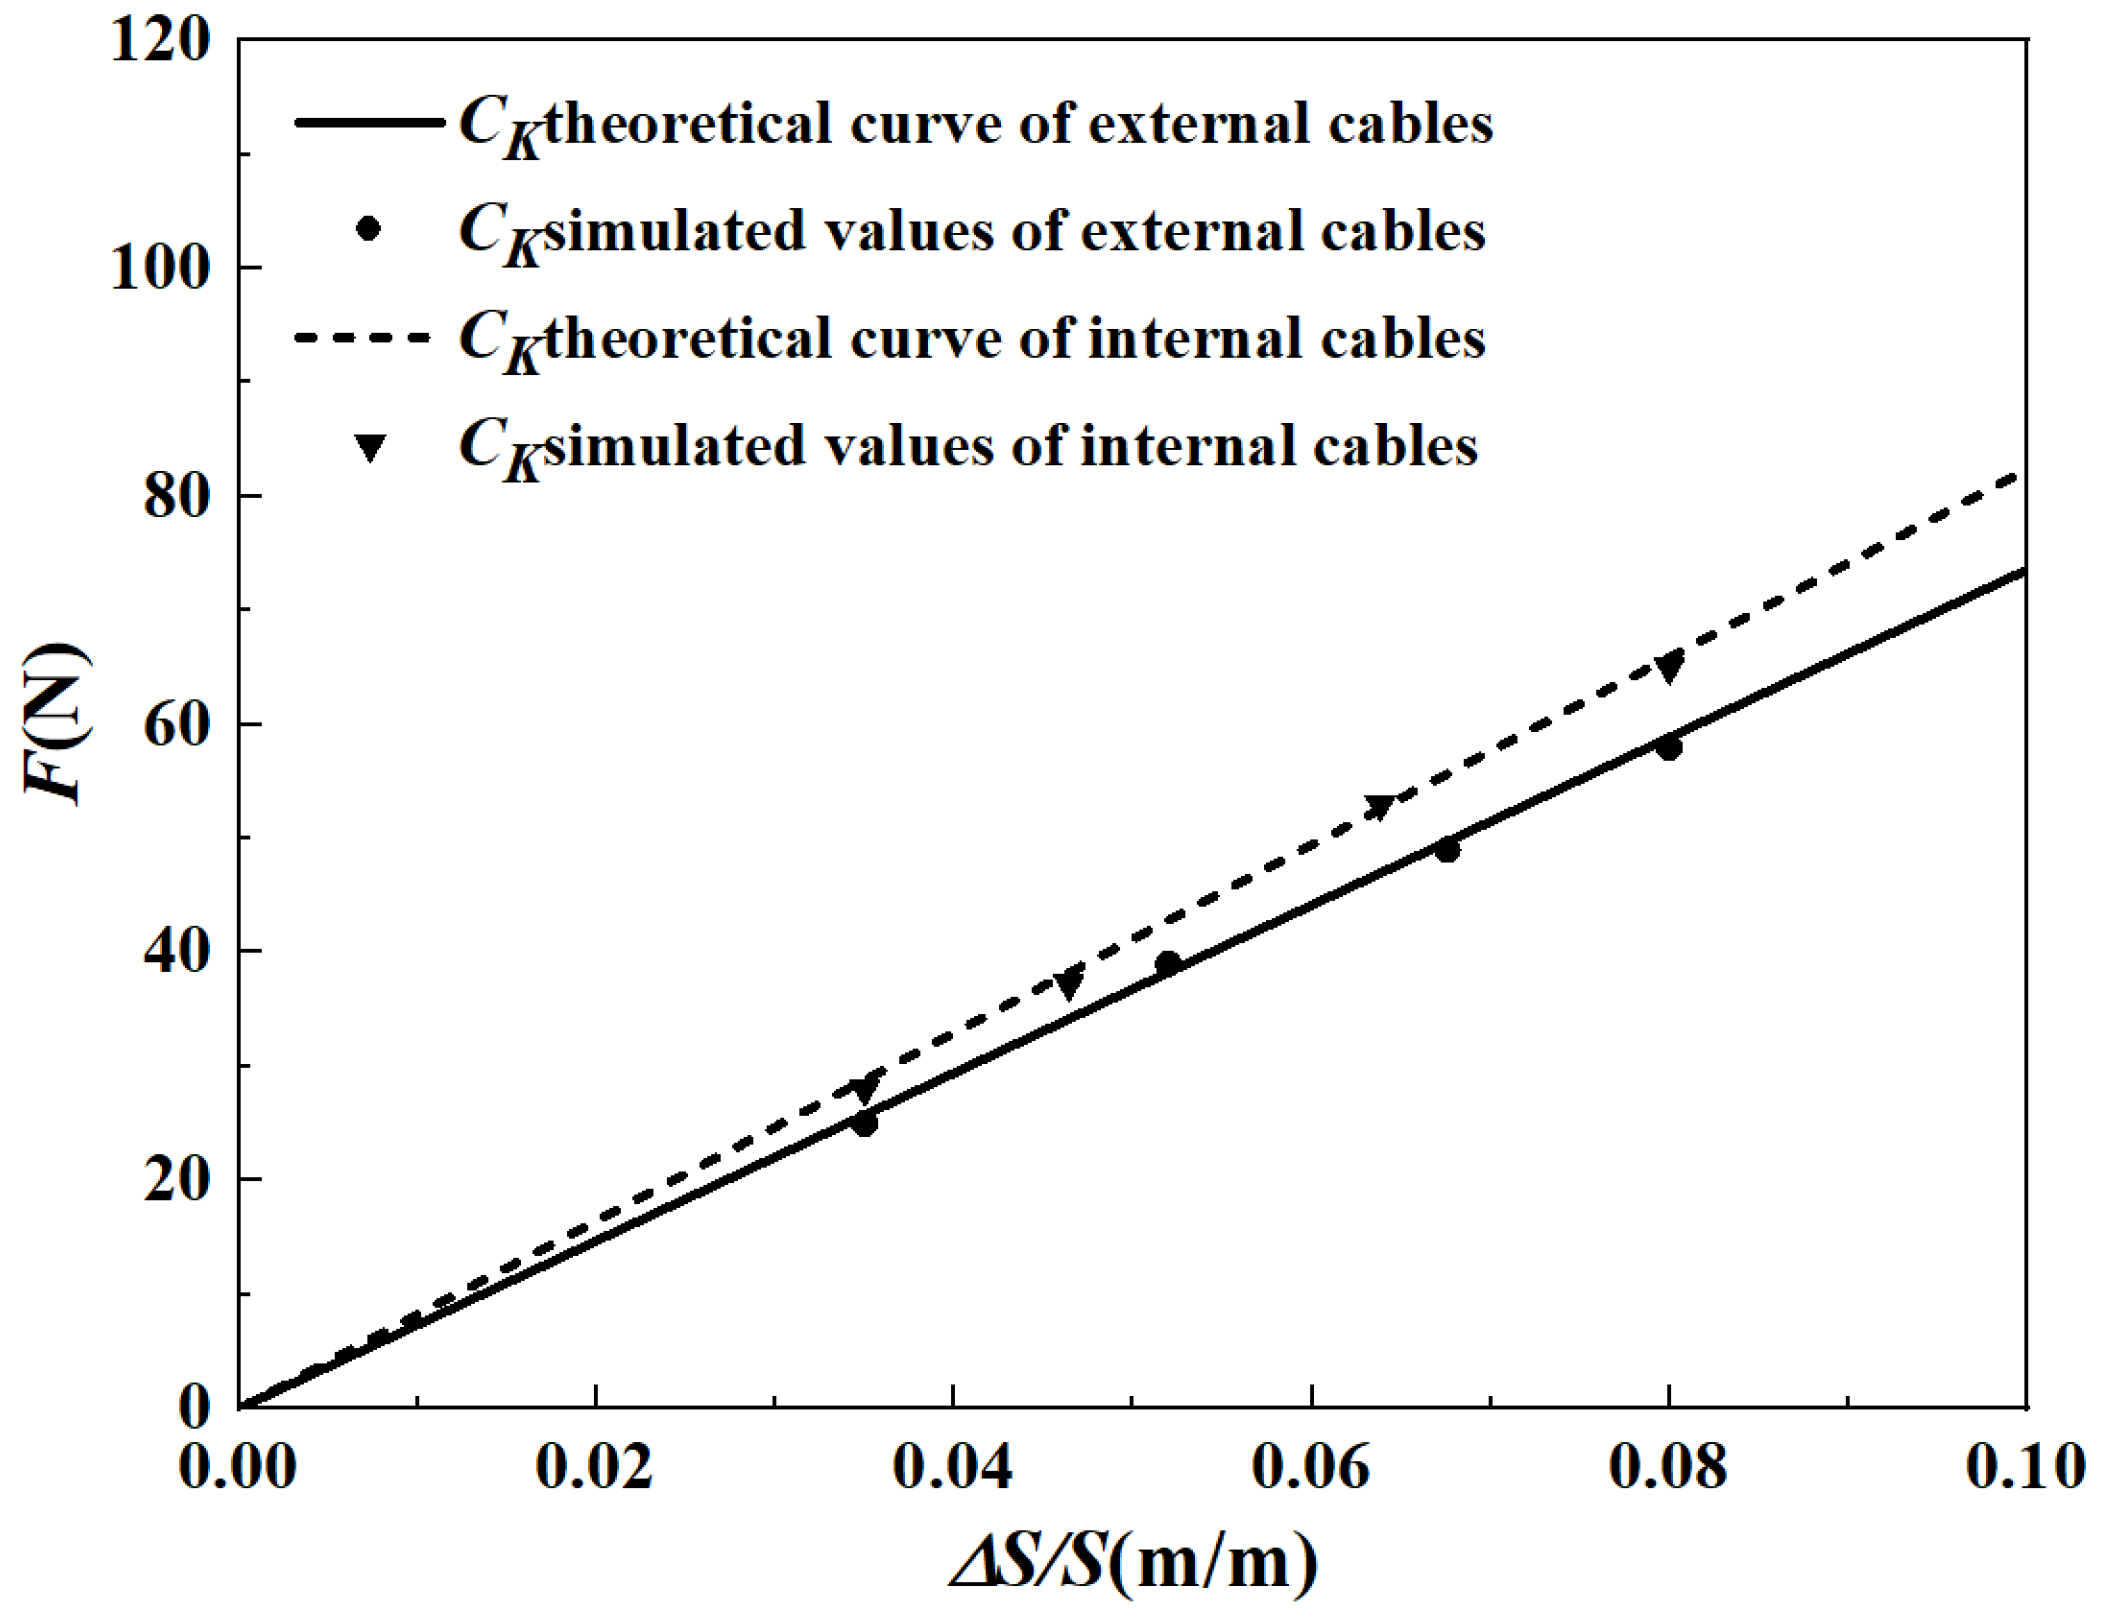
Figure 1. Tension-relative elongation curve of the cables.
Jmse 11 00971 g001
Figure 2. Mooring configuration of the SFT.
Jmse 11 00971 g002
Figure 3. The moored SFT in wave tank.
Jmse 11 00971 g003
Figure 4. The coordinate system.
Jmse 11 00971 g004
Figure 5. Time-history and time-frequency spectra of the dynamic response (HS = 5.12 cm, TP = 1.6 s, d0/Lp ≈ 0.11, d0/d = 0.3, d0/Hs = 8.2, and d0/Hm = 3.3).
Jmse 11 00971 g005aJmse 11 00971 g005b
Figure 6. The time-frequency spectrums of dynamic responses with various α1 (HS/d0 = 0.1, TP/T0S = 1.25, TP/T0H = 1.23, TP/T0P = 2.96, d0/d = 0.35, and d0/Lp = 0.11).
Jmse 11 00971 g006aJmse 11 00971 g006bJmse 11 00971 g006c
Figure 7. Time-frequency spectrum parameters of the dynamic response varies with α1.
Jmse 11 00971 g007
Figure 8. Generalised energy spectrum E(t) of dynamic responses under freak and random waves.
Jmse 11 00971 g008aJmse 11 00971 g008b
Figure 9. The generalised energy spectrum parameters of the dynamic responses under freak and random waves varies with α1.
Jmse 11 00971 g009
Table 1. Summary of geometric and hydrodynamic parameters of the SFT.
ParametersSymbolsPrototypeUnitModelUnit
LengthL120.0m200.0cm
DiameterD12.0m20.0cm
MassM11232t52.0kg
Center of gravityB9.6m16.0cm
Center of buoyancyb012.0m10.0cm
Natural surge periodT0S9.90s1.29s
Natural heave periodT0H10.10s1.31s
Natural pitch periodT0P4.18s0.55s
Buoyancy weight ratioBWR1.20-1.20-
Table 2. Experimental parameters simulated in the RAO tests.
Fixed ParametersH (cm)T (s)Wave Length L (m)Relative Submerged Depth d0/L
d = 120 cm
d0 = 42 cm
d0/d = 0.35
F0 = 13 N
4.00.80.990.360
1.01.560.231
1.22.240.161
1.43.020.119
1.63.840.094
1.84.670.077
2.05.490.066
Table 3. Experimental parameters simulated in the tests for the dynamic responses of SFT.
Fixed ParametersHs (cm)TP (s)Relative Wave HeightRelative Wave PeriodRelative Submerged Depth
d0/LP
α1
Hs/dHs/d0TP/T0STP/T0HTP/T0P
d = 120 cm
d0 = 42 cm
d0/d = 0.35
F0 = 13 N
4.01.60.0330.0951.251.232.960.1091.90
2.04
2.20
2.41
2.51
2.59
Table 4. Summary of characteristic parameters of the surge time-frequency spectrum.
HS (cm)TP (s)HS/dTP/T0Sα1The Time Range for Large Value of Time-Frequency SpectrumThe Frequency Range for Large Value of Time-Frequency SpectrumThe Peak Value of Time-Frequency Spectrum (cm2)
t (s)t (s)f (Hz)f (Hz)Freak WaveRandom WaveRatio
4.01.60.0331.251.909.7~13.33.60.48~0.880.403.741.732.16
2.049.6~14.14.50.46~0.900.445.101.902.68
2.208.5~13.75.20.42~0.980.527.681.884.09
2.418.6~14.86.20.38~1.02/1.31~2.121.4511.461.866.16
2.518.5~16.27.70.37~2.071.7021.121.9111.06
2.5918.3~26.98.60.36~2.692.3342.761.8922.62
Table 5. Summary of characteristic parameters of heave time-frequency spectrum.
HS (cm)TP (s)HS/dTP/T0Sα1The time Range for Large Value of Time-Frequency SpectrumThe Frequency Range for Large Value of Time-Frequency SpectrumThe Peak Value of Time-Frequency Spectrum (cm2)
t (s)t (s)f (Hz)f (Hz)Freak WaveRandom WaveRatio
4.01.60.0331.231.9010.2~12.90.70.59~0.780.190.480.361.33
2.0410.2~13.23.00.55~0.790.240.580.391.49
2.209.1~13.64.50.52~0.810.290.850.402.13
2.419.8~14.54.70.47~0.920.451.150.383.03
2.519.9~15.15.20.48~1.290.812.700.416.59
2.5919.0~25.96.90.40~2.071.674.580.3911.74
Table 6. Summary of characteristic parameters of the pitch time-frequency spectrum.
HS (cm)TP (s)HS/dTP/T0Sα1The Time Range for Large Value of Time-Frequency SpectrumThe Frequency Range for Large Value of Time-Frequency SpectrumThe Peak Value of Time-Frequency Spectrum (cm2)
t (s)t (s)f (Hz)f (Hz)Freak WaveRandom WaveRatio
4.01.60.0332.961.9010.2~12.60.40.61~0.780.170.760.651.17
2.0410.2~12.80.60.55~0.780.231.220.711.72
2.208.7~12.94.20.49~0.800.311.410.672.10
2.419.6~14.14.50.42~0.88/1.55~1.980.892.120.693.07
2.519.6~15.76.10.39~0.95/1.35~1.981.195.330.697.72
2.5918.6~25.97.30.38~2.852.478.690.7012.41
Table 7. Summary of characteristic parameters of mooring tension (1#) time-frequency spectrum.
HS (cm)TP (s)HS/dTP/T0Sα1The Time Range for Large Value of Time-Frequency SpectrumThe Frequency Range for Large Value of Time-Frequency SpectrumThe Peak Value of
Time-Frequency
Spectrum (cm2)
t (s)t (s)f (Hz)f (Hz)Freak waveRandom waveRatio
4.01.60.0331.251.9010.2~12.50.30.55~0.700.152437.001990.311.22
2.0410.2~13.02.80.54~0.740.202844.761960.631.45
2.209.8~13.53.70.51~0.780.273443.411978.331.74
2.4110.1~14.14.00.47~0.800.334396.621969.572.23
2.519.7~13.84.10.47~0.810.344892.771976.152.48
2.5919.8~24.34.50.44~0.880.446203.591992.673.11
Table 8. Summary of the statistical characteristics of generalized energy spectrum parameters of surge.
HS (cm)TP (s)α1Energy Concentration Degree δEThe Maximum Value of Generalized Energy
Spectrum Emax
mE (Generalised Energy Spectrum Area within TEmax~TEmin)Time Distribution Parameter of Energy Concentration ΔTE
Freak WaveRandom WaveRatioFreak WaveRandom WaveRatioFreak WaveRandom WaveRatio
4.01.61.9024.137.123.392.460.673.675.231.443.632.04
2.0427.156.953.913.050.684.497.582.013.772.53
2.2035.287.035.024.670.726.4912.382.345.292.93
2.4148.386.956.966.750.709.6418.852.537.453.32
2.5151.886.398.129.920.6814.5930.562.7011.324.01
2.5968.117.269.3822.780.8427.1269.792.7525.384.08
Table 9. Summary of statistical characteristics of generalized energy spectrum parameters of heave.
HS (cm)TP (s)α1Energy Concentration
Degree δE
The Maximum Value of Generalized Energy Spectrum EmaxmE (Generalised Energy Spectrum Area within TEmax~TEmin)Time Distribution
Parameter of Energy
Concentration ΔTE
Freak WaveRandom WaveRatioFreak WaveRandom WaveRatioFreak WaveRandom WaveRatio
4.01.61.9010.424.592.270.210.092.330.520.153.472.05
2.0413.314.832.760.240.102.400.660.183.672.23
2.2016.735.023.330.330.113.001.050.215.002.66
2.4125.435.134.960.580.124.831.720.237.482.93
2.5145.124.969.101.290.1210.753.860.2913.313.59
2.5974.825.3913.883.430.1131.188.350.3226.093.94
Table 10. Summary of statistical characteristics of generalized energy spectrum parameters of pitch.
HS (cm)TP (s)α1Energy Concentration
Degree δE
The Maximum Value of Generalized Energy Spectrum EmaxmE (Generalised Energy Spectrum Area within TEmax~TEmin)Time Distribution
Parameter of Energy Concentration ΔTE
Freak WaveRandom WaveRatioFreak WaveRandom WaveRatioFreak WaveRandom WaveRatio
4.01.61.9013.115.092.580.740.481.680.850.811.050.75
2.0415.355.053.040.880.481.831.020.861.190.78
2.2016.135.233.081.040.492.122.181.661.311.86
2.4122.485.324.231.570.503.143.611.851.952.12
2.5126.405.035.252.240.494.576.062.172.792.81
2.5956.285.1610.916.070.5012.1416.282.426.733.38
Table 11. Summary of statistical characteristics of generalized energy spectrum parameters of mooring tension.
HS (cm)TP (s)α1Energy Concentration Degree δEThe Maximum Value of Generalized Energy Spectrum EmaxmE (Generalised Energy Spectrum Area within TEmax~TEmin)Time Distribution
Parameter of Energy Concentration ΔTE
Freak WaveRandom WaveRatioFreak WaveRandom WaveRatioFreak WaveRandom WaveRatio
4.01.61.906.753.721.81951.31565.331.682040.911293.701.581.6
2.047.933.722.131151.1566.272.032739.861492.251.841.93
2.209.633.722.591463.94557.392.634077.951771.432.302.48
2.4112.343.733.311892.41562.253.375476.091860.382.942.71
2.5113.663.663.732136.23546.273.916092.691891.973.222.80
2.5915.233.734.082710.00583.924.648924.961985.694.493.10
Disclaimer/Publisher’s Note: The statements, opinions and data contained in all publications are solely those of the individual author(s) and contributor(s) and not of MDPI and/or the editor(s). MDPI and/or the editor(s) disclaim responsibility for any injury to people or property resulting from any ideas, methods, instructions or products referred to in the content.