Abstract
The shaft tubular pump device is widely used in various water diversion projects because of its ultra-low head and large flow characteristics. Due to the tip clearance between the blade and the shroud, it is easy to cause hydraulic mechanical performance changes, induced vibration, and noise, which seriously affects the safe and stable operation of the pump. Steady and unsteady three-dimensional flow field numerical simulations of a shaft tubular pump device were carried out using computational fluid dynamics to investigate the impeller flow properties of the device under various flow conditions, including the tip clearance leakage flow (TCLF) and change rule of pressure pulsation. The TCLF, vortex morphology evolution, and pressure pulsation properties of the impeller tip clearance were analyzed. The results show that with an increase in the flow rate, the influence of the tip clearance size on the tip clearance flow decreases, the TCLF decreases, and the axial velocity of the water flow at the tip clearance increases. When the flow rate increases, the swirling strength of the tip leakage vortex decreases, and the distance between the tip leakage vortex and the suction surface of the blade increases. With the increase in flow rate, the pressure pulsation amplitude at the tip clearance increases first and then decreases. The focus of this study is to analyze the variation of tip clearance flow field and pressure pulsation under multiple working conditions, aiming to provide some help for improving the performance of the pump device and ensuring its safe operation.
1. Introduction
The shaft tubular pump device has been adopted in water diversion and flood control projects such as the East Route Project of the South-to-North Water Diversion Project and the Taihu Lake Project because of its simple structure, straight inlet and outlet pipes, high device efficiency, small excavation depth, low project investment, and easy maintenance and management. In the future, more low-lift tubular pumps will be used in pumping stations along rivers and coastal areas. Figure 1 shows statistical data from some shaft tubular pumping stations, both existing and under construction, in China. For example, the impeller diameter of the shaft tubular pump device of the Pizhou pumping station in the East Route Project of the South-to-North Water Diversion in China is 3.3 m, the rated speed is 108 r·min−1, and the single pump flow rate is 33.4 m3·s−1. The impeller diameter of Ningbo Huazizha Pumping Station is 3.9 m, the rated speed is 67 r·min−1, and the single pump flow rate is 37.5 m3·s−1.
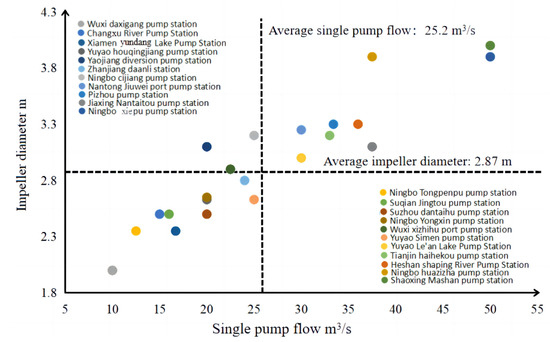
Figure 1.
Some shaft tubular pump stations (both existing and under construction) in China.
In a pump station, the blade and shroud are separated by the tip clearance, owing to the structural properties of the impeller of the tubular pump. In the tip clearance, a tip clearance leakage flow (TCLF) is produced, driven by the pressure difference between the pressure surface (PS) and the suction surface (SS) of the blade, which interacts with the main flow inside the impeller to create complex flow structures, such as clearance separation vortices, tip leakage vortices (TLV), and clearance shear layers [1]. These structures interfere with the main flow movement, affect nearly 20% of the pipe, and induce cavitation [2,3], significantly impacting the safe and stable operation of the pump and altering the hydraulic mechanical properties, causing vibration and noise. The impact of these effects on the efficient, safe, and stable operation of shaft tubular pump devices with a design head of less than 3 m is particularly apparent.
With the continuous updating and maturity of CFD methods, more and more scholars use CFD methods to solve problems in the pump design process. For example, Ji et al. [4] studied the hydraulic performance and pressure pulsation characteristics of the pump device to provide better guidance for the stable and efficient operation of the shaft tubular pump device. Chen et al. [5] used experimental and numerical methods to predict the performance of the pump under different working conditions. Wang et al. [6] designed and optimized the pump through an artificially intelligent algorithm and CFD analysis. Using CFD to study the pump device has the characteristics of low resource consumption and easy to intuitively explore the detailed flow field. Therefore, the CFD method has significant advantages in exploring the flow field characteristics at the tip clearance.
Some scholars have studied the influence of tip clearance on pumps and turbines. For example, Liu et al. [7] explored the characteristics of a TLV in a mixed-flow pump. Kim et al. [8] investigated tip clearance flow characteristics and undertakes a transient fast Fourier transform analysis of a Kaplan turbine. Wang et al. [9] explored the variation in the leakage vortex structure and its trajectory under various flow conditions and improved the prediction model of the leakage vortex trajectory. Using numerical calculations and verification tests, Yang et al. [10] investigated the effect of the tip clearance size on a sewage pump’s operation and internal flow field distribution. Ji et al. [11] investigated the effects of varying the tip clearance on the transient properties of mixed-flow pumps under stall conditions using unsteady time-accurate simulations. Yu et al. [12] studied the effect of tip clearance on the propulsion efficiency and pressure pulsations of a pump-jet propeller. Shen et al. [13] investigated the impact of various tip clearance widths on the tip flow dynamics and main flow properties of an axial-flow pump. Han et al. [14] investigated TLV cavitation in a propelling pump using an LES. Zhang et al. [15] investigated the energy performance and flow properties of a multiphase pump because of tip clearance. Kan et al. [16] analyzed the pressure, streamlines, and turbulent kinetic energy with respect to the impact of tip clearance on the flow patterns and pressurization capabilities of a helico-axial flow pump. The current literature shows that the influence of the tip clearance on pumps and pump sections has been comprehensively studied, but there have been few studies on the influence of the tip clearance on the hydraulic performance of a pump device under the condition of hydraulic coupling between the pump and pipe. The overall impact of the tip clearance on a shaft tubular pump device has been the subject of only a small number of studies.
Previous research on shaft tubular pump devices has focused on the structural design optimization of the pipes [17,18], the influence of the position and shape of the impact of the impeller and guide vane on energy performance [19,20,21,22,23], and the flow field and internal flow properties of the devices [24]. However, studies on the tip clearance of the impeller of a shaft-tubular pump device are relatively scarce. In this paper, a numerical simulation of a vertical shaft tubular pump device is carried out using the continuity equation, the Reynolds Averaged Navier-Stokes equation, and the Shear Stress Transport-Curvature Correction (SST-CC) turbulence model. The flow characteristics of the tip clearance leakage flow of the impeller of the shaft tubular pump device under different flow conditions were explored. The pressure, vorticity, swirling strength, and turbulent kinetic energy of the clearance flow field were analyzed. The morphological evolution of the clearance leakage flow and the distribution of pressure pulsation were studied. It is critical to clarify the change mechanism of the tip clearance flow field of the impeller when the pump and pipe are hydraulically coupled. This can serve as a guide for enhancing the hydraulic performance of shaft tubular pump devices and ensuring that such devices operate effectively, safely, and steadily.
2. Calculation Object and Test Device
2.1. Calculation Object
The shaft tubular pump used for numerical calculation in this study is a low-lift water pump device, including four flow passage components: the shaft inlet pipe, the impeller, the guide vane, and the straight outlet pipe, as shown in Figure 2. The horizontal direction perpendicular to the water flow is the X-axis, the vertical direction perpendicular to the water flow is the Y-axis, and the horizontal direction parallel to the pump axis is the Z-axis. The specific speed of the pump used in the shaft tubular pump device is 1179. The shaft tubular pump impeller’s nominal diameter D is 300 mm, the blade placement angle is 0°, the number of blades is three, and the rated rotation of the impeller is n = 981 r·min−1. The guide vane has five leaves in total. The axial distance (0.18D) between the impeller and guide vane is shown.
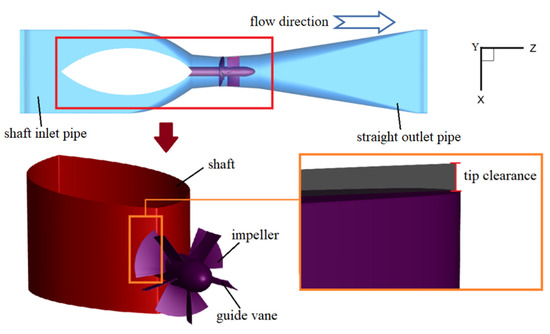
Figure 2.
A three-dimensional model of the shaft tubular pump device.
Considering the impeller nominal diameter D as the base, the primary dimensionless geometrical parameters of the shaft inlet pipe and straight outlet pipe were calculated. Figure 3 shows these primary geometrical dimensions. The length of the shaft inlet pipe is 5.55D, the inlet surface width is 2.77D, the inlet surface height is 1.51D, the outlet surface diameter is 1.13D, the shaft length is 4.35D, and the shaft width is 1.54D. The straight outlet pipe length is 5.25D, the outlet pipe width is 2.77D, the outlet pipe height is 1.51D, and the inlet pipe diameter is 1.13D.
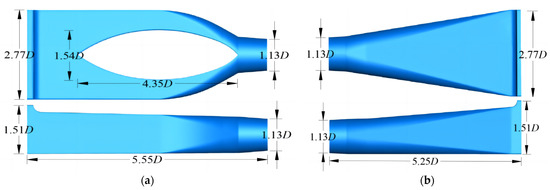
Figure 3.
A main control dimension diagram of the pipe. (a) Shaft inlet pipe, (b) straight outlet pipe.
2.2. Test Device
The energy performance of the physical model of the shaft tubular pump device was tested on a high-precision hydraulic equipment test bench of the Hydrodynamic Engineering Laboratory of Jiangsu Province, China. Figure 4 shows the test bench for the shaft tubular pump device. In the model pump device, the nominal diameter of the impeller was 300 mm, the number of impeller blades was three, the average tip clearance d was 0.2 mm, and the number of guide vane blades was five. The head and torque of the shaft tubular pump device at various flow rates were measured at a blade placement angle of 0° and a rated speed of 981 rpm.

Figure 4.
The shaft tubular pump device test bench.
Table 1 summarizes the primary measurement equipment and the associated system uncertainties for each piece of equipment. The measurement and calibration department recognized by China provides the system uncertainty associated with each piece of measurement equipment. Using the referenced comprehensive uncertainty calculation approach [25] for the pump device test bench, the system uncertainty of the test bench was ±0.305%, the random uncertainty was ±0.206%, and the comprehensive uncertainty of the test bench was ±0.368%, satisfying the requirements for the comprehensive uncertainty of the effectiveness of a test bench outlined in SL140-2006 and IEC 60193-2019. The system uncertainty of the test bench ES is the root of the sum of individual system errors:
where EQ, EH, EM, and En are the system errors of flow rate, head, torque, and rotational speed, respectively.

Table 1.
The system uncertainty of each piece of measurement equipment.
The pressure pulsation was measured by the HM90 medium- and high-frequency dynamic sensor of the German HELM company and the signal acquisition was performed using an EN900 portable rotary mechanical vibration acquisition instrument and a supporting analysis system from Beijing ENVADA. The working surface of the sensor was in full contact with the liquid surface when the sensor was installed. The test results were based on a confidence level of 97% for the pressure pulsation mixing amplitude.
3. Numerical Simulation and Experimental Verification
The tip clearance flow of a pump impeller is characterized by a high turbulence intensity accompanied by vortex motion such as clearance leakage vortices or clearance separation vortices. In order to explore the flow characteristics at the tip clearance of the impeller, after comparing multiple schemes, three characteristic schemes with different tip clearance widths of d = 0.2 mm, d = 0.5 mm, and d = 1.0 mm were selected according to the difference in the energy performance of the pump device. A numerical simulation of the whole vertical shaft tubular pump device under different flow conditions was carried out.
3.1. Turbulence Model and Calculation Boundary Conditions
The water flow in the shaft inlet pipe had a Reynolds number of 7.44 × 10⁵ and that in the straight outlet pipe had a Reynolds number of 7.30 × 10⁵. Therefore, incompressible three-dimensional viscous turbulence roughly describes the fluid inside the pump device. The laws of mass, momentum, and capacity conservation all apply to the fluid motion. Without considering the heat exchange between the bodies, the fluid in the pump device can be described by the continuity and momentum equations.
The SST k-ω turbulence model [26] takes into account the effect of turbulent shear stress transfer in the counter-pressure boundary layer and is effective in predicting the fluid separation point and separation zone under the pressure gradient condition. However, the SST k-ω model is not sensitive to rotation effects. To solve this problem, Smirnov and Men [27] used the curvature correction method of a rotation domain to modify the SST k-ω model. In the SST-CC model with curvature correction in the rotating domain, the generating term Pk of the k and ω transport equations is modified to Pk·fr, fr is given by:
where Cscale is the proportional coefficient. The SST-CC model has several advantages in capturing vortex characteristics [28,29] that are conducive to the simulation of a tip clearance leakage vortex.
To obtain good simulation results, the calculation boundary conditions were set equal to those in Ref. [30] when the steady calculation was carried out. Table 2 lists the specific settings.
Table 2.
Boundary condition settings.
On both sides of the impeller, the dynamic-static interaction was designed as a transient rotor stator in the unsteady calculation of the flow field [31]. The determination of the time step for an unsteady computation must satisfy the following criterion for the Courant number:
where is the absolute value of the estimated average speed and l is the minimum size of the grid.
Based on the sampling theorem requirements, , approximately 2.56–4 times the maximum frequency of the signal was taken. The blade frequency was 49.05 Hz, and the rotation frequency was 16.35 Hz. To monitor the pressure pulsation of the blade frequency, at least six points had to be selected for a blade frequency period, and the maximum time step was = 3.3979 × 10⁻³ s. Considering all of this, the impeller was calculated for each 3° revolution, and the time step was = 5.09684 × 10⁻⁴ s.
3.2. Grid Division of the Computing Domain
Compared to unstructured grids, structured grids have fast generation speeds, provide high grid quality, and effectively capture the surfaces of physical structures. Therefore, the ICEM CFD software was used to divide the inlet pipe and outlet pipe into hexahedral structured grids. The TurboGrid software was employed to create the impeller and the guild vane. An H/J/L-grid topology was adopted for the impeller, and an H-grid topology was adopted for the guide vane, as shown in Figure 5. Mesh refinement was performed on the blade boundary layer and tip to simulate the TCLF more precisely. Based on the size of the tip clearance, 51 and 32 nodes were arranged axially and radially, respectively. The y+ of the impeller near-wall grid is less than 30 to solve the flow field of the pump device [32,33].
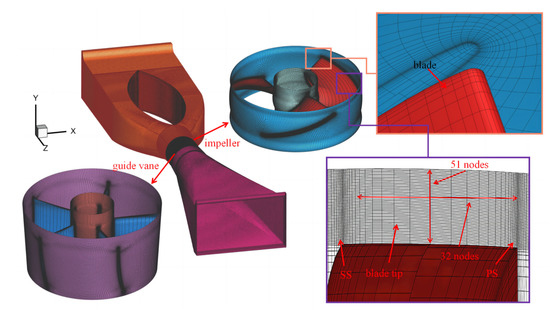
Figure 5.
The pump device grid.
Seven groups of grid schemes with different numbers of grids were selected to calculate the efficiency of the pump device under the optimal condition and a tip clearance d of 0.2 mm and to verify the independence and convergence of the number of grids in the numerical simulation. The number of grids in each scheme is listed in Table 3.
Table 3.
Grid scheme information.
The trend of the efficiency of the pump device gradually stabilized as the number of meshes increased (Figure 6). With an increase in the number of meshes to 5.7 million (the number of impeller grids was 2.13 million), the absolute difference in the efficiency of the pump device was not greater than 0.3% and the clearance leakage flow and impeller outlet velocity changed little (Figure 7). This demonstrates that the simulation of the energy performance and detailed flow field of the pump device meet the numerical simulation accuracy requirements [33,34].
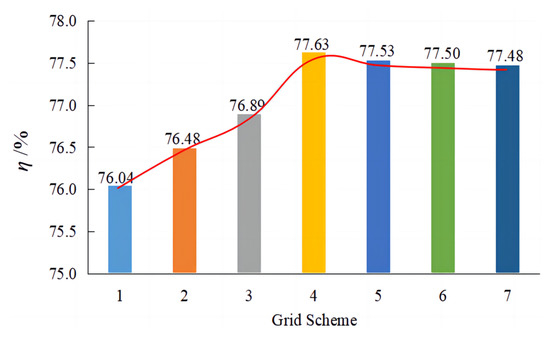
Figure 6.
The pump device efficiency under different schemes.
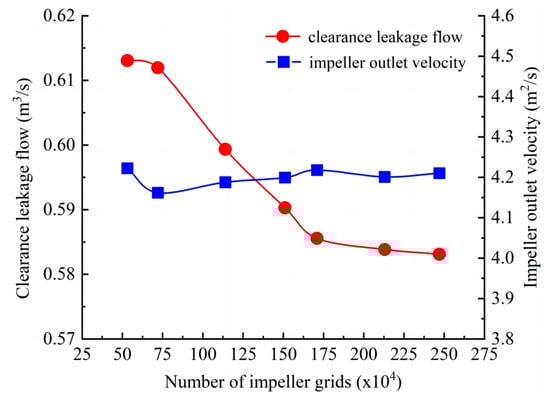
Figure 7.
The clearance leakage flow and impeller outlet velocity of different impeller grid numbers (corresponding to each scheme).
The grid convergence index (GCI) was used to verify the grid convergence of the pump device, and the number of grids that can create a pseudo-steady-state condition for the numerical simulation solution was determined [35]. Grid schemes with small efficiency changes for the three pump device sets of Schemes 4, 5, and 6 were selected. After calculation, GCI12 and GCI23 were 0.108% and 0.028%, respectively, both less than 1%, indicating that the discretization error associated with each grid scheme was within the allowable range [36] and that the grid convergence criterion was satisfied. The three groups of grids could be used for the simulation calculation of the pump device, and the 5,191,716 grids of Scheme 5 were finally selected for numerical calculation.
3.3. Experimental Verification
In the global analysis and comparison of the energy performance curves of the numerical simulation and test results, the flow coefficient KQ and head coefficient KH were used. The calculation formulae are as follows:
where Q is the flow rate of the pump device, H is the head of the pump device, n is the rated speed of the impeller, D is the nominal diameter of the impeller, and g is the acceleration of gravity.
Figure 8 shows the energy performance curve of the numerical simulation and experimental results for a tip clearance of d = 0.2 mm. Considering the hydraulic coupling between the pump and the pipe, the influence of the hydraulic performance of the pipe leads to the deviation of the pump operation condition. Under the condition of a large flow rate, the hydraulic loss along the pipe and the local hydraulic loss increase obviously, and the efficiency of the pump device decreases sharply under large flow rate conditions. The results show that the simulation results are in good agreement with the experimental results. In particular, for flow conditions of KQ = 0.41, KQ = 0.49, and KQ = 0.54, the absolute differences between the numerical simulation and the test results of the efficiency of the pump device are 3.66%, 1.71%, and 0.94%, whereas the head coefficient differences between the numerical simulation and the test results of the head of the pump device are 0.06, 0.04, and 0.01, confirming the reliability of the numerical simulation.
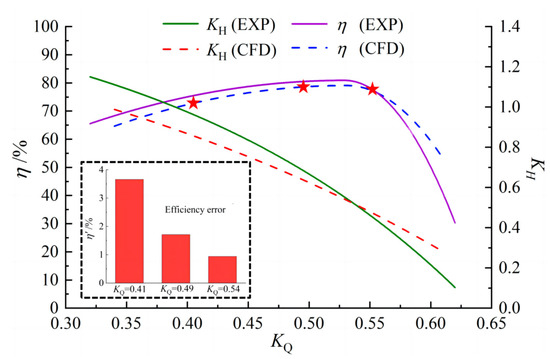
Figure 8.
A comparison of the energy performance of the test and numerical simulation. (d = 0.2 mm).
4. Results Analysis and Discussion
To determine the relative position of the single-blade area of the impeller of the tubular pump device, the blade chord length coefficient λ is defined as
where s is the position of the relative chord length of the blade and c is the chord length of the blade, as shown in Figure 9a.
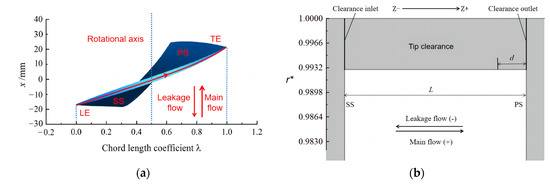
Figure 9.
The parameter settings. (a) Single blade, (b) clearance area.
The thickness coefficient ζ of the blade rim is expressed in Equation (7) and is used to determine the relative thickness of the impeller blade of the tubular pump device.
where d is the thickness of the blade at different positions and L is the total thickness of the blade rim, as shown in Figure 9b.
The radial coefficient r* of the blade is defined in Equation (8) to determine the relative radial position of the impeller blade of the tubular pump device.
where r is the radial position coordinate of the blade and D is the nominal diameter of the impeller, as shown in Figure 9b.
The clearance area on the PS side was set as the clearance inlet and that on the SS side as the clearance outlet. Simultaneously, the main flow direction was defined as the positive direction of the z-axis, and the TCLF direction was defined as the negative direction of the z-axis. The side of the impeller blade near the inlet side was set as the leading edge (LE) and the side near the outlet side was set as the trailing edge (TE). Figure 8 shows the parameter settings.
4.1. Analysis of the Tip Clearance Leakage Flow at Different Flow Rates
To determine the tip clearance leakage under different flow conditions, the relative leakage RQ is defined as
where Qtip is the flow rate of the TCLF and Qtotal is the total flow rate of the impeller.
The relative leakage of various tip clearances under three different flow conditions, KQ = 0.41, KQ = 0.49, and KQ = 0.54, is shown in Figure 10. An increase in the tip clearance width results in an increase in the clearance leakage when the flow rate is the same. At the same tip clearance width, the leakage at the tip clearance decreases with increasing flow rate. This is mainly because when the flow rate increases, the head decreases accordingly, and the TCLF and pressure difference between the PS and SS of the blade diminish. Simultaneously, when the width of the tip clearance is small (d = 0.2 mm), the variation in the tip clearance leakage is small, and the range of leakage variation with the flow rate also proportionally expands with an increase in the blade tip clearance width. Therefore, under small flow conditions or with a large tip width, the tip clearance produces a large clearance leakage, affecting the operation of the pump device.
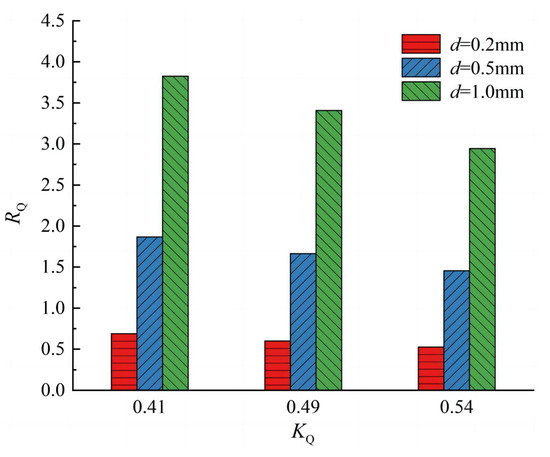
Figure 10.
The relative leakage of the tip clearance.
Figure 11 shows the ratio Va of the axial leakage velocity to the circumferential velocity Utip of different tip clearances at the impeller leading edge (LE), the impeller trailing edge (TE), and the chord length 50% (λ = 0.5) under three different flow conditions: KQ = 0.41, KQ = 0.49, and KQ = 0.54. From the figure, it is seen that the axial velocity of the TCLF at the LE is significantly affected by the change in the flow rate. When the flow rate increases, the absolute value of the axial velocity of the TCLF at the LE decreases. When the flow rate reaches KQ = 0.54, the clearance widths are d = 0.5 mm and d = 1.0 mm, and the axial velocity of the TCLF at the LE changes from positive to negative, showing that as the flow rate increases, the impact of the clearance on the water flow progressively decreases, and the velocity direction of the TCLF affected by the main flow is biased toward the outlet side. The axial velocity of the TCLF at λ = 0.5 is not visibly impacted by the alteration in flow rate, and the absolute value of the axial velocity of the TCLF only decreases slightly in response to an increase in the flow rate. The axial velocity of the TCLF at the TE is positive, and the axial velocity gradually increases in response to an increase in the flow rate, indicating that the water flow is mainly affected by the main flow and that the influence of the clearance on the water flow gradually reduces as the flow rate increases.
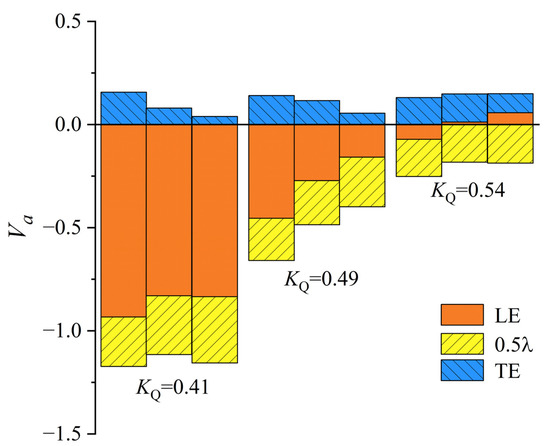
Figure 11.
The relative axial velocity of TCLF.
Four dimensionless parameters—the pressure coefficient Cp, vorticity coefficient Cω, swirling strength coefficient Cs, and turbulent kinetic energy (TKE) coefficient Ck—were used to analyze the properties of the TLV in three characteristic sections (λ = 0.2, λ = 0.5, and λ = 0.8) of the tip clearance under a flow rate of KQ = 0.41 and a tip clearance width of d = 1.0 mm. The dimensionless parameters were calculated as
where P is the pressure, ρ is the density of water, and Utip is the circumferential velocity.
where ωz is the vorticity in the Z direction, Vin is the average velocity of the impeller inlet surface, and c is the chord length of the blade outer-edge airfoil.
where Ss is the swirling strength, and
where k is the TKE.
Figure 12 shows the pressure coefficients in the tip clearance area for different chord lengths. From the figure, it can be seen that the clearance separation vortex primarily formed near the clearance entrance on the tip side of the blade. When λ = 0.2, there is an apparent area of relatively low pressure at the position of the clearance separation vortex, the pressure difference between different areas is apparent, and there is a certain distance between the core of the low-pressure area and the clearance inlet. The TCLF transforms into a radial flow after passing through the low-pressure area. When λ = 0.5, the scope of the relatively low-pressure area expands, but its overall pressure increases, the pressure gap between the regions narrows, the TCLF turns at the vortex, and backflow occurs far from the blade side. When λ = 0.8, the pressure difference is not apparent. There is only a certain pressure difference between the low-pressure core area and other areas, and the TCLF slightly changes after passing through the low-pressure core area.
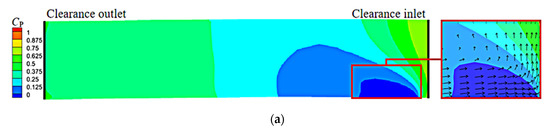
Figure 12.
The pressure coefficient in the tip clearance area. (a) λ = 0.2, (b) λ = 0.5, (c) λ = 0.8.
Figure 13 shows the characteristic parameters of the TLV at λ = 0.2. In Figure 12a,b, there are apparent peak points of the vorticity and swirling strength near ζ = 0 and r* = 0.988, and there is a water-drop-shaped vortex area extending from the peak to the outlet of the tip clearance, which has high vorticity and intensity. In Figure 12c, the TKE is high at the peak and vortex points and decreases with increasing ζ and r*.
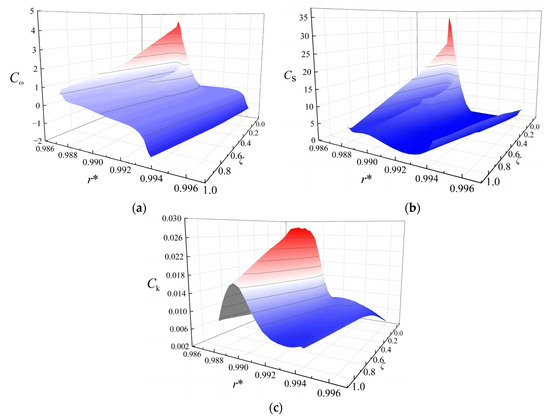
Figure 13.
The TLV properties (λ = 0.2). (a) The vorticity coefficient Cω, (b) the swirling strength Cs, (c) the turbulent kinetic energy coefficient Ck.
Figure 14 shows the characteristic parameters of the TLV at λ = 0.5. Similar to λ = 0.2, there is a higher vorticity and swirling strength at the peak point and the droplet vortex area. However, it is different from the case of λ = 0.2 because the range of the peak point and the droplet vortex area are expanded and the numerical amplitude is reduced. Compared with λ = 0.2, the overall value of TKE at λ = 0.5 decreases. When ζ and r* increase, the TKE decays with a greater amplitude.
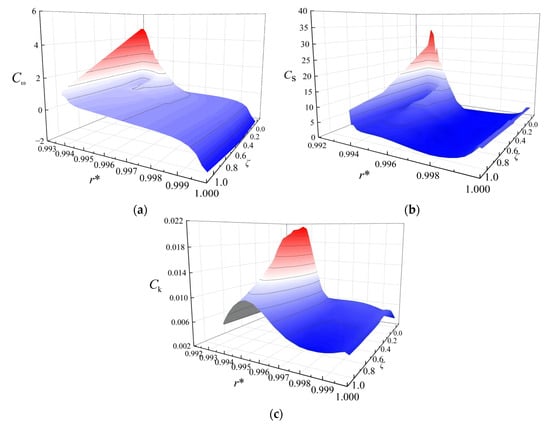
Figure 14.
The TLV properties (λ = 0.5). (a) The vorticity coefficient Cω, (b) the swirling strength Cs, (c) the turbulent kinetic energy coefficient Ck.
Figure 15 shows the characteristic parameters of the TLV at λ = 0.8. At λ = 0.8, the vorticity and swirling strength are low except for at the peak point, and the vorticity and swirling strength rapidly decrease away from the peak point. Compared with λ = 0.2 and λ = 0.5, the overall value of TKE at λ = 0.8 is smaller, and the decreasing trend of TKE is relatively smooth with increasing ζ and r*.
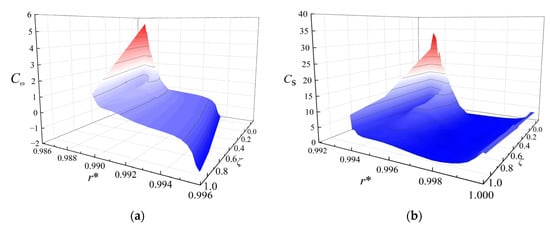
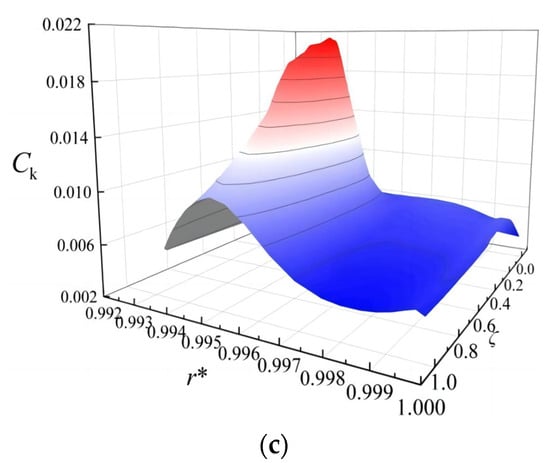
Figure 15.
The TLV properties (λ = 0.8). (a) The vorticity coefficient Cω, (b) the swirling strength Cs, (c) the turbulent kinetic energy coefficient Ck.
4.2. Analysis of the Vortex Shape Properties of the Tip Clearance under Different Flow Conditions
There are many current vortex identification methods, including the Q criterion, the criterion, and the Ω criterion. Among these, the Ω criterion has the advantages of a clear physical significance, identification results that are insensitive to the threshold value, a clear value range, and a strong ability to capture weak vortices compared with other vortex identification methods. To thoroughly analyze the properties of the vortex shape at the tip clearance under various flow conditions, the Ω criterion was used to identify the vortex shape at different moments under different flow conditions (KQ = 0.41, KQ = 0.49, and KQ = 0.54). This approach effectively avoids the disadvantage of the traditional vortex identification method, which is that it is greatly affected by the threshold value, which can cause vortex structures in the flow field to be unrecognized or even to be identified incorrectly [37].
Figure 16 shows the vortex shape properties of the tip clearance at three characteristic moments (1/3T, 2/3T, and 3/3T) in the rotating period T under different flow conditions. There is a certain regularity in the change in the TLV in a cycle. At 1/3T, the vortex with a large TKE strength extends along the SS of the blade. Meanwhile, the TLV is separated at λ = 0.2–0.4, and the vortex with a low TKE strength extends in the circumferential direction. When KQ = 0.41, the separation of the TLV occurs near λ = 0.4, and the separation position of the TLV also advances when the flow rate increases. At 2/3T, the vortex at the original SS decays, whereas the TKE strength center shifts to the TE and the separated leakage vortex continues to extend in the circumferential direction. When the flow rate increases, the TKE strength of the TLV exhibits a downward trend and the separated leakage vortex shifts to the TE side. At 3/3T, the originally separated leakage vortex continues to move toward the TE until it merges with the TLV near the SS of the impeller. The TLV near the LE has a higher TKE strength and extends along the suction direction toward the TE, whereas the TKE strength of the TLV decreases as the flow rate increases.
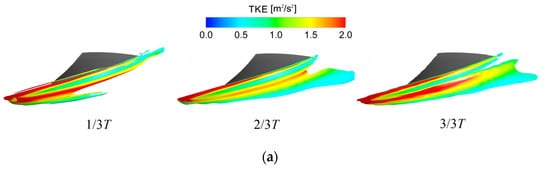
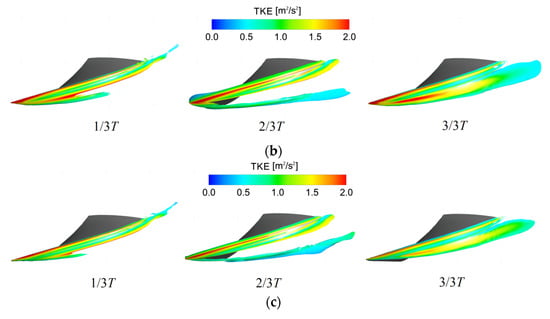
Figure 16.
Morphological properties of the TLV under different flow conditions. (a) KQ = 0.41, (b) KQ = 0.49, (c) KQ = 0.54.
The vorticity coefficients of the TLV in seven characteristic sections were compared to analyze the vorticity properties of the TLV under various flow conditions, and the results are shown in Figure 17. The results show that the vorticity coefficient at the TLV is smaller than that under the other two flow conditions (KQ = 0.49 and KQ = 0.54) when the flow rate is KQ = 0.41 in the two characteristic sections (Section 2 and Section 3) in the range of λ = 0.2–0.4. This is mainly because when the flow rate is large, the TLV is affected by the main flow and close to the rim wall, and there is a large vorticity near the wall. The TLV gradually develops away from the rim wall with an increase in λ, and the vorticity coefficient under the large-flow condition also decreases. In other characteristic sections, the relative vorticity at the TLV is also weakened because of the weakening of the interference of the TLV with the main stream when the flow rate accelerates. Therefore, the flow rate of each section increases with a decreasing vorticity coefficient.

Figure 17.
The TLV vorticity coefficients of the characteristic section under different flow conditions.
4.3. Analysis of the Tip Clearance Leakage Flow at Different Flow Rates
To analyze the pressure pulsation characteristics at the tip clearance under various flow conditions, three monitoring points were arranged at LE (λ = 0.5) and TE under the condition that the tip clearance width d = 1.0 mm. These points are numbered P01–P09, as shown in Figure 18. In addition, to analyze the properties of the TLV center under different flow conditions, a monitoring point was set at the TLV center under various flow rates. This point is called P10, and the vortex center position was determined by the maximum vortex intensity rule (when the swirling strength and vorticity both exceed the established threshold level, the point defined as having the maximum swirling strength is the vortex center).
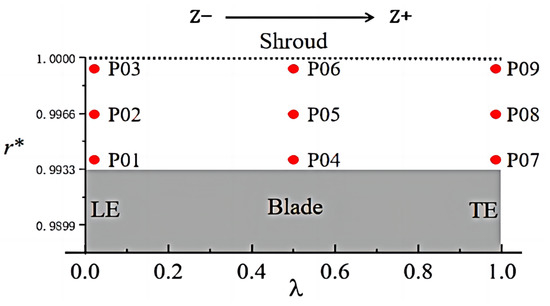
Figure 18.
The positions of the monitoring points at the blade tip clearance.
The monitoring points were set at the upper part of the impeller inlet to simulate the pressure pulsation and verify its accuracy. Figure 19 shows the pressure pulsation spectra obtained by the experiment and the numerical simulation at the upper part of the impeller inlet when the tip clearance was d = 0.2 mm and the optimal working condition was KQ = 0.49. The figure shows that the pressure pulsation amplitude (AMP) obtained by the numerical simulation is slightly larger than that of the experimental results, but the predicted frequencies of the primary and secondary frequencies are similar. The numerical simulation agrees with the overall trend of the experimental data, indicating that it is capable of accurately predicting the pressure pulsation.
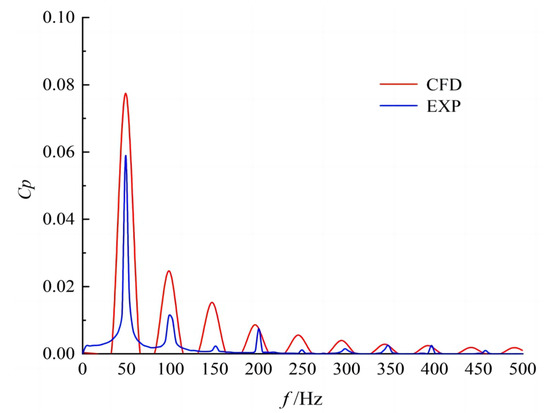
Figure 19.
A comparison of the pressure pulsation spectra from CFD and EXP (d = 0.2 mm).
Figure 20 presents a pressure pulsation diagram of the monitoring points P01–P09 under KQ = 0.41. As shown in Figure 19, the pressure pulsation of each monitoring point in the rotation cycle T of the impeller regularly changes with time, and there are three pressure valleys in a cycle (i.e., the pressure value at the monitoring point when the impeller rotates through the tip clearance).
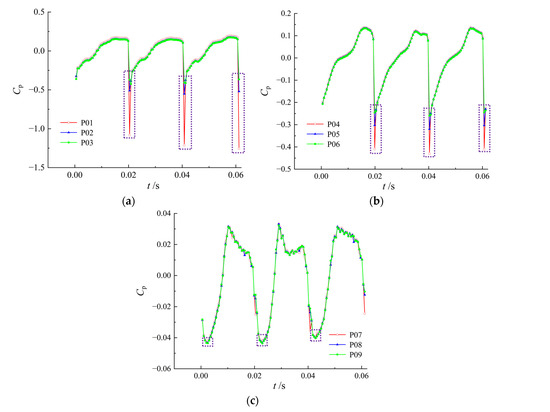
Figure 20.
The pressure pulsation of the monitoring points P01–P09 (KQ = 0.41). (a) LE, (b) λ = 0.5, (c) TE.
The pressure values of each monitoring point under different flow conditions were averaged and compared when passing through the tip clearance in the impeller rotation cycle T. Figure 21 presents the results. The figure demonstrates that the pressure at a fixed chord length gradually decreases as the distance from the blade increases. Under the optimal condition (KQ = 0.49), the pressure values of each monitoring point are lower than those under other flow conditions. The pressure value of P04–P06 at the monitoring point of λ = 0.5 is higher than that of the other monitoring points, and the pressure value of P07–P09 at the monitoring point of TE is less than that of the other monitoring points. Under the small flow condition (KQ = 0.41), the pressure values of the monitoring points P04–P06 at λ = 0.5 are slightly larger than those of the flow condition KQ = 0.49, whereas the pressure values of the monitoring points at TE and LE (P07–P09, P01–P03) are smaller than their pressure values under the flow condition KQ = 0.49.
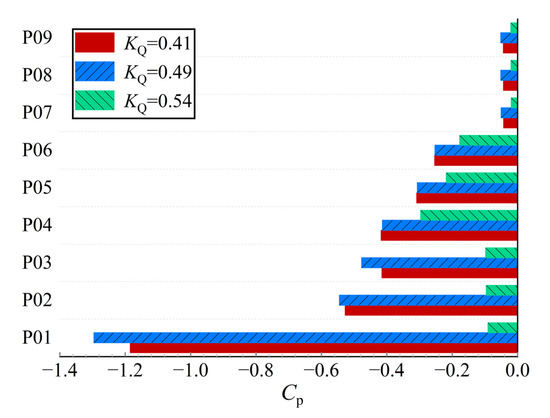
Figure 21.
The average pressure coefficient at the tip clearance of the monitoring points P01–P09.
Figure 22 presents the pressure pulsation spectra of the monitoring points P01–P09 under various flow conditions. In this figure, the main frequency of the pressure pulsation of each monitoring point, regardless of the flow conditions, is 49.05 Hz, which triples the rotation frequency. When the flow rates are KQ = 0.41 and KQ = 0.49, the pressure pulsation spectrum has a similar rule, and the AMP of the monitoring points P01–P03 at the LE is different (i.e., the closer to the blade, the greater the AMP of the monitoring point). The pressure amplitude of the monitoring points P04–P06 at λ = 0.5 are similar at low frequencies. With increasing frequency, the AMP of the monitoring point P04 near the blade becomes slightly higher than that of the monitoring points P04 and P05. There is no significant difference in the AMP of the monitoring points P07–P09 at TE at different frequencies. When the flow rate increases from KQ = 0.41 to KQ = 0.49, the amplitude of the main frequency of the pressure pulsation at the monitoring points P01–P03 at LE decreases, the amplitude of the pressure pulsation at the monitoring points P04–P06 at λ = 0.5 does not significantly change, and the AMP of the main frequency at the monitoring points P07–P09 at TE increases while the AMP of the secondary frequency decreases. When the flow condition is KQ = 0.54, the AMP is considerably lower than that under the other two flow conditions. The main frequency amplitude of the monitoring points P01–P03 is approximately 0.42 times that of KQ = 0.41 and KQ = 0.49. The main frequency AMP of the monitoring points P04–P06 is approximately 0.66 times that of KQ = 0.41 and KQ = 0.49. The main frequency amplitude of the monitoring points P07–P09 is about 0.45 times that of KQ = 0.41 and KQ = 0.49. The low frequency of the AMP of the three monitoring points at the same chord length does not significantly differ, but there are some differences in the high frequencies.
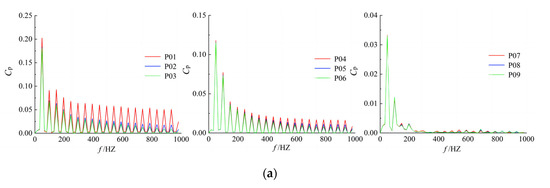
Figure 22.
The spectrum of the pressure pulsation at monitoring points P01–P09. (a) KQ = 0.41, (b) KQ = 0.49, (c) KQ = 0.54.
Figure 23 shows the pressure pulsation time domain and frequency spectrum of the TLV center monitoring point P10 under various flow conditions. In the figure, the AMP of the monitoring point P10 drops as the flow rate rises, and the fluctuation frequency in an impeller rotation period T also decreases as the flow rate increases. Under KQ = 0.54, the primary frequency of the pressure pulsation at the monitoring point P10 is 32.7 Hz, which is the same as the blade frequency, whereas the main frequency of the pressure pulsation at the flow conditions of KQ = 0.41 and KQ = 0.49 is 65.4 Hz, indicating that the TCLF significantly interferes with the main flow to form a strong TLV under the small flow condition. With an increasing flow rate, the main flow is enhanced, and the interference of the TCLF with the mainstream is gradually reduced until the TCLF is mostly controlled by the main flow under the large flow condition.
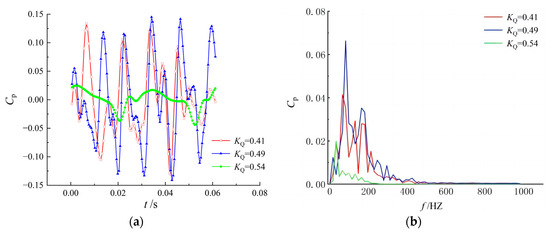
Figure 23.
A pressure pulsation diagram of the monitoring point P10. (a) Time-domain diagram, (b) spectrum diagram.
5. Conclusions
This study investigated the variation of the flow field and pressure pulsation in the tip clearance under multiple operating conditions. Using the SST-CC turbulence model, the tip clearance flow properties and clearance pressure pulsation of a shaft tubular pump device under various flow conditions were numerically analyzed, and the accuracy of the numerical calculation results was verified by comparison with energy performance and pressure pulsation experiments. The following conclusions were drawn:
1. When the flow rate increased, the TCLF decreased, and the axial velocity of the flow at the tip clearance increased. The axial velocity of the TCLF at the LE was significantly affected by changes in the flow rate. When the flow rate reached KQ = 0.54 and the gap widths were d = 0.5 mm and d = 1.0 mm, the axial velocity of the TCLF at the LE changed from positive to negative, indicating that the influence of the tip clearance of the water flow decreased as the flow rate increased and was finally controlled by the main flow.
2. A vortex zone existed near the tip clearance inlet (ζ = 0.1) on the tip side. The pressure in the vortex zone near the LE (λ = 0.2) was lower, and the vorticity, swirling strength, and TKE were higher. The range of the vortex zone gradually increased from λ = 0.2 to λ = 0.5, but the pressure value also gradually increased, and the peak values of the vorticity, swirling strength, and TKE decreased. The parameters continued to flatten from λ = 0.5 to λ = 0.8 and the actual vortex area decreased.
3. The TLV shape regularly changed in the impeller rotation cycle T. The TLV was separated from the vortex that was attached to the blade SS (λ = 0.2–0.4) and was far from the blade SS in the radial direction. The separated vortex was then close to the blade SS. When the flow rate increased, the overall strength of the TLV showed a downward trend and was mostly affected by the main flow away from the SS of the blade.
4. The pressure values of the monitoring points at the tip clearance were similar when the flow conditions were KQ = 0.41 and KQ = 0.49. When KQ = 0.41, the values of the AMP of the main frequencies at each monitoring point were slightly higher and the second frequencies were lower than those when KQ = 0.49. The pressure values at the tip clearance were significantly reduced under large-flow conditions (KQ = 0.54). The main frequency amplitude of the pressure pulsation at the monitoring points P01–P03 at the LE was approximately 0.42 times that at KQ = 0.41 and KQ = 0.49. The AMP of the main frequency at the monitoring points P04–P06 at λ = 0.5 was approximately 0.66 times that at KQ = 0.41 and KQ = 0.49. The AMP of the main frequency at the monitoring points P07–P09 at TE was approximately 0.45 times that at KQ = 0.41 and KQ = 0.49. The pressure pulsation at the vortex center of the TLV decreased as the flow rate increased. The main frequency of the pressure pulsation was 65.4 Hz when KQ = 0.41 and KQ = 0.49, and the main frequency of the pressure pulsation was 32.7 Hz when KQ = 0.54.
In this paper, considering the hydraulic coupling effect of the pump and pipe, the tip clearance leakage flow of the impeller was analyzed, the leakage rate and leakage velocity characteristics of different tip clearances were clarified, the variation rules of the vorticity, swirling strength, and turbulent kinetic energy of tip leakage flow field were expounded, and the time-frequency characteristics of the pressure fluctuation in the tip clearance area were revealed. This study provides a reference for controlling tip clearance leakage flow and reducing its impact on the hydraulic performance of pump devices, which is conducive to the efficient, safe, and stable operation of such devices. In the future, some research work considering more factors will be carried out, such as considering the cavitation effect at the tip clearance and exploring the influence of the clearance shape on the flow field of the pump device.
Author Contributions
Conceptualization, methodology, funding acquisition and supervision, F.Y.; software, writing—original draft and formal analysis, Z.L.; investigation and writing—review and editing, J.G.; resources and supervision, H.J.; investigation and supervision, S.S.; resources and writing—review and editing, X.J. All authors have read and agreed to the published version of the manuscript.
Funding
This research was funded by the National Natural Science Foundation of China (Grant No. 51609210), the Major Projects of the Natural Science Foundation of the Jiangsu Higher Education Institutions of China (Grant No. 20KJA570001), the Technology Project of the Water Resources Department of the Jiangsu Province (Grant No. 2022074), the Science and Technology Plan Project of Yangzhou City (Grant No. YZ2022192) and the Postgraduate Research & Practice Innovation Program of Jiangsu Province (Grant No. SJCX22_1757).
Institutional Review Board Statement
Not applicable.
Informed Consent Statement
Not applicable.
Data Availability Statement
All data is available in this paper.
Conflicts of Interest
The authors declare no conflict of interest.
Nomenclature
| TCLF | tip clearance leakage flow |
| PS | pressure surface |
| SS | suction surface |
| TLV | tip leakage vortices |
| CFD | computational fluid dynamics |
| SST-CC | shear stress transport-curvature correction |
| D | impeller nominal diameter |
| ES | system uncertainty of the test bench |
| EQ, EH, EM, En | system errors of flow rate, head, torque and rotational speed |
| Pk | generating term of the transport equations |
| fr | correction factor |
| Co | Courant number |
| absolute value of the estimated average speed | |
| fs.max | maximum sampling frequency |
| fmax | maximum frequency in the signal |
| Δt | time step |
| d | tip clearance width |
| GCI | grid convergence index |
| KQ, KH | flow coefficient, head coefficient |
| Q | flow rate |
| H | head |
| g | acceleration of gravity |
| λ | blade chord length coefficient |
| ζ | thickness coefficient |
| r* | radial coefficient |
| LE | leading edge |
| TE | trailing edge |
| RQ | relative leakage |
| Qtip, Qtotal | flow rate of the TCLF, total flow rate of the impeller |
| TKE | turbulent kinetic energy |
| Cp, Cω, Cs, Ck | pressure coefficient, vorticity coefficient, swirling strength coefficient, TKE coefficient |
References
- Zhang, D.; Shi, W.; van Esch, B.; Shi, L.; Dubuisson, M. Numerical and experimental investigation of tip leakage vortex trajectory and dynamics in an axial flow pump. Comput. Fluids 2015, 112, 61–71. [Google Scholar] [CrossRef]
- Zhang, D.; Shi, L.; Shi, W.; Zhao, R.; Wang, H.; van Esch, B. Numerical analysis of unsteady tip leakage vortex cavitation cloud and unstable suction-side-perpendicular cavitating vortices in an axial flow pump. Int. J. Multiph. Flow 2015, 77, 244–259. [Google Scholar] [CrossRef]
- Zhang, H.; Zuo, F.; Zhang, D.; Shi, W. Formation and Evolution Mechanism of Tip Leakage Vortex in Axial Flow Pump and Vortex Cavitation Analysis. Nongye Jixie Xuebao/Trans. Chin. Soc. Agric. Mach. 2021, 52, 157–167. [Google Scholar]
- Ji, D.; Lu, W.; Xu, L.; Lu, L. Comparison of the Hydraulic Performance and Pressure Pulsation Characteristics of Shaft Tubu-lar Pump Device under Multiple Working Conditions. JMSE 2022, 10, 750. [Google Scholar] [CrossRef]
- Chen, J.; Mao, J.; Shi, H.; Wang, X. Experimental and Numerical Study on the Hydraulic Characteristics of an S-Type Bidi-rectional Shaft Tubular Pump. JMSE 2022, 10, 671. [Google Scholar] [CrossRef]
- Wang, C.-N.; Yang, F.-C.; Nguyen, V.T.T.; Vo, N.T.M. CFD Analysis and Optimum Design for a Centrifugal Pump Using an Effectively Artificial Intelligent Algorithm. Micromachines 2022, 13, 1208. [Google Scholar] [CrossRef]
- Liu, Y.; Tan, L. Spatial–Temporal Evolution of Tip Leakage Vortex in a Mixed-Flow Pump With Tip Clearance. J. Fluids Eng. 2019, 141, 081302. [Google Scholar] [CrossRef]
- Kim, H.-H.; Rakibuzzaman, M.; Kim, K.; Suh, S.-H. Flow and Fast Fourier Transform Analyses for Tip Clearance Effect in an Operating Kaplan Turbine. Energies 2019, 12, 264. [Google Scholar] [CrossRef]
- Wang, L.; Lu, J.; Liao, W.; Wang, W.; Feng, J.; Luo, X. Study on tip leakage vortex structure properties of centrifugal pump. J. Hydraul. Eng. 2020, 51, 738–748. [Google Scholar]
- Yang, Y.; Zhou, L.; Bai, L.; Xu, H.; Lv, W.; Shi, W.; Wang, H. Numerical Investigation of Tip Clearance Effects on the Perfor-mance and Flow Pattern Within a Sewage Pump. J. Fluids Eng. 2022, 144, 081202. [Google Scholar] [CrossRef]
- Ji, L.; Li, W.; Shi, W.; Agarwal, R. Transient characteristics of internal flow fields of mixed-flow pump with different tip clearances under stall condition. Proc. Inst. Mech. Eng. Part A J. Power Energy 2021, 235, 700–717. [Google Scholar] [CrossRef]
- Yu, H.; Zhang, Z.; Hua, H. Numerical Investigation of Tip Clearance Effects on Propulsion Performance and Pressure Fluc-tuation of a Pump-Jet Propulsor. Ocean Eng. 2019, 192, 106500. [Google Scholar] [CrossRef]
- Shen, S.; Qian, Z.; Ji, B.; Agarwal, R. Numerical investigation of tip flow dynamics and main flow characteristics with varying tip clearance widths for an axial-flow pump. Proc. Inst. Mech. Eng. Part A J. Power Energy 2019, 233, 476–488. [Google Scholar] [CrossRef]
- Han, C.-Z.; Xu, S.; Cheng, H.-Y.; Ji, B.; Zhang, Z.-Y. LES method of the tip clearance vortex cavitation in a propelling pump with special emphasis on the cavitation-vortex interaction. J. Hydrodyn. 2020, 32, 1212–1216. [Google Scholar] [CrossRef]
- Zhang, J.; Fan, H.; Zhang, W.; Xie, Z. Energy performance and flow characteristics of a multiphase pump with different tip clearance sizes. Adv. Mech. Eng. 2019, 11, 168781401882335. [Google Scholar] [CrossRef]
- Kan, N.; Liu, Z.; Shi, G.; Liu, X. Effect of Tip Clearance on Helico-Axial Flow Pump Performance at Off-Design Case. Process. 2021, 9, 1653. [Google Scholar] [CrossRef]
- Yang, F.; Liu, C.; Tang, F.; Zhou, J. Analysis of Shaft Line Evolution and Its Influence on Hydraulic Performance of Pump De-vice. J. Basic Sci. Eng. 2014, 22, 129–138. [Google Scholar]
- Xie, R.; Wu, Z.; He, Y.; Tang, F.; Xie, C.; Tu, L. Study on optimization of inlet and outlet passage of bidirectional shaft tubular pump. Trans. Chin. Soc. Agric. Mach. 2015, 46, 68–74. [Google Scholar]
- Xu, L.; Lv, F.; Li, F.; Ji, D.; Shi, W.; Lu, W.; Lu, L. Comparison of Energy Performance of Shaft Tubular Pump Device at Two Guide Vane Inlet Angles. Process. 2022, 10, 1054. [Google Scholar] [CrossRef]
- Meng, F.; Pei, J.; Li, Y.; Yuan, S.; Chen, J. Influence of guide vane position on hydraulic performance of bidirectional shaft tubular pump. Trans. Chin. Soc. Agric. Mach. 2017, 48, 135–140. [Google Scholar]
- Jiao, H.; Sun, C.; Chen, S. Analysis of the Influence of Inlet Guide Vanes on the Performance of Shaft Tubular Pumps. Shock Vib. 2021, 2021, 1–17. [Google Scholar] [CrossRef]
- Cheng, K.; Li, S.; Cheng, L.; Sun, T.; Zhang, B.; Jiao, W. Experiment on Influence of Blade Angle on Hydraulic Characteristics of the Shaft Tubular Pumping Device. Processes 2022, 10, 590. [Google Scholar] [CrossRef]
- Pei, J.; Meng, F.; Li, Y.; Yuan, S.; Chen, J. Effects of distance between impeller and guide vane on losses in a low head pump by entropy production analysis. Adv. Mech. Eng. 2016, 8, 168781401667956. [Google Scholar] [CrossRef]
- Wang, S.; Zhang, L.; Yin, G. Numerical Investigation of the FSI Characteristics in a Tubular Pump. Math. Probl. Eng. 2017, 2017, 1–9. [Google Scholar] [CrossRef]
- Yang, F.; Liu, C. Numerical and Experimental Investigations of Vortex Flows and Vortex Suppression Schemes in the Intake Passage of Pumping System. Adv. Mech. Eng. 2015, 7, 547086. [Google Scholar] [CrossRef]
- Menter, F.R. Two-equation eddy-viscosity turbulence models for engineering applications. AIAA J. 1994, 32, 1598–1605. [Google Scholar] [CrossRef]
- Smirnov, P.E.; Menter, F.R. Sensitization of the SST Turbulence Model to Rotation and Curvature by Applying the Spalart–Shur Correction Term. J. Turbomach. 2009, 131, 041010. [Google Scholar] [CrossRef]
- Al-Obaidi, A.R. Effects of Different Turbulence Models on Three-Dimensional Unsteady Cavitating Flows in the Centrifugal Pump and Performance Prediction. Int. J. Nonlinear Sci. Numer. Simul. 2019, 20, 487–509. [Google Scholar] [CrossRef]
- Yang, F.; Zhang, Y.; Yuan, Y.; Liu, C.; Li, Z.; Nasr, A. Numerical and Experimental Analysis of Flow and Pulsation in Hump Section of Siphon Outlet Conduit of Axial Flow Pump Device. Appl. Sci. 2021, 11, 4941. [Google Scholar] [CrossRef]
- Yang, F.; Li, Z.; Yuan, Y.; Liu, C.; Zhang, Y.; Jin, Y. Numerical and Experimental Investigation of Internal Flow Characteristics and Pressure Fluctuation in Inlet Passage of Axial Flow Pump under Deflection Flow Conditions. Energies 2021, 14, 5245. [Google Scholar] [CrossRef]
- Wang, F. Flow Analysis Method of Pump and Pump Station, 1st ed.; China Water & Power Press: Beijing, China, 2020. [Google Scholar]
- Yang, F.; Li, Z.; Hu, W.; Liu, C.; Jiang, D.; Liu, D.; Nasr, A. Analysis of flow loss characteristics of slanted axial-flow pump device based on entropy production theory. R. Soc. Open Sci. 2022, 9, 211208. [Google Scholar] [CrossRef] [PubMed]
- Feng, H.; Wan, Y.; Fan, Z. Numerical investigation of turbulent cavitating flow in an axial flow pump using a new transport-based model. J. Mech. Sci. Technol. 2020, 34, 745–756. [Google Scholar] [CrossRef]
- Qiaorui, S.; Ali, A.; Biaobiao, W.; Wang, P.; Bois, G.; Jianping, Y.; Kubar, A.A. Numerical Study on Gas-Liquid Two Phase Flow Characteristic of Multistage Electrical Submersible Pump by Using a Novel Multiple-Size Group (MUSIG) Model. Phys. Fluids 2022, 34, 063311. [Google Scholar] [CrossRef]
- Yang, F.; Li, Z.; Fu, J.; Lv, Y.; Ji, Q.; Jian, H. Numerical and Experimental Analysis of Transient Flow Field and Pressure Pul-sations of an Axial-Flow Pump Considering the Pump–Pipeline Interaction. JMSE 2022, 10, 258. [Google Scholar] [CrossRef]
- Kan, K.; Zhao, F.; Xu, H.; Feng, J.; Chen, H.; Liu, W. Energy Performance Evaluation of an Axial-Flow Pump as Turbine under Conventional and Reverse Operating Modes Based on an Energy Loss Intensity Model. Phys. Fluids 2023, 35, 015125. [Google Scholar] [CrossRef]
- Wang, Y.; Gui, N. The Third Generation Vortex Identification Method and Its Application. Chin. J. Hydrodyn. 2019, 34, 413–429. [Google Scholar]


Disclaimer/Publisher’s Note: The statements, opinions and data contained in all publications are solely those of the individual author(s) and contributor(s) and not of MDPI and/or the editor(s). MDPI and/or the editor(s) disclaim responsibility for any injury to people or property resulting from any ideas, methods, instructions or products referred to in the content. |
© 2023 by the authors. Licensee MDPI, Basel, Switzerland. This article is an open access article distributed under the terms and conditions of the Creative Commons Attribution (CC BY) license (https://creativecommons.org/licenses/by/4.0/).