Article

An Experimental Study on the Resistance of a High-Speed Air Cavity Craft

1
State Key Laboratory of Hydraulic Engineering Simulation and Safety, Tianjin University, Tianjin 300072, China
2
Tianjin Renai College, Tianjin 301636, China
*
Author to whom correspondence should be addressed.
J. Mar. Sci. Eng. 2023, 11(7), 1256; https://doi.org/10.3390/jmse11071256
Submission received: 28 April 2023 / Revised: 10 June 2023 / Accepted: 19 June 2023 / Published: 21 June 2023
(This article belongs to the Section Ocean Engineering)

Abstract

:
For the marine industry, resistance reduction can reduce energy consumption and achieve protection of the marine environment. The use of air lubrication to reduce the resistance of ships is one of the most important ways. With this technology, high-speed air cavity crafts show immense potential as they can be utilized in various marine activities, such as emergency rescue, supply, and maritime security. Through experiments, this study presents an in-depth analysis of the effects of bubble chamber pressure and initial stern inclination on the resistance of high-speed air cavity crafts at different speeds. The results show that air pressure has a significant impact on resistance. It was found that as the speed of the ship increased, the resistance reduction effect became more prominent under the same pressure conditions. Moreover, the resistance tended to stabilize when the pressure reached a certain value. In addition to the air pressure, the longitudinal inclination does have an effect on resistance reduction. To achieve better resistance reduction, the initial stern inclination angle should be chosen appropriately. Furthermore, adjusting the angle with speed changes can optimize the resistance reduction effect. This experimental study provides critical support for conducting further research on high-speed air cavity crafts. The findings offer valuable insights into improving hull forms, guiding host selection, and assessing performance.

1. Introduction

High-speed air cavity crafts are an innovative and emerging class of ships that offer several advantages over other types of vessels, such as hydrofoils and hovercrafts. Notably, high-speed air cavity crafts boast excellent economic performance and a simple structure, enabling easy routine maintenance, low costs, and convenient access to docks. As such, this vessel type presents broad market potential for both military and civilian applications and has garnered considerable attention as a research focus within the international shipbuilding industry [1,2,3].
To reduce resistance and increase speed, high-speed air cavity crafts utilize marine gas lubrication technology, which capitalizes on the significant differences in viscosity and density between water and gas to minimize frictional and viscous resistance on the vessel’s hull. By inflating the cavity with air, a thin air layer is formed and maintained on the bottom of the boat, effectively creating separation between the hull and the water, thus reducing the contact area and effectively decreasing resistance. This approach represents a crucial method for achieving energy savings and reducing emissions in the marine industry, as well as raising the speed limitation for safe and efficient navigation [4,5].
Research on cavity resistance reduction has been conducted by several countries, including the United States, Russia, China, France, Japan, Ukraine, the Netherlands, and others [6,7,8,9,10]. With the introduction of decarbonization regulations such as the Energy Efficiency Design Index, the Energy Efficiency Existing Ship Index, and the Carbon Intensity Indicator, shipowners, ship operators, and charterers are keen to ensure that their ships are as energy-efficient as possible and follow the IMO’s decarbonization targets. Several shipping companies and shipyards have recognized the potential of air lubrication and have started incorporating these technologies into their vessel designs and retrofit projects. The commercial availability of these technologies allows shipowners and operators to consider air lubrication as a viable solution for enhancing the operational efficiency and sustainability of their fleets. Research and development efforts continue to explore new advancements and refine existing methods to achieve optimal performance gains. They may offer a promising and exciting avenue for advancing the future of the marine industry [11].
Over the years, researchers around the world have carried out experimental studies on cavity resistance reduction for different models. As early as 2004, Gokcay et al. [12] conducted resistance tests on two high-speed cavity hull models. Meaningful conclusions, such as the small effect of air supply rate on drag reduction, were obtained.
Since 2009, the studies of Matveev et al. have made contributions in this field [13,14,15,16,17,18,19]. First, an experimental study and numerical simulation of an air ventilation cavity under a simplified hull were carried out. Experiments with a stepped hull model were carried out in an open-surface water channel. To complement and bolster these physical experiments, numerical studies were carried out using the linear potential flow method and the finite volume viscous code Fluent [13]. In their work published in 2011, Matveev et al. [14] conducted an experiment and modeling studies of the cavity formed under a model-scale hull. It was found that the placement of lifting plates beneath the cavity of the trim model significantly increased the maximum size of the cavity, suggesting the possibility of using hydrofoils and variable air supply as a mechanism to control the air cavity.
The following year, Matveev et al. [15] employed a potential flow model to explore the impact of the hull transverse frame on the characteristics of the air cavity formed by wedging. In 2015, a study was carried out on the application of drag-reduction air cavities for high-speed heavy-loaded monohull ships. Based on the linearized potential flow theory of surface flow, the mathematical model description and parameter calculation for the selected structure were given [16]. In 2019, a simplified numerical model of a nonconstant air cavity was further elaborated to simulate the air cavity dynamics under time-varying external conditions [17].
Meanwhile, the work of Collins and Matveev [18] in 2020 focused on the effect of compact actuators on the water flow under the hull. They suggested that the actuator effect is more pronounced at higher water velocities. Meanwhile, Matveev [19] simulated air cavity flow with computational fluid dynamics. It was found that the numerical results obtained for the air cavity agreed with the experimental data, which served as verification of the feasibility of the experimental and numerical methods.
The research conducted by Cucinotta et al. is another contribution to this field [20,21,22,23,24]. In 2017, an experimental comparison of high-speed planing yacht models with different air cavity designs was carried out, discussing the results and influence of geometric and physical parameters [20]. At the same time, a series of computational tests and comparisons were conducted to obtain reliable predictions of the behavior of the bubbles under the hull [21]. In 2018, they presented a comparison between the experimental test and simulation results to validate the differences, further establishing the reliability of their approach for the design [22,23].
More recently, in 2021, the work of Cucinotta et al. [24] has continued with model tests to investigate the effect of adding longitudinal rails on an air cavity stepped planing hull, offering important insights into the potential of this technology for practical applications.
In addition to the two aforementioned teams, further related research has been conducted by scholars and researchers in some countries and regions in recent years.
For instance, Butterworth et al. [25] carried out a series of tests in 2015 to investigate the performance of introducing an air cavity into a model hull form, including static stability tests, resistance tests, and motion response tests. In 2019, Wu et al. [26] conducted resistance and self-propulsion tests on a model ship based on a 95,000 DWT bulk carrier with a bottom cavity, and a suitable bottom cavity was designed for low-speed and large ships based on the plate test results. In 2020, Wang et al. [27] carried out an experimental study of ventilated cavity flow in a model ship using a calm water towing tank, where they explored some characteristics of the cavity.
These studies demonstrate the ongoing commitment of researchers to explore the potential of air cavity technology for improving the performance of high-speed ships, with valuable contributions being made to the field through both experimental and numerical investigations. However, despite the progress made in recent years, the number of experimental studies on these crafts remains relatively small. The experimental research on the effect of longitudinal tilt on the drag reduction of these crafts is still very limited, leaving gaps in our understanding of the technology.
Against this background, the present study aims to obtain some useful conclusions by conducting model tests on a 25 m long high-speed air cavity craft, with a focus on resistance tests under different air pressures and initial stern inclination angles. The paper is structured into five sections. Section 1 (this section) provides an overview of the topic and summarizes related studies in the field. Section 2 introduces the symbols and nomenclature used in the testing and analysis process, ensuring clarity and consistency in the presentation of the results. Section 3 details the content and method of the test, including the parameters of the ship, the test steps, and model-making procedures. Section 4 presents the test results, which are analyzed and discussed in detail. Finally, Section 5 summarizes the key findings of the study and proposes future research directions.

2. Nomenclature

The nomenclature adopted in this study is in accordance with standard conventions in the field of naval architecture and marine engineering, as shown in Table 1. Specifically, the subscript M is utilized to denote the model number, while the subscript S denotes the full-scale vessel.

3. Test Content and Methodology

The resistance test of a ship model is a crucial component of ship model testing, which primarily investigates the forces acting on the ship model and its sailing state as it moves in a straight line at a constant speed in water. This test is crucial for calculating the effective power of the actual ship and selecting the appropriate propeller. Verification of whether the expected reduction in ship resistance can be achieved must be obtained through ship model testing, which can be considered the most common and effective method for such evaluations. This chapter will elaborate on the ship model parameters, test equipment and model, and test content.

3.1. Hull Parameters

Table 2 provides the key parameters of the hull and additional relevant parameters, where CB and CM are calculated according to the following equations:
C B = L W L B T
C M = A M B T
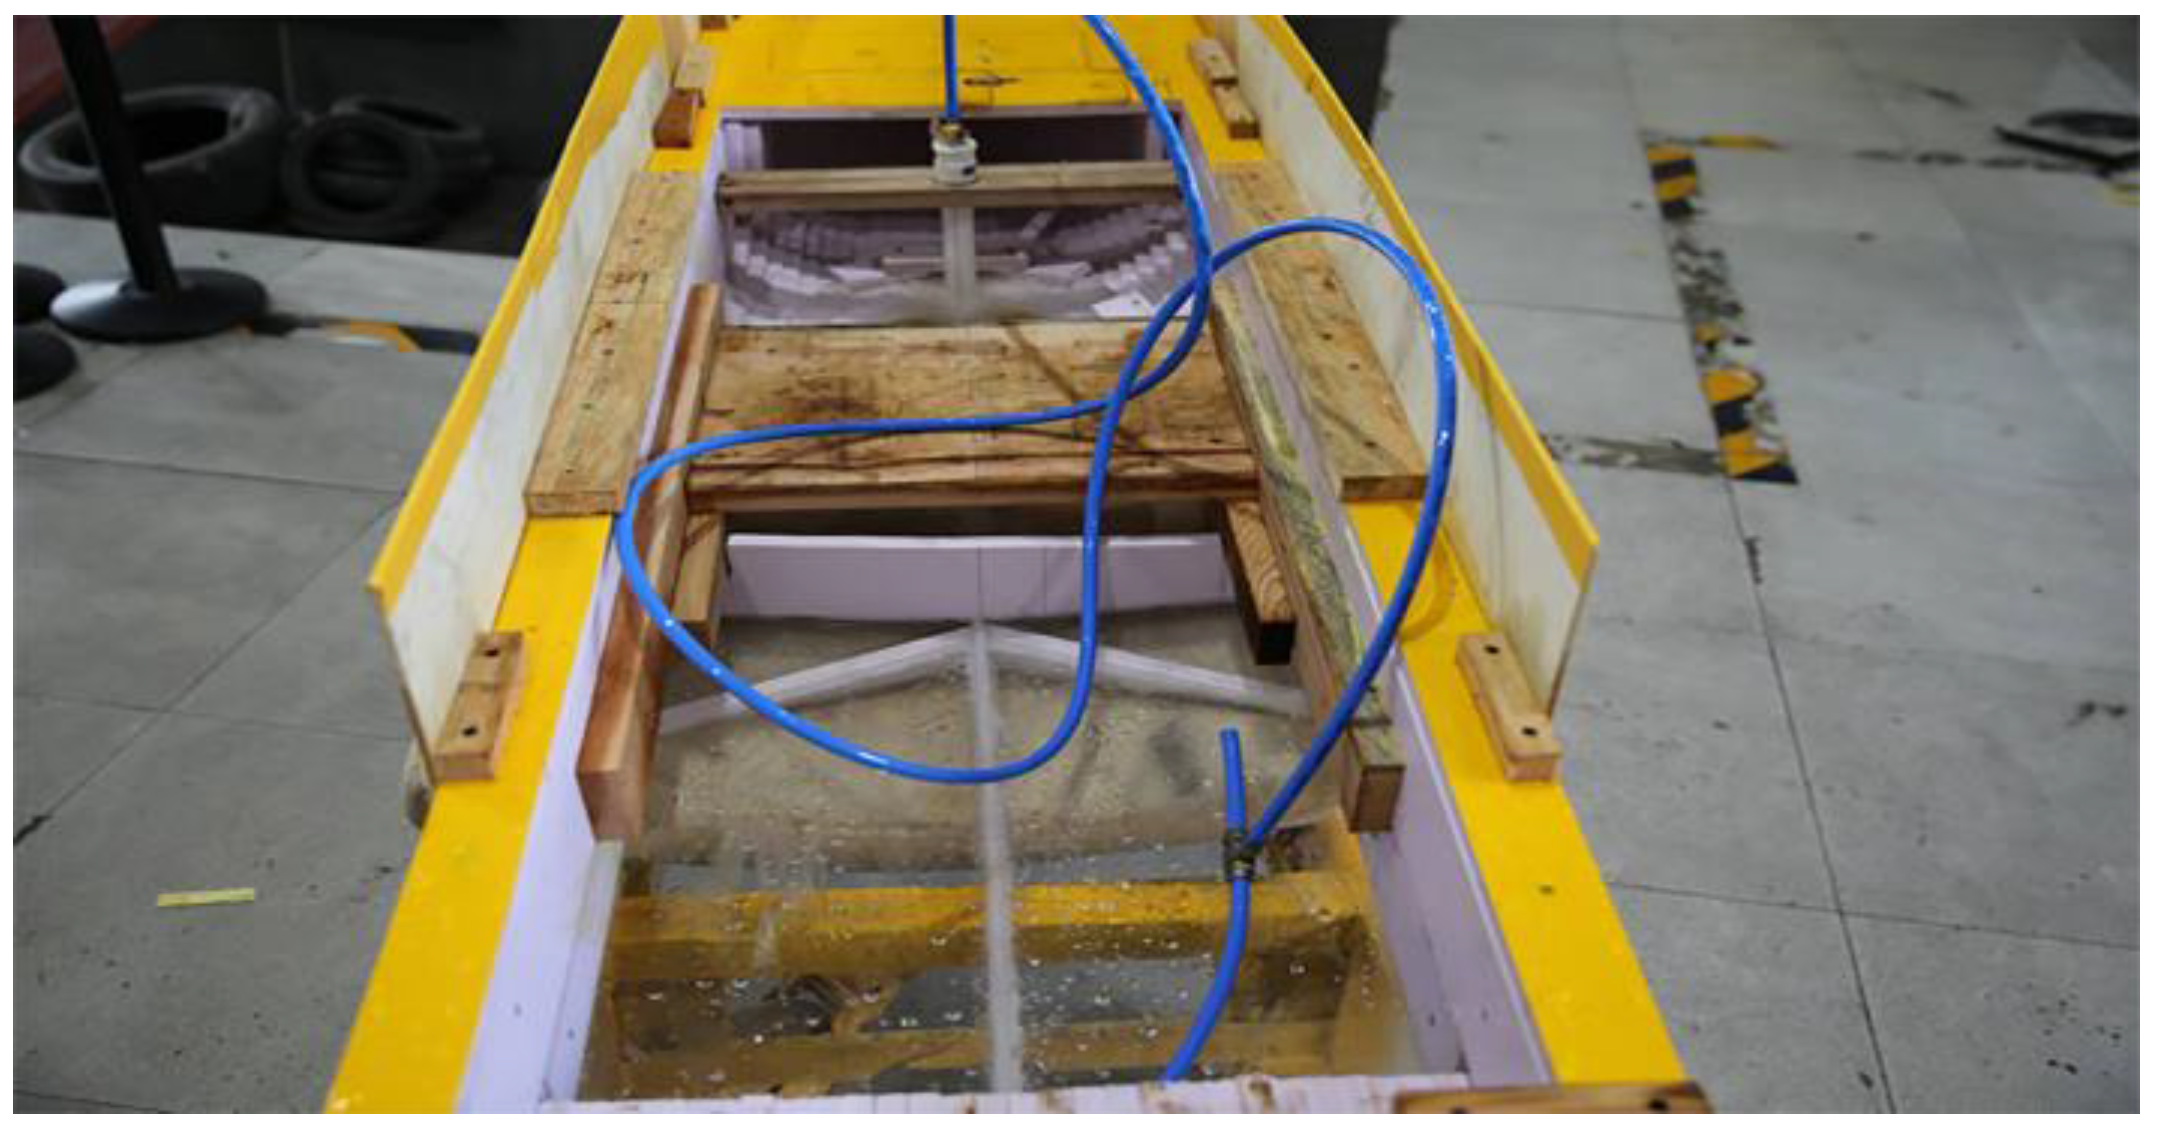
The foregoing hull parameters correspond to an initial stern inclination angle of 2.5°. The model is shown in Figure 1 and Figure 2. A distinct feature of this craft is the incorporation of cavities at its bottom, referring to the existing literature and similar ships. This innovative design element serves the purpose of reducing the resistance encountered by the craft during its operation. The lower part of the hull is divided into three sections: the stern cavity, midship cavity, and antiair bubble escape area, as depicted in Figure 3. The sidewalls of the cavities extend to the stern bulkhead, providing space for the arrangement of the stern propulsion system. For a more comprehensive design, please refer to Figure A1 for the lines plan. The wetted surface area S (m2), as presented in Table 2, pertains to the no-air state, whereas the value for the air state corresponds to the original wetted surface area, reduced by the cavity area of 84 m2. Specifically, the latter equals 97 m2, given that 181 m2 minus 84 m2 results in a total of 97 m2.

3.2. Test Setup and Model

This experimental study was conducted in a towing tank with a length of 135 m, a width of 7 m, and a depth of 3.6 m. The main data measured in the testing procedure are the resistance, pitch, and heave of the model. The resistance was derived from the measurement of drag force with the resistance dynamometer. Pitch and heave were measured using the inclination sensor and the displacement sensor, respectively. The data were collected in real time via a data acquisition system. Moreover, the wave characteristics during the voyage were thoroughly monitored using cameras positioned on the starboard and port sides, while the flow characteristics at the observation window were recorded using a panoramic waterproof camera fixed to the stern beam.
The test model used in the experiment was crafted from wood–plastic panels, which served as the primary material. These panels were lightweight, corrosion-resistant, malleable, and cost-effective. The model was attached using automotive sheet metal adhesive, screws, and other techniques.
The construction of the model was performed with utmost care and precision using a combination of automotive sheet metal adhesive and screws. The headline of the model was constructed using a polyputty base, a material that boasts excellent adhesion to the surface of the object and does not exhibit any cracking during the drying process. Furthermore, to achieve a high degree of surface smoothness for the model, it was meticulously sanded and painted to the appropriate standard. For the purpose of facilitating the observation of the flow phenomenon at the rear of the broken stage, a transparent viewing window made of plexiglass was thoughtfully provided on the tail glide.
To prevent damage to the measurement element by the inertial force during the experiment, a clamping device fixed on the trailer was employed. The model was driven by it to the stage of uniform speed movement, and the clamping device was opened to make the model in a free sailing state for measurement recording. After the measurement was completed, the clamping device was re-engaged, and the trailer was braked again to slow down and return the model to the initial position at low speed.

3.3. Test Content

In order to better complete the test, a pretest was first conducted. Resistance contrast tests were carried out at real ship speed of Vs = 30.9 kn, while air cavity pressures of 10 kPa, 17 kPa, 35 kPa, 50 kPa, and 68 kPa were, respectively, applied. It was observed that the resistance value gradually decreased as the pressure increased. However, after the pressure reached 50 kPa, the resistance value of the ship model stabilized.
This phenomenon could be attributed to the increase in the void fraction in the gas–liquid two-phase flow as the pressure increased, leading to a reduction in the model’s frictional resistance. This trend continued until the saturation pressure was reached, resulting in an isobaric interior of the cavity, at which point the resistance reduction effect reached its maximum. Considering the real situation, the follow-up tests were carried out at 50 kPa.
At this pressure, resistance tests were conducted for the initial stern inclination angles of 1.5°, 2.5°, and 3.5°. By implementing the control variable method, 20 different speed multicondition combinations from 12 to 31 knots were utilized to investigate the effects of pressure, pitch angle, and other key parameters on the resistance performance of the high-speed craft. Furthermore, the resistance reduction effects on the craft before and after air injection into the bottom of the craft were compared. Additionally, resistance data without air were tested at an initial stern inclination angle of 2.5° to provide a reference for experimental comparisons.

4. Results and Discussion

In this section, the results of the model resistance test conversions and the sailing measurements of pitch are described and analyzed.

4.1. Text Results

For comparison purposes, the resistance experiments of the ship model under every towing speed were performed. The results are shown in Table 3, which include four cases. The first case is no air bubbles and for the initial stern inclination angles of 2.5°. The remaining three cases are at 50 kpa and for the initial stern inclination angles of 1.5°, 2.5°, and 3.5°, respectively. The experimental results were revised based on the recommendations provided by the ITTC.
The Froude numbers were calculated according to the following equation:
F r = V S g L S = V M g L M

4.2. Calculation Method

The results of the ship model resistance test were converted based on the 2D method. The obtained conversion results include the actual ship resistance and the effective power of a bare hull in ideal environmental conditions with no wind, waves, or currents, infinite water depth, and a seawater temperature of 15 °C (density of 1025 kg/m3).
The total resistance coefficient C T , using the 1957 ITTC ship model-real ship conversion formula, is
C T = 2 R T ρ S V 2
The frictional resistance coefficient C F is
C F = 0.075 ( lg R e 2 ) 2
where: R e = V L WL υ
V is the speed of the ship (m/s).
υ is the kinematic viscosity coefficient of water (m2/s).
The roughness allowance coefficient was selected according to the length of the ship and the experience of the towing tank. For this test, the value of ΔCF was determined to be 0.00078.
The residual resistance coefficient C R is
C R = C TM C FM
The total resistance coefficient of a real ship is
C TS = C FS + Δ C F + C R
The real ship effective power is
P E = 1 2 ρ V 3 S C TS
The definitions of the parameters mentioned in the aforementioned equation can be found in Section 2, which is dedicated to nomenclature.

4.3. Effective Power

The results of the calculations are shown below.
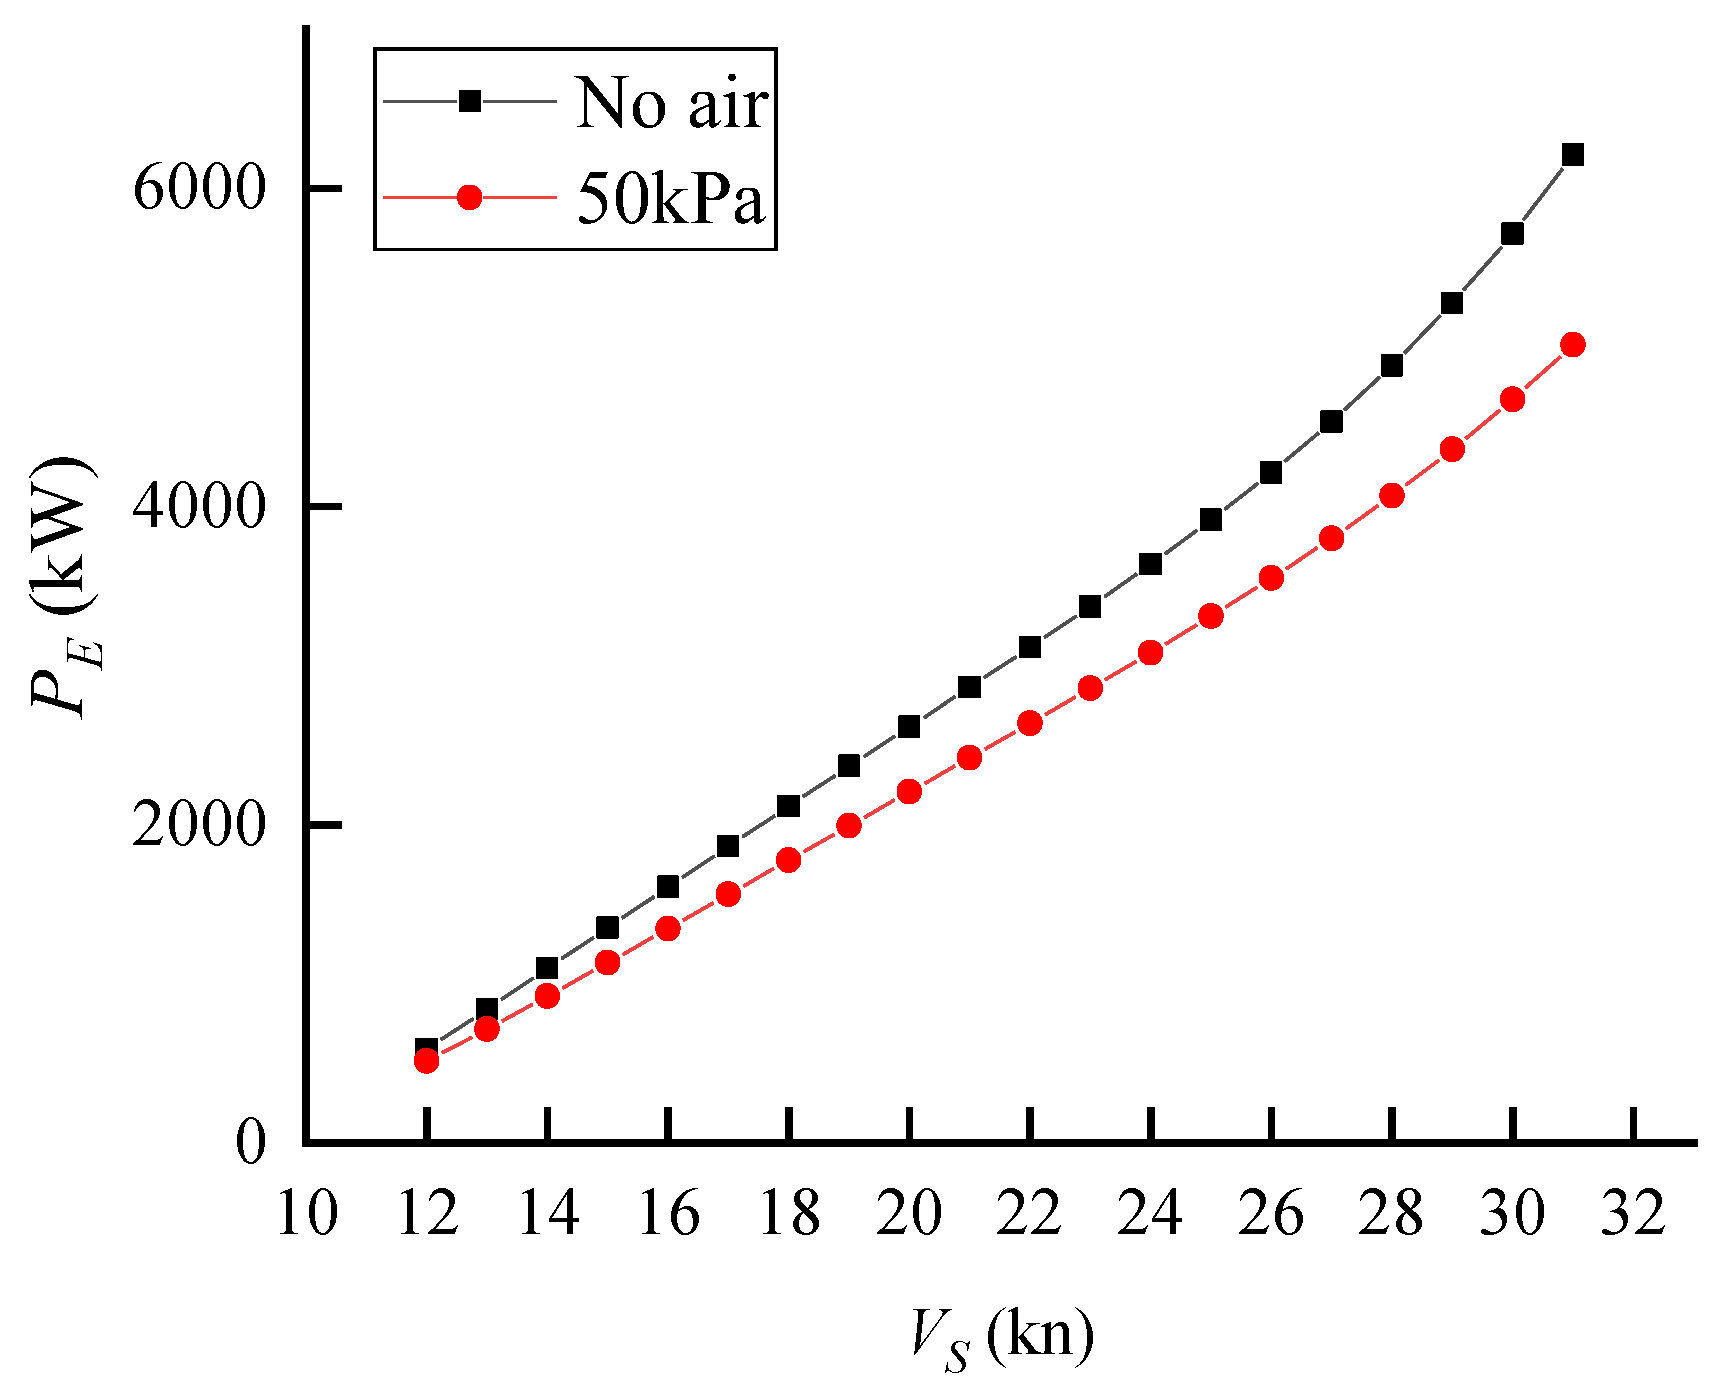
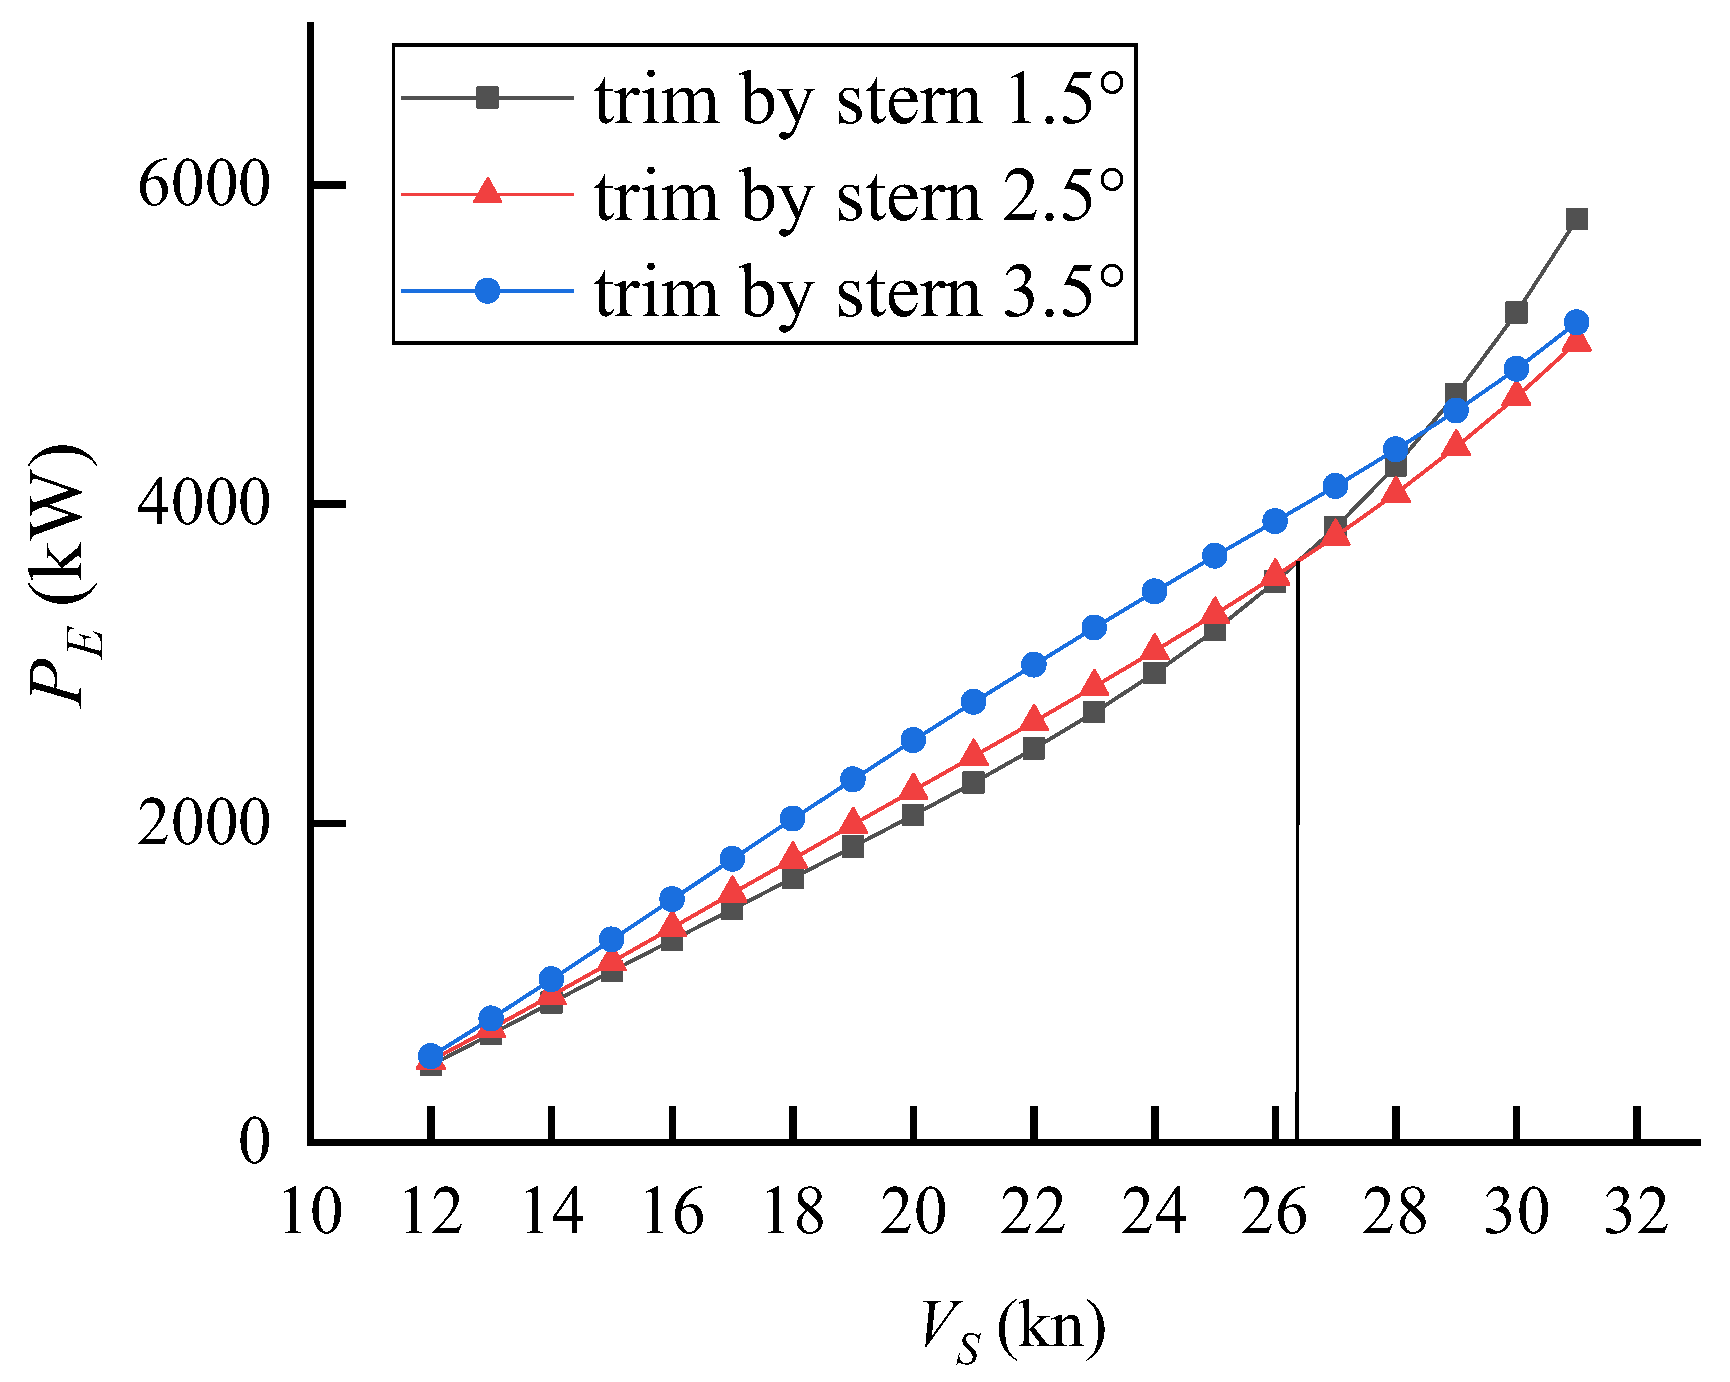
The graphs in Figure 4 and Figure 5 demonstrate a clear trend, where PE is approximately linear with respect to velocity in the range of 12–26 kn. Figure 4 shows the impact of the presence of air compared to its absence and indicates that the presence of air effectively reduces the effective power required to overcome resistance. It is noteworthy to mention that as the value of the horizontal coordinate increases, the interval between the two lines also increases. It is observed that at higher speeds, there is a greater reduction in effective power. Moreover, Figure 5 shows that at a pressure of 50 kPa, from 12–26 kn, the effective power with air increases by increasing the initial stern inclination angles. From 27 kn to 31 kn, the effective power with air in the initial stern inclination of 2.5° is lower than that of 1.5° or 3.5°. As can be seen, at high speeds, a 2.5° stern inclination results in better resistance reduction. Near the velocity of Vs = 30 kn, the resistance of the initial tail tilt of 2.5° is minimal. Based on the calculations derived from the data, the resistance reduction effect is 18.3% in comparison to the condition with no air.
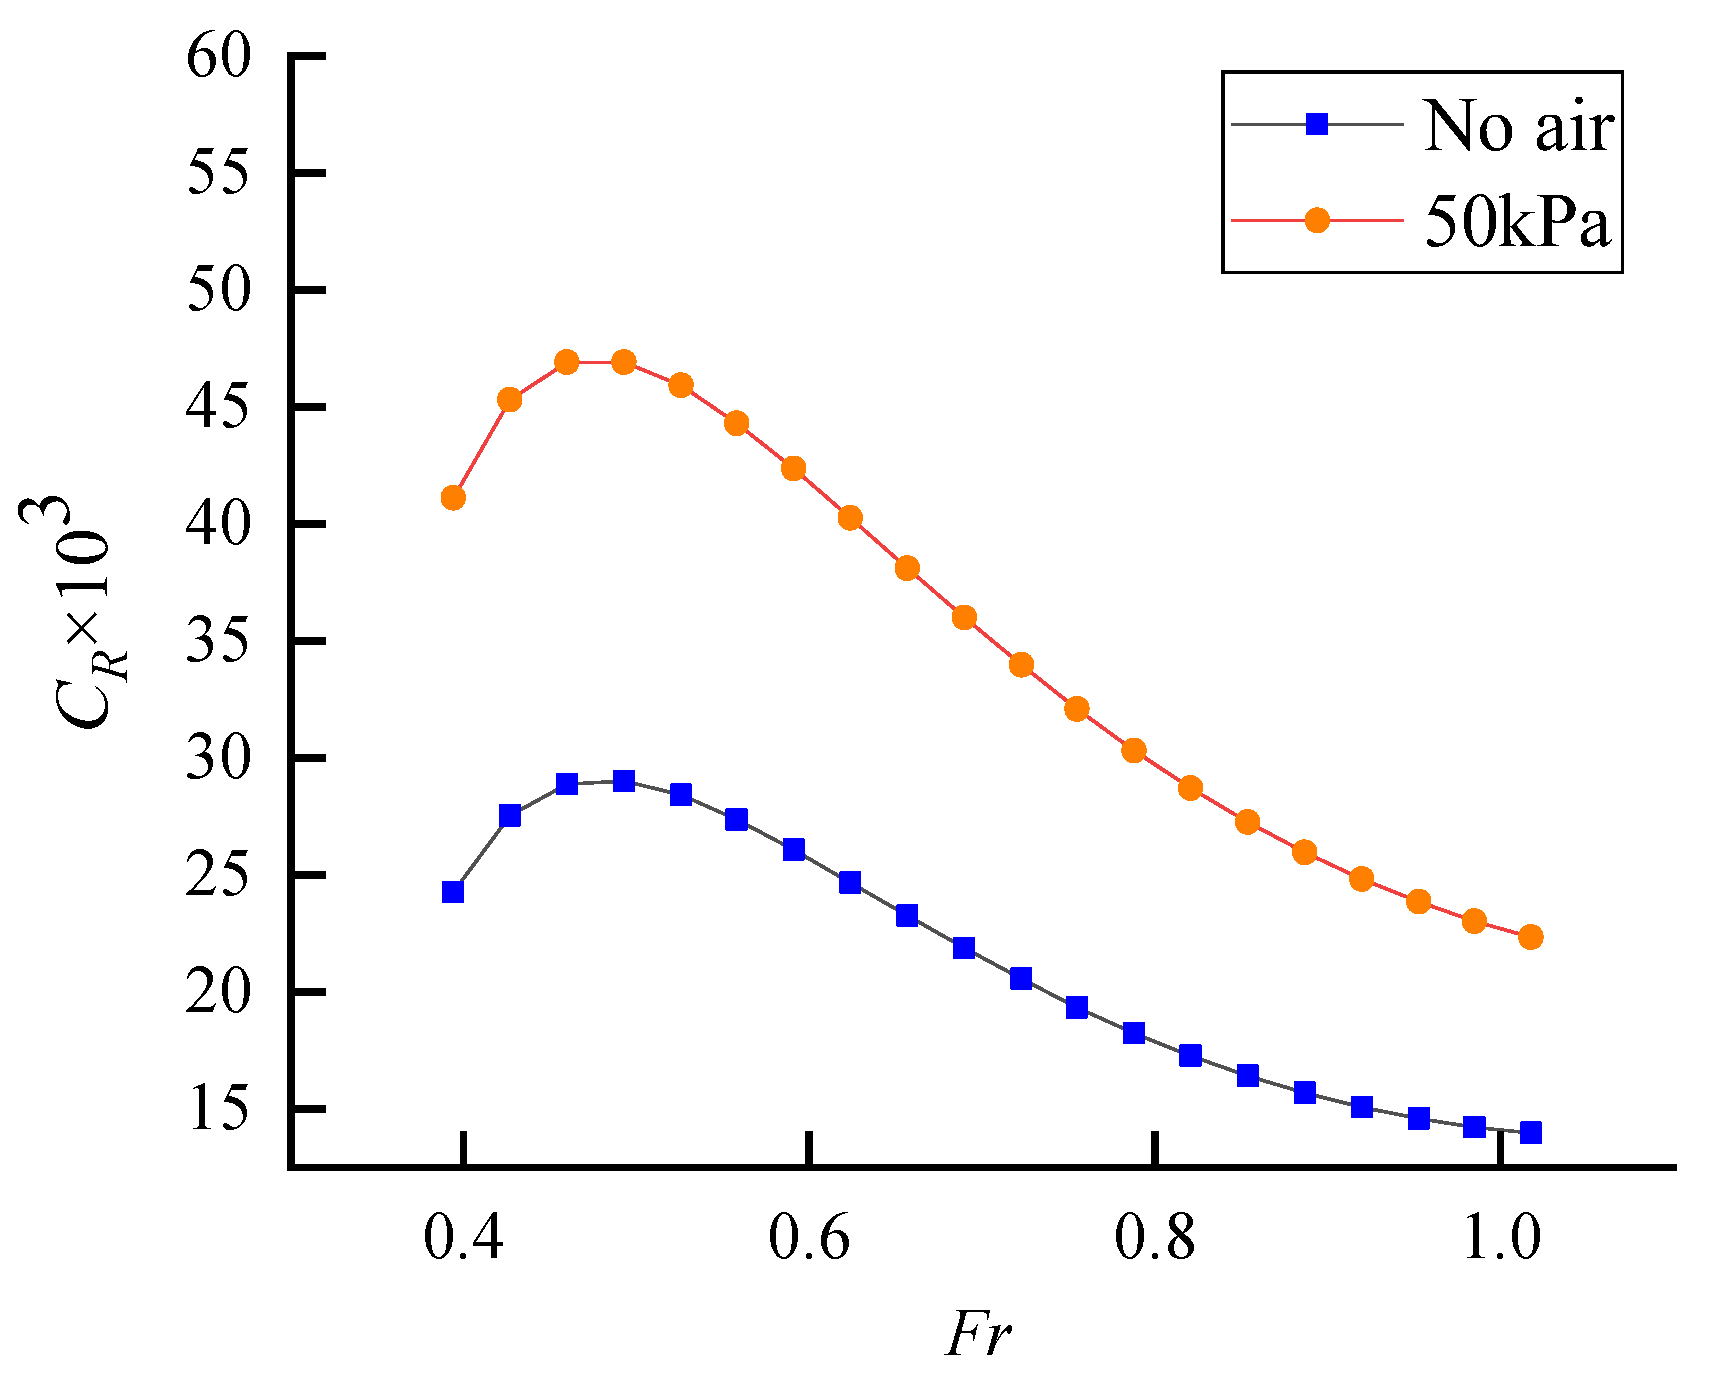
In Figure 6, the residual resistance coefficient in the inflated state appears to be greater than in the noninflated state. This observation can be attributed to the amplified influence of wave-making resistance resulting from inflation, thereby contributing to the overall residual resistance experienced by the vessel. According to Froude’s perspective, a ship’s total resistance comprises both frictional resistance and residual resistance [28]. However, despite the greater residual resistance, the total resistance in the inflated state is actually lower when compared to the noninflated state. Hence, this further underscores the superiority of air lubrication in terms of resistance reduction.
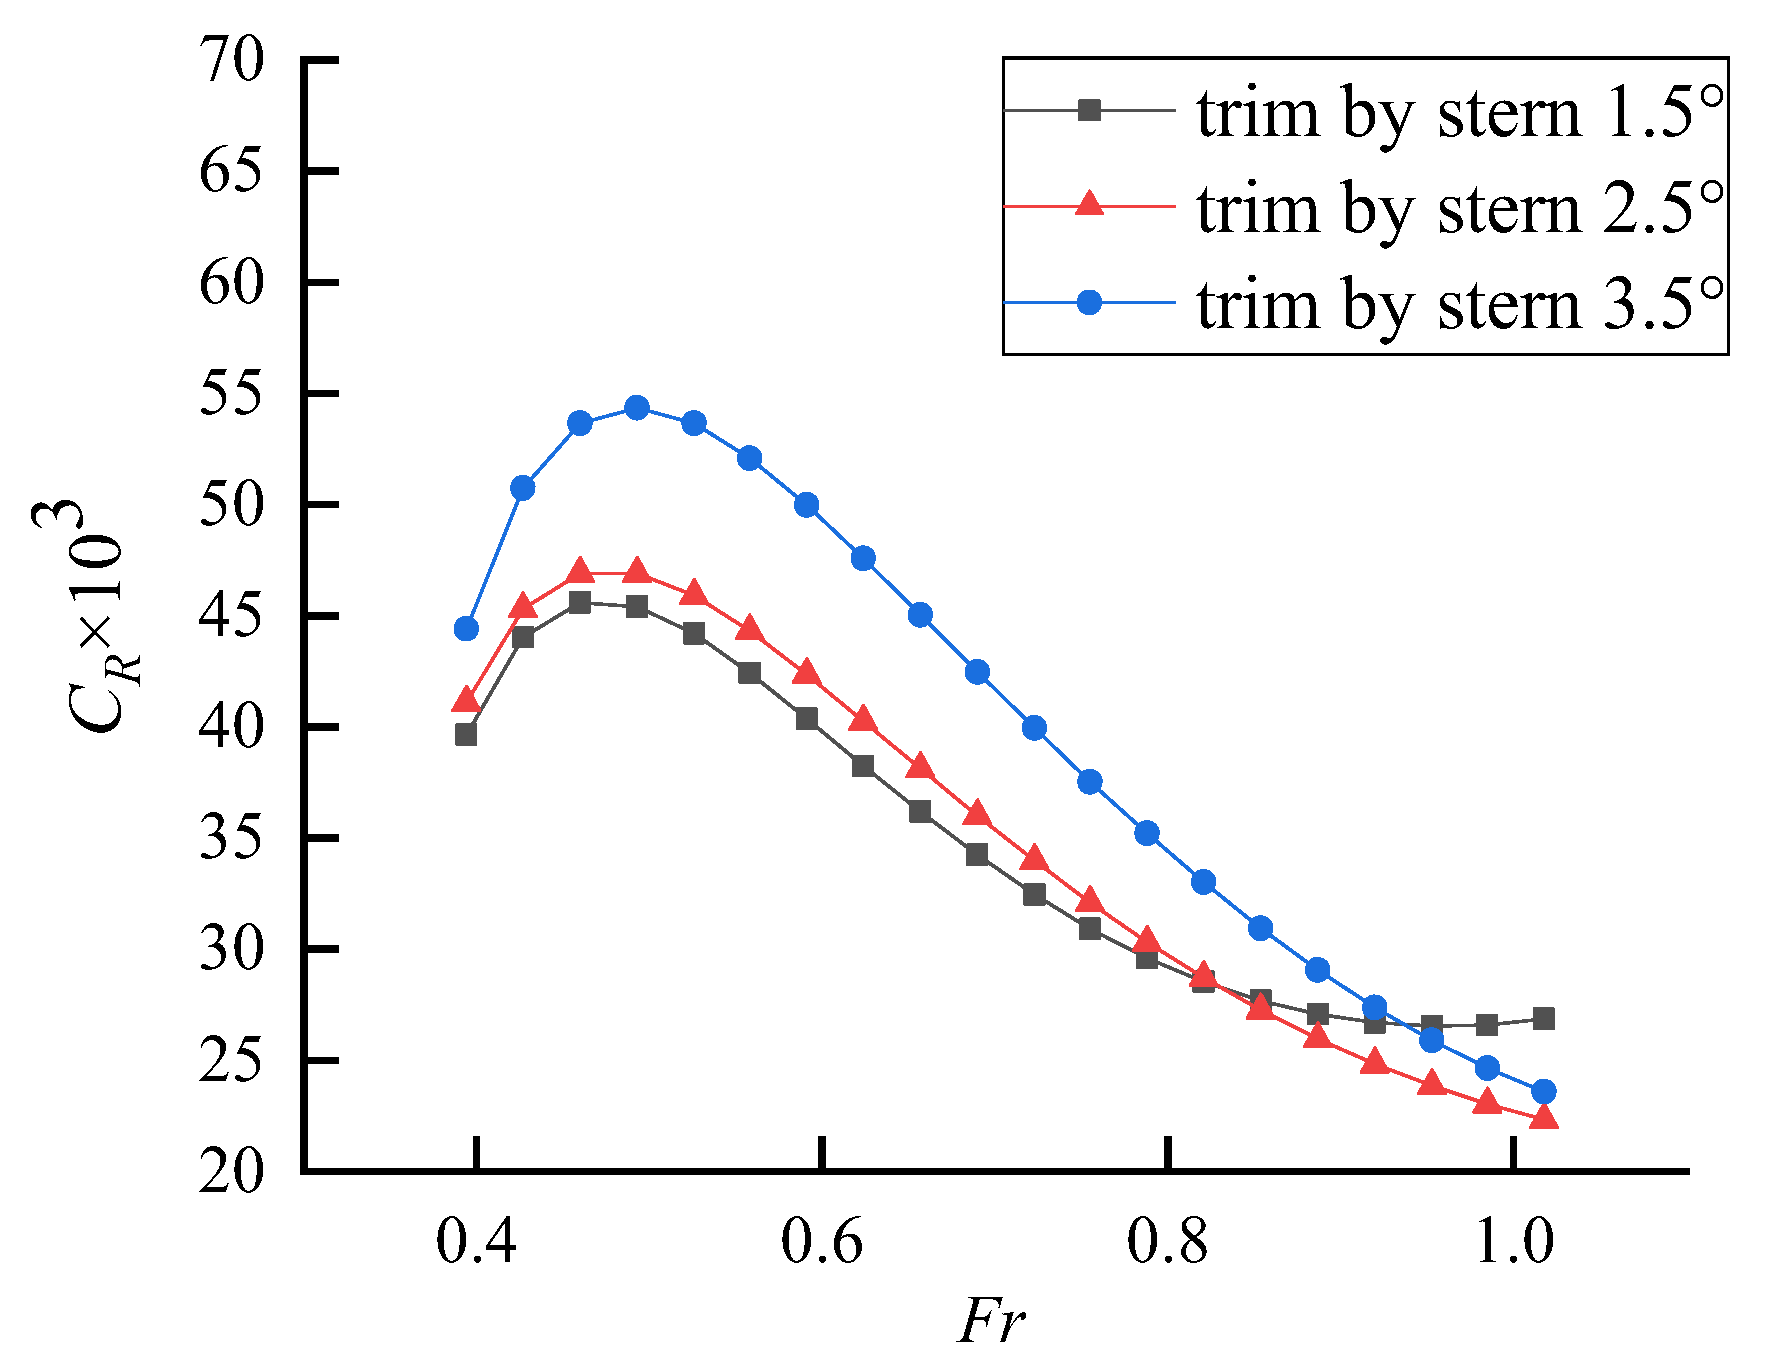
On the other hand, Figure 6 and Figure 7 depict the residual resistance coefficient curves, indicating that the peak occurs around Fr = 0.5, consistent with the trend of the curve measured by Groot and Henschke [29].

4.4. Heave and Pitch Angle during the Test

Conventional displacement-type ships mainly rely on static buoyancy to maintain the stability of the hull, so they generally maintain a positive floating state or a slight stern inclination during navigation.
Small changes in longitudinal inclination will lead to changes in the angle of attack of the incoming flow, wetted area, etc., thus causing changes in resistance components such as residual resistance and viscous resistance and ultimately affecting the total resistance of the craft.
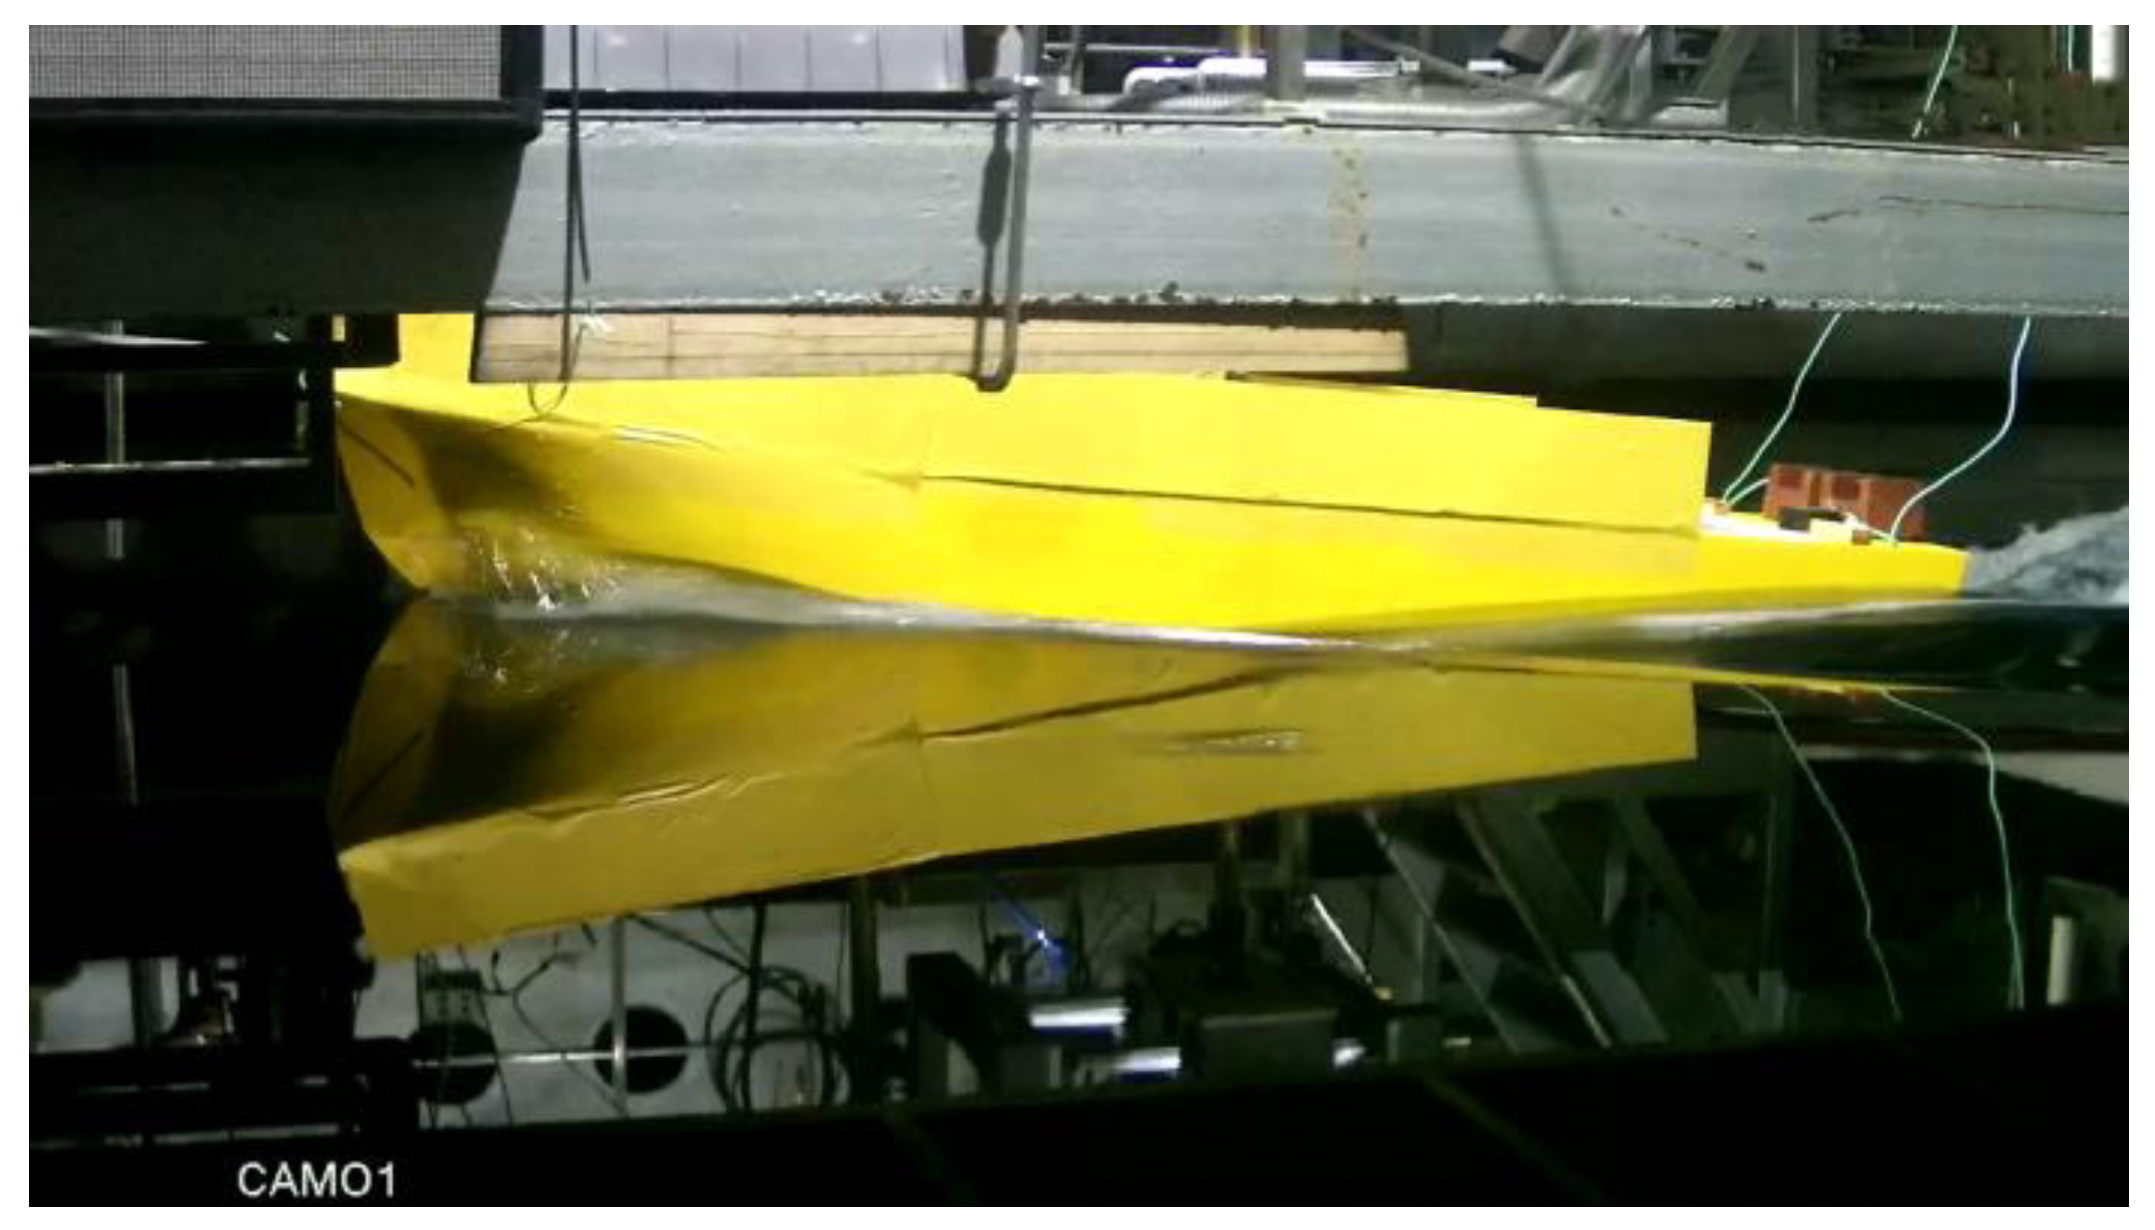
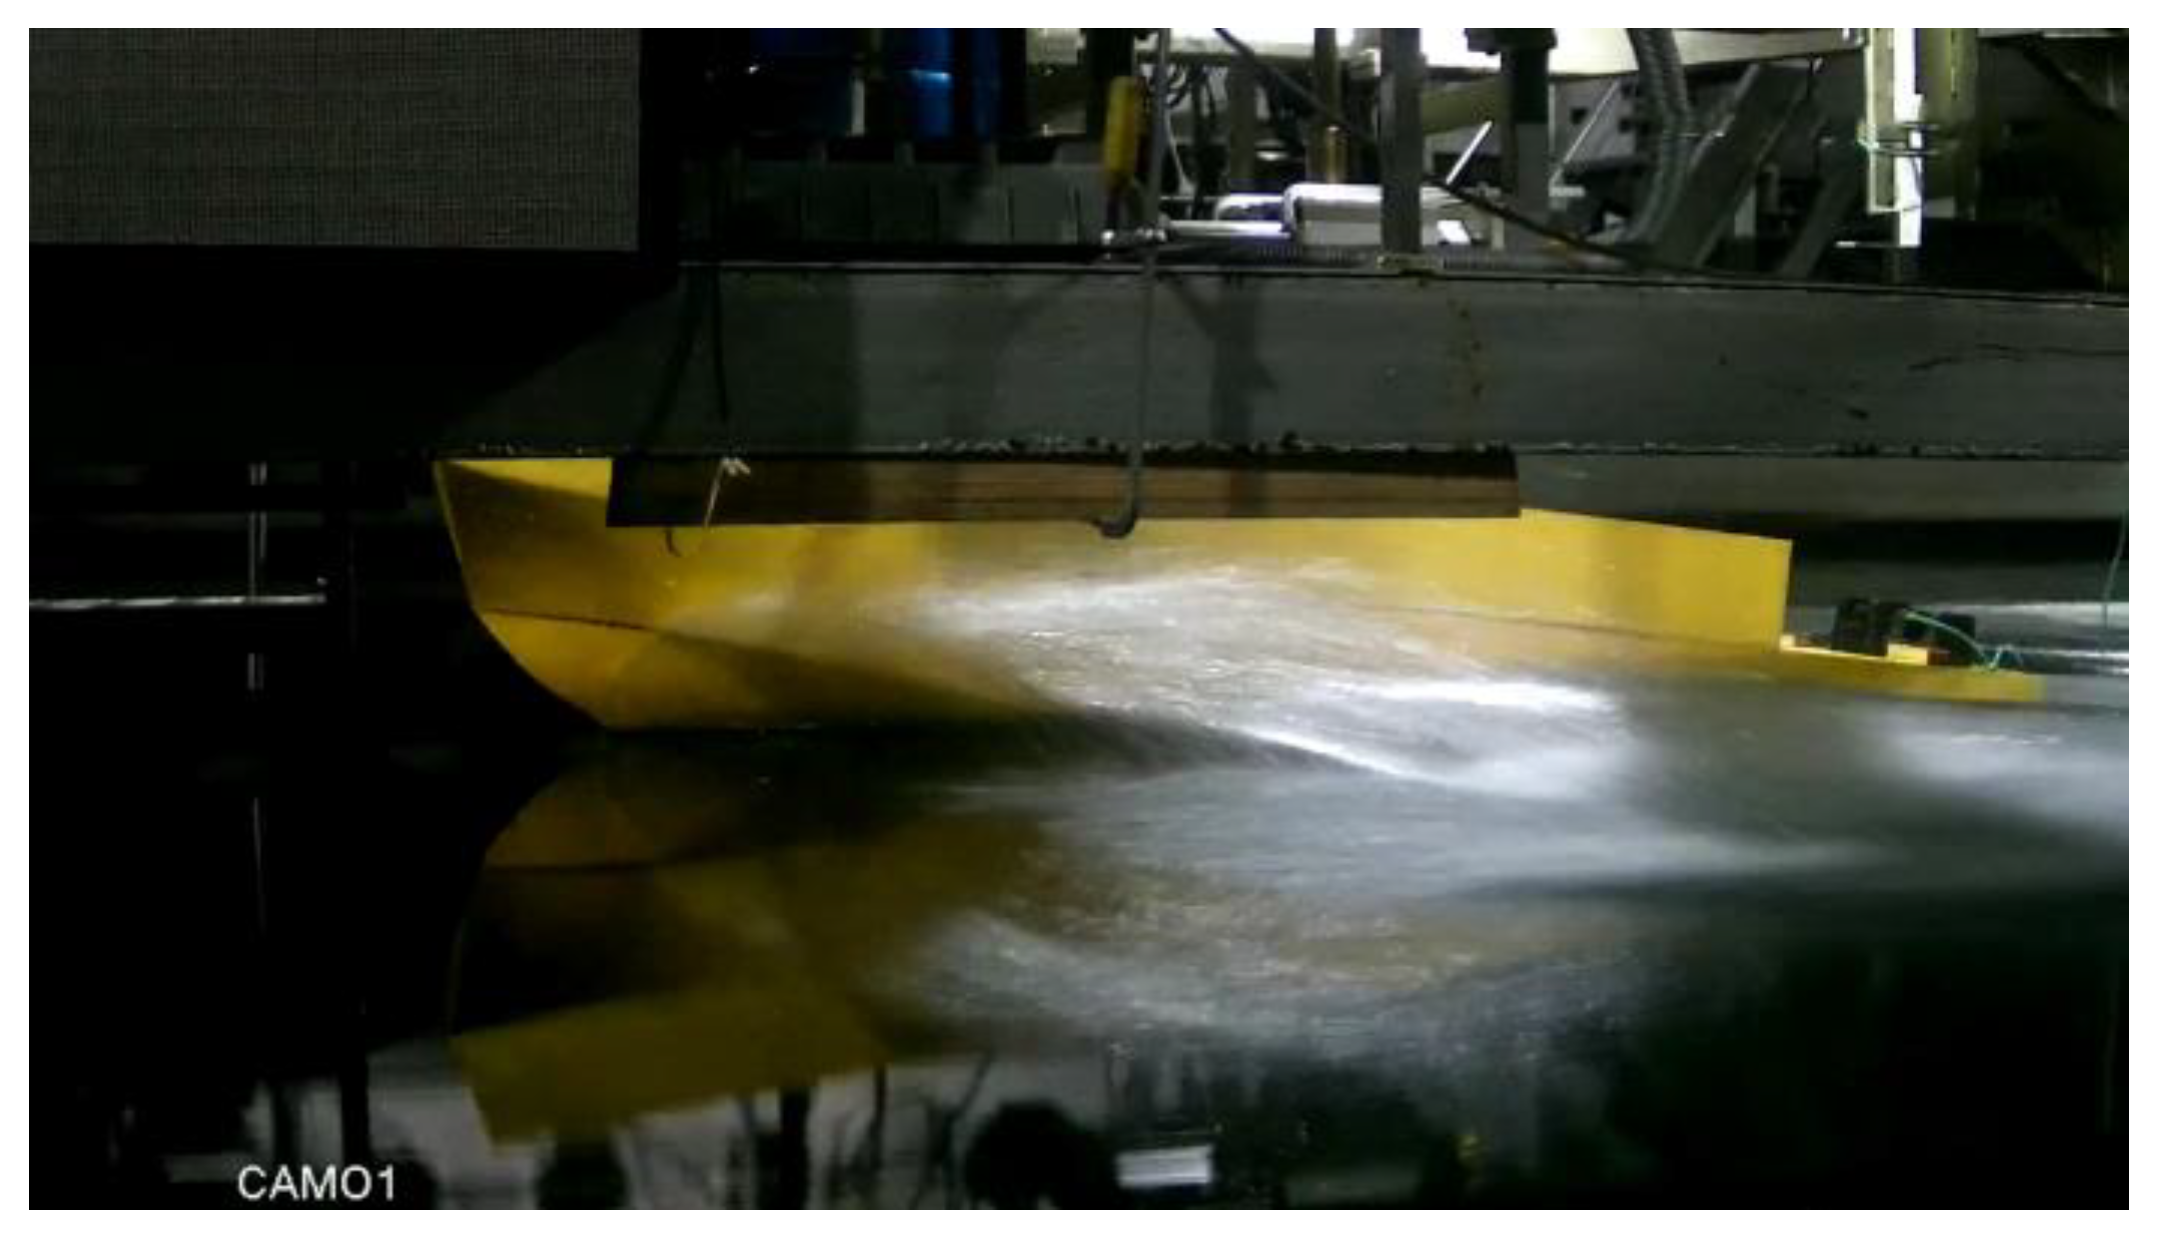
Figure 8 and Figure 9 illustrate the test waveforms, depicting the experimental results for two distinct velocities, 12.4 kn and 30.9 kn, respectively. It is observed that as the velocity of the vessel increases, the water splash on the bow becomes more prominent and forceful.
During the testing phase, the model was subjected to three different trim states of 1.5°, 2.5°, and 3.5° by adjusting the load conditions. The resistance values were compared across the range of design speeds, and the corresponding results are tabulated below for further analysis, as shown in Table 4.
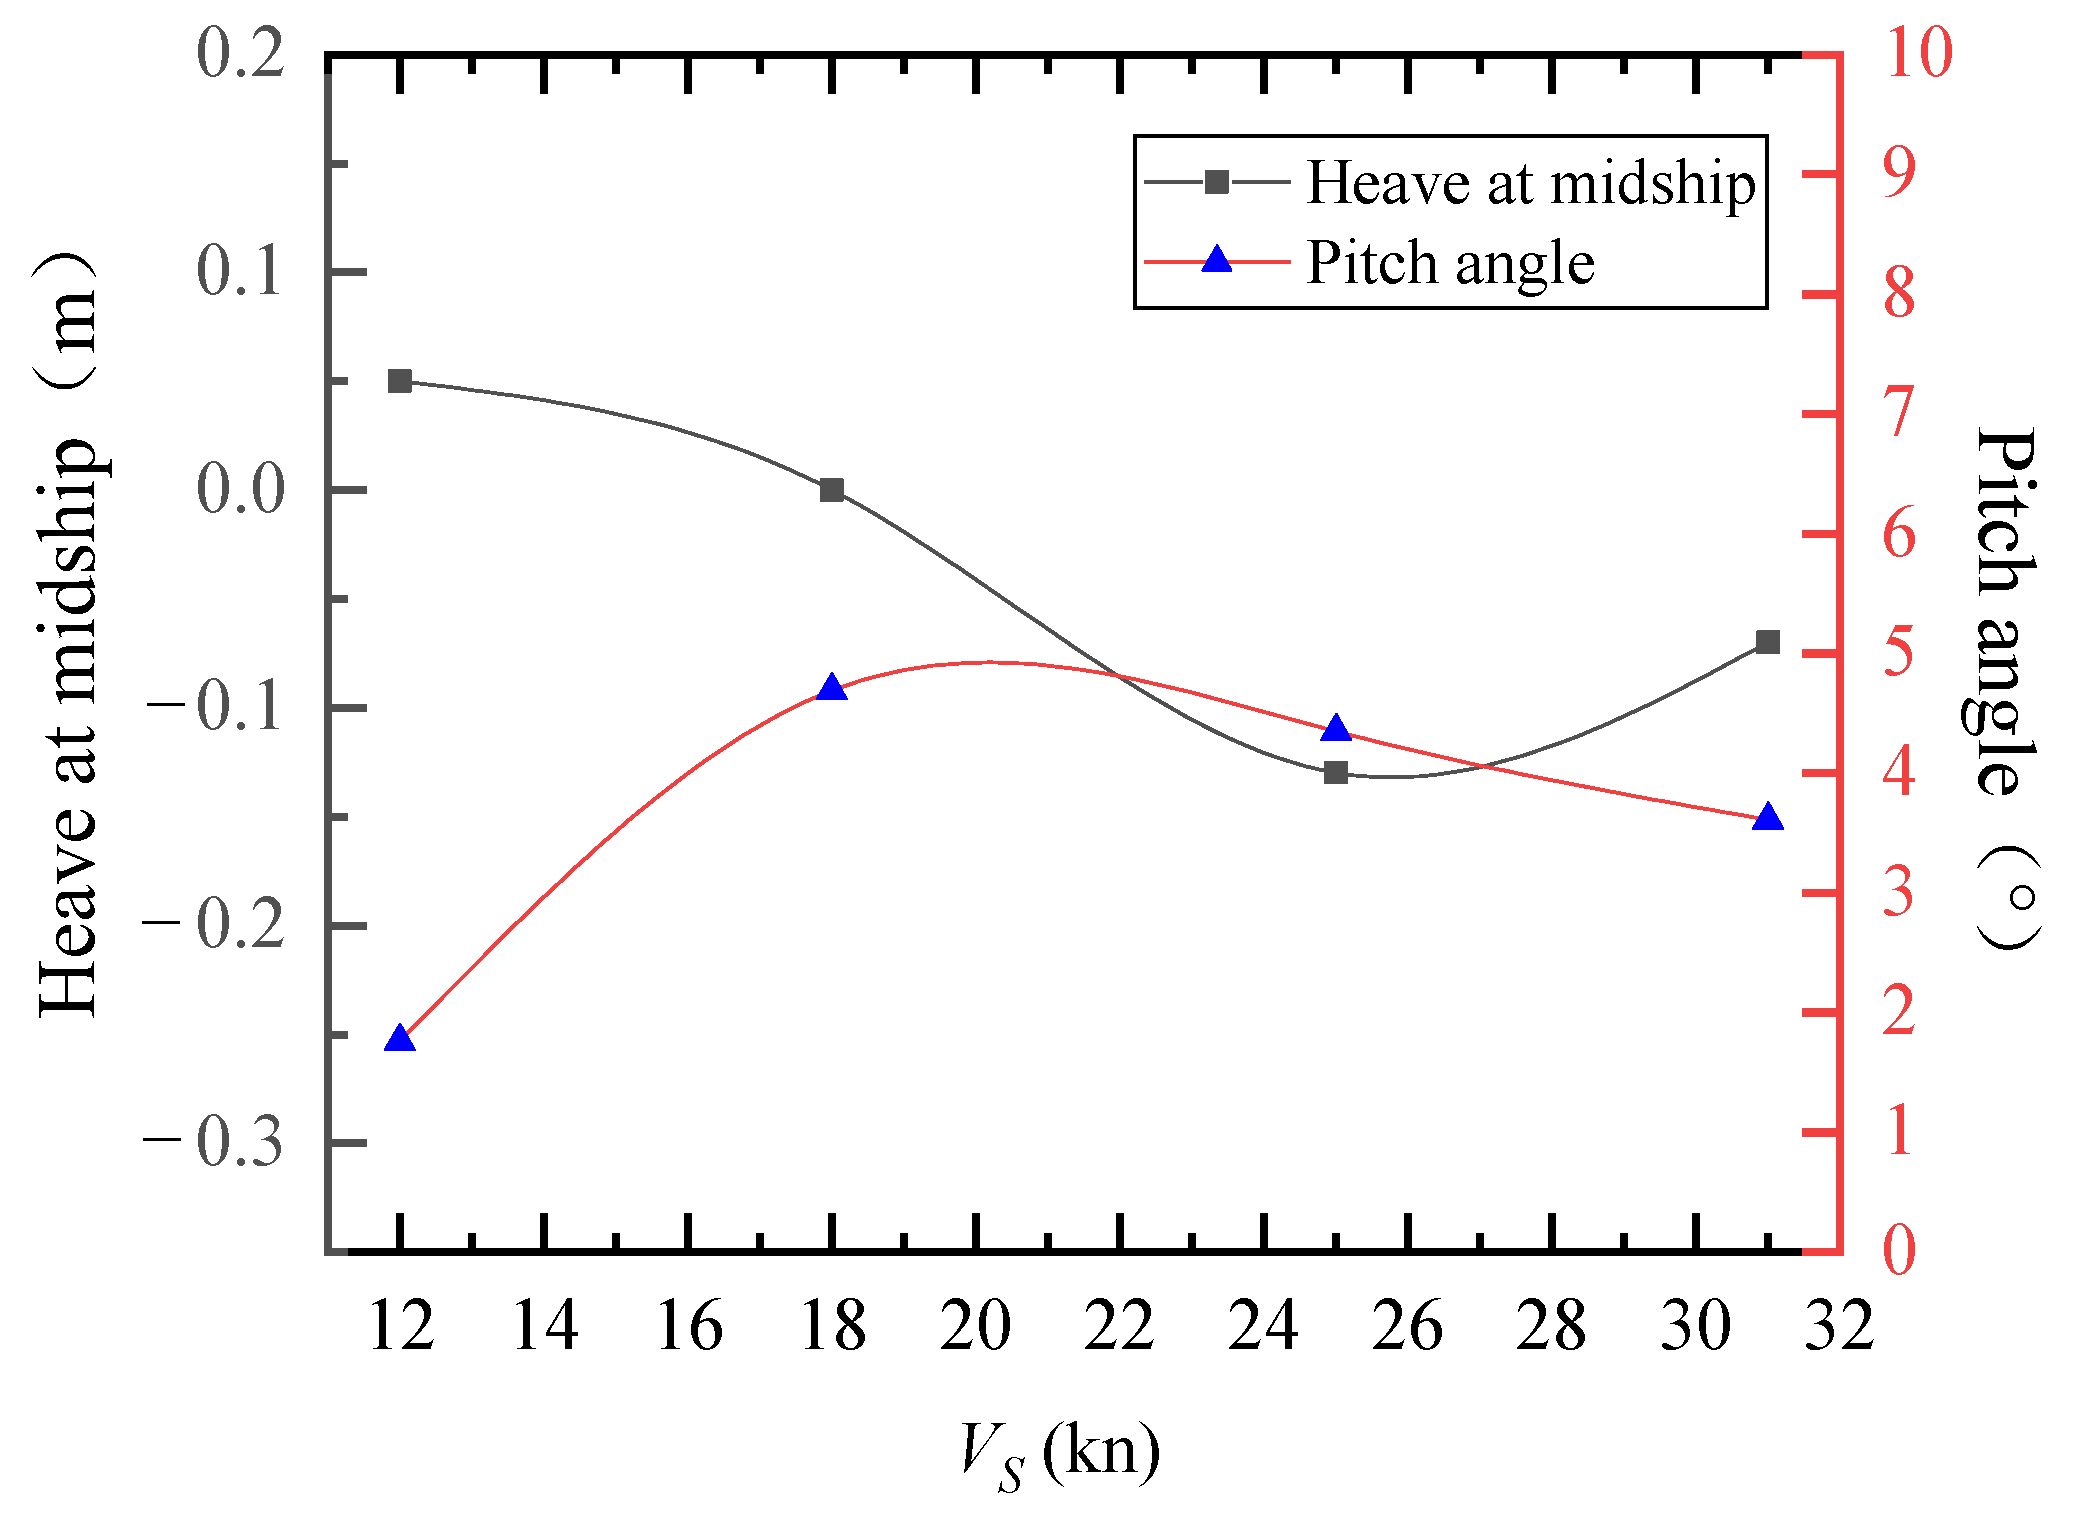
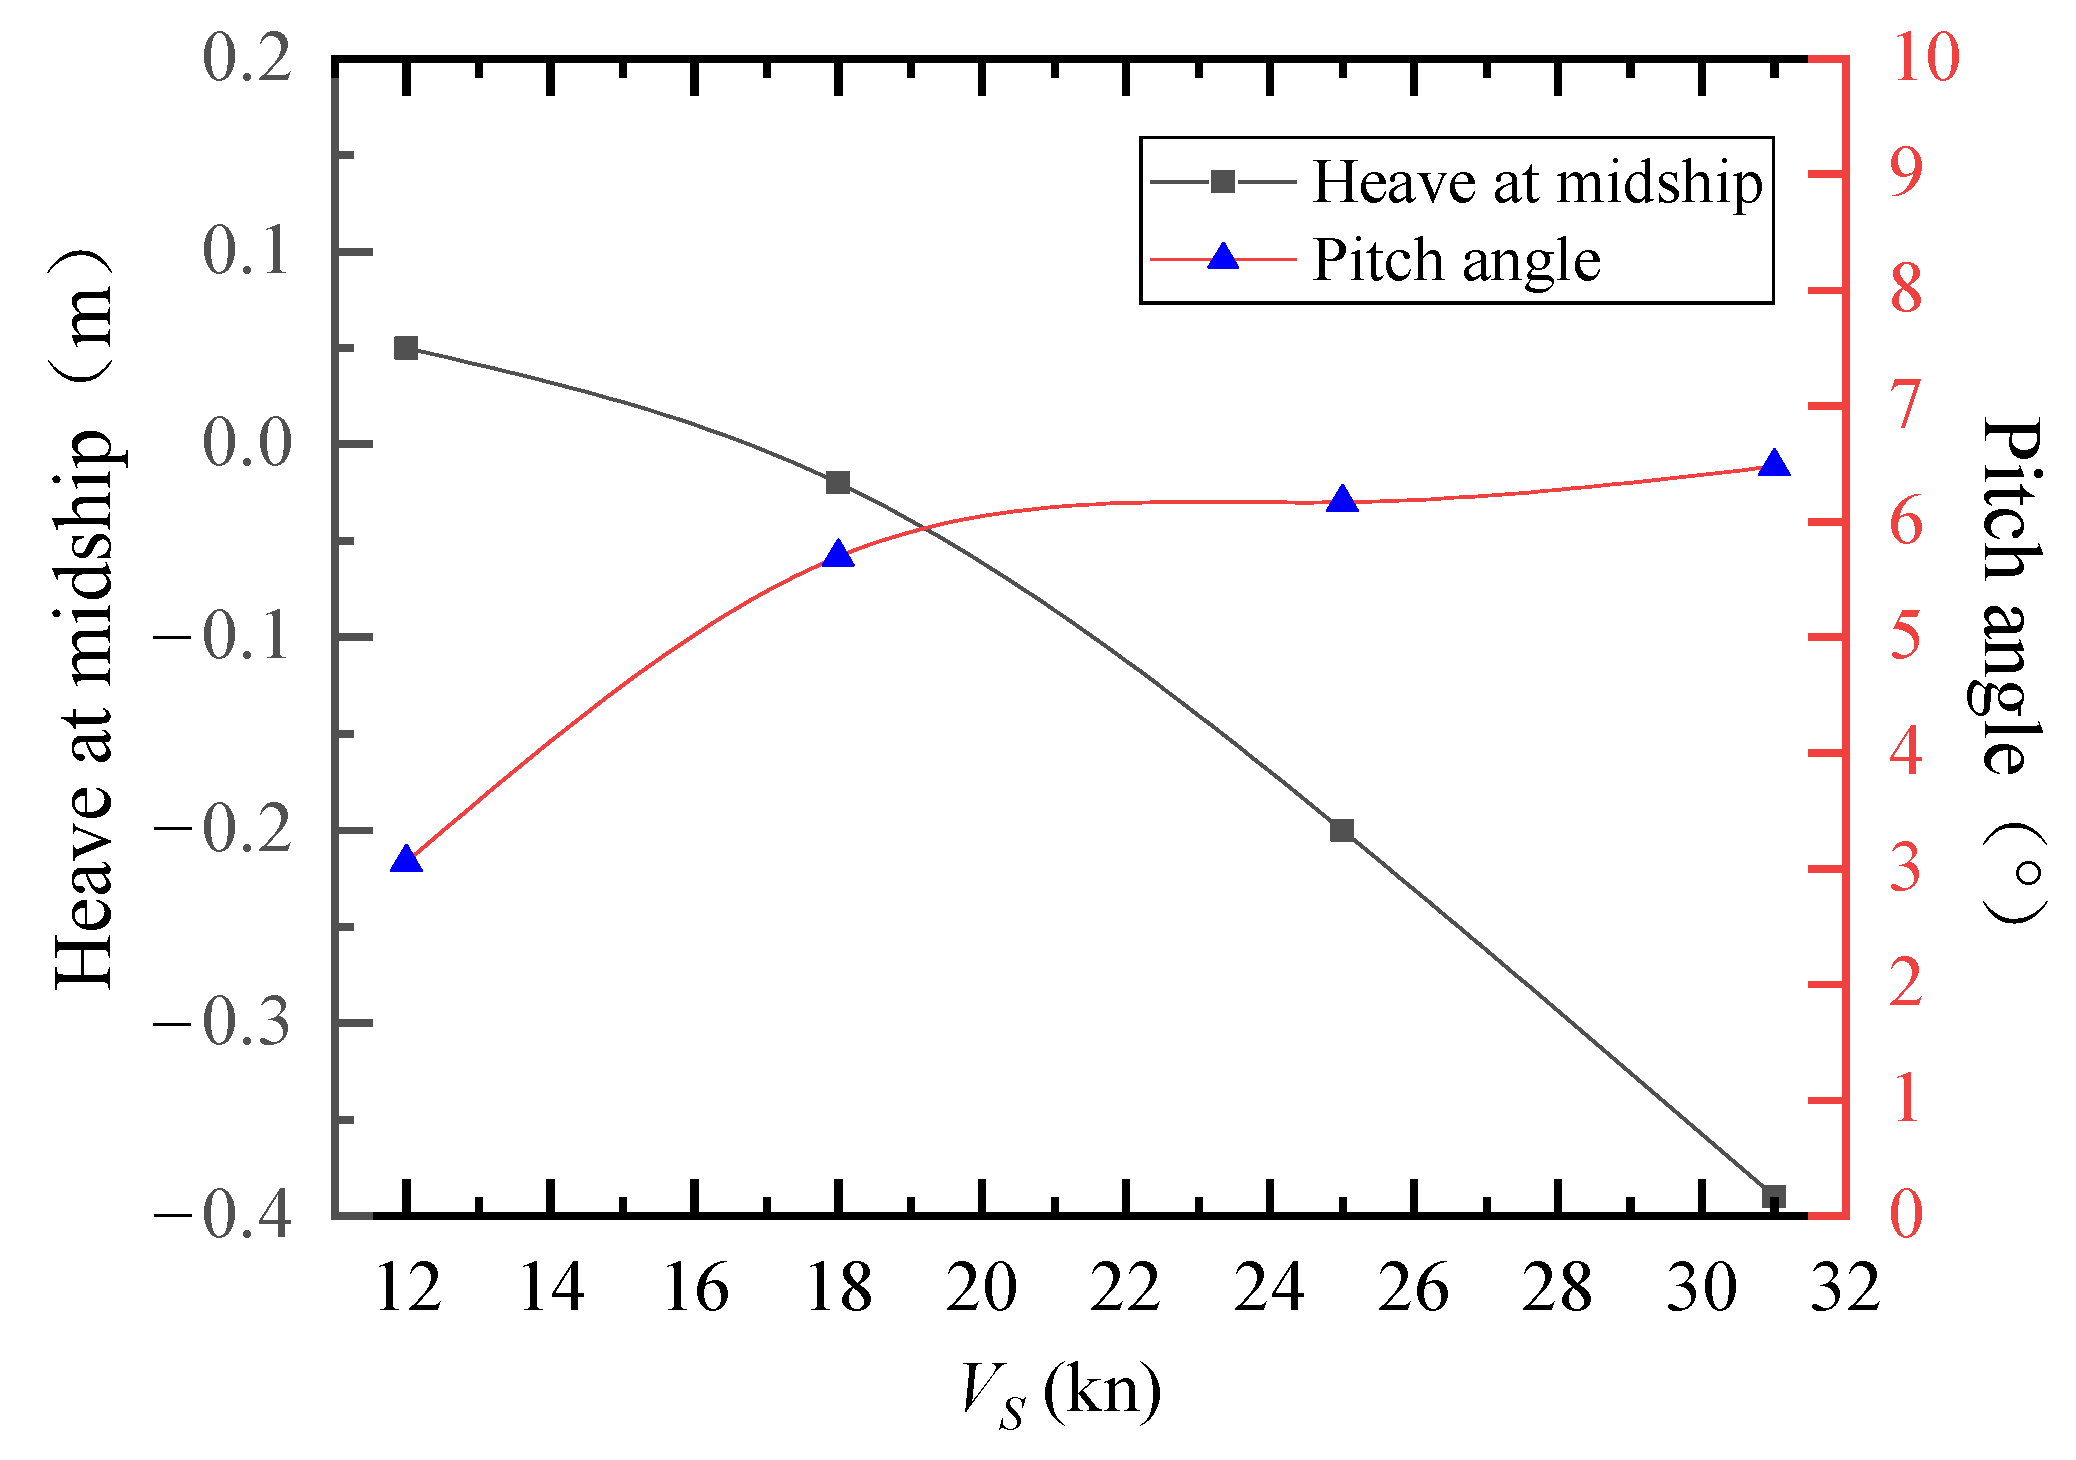
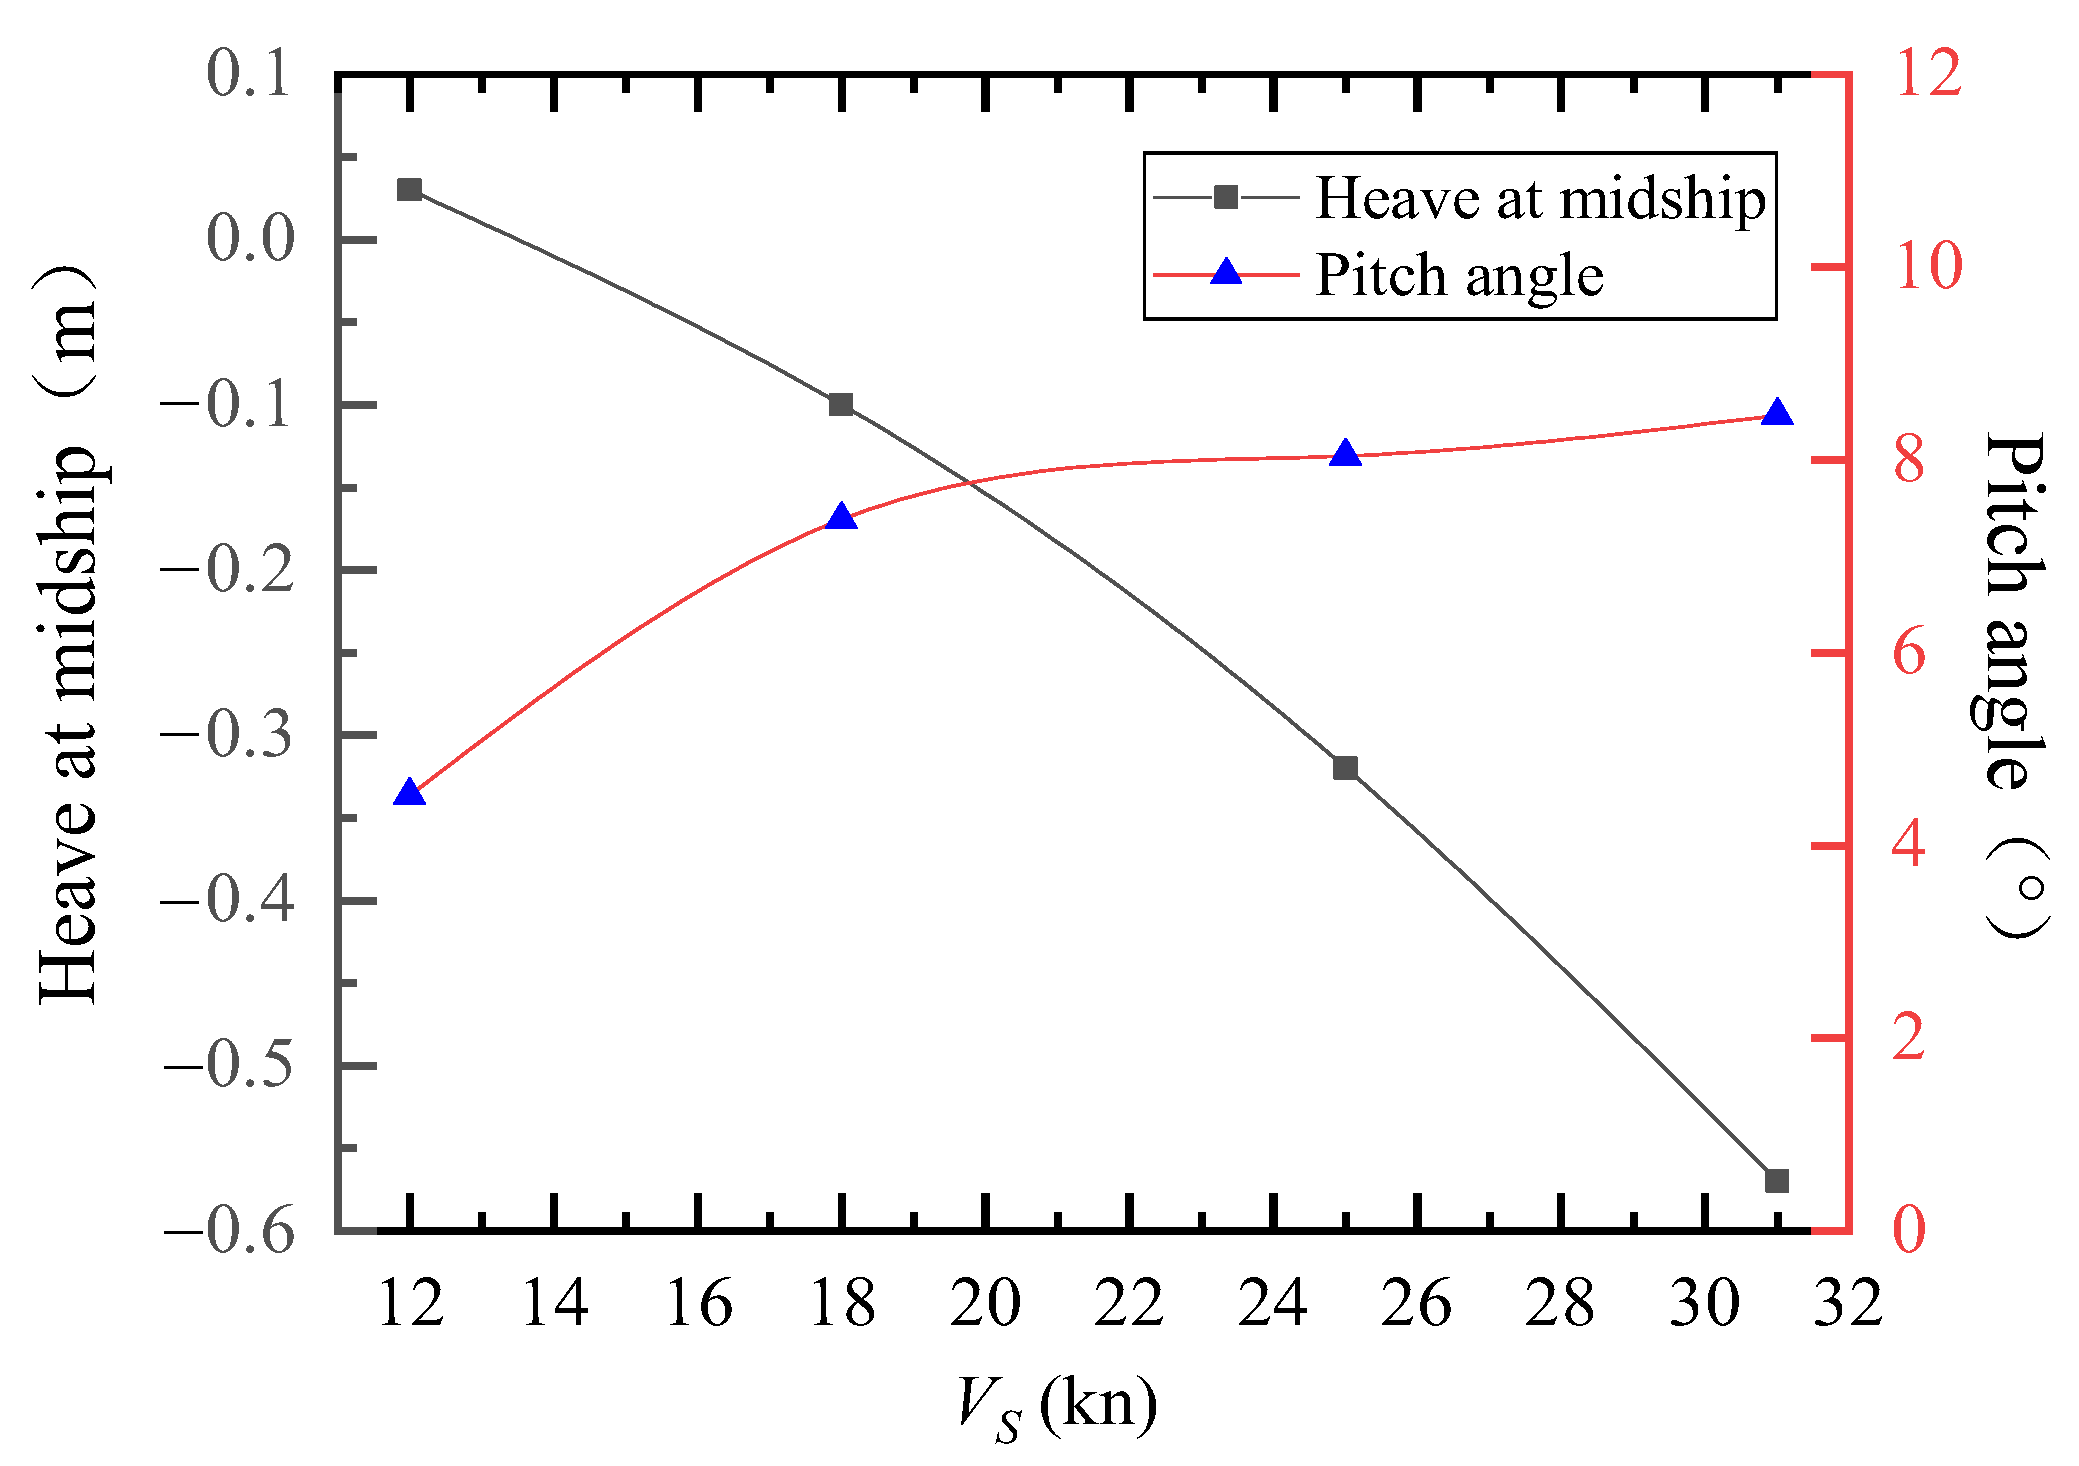
At the design speed, the test results indicate that the model exhibited the lowest resistance at a stern inclination of 2.5°, with a value of 298.11 N. As shown in Figure 10, Figure 11, Figure 12 and Figure 13, the relationship between the resistance and the longitudinal inclination of the model can be expressed as follows:
  • When the longitudinal inclination is inadequate, the air does not exert a considerable lifting effect on the model. The high-speed air cavity craft does not attain the gliding state during operation and remains in the phase of ascending resistance peak, thus failing to achieve the optimal resistance reduction effect;
  • Excessive longitudinal inclination leads to the lifting of the hull, gradual reduction of the wetted length, and a constant backward shift of the center of dynamic pressure at the bottom. Such an inclination results in poor stability of the ship at high speeds, and a significant change in sailing lift that causes higher splash and more severe waves within the amidships range of −0.4 to 0.05 m. This, in turn, leads to an increase in wave-making resistance and the growing contribution of splash resistance to the residual resistance, thus impairing the reduction of resistance.

4.5. Resistance Reduction Effect Analysis

As a result of the presence of an air layer at the bottom of the model and an increase in the bottom inclination of the bow glide surface, both the frictional resistance and acceleration of the motion are significantly reduced. Consequently, the resistance and seakeeping performance of the ship are enhanced.
At the same time, the introduction of air creates a cavity, which leads to a decrease in the wetted area, along with a reduction in the density and turbulence of the gas–liquid two-phase mixture, resulting in a decrease in resistance.
The high-speed air cavity craft at different speeds is in different sailing states, which have different Froude numbers. As its bottom longitudinal pressure distribution is different at different speeds, the sailing state will also change significantly with the speed during the sailing process. As the speed of the vessel increases, the hull is lifted, causing the longitudinal inclination angle, wet surface area, and wetting length to vary with speed.
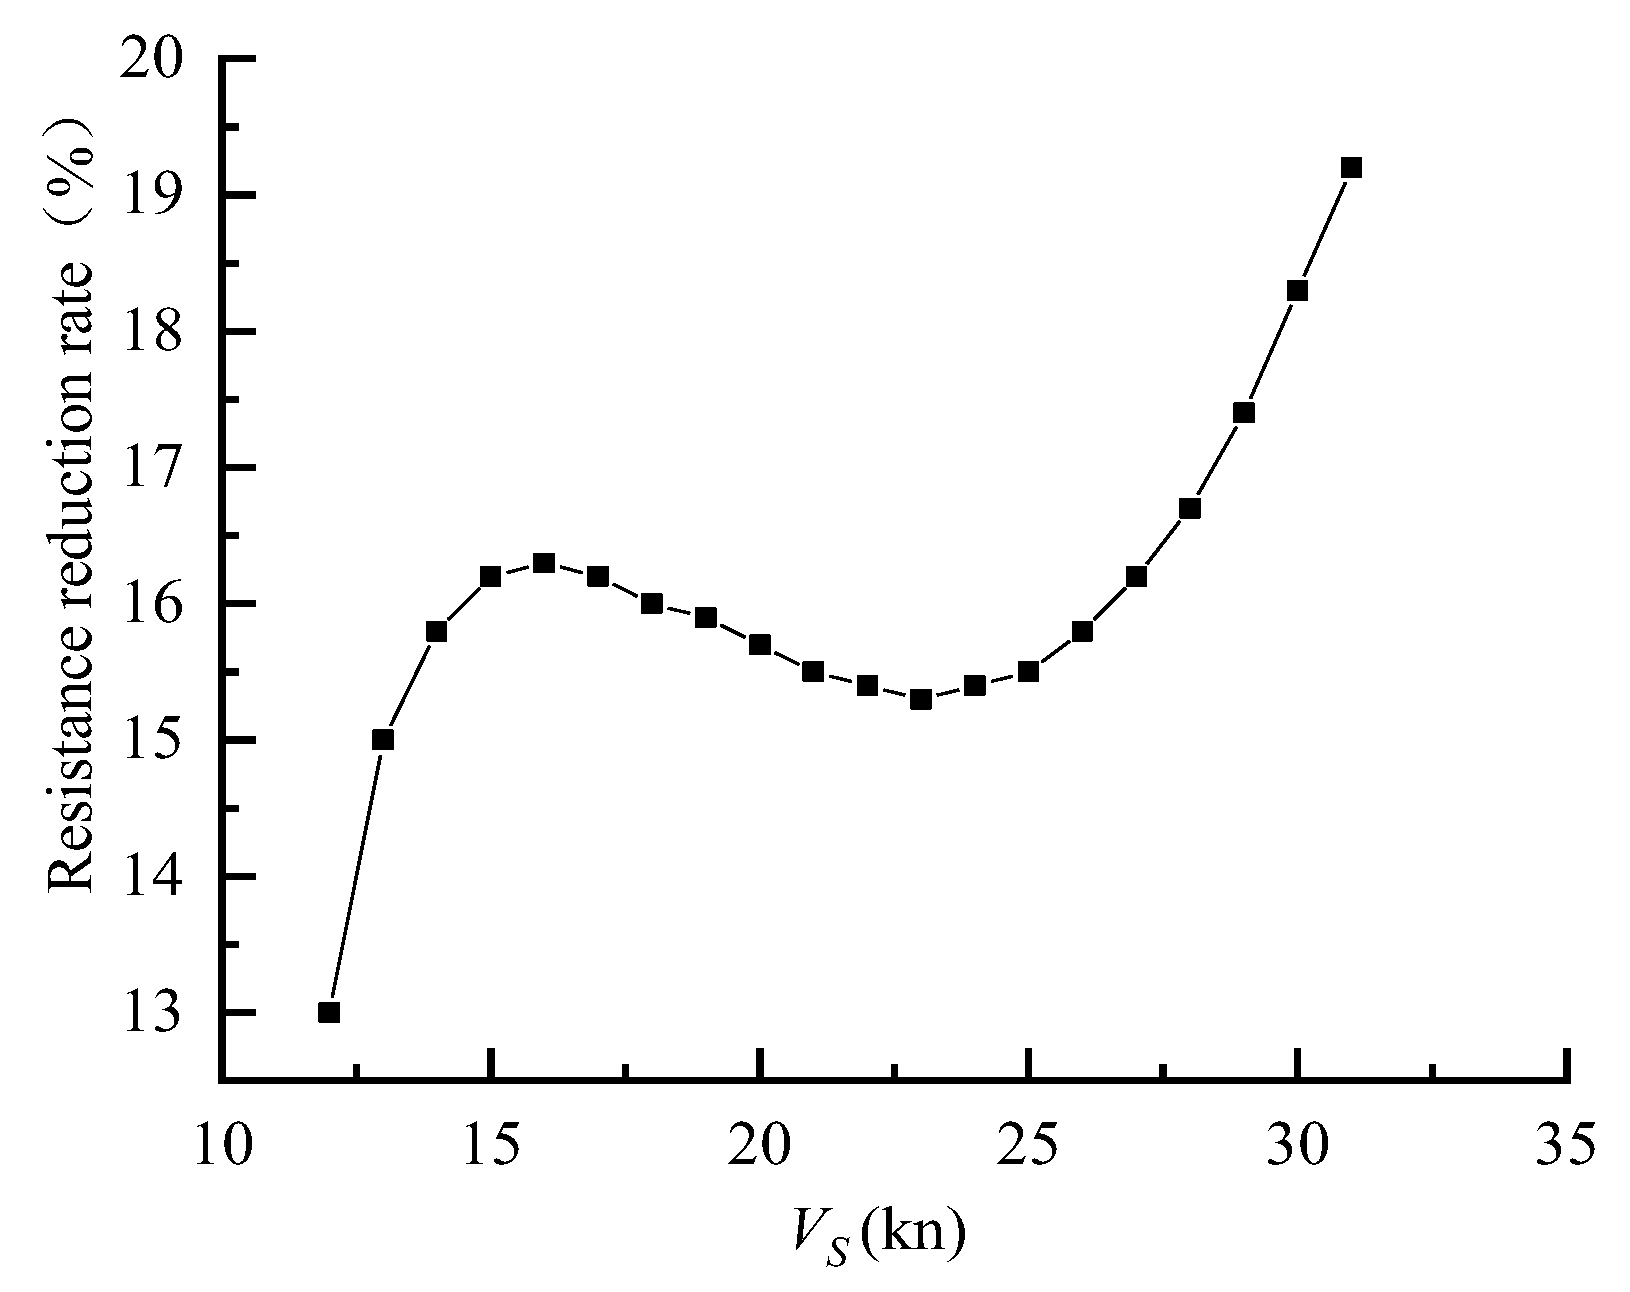
As depicted in Figure 14, it is evident that the resistance reduction effect varies with the increase in speed. Specifically, the resistance reduction effect experiences a slight decrease between the speeds of 15 and 25 kn. However, after reaching 25 kn, the rate of resistance reduction effect increases substantially, reaching a maximum of 19.2% at 31 kn. Notably, when the vessel reaches the design speed of 30 kn, the resistance reduction effect is 18.3% compared to the absence of air injection.

5. Summary

(1)
In order to achieve a more effective reduction in resistance, the high-speed air cavity craft should select an appropriate initial stern inclination angle, and if feasible, the angle should vary with speed;
(2)
The influence of air pressure on model resistance is significant. As the air pressure increases, the resistance value gradually decreases until it reaches the optimal air pressure, after which the resistance remains relatively stable;
(3)
At the displacement state of a real ship of 125 t and a chamber pressure of 50 kPa, the resistance of the initial stern inclination of 2.5° is observed to be at its minimum near the design speed of Vs = 30 kn. Comparatively, the reduction effect is estimated to be 18.3% when compared to the state without air injection;
(4)
Before the formal test, a preliminary test was conducted to evaluate the test conditions, check the scientific feasibility of the experimental design, and accurately control the relevant variables, laying a foundation for the formal test. The pretest is crucial in preventing the inefficient use of manpower, materials, and financial resources resulting from poorly designed or blindly conducted tests. By reducing costs and saving time, the pretest plays a positive role in enhancing the efficiency and effectiveness of the overall testing process.
This study focuses on the air cavity craft model. However, due to the presence of cavities in the model, the resistance will be expected to be different compared to the same type of cavity-free one. Hence, future work will focus on the comparative validation of the cavity model with the conventional one without cavities to assess its applicability for industrial implementation.
Furthermore, it is important to acknowledge that the model tests have inherent limitations. There are some differences in drag between the self-propulsion of the ship and the experimental towing situation in real engineering, and vibration, noise, and cavitation are also important influencing factors to be explored. The above provides a reference for related research and offers ideas and directions for similar studies.

Author Contributions

The manuscript was written by L.S. and Z.W.; all authors discussed the original idea; conceptualization, L.S. and Y.Y.; methodology, L.S.; formal analysis, L.S. and Z.W.; investigation, S.W.; resources, J.Y.; data curation, S.W.; writing—original draft preparation, L.S.; writing—review and editing, L.S., J.Y., Y.Y. and R.G.; visualization, Z.W.; supervision, J.Y.; project administration, J.Y.; funding acquisition, J.Y. All authors have read and agreed to the published version of the manuscript.

Funding

This work was supported by the National Natural Science Foundation of China (52071234), the Tianjin Science and Technology Plan Project (22JCYBJC00650), and the Project of the Ministry of Industry and Information Technology (MC-201917-C09).

Institutional Review Board Statement

Not applicable.

Informed Consent Statement

Not applicable.

Data Availability Statement

Data available from the authors, upon reasonable request.

Conflicts of Interest

The authors declare no conflict of interest.

Appendix A

Figure A1. The lines plan.
Jmse 11 01256 g0a1

References

  1. Pavlov, G.A.; Yun, L.; Bliault, A.; He, S.-L. Air Cavity Ship Concept Evaluation. In Air Lubricated and Air Cavity Ships: Development, Design, and Application; Pavlov, G.A., Yun, L., Bliault, A., He, S.-L., Eds.; Springer: New York, NY, USA, 2020; pp. 179–229. [Google Scholar]
  2. Mäkiharju, S.A.; Perlin, M.; Ceccio, S.L. On the energy economics of air lubrication drag reduction. Int. J. Nav. Archit. Ocean Eng. 2012, 4, 412–422. [Google Scholar] [CrossRef] [Green Version]
  3. Yun, L.; Bliault, A. Theory and Design of Air Cushion Craft; Hodder Headline: London, UK; Elsevier: Amsterdam, The Netherlands, 2000. [Google Scholar]
  4. An, H.; Pan, H.; Yang, P. Research Progress of Air Lubrication Drag Reduction Technology for Ships. Fluids 2022, 7, 319. [Google Scholar] [CrossRef]
  5. Kim, H.; Park, S. Coupled Level-Set and Volume of Fluid (CLSVOF) Solver for Air Lubrication Method of a Flat Plate. J. Mar. Sci. Eng. 2021, 9, 231. [Google Scholar] [CrossRef]
  6. Dong, W.; Liu, Z.; Ou, Y.; Guo, R. Experimental study on the hull form of high-speed air cavity craft. In Proceedings of the 9th International Conference on Fast Sea Transportation, FAST 2007, Shanghai, China, 23–27 September 2007; pp. 265–270. [Google Scholar]
  7. Tanaka, T.; Oishi, Y.; Park, H.J.; Tasaka, Y.; Murai, Y.; Kawakita, C. Frictional drag reduction caused by bubble injection in a turbulent boundary layer beneath a 36-m-long flat-bottom model ship. Ocean Eng. 2022, 252, 111224. [Google Scholar] [CrossRef]
  8. Li, Z.; Zhang, X.-S.; Wan, D.-C. Research progress on the hydrodynamic performance of water-air-bubble mixed flows around a ship. J. Hydrodyn. 2022, 34, 171–188. [Google Scholar] [CrossRef]
  9. Sayyaadi, H.; Nematollahi, M. Determination of optimum injection flow rate to achieve maximum micro bubble drag reduction in ships; an experimental approach. Sci. Iran. 2013, 20, 535–541. [Google Scholar] [CrossRef]
  10. Sun, T.; Zhang, X.; Zhang, J.; Wang, C. Experimental Study on the Unsteady Natural Cloud Cavities: Influence of Cavitation Number on Cavity Evolution and Pressure Pulsations. J. Mar. Sci. Eng. 2021, 9, 487. [Google Scholar] [CrossRef]
  11. Wu, H.; Wu, W.; Chen, K. Review of Research on Air Bubble Drag Reduction on Ships. Shipbuild. China 2019, 60, 212–227. [Google Scholar]
  12. Gokcay, S.; Insel, M.; Odabasi, A.Y. Revisiting artificial air cavity concept for high speed craft. Ocean Eng. 2004, 31, 253–267. [Google Scholar] [CrossRef]
  13. Matveev, K.I.; Burnett, T.J.; Ockfen, A.E. Study of air-ventilated cavity under model hull on water surface. Ocean Eng. 2009, 36, 930–940. [Google Scholar] [CrossRef]
  14. Matveev, K.I.; Miller, M.J. Air cavity with variable length under a model hull. Proc. Inst. Mech. Eng. Part M J. Eng. Marit. Environ. 2011, 225, 161–169. [Google Scholar] [CrossRef]
  15. Matveev, K.I. Transom effect on the properties of an air cavity under a flat-bottom hull. Ships Offshore Struct. 2012, 7, 143–149. [Google Scholar] [CrossRef]
  16. Matveev, K.I. Hydrodynamic modeling of semi-planing hulls with air cavities. Int. J. Nav. Archit. Ocean Eng. 2015, 7, 500–508. [Google Scholar] [CrossRef] [Green Version]
  17. Matveev, K.I. Simplified model for unsteady air cavities under ship hulls. Proc. Inst. Mech. Eng. Part M J. Eng. Marit. Environ. 2019, 234, 100–107. [Google Scholar] [CrossRef]
  18. Collins, J.M.; Matveev, K.I. Investigation of influence of compact actuators on air cavity in water flow under recessed hull. Proc. Inst. Mech. Eng. Part M J. Eng. Marit. Environ. 2020, 235, 421–431. [Google Scholar] [CrossRef]
  19. Matveev, K.I. Numerical simulation of air cavity under a simplified model-scale hull form. J. Ocean. Eng. Sci. 2020, 5, 68–72. [Google Scholar] [CrossRef]
  20. Cucinotta, F.; Guglielmino, E.; Sfravara, F. An experimental comparison between different artificial air cavity designs for a planing hull. Ocean Eng. 2017, 140, 233–243. [Google Scholar] [CrossRef]
  21. Cucinotta, F.; Nigrelli, V.; Sfravara, F. A preliminary method for the numerical prediction of the behavior of air bubbles in the design of air cavity ships. In Advances on Mechanics, Design Engineering and Manufacturing: Proceedings of the International Joint Conference on Mechanics, Design Engineering & Advanced Manufacturing (JCM 2016), Catania, Italy, 14–16 September 2016; Springer International Publishing: Cham, Switzerland, 2017; pp. 509–516. [Google Scholar] [CrossRef]
  22. Cucinotta, F.; Guglielmino, E.; Sfravara, F.; Strasser, C. Numerical and experimental investigation of a planing Air Cavity Ship and its air layer evolution. Ocean Eng. 2018, 152, 130–144. [Google Scholar] [CrossRef]
  23. Cucinotta, F.; Nigrelli, V.; Sfravara, F. Numerical prediction of ventilated planing flat plates for the design of Air Cavity Ships. Int. J. Interact. Des. Manuf. (IJIDeM) 2018, 12, 537–548. [Google Scholar] [CrossRef]
  24. Cucinotta, F.; Mancini, D.; Sfravara, F.; Tamburrino, F. The Effect of Longitudinal Rails on an Air Cavity Stepped Planing Hull. J. Mar. Sci. Eng. 2021, 9, 470. [Google Scholar] [CrossRef]
  25. Butterworth, J.; Atlar, M.; Shi, W. Experimental analysis of an air cavity concept applied on a ship hull to improve the hull resistance. Ocean Eng. 2015, 110, 2–10. [Google Scholar] [CrossRef] [Green Version]
  26. Wu, H.; Ou, Y.-P. Experimental Study of Air Layer Drag Reduction with Bottom Cavity for A Bulk Carrier Ship Model. China Ocean Eng. 2019, 33, 554–562. [Google Scholar] [CrossRef]
  27. Wang, L.; Huang, B.; Qin, S.; Cao, L.; Fang, H.; Wu, D.; Li, C. Experimental investigation on ventilated cavity flow of a model ship. Ocean Eng. 2020, 214, 107546. [Google Scholar] [CrossRef]
  28. Song, K.-W.; Guo, C.-Y.; Wang, C.; Sun, C.; Li, P.; Zhong, R.-F. Experimental and numerical study on the scale effect of stern flap on ship resistance and flow field. Ships Offshore Struct. 2020, 15, 981–997. [Google Scholar] [CrossRef]
  29. Molland, A.F.; Turnock, S.R.; Hudson, D.A. Ship Resistance and Propulsion; Cambridge University Press: Cambridge, UK, 2017. [Google Scholar]
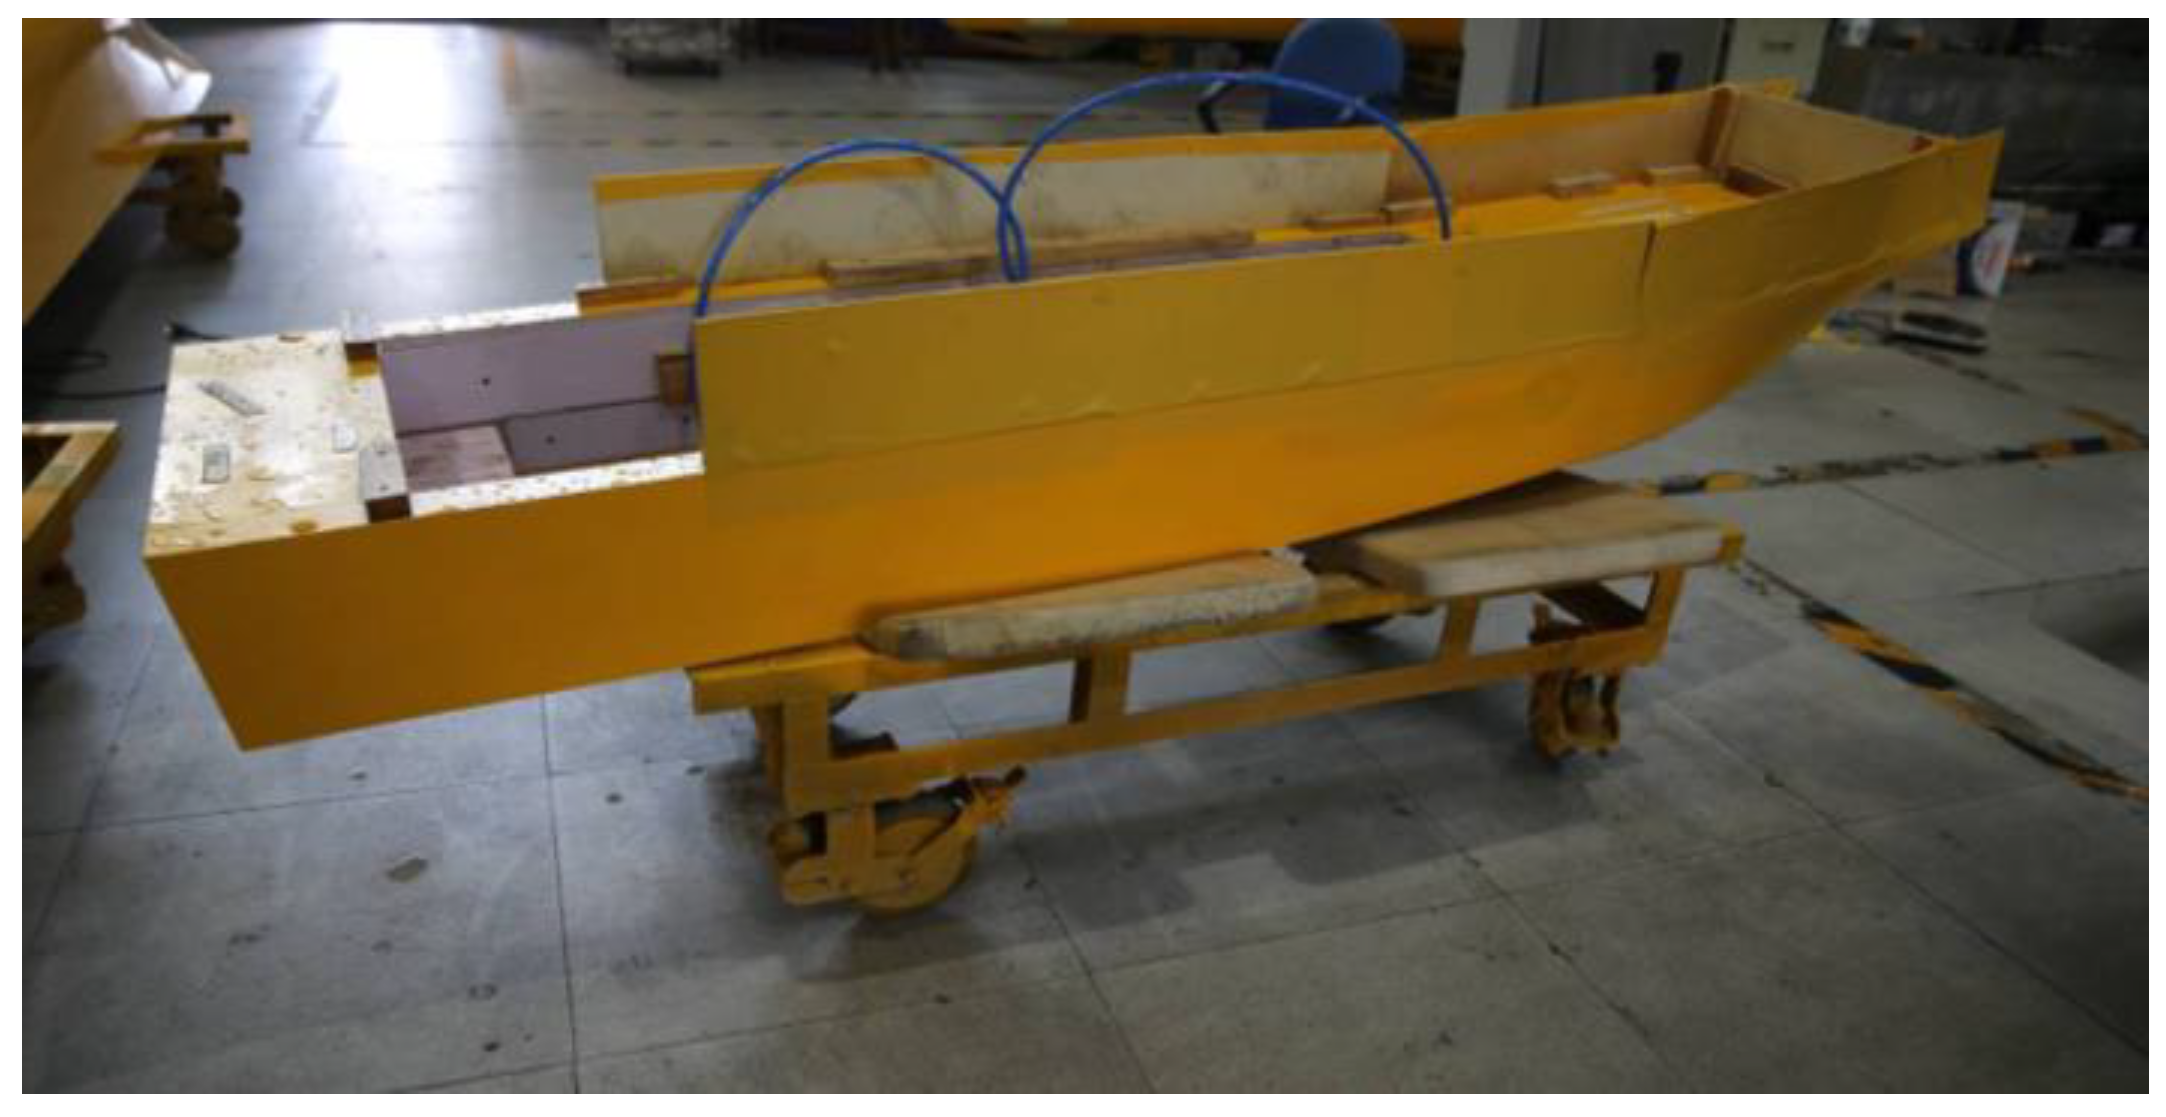
Figure 1. The model of the high-speed air cavity craft.
Jmse 11 01256 g001
Figure 2. The internal structure of the model.
Jmse 11 01256 g002
Figure 3. The midlongitudinal section of the model.
Jmse 11 01256 g003
Figure 4. Effective power without air compared to air pressure of 50 kPa when the initial stern inclination angle is 2.5°.
Jmse 11 01256 g004
Figure 5. Effective power at 1.5°, 2.5°, and 3.5° for different initial stern inclination angles.
Jmse 11 01256 g005
Figure 6. Residual resistance coefficient curve without air compared to air pressure of 50 kPa when the initial stern inclination angle is 2.5°.
Jmse 11 01256 g006
Figure 7. Residual resistance coefficient curve at 1.5°, 2.5°, and 3.5° for different initial stern inclination angles.
Jmse 11 01256 g007
Figure 8. Typical sailing condition of the model (speed 12.4 kn).
Jmse 11 01256 g008
Figure 9. Typical sailing condition of the model (speed 30.9 kn).
Jmse 11 01256 g009
Figure 10. Heave at midship and pitch angle (initial stern inclination angle 2.5°, no air).
Jmse 11 01256 g010
Figure 11. Heave at midship and pitch angle (initial stern inclination angle 1.5°, air pressure 50 kPa).
Jmse 11 01256 g011
Figure 12. Heave at midship and pitch angle (initial stern inclination angle 2.5°, air pressure 50 kPa).
Jmse 11 01256 g012
Figure 13. Heave at midship and pitch angle (initial stern inclination angle 3.5°, air pressure 50 kPa).
Jmse 11 01256 g013
Figure 14. Resistance reduction curve.
Jmse 11 01256 g014
Table 1. Nomenclature.
SymbolDefinitionUnit
AMmidship section area under the design waterlinem2
Bbreadthm
CBblock coefficient
CMmidship section coefficient
LPPlength between perpendicularsm
LWLwaterline lengthm
Swetted surface aream2
Tdraftm
TFfore draftm
TAaft draftm
molded volumem3
ρwater densitykg/m3
CFMfrictional resistance coefficient of ship model
CFSfrictional resistance coefficient of full-scale ship
CTMtotal resistance coefficient of ship model
CTStotal resistance coefficient of a real ship
CRresidual resistance coefficient
FrFroude number
PEeffective powerkW
RTtotal resistance of ship
RMtotal resistance of ship modelN
ReReynolds number
RStotal resistance of full-scale shipN
LMlength of modelm
LSlength of shipm
VMvelocity of modelm2/s
VSvelocity of shipkn
CFfrictional resistance coefficient
ΔCFroughness allowance coefficient
υkinematic viscosity coefficient of waterm2/s
Table 2. Main dimensions of the ship and the model.
SymbolShipModelUnit
LWL25.02.5m
LPP25.02.5m
B5.80.58m
TF1.250.125m
TA2.380.238m
T1.8510.185m
125.00.125m3
AM7.170.0717m2
S181.01.810m2
CB0.465
CM0.668
LPP/B4.31
B/T3.20
Table 3. Test results of the total resistance of the ship model.
Resistance (N)
VS
(knots)
VM
(m/s)
FrNo Air
2.5°
50 kPa
1.5°
50 kPa
2.5°
50 kPa
3.5°
121.9520.394 95.00577.40181.96585.970
132.1150.427 124.516100.001105.156114.157
142.2770.460 150.490119.654125.898139.395
152.4400.493 173.273136.724144.405161.890
162.6030.526 193.211151.577160.888181.848
172.7650.558 210.650164.578175.560199.473
182.9280.591 225.934176.092188.634214.974
193.0910.624 239.409186.485200.321228.554
203.2530.657 251.421196.122210.834240.420
213.4160.690 262.314205.369220.386250.778
223.5790.723 272.435214.590229.188259.834
233.7410.755 282.128224.151237.453267.792
243.9040.788 291.739234.417245.393274.860
254.0670.821 301.614245.753253.221280.915
264.2290.854 312.097258.526261.149286.117
274.3920.887 323.534273.099269.389291.221
284.5550.920 336.272289.839278.153296.555
294.7170.953 350.654309.111287.655302.445
304.8800.985 367.026331.279298.105309.220
315.0431.018 385.735356.710309.718317.207
Table 4. Resistances (N) of models for different stern inclination.
SpeedStern Inclination Angle (°)
(kn)1.52.53.5
28289.59278.17296.53
29309.08287.58302.51
30 (design)331.32298.11309.27
31356.73309.76317.19
Disclaimer/Publisher’s Note: The statements, opinions and data contained in all publications are solely those of the individual author(s) and contributor(s) and not of MDPI and/or the editor(s). MDPI and/or the editor(s) disclaim responsibility for any injury to people or property resulting from any ideas, methods, instructions or products referred to in the content.