Article

Study on Mitigation of Wake Interference by Combined Control of Yaw Misalignment and Pitch

1
College of Engineering, Ocean University of China, 238 Songling Road, Laoshan District, Qingdao 266100, China
2
Shandong Academy of Sciences, Qilu University of Technology, Qingdao 266100, China
3
China Electric Power Research Institute, Beijing 100192, China
*
Author to whom correspondence should be addressed.
J. Mar. Sci. Eng. 2023, 11(7), 1288; https://doi.org/10.3390/jmse11071288
Submission received: 12 June 2023 / Revised: 22 June 2023 / Accepted: 23 June 2023 / Published: 25 June 2023
(This article belongs to the Section Marine Energy)

Abstract

:
Yaw misalignment can make a wake steer, which is an effective method to increase the power of wind farms but it also increases the fatigue load of the turbines. In this paper, the combination of yaw offset and pitch control (CYMP) is studied to analyse the potential mitigation of wake, focusing on the wind velocity and turbulence of the wake distribution, power increment, and fatigue load reduction. The simulation case study shows that the method of CYMP can reduce the fatigue load by 10.29% and increase the total power by 1.7% compared with only wake steering in FAST.Fram. The Collaborative MPC (CoMPC) method based on CYMP is proposed to the real-time wake control in this research, which can increase power by more than 2% and reduce thrust by more than 4% than greedy control under 10 m/s turbulent wind.

1. Introduction

Offshore wind power has grown rapidly in the past few years; it is estimated that the total installed capacity of global offshore wind power will reach 200 GW by 2030 [1,2]. The proportion of offshore wind power is growing fast, which is of great significance to achieve the goal of carbon neutrality. The lower turbulence intensity and higher wind speed in offshore wind farms can lead to higher power generation than that of onshore wind farms. However, offshore wind farms exhibit a diminished ability for the wake to dissipate, resulting in significant wake interference [3]. Severe wake interference causes a huge loss of annual power generation [4] and wake also reduces the reliability of the safe operation of wind turbines [5].
The method of changing the operation state of the wind turbine to alleviate the wind-farm wake is called wind-farm control, which is the most common method to mitigate wake disturbances for established wind farms [6,7].
Wake steering is a method to mitigate wind-farm wake, which has attracted great attention [8]. The yaw misalignment technology deflects [9,10] and curls the wake laterally [11,12], away from the downstream turbines, which is the key point of the technology to increase the power generation of wind farms. Wake steering is considered to be an effective method to increase power output [13]. Adaramola and Krogstad [14] studied the wake steering in a wind-tunnel test, and they found that when the upwind turbine yawed by 30°, the total power output could be increased by 12%. Campagnolo et al. [15] changed the wind-tunnel test conditions and it was found that when the upstream turbine yaw misalignment angle was set to 20°, the maximum power gain was 7.0%. Howland et al. [16] conducted a series of field tests and found that an appropriate yaw misalignment control could increase the wind-farm power output by about 10%. However, the fatigue load of the turbine always increases under wake steering. The turbine increases its fatigue load due to yaw offset [17]. Lin and Port’e-Agel [18] used the method of multiobjective parameter optimization to determine the maximum power output and the minimum fatigue load in the wind-tunnel test. The wake steering also increases the fatigue load of the downwind turbine. Churchfield et al. [19] also found that although the wake steering made the downwind power increase, the fluctuation of blade root flap-wise moment was significantly increased, and the root mean square of bending moment of the turbine blade affected by partial wake was increased by at least 15% in CFD simulation analysis.
Pitch control [20,21,22] has also attracted much attention in the study of relieving wake effects [23,24]. Corten and Schaak [25] tested 24 turbines (3 × 8) with a 25 cm rotor diameter in the wind tunnel, and they found that the pitch control of the front-row turbines made the total power output increase by 4.6%; meanwhile, the increase of power was the most pronounced in the second-row turbines. However, pitch control did not always improve the power generation of wind farms. Bartl and Sætran [26] set the constant average wind speeds and varied the turbulence intensity in the wind-tunnel test, the rotor diameter of the two turbines was 90 cm, and the pitch control did not improve the total power. Campagnolo et al. [27] also applied wind-tunnel experiments to investigate the pitch control, and they found that only when the first two turbines were considered, the pitch control could increase total power, but when the third turbine was considered, the total power output did not increase. Kim et al. [28] validated that the atmospheric turbulence and Reynolds number affected the pitch control, i.e., when the atmospheric turbulence intensity was low, the wake expansion rate was slow [5]; also, when the Reynolds number was low, the rate of wake expansion was slow [29], so the momentum recovery was low. Annoni et al. [30] found that when the downwind turbines were affected by full wake, the upwind turbines were pitched. The kinetic power along the wake boundary was significantly increasing. Still, with the wake expansion, the swept area of the downwind turbine was away from the boundary, which had little influence on the power increase of the downstream turbines. Combining the experiments and analysis above, Ha et al. concluded that the environment greatly affected the pitch control effect [31].
Reducing the axial inducement factor can reduce the rotor’s thrust to the wind, which is important in reducing the wake’s turbulence and deficit [32,33]. Pitch is one of the methods to change the axial induce factor. Although the pitch control does not significantly improve wind-farm power, it helps to reduce the wake-turbulence intensity.
Bossanyi [34] has proposed a combining yaw and induction control method to optimize wind-farm power and reduce fatigue load. This method takes advantage of wind direction changes and wind field speed to maximize power output and reduce fatigue load by adjusting the wind turbine’s yaw angle and blade-pitch angles. The fundamental theory of the method is that the yaw misalignment control makes the downwind turbine away from the wake centre or close to the wake boundary, and the pitch control reduces the axial induction factor of the upstream turbine and increases the recovery of kinetic energy along the wake boundary.
Despite some research studies demonstrating the benefits of the CYMP approach in increasing power generation and reducing fatigue loads, there is a dearth of comprehensive research papers that thoroughly examine the effects of this approach on wake turbulence, wind-speed distribution, power output, and especially the fatigue characteristics of wind turbines. In this research, firstly, the simulation method is used to analyze the influence of CYMP on the wind-speed distribution and turbulence distribution in the wake, as well as the influence of power and load changes; secondly, to analyze the potential of CYMP to alleviate the wake in the wind farm, a method of CYMP-based cooperative model predictive control (CoMPC) was proposed for wind-farm wake control. The paper is arranged as follows: Section 2 introduces the simulation tool FAST.Farm and simulation setup, Section 3 gives the case analysis and discussion points, Section 4 proposes CoMPC based on CYMP and simulates to verify the effectiveness of this method, and Section 5 summarizes the whole paper.

2. Methodology

2.1. Overview of FAST.Farm

FAST.Farm is a simulation tool developed by the National Renewable Energy Laboratory (NREL), which is an extension of the OpenFast. The wake calculation is conducted by modifying and extending the dynamic wake meandering (DWM) model. FAST.Farm is used to describe wake development and evolution, explain the wake interference effect, and describe the fatigue load and power of the turbine under wake interference.
The thin shear layer approximation of a Reynolds averaged Navier–Stokes equation under quasi-steady-state conditions is used to simulate wake deficit, and the turbulent closure captured with the eddy viscosity formula [35] is also applied.

2.2. Wind Turbine Model

The NREL’s 5 MW baseline turbines model is used and the parameters of wind turbines are listed in Table 1.

2.3. CYMP and Results

The flow field of the downwind turbine has changed when compared with the free flow field. This change is due to the wake generated by the upwind turbine, and the turbulence intensity increases as the average wind speed decreases. The wake interference diagram is shown in Figure 1, where the parameter γ is the angle between the rotor axis and wind direction; it is called the yaw misalignment angle and the parameter β is the pitch angle.
In Figure 1a, in the case of the wind speed below the rated speed, the turbine WT1 is in free flow and has no control over the wake, γ and β are 0°, and the power of WT1 reaches the optimum. At this time, the wind speed of the wake is very low, the turbulence intensity is high, and WT2 is seriously affected by the wake, resulting in the decrease of WT2 power and the increase of fatigue load [2]. The CYMP method is a combination of yaw misalignment and pitch control. Yaw misalignment makes the wake steer, and the downwind turbine far away from the wake centre. The upwind turbine reduces the thrust to the wind through pitch while reducing the thrust to the wind of the upstream turbine will reduce the turbulence in the wake [30].
In Figure 1b, the CYMP method is applied to make velocity recover (dashed arrow) and wake centre-line offset, where both γ and β are not 0°. WT1 applies the CYMP method, which makes C P reduced, as shown in Equation (1),
C P β i ,   λ i ,   γ i = C P β i ,   λ i η c o s ( γ i ) 2
where C P is deduced from the experiment of Medici [36] and it is a function of β ,   λ   a n d   γ ; λ is the tip speed ratio. η is the loss factor. C P β i ,   λ i is obtained from the C P -curve without yaw. The power of WT1 P i reduces, as Equation (2) [37].
P i = 1 2 ρ A i C P β i ,   λ i ,   γ i v i 3 ( i = 1 ,   2 ,   3 )
where I is the wind turbines number, ρ is the air density, A i is the turbine rotor swept area, and v is the efficient wind speed.
Repeated fatigue-load accumulation will cause fatigue damage to turbine materials; for example, cracks appear, consequently reducing the turbine’s service life. According to Equation (3)
D = i n i N
where ni is the number of fatigue-load cycles and N is the number of cycles causing fatigue-load failure. This paper applies damage equivalent fatigue load (DEL) to fatigue loads in all simulations.
D E L = i n i m N 1 m
where m is Wöhler exponents and the value of m varies with different materials. In the fatigue-load analysis of Section 3, the blade out-of-plane moment at the blade root is selected as the object and m is defined as 10.

2.4. Simulation Setup

As shown in Figure 2, the scenario of two wind turbines with spacing x/D = 5 is selected. The average wind speed (v) of 7.5 m/s is observed in simulation. The wind characteristics of this region are: (a) obvious wake interference; (b) when the wind speed is lower than rated, the pitch control is easy to achieve. The characteristics of turbine operation in those regions are: (a) the rotor speed increases and the β is 0°; (b) the rotor speed control follows the optimal Cp tracking. Turbulence intensity (TI) of 6%; a wind shear (kv) of 0.13, air density ( ρ ) of 1.225 kg/ m 3 are typical offshore wind characteristics, and the distance of the two wind turbines in the wind direction is 5D.
Turbsim is a tool for generating wind by NREL. It is most applicable to the simulation of small wind farms and it has lower computational complexity than CFD simulation tools. Turbsim generates the turbulent wind, the specific settings are as follows Table 2:

3. Result Analysis

In this section, the three aspects are studied and analysed: the wake visualization, the impact of the CYMP on the wake, and the impact of the wake on the downwind turbine under the control of CYMP.

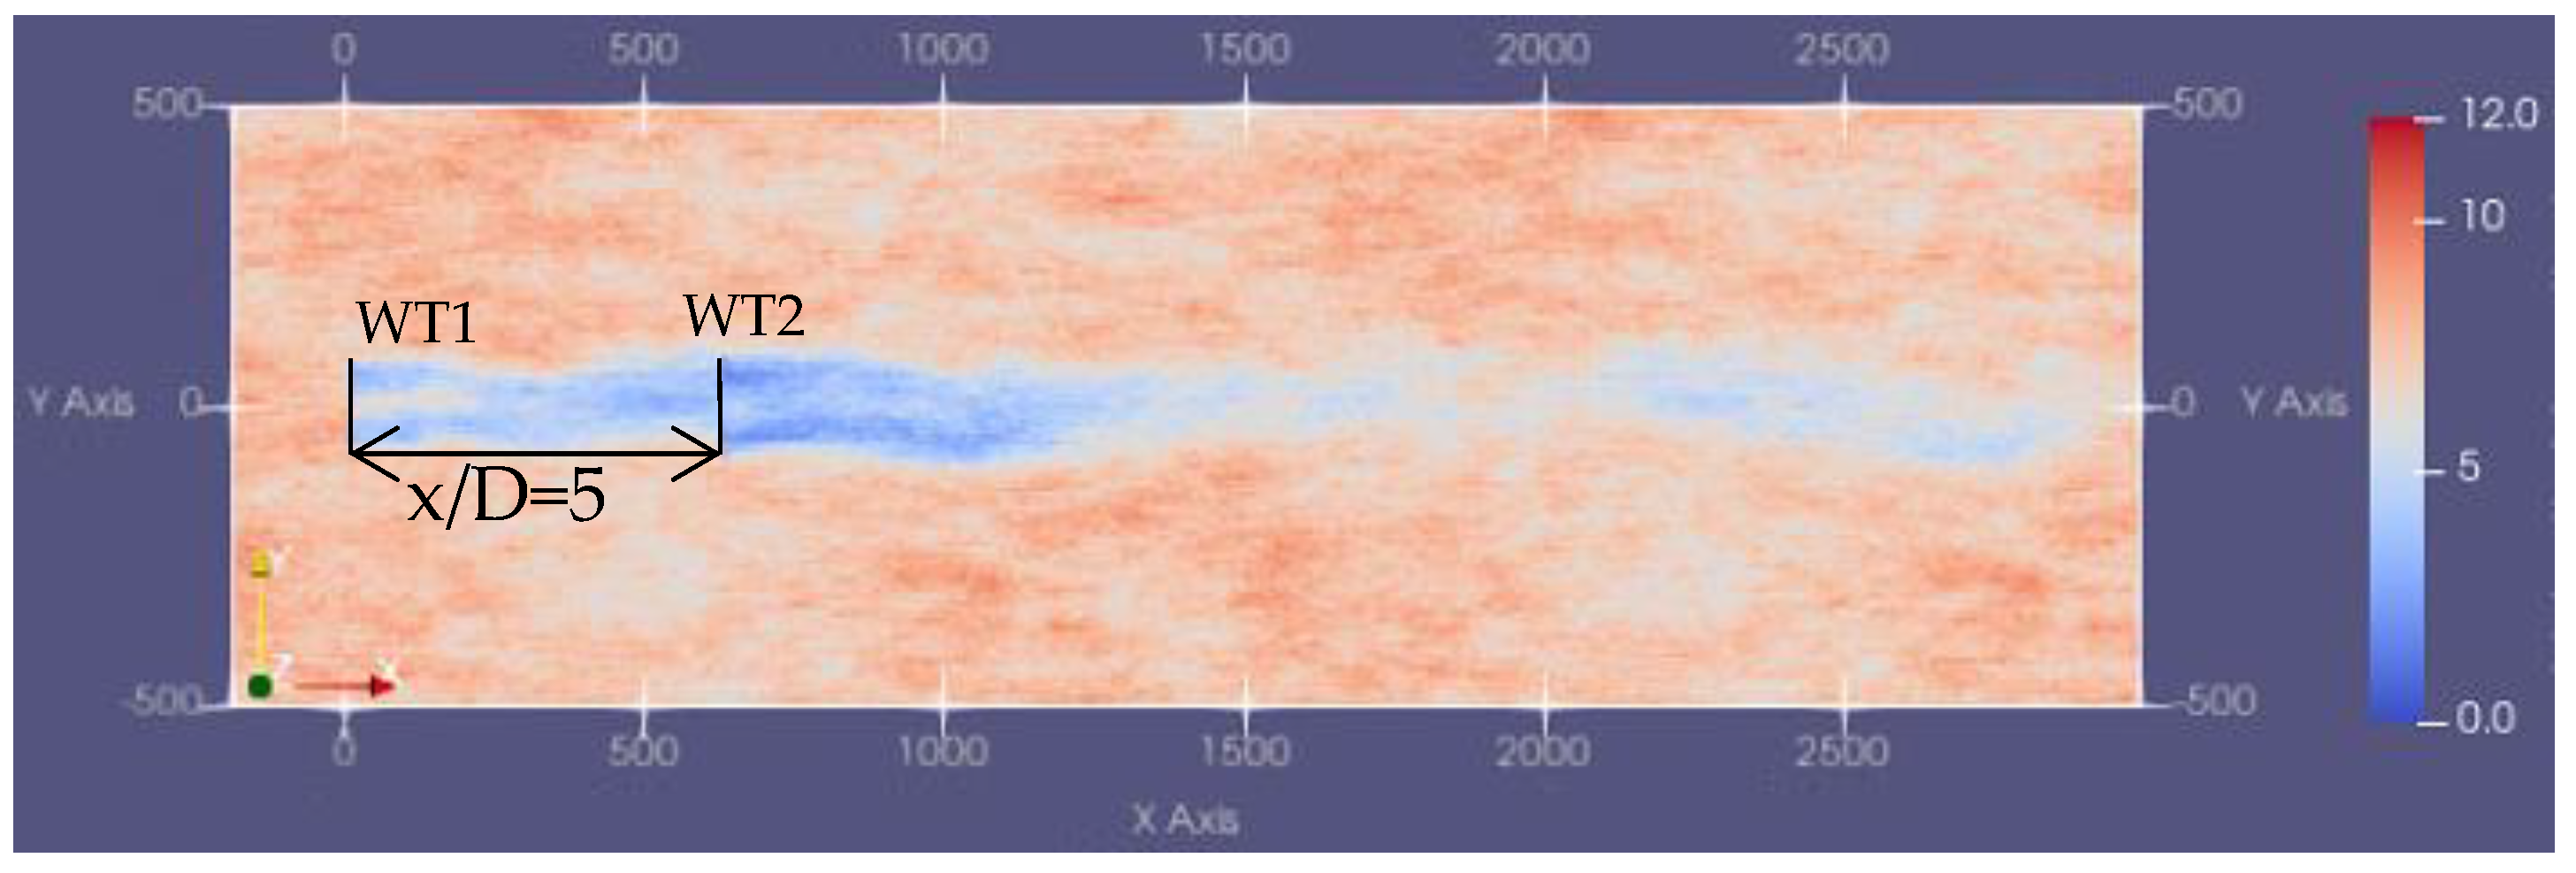
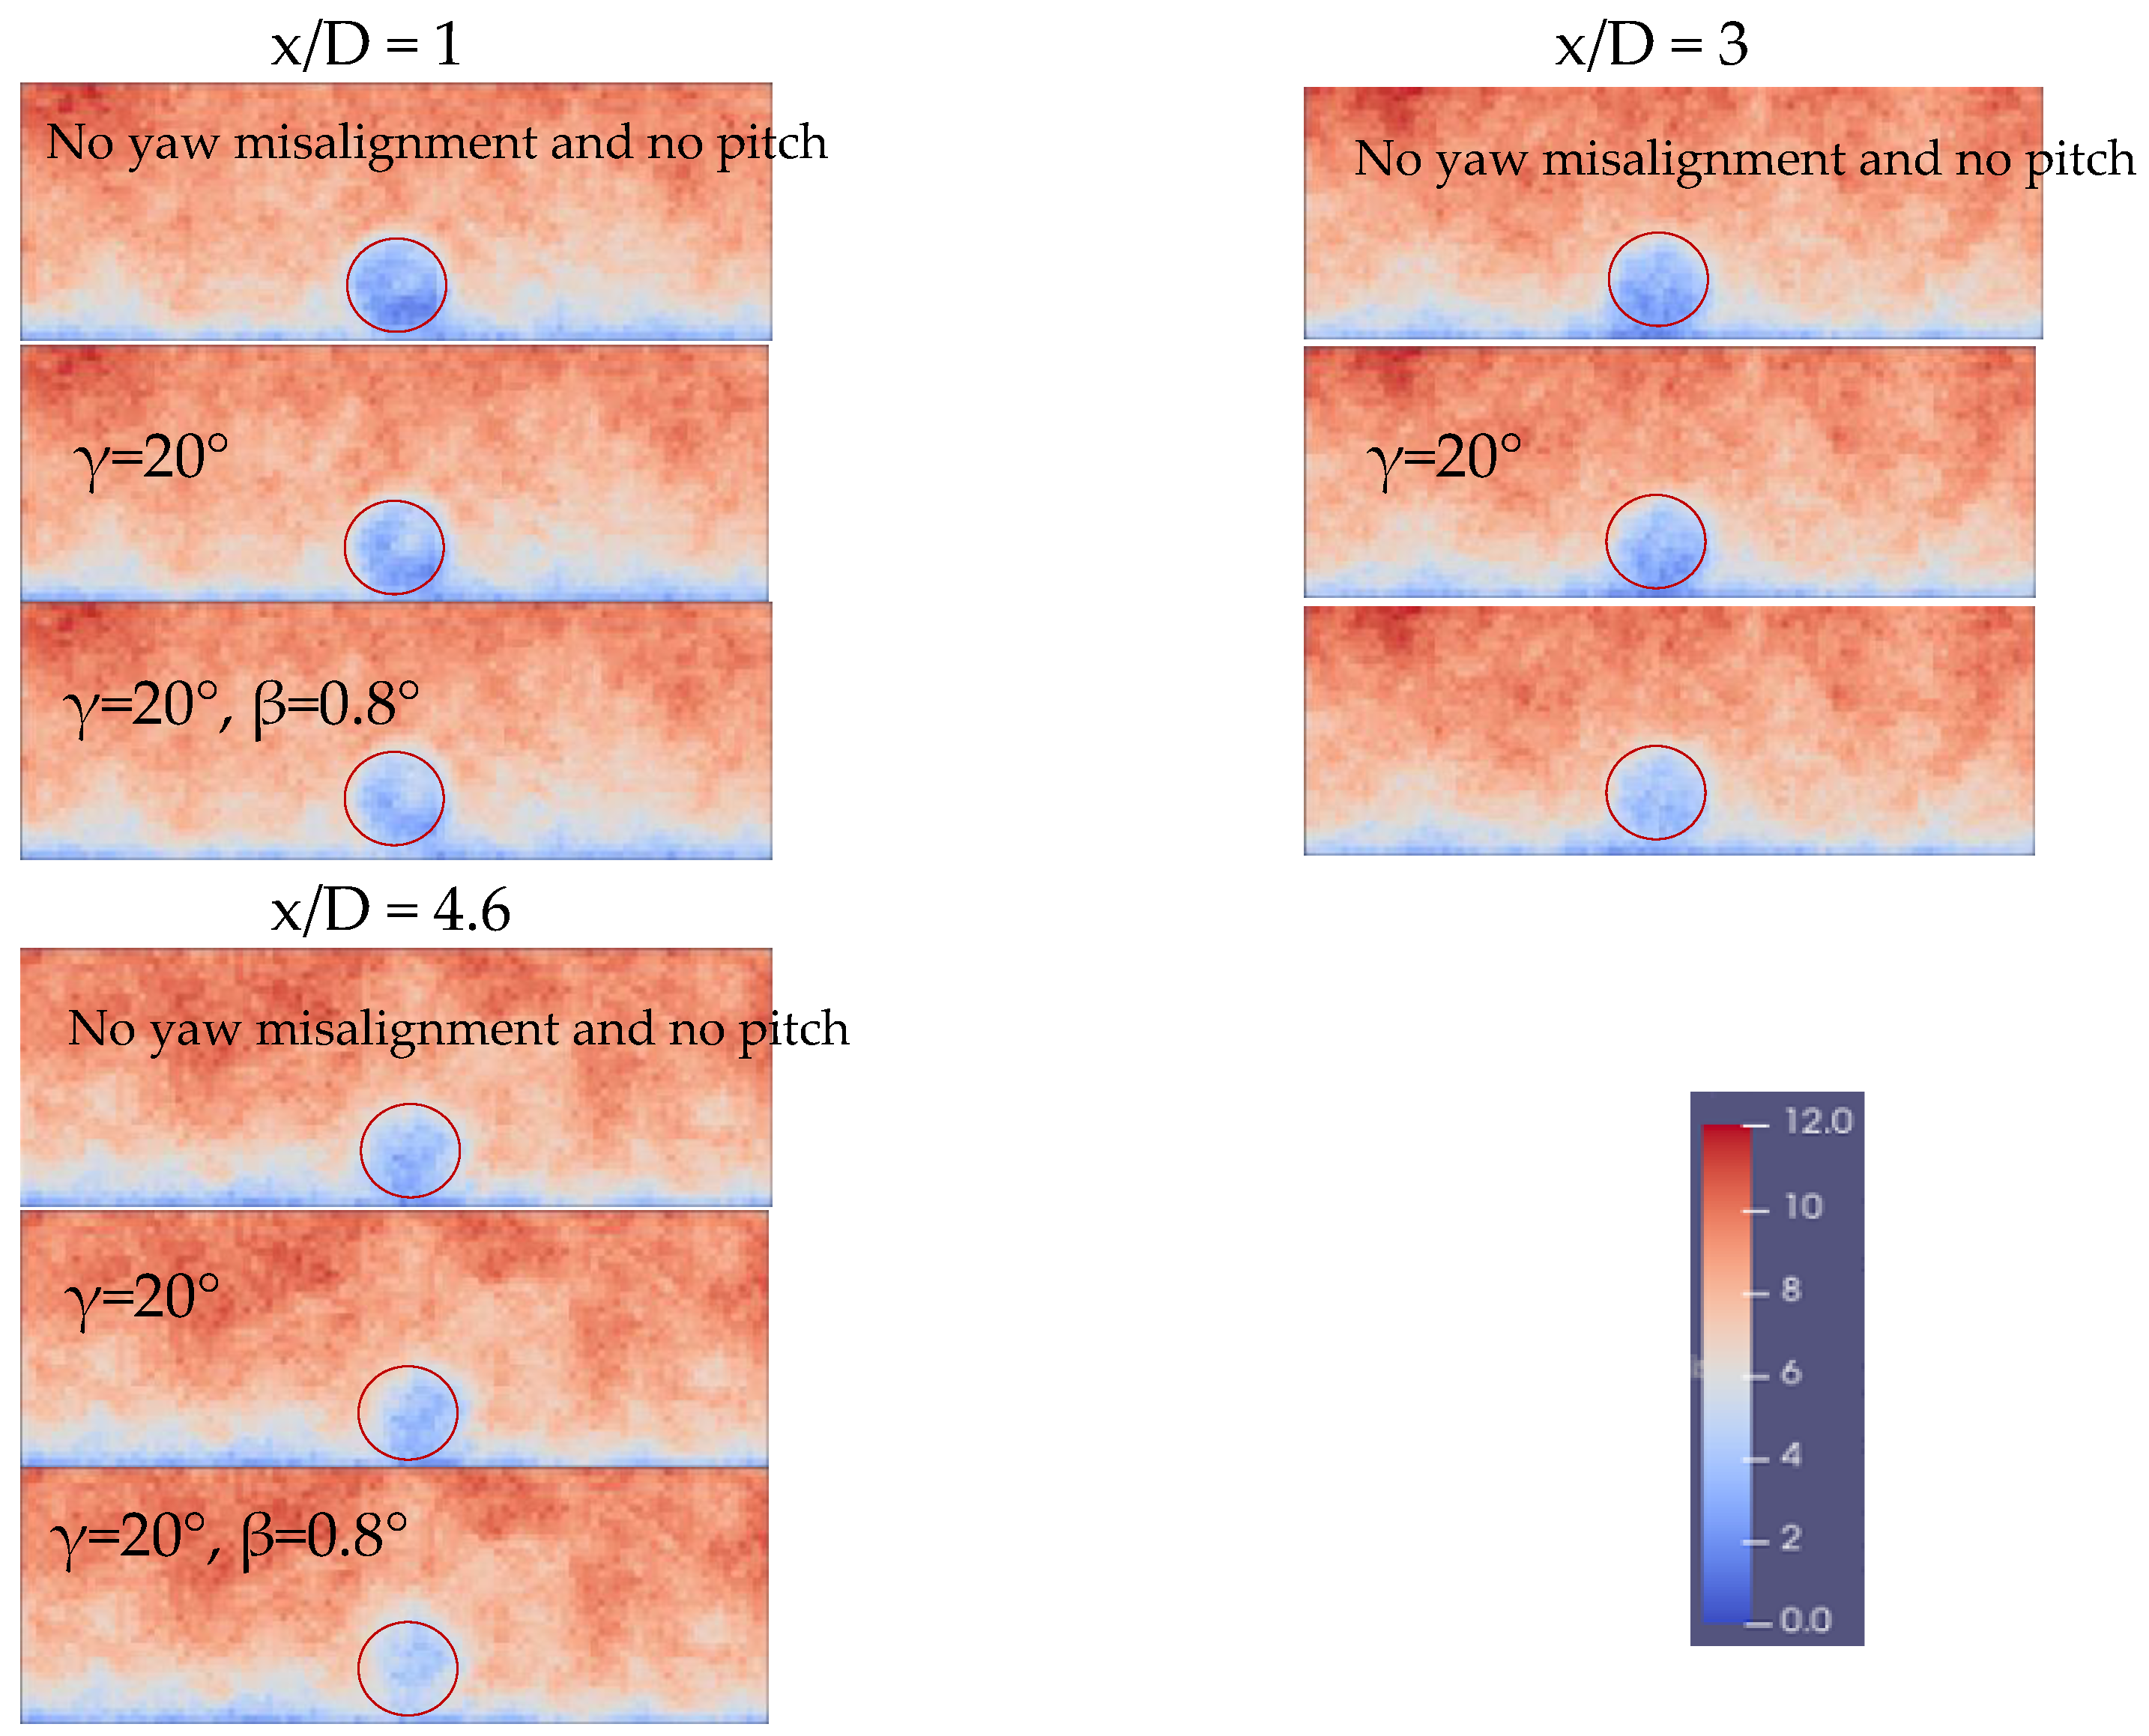
3.1. Flow Visualizations

The visualization of the wake plane can vividly show the changes in the wake. Just take the results of three different cases as examples, which are control with no yaw misalignment and no pitch, γ = 20 ° and γ = 20 ° ,   β = 0.8 ° . The wake states are shown in Figure 3, the controls with γ = 20 ° and γ = 20 ° ,   β = 0.8 ° make the wake centre offset to the right, and the farther the distance between WT1 and WT2 at the wind direction, the greater offset of the wake centre, which is consistent with the characteristics of yaw misalignment control [38]. Wind shear results in a lower wind speed within the lower half of the swept area and it is one of the important factors that cause the increase of the fatigue load [39]. Compared with the control results of γ = 20 ° , the control of γ = 20 ° ,   β = 0.8 ° makes the wake boundary recover faster, which is shown in the decrease of wake radius in Figure 4.

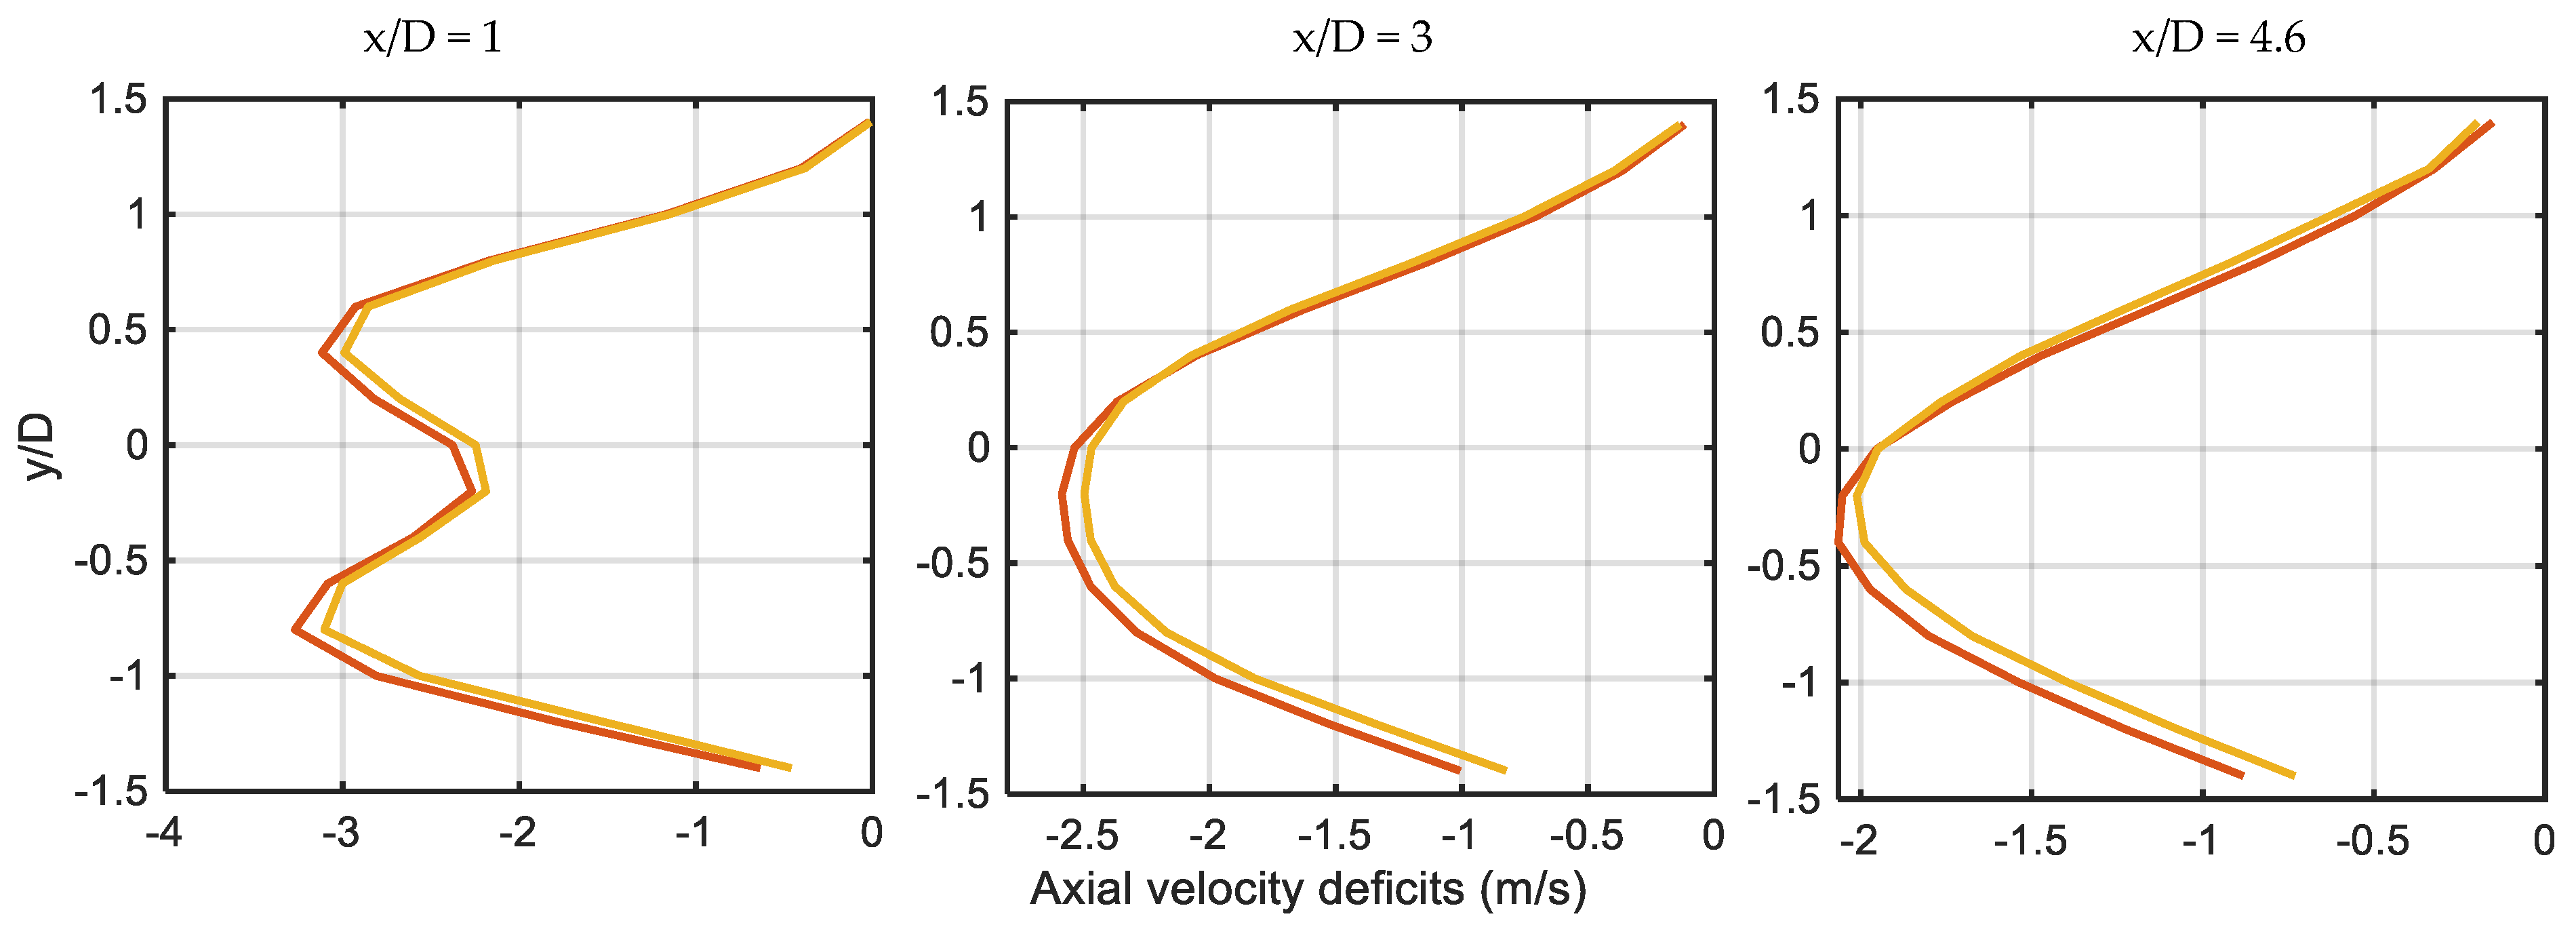
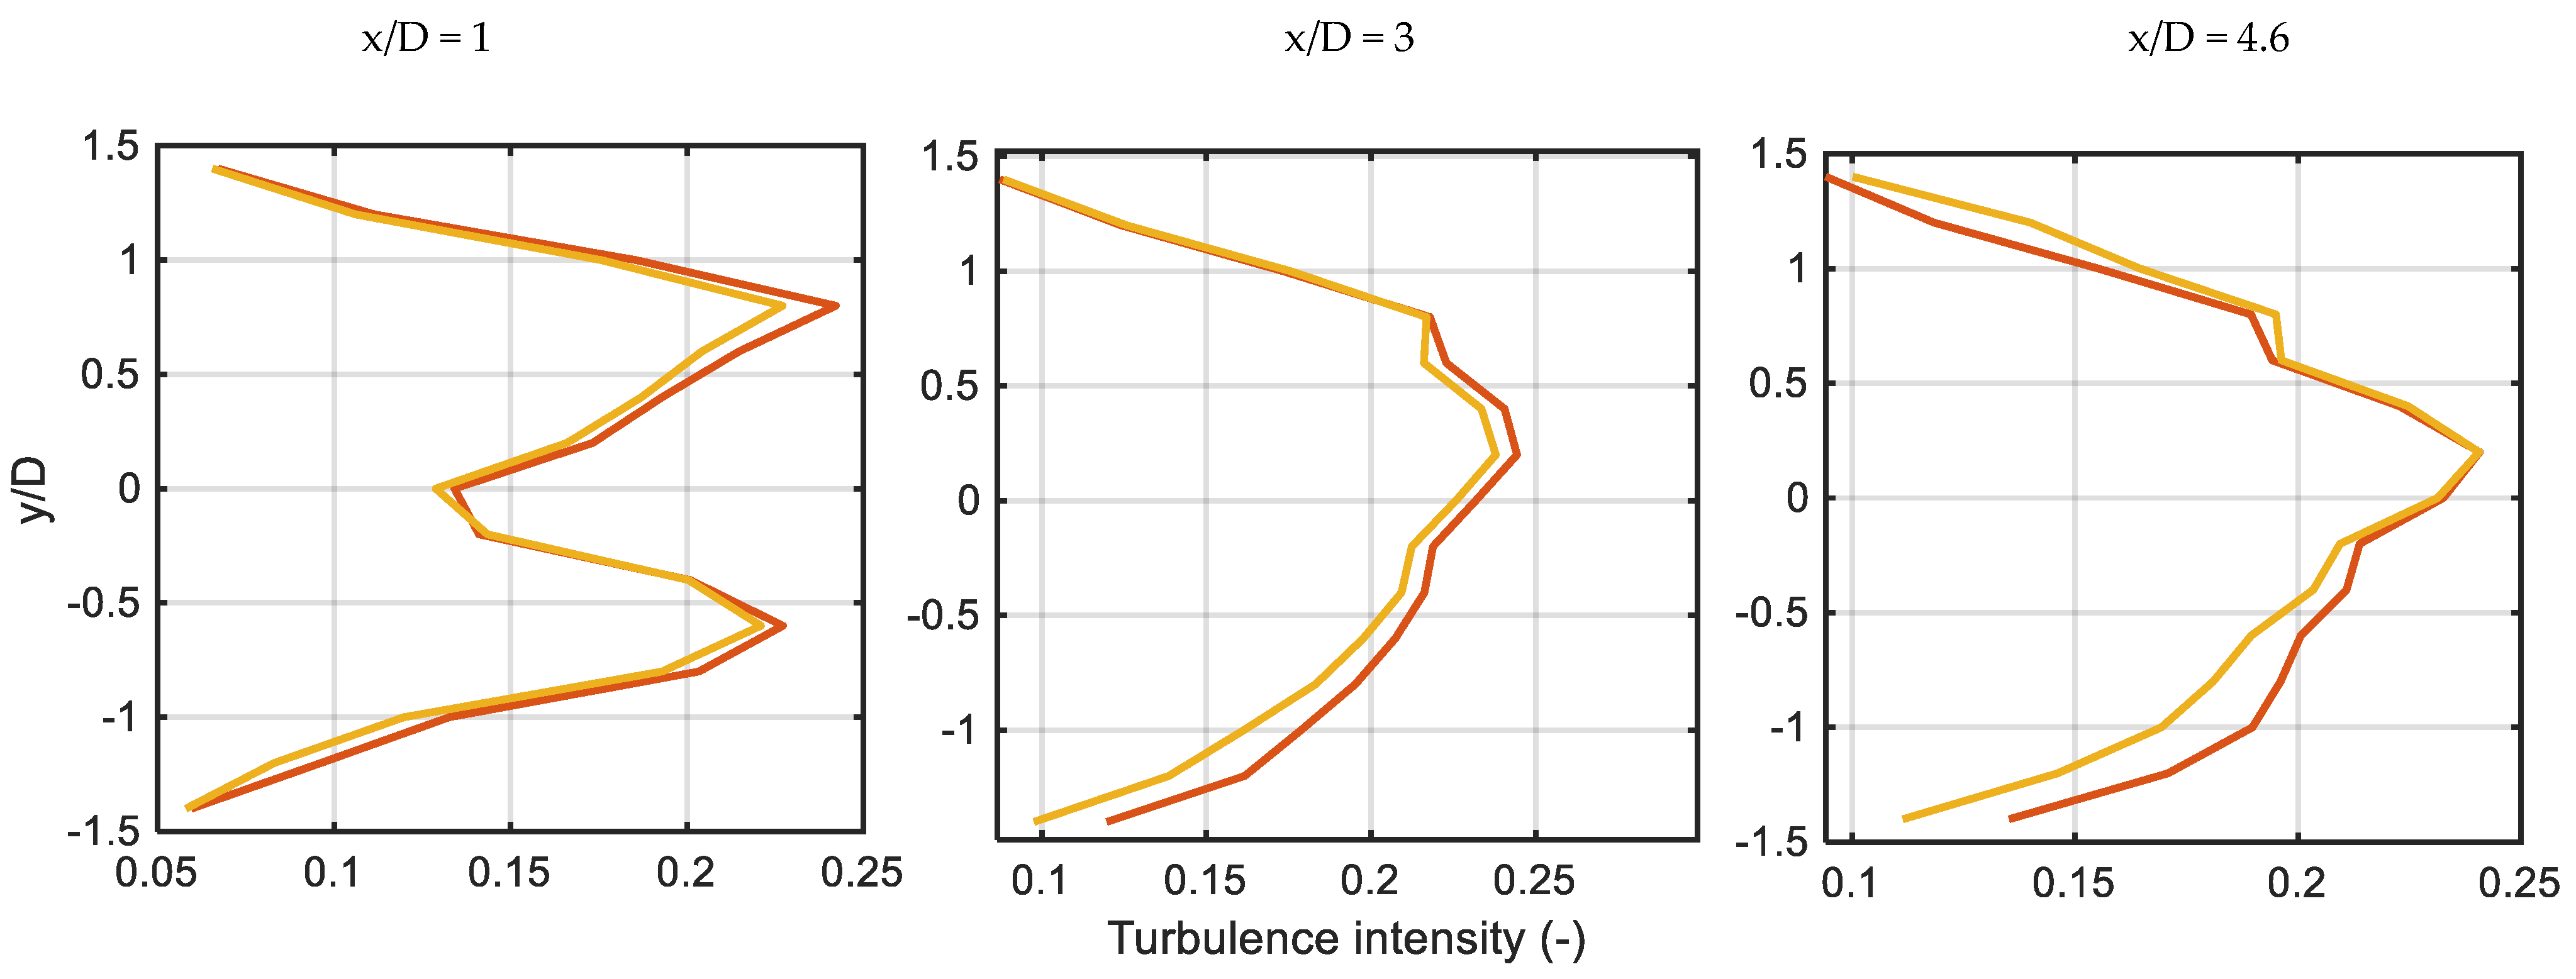
3.2. Effect on the Wake

This part quantifies the wake characteristics in Section 3.1, and the axial velocity deficits, wake turbulence and wake centre-line offset are analysed as blow.
In Figure 5, the characteristics of the wake centre-line offset can be found that the yaw misalignment makes the wake centre-line offset in the y-axis direction. In contrast, it is not obvious in the z-axis direction. The distance of the wake centre-line offset under the control with γ = 20 ° ,   β = 0.8 ° is less than the control with γ = 20 ° ; this may be caused by the difference in the wake speed. Wake deficits and turbulence also have such characteristics, so they are analysed only in the y-axis direction.
The wake recovery is generally considered from two aspects: wake deficit and wake turbulence. As shown in Figure 6, the controls with γ = 20 ° and γ = 20 ° ,   β = 0.8 ° make the wake deficit centre offset to the right (y < 0) by 0.2 times the rotor radius (R) because of the upwind turbine yaw misalignment. The energy capture capacity is the largest at the position of 0.6–0.8 times the rotor radius (0.6–0.8R) from the center of the hub, and the wake deficit is the most at 0.6–0.8R as shown at x/D = 1. With the evolution of wake downwind, compared with at x/D = 1, the wind speed of x/D = 3 at 0.6–0.8R recovers rapidly. At x/D = 4.6, the wind deficit at the wake centre is the most, and the closer to the boundary, the lower the wind deficit.
There is little difference in the wake deficit on the left side of the hub centre between the controls with γ = 20 ° and γ = 20 ° ,   β = 0.8 ° , and on the right side of the wake plane (y < 0), the wake deficit of the control with γ = 20 ° is less than that of the control with γ = 20 ° ,   β = 0.8 ° . At x/D = 4.6 and the 0.6–0.8R position, the control with γ = 20 ° ,   β = 0.8 ° makes wind speed 0.18 m/s higher than that of the control with γ = 20 ° . This can be explained that under the control with γ = 20 ° ,   β = 0.8 ° , the wind speed of the downwind wake recovers quickly, which helps improve the power of the downwind turbines. This conclusion is consistent with the visualization results in Figure 4.
Turbulence is an important factor affecting the fatigue load. As shown in Figure 7, at x/D = 1, the control with γ = 20 ° ,   β = 0.8 ° makes the turbulence of 0.6–0.8 R lower than that of the control with γ = 20 ° . This is caused by the reduction of the thrust of the upwind turbine and the difference in other regions of the y-axis is not obvious. At x/D = 3, the turbulence intensity on the left side (y > 0) of the wake plane is higher than that on the right side, but the opposite is true at x/D = 4.6. In the right side of the wake plane at x/D = 4.6, the control with γ = 20 ° ,   β = 0.8 ° makes the turbulence reduced by 1.25% at the 0.6–0.8R position and this is also one of the factors to reduce the fatigue load of downwind turbines.
The wind speed at the hub centre and rotor speed of WT2 are shown in Figure 8 and Figure 9, respectively. As shown in Figure 8, under control with γ = 20 ° ,   β = 0.8 ° , although the wind speed of WT2 has not been significantly improved, the wind speed PDF of WT2 is greatly changed. This is important for the rotor speed increase of WT2. For the average wind speed greater than 5.5 m/s, the PDF under the control with γ = 20 ° ,   β = 0.8 ° is higher than that of the control with γ = 20 ° . The rotor speed of WT2 shows consistency with the wind-speed distribution. As shown in Figure 8, when the rotor speed is greater than 8 rpm, the PDF of control with γ = 20 ° ,   β = 0.8 ° is greater than that of γ = 20 ° . When the rotor speed is around 8.4 rpm, the PDF value under the control with γ = 20 ° ,   β = 0.8 ° is twice the control with γ = 20 ° .

3.3. Turbine Performance Impact

To study the impact of CYMP on the performance of the wind turbine, more simulation cases are studied, which are listed in Table 3. The yaw misalignment angle varies from 0° to 40° (positive for clockwise yaw) with a gradient of 5°; the pitch angle changes from 0° to 1.0° with a gradient of 0.2°. The fatigue load and total power of CYMP are shown in Figure 10 and Figure 11, respectively. The results are normalized by the value of no yaw offset and no pitch. As shown in Figure 10, the turbine blade root out-of-plane moment is used to calculate the damage-equivalent loads (DEL) and is normalized by the WT1 DEL value of no yaw misalignment and pitch. When the CYMP with β = 0 ° is chosen, the control with clockwise yaw misalignment of WT1 makes the DEL of WT1 decrease, which is consistent with Kragh’s research [39]. The fatigue load of WT2 is increased because of the partial overlaps. The fatigue damage of WT1 and WT2 under the CYMP method is both lower than that of the control with β = 0 ° . When the WT1 pitch angle is 1.0°, the fatigue damage of the two turbines decreases the most. When the yaw misalignment angle is 30°, the fatigue damage of WT1 is decreased by 9.94%. When the yaw misalignment angle is 25°, the fatigue damage of WT2 is decreased by 10.29%. Therefore, the high fatigue load of WT2 caused by yaw misalignment can be effectively reduced under the CYMP method.
Figure 11 shows the total power under the CYMP method; CYMP with β = 1.0 ° was used as a comparison. The control with γ = 5 ° ,   β = 1.0 ° of WT1 make total power maximal improved by 1.7%. When the γ of WT1 is greater than 15°, the CYMP method reduces the total power. It can be seen that when WT1 takes the CYMP control, the captured power of WT1 is reduced while the power boosted by WT2 downwind is less than this value; as a result, the total power is reduced. This value may be improved when more downwind turbines are added and more research will be undertaken in the future.

4. Cooperative Control of Wind Farm Based on Model Predictive Control of CYMP

For offshore wind farms, a multimodel predictive controller collaborative control strategy (CoMPC) is proposed; joint pitch and yaw control actions can increase power generation and reduce wind turbine loads.

4.1. Method Design

MPC is a commonly used control method for wind turbines. According to the control needs of offshore semisubmersible floating wind farms, this paper proposes CoMPC. The framework of CoMPC is shown in Figure 12. The supercontroller is for wind farms, and the optimization algorithm “Fmincon” calculates the optimal references, including yaw angle, pitch angle, and rotor speed of each wind turbine corresponding to the optimal target, and considers the free-flow wind speed, wind direction, and wind-turbine arrangement. Then the supercontroller transmits the optimal operating value of the wind turbine to each MPC controller. The MPC controller tracks the reference value and controls the wind-turbine action. At the same time, the operating data and wind of the wind farm are fed back to the supercontroller continuously and each MPC controller for real-time adjustment of optimal value selection and tracking of control actions, realizing dynamic active wake control of CYMP.

4.1.1. Supercontroller Design

The goal of the supercontroller is to maximize the power i n P i of the entire wind farm while reducing load. For the convenience of calculation, the load is specified as the thrust i n F i of the wind turbine. The total power and thrust of all generators in the wind farm are expressed as follows:
i n P i = ŋ ρ π R 2 v f 3 2 i n C P i [ 1 δ v i ( C T j ) j W i ] 3
i n F i = ρ π R 2 v f 2 2 i n C T i [ 1 δ v i ( C T j ) j W i ] 2
where ρ is the air density, π R 2 is the plane area of the rotor, v f is the wind farm free-flow wind speed, and δ v i ( C T j ) j W i indicates that the wind deficit of the i t h wind turbine affected by other wind turbines W i in the wind farm. The wind-speed deficit caused by wake is obtained by the classic wake model, the Jensen model [40,41], and the wake deflection caused by yaw is calculated by the Jiménez model [42]. These two models are not the focus of this article and will not be introduced in this article; please refer to the paper for details if needed; C T j indicates the thrust coefficient of the i t h wind turbine and C P i , C t i are affected by the pitch angle β and rotor speed ω at the same time, so the supercontroller also needs to consider the control of ω, C P i , and C t i are obtained from the look-up table. The objective function of the supercontroller is set as:
m a x ( f γ ,   β ,   ω ) = m a x ( i n ( a P i b F i ) )
where a and b are the weights for power and thrust, respectively. The goal of the super controller is to find γ r e f , β r e f , and ω r e f when f γ ,   β ,   ω is maximized and take them as the best operating point of each wind turbine.
For a wind farm with n wind turbines, when the function f ( γ ,   β ,   ω ) is maximum, there are 3 n optimization parameters. When n is large, the number of parameters will make the computational burden increase. Due to the changing of wind conditions, the long calculation time may invalidate the optimal reference. In response to this problem, this paper proposes to partition the wind farm, with wind turbines in the upwind direction as the dominant factor and the wind turbines that are seriously disturbed by the wake of this wind turbine divided into the same area. The schematic diagram is shown in Figure 13.
First, obtain the wind direction, wd, coordinates of all wind turbines ( x ( i ) ,   y ( i ) ) ;
Second, rotate the coordinates of all wind turbines according to the wind direction w d according to Equation (18) and obtain the new coordinates of the wind turbines ( x _ w d ( i ) ,   y _ w d ( i ) ) ,
x w d ( i ) y w d ( i ) = c o s ( w d ) s i n ( w d ) s i n ( w d ) c o s ( w d ) x ( i ) y ( i )
Third, select the wind turbine with the smallest x coordinate value and name it R 1 _ T 1 , R 1 represents the first area and R 1 _ T 1 represents the first wind turbine in the first region. Look for the wind turbine with less x w d , y w d is the y coordinate of the wind turbine. If x w d x w d R 1 _ T 1 4 R 2 + y w d y w d R 1 _ T 1 R is satisfied, it is determined that the wind turbine is affected by the wake interference of R 1 _ T 1 , where, x w d R 1 _ T 1 , y w d R 1 _ T 1 is the x coordinate of R 1 _ T 1 , R = 63   m . If yes, name the wind turbine R 1 _ T 2 , and if no, name it R 2 _ T 1 . In the same way, find the wind turbines with lower x _ w d order again to determine whether they are interfered with by R 1 _ T 1 and R 1 _ T 2 (or R 2 _ T 1 ) , and name them, according to the naming rules, until all the wind turbines are named and the partition is completed, all partitions are named: R 1 ,   R 2     R k   ( k n ) .
Fourth, the wind turbine in the same area is considered an optimization target and Equation (7) is used to find the optimal.
This method is based on the assumption that each area does not interfere with each other.

4.1.2. Control Model of Semisubmersible Floating Wind Turbine

For a semisubmersible floating wind turbine, a control-oriented four-input and two-output four-order incremental state space expression is established as follows:
x ˙ = A x + B u y = C x + D u
State variable x = ω r ,   ω g ,   β ,   γ ,   T T , which are rotor speed, generator speed, pitch angle, yaw angle, and generator torque; control input u = β c ,   γ c ,   T c ,   v ,   H T , which are, respectively, the controlled pitch angle, the controlled yaw angle, the controlled generator torque, the wind speed of each wind turbine, and the wave height of each wind turbine; y = P T , P is generator power.
A ,   B ,   C ,   D in Formula (9) are obtained by linearizing the NREL, semisubmersible floating wind turbine nonlinear model:
ω ˙ r = 1 J r [ K T ω ω r B d ( ω r ω g N g ) + K T β β + K T γ γ + K T v v + K T H H ]
ω ˙ g = 1 J g [ T + K g B d ( ω r ω g N g ) ]
β ˙ = ( β c β ) / τ β
γ ˙ = ( γ c γ ) / τ γ
T ˙ = T c T / τ g
P = ŋ ω g T
where the rotor torque of inertia J r = 5.34 · 10 6   k g · m 2 , the generator torque of inertia J g = 534   k g · m 2 , the gearbox growth ratio N g = 97 , the drive shaft damping coefficient B d = 6.215 × 10 6   k g · m 2 / ( r a d · s ) , K T ω ,   K T β ,   K T γ ,   K T v ,   K T H ,   K g , ε t ,   K M ,   K B is the identification parameter, τ β is the inertia time constant of variable pitch, τ γ is the yaw inertia time constant, τ g is the generator torque inertia time constant, and the power generation efficiency ŋ = 0.944 .

4.1.3. MPC Controller for Wind Turbine
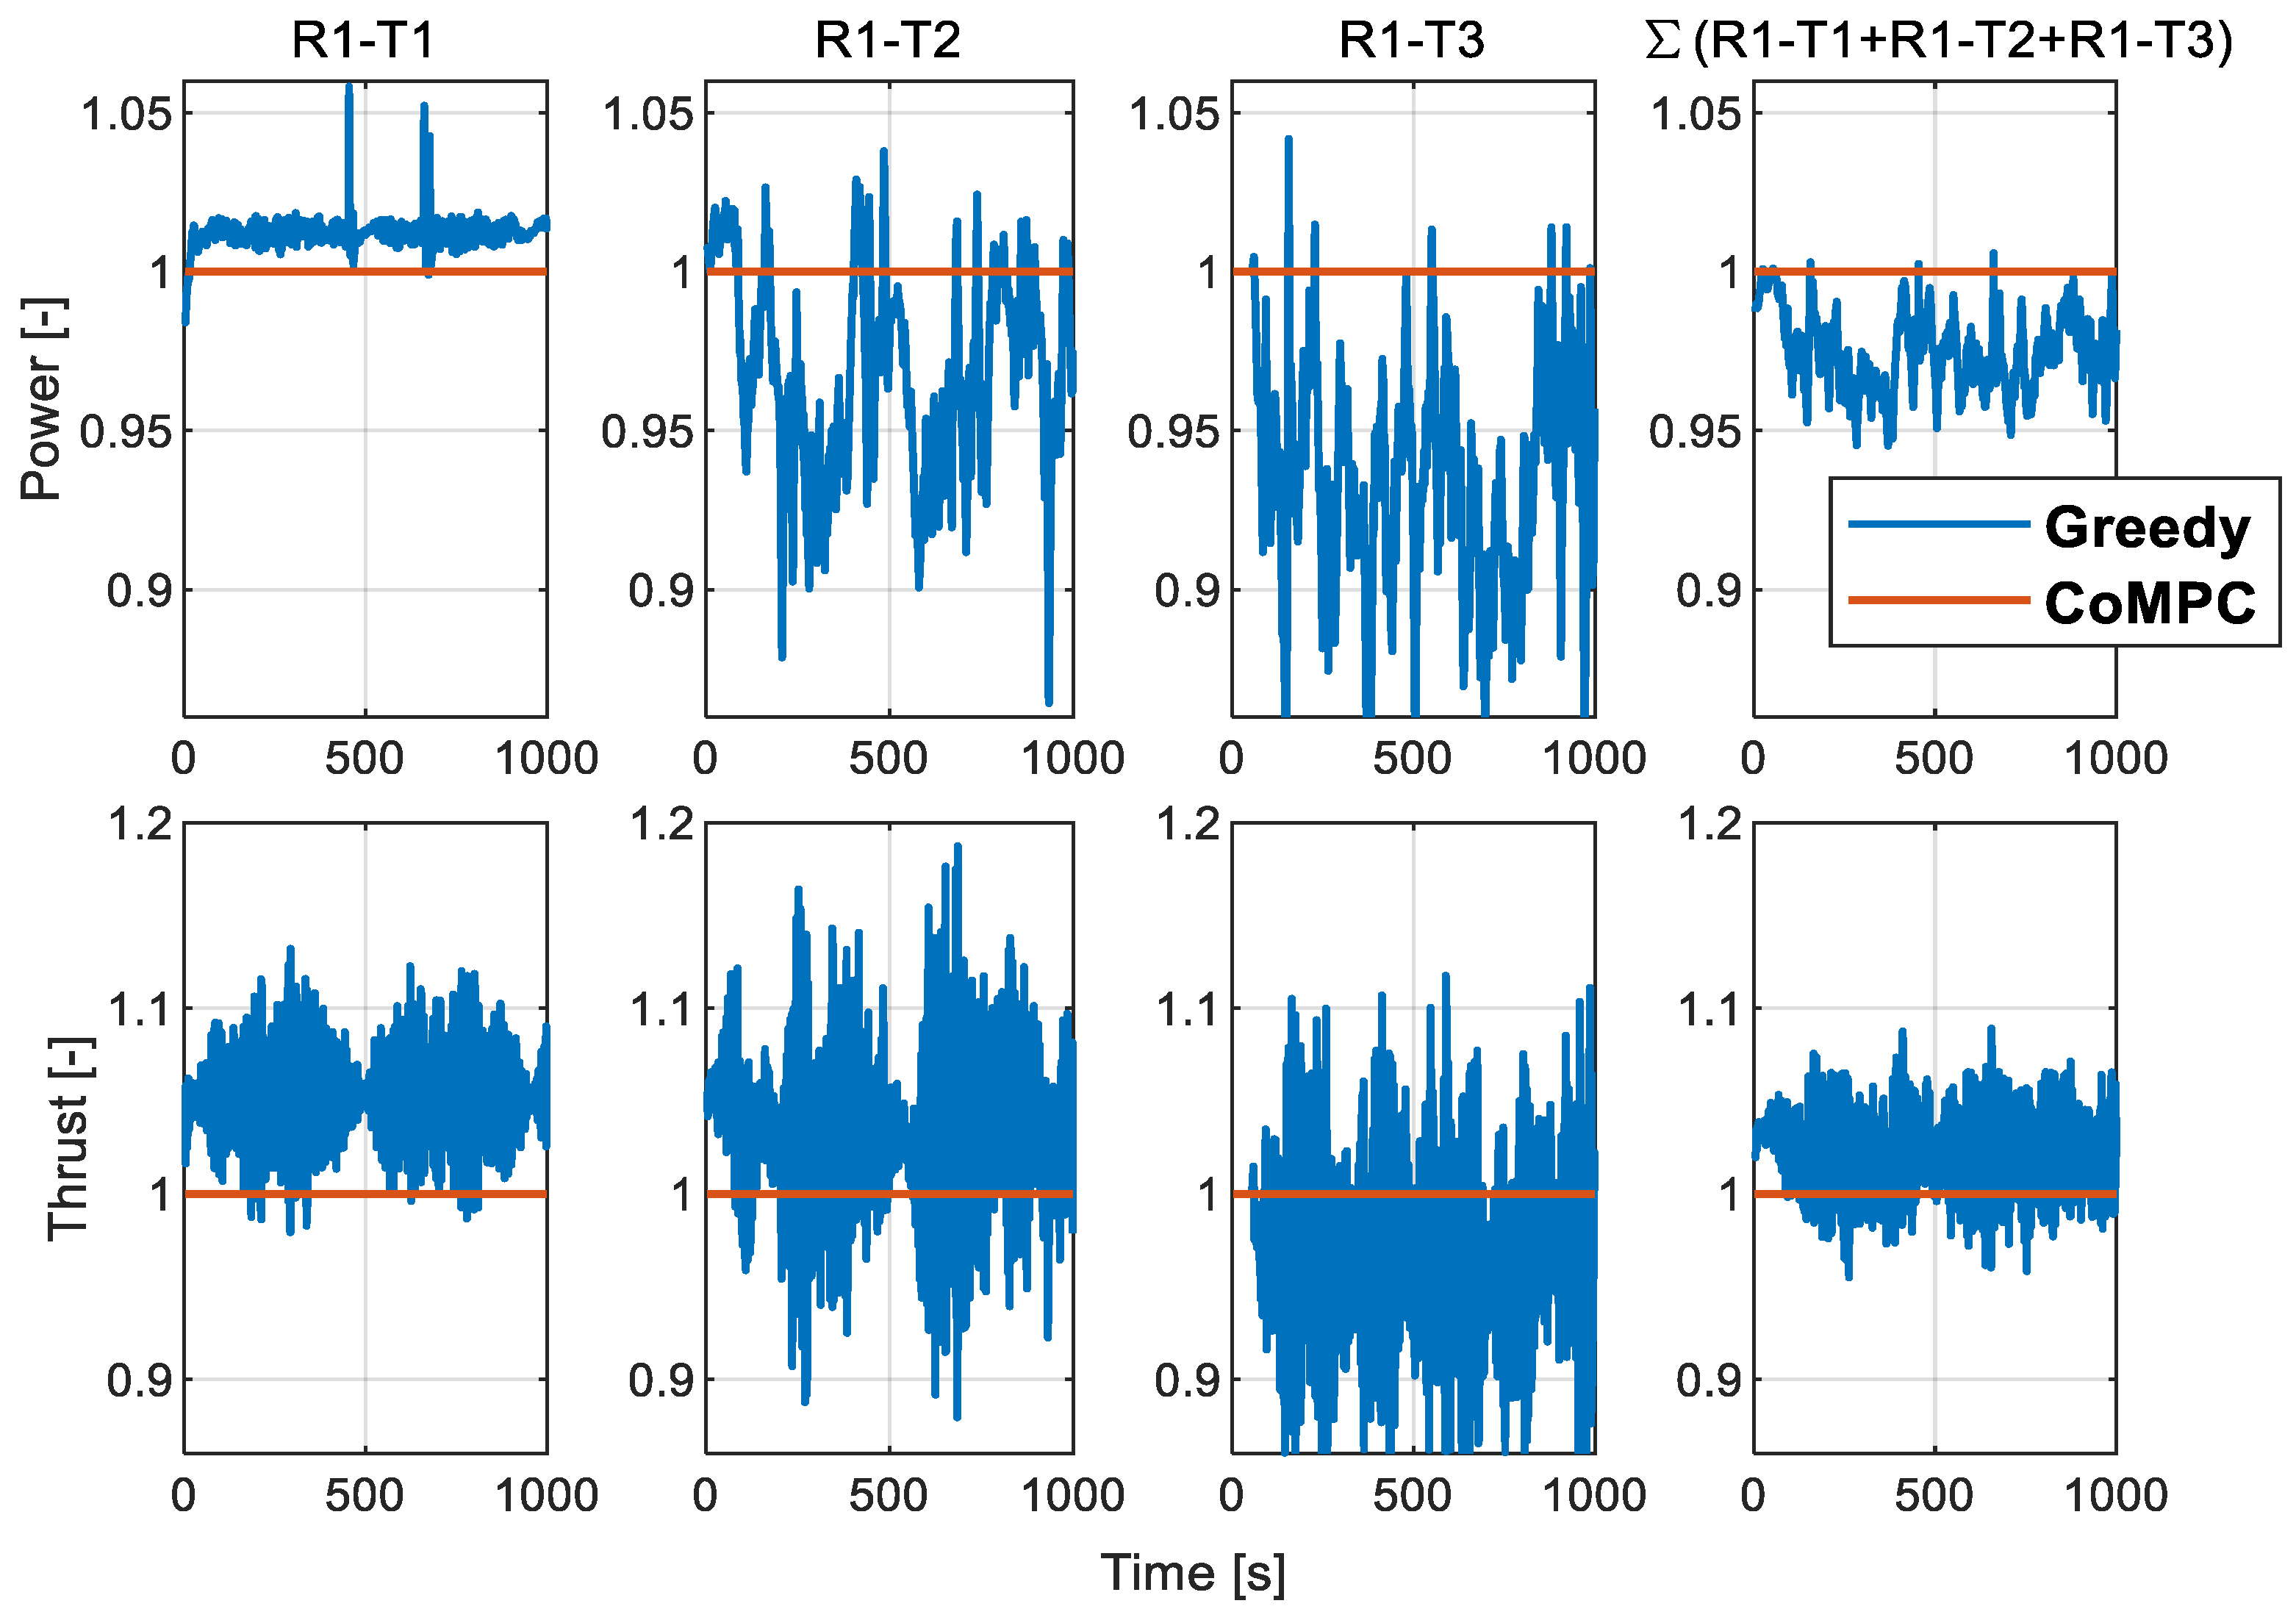
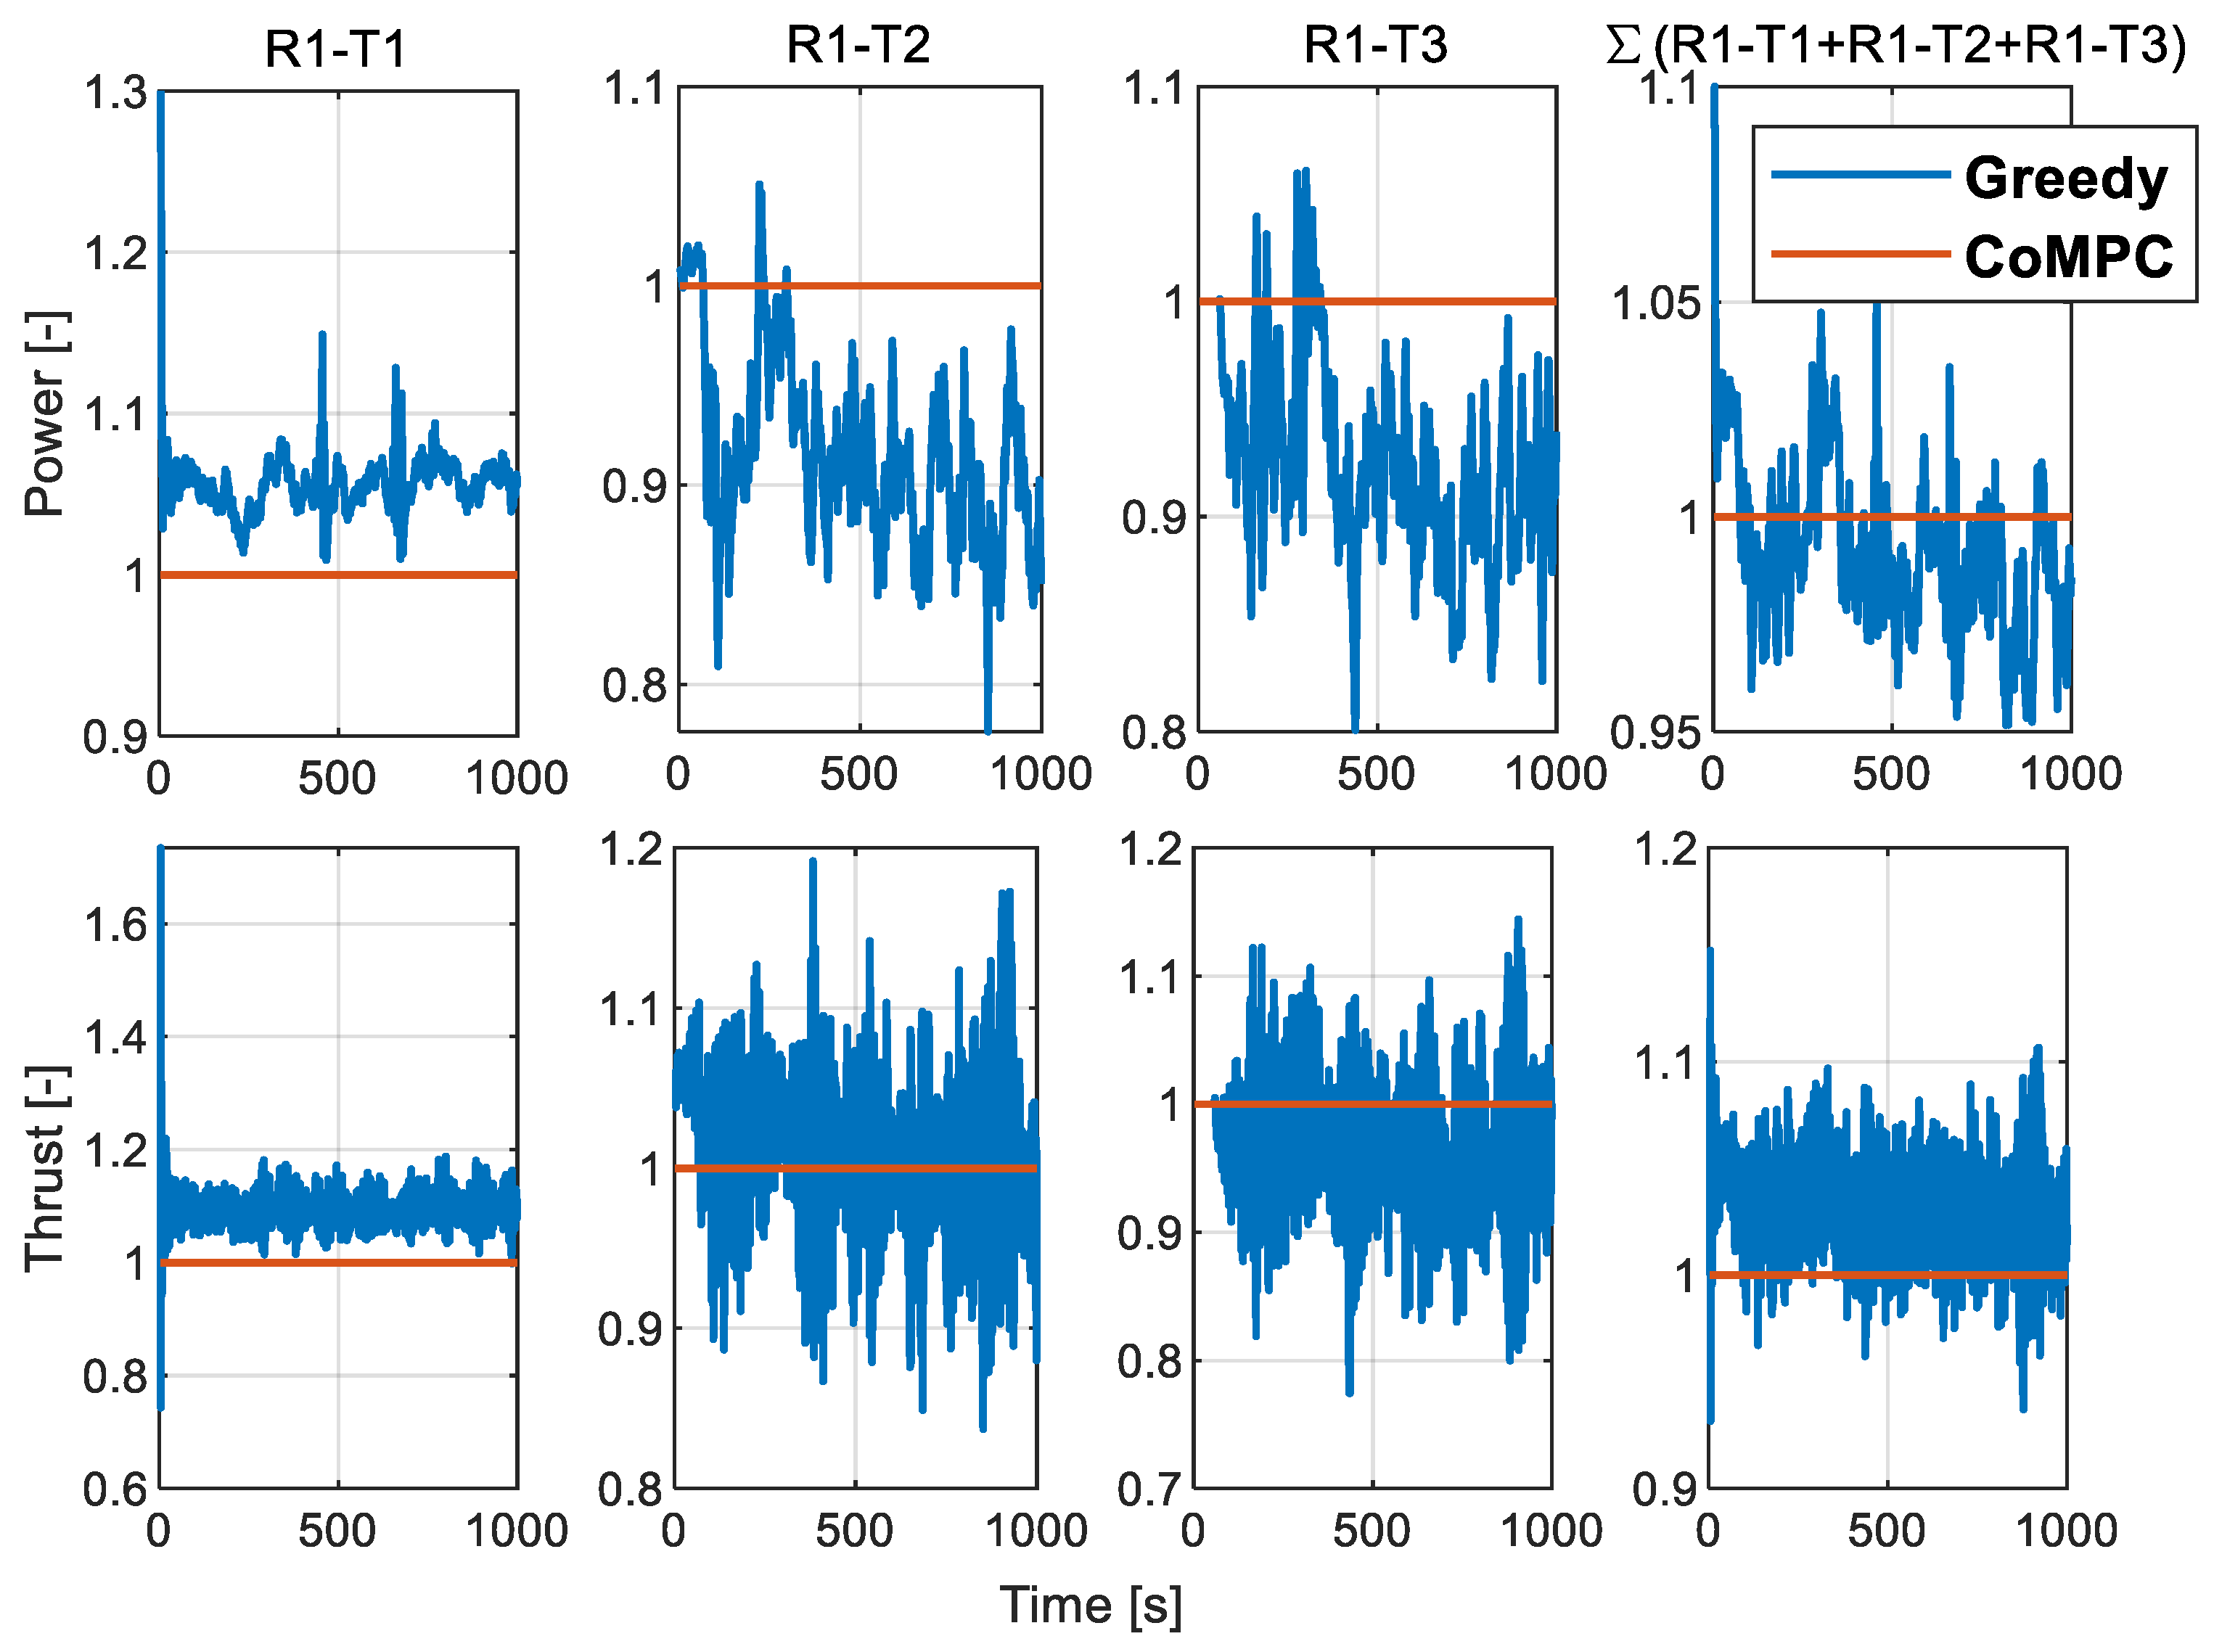
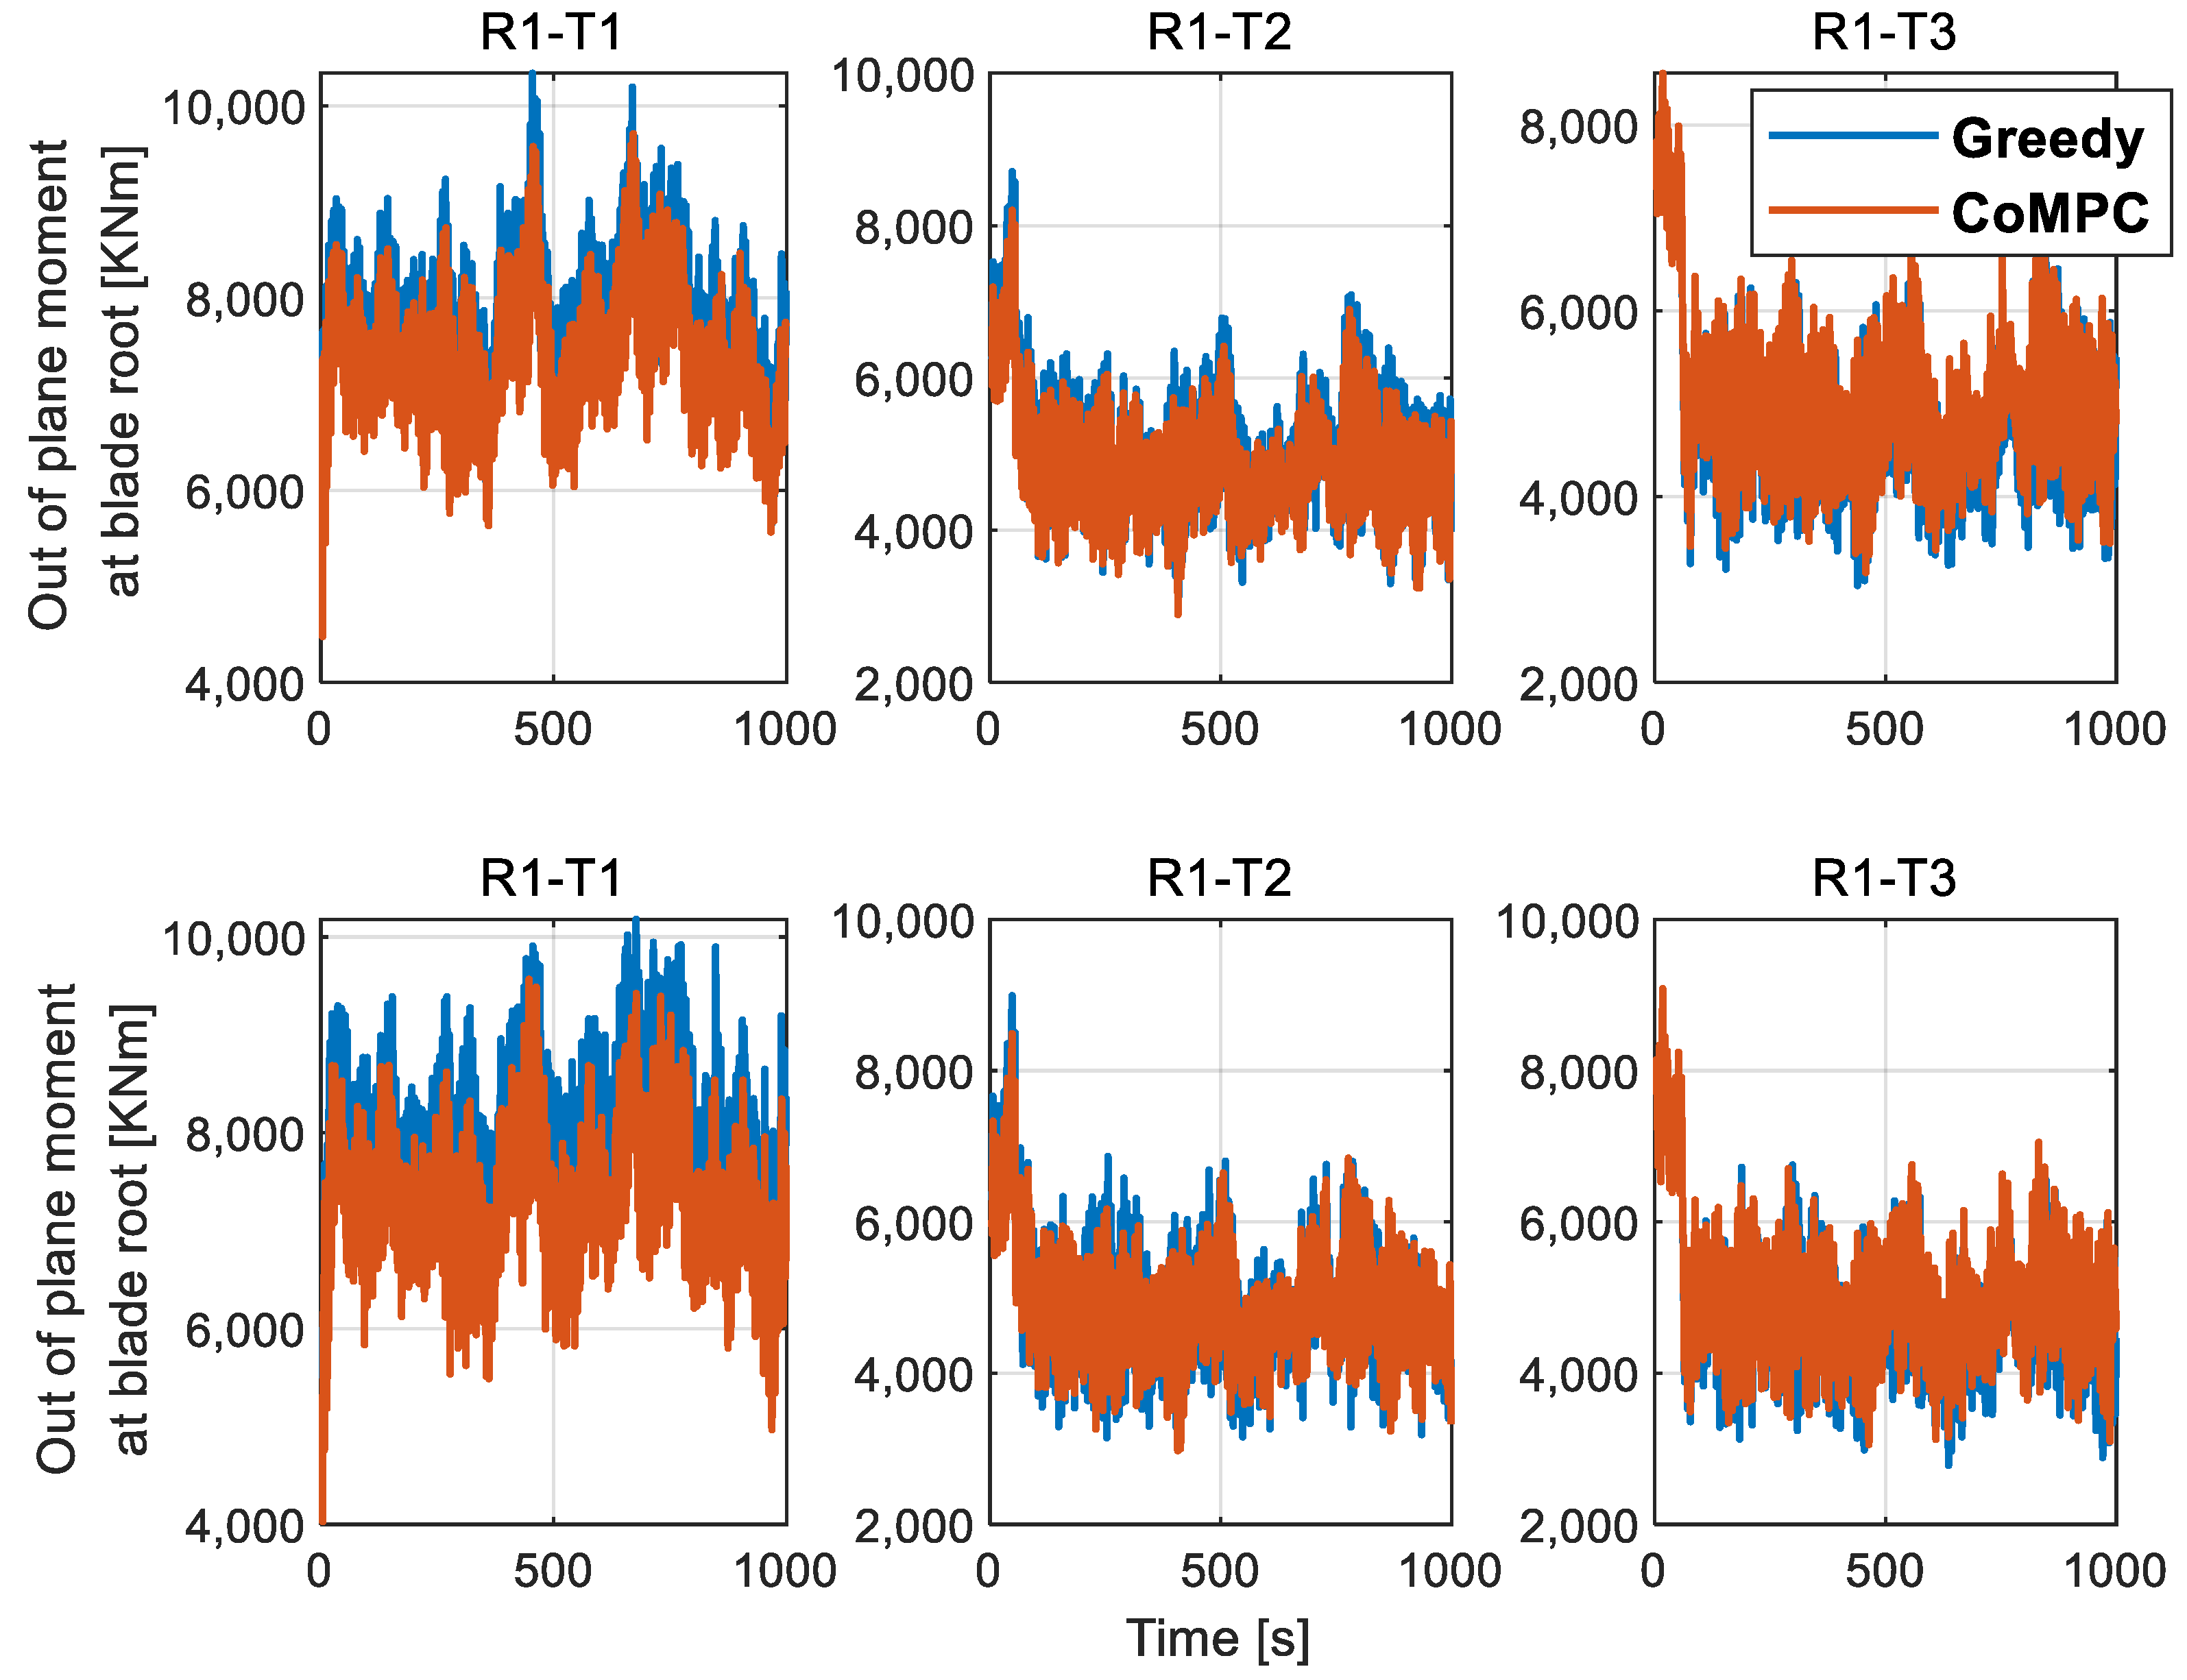
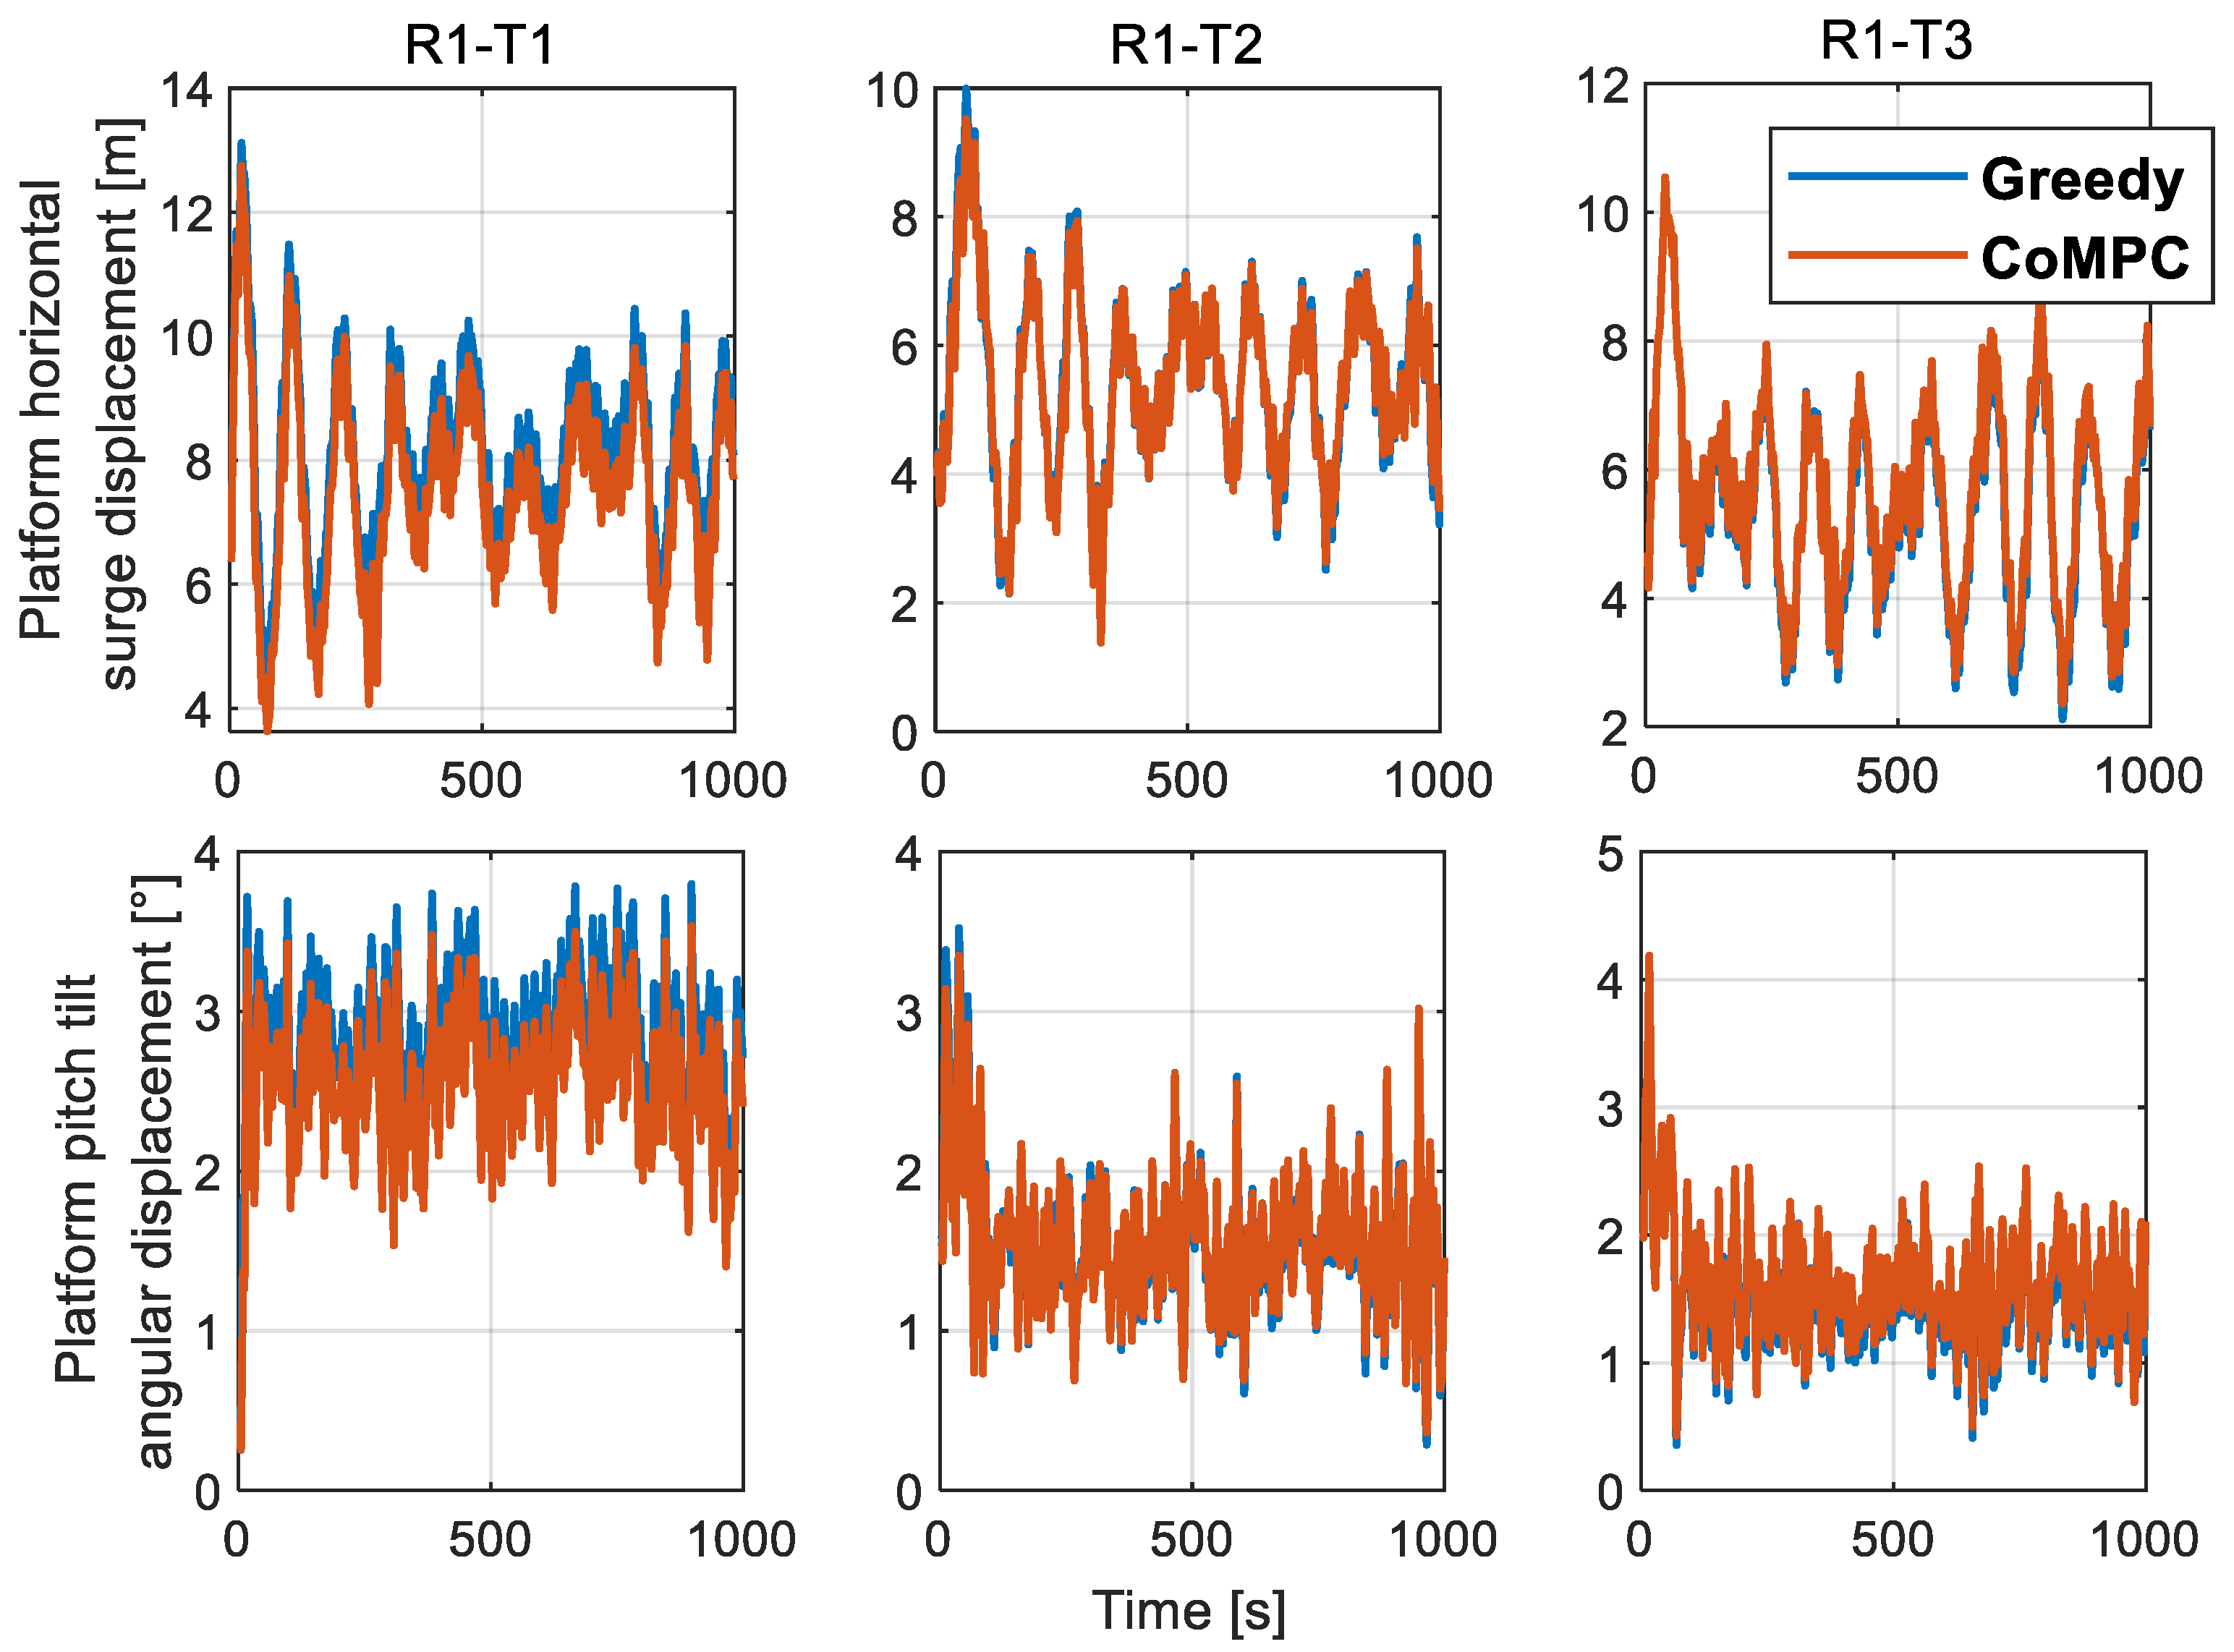
After discretizing Equation (19), Equation (16) is obtained.
x k + 1 = A k x k + B k u k
where A k and B k are obtained by discretization of the state. References to state variables are as follows:
x r e f = m a x ( ω r , m i n ,   m i n ( ω r , r e f ,   ω r , n o m ) ) m a x ( ω g , m i n ,   m i n ( ω g , r e f ,   ω g , n o m ) ) β r e f γ r e f m i n ( T m a x ,   P n o m ŋ ω g , 0 )
where the minimum of rotor speed ω r , m i n = 0.723   r a d / s , the nominal rotor speed ω r , n o m = 1.267   r a d / s , the minimum of generator speed ω g , m i n = ω r , m i n N g , the nominal generator speed ω g , n o m = ω r , n o m N g , the maximum of generator torque T m a x = 47 , 403   N m , and the nominal generator power P n o m = 5   M W , ω g , 0 is the generator speed measurement during state equilibrium, which means x ˙ = 0 .
The goal of MPC in this paper is to minimize the deviation between the predicted state and the reference value, and to avoid frequent action of the controller and reduce the mechanical load of the unit. Therefore, the value function of the optimization problem can be described as follows:
J = m i n k = k 0 k 0 + N P 1 x ~ T k Q c x ~ k + u c ^ T k R c u c ^ k + x T k 0 + N P P c x k 0 + N P
where, x ~ = x ( k ) x r e f , u c ^ = u c ( k ) u c m , u c 0 is the measurement of control inputs during state equilibrium. Q c and R c are weight. With dynamic state space equation constraints:
x ~ k + 1 = A k x ~ k + B c k u c ^ k
where control input u c ^ = [ γ ^ c ,   β ^ c ,   T ^ c ] T , the constraints of u c ^ are as follows:
if   ω g < ω g , n o m , u ^ m i n = m a x ( γ 0 ,   γ r a t e ) m a x ( β 0 ,   β r a t e ) m a x ( T 0 ,   T r a t e ) ,   u ^ m a x = m a x ( γ 0 ,   γ r a t e ) m a x ( β 0 ,   β r a t e ) m i n ( T m a x T 0 ,   P n o m ŋ ω g , 0 T 0 ,   T r a t e )
if   ω g ω g , n o m , u ^ m i n = m a x ( γ 0 ,   γ r a t e ) m a x ( β 0 ,   β r a t e ) m i n ( T m a x T 0 ,   P n o m ŋ ω g , 0 T 0 ,   T r a t e ) u ^ m a x m i n ( γ m a x γ m ,   γ r a t e ) m i n ( β m a x β m ,   β r a t e ) m i n ( T m a x T 0 ,   P n o m ŋ ω g , 0 T 0 ,   T r a t e )
where γ 0 is the yaw angle measurement of control inputs during state equilibrium, yaw rate γ r a t e = 0.3 ° / s , maximum yaw angle γ m a x = 45 ° ; β 0 is the pitch angle measurement of control inputs during state equilibrium, pitch rate β r a t e = 8 ° / s , maximum pitch angle β m a x = 90 ° ; T 0 is the yaw angle measurement of control inputs during state equilibrium, generator torque rate T r a t e = 15,000   N m / s , maximum generator torque T m a x = 40,000   N m .

4.2. Result

Taking the wind farm layout in Figure 13 as an example, the wind direction is shown in the x-axis direction, the wind farm is divided into three zones, assuming that each zone does not affect the others. The optimization effect of region 1 proves the optimization performance of CoMPC for wind farms. The x-axial spacing of each wind turbine in region 1 is 5D, and the y-axis direction has no spacing (in addition to the displacement changes caused by the movement of the wind turbine).
According to the wind-condition characteristics of an offshore wind farm, the simulated v is 10 m/s, TI is 6%, Kv is 0.13, and the wave height (WH) are 1.2 and 3 m, respectively, with Gaussian white noise. Wind-speed changes and WH changes are shown in Figure 14.
The Greedy algorithm means no collaboration between wind turbines; each wind turbine is in the optimal power generation operation state. The following results are compared with the Greedy algorithm. As shown in Figure 15 and Figure 16, the total power controlled by CoMPC is higher than that controlled by Greedy, the total thrust is also lower. According to statistical calculations, when the WH is 1.2 m, the average power is increased by about 2.5% and the average load is reduced by about 4%. At a WH of 3 m, the average power is increased is about 2.1% and the average load decreased is about 4.5%.
As shown in Figure 17, under CoMPC control, the out-of-plane moment at the blade root of R1-T1 and R1-T2 wind turbine decreases compared with the Greedy control. In contrast, under CoMPC control, the power capture of the R1-T3 wind turbine increases, and the corresponding out-of-plane moment at the blade root increases, but very little.
The movement of the semisubmersible floating wind turbine platform is an important criterion for evaluating wind-turbine operation. As shown in Figure 18 and Figure 19, under the control of CoMPC, the surge displacement and pitch tilt angular displacement of the R1-T1 wind turbine are large and significantly reduced. In contrast, the R1-T3 wind turbine still increases slightly due to the increase in power capture, but the motion range is still small.
According to the above simulations, the following conclusions can be drawn: under the conditions of two groups of different wave heights, there is no significant difference in the optimization effect of CoMPC and it is temporarily considered that the wave height has no effect on this method.

5. Conclusions

In this paper, a method to mitigate wake interference is studied. The upwind wind turbine with a CYMP method is used to optimize the fatigue load caused by wake steering and increase the total power. The paper starts with the influence of a CYMP control on the distribution characteristics of the flow field. It analyses the control principle of CYMP, which has not been paid attention to in previous papers, and the feasibility of the CYMP method to reduce wake disturbance is proven by simulation. Several case studies show that the CYMP method can reduce the fatigue load by 10.29% and increase the total power by 1.7%, compared with only wake steering.
A proper combination of yaw and pitch angles is critical to reduce fatigue loads and increase overall power, which is a critical part of making the CYMP method work. In order to make better use of the CYMP method in a dynamic wind farm, this paper proposes a CYMP-based CoMPC. The concept of the super controller is used to calculate the optimal control action of each wind turbine in the cooperative state online, which is used as a reference for each MPC controller, so as to achieve the purpose of wind-farm coordination. Furthermore, a novel wake-partitioning method is proposed in the study to address the high dimensionality of the optimization objective. Although the steady-state model is adopted for the wake calculation, the supercontroller continuously adjusts the optimal value according to the periodic feedback to adapt to the dynamic changes of the wake. The simulation results show that at a turbulent wind speed of 10 m/s, the CoMPC method control can increase the average power by more than 2%, reduce the average load by more than 4% compared with the greedy control, and the wave height has no effect on CoMPC. This result shows that CoMPC is promising.

Author Contributions

Conceptualization, L.Z. and Y.G.; Methodology, L.Z.; Formal analysis, L.Z.; writing—original draft preparation, L.Z.; Writing-review and editing, F.G., B.Z. and Y.X.; Visualization, J.W. and L.X.; Data curation, Y.X.; Funding acquisition, Y.X. All authors have read and agreed to the published version of the manuscript.

Funding

This work was supported by the Offshore Wind Power Intelligent Measurement and Control Research Centre and Laboratory Construction at the Ocean University of China grant number 861901013159, and Shandong Provincial Natural Science Foundation, grant number ZR2021ZD23.

Institutional Review Board Statement

Not applicable.

Informed Consent Statement

Not applicable.

Data Availability Statement

All research data can be obtained from [email protected].

Acknowledgments

The author is very grateful to China Electric Power Research Institute for its support in parameters of the wind farm.

Conflicts of Interest

The authors declare that they have no known competing financial interests or personal relationships that could have appeared to influence the work reported in this paper.

References

  1. Global Wind Energy Council. Global Wind Report 2021. 2020. Available online: https://gwec.net/wp-content/uploads/2021/03/GWEC-Global-Wind-Report-2021.pdf (accessed on 12 May 2023).
  2. Global Wind Energy Council. Global Wind Report 2022. 2021. Available online: https://gwec.net/wp-content/uploads/2022/03/GWEC-GLOBAL-WIND-REPORT-2022.pdf (accessed on 12 May 2023).
  3. Xue, L.; Wang, J.; Zhao, L.; Wei, Z.; Yu, M.; Xue, Y. Wake Interactions of Two Tandem Semisubmersible Floating Offshore Wind Turbines Based on FAST.Farm. J. Mar. Sci. Eng. 2022, 10, 1962. [Google Scholar] [CrossRef]
  4. Nilsson, K.; Ivanell, S.; Hansen, K.S.; Mikkelsen, R.; Sørensen, J.N.; Breton, S.P.; Henningson, D. Large-eddy simulations of the Lillgrund wind farm. Wind Energy 2015, 18, 449–467. [Google Scholar] [CrossRef]
  5. Lissaman, P. Energy effectiveness of arbitrary arrays of wind turbines. J. Energy 1979, 3, 323–328. [Google Scholar] [CrossRef]
  6. Andersson, L.E.; Anaya-Lara, O.; Tande, J.O.G.; Merz, K.O.; Imsland, L.S. Wind farm control—Part I: A review on control system concepts and structures. IET Renew. Power Gener. 2021, 15, 2085–2108. [Google Scholar] [CrossRef]
  7. Zhao, L.; Xue, L.; Li, Z.; Wang, J.; Yang, Z.; Xue, Y. Progress on Offshore Wind Farm Dynamic Wake Management for Energy. J. Mar. Sci. Eng. 2022, 10, 1395. [Google Scholar] [CrossRef]
  8. Zhao, L.; Gong, F.; Chen, S.; Wang, J.; Xue, L.; Xue, Y. Optimization study of control strategy for combined multi-wind turbines energy production and loads during wake effects. Energy Rep. 2022, 8, 1098–1107. [Google Scholar] [CrossRef]
  9. Speakman, G.A.; Abkar, M.; Martínez-Tossas, L.A.; Bastankhah, M. Wake steering of multi-rotor wind turbines: A new wind farm control strategy. arXiv 2020, arXiv:2006.11874. [Google Scholar]
  10. Dou, B.; Guala, M.; Lei, L.; Zeng, P. Experimental investigation of the performance and wake effect of a small-scale wind turbine in a wind tunnel. Energy 2019, 166, 819–833. [Google Scholar] [CrossRef]
  11. Bastankhah, M.; Shapiro, C.R.; Shamsoddin, S.; Gayme, D.F.; Meneveau, C. A vortex sheet based analytical model of the curled wake behind yawed wind turbines. J. Fluid Mech. 2022, 933, A2. [Google Scholar] [CrossRef]
  12. Mohammadi, M.; Bastankhah, M.; Fleming, P.; Churchfield, M.; Bossanyi, E.; Landberg, L.; Ruisi, R. Curled-Skewed Wakes behind Yawed Wind Turbines Subject to Veered Inflow. Energies 2022, 15, 9135. [Google Scholar] [CrossRef]
  13. Archer, C.L.; Vasel-Be-Hagh, A. Wake steering via yaw control in multi-turbine wind farms: Recommendations based on large-eddy simulation. Sustain. Energy Technol. Assess. 2019, 33, 34–43. [Google Scholar] [CrossRef]
  14. Adaramola, M.; Krogstad, P.-Å. Experimental investigation of wake effects on wind turbine performance. Renew. Energy 2011, 36, 2078–2086. [Google Scholar] [CrossRef]
  15. Campagnolo, F.; Petrović, V.; Schreiber, J.; Nanos, E.M.; Croce, A.; Bottasso, C.L. Wind tunnel testing of a closed-loop wake deflection controller for wind farm power maximization. J. Phys. Conf. Ser. 2016, 753, 032006. [Google Scholar] [CrossRef] [Green Version]
  16. Howland, M.F.; Lele, S.K.; Dabiri, J.O. Wind farm power optimization through wake steering. Proc. Natl. Acad. Sci. USA 2019, 116, 14495–14500. [Google Scholar] [CrossRef] [PubMed] [Green Version]
  17. Schreiber, J.; Salbert, B.; Bottasso, C. Study of wind farm control potential based on SCADA data. J. Phys. Conf. Ser. 2018, 1037, 032012. [Google Scholar] [CrossRef]
  18. Lin, M.; Porté-Agel, F. Power maximization and fatigue-load mitigation in a wind-turbine array by active yaw control: An LES study. J. Phys. Conf. Ser. 2020, 1618, 042036. [Google Scholar] [CrossRef]
  19. Churchfield, M.J.; Fleming, P.; Bulder, B.; White, S.M. Wind turbine wake-redirection control at the Fishermen’s Atlantic City windfarm. In Proceedings of the Offshore Technology Conference, Houston, TX, USA, 4–7 May 2015. [Google Scholar]
  20. Dilip, D.; Porté-Agel, F. Wind turbine wake mitigation through blade pitch offset. Energies 2017, 10, 757. [Google Scholar] [CrossRef]
  21. Lee, J.; Son, E.; Hwang, B.; Lee, S. Blade pitch angle control for aerodynamic performance optimization of a wind farm. Renew. Energy 2013, 54, 124–130. [Google Scholar] [CrossRef]
  22. Behnood, A.; Gharavi, H.; Vahidi, B.; Riahy, G. Optimal output power of not properly designed wind farms, considering wake effects. Int. J. Electr. Power Energy Syst. 2014, 63, 44–50. [Google Scholar] [CrossRef]
  23. Navarrete, E.C.; Perea, M.T.; Correa, J.J.; Serrano, R.C.; Moreno, G.R. Expert control systems implemented in a pitch control of wind turbine: A review. IEEE Access 2019, 7, 13241–13259. [Google Scholar] [CrossRef]
  24. Tian, J.; Zhou, D.; Su, C.; Blaabjerg, F.; Chen, Z. Optimal control to increase energy production of wind farm considering wake effect and lifetime estimation. Appl. Sci. 2017, 7, 65. [Google Scholar] [CrossRef] [Green Version]
  25. Corten, G.; Schaak, P. Heat and Flux. Increase of Wind Farm Production by Reduction of the Axial Induction. In Proceedings of the European Wind Energy Conference, Madrid, Spain, 16–19 June 2003. [Google Scholar]
  26. Bartl, J.; Sætran, L. Experimental testing of axial induction based control strategies for wake control and wind farm optimization. J. Phys. Conf. Ser. 2016, 753, 032035. [Google Scholar] [CrossRef]
  27. Campagnolo, F.; Petrović, V.; Bottasso, C.L.; Croce, A. Wind tunnel testing of wake control strategies. In Proceedings of the 2016 American Control Conference (ACC), Boston, MA, USA, 6–8 July 2016; pp. 513–518. [Google Scholar]
  28. Kim, H.; Kim, K.; Paek, I. Model based open-loop wind farm control using active power for power increase and load reduction. Appl. Sci. 2017, 7, 1068. [Google Scholar] [CrossRef] [Green Version]
  29. McTavish, S.; Feszty, D.; Nitzsche, F. Evaluating Reynolds number effects in small-scale wind turbine experiments. J. Wind Eng. Ind. Aerodyn. 2013, 120, 81–90. [Google Scholar] [CrossRef]
  30. Annoni, J.; Gebraad, P.M.; Scholbrock, A.K.; Fleming, P.A.; Van Wingerden, J.W. Analysis of axial-induction-based wind plant control using an engineering and a high-order wind plant model. Wind Energy 2016, 19, 1135–1150. [Google Scholar] [CrossRef]
  31. Ha, K.; Truong, H.V.A.; Dang, T.D.; Ahn, K.K. Recent control technologies for floating offshore wind energy system: A review. Int. J. Precis. Eng. Manuf.-Green Technol. 2021, 8, 281–301. [Google Scholar] [CrossRef]
  32. Ishihara, T.; Qian, G.-W. A new Gaussian-based analytical wake model for wind turbines considering ambient turbulence intensities and thrust coefficient effects. J. Wind Eng. Ind. Aerodyn. 2018, 177, 275–292. [Google Scholar] [CrossRef]
  33. Smith, S.D. Thrust-anemometer measurements of wind turbulence, Reynolds stress, and drag coefficient over the sea. J. Geophys. Res. 1970, 75, 6758–6770. [Google Scholar] [CrossRef]
  34. Bossanyi, E. Combining induction control and wake steering for wind farm energy and fatigue loads optimisation. J. Phys. Conf. Ser. 2018, 1037, 032011. [Google Scholar] [CrossRef] [Green Version]
  35. Ainslie, J.F. Calculating the flowfield in the wake of wind turbines. J. Wind Eng. Ind. Aerodyn. 1988, 27, 213–224. [Google Scholar] [CrossRef]
  36. Medici, D. Experimental Studies of Wind Turbine Wakes: Power Optimisation and Meandering. KTH. 2005. Available online: https://www.diva-portal.org/smash/get/diva2:14563/FULLTEXT01.pdfPower (accessed on 12 May 2023).
  37. Bianchi, F.D.; De Battista, H.; Mantz, R.J. Wind Turbine Control Systems: Principles, Modelling and Gain Scheduling Design; Springer: Berlin/Heidelberg, Germany, 2007; Volume 19. [Google Scholar]
  38. Gebraad, P.M.; Teeuwisse, F.; Van Wingerden, J.; Fleming, P.A.; Ruben, S.; Marden, J.; Pao, L. Wind plant power optimization through yaw control using a parametric model for wake effects—A CFD simulation study. Wind Energy 2016, 19, 95–114. [Google Scholar] [CrossRef]
  39. Kragh, K.A.; Hansen, M.H. Load alleviation of wind turbines by yaw misalignment. Wind Energy 2014, 17, 971–982. [Google Scholar] [CrossRef]
  40. Jensen, N.O. A Note on Wind Generator Interaction; Risø National Laboratory: Roskilde, Denmark, 1983. [Google Scholar]
  41. Katic, I.; Højstrup, J.; Jensen, N.O. A simple model for cluster efficiency. In Proceedings of the European Wind Energy Association Conference and Exhibition, Rome, Italy, 7–9 October 1986; pp. 407–410. [Google Scholar]
  42. Jiménez, Á.; Crespo, A.; Migoya, E. Application of a LES technique to characterize the wake deflection of a wind turbine in yaw. Wind Energy 2010, 13, 559–572. [Google Scholar] [CrossRef]
Figure 1. Wake interference diagram: (a) Free stream state; (b) CYMP operation of the upwind wind turbine.
Jmse 11 01288 g001
Figure 2. Layout and visualization of two fans, wind turbine spacing x/D = 5 in the wind direction.
Jmse 11 01288 g002
Figure 3. Explicit boundary conditions schematic.
Jmse 11 01288 g003
Figure 4. Instantaneous flow velocity visualization on YZ planes downstream from WT1. Note: Red circles indicate a rotor located directly downwind of the turbine. The colour bar indicates the wind velocity corresponding to the different colours in the figures. γ = 20 ° means the control with yaw error angle of 20°; γ = 20 ° ,   β = 0.8 ° means the CYMP with yaw error of 20° and pitch angle of 0.8 ° .
Jmse 11 01288 g004
Figure 5. Wake centre-line offset on the y-axis (left) and z-axis (right). Note: The red line means control with γ = 20 ° ; The yellow line means the combination control with γ = 20 ° ,   β = 0.8 ° .
Jmse 11 01288 g005
Figure 6. Spanwise profiles of the velocity deficit at the hub height for the incoming flow. Note: The red line means control with γ = 20 ° ; The yellow line means the combination control with γ = 20 ° ,   β = 0.8 ° .
Jmse 11 01288 g006
Figure 7. Spanwise profiles of the turbulence intensity for the inflow wind. Note: The red line means control with γ = 20 ° ; The yellow line means the combination control with γ = 20 ° ,   β = 0.8 ° .
Jmse 11 01288 g007
Figure 8. Wind speed variation (left) and PDF (right) in the hub centre of WT2. Note: PDF is an abbreviation for probability density function, which represents the probability distribution of wind speed. The red line means control with γ = 20°; The yellow line means the combination control with γ = 20°, β = 0.8°.
Jmse 11 01288 g008
Figure 9. Rotor speed variation (left) and PDF (right) of WT2. Note: PDF is an abbreviation for probability density function, which represents the probability distribution of wind speed. The red line means control with γ = 20 ° ; The yellow line means the combination control with γ = 20 ° ,   β = 0.8 ° .
Jmse 11 01288 g009
Figure 10. Effect on fatigue load of turbines with the CYMP control method in wake interference conditions. Note: Normalized by the fatigue load of WT1 with no yaw and no pitch.
Jmse 11 01288 g010
Figure 11. The total power of two wind turbines under the CYMP method. Note: The total power is normalized by the total power with no yaw and pitch. It is worth noting that the dynamic wake model in FAST.Farm does not capture the effect of the atmospheric boundary layer; however, the pitch-angle settings need to be considered in the specific atmospheric condition [3,29], so the results are biased in this paper. Although the pitch-angle setting deviates from the actual optimization effect, it is enough to prove that this method can potentially optimize the wake effect.
Jmse 11 01288 g011
Figure 12. Framework of the CoMPC.
Jmse 11 01288 g012
Figure 13. Partition diagram of wind-farm wake. Note: Each red rectangle represents one wake disturbance area.
Jmse 11 01288 g013
Figure 14. Wind speed and wave elevation vary with time in the simulation. The left picture is wind speed and the right is wave elevation.
Jmse 11 01288 g014
Figure 15. WH = 1.2 m, power and thrust of each wind turbine and total under different controls. Note: Power is on the top row, thrust is on the bottom row, the first three columns are for each fan, and the last column is the sum of the three wind turbines.
Jmse 11 01288 g015
Figure 16. WH = 3 m, power and thrust of each wind turbine and total under different controls. Note: Power is on the top row, thrust is on the bottom row, the first three columns are for each fan, and the last column is the sum of the three wind turbines.
Jmse 11 01288 g016
Figure 17. Out-of-plane moment at blade root under different controls. In (top) row, WH = 1.2 m, In (bottom) row, WH = 3 m.
Jmse 11 01288 g017
Figure 18. WH = 1.2 m, platform movement. The top row shows platform horizontal surge displacement, the bottom row shows pitch tilt angular displacement.
Jmse 11 01288 g018
Figure 19. WH = 3 m, platform movement under different controls. Note: The top row shows platform horizontal surge displacement, the bottom row shows pitch tilt angular displacement.
Jmse 11 01288 g019
Table 1. Turbine parameters.
ParameterValue
Rated power (MW)5
Blades number (−)3
Cut-in, cut-out, rated wind speed (m/s)3, 25, 11.4
Cut-in, rated rotor speed (rpm)6.9, 12.1
Hub height (m)90
Rotor diameter (m)126
Table 2. Simulation of wind parameters.
ParameterValue
Turbulence intensity (−)6%
Average wind speed (m/s)7.5
Turbulence modelKaimal model
Wind shear [−]0.13
Table 3. Simulation cases.
Method NameYaw Misalignment [°]Pitch Angle [°]
entry 15/10/15/20/
25/30/35/40
0
entry 250.2/0.4/0.6/0.8/1.0
10
15
20
25
30
35
40
Disclaimer/Publisher’s Note: The statements, opinions and data contained in all publications are solely those of the individual author(s) and contributor(s) and not of MDPI and/or the editor(s). MDPI and/or the editor(s) disclaim responsibility for any injury to people or property resulting from any ideas, methods, instructions or products referred to in the content.

