Article

Assessing Nutrient Limitation in Yeongsan River Estuary Using Bioassay Experiments

1
Marine Biotechnology & Bioresource Research Department, Korea Institute of Ocean Science & Technology, Busan 49111, Republic of Korea
2
Tongyeong Megacosm Test Station, Korea Institute of Ocean Science & Technology, Busan 49111, Republic of Korea
3
Department of Environmental Engineering & Biotechnology, Mokpo National Maritime University, Mokpo 58628, Republic of Korea
*
Authors to whom correspondence should be addressed.
J. Mar. Sci. Eng. 2023, 11(7), 1337; https://doi.org/10.3390/jmse11071337
Submission received: 25 May 2023 / Revised: 19 June 2023 / Accepted: 29 June 2023 / Published: 30 June 2023
(This article belongs to the Special Issue Ecology and Physiology of Seaweeds and Their Response to Changes)

Abstract

:
The Yeongsan River estuary is experiencing increased concentrations of nutrient and organic matter due to its estuary bank (sea dike). The opening of floodgates at the estuary bank leads to a substantial inflow of freshwater into the saltwater zone, thereby resulting in water quality changes. Our study evaluated spatiotemporal variations in nutrient limitation in the freshwater and saltwater zones in the Yeongsan River estuary, which is expected to fluctuate with the changing seasons. We utilized the N:P ratio to evaluate the potential nutrient limitation and conducted bioassay experiments to directly assess actual nutrient limitation. The N:P ratio showed that P was the limiting nutrient in both the long-term (2004–2008) and during our field investigation. However, the bioassay experiment revealed that in the freshwater zone, P was limited in spring and winter (p < 0.05), while no nutrient was limited in summer and fall. In the saltwater zone, we observed P limitation in spring and winter (p < 0.05) and N limitation in fall (p < 0.05), whereas no nutrient limitation was observed in the summer. These results demonstrate that actual nutrient limitation, which directly influences phytoplankton growth, varies spatiotemporally in response to freshwater discharge in the Yeongsan River estuary.

1. Introduction

Phytoplankton are primary producers in aquatic ecosystems and play a vital role in the production of aquatic organic matter. Phytoplankton community and dominant species distribution can be influenced by various physical parameters, such as water temperature and turbidity, and chemical parameters, such as dissolved oxygen and nutrients [1]. Under adequate light and temperature conditions, nutrients limit phytoplankton growth [2,3]. In addition, the phytoplankton community can be regulated through top-down controls, such as selective grazing from zooplankton [4,5,6].
Inorganic and organic nutrients are essential elements required for phytoplankton growth, and their concentration changes can significantly impact the structure and growth of phytoplankton. In the case of Bacillariophyceae, the optimal P:Si ratio is different by species, especially when two species compete. The difference in the optimal ratio by species can determine species’ coexistence or competitive exclusion [7,8]. In the case of Cyanophyceae, the total phosphorus concentration is crucial during growth [9], and Cyanophyceae blooms may be caused by an increase in phosphorus concentration rather than by a simple decrease in the N:P ratio [10,11,12]. Therefore, it is necessary to estimate and monitor nutrient levels in ecosystems to maintain healthy and productive aquatic ecosystems [13,14,15].
The molar N:P ratio [16] is the most widely used method to assess inorganic nutrient limitation, but can be misleading due to measurement error at low concentrations. Additionally, determining nutrient limitation may be challenging when original nutrient concentrations are high, even if the ratios indicate nutrient limitation [14].
Bioassay experiments can directly and simply determine nutrient limitations by adding nutrients to samples collected from the field and culturing them. Thus, they can compensate for the shortcomings of the N:P ratio and mesocosm experiments. Moreover, they can reflect the influence of different environmental conditions and phytoplankton communities in the field.
The Yeongsan River estuary, the focus of this study, has been experiencing increased water pollution, particularly high concentrations of nutrients (total phosphorus and total nitrogen) and organic matter owing to domestic sewage and wastewater, since the construction of a sea dike in December 1981 [17]. The opening of sluice gates at the dike results in a considerable inflow of freshwater with high concentrations of nutrients and organic matter into Mokpo Port, causing changes in its water quality [18].
Most nutrient limitation assessments using bioassay experiments in estuaries with these characteristics have been conducted in laboratories rather than in field cultures that reflect real-world conditions [2,14,15,19,20,21]. Furthermore, nutrient limitation assessments in the study site have only been conducted in the freshwater zone, and no assessments have been conducted in Mokpo Port, a saltwater zone.
Therefore, this study conducted a bioassay experiment to determine the seasonal nutrient limitation in the freshwater and saltwater zones of the Yeongsan River estuary. By conducting a field study, we aimed to provide an accurate assessment of nutrient limitation and gain insights into the impacts of nutrient discharge on the water column processes in the saltwater zone, Mokpo Port.

2. Materials and Methods

2.1. Study Area and Water Sampling

The Yeongsan River is located in the southwestern region of South Korea. It is one of five major rivers in the Korea, along with the Han, Geum, Nakdong, and Seomjin rivers. It has a length of 137 km and a drainage area of 3468 km2, consisting of 168 tributaries. The Yeongsan River basin includes one metropolitan city, three cities, and seven administrative districts. The population is 1,900,000, with 1727 industrial facilities and 16,566,320 livestock being raised, making the Yeongsan River a potential source of pollution (as of December 2016) [22]. In addition, the annual average available water resources in the Yeongsan River basin are 3.9% of the entire country’s total water resources, or 3 billion m3 [23], which is the smallest amount among the five major river basins, making the water quality highly sensitive to even small amounts of pollutants [24,25,26,27,28].
The Mokpo area, located in the Yeongsan River estuary, had an average temperature of 13.0 °C and total precipitation of 982.1 mm in 2011, with an average photoperiod of 5.7 h. From 2011 to 2020, the average temperature was 14.0 °C, the annual average precipitation was 1193.9 mm, and the average photoperiod was 6.2 h [29].
For the freshwater zone of the Yeongsan River, we selected one station upstream (Station A) and one station downstream (Station B), while for the saltwater zone, we selected one station (Station C) closest to the Yeongsan River dike (Figure 1). The bioassay tank was installed at a location near the Yeongsan River dike.
To capture seasonal variability in nutrient limitation, the field study was conducted in January, April, July, and October of 2011. Water samples were taken from 1 m below the surface using a Van Dorn water sampler. The samples were stored in polycarbonate bottles before the bioassay experiments.

2.2. Experimental Method

2.2.1. Environment during the Experiment

Water temperature and salinity were measured using the YSI-Model 6600 v2 equipment at 1 m below the water surface at the sampling stations and in the bioassay tank during the bioassay experiment. A LICOR® PAR quantum radiometer was used to measure the solar radiation intensity to calculate the light extinction coefficient. The light extinction coefficient was calculated by taking solar radiation measurements underwater at depths of 10, 35, 60, 85, and 110 cm in the field survey, and the solar radiation in the bioassay tank was measured during the bioassay experiment. The Beer–Lambert law (Iz = Ioe−Kz, where Io = PAR at surface, K = diffuse attenuation coefficient, z = water depth, and Iz = PAR at z) was used for calculating the light extinction coefficient. For the bioassay experiment, data from the Korea Meteorological Administration [29] were used for the daily precipitation and photoperiod.

2.2.2. N:P Ratio Evaluation

To determine the potential nutrient limitation of phytoplankton in the Yeongsan River estuary through the Redfield ratio (N:P ratio > 16:1 indicates P limitation), this study utilized nutrient concentration data from the Marine Environmental Measurement Network [30] and Water Environment Information System [31] collected during the February, May, August, and November 2004–2008 monitoring periods. We also used nutrient data during our field sampling in January, April, July, and October 2011.
In this study, we defined dissolved inorganic nitrogen (N) as the sum of the ammonium (NH4+), nitrite (NO2), and nitrate (NO3) concentrations, while dissolved inorganic phosphate was the orthophosphate (PO43−) concentration and inorganic silicate was defined as the silicate (SiO2-Si) concentration.
Nutrient analysis was performed by inserting 15 mL of the filtrates, filtered through an Acrodisc® 25 mm syringe filter (pore size 0.45 μm), into a plastic scintillation vial, which were then frozen on dry ice and transported. After storage at −20 °C, the nutrients were analyzed twice using AutoAnalyzer (Bran Luebbe®) according to Parsons et al. (1984) [32].

2.2.3. Bioassay Experiment and Nutrient Addition

To conduct the bioassay experiment, we constructed a transparent tank (90 cm × 100 cm × 35 cm) with a circulation system that allowed seawater from Mokpo Port to flow in and out. The Yeongsan River (freshwater zone) experimental group was covered with a net to reduce the amount of transmitted light, reflecting the low transparency of the Yeongsan River (Figure 2). All 12 polycarbonate bottles contained 1 L of seawater sample from which zooplankton was removed using a 70 μm mesh.
Nutrients were added to each treatment group, as presented in Table 1.
The control group (Cont.), with no addition of nutrients, was designed, and all nutrient-added treatments (Mixed) involved NH4+ + NO3 + NH4+ + PO43− + SiO2 treatments. In the NH4+ nutrient-added treatment (NH4+), NH4Cl was added; in the NO3 nutrient-added treatment (NO3), NaNO3 was added; in the PO43− nutrient-added treatment (PO43−), K2HPO4 was added; and in the SiO2 nutrient-added treatment (SiO2), Na2SiO39H2O was added. In the samples collected in the freshwater zone (Stations A and B), 11 mg/L, 11 mg/L, 6 mg/L, and 23 mg/L of NH4Cl, NaNO3, K2HPO4, and Na2SiO3⋅9H2O, which were three times the maximum concentrations during 2003–2010, were added, respectively; in the samples collected in the saltwater zone (Station C), 4 mg/L, 5 mg/L, 2 mg/L, and 18 mg/L, which were twice the maximum concentrations during 2003–2010, were added, respectively.
The bioassay experiments were conducted for four seasons and water samples were collected from the treatment groups during each season.
In winter, the experiments were conducted for 31 days, from 26 January 2011, to 25 February 2011. In spring, the experiments were conducted for 14 days, from 11 April 2011, to 24 April 2011. In the summer, the experiments were conducted for 6 days, from 20 July 2011, to 25 July 2011, and in the fall, the experiments were conducted for 9 days, from 21 October 2011, to 30 October 2011. The experimental (incubation) time varied by season, considering the differences in phytoplankton growth rates that are dependent on water temperature and light availability.

2.2.4. Phytoplankton Analysis

The chlorophyll a (chl-a) concentration was used as a proxy for phytoplankton biomass. As the rate of phytoplankton proliferation in response to water temperature varies by season, samples of 10 mL were taken once to three times a day in winter, twice in spring and fall, and once in summer. The collected samples were filtered using glass fiber filter paper (GF/F filter, diameter 25 mm, Whatman, Maidstone, UK, pore size 0.7 µm). The filter paper was transferred to a light-shielding test tube containing 8 mL of 90% acetone and chl-a was extracted during 12 h before being measured using a Turner Designs 10-AU fluorometer.
To analyze the phytoplankton community, samples were fixed with Lugol’s solution (final concentration 1%), and 1 mL of the fixed sample was placed into the S-R chamber and analyzed. Fixed samples were examined using an Axioskop 2 MAT optical microscope (ZEISS, Aalen, Germany) under 200–400 times magnification. Species analysis was performed three times: on the first day of the incubation, the day the chl-a value was high, and at the end of the incubation period. The phytoplankton counting and identification were performed based on the Korean Animal and Plant Book Vol. 9 (Freshwater Phytoplankton) [33] and Vol. 34 (Marine Phytoplankton) [34].
The graphs were prepared using the Surfer 11 and Grapher 8 software. A Kruskal–Wallis test of non-parametric equivalence (p-value < 0.05 was considered as a statistically significant difference) using SPSS 27 was performed to statistically compare chl-a during the bioassay experiment.

3. Results

3.1. Assessment of N:P Ratio

3.1.1. N:P Ratio from 2004 to 2008

The analysis of the N:P ratios using monitoring data revealed potential P limitation in all seasons from 2004 to 2008, with ratios above 16. P limitation was strongest at Station B during winter (N:P ratio of 13.5–97.6 with an average of 67.7) and spring (N:P ratio of 70.11–133.4 with an average of 92.1) (Figure 3). During summer, Station C showed the strongest P limitation (N:P ratio of 26.9–130.2 with mean 91.8). In fall, the N:P ratio at Station C also showed P limitation with a ratio above 16 (N:P ratio of 16.8–35.5 with an average of 21.9) but was lower than that at the other stations.

3.1.2. N:P Ratio during the Field Study

The N:P ratios of the water samples collected in 2011 were above 16 in all four seasons, indicating potential P limitation. During winter, the strongest P limitation was observed at Stations A and B (Figure 4). Meanwhile, the N:P ratio at Station C was considerably smaller than that at Stations A and B. During spring, Station B had the strongest P limitation. The N:P ratio was lower during summer and fall than during other seasons. The highest degree of potential P limitation was observed at Station C during summer, while during fall, the highest degree of potential P limitation was observed at Station A although the difference was not high.

3.2. Environment during Field Survey

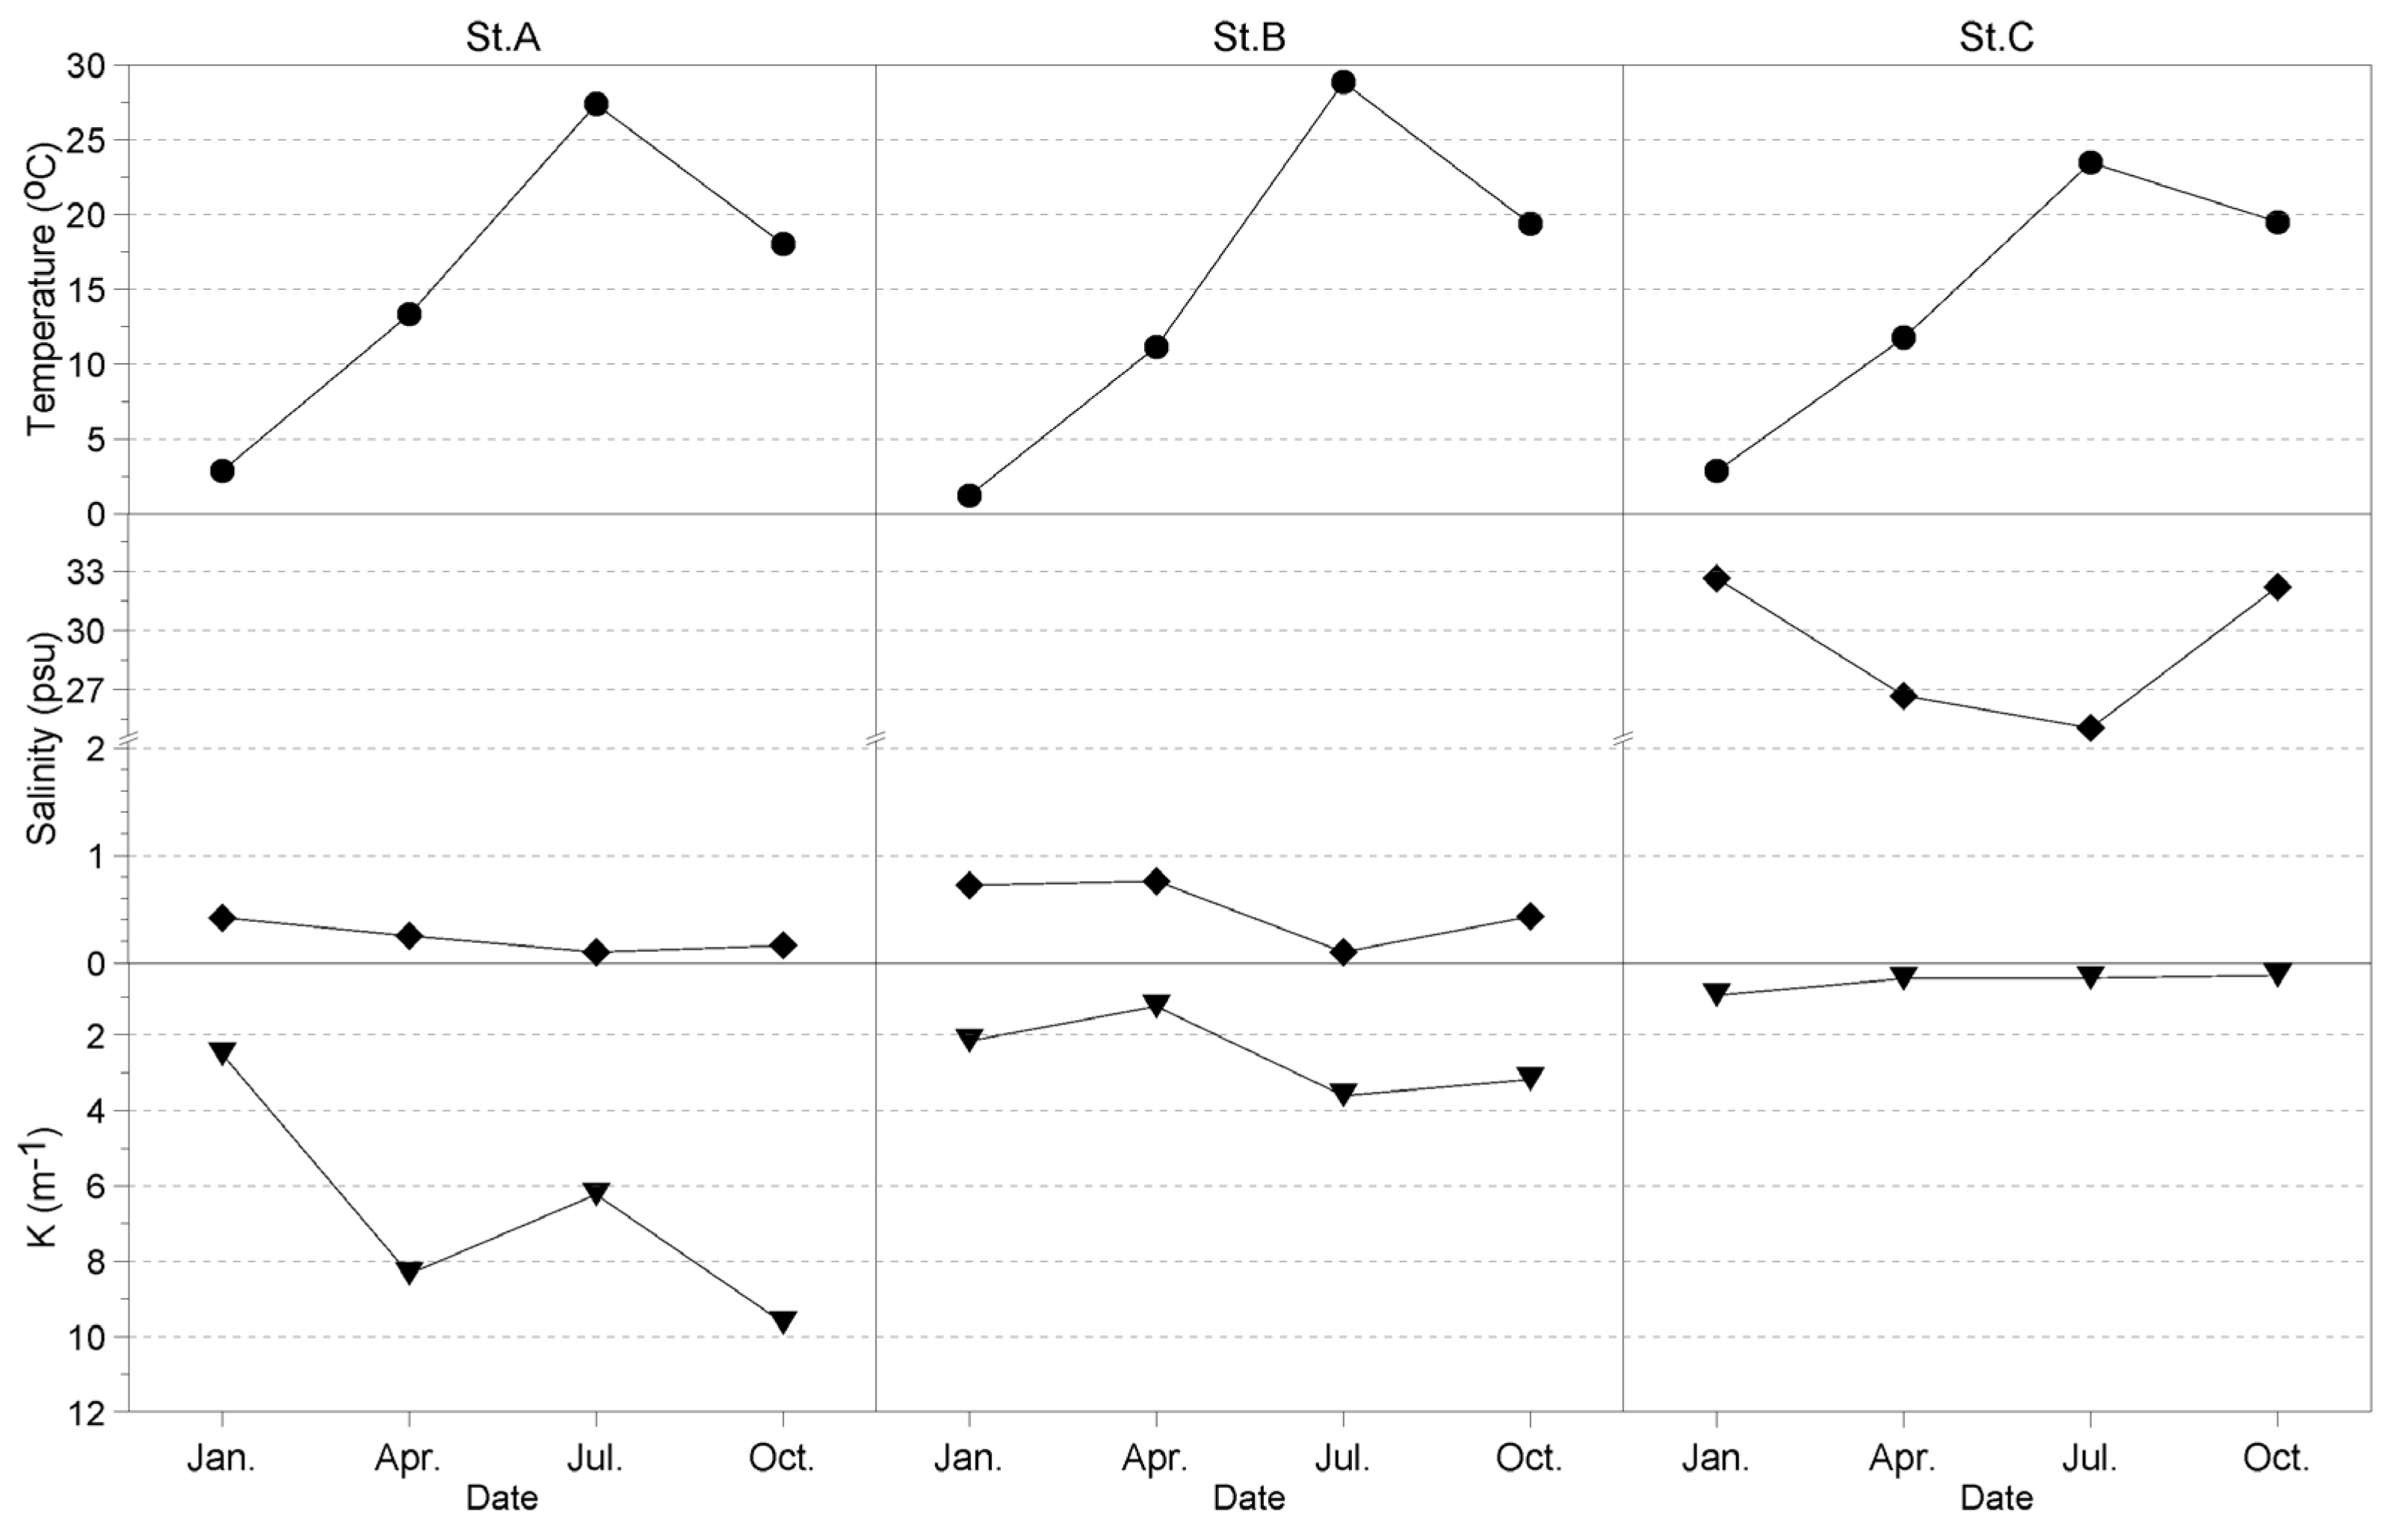
During the field survey, the water temperature at Stations A and B, which are freshwater zones, showed an overall similar distribution; however, the summer water temperature at Station C, which is the saltwater zone, was low, unlike the other stations (Figure 5). A seasonal change in salinity was not observed at Stations A and B, whereas a clear seasonal pattern was observed at Station C, decreasing to 25.05 psu.
The light extinction coefficient was the highest during the survey period at Station A, the upstream zone of the Yeongsan River with high turbidity; however, at Stations B and C there was a low light extinction coefficient.

3.3. Bioassay Experiment

3.3.1. Environment during the Experiment

  • Winter
The precipitation during the bioassay experiment in winter ranged between 0 and 6.5 mm, with a daily average of 2.1 mm and total of 18.8 mm (Figure 6). The photoperiod was 0–10.1 h with a daily average of 6.6 h. The average water temperature was 3.9 °C from day 2 to day 27. However, the water temperature increased to 13.7 °C on day 30, the last day of the experiment. The light extinction coefficients of the freshwater and saltwater zones showed different distributions, with higher values in the freshwater zones than those of the saltwater but similar trends.
  • Spring
The precipitation in spring ranged between 0 and 27 mm, with a daily average of 5.7 mm and a total of 28.3 mm (Figure 7). The photoperiod was 0–11.8 h, with an average of 8.8 h. The temperature was 11.24–12.60 °C with an average of 11.98 °C, showing a small change. The light extinction coefficients of the freshwater zones were higher than those of the seawater zone but showed similar trends.
  • Summer
There was no precipitation during the bioassay experiment in summer and the photoperiod was 4.9–8.5 h with an average of 6.5 h (Figure 8). The water temperature ranged between 22.5 and 25.2 °C with an average of 23.9 °C, and no apparent change was observed. The light extinction coefficients showed a similar pattern to those in winter and spring.
  • Fall
The precipitation during the biological test in fall ranged between 0 and 8.5 mm with a daily average of 2.1 mm (Figure 9). The photoperiod was 0–10.2 h with an average of 6.0 h. The water temperature ranged between 16.5 and 18.4 °C with an average of 17.4 °C, and no significant change was observed. The light extinction coefficients of the freshwater zones were higher than those of the saltwater zone, similar to other seasons.

3.3.2. Seasonal Changes in Phytoplankton Chl-A Levels in Response to Nutrient Addition

  • Winter
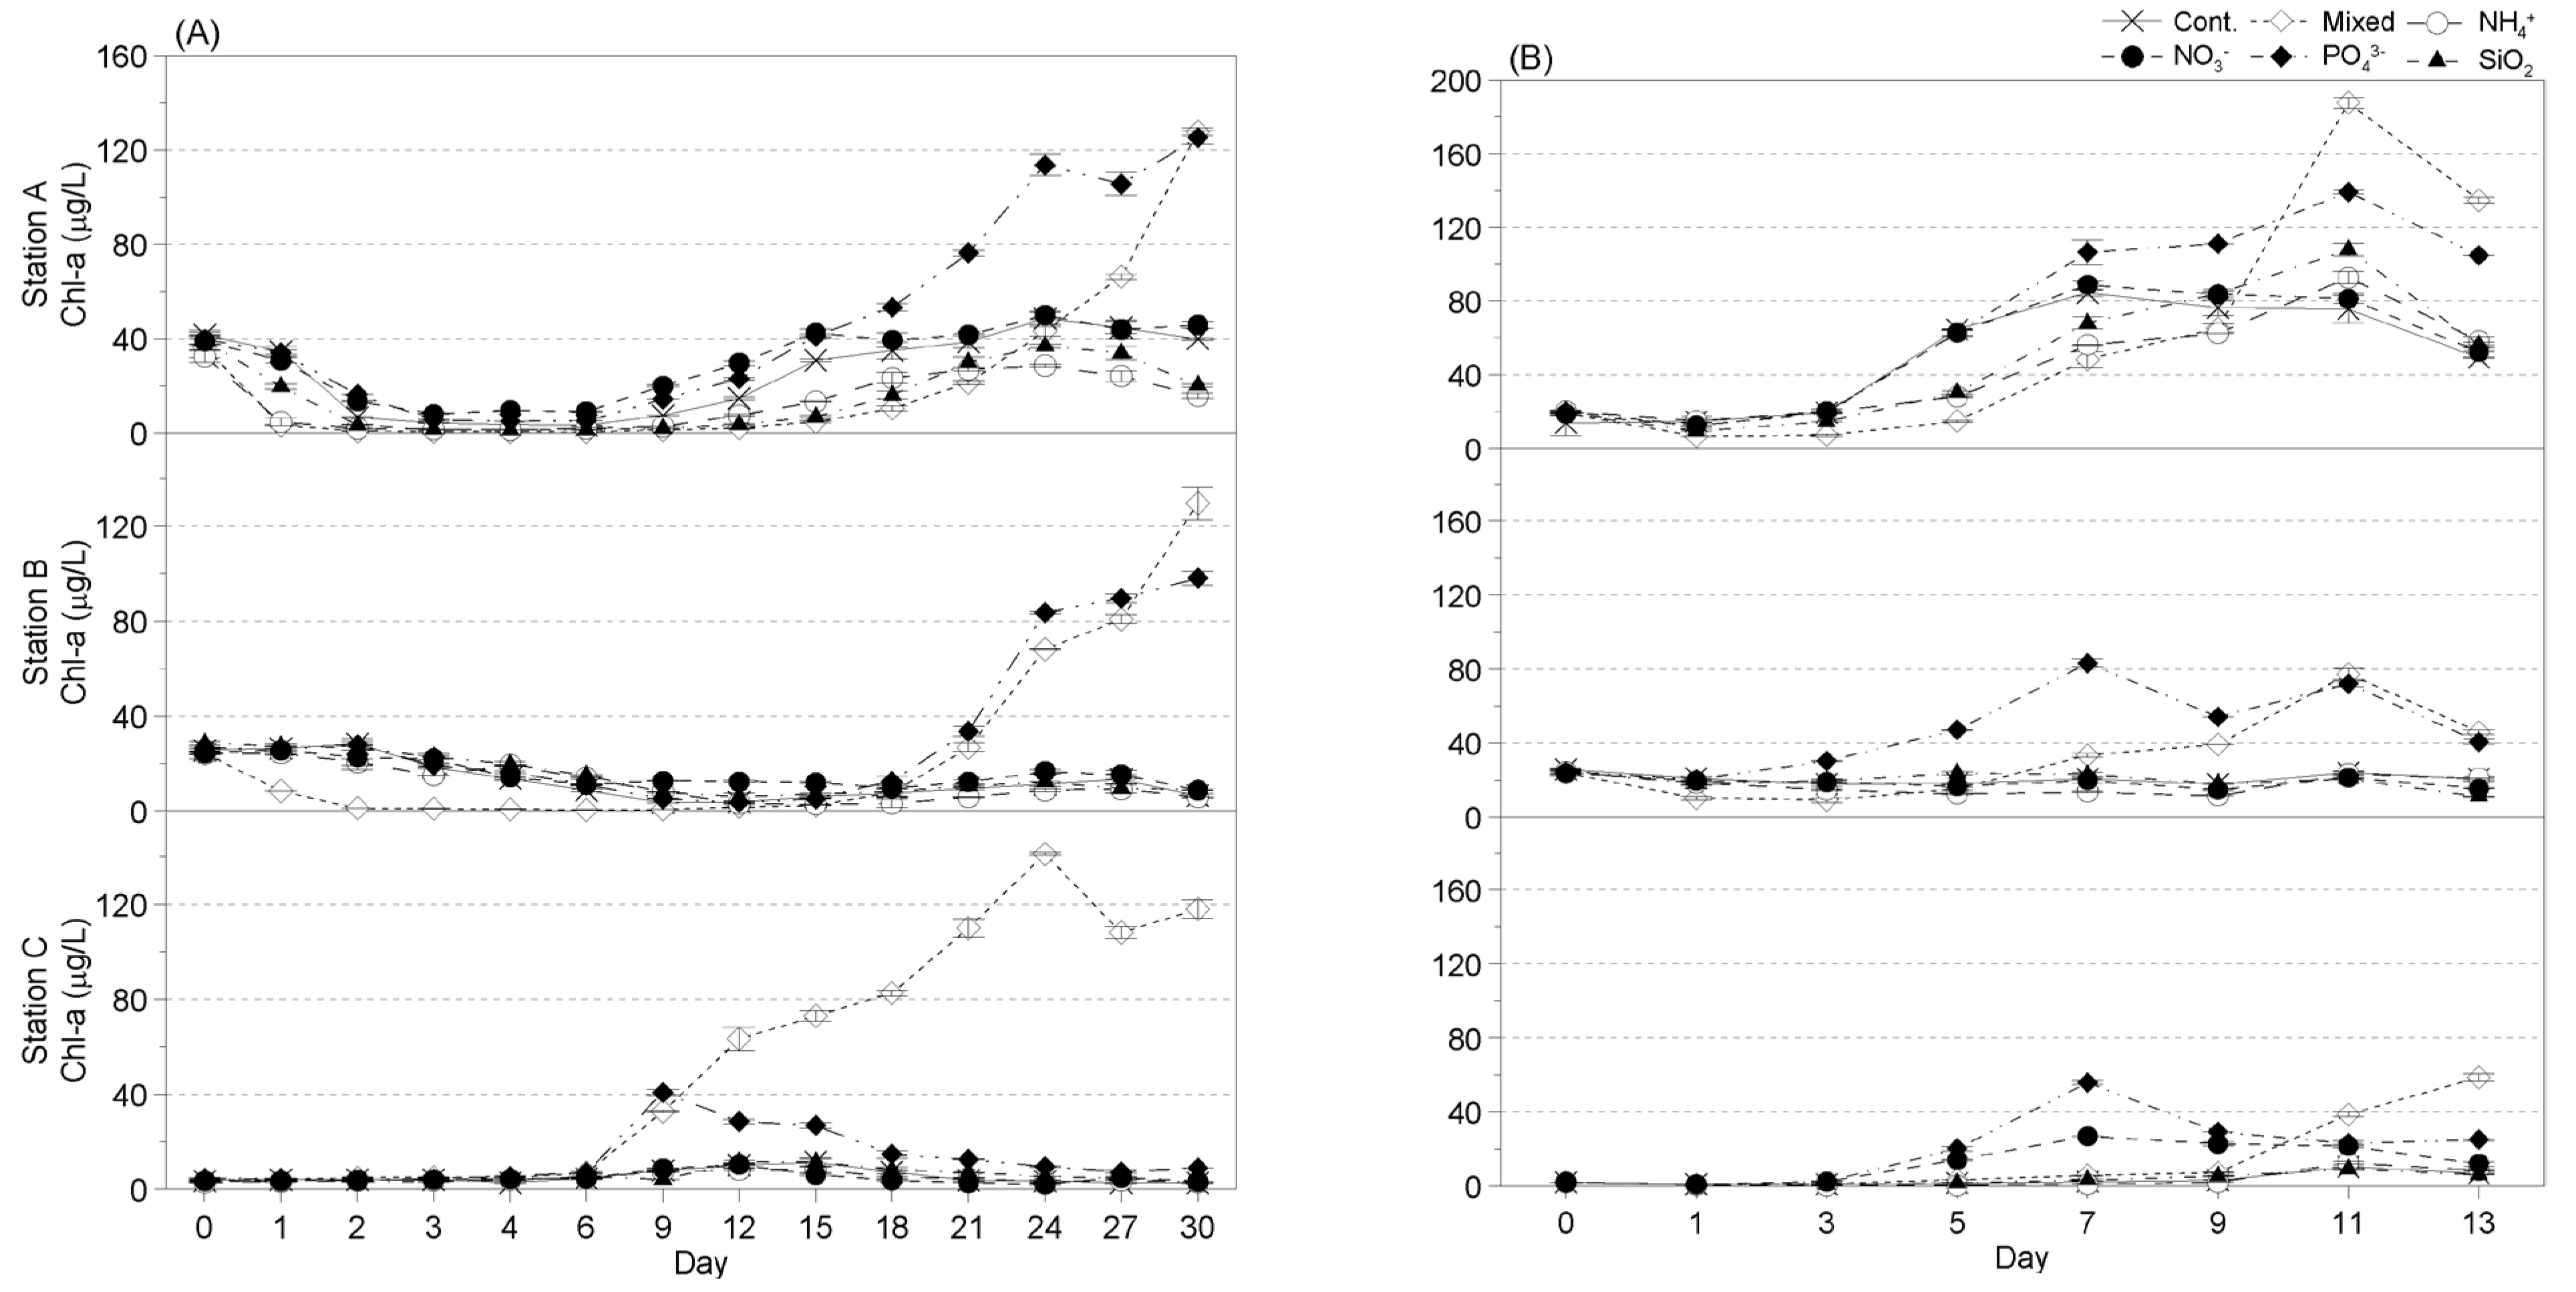
During winter at Station A, all groups initially showed a decrease in chl-a levels, and then, an increase in chl-a levels from day 9 to day 18 (Figure 10A). The chl-a levels in the Mixed and the PO43− groups continued to increase after day 18. By day 30, the chl-a level was approximately 3.5-fold higher than that before nutrient addition. The chl-a levels of the PO43− group appeared higher than the Cont. group, but the differences was not statistically significant (Table 2).
A similar trend was observed at Station B (Figure 10A). The Mixed and PO43− groups showed a decrease in chl-a levels at the beginning of the experiment, followed by an increase from day 21. The chl-a level in the Mixed group increased to 129.6 µg/L on day 30, which is approximately 5.3-fold higher than the chl-a level before nutrient addition. Similarly, the chl-a level in the PO43− group was approximately 3.6-fold higher. The chl-a levels of the PO43− group were significantly (p < 0.05) higher than the Cont. group (Table 2).
At Station C, changes in chl-a levels were observed in both the Mixed and PO43− groups (Figure 10A). The chl-a level in the Mixed group began to increase from day 9 to day 24; the chl-a level in the PO43− group increased on day 9. The chl-a levels of the PO43− group were significantly (p < 0.05) higher than the Cont. group (Table 2).
  • Spring
For Station A, in spring, all groups showed an increase in chl-a levels from day 5 (Figure 10B). On day 11, all groups showed the highest chl-a levels. The Mixed and PO43− groups showed a higher chl-a distribution than the other treatment groups, with the chl-a levels in the Mixed and the PO43− groups increasing by approximately 9.8-fold and approximately 6.9-fold, respectively. The chl-a level of the PO43− group appeared higher than the Cont. group, but the difference was not statistically significant (Table 2).
For Station B, the chl-a level showed no change in any of the treatment groups, except for the Mixed and the PO43− groups (Figure 10B). The chl-a level in the Mixed group increased on day 7, while the chl-a level in the PO43− group started to increase on day 3. The chl-a level of the PO43− group was significantly (p < 0.05) higher than the Cont. group (Table 2).
For Station C, the phytoplankton chl-a level showed a trend similar to that observed at Station B (Figure 10B). The chl-a level in the Mixed group started to increase on day 11. The chl-a levels in the PO43− and NO3 groups began to increase on day 5 and on day 7, which were approximately 30-fold and 13-fold higher than the initial chl-a levels, respectively. The chl-a levels of the PO43− and NO3 groups were significantly (p < 0.05) higher than the Cont. group (Table 2).
  • Summer
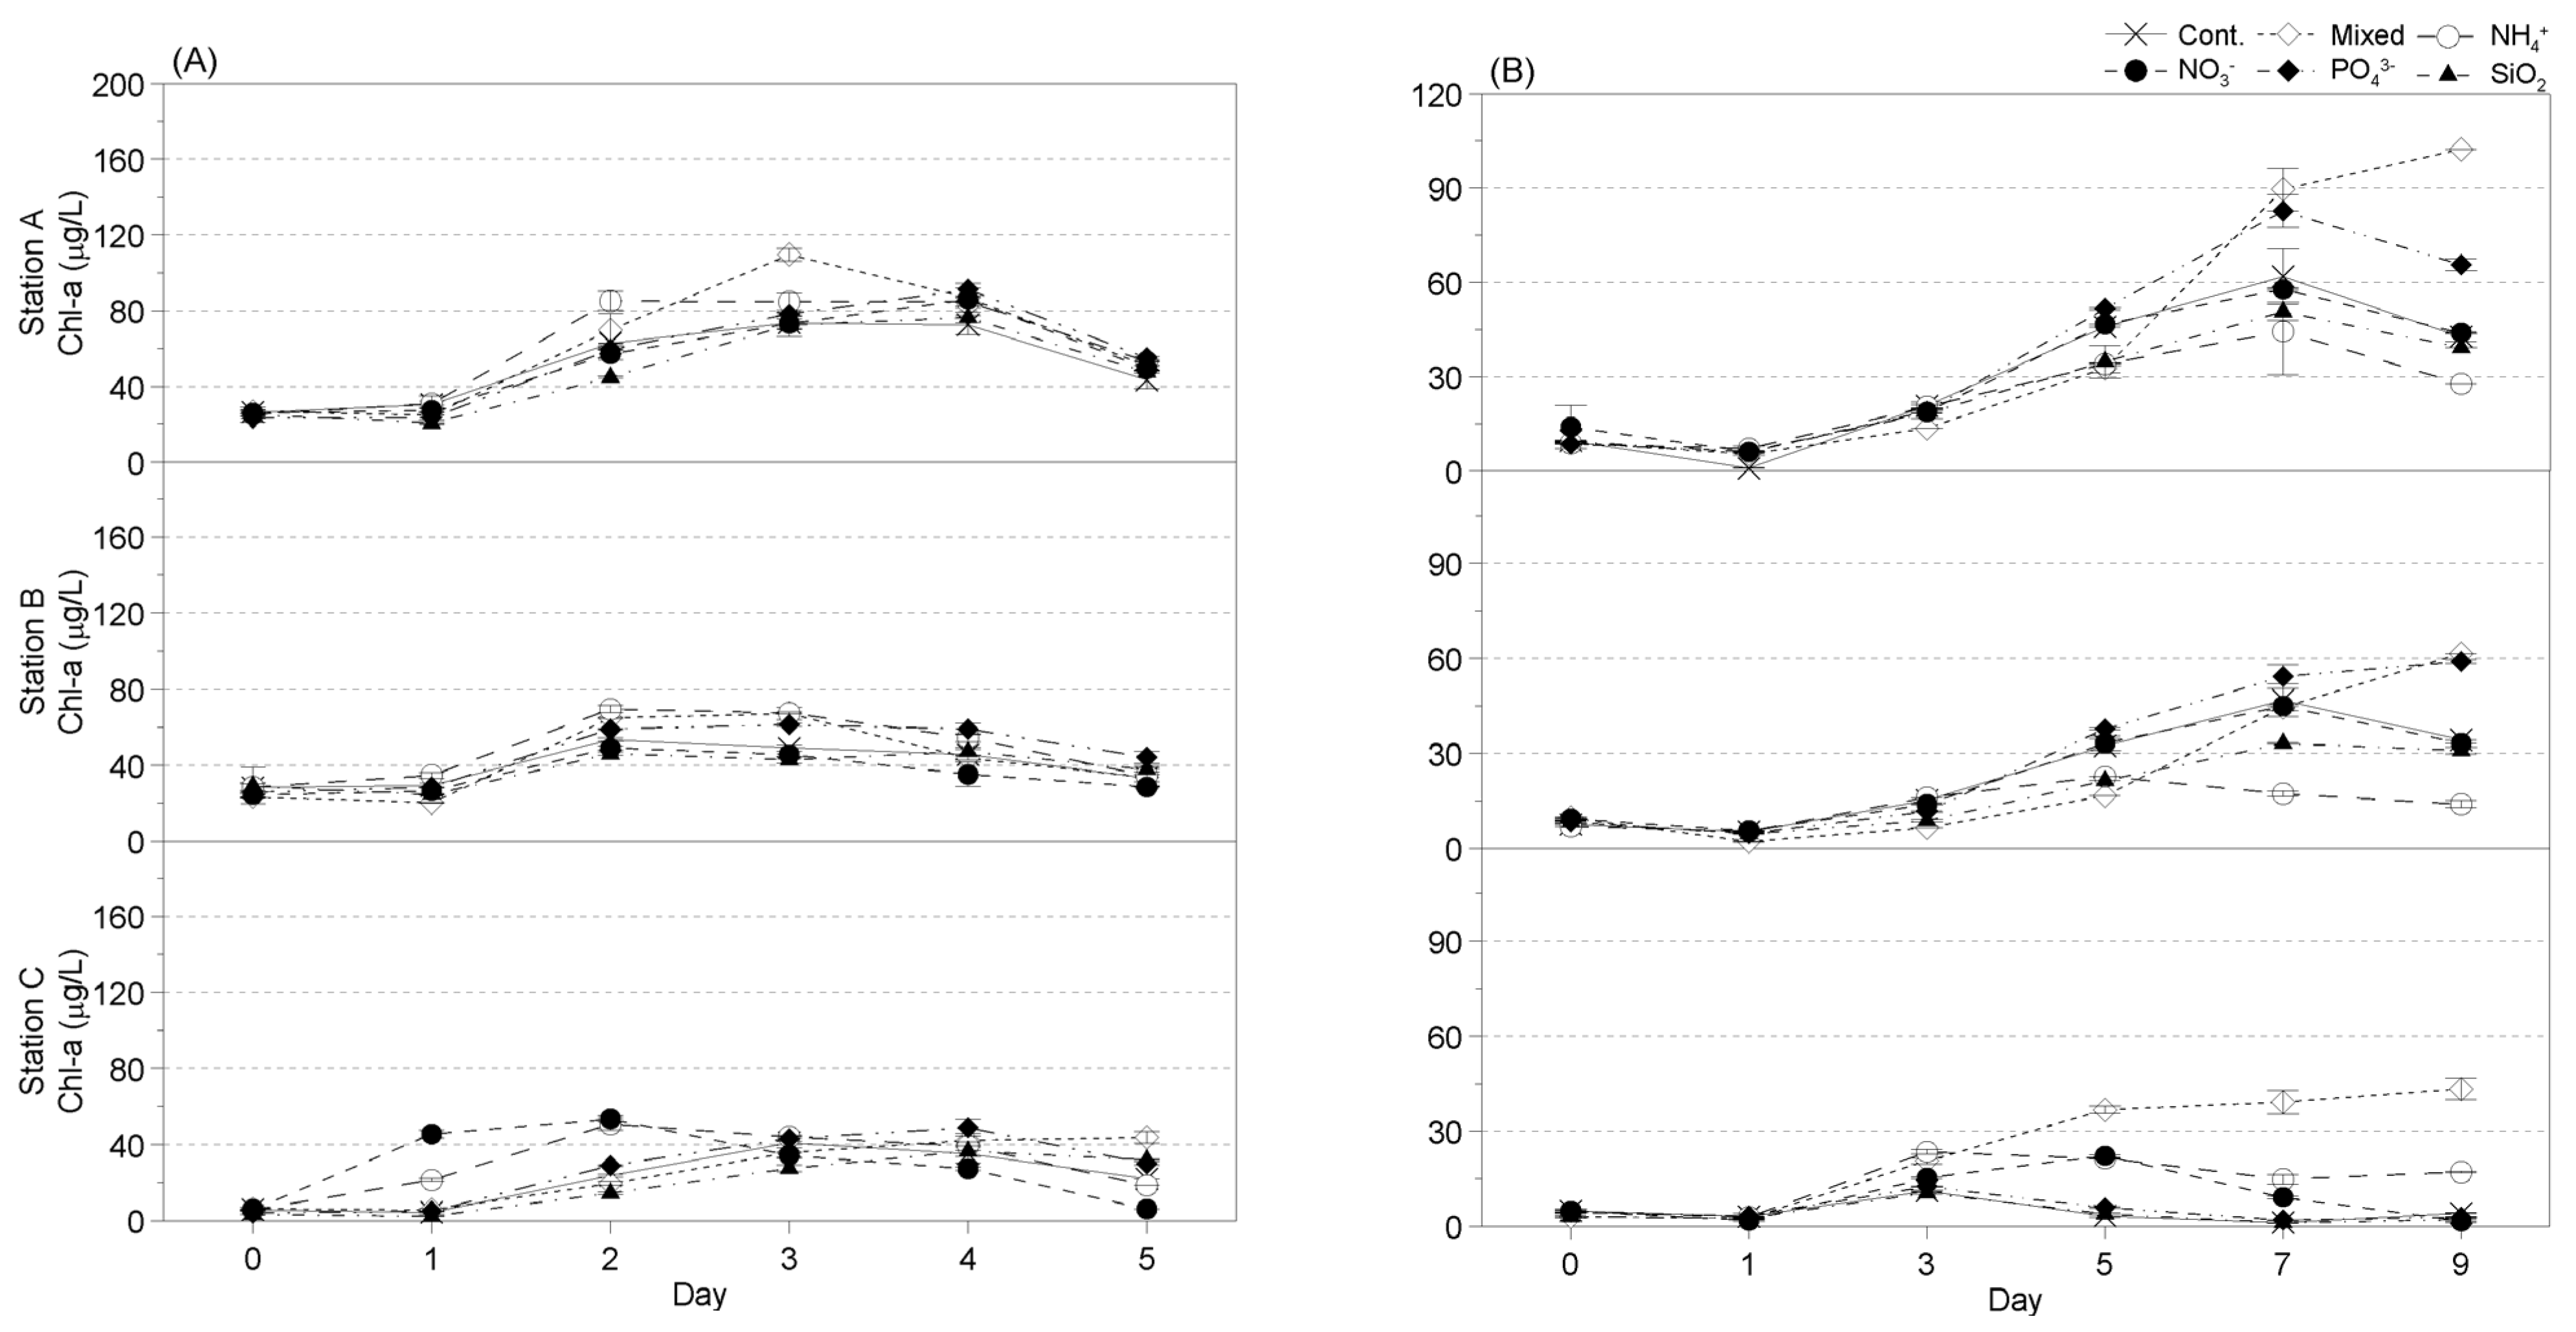
At Station A, the chl-a levels in all groups increased from day 2, and the chl-a distribution exhibited a similar trend (Figure 11A). The chl-a levels of the treatment groups appeared similar to that of the Cont. group, and the differences were not statistically significant (Table 2).
Station B also showed a similar trend, with the chl-a level starting to increase from day 2 in all groups (Figure 11A). The treatment groups’ chl-a levels appeared similar to that of the Cont. group, and the differences were not statistically significant (Table 2).
The distribution of phytoplankton chl-a at Station C was also similar to that observed at Station B (Figure 11A). Although the chl-a level increased from day 1, showing differences in the timing of the increase, the chl-a distributions of the treatment groups showed similar trends to that of the Cont. group. The treatment groups’ chl-a levels appeared similar to that of the Cont. group, and the differences were not statistically significant (Table 2).
  • Fall
At Station A, the chl-a levels in all the groups increased from day 3. The chl-a levels in the Cont. and Mixed groups increased to 61.84 µg/L on day 7 and 102.4 µg/L on day 9, respectively (Figure 11B). The chl-a level of the PO43− group appeared higher than the Cont. group, but the difference was not statistically significant (Table 2).
At Station B, the chl-a levels in all the groups increased from day 3 (Figure 11B). In all the treatment groups, except the Mixed and PO43− groups, the chl-a levels increased by approximately 3.2–4.7-fold; the chl-a level in the PO43− group increased by approximately 7.0-fold. The chl-a level of the PO43− group appeared higher than the Cont. group, but the difference was not statistically significant (Table 2).
At Station C, the chl-a levels in all the groups increased from day 3 (Figure 11B). The chl-a levels in the NH4+ and NO3 groups increased by approximately 2.09- and 1.98-fold, respectively, on day 5. The other treatment groups’ chl-a levels were similar to that of the Cont. group. The chl-a levels of the NH4+ group were significantly (p < 0.05) higher than the Cont. group (Table 2).

3.3.3. Seasonal Changes in Phytoplankton Community in Response to Nutrient Addition

  • Winter
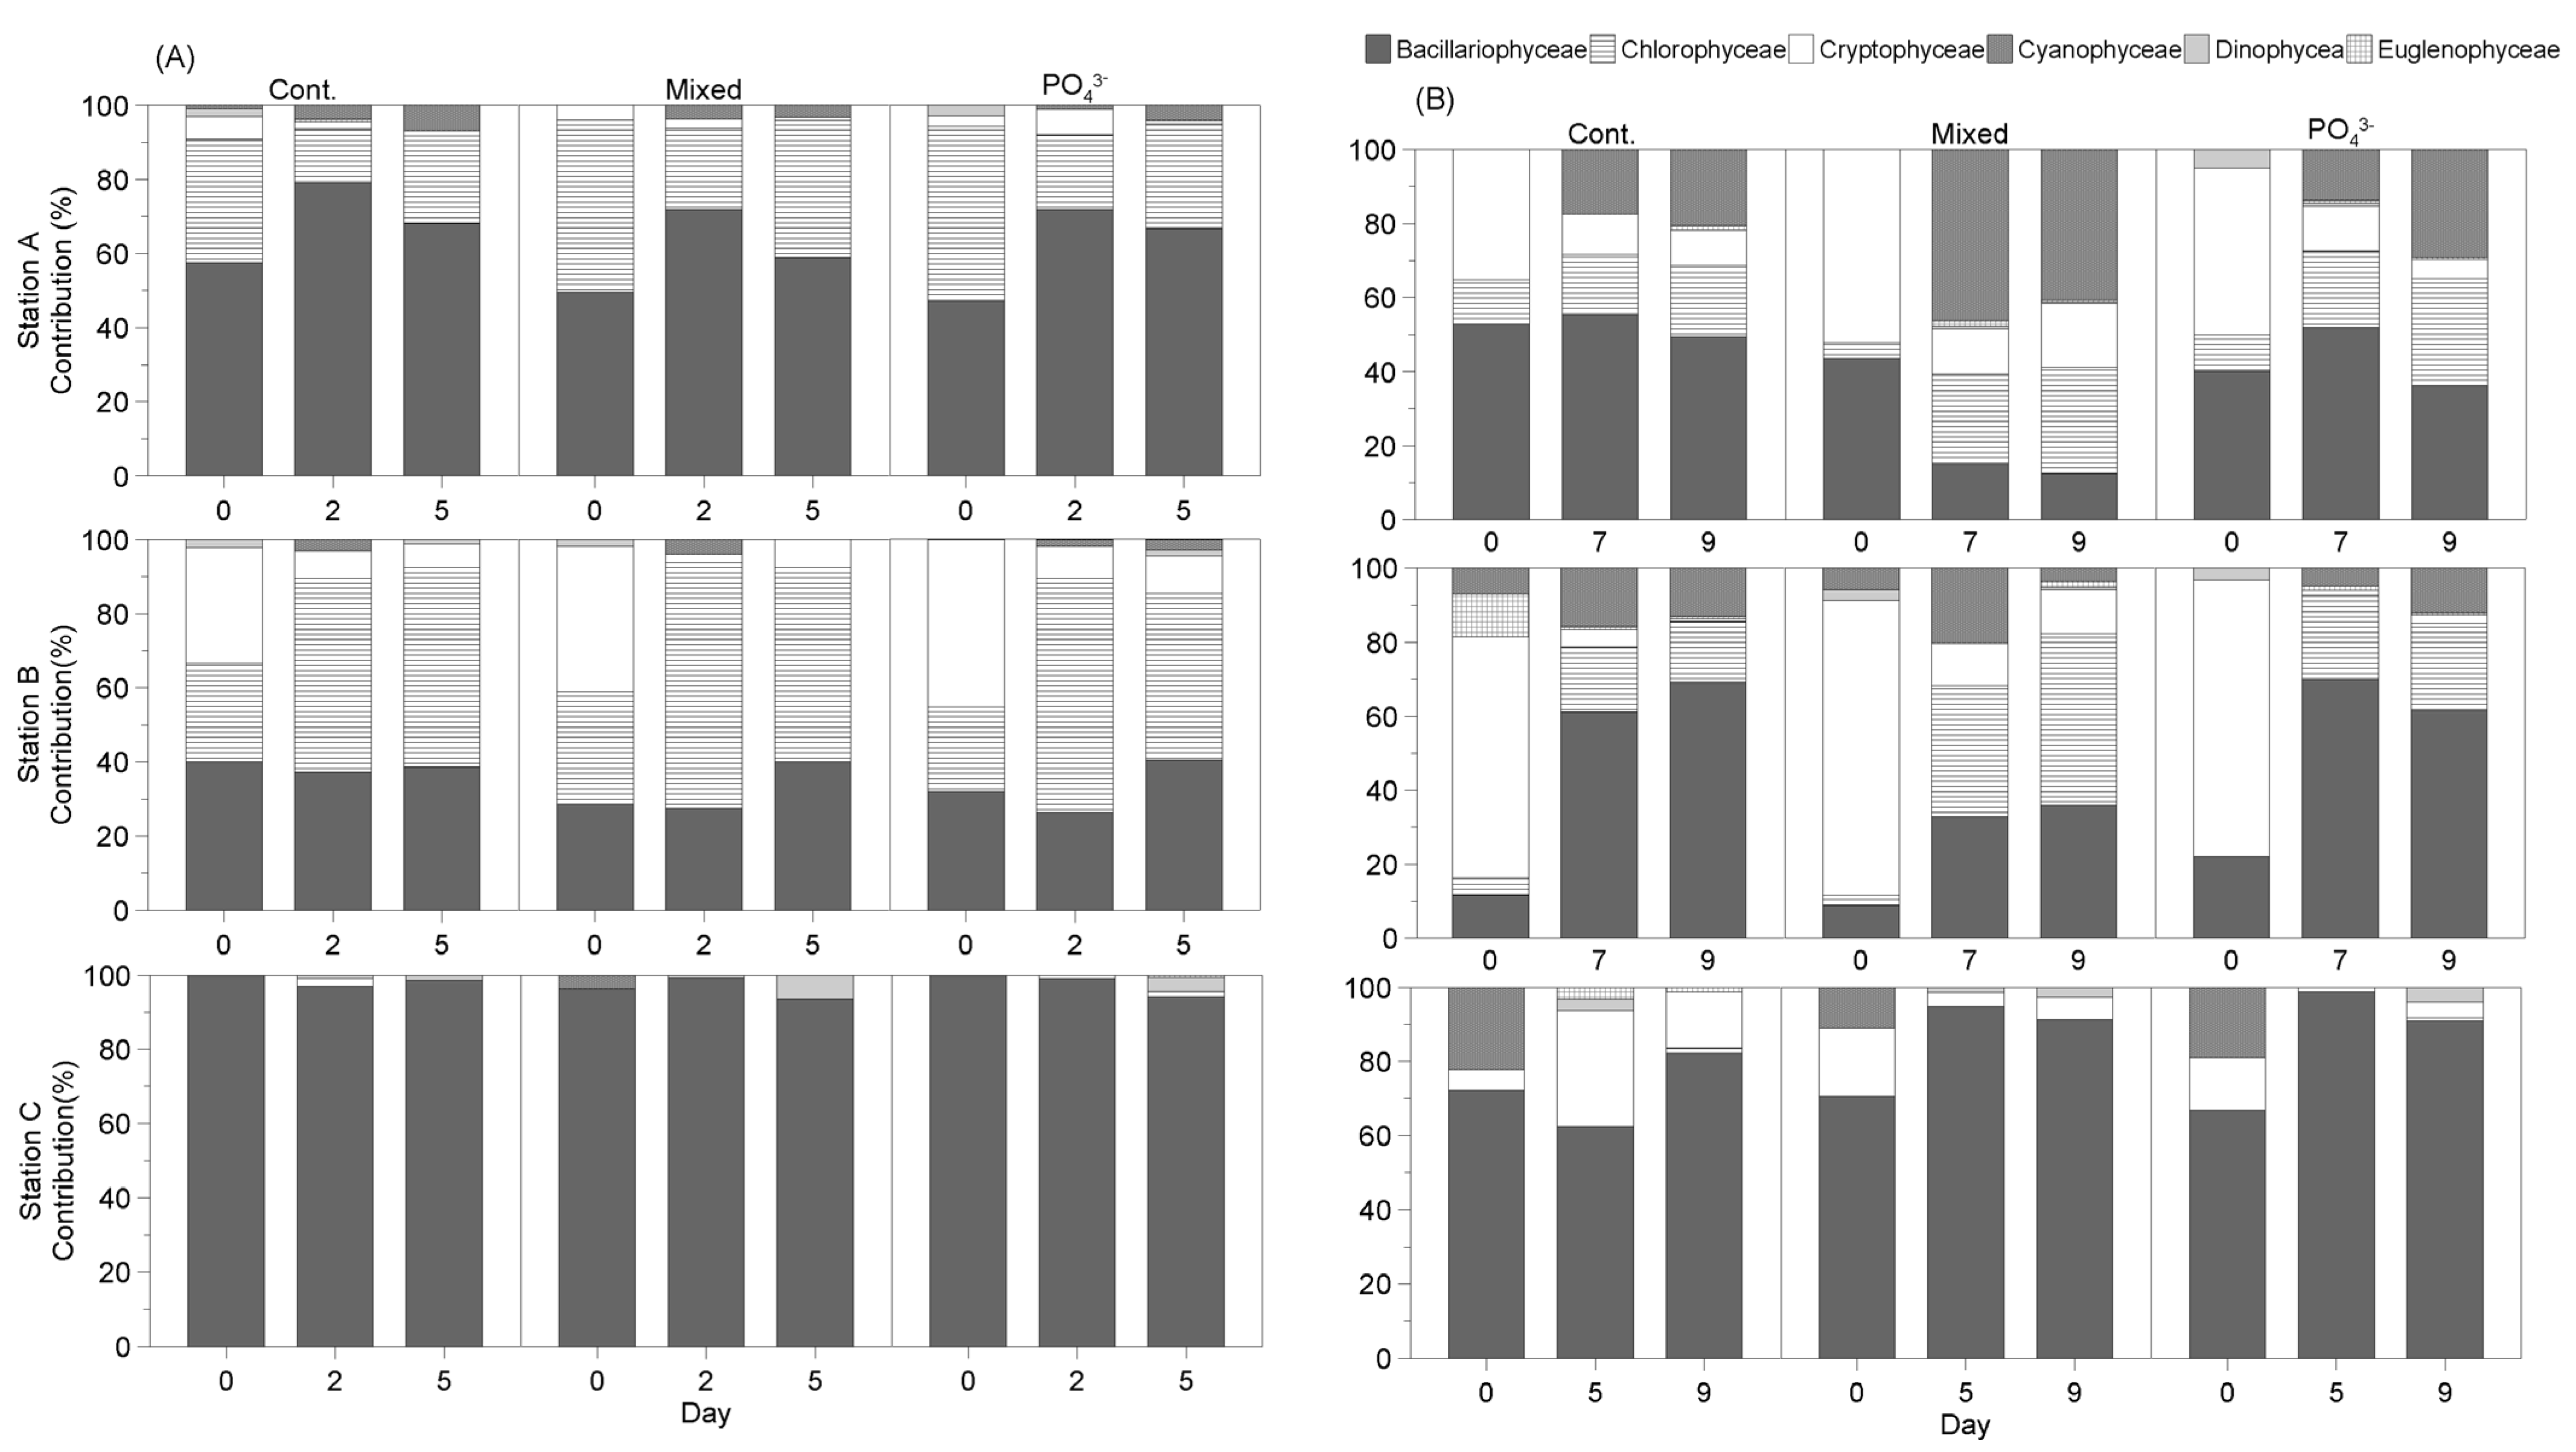
In winter, at Station A, the phytoplankton community in the Cont. group did not show an apparent change, but there was an apparent change in the community in the Mixed and PO43− groups (Figure 12A). In the Mixed and PO43− groups, the abundances of the Chlorophyceae tended to increase as the experiment progressed; the percentage abundances were 82.07% and 34.54%, respectively, on day 30.
At Station B, the community in the Mixed and PO43− groups also showed an apparent change. On day 21, in the Mixed and PO43− groups, the abundances of Chlorophyceae increased to 33.53% and 16.74%, respectively whereas those of Bacillariophyceae decreased to 51.83% and 71.67%, respectively.
At Station C, none of the groups showed apparent changes in the community. The abundance of Bacillariophyceae in the Cont. group decreased by approximately 10% (to 90.16%) on day 9, but on day 30, the distribution of Bacillariophyceae changed back to the that observed on day 0. In the Mixed and PO43− groups, the ultra-dominant distribution of Bacillariophyceae was maintained until day 30.
  • Spring
At Station A, in spring, the community in all the groups showed apparent changes (Figure 12B). The abundance of Chlorophyceae, which did not appear in the Cont. group, increased to 48.67% on day 9, while that of Cryptophyceae decreased as the experiment progressed. In the PO43− group, the abundance of Chlorophyceae increased from 5.71% on day 0 to 17.42% on day 9, while that of Cryptophyceae decreased.
At Station B, all groups showed similar changes in the community. All groups showed an increase in the abundance of Bacillariophyceae and a decrease in the abundance of Cryptophyceae; however, the change in the abundance of Chlorophyceae was minimal in the Cont. group. Further, the Mixed and PO43− groups showed a larger increase in the abundance of Chlorophyceae than the other groups on day 9.
At Station C, on day 9, the abundance of Dinophyceae increased by 22.67% in the Cont. group, and the abundances of Bacillariophyceae increased to 100% and 98.83% in the Mixed and PO43− groups, respectively. In addition, the abundance of Dinophyceae in the PO43− group increased to 13.73% on day 13, which was the last day of the experiment.
  • Summer
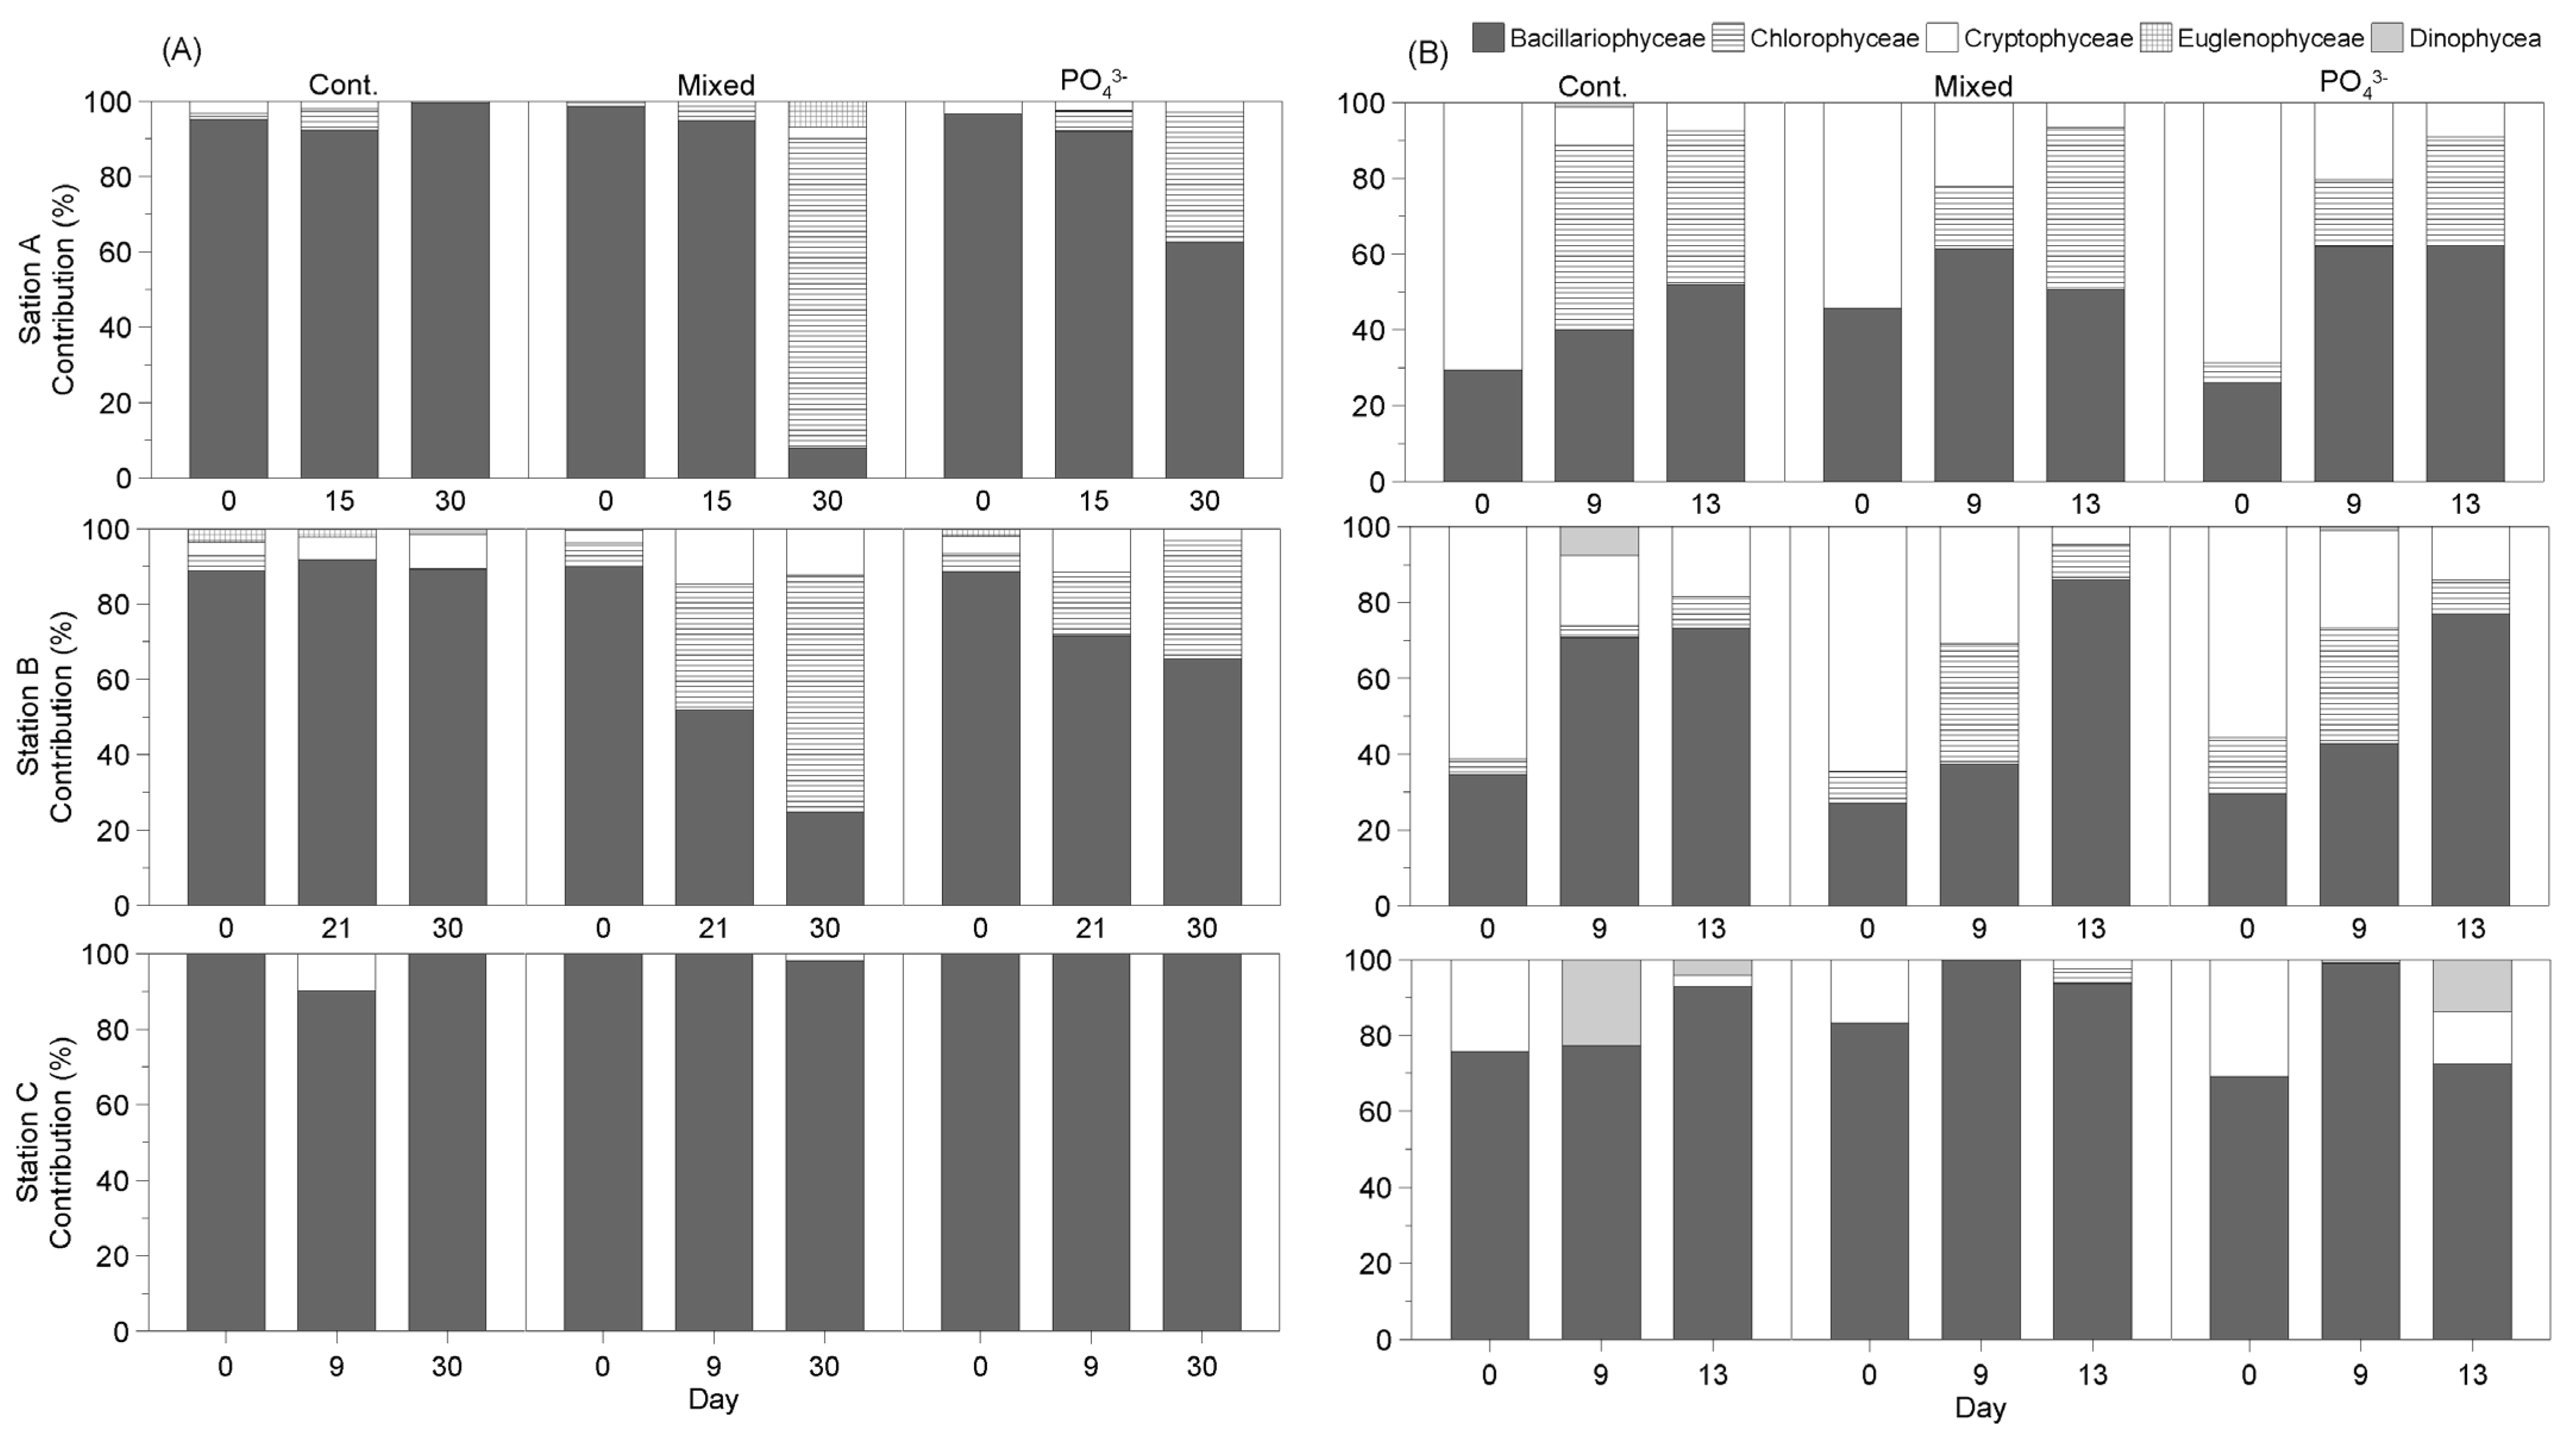
At Station A, in summer, the changes in the community in the Cont., Mixed, and PO43− groups showed similar trends (Figure 13A). The abundance of Bacillariophyceae showed an increasing trend, while that of Chlorophyceae showed a decreasing trend on day 2.
At Station B, the phytoplankton communities in all the groups also showed similar distributions. In the Cont. group, the abundance of Chlorophyceae increased to 53.76% and that of Cryptophyceae decreased to 6.45% on day 5. On day 2, in the Mixed group, the abundance of Chlorophyceae increased to 66.41% and that of Cryptophyceae decreased to 2.29%. On day 2, in the PO43− group, the abundance of Chlorophyceae increased to 63.16% and that of Cryptophyceae decreased to 8.77%.
At Station C, Bacillariophyceae was the most abundant among the phytoplankton community in all the groups; the Cont. group showed no apparent changes in the community over time. The abundance of Dinophyceae increased to 6.84% and 3.82% on day 9 in the Mixed and PO43− groups, respectively, but the increase was not apparent, showing a distribution similar to that observed in the Cont. group.
  • Fall
At Station A, during the fall, all groups showed changes in the communities (Figure 13B). In the Cont. group, the abundance of Cryptophyceae decreased to 9.64% on day 9 and that of Bacillariophyceae increased to 55.43% on day 7. In the Mixed group, the abundance of Cryptophyceae decreased to 12.12% on day 7 and that of Chlorophyceae increased to 28.63% on day 9. On day 9, the PO43− group showed a decrease in the abundance of Cryptophyceae but an increase in the abundance of Chlorophyceae.
At Station B, the abundance of Cryptophyceae decreased but the abundances of Bacillariophyceae and Chlorophyceae increased in all the groups (Figure 13B). In the Cont. group, the abundance of Bacillariophyceae increased from 11.72% on day 0, to 61.11% on day 7, and 69.18% on day 9. In the Mixed group, the abundance of Chlorophyceae showed the most pronounced increase, i.e., 46.32%, on day 9. In the PO43− group, the abundance of Bacillariophyceae increased apparently and then decreased and that of Cyanophyceae increased to 12.07% on day 9.
At Station C, the changes in the community differed between the Cont. and experimental groups (Figure 13B). In the Cont. group, the abundance of Cryptophyceae increased to 31.25% on day 5 and that of Bacillariophyceae increased to 82.19% on day 9. The Mixed and NH4+ groups showed similar trends of increase in the abundance of Bacillariophyceae and decrease in the abundances of Cryptophyceae on day 5 and Bacillariophyceae on day 9.

4. Discussion

A general trend in nutrient limitation is that freshwater zones are limited by P, whereas the marine environment is limited by N [35]. However, the actual nutrient limitation in coastal waters can vary depending on the location and time of the year because of the influences of both land and open ocean waters [36,37,38]. Previous studies conducted in Chesapeake Bay [36], Hiroshima Bay [37], and Louisiana Bay [38] have shown spatiotemporal variability in nutrient limitation. Similarly, the bioassay experiments performed at the Yeongsan River estuary in this study also showed spatiotemporal variability in nutrient limitation. Additionally, in both the present study and previous coastal water studies, the N:P ratio indicated potential P limitation spatiotemporally.
Redfield (1958) [16] and Redfield et al. (1963) [39] proposed that N limitation occurs when the concentration ratio of N and P in water systems is below 16. In contrast, P limitation occurs when it is above 16, based of the molar ratio (106C:16N:1P) in phytoplankton cells [15]. This study found the estuary’s freshwater and saltwater zones to be P limited, as indicated by the N:P ratio, which was above 16. However, it can be challenging to assess nutrient limitation based on the ratio alone when the absolute (original) concentrations are high. Additionally, when the concentration of nutrients is low, it can be misinterpreted because of measurement errors [15].
Based on the results of the bioassays, in the Yeongsan River estuary, the limiting nutrient in the freshwater zone (Station A and B) was P in spring and winter, while no specific nutrient limitation was found in summer and fall. Among the studied stations in the Yeongsan River, both Stations A (upstream) and B (downstream) showed P limitation, which is known to be the primary nutrient-limiting factor in freshwater ecosystems. Notably, Station B remained unaffected by the opening of the floodgates of the Yeongsan River dike. In summer, the total precipitation recorded before the field survey was 221.5 mm, the highest of the year. The light extinction coefficient was the highest (3.6 m−1) during the survey period. Due to precipitation in the summer, high amounts of nutrients are introduced, and the light extinction coefficient was high. This is consistent with the findings of Jang et al. (2010) [40], that phytoplankton productivity is regulated by light when nutrients are abundant in summer.
In the saltwater zone (Station C), P was observed to be limiting during spring and winter, while N was limiting during fall. No specific nutrient limitation was observed in the summer. During spring, the distribution of phytoplankton chl-a was similar to that observed at Station B. A discharge of 4,041 thousand tons of freshwater was released in four days before the field study, resulting in a low salinity of 26.7 psu. Therefore, the P nutrient limitation may be attributed to the influence of the Yeongsan River freshwater. The structure of the phytoplankton community revealed the dominance of Bacillariophyceae to be a major group at Mokpo Port, as previously reported by Cho (2010) [41]. This increase was likely due to the high concentration of nutrients entering the saltwater zone via the freshwater discharge from the Yeongsan River dike. Bacillariophyceae abundance is known to increase rapidly under nutrient-rich conditions [42]. This increase may contribute to the N limitation observed but this needs to be explained by further studies.
During summer, the chl-a distribution in the saltwater zone exhibited a similar trend to that observed in the freshwater zone (Station B), and the salinity was low at 25.05 psu. The Yeongsan River dike discharged freshwater 23 times during summer, with a total volume of 461,103 thousand tons, resulting in reduced phytoplankton activity by decreasing light availability due to high turbidity or osmotic stress of decreasing salinity and no specific nutrient limitation due to the riverine input of nutrients. The phytoplankton community did not show an evident species shift responding to the nutrient addition, suggesting that the phytoplankton community was not affected by nutrient limitation during summer. Fisher et al. (1988) [43] noted that phytoplankton are more sensitive to unstable water masses, high turbidity, and abrupt changes in salinity rather than to nutrients caused by freshwater inflow. This showed similar results to this experiment.
During fall, the salinity was 32.2 psu, unaffected by freshwater, and N (especially NH4+) was the limiting nutrient, consistent with the prevailing notion that seawater is mainly dominated by N limitation [43,44,45]. The abundance of Dinophyceae increased during the survey, as they are less reliant on nutrient concentrations than Bacillariophyceae due to their ability to perform soft motions and mixotrophy [46,47,48]. Thus, the abundance of Dinophyceae may have increased in the fall when nutrient concentrations were generally lower.
In winter, the chl-a exhibited a sharp response in the Mixed, with a relatively higher distribution in the PO43− group. The chl-a concentration in the field during this season was high (11 µg L−1), with a dominance of Bacillariophyceae. This suggests that the preferred nutrients of Bacillariophyceae, PO43− and SiO2, were temporarily consumed, indicating P as a main limiting nutrient.
In conclusion, the nutrient limitation in the Yeongsan River estuary varied by season rather than following a general pattern of P limitation in the freshwater zone and N limitation in the saltwater zone although it is physically divided by a dike. This is because freshwater flows in after the opening of the dike of the Yeongsan River estuary, and the Mokpo Port, a saltwater zone, is greatly affected by the freshwater inflow, an episodic event, especially during wet seasons. Thus, it is essential to fully consider the impact of freshwater inputs on nutrient limitation to understand the phytoplankton blooms in the Yeongsan River estuary. Bacterial abundance needs to be considered in the future because they play a major role in consuming nutrients and controlling phytoplankton [49,50,51]. This study suggests that understanding the effect of anthropogenic freshwater is required to manage estuaries altered by engineered structures such as sea dikes.

Author Contributions

Conceptualization, validation, investigation, and resources, B.B.Y. and Y.S.; methodology, formal analysis, B.B.Y.; writing and visualization, B.B.Y. and Y.S.; review and editing B.B.Y., Y.-H.J. and Y.S.; project administration and funding acquisition, Y.-H.J. We confirm this manuscript and data are original and have not been previously published or considered elsewhere. All authors have read and agreed to the published version of the manuscript.

Funding

This research was supported by the Korea Institute of Ocean Science and Technology (PEA0116) and the Basic Science Research Program of the National Research Foundation of Korea (NRF), funded by the Ministry of Education (grant no. 2018R1D1A1B05049865).

Institutional Review Board Statement

Not applicable.

Informed Consent Statement

Not applicable.

Data Availability Statement

Not applicable.

Conflicts of Interest

The authors declare no conflict of interest.

References

  1. Yang, H.S.; Kim, S.S. A study on sea water and ocean current in the Sea adjacent to Korea Peninsula. 1. Physical processes influencing the surface distributions of chlorophyll and nutrient in the southern sea of Korea in summer. Korean J. Fish Aquat. Sci. 1990, 23, 417–424. [Google Scholar]
  2. Kwon, K.Y.; Kim, C.H.; Kang, C.K.; Moon, C.H.; Park, M.O.; Yang, S.R. Limiting Nutrients for Phytoplankton Growth in the Seomjin River Estuary as Determined by Algal Bioassay experiment. Korean J. Fish Aquat. Sci. 2002, 35, 455–462. [Google Scholar]
  3. Song, E.; Shin, Y.S.; Jang, N.; Lee, J. Assessment of Nutrient and Light Limitation of Phytoplankton in the Youngsan Lake. Korean J. Limnol. 2010, 43, 35–43. [Google Scholar]
  4. Kagami, M.; Yoshida, T.; Gurung, T.B.; Urabe, J. Direct and indirect effects of zooplankton on algal composition in in situ grazing experiments. Oecologia 2002, 133, 356–363. [Google Scholar] [CrossRef]
  5. Keckeis, S.; Baranyi, C.; Hein, T.; Holarek, C.; Riedler, P.; Schiemer, F. The significance of zooplankton grazing in a floodplain system of the River Danube. J. Plankton Res. 2003, 25, 243–253. [Google Scholar] [CrossRef] [Green Version]
  6. Uhm, S.H.; Hwang, S.J. Grazing Relationship between Phytoplankton and Zooplankton in Lake Paldang Ecosystem. Korean J. Limnol. 2006, 39, 390–401. [Google Scholar]
  7. Tilman, D. Resource competition between plankton algae: An experimental and theoretical approach. Ecology 1977, 58, 338–348. [Google Scholar] [CrossRef]
  8. Tilman, D. Ecological competition between algae: Experimental confirmation of resource-based competition. Theory Sci. 1978, 192, 463–465. [Google Scholar]
  9. Smith, V.H.; Willen, E.; Karlsson, B. Predicting the summer peak biomass of four species of blue-green algae (cyanphyta/cyanobacteria) in Swedish lakes. J. Am. Water Resour. Assoc. 1987, 23, 397–402. [Google Scholar] [CrossRef]
  10. Trimbee, A.M.; Prepas, E.E. Evaluation of total phosphorus as a predictor of the relative biomass of blue-green algae with emphasis on Alberta lakes. Can. J. Fish. Aquat. Sci. 1987, 44, 1337–1342. [Google Scholar] [CrossRef]
  11. Scheffer, M.; Rinaldi, S.; Gragnani, A.; Mur, L.R.; van Nes, E.H. On the dominance of filamentous cyanobacteria in shallow, turbid lakes. Ecology 1997, 78, 272–282. [Google Scholar] [CrossRef]
  12. Xie, L.; Xie, P.; Li, S.; Tang, H.; Liu, H. The low TN:TP ratio, a cause or a result of Microcystis blooms? Water Res. 2003, 37, 2073–2080. [Google Scholar] [CrossRef]
  13. Choi, K.H.; Hwang, S.J.; Kim, H.S.; Han, M.S. Temporal changes of limiting nutrients and phytoplankton G-rowth rate in lake Paldang. Korean J. Limnol. 2003, 36, 139–149. [Google Scholar]
  14. Lee, S.H. Study on Nutrient Limitation and Trophic State in the Sumjin and Youngsan River System. Master’s Thesis, Mokpo National Maritime University, Mokpo, Republic of Korea, 2006. [Google Scholar]
  15. Kim, J.H.; Jeong, W.O.; Shin, Y.; Jeong, B. Evaluating Limiting nutrients through long-term data analyses and bioassay experiments in Cheonsu Bay and Taean Sea. J. Korean Soc. Mar. Environ. Saf. 2022, 28, 459–468. [Google Scholar] [CrossRef]
  16. Redfield, A.C. The biological control of chemical factors in the environment. Am. Sci. 1958, 46, 205–225. [Google Scholar]
  17. Kim, G.S. The Change of Pollution Loads flowing into Mokpo Harbour due to the Operation of Mokpo Municipal Sewage Treatment Plant. In Proceedings of the The Korean Society for Marine Environment and Energy, Ansan, Republic of Korea, 19–20 May 2000. [Google Scholar]
  18. Sin, Y.; Hyun, B.; Jeong, B.; Soh, H. Impacts of eutrophic freshwater inputs on water quality and phytoplankton size structure in a temperate estuary altered by a sea dike. Mar. Environ. Res. 2013, 85, 54–63. [Google Scholar] [CrossRef]
  19. Lee, Y.S.; Yu, J.; Kwon, K.; Choi, Y.; Cho, E.S. Temporal and spatial variations of limiting nutrient on phytoplankton growth in the Gwangyang Bay, Korea. J. Korean Soc. Environ. Eng. 2004, 26, 890–895. [Google Scholar]
  20. Hyun, B.G.; Shin, K.; Kim, D.S.; Kim, Y.O.; Baek, S.H. Understanding of Phytoplankton Community Dynamic-s through Algae Bioassay Experiment during Winter Season of Jinhae bay, Korea. J. Korean Soc. Oceanogr. 2011, 16, 27–38. [Google Scholar]
  21. Son, M.; Baek, S.H. The distinct characteristics of phytoplankton growth response and their community struct-ure following seven different nutrients addition in spring season of Jinhae Bay. J. Korea Acad.-Ind. Coop. Soc. 2015, 16, 6567–6574. [Google Scholar]
  22. Yeongsan River Basin Environmental Office. Available online: http://www.me.go.kr/ysg (accessed on 20 April 2023).
  23. Ministry of Land. 2011 Long-Term Comprehensive Plan for Water Resources; Ministry of Land: Sejong, Republic of Korea, 2011; pp. 10–18.
  24. Kim, S.G.; Cha, G.S. Effect of water quality improvement with secure instream flow in Yeongsan river. J. Green Ind. Res. Honam Univ. 2011, 17, 45–51. [Google Scholar]
  25. Jung, J.W.; Lim, B.J.; Cho, S.H.; Choi, J.H.; Song, K.D.; Ha, D.W.; Kim, H.S.; Park, S.H.; Hwang, T.H.; Jung, S.J.; et al. The influence of land use on water quality in the tributary of the Yeongsan river basin. Korean J. Limnol. 2012, 45, 412–419. [Google Scholar]
  26. Song, J.J.; Kim, B.B.; Hong, S.G. Study on water quality change of Yeongsan river’s upstream. J. Korean Soc. Environ. Technol. 2015, 16, 154–159. [Google Scholar]
  27. Kim, J.S.; Kim, J.Y.; Seo, D.I. Effect of major pollution sources on algal blooms in the Seungchon weir and Juksan weir in the Yeongsan river Using EFDC. J. Korea Water Resour. Assoc. 2020, 53, 369–381. [Google Scholar]
  28. Kim, Y.W.; Lee, J.W.; Woo, S.Y.; Kim, S.J. Evaluation of stream flow and water quality changes of Yeongsan river basin by interbasin water transfer using SWAT. J. Korea Water Resour. Assoc. 2020, 53, 1081–1095. [Google Scholar]
  29. Korea Meteorological Administration. Available online: http://www.kma.go.kr (accessed on 25 April 2023).
  30. Marine Environmental Measurement Network. Available online: http://www.meis.go.kr (accessed on 21 March 2023).
  31. Water Environment Information System. Available online: http://water.nier.go.kr (accessed on 21 March 2023).
  32. Parsons, T.R.; Maita, Y.; Lalli, C.M. A Manual of Chemical & Biological Methods for Seawater Analysis; Elsevier: Amsterdam, The Netherlands, 1984. [Google Scholar]
  33. Jung, Y.H. Illustrated Encyclopedia of Fauna & Flora of Korea Vol. 9 Fresh Water Algae; The Ministry of Education: Sejong, Republic of Korea, 1968.
  34. Sim, J.H. Illustrated Encyclopedia of Fauna & Flora of Korea Vol. 34 Marine Phytoplankton; The Ministry of Education: Sejong, Republic of Korea, 1994.
  35. Schindler, D.W. Evolution of phosphate limitation in lakes. Science 1977, 195, 260–262. [Google Scholar] [CrossRef] [Green Version]
  36. Fisher, T.R.; Peele, E.R.; Ammerman, J.W.; Harding, L. Nutrient limitation of phytoplankton in Chesapeake Bay. Mar. Ecol. Prog. Ser. 1992, 82, 51–63. [Google Scholar] [CrossRef]
  37. Lee, Y.S.; Yamada, T.; Seiki, T.; Mukai, T.; Takimoto, K.K.; Okada, M. Effect of freshwater due to heavy rain on phytoplankton growth in Hiroshima Bay. Jap. Soc. Water Environ. (JSWE) 1996, 19, 995–1003. [Google Scholar] [CrossRef] [Green Version]
  38. Moore, C.M.; Mills, M.M.; Arrigo, K.R.; Berman-Frank, I.; Bopp, L.; Boyd, P.W.; Galbraith, E.D.; Geider, R.J.; Guieu, C.; Jaccard, S.L.; et al. Processes and patterns of oceanic nutrient limitation. Nat. Geosci. 2013, 6, 701–710. [Google Scholar] [CrossRef] [Green Version]
  39. Redfield, A.C.; Ketchum, B.H.; Richards, F.A. The influence of organisms on the composition of the sea water. Sea 1963, 2, 26–77. [Google Scholar]
  40. Jang, P.G.; Jang, M.C.; Lee, W.J.; Shin, K. Effects of nutrient property changes on summer phytoplankton community structure of Jangmok bay. Ocean Polar Res. 2010, 32, 97–111. [Google Scholar] [CrossRef] [Green Version]
  41. Cho, E.S. Variations in marine environmentes and phytoplankton community around Mokpo Harbour. J. Environ. Sci. Int. 2010, 19, 1323–1336. [Google Scholar] [CrossRef] [Green Version]
  42. Choi, J.K. The Plankton Ecology of Korean Coastal Waters; Donghwa: Paju, Republic of Korea, 2011; pp. 30–104. [Google Scholar]
  43. Fisher, T.R.; Harding, L.W., Jr.; Stanley, D.W.; Ward, L.G. Phytoplankton, nutrients, and turbidity in the Chesapeake, Delaware, and Hudson estuaries. Estuar. Coast. Shelf Sci. 1988, 27, 61–93. [Google Scholar] [CrossRef]
  44. De Baar, H.J.W. von Liebig’s law of the minimum and plankton ecology (1899–1991). Prog. Oceanogr. 1994, 33, 347–386. [Google Scholar] [CrossRef] [Green Version]
  45. Begon, M.C.; Townsend, C.R.; Harper, J.L. Ecology: From Individuals to Ecosystems, 4th ed.; John Wiley & Sons: New York, NY, USA, 2012; pp. 574–583. [Google Scholar]
  46. Smayda, T.J. Harmful algal blooms: Their ecophysiology and general relevance to phytoplankton blooms in the sea. Limnol. Oceanogr. 1997, 42, 1137–1153. [Google Scholar] [CrossRef]
  47. Stoecker, D.K. Mixotrophy among Dinoflagellates 1. J. Eukaryot. Microbiol. 1999, 46, 397–401. [Google Scholar] [CrossRef]
  48. Villiot, N.; Maas, A.E.; Poulton, A.J.; Blanco-Bercial, L. Organic and inorganic nutrients modulate taxonomic diversity and trophic strategies of small eukaryotes in oligotrophic oceans. FEMS Microbes 2023, 4, xtac029. [Google Scholar] [CrossRef]
  49. Kim, S.J.; Lee, S.S. The development of treatment system for removing the low concentrated nitrogen and phosphorus using phototrophic bacteria and media. Korean J. Microbiol. 2010, 46, 27–32. [Google Scholar]
  50. Baek, S.H.; You, K.; Han, M.S. Analysis of environmental factors related to seasonal variation of bacteria and heterotrophic nanoflagellate in Kyeonggi Bay, Korea. Korean J. Environ. Biol. 2017, 35, 198–206. [Google Scholar] [CrossRef]
  51. Kim, S.H.; Sin, Y.S. Bacterial distribution and relationship with phytoplankton in the Youngsan River estuary. J. Mar. Life Sci. 2019, 4, 53–62. [Google Scholar]
Figure 1. Sampling stations in the Yeongsan River estuary and bioassay tank location.
Jmse 11 01337 g001
Figure 2. Experimental setup of the bioassay experiment. (A) The Station A and B tanks were covered with a screen to simulate in situ conditions. (B) The Station C tank had no cover.
Jmse 11 01337 g002
Figure 3. Seasonal variability in N:P ratio at the three stations from 2004 to 2008. The line indicates the N:P ratio of 16.
Jmse 11 01337 g003
Figure 4. Seasonal variability in N:P ratio at the three stations. The line indicates an N:P ratio of 16. Note that a break line was also added in the y-axis to show the data of Stations B and C during spring.
Jmse 11 01337 g004
Figure 5. Temporal distributions of water temperature, salinity, and light extinction coefficient (K) during sampling periods.
Jmse 11 01337 g005
Figure 6. Temporal distributions of (A) Temporal distributions of precipitation, photoperiod, (B) temperature, and (C) light extinction coefficient (=K) during bioassay experiment in winter.
Jmse 11 01337 g006
Figure 7. Temporal distributions of (A) Temporal distributions of precipitation, photoperiod, (B) temperature, and (C) light extinction coefficient (K) during bioassay experiment in spring.
Jmse 11 01337 g007
Figure 8. Temporal distributions of (A) Temporal distributions of precipitation, photoperiod, (B) temperature, and (C) light extinction coefficient (K) during bioassay experiment in summer.
Jmse 11 01337 g008
Figure 9. Temporal distributions of (A) Temporal distributions of precipitation, photoperiod, (B) temperature, and (C) light extinction coefficient (K) during bioassay experiment in fall.
Jmse 11 01337 g009
Figure 10. Chlorophyll a (Chl-a) concentrations over time (in a day) during the bioassay experiment in (A) winter and (B) spring (error bar = standard deviation).
Jmse 11 01337 g010
Figure 11. Chlorophyll a (Chl-a) concentrations over time (in a day) during the bioassay experiment in (A) summer and (B) fall (error bar = standard deviation).
Jmse 11 01337 g011
Figure 12. Distribution of the different phytoplankton groups during the bioassay experiment in (A) winter and (B) spring.
Jmse 11 01337 g012
Figure 13. Distribution of different phytoplankton groups during the bioassay experiment in (A) summer and (B) fall.
Jmse 11 01337 g013
Table 1. Nutrient addition for bioassay experiments.
NH4+NO3PO43−SiO2Note
Reagent addedNH4ClNaNO3K2HPO4Na2SiO3⋅9H2O
Addition amount in freshwater zone
(Station A and Station B)
11 mg/L11 mg/L6 mg/L23 mg/LThree times the maximum concentration in 2003–2010
Addition amount in saltwater zone
(Station C)
4 mg/L5 mg/L2 mg/L18 mg/LTwice the maximum concentration in 2003–2010
Table 2. Results (p-values) of Kruskal–Wallis test on difference in chlorophyll a (N = 6–14) between nutrient treatment and control groups.
SeasonStationMixedNH4+NO3PO43−SiO2
WinterA0.0160.0020.1260.1030.012
B0.0980.5520.0820.0260.231
C0.0000.9130.7210.0000.380
SpringA0.4740.7060.6370.1520.895
B0.3270.0650.0930.0000.806
C0.2140.1630.0110.0180.821
SummerA0.5640.2480.9311.0000.686
B0.9540.1840.1330.3860.525
C0.4880.2850.1490.4530.507
FallA0.8170.4190.8400.5640.525
B0.9080.2720.9540.4880.326
C0.0430.0080.2250.7290.225
Cont. vs. Mixed (Mixed), Cont. vs. NH4+ (NH4+), Cont. vs. NO3 (NO3), Cont. vs. PO43− (PO43−), Cont. vs. SiO2 (SiO2). Significant at p-value < 0.05 in bold.
Disclaimer/Publisher’s Note: The statements, opinions and data contained in all publications are solely those of the individual author(s) and contributor(s) and not of MDPI and/or the editor(s). MDPI and/or the editor(s) disclaim responsibility for any injury to people or property resulting from any ideas, methods, instructions or products referred to in the content.