1. Introduction
The Bay of Algeciras coastline, with more than 40 km in length, has material evidence of exceptional Underwater Cultural Heritage (UCH) as wrecks, ports, anchorages, etc. This UCH comes from the historical relationships, maintained over millennia, of the societies established in the area surrounding the Strait of Gibraltar with and by the sea. The conservation of the UCH is crucial as an intangible asset that brings responses from our past and has an outstanding universal value from a historical, aesthetic, ethnological or anthropological point of view. In addition, the sustainable exploitation of UCH will increase the relevance of cultural tourism within maritime tourism. Moreover, UCH plays a key role in sustainable development as an important economic engine, which has been recognized by the European Union (EU), the United Nations Educational, Scientific and Cultural Organization (UNESCO) or the International Council on Monuments and Sites (ICOMOS). In this sense, among the strategic objectives of the major economic programs, tourism, leisure, and other cultural activities have been identified as one of the major priorities and opportunities for Spain and Europe.
The formation process, preservation and future perspectives of conservation of the UCH located in coastal areas under the influence of the littoral process cannot be properly undertaken without considering and monitoring the particularities of the surrounding environment. The specific and particular physical–chemical conditions of the underwater environment have allowed, in several cases, the remains to reach a certain degree of stability, permitting each site to be unique [
1,
2]. Although a deeper theoretical–methodological development is still unclosed, the great dynamism to which these types of deposits are subjected is better understood. This step forward represents a remarkable conceptual advance over the usual and outdated notion of wrecks as “time capsules”, frozen spatially and chronologically. The complex processes operating in an underwater archaeological site and conditioning its state result from the permanent interaction of many agents acting on it [
2,
3,
4,
5], mainly the intensity and direction of the currents and waves, as well as sedimentary and geochemical processes.
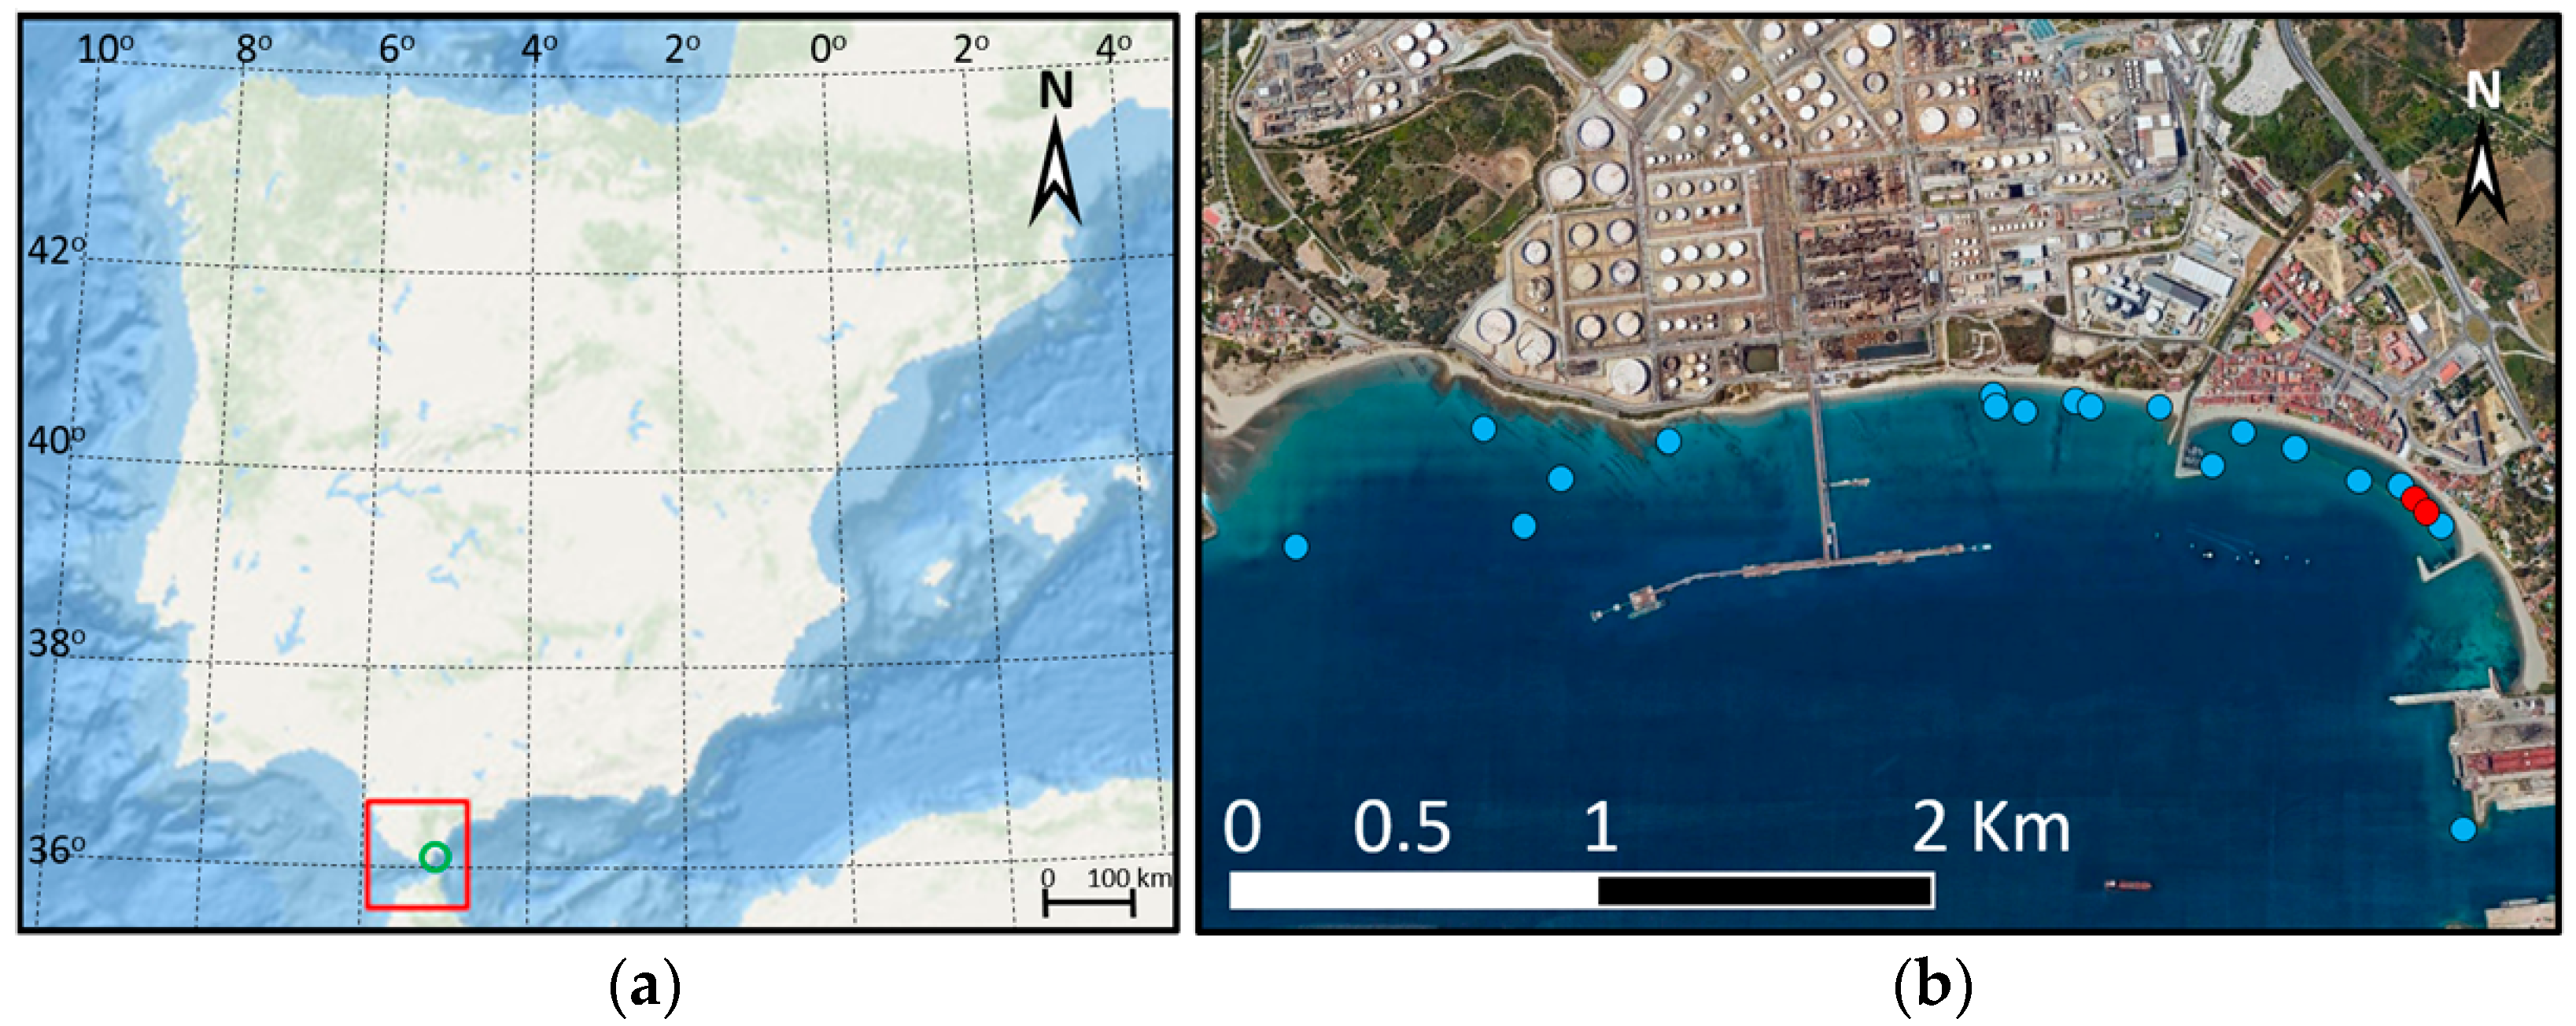
With the increasing number of shipwrecks and other submerged structures uncovered recently in the Bay of Algeciras [
6],
Figure 1, it becomes necessary to develop alternative methods of storage, conservation and stabilization of these archaeological sites. Rule Number 1 of the Annex to the 2001 UNESCO Convention on the Protection of Underwater Cultural Heritage [
7] states that “The protection of Underwater Cultural Heritage through in situ preservation shall be considered as the first option”.
In the last years, several projects [
8,
9,
10,
11] have shown the close relationship between the degree of conservation of the UCH and the marine environmental conditions and concluded that the environmental or anthropic parameters that affect underwater archaeological sites demand immediate actions based on their knowledge and adequate monitoring to prevent the irreversible destruction of the remains and to ensure their long-term stability. In this sense, physical variables are considered a key factor for the in situ preservation of UCH [
12] due to their direct impact on the integrity of fragile materials and the de-contextualization of objects and their ability to modulate or control other factors such as sedimentary dynamics, geochemical conditions and biological activity [
13]. However, the analysis of the impact of these parameters on the UCH has been performed without evaluating their changes in the long term. This fact is especially relevant in the context of global warming due to Climate Change (CC). The problem of CC and its influence on the conservation of the world’s natural and cultural heritage was pointed out by UNESCO [
7], highlighting the need for future research, the development of a legal framework, and interrelationships with other international organizations, such as the Intergovernmental Panel on Climate Change (IPCC). Because of the CC, changes in the wind and low-pressure systems can increase the frequency and intensity of extreme events such as a storm in the next century [
14]. The projected rise in global mean sea level ranges from 0.43 to 0.82 m for the best-case (RCP2.6) and worst-case (RCP8.5) at the end of this century. The sea surface temperature is also expected to increase from 0.05 to 0.5 °C decade-1 [
15]. These changes are not homogeneous in time and space; therefore, their impact on UCH will not be homogenous either. In the study area, the Bay of Algeciras, the sea level is expected to increase by 0.6 m at the end of the century, and the frequency of flooding events will increase up to 500 times for the RCP8.5 scenario [
16]. The yearly mean sea surface temperature is projected to increase by almost 3 °C by 2100 along the Alboran Sea coast, particularly in summer [
17].
In this context: (i) the high density of cultural heritage assets on the coast of the Bay of Algeciras; (ii) its social and economic relevance; (iii) the threatening impact of climatic factors contributing to its deterioration; and (iv) the necessity of long-term preservation; the option of in situ protection and monitoring for the required initial environmental characterization can have an unaffordable cost in some cases. Therefore, it is also necessary to develop new tools and methodologies that help identify and prioritize those sites where the in situ protection program or other actions (prospecting, excavation and archaeological documentation) should be implemented to mitigate the loss of archaeological information. The design, development and deployment of autonomous ocean platforms for the observation, exploration and monitoring of marine and oceanic environments have grown exponentially with the lowering of production costs and technological developments brought about by the digital revolution. With the advent of the digital revolution, which has generalized the use of electronic circuits and TTL technology, unmanned vehicles with different degrees of autonomy, marine as Unmanned Surface Vehicles (USV) or underwater as Autonomous Underwater Vehicles (AUV), as well as Remotely Operated Vehicles (ROV), and more recently aerial as Unmanned Aerial Systems (UAS), have begun to revolutionize the exploration of the marine environment and coasts, generally offering observation platforms at a lower cost, free of risks for operators, and capable of obtaining more information in less time [
18,
19]. Remote sensing tools operating from unmanned vehicles and satellites are contributing to the integration of terrestrial and marine datasets for the assessment of geohazards in coastal and marine areas, with special reference to tsunamis and storms, coastal and marine landslides and sea-level rise-related hazards [
20]. In the specific case of USVs, they have been extensively used in archaeological and archaeometric missions, including studies of coastal evolution in shallow waters in areas of high historical interest [
21,
22,
23,
24].
These new platforms and the observations they make are essential for documenting the state, variability and changing conditions of the oceans under climate change and other anthropogenic pressures, as well as the effect of such changes on ecosystems or the cultural heritage that remains there. This knowledge is crucial for understanding, predicting and ultimately mitigating and adapting to present and future adverse impacts. These impacts can be more severe in shallow water, where cultural heritage sites are most vulnerable to natural and human-induced impacts, making it critical to document and monitor them over time. Multibeam Echosounders (MBES) and photogrammetry are two techniques commonly used for mapping and documenting underwater sites [
25,
26]. While MBES provides a detailed digital terrain model of the seabed and can be installed in a USV, photogrammetry performed by divers can provide the highest resolution data on objects and structures. Integrating these techniques can provide a more comprehensive and accurate representation of the site. In this study, we present a case study of the integration of MBES and photogrammetry for the documentation and monitoring of cultural heritage sites in the shallow waters of the Bay of Algeciras. The results demonstrate the benefits of using this combined approach for accurately documenting and monitoring cultural heritage sites in shallow waters, providing valuable information for conservation and management efforts.
Therefore, this paper focuses on comparative experimental fieldwork at two submerged sites. The shite of Puente Mayorga IV contains the remains of a probable gunboat used during the sieges of Gibraltar at the end of the 18th century. Its original construction system and the scarce knowledge of this type of small craft make it very interesting for archaeological and naval history research. For these reasons of originality and exceptionality, we decided to undertake an excavation to obtain detailed planimetry in order to study its naval construction. During this process, priority was given to non-intrusive techniques in the documentation, such as digital methods or real measurements in situ. The contemporary shipwreck is located very close to the Puente Mayorga IV shipwreck. This structure, from the end of the 20th century, is at a very shallow depth, and we have used it, especially as a control element for satellite or aerial measurements in the framework of experimentation with different techniques for recording the UCH of the area.
2. Materials and Methods
2.1. Unmanned Vehicles and Sensors
Data were collected by using two unmanned vehicles from the University of Cadiz Peripheral Drone Service (
www.dron.uca.es, accessed on 1 April 2023),
Figure 2: a DJI Matrice 300 RTK UAS and a Maritime Robotics Otter Pro USV. The Matrice 300 UAS incorporated a Zenmuse P1 sensor for precision photogrammetry in flight, with a horizontal accuracy of 3 cm and a vertical accuracy of 5 cm, a global mechanical shutter with a shutter speed of 1/2000 s, and a 4.4 μm pixel size. The data were post-processed using the commercial software Pix4D Postflight Terra, a suite for UAS mapping. Several studies have used active remotely sensed imagery collected by UAS to visually detect and record shipwrecks in shallow water, and more recently, results based on hyperspectral technology and LiDAR bathymetry have been published [
27,
28,
29]. Data obtained with UAS on the contemporary shipwreck have been used to calibrate other measurements obtained by Google Earth, bathymetric probes and divers.
Regarding the Otter Pro USV, it was the vehicle in charge of autonomously carrying out the bathymetric work. This USV is a small catamaran with a footprint of 200 × 108 × 81.5 cm and a weight of 63 kg, adequate for bathymetric surveys in sheltered waters (such as shallow-water coasts, harbour areas, lakes, canals, rivers and ponds). The USV is controlled by Maritime Robotics’ Vehicle Control Station (VCS), a graphical user interface with several control modes, such as course and speed control, heading control, or waypoint control.
The integration between the onboard control systems and the MBES allows autonomous bathymetric work to be carried out. The hydrographic work was conducted with a Norbit iWBMSe MBES coupled to an Applanix Position and Orientation System for Marine Vessels (POS MV). Some technical specifications of the MBES are a swath coverage between 5 and 210°, a range resolution of less than 10 mm, a number of beams between 256 and 512, an operating frequency selectable at 200, 400 or 700 KHz, a resolution (across × along) of 0.9° × 1.9° at 400 KHz and 0.5° × 1.0° at 700 KHz, a heading accuracy of 0.08° (Real Time Kinematic, RTK), pitch/roll accuracy of 0.03° and heave accuracy of 2 cm or 2%. For post-processing correction of the bathymetric data, velocity profiles were obtained with an AML Base2 sound profiler, launched automatically from a winch on board the USV. Finally, the Applanix POS MV provides accurate navigation and attitude data to correct the effects of USV motion during survey operations, combining the IMU (Inertial Measurement Unit) and GNSS (Global Navigation Satellite System) sensor data into an integrated navigation system. The appropriate topographic measurements guaranteed the quality of the positioning data in conjunction with the DGPS RTK positioning system and NTRIP (Network Transport of RTCM via Internet Protocol) corrections from the Andalusian Positioning Network and the movement sensor.
Two calibrations were performed before data acquisition: (1) the calibration of the Applanix positioning system and inertial system, performing the “turns of 8” for adjustment in the offset of the equipment and adjustments in the heading of the boat; and (2) the calibration of the Norbit sounder, following the standards set by the International Hydrographic Organization (IHO) for Special Order areas [
30] and performing the relevant calibration lines to adjust the pitch, yaw and roll of the sounder. Following this standard, the maximum allowable vertical uncertainty in vertical measurements was calculated with the following formula: “
a” (the portion of the uncertainty that does not vary with the depth, 0.25 m Special Order) and “
b” (coefficient that represents that portion of the uncertainty that varies with the depth, 0.0075 Special Order), together with the depth “
d”, the parameters that have to be introduced in the formula of the Total Vertical Uncertainty (TVU):
A project of lines was prepared to cover the archaeological remains to be studied and to guarantee a good overlap between the lines to achieve a good data resolution, which in our case was 100%. We used a working speed of 2 knots, which we recommend for working in shallow waters. The data were recorded at a frequency of 700 kHz with a beam aperture of 90°. The registration time was 45 min.
There are numerous studies in the literature on the use of MBES for imaging submerged shipwrecks from conventionally manned vessels [
31,
32,
33,
34,
35]. However, we do not know of any study in which this combination of technologies, MBES plus USV and photogrammetry, has been used in the dimensional study of a shipwreck.
2.2. Google Earth
As a first approach, we used Google Earth (GE) for the acquisition of dimensions and shape information for the contemporary shipwreck. Other authors have already proposed the use of GE as a tool to identify abandoned ships and shipwrecks [
36]. GE is a geographic information system that displays a virtual three-dimensional globe that allows the visualization of multiple cartographies, based on satellite images, aerial photography and GIS data. Among other tools available through the desktop application, GE includes a distance measurement tool.
2.3. Bathymetric Data Collection and Post-Processing
The USV has two computers. The first one is used to control the vessel’s movement and speed according to the preplanned lines and orders received by radio. The second one is used for running the MBES and to record the position, attitude, sound velocity at the transducer, time and depth. This computer also records the Sound Velocity Profiles (SVP) when they are obtained.
MBES are the best tool for depth calculation, together with mapping the seabed, because they obtain the complete seafloor insonification with a good resolution. The latter mainly depends on the distance from the MBES transducer to the bottom and the frequency of the sound rays; the higher the frequency, the better. In our case study, that distance was under 3 m, and the frequency was 700 KHz, the highest of our equipment. We achieved good results in spite of the physical limitation of the sound propagation, which prevented us from obtaining more detail on the smallest elements of the wreck.
The MBES principle of operation is based on a transmission pulse directed towards the seafloor. This pulse is narrow along the heading direction of the vessel and wide across the course. After the reflection of the sound by the seabed, the receiving beams are electronically generated. The two-way travel time between transmission and reception is computed by seabed detection algorithms. With the application of ray tracing correction due to the refraction of the sound rays, it is possible to determine (a) the depth and (b) the transversal distance from the USV nadir to the small insonified area by each beam.
The transmitted beam is wide across the USV course and narrow along it, only 1°; on the other hand, the beams electronically formed during the reception phase are wide along the course, near 180°, and narrow across it, only 0.5°. The intersections of the unique transmitted beam in the seabed with the X electronically reception beams are the small areas (footprints) where X soundings are measured. In our case, X was 512 in order to reach the best resolution possible of the wreck.
Since depths are measured from a floating USV with six possible degrees of freedom (three translations and three rotations), for accurate computation of depth measurement and its associated positioning, precise measurements of latitude, longitude, heave, roll, pitch and heading are also recorded by the Applanix IMU, as described in
Section 2.1.
To gather complete information about the seabed by MBES, a planned survey with transect lines is needed. It consisted of some parallel lines to the wreck’s keel and another set of lines across, centered in the position of the wreck. Its length was longer than the keel, about 50 m, and the separation among them was only 3 m, to ensure that the overlap was 100% and to prevent any gap or area without data due to the true track of the USV.
Data processing was performed with two software packages for comparison: the HySweep module of the Hypack software (version 2020) and the NaviModel Producer software from EIVA (product no: NM.PRO). Once the data were acquired, a bathymetric surface was generated with the real minimum height, although a CUBE (Combined Uncertainty and Bathymetric Estimator) surface was previously generated with the confidence criteria, and a filter was applied to clean up the very erroneous data above the 95% confidence level. The rest of the data was cleaned manually.
2.4. Photogrammetry and Post-Processing
Photogrammetry is a recording technique that has been used in underwater archaeology since the 1970s [
37], although the first experiments were made as early as the 1960s [
38,
39], because it makes it possible to obtain a 3D model of any object by taking photographs from different angles. As long as visibility conditions allow, it is a method by which a virtual visualisation of any site can be obtained, requiring less dive time than traditional archaeological drawing and sparing the subjective aspects of the archaeological process [
38].
Photogrammetry uses a variety of algorithms and techniques to perform image processing and three-dimensional reconstruction. Some of the algorithms used include:
Feature matching is used to correlate key points between different images using algorithms like SIFT (Scale-Invariant Feature Transform) or SURF (Speeded-Up Robust Features). These algorithms find key points in the images and compare them to establish correspondences [
40,
41].
Triangulation is used to calculate the three-dimensional position of a point from the images. One of the most common algorithms is the Delaunay Triangulation method, which uses corresponding spots in multiple images to calculate the 3D position of the points of interest [
42].
Bundle adjustment is an algorithm used to adjust the camera parameters and improve the accuracy of the 3D model. Bundle adjustment methods, such as the least squares method, estimate the camera parameters and 3D points that minimize the discrepancies between the observed 2D projections and the estimated 2D projections in the 3D model [
43].
Image fusion is used to combine multiple overlapping images into a single panoramic or mosaic image. These algorithms perform image alignment and correction to achieve smooth and seamless transitions between the images [
44].
Outlier point filtering is used to improve the accuracy and quality of the 3D model by identifying and removing points that do not fit well with the model or have a high discrepancy compared to other points [
45].
A GNSS device was used to take various control points on the site. This operation was carried out by three divers and a 4-metre pole attached to the top of the GS receiver or GNSS antenna. This end of the pole, which was out of the water and on the surface, was operated by one diver, while another diver placed the lower part of the pole, submerged, at the exact point on the shipwreck whose coordinates were to be recorded. The third diver, on the boat, recorded each point with the GNSS pad.
For the photogrammetric documentation of
Puente Mayorga IV, a total of 1650 photographs were taken over the shipwreck, covering an area of 54.4 m
2 in a “grid” pattern (
Figure 3). This means that zenith photographs were taken over the site at an altitude of 1.1 m, making 18 lines longitudinal to the axis of the shipwreck, and then a second coverage was performed, with 39 lines transversal to the previous ones [
39]. The overlap between the photographs was at least 60%, leaving a distance between the longitudinal lines of approximately 65 cm. The spacing of the transverse lines varied widely, ranging from 20 to 60 cm, and several lines at different altitudes overlapped to document all the details of the shipwreck’s frames. The camera used was a GoPro Hero 7 Silver with a resolution of 3648 × 2736 pixels and a focal length of 3 mm. In addition, thirteen control points were marked on the shipwreck, the coordinates of which were recorded with a Leica GS18 GNSS in the ETRS89/UTM zone 30N coordinate system to fix the 3D model in its correct spatial relationship [
39].
The dive time required to take the photographs was one hour and twenty-nine minutes. If we take into account the time for setting the scales, the North arrow, the control measurements, the setting of the control points, and the taking of their coordinates, one hour more must be added. At this point, it should be noted that the results obtained with photogrammetry, which provides a good visualisation of the shipwreck in which many details of its naval architecture can be observed, are because the site was excavated and cleaned before the photographs were taken.
In other words, without prior excavation, photogrammetry only outlines the shipwreck and displays those details that are not buried. Therefore, if we want to compare results between detailed photogrammetries such as the one of Puente Mayorga IV, the excavation time (21 days) must be taken into account.
For the subsequent processing of the photogrammetry, the Agisoft Metashape Pro software version 1.8.3 from Agisoft was used.
4. Discussion
Studying a submerged archaeological site without its alteration should be considered a fundamental premise. In order to keep archaeological sites intact while obtaining as much information as possible, remote sensors play a fundamental role. There are different types of sensors: passive sensors use the electromagnetic spectrum, such as photogrammetry, while active sensors transmit and receive sound (e.g., multibeam sounders). Both have strengths and weaknesses; therefore, depending on the shipwreck to be studied, environmental conditions, resources and time, one or the other can be used, or even both.
In this contribution, we have studied two wrecks, one historical and one contemporary. The contemporary shipwreck is on the bottom and has no documentary value, but it was used to validate the techniques. The
Puente Mayorga IV shipwreck was completely buried. One side of the wooden hull of the ship, together with dozens of projectiles concreted in a large mound nest to the starboard bow area, were preserved. The excavation of the wreckage, before the photogrammetry and MBES work, involved three weeks of work with divers. For both techniques, the wreckage must emerge sufficiently from the seabed. These techniques have already been used together with success in [
49], where high-resolution sonar and a photogrammetric system were integrated to compare objects on the bottom of a lake as a complete, high-potential, simple and fast monitoring method for inland waters.
Before assessing the feasibility of one technique or another, it is necessary to establish which parameters will be used to compare both techniques: safety for the researchers, degree of autonomy, speed and ease of installation, calibration and design of the data acquisition method, data acquisition and its processing time, economic cost, and finally the quality of the data obtained.
The main limitation of photogrammetry, based on underwater photography, is water turbidity. Thus, in areas such as marshes or river mouths, little or no visibility due to suspended sediment present throughout the water column hinders the realization of photographs. Within open sea areas, water clarity or turbidity will be conditioned by depth, type of bottom, plankton, currents, wind and prevailing waves, proximity to mouths and estuaries, etc. Another major limitation of photogrammetry is working depth. This parameter not only hinders the georeferencing and orientation of the digital model of the shipwreck, but also when depth increases, reduces the time spent by divers, increases their risks, and causes light to be lost and colours to be attenuated or disappear, starting with the lower frequencies. This can be solved by using artificial light or an ROV [
50].
For multibeam echo sounder bathymetry, there are two types of uncertainties to take into account: uncertainty in the position of the soundings (positioning uncertainty) and uncertainty in the determination of depth (vertical uncertainty). The regulations established by the IHO determine limit values that help check if the order used is correct. For Special Order surveys, the position of the soundings must be determined with a maximum Total Horizontal Maximum Uncertainty (THU) of 2 m depth at a 95% confidence level. The vertical uncertainty of a sounding is understood as the uncertainty of the reduced depths. Hence, it is necessary to combine all the errors made with depth determination. The formula described in
Section 2.4 will be used to calculate, at a 95% confidence level, the maximum allowable TVU. As with the rest of the acoustic sounding systems, multibeam echo sounders can accumulate several errors that can degrade the accuracy of position and depth. Some of the most common are instrumental errors of the sounder itself; GPS errors; errors in the measurement of tides; errors in the measurement of the speed of sound; and errors due to the ship’s inertial movements (pitch, roll and heave).
As aforementioned, the photogrammetry consisted of more than 1600 photographs systematically taken over an hour and a half by divers with an underwater camera. With favourable environmental and meteorological conditions, the acquisition of photographs of the shipwreck followed a pre-designed pattern, obtaining the greatest detail of the shipwreck and its cargo. Subsequently, with the help of specialized software (Futtock), the images were post-processed for 15 h to generate a 3D digital model of the shipwreck, which allowed the study of the naval architecture of the shipwreck and its linkage. The smaller the separation between the photo acquisition lines and the slower the speed to cross these lines, the more time is demanded for data acquisition through photographs, approximately three times longer than a bathymetric work from USV.
On the other hand, the MBES system aboard USV was used to obtain acoustic information on the seafloor. This approach allowed us to measure seafloor depth and represent its cartography, as well as detect georeferenced objects. In this case, the fieldwork was completely autonomous and lasted 45 min, while the post-processing with software took two hours. Additionally, while diving always involves some risk for archaeologists, the risk of an accident is non-existent for technicians working with an MBES installed on a USV since it carries out the work in a programmed manner.
Regarding economic efforts, a distinction must be made between the costs associated with equipment and those related to its operators. The equipment needed to perform the photogrammetry (including a rigid inflatable boat) is much cheaper than the multibeam sounder carried out by an autonomous surface vehicle. In terms of personnel, only two technicians located on land were needed for the USV and the bathymetry, while photogrammetry was carried out by two divers plus the person in charge of the boat, increasing the cost of this item. Post-processing time was also much less in the bathymetric work. Additionally, we valued not only the price of each specific software to analyse data but also the ease of use. Thus, there is a clear advantage for photogrammetry since it does not require acquisition software, and the post-processing is much cheaper and easier to handle than the MBES system. In addition, photogrammetry needs fewer auxiliary data to obtain a good result since it only demands a series of control points whose geographical coordinates are established with GNSS equipment. Nevertheless, MBES forces us to know the position of the sensor and the speed of sound in the water at all times, its movement with the prevailing swell, the height of the tide, the installation parameters of the antennas of the positioning equipment and the transducer of the sounder, as well as the sound velocity profile in the water column.
In terms of environmental and meteorological conditions, both systems have their limitations. As already mentioned, the biggest enemy of photogrammetry is turbidity, which can hamper its use. On the contrary, turbidity practically does not interfere with the effectiveness of MBES. Therefore, this technique can be used as long as the weather conditions are good since waves affect the navigation of the USV and the quality of the obtained data. In any case, in this work, the conditions were excellent for the use of both techniques.
Finally, the quality and comparability of the results can be considered the fundamental points of the study. In principle, the DEM resulting from photogrammetry offers great detail of the smaller elements of the shipwreck and therefore could offer better accuracy in the measurements. With large dimensions, it is preferable to use the model generated by the MBES system. This model is not subject to the distortions of the photogrammetric model, which are produced by the non-integration of the measurements. An example of distortion is the use of a measuring tape to measure the distance between points without any orientation between them. Another is the coordinates of the control points, which are obtained either from a buoy located in the more or less approximate vertical of the point or with a pole of several meters that, supported on them, must emerge from the water with difficulty, in any case, to do it in the same vertical.
For instance, this distortion could be observed on the right-hand side of the transverse profiles of the shipwreck (lines 4 and 5 in
Figure 9a) (
Figure 11), since models from both techniques presented some distance among them. On the contrary, the longitudinal profiles (lines 1, 2 and 3 in
Figure 9a) show that the two models are very close to each other (
Figure 12). Profiles 1 and 2 have a good fit between the DEM (in green) and the two DBM (blue and red). In profile 3, a small displacement in X–Y can be observed between the two models, causing the DEM profile not to be carried out on the ceiling stringer but near the keel, giving rise to the appearance of the saw teeth of the floors and clearances (floor spacing). Moreover, as can be observed in profile 5, the two models on the starboard side of the shipwreck have an appreciable difference in Z, something that does not occur on the port side as in profile 2.
Since the MBES system requires the emission of an acoustic wave and its reception in multiple beams, it is very difficult to penetrate the small gaps between the frames or floors. For this reason, the models are almost coincidental on the floors. The photogrammetric DEM is better adjusted for clearances than the DBM. Moreover, since the latter is designed to detect the minimum depth of each beam, it will be affected by shadows generated from behind by obstacles such as frames, excluding when the beam is incident directly on the vertical. This problem could be improved by making more data acquisition lines, i.e., increasing the density of lines by decreasing the separation between them, closing the beams to give higher resolution, and obtaining data in other scanning directions in addition to those in two perpendicular directions.
Either way, even if the number of lines is increased, the physical limitation of acoustic propagation is imposed. Thus, the greater the distance to the shipwreck, the lower the resolution achieved and the fewer details obtained from the wreckage using an MBES system. For greater depths, this problem could be solved or reduced by using an AUV (Autonomous Underwater Vehicle) instead of a USV, which allows one to get very close to the objective shipwreck.
The use of photogrammetry is widespread among archaeologists due to its simplicity and low economic requirements, but this is not the case for MBES. Although it is more complex and expensive, MBES can be used in the study and monitoring of submerged archaeological sites in shallow waters, as it complements photogrammetry and sometimes even replaces it when water turbidity does not allow its use. In the best of cases and whenever possible, both techniques should be combined, as has been demonstrated in this work. Therefore, an effective joint work protocol would be (1) to obtain a DEM with MBES of a wide study area, to know the general geo–morphological dynamics, and to establish a specific documentation priority for sites that are in the process of being unearthed; (2) Once the intervention priorities have been defined, detailed documentation is carried out on some underwater archaeological sites using photogrammetry, as long as the water clarity allows it. (3) Afterwards, the site is covered and the control points of the tumulus are defined, or if it is left uncovered, the control points are archaeological features identified in the fieldwork. (4) Finally, the first MBES documentation of the site and the immediate surroundings is carried out, which will serve as a base model for (5) Monitoring at least once in every warm and cold season in those areas of concentration of shipwrecks with USV.
5. Conclusions
Within the framework of the virtual documentation projects, we have developed a non-intrusive methodology for the documentation of the UCH. In this contribution, we prioritize exploration over recovery and innovation by using geophysical techniques that map the seabed without altering the UCH, identifying what is buried, what is anomalous and at what depth, as well as helping to monitor its degree of preservation. Once it is, our number one concern is to leave the underwater archaeological artefacts in their original location and to document them through interventions in which we establish a proportionate ratio between the impact caused and the scientific information obtained. Our specific action is therefore based on graphic documentation using various techniques (photogrammetry, MBES, video, 360° video, scanning, drawing, etc.). Once processed and studied, these results give rise to virtual models that we use to continue researching the UCH or to communicate it to society.
To date, we have seen how photogrammetry offers greater detail in the documentation of singular elements of the naval architecture of wrecks. In contrast, the use of MBES does not achieve this level of detail. Comparing the two techniques would be complicated and may even be unrealistic in archaeological research given the differences in data acquisition principles (acoustic vs. optical data). However, the complementary use of both techniques is of great interest since MBES with USV covers large areas with a high-resolution level of detail. This aspect is very useful for large-scale monitoring of coastal sites that are at risk of quick burial/covering due to changes produced by climatic change. Data acquisition and post-processing are fast, and sea work is safe and agile as long as wave conditions allow the USV to navigate. Likewise, the use of photogrammetry for the detailed documentation of shipwrecks is necessary if we want to accurately assess aspects of historical interest but, above all, to know millimetric losses and deterioration, which in the medium term affect this heritage. Photogrammetry allows us to know if this or that object has been removed or if the timber has been displaced, and MBES allows us to know if the entire site is being displaced, covered, or eroded. Nevertheless, photogrammetry requires adequate water transparency and longer times of data collection and post-processing, and since it is carried out by divers, risks that could be eliminated by using an ROV are present.
Therefore, the complementary use of both techniques is very productive. In our experience, the joint use of the techniques is useful for monitoring and controlling the deterioration processes of coastal underwater sites in shallow waters in scenarios of anthropic hazards or climate change. Photogrammetry provides the first level of detail necessary to establish control points for site deterioration as well as to obtain archaeological data. Once photogrammetric recording has been carried out, sites can generally be covered with sandbags or re-entered to ensure better preservation. Thereafter, the use of MBES from a USV, which is more economical, safe and effective in covering large areas, is an excellent tool to carry out periodic monitoring of the sites, checking the measures or control elements established in the detailed photogrammetric documentation or the evolution of burial tumulus if the sites have been covered for their protection.
In conclusion, we would like to recall that prioritizing non-intrusive techniques over intrusive ones offers not only the possibility to perform constant monitoring of archaeological sites and to document numerous underwater archaeological sites in a short time and effectively but also helps heritage managers prioritize the order of intervention on different archaeological sites according to the risk they present. Acting quickly and efficiently in the field is essential to protecting a unique heritage that is at risk.

 ,
, 


