Article

Numerical Investigation on Cavitation Jet in Circular Arc Curve Chamber Self-Excited Oscillation Nozzle

1
Marine Engineering College, Dalian Maritime University, Dalian 116026, China
2
College of Ocean Engineering, Guangdong Ocean University, Zhanjiang 524088, China
*
Author to whom correspondence should be addressed.
J. Mar. Sci. Eng. 2023, 11(7), 1391; https://doi.org/10.3390/jmse11071391
Submission received: 7 June 2023 / Revised: 6 July 2023 / Accepted: 7 July 2023 / Published: 10 July 2023
(This article belongs to the Section Ocean Engineering)

Abstract

:
In order to improve the cavitation performance of the self-excited oscillation nozzle (SEON), a novel SEON with a circular arc curve chamber was designed by changing the chamber wall profile of the SEON. The performance of the circular arc curve chamber SEON was studied numerically. Taking the vapor volume distribution and the vapor volume fraction as the evaluation indexes, the influences of the chamber wall profile on the cavitation performance of the circular arc curve chamber SEON were analyzed. In addition, it was compared with the broken-line chamber SEON. The numerical results show that the cavitation performance of the circular arc curve chamber SEON is first enhanced and then weakened by increasing the circular arc radius. The circular arc curve chamber structure can form a larger central cavitation volume in the nozzle, which improves the cavitation performance of the SEON. When the circular arc radius is 2 mm, the cavitation area and the turbulent kinetic energy of the circular arc curve chamber SEON increase by 122.5% and 16.9%.

1. Introduction

As a ship remains in the water for a long time, a large number of aquatic organisms and algae will attach to the surface of the hull, leading to increased resistance of the ship. Cleaning the hull can not only reduce the ship’s resistance and reduce greenhouse gas emissions, but also effectively prevent biological invasion and maintain the local ecological balance. Water jet cleaning is one of the common methods used in underwater hull cleaning. The self-excited oscillation cavitation jet is considered the most promising underwater hull cleaning method, due to its own pulse effect and instantaneous velocity several times higher than that of a continuous jet [1]. The self-excited oscillation cavitation jet is not only outstanding in the field of underwater hull cleaning [2], but is also widely used in cutting [3], underground drilling [4,5], marine mining [6], and other industries.
Optimizing the cavitation performance of the self-excited oscillation nozzle (SEON) is the key to improving the efficiency of underwater hull cleaning. The operating conditions [7], target [8], structural parameters of the nozzle [9], and multi-field coupling [10] will affect the cavitation performance of the self-excited oscillation cavitation jet. Erosion and visualization experiments are important methods to study the characteristics of the cavitation jet [7]. The erosion experiment can not only obtain the cavitation performance by calculating the mass loss before and after the erosion sample but can also obtain the surface topography of the erosion sample. The erosion process of the cavitation jet on samples is relatively complicated. Cavitation collapse affects the distribution and size of the pits on the sample surface [11,12] and is accompanied by shock wave generation [13]. The visualization experiments can capture the images of the cavitation cloud, process the image data, and analyze the characteristics of the flow field. Currently, the commonly used image analysis methods include the detection of dimensionless gray intensity [14] and the proper orthogonal decomposition [15]. Through the analysis of the morphology of the cavitation cloud, it can be found that the erosion ability of the cavitation jet comes from the energy released when the cavitation collapses. That is to say, the cavitation clouds with irregular boundaries or about to be broken have a better erosion effect on samples [16]. It can be seen that the cavitation cloud morphology of the cavitation jet has an important influence on its erosion effect. The nozzle structure is the most important factor affecting the cavitation cloud morphology [17]. Its parameters will not only affect the flow characteristics of the cavitation jet but will also influence the axial pressure of the cavitation jet [18,19]. In addition, the grooves [20] and the roughness [21] on the inner surface of the nozzle will increase the energy disturbance of the jet and promote the generation of cavitation clouds. A study on the chamber structure of the SEON in the literature [22] showed that the pulse intensity of the cavitation jet was affected by changing the structural parameters of the SEON. The increase of pulse intensity in the self-excited oscillation cavitation jet is due to the transient accumulation and release of jet energy by the cavitation vortex ring in the self-excited oscillation chamber. Therefore, it is necessary to study the cavitation vortex ring in the chamber to increase the pulse intensity in the SEON. Wang et al. [23] adopted Bézier curves to optimize the chamber wall of the SEON. This structure improves the cavitation vortex ring distribution in the chamber of the SEON and enhances the cavitation performance and pulse intensity of the SEON. However, the change in the wall profile of the SEON will result in the reduction of the chamber space and the length of the collision wall. More importantly, the SEON optimized by the Bézier curve is difficult to process and apply in practice.
Therefore, in this paper, the broken line at the end of the collision wall of the chamber was designed as a circular arc curve to form a novel circular arc curve chamber SEON. The numerical investigation of the circular arc curve chamber SEON was carried out by Ansys Fluent. The cavitation performance of the SEONs with different circular arc radii was investigated. In addition, a comparative study was conducted with the broken-line chamber SEON.

2. Design of SEON

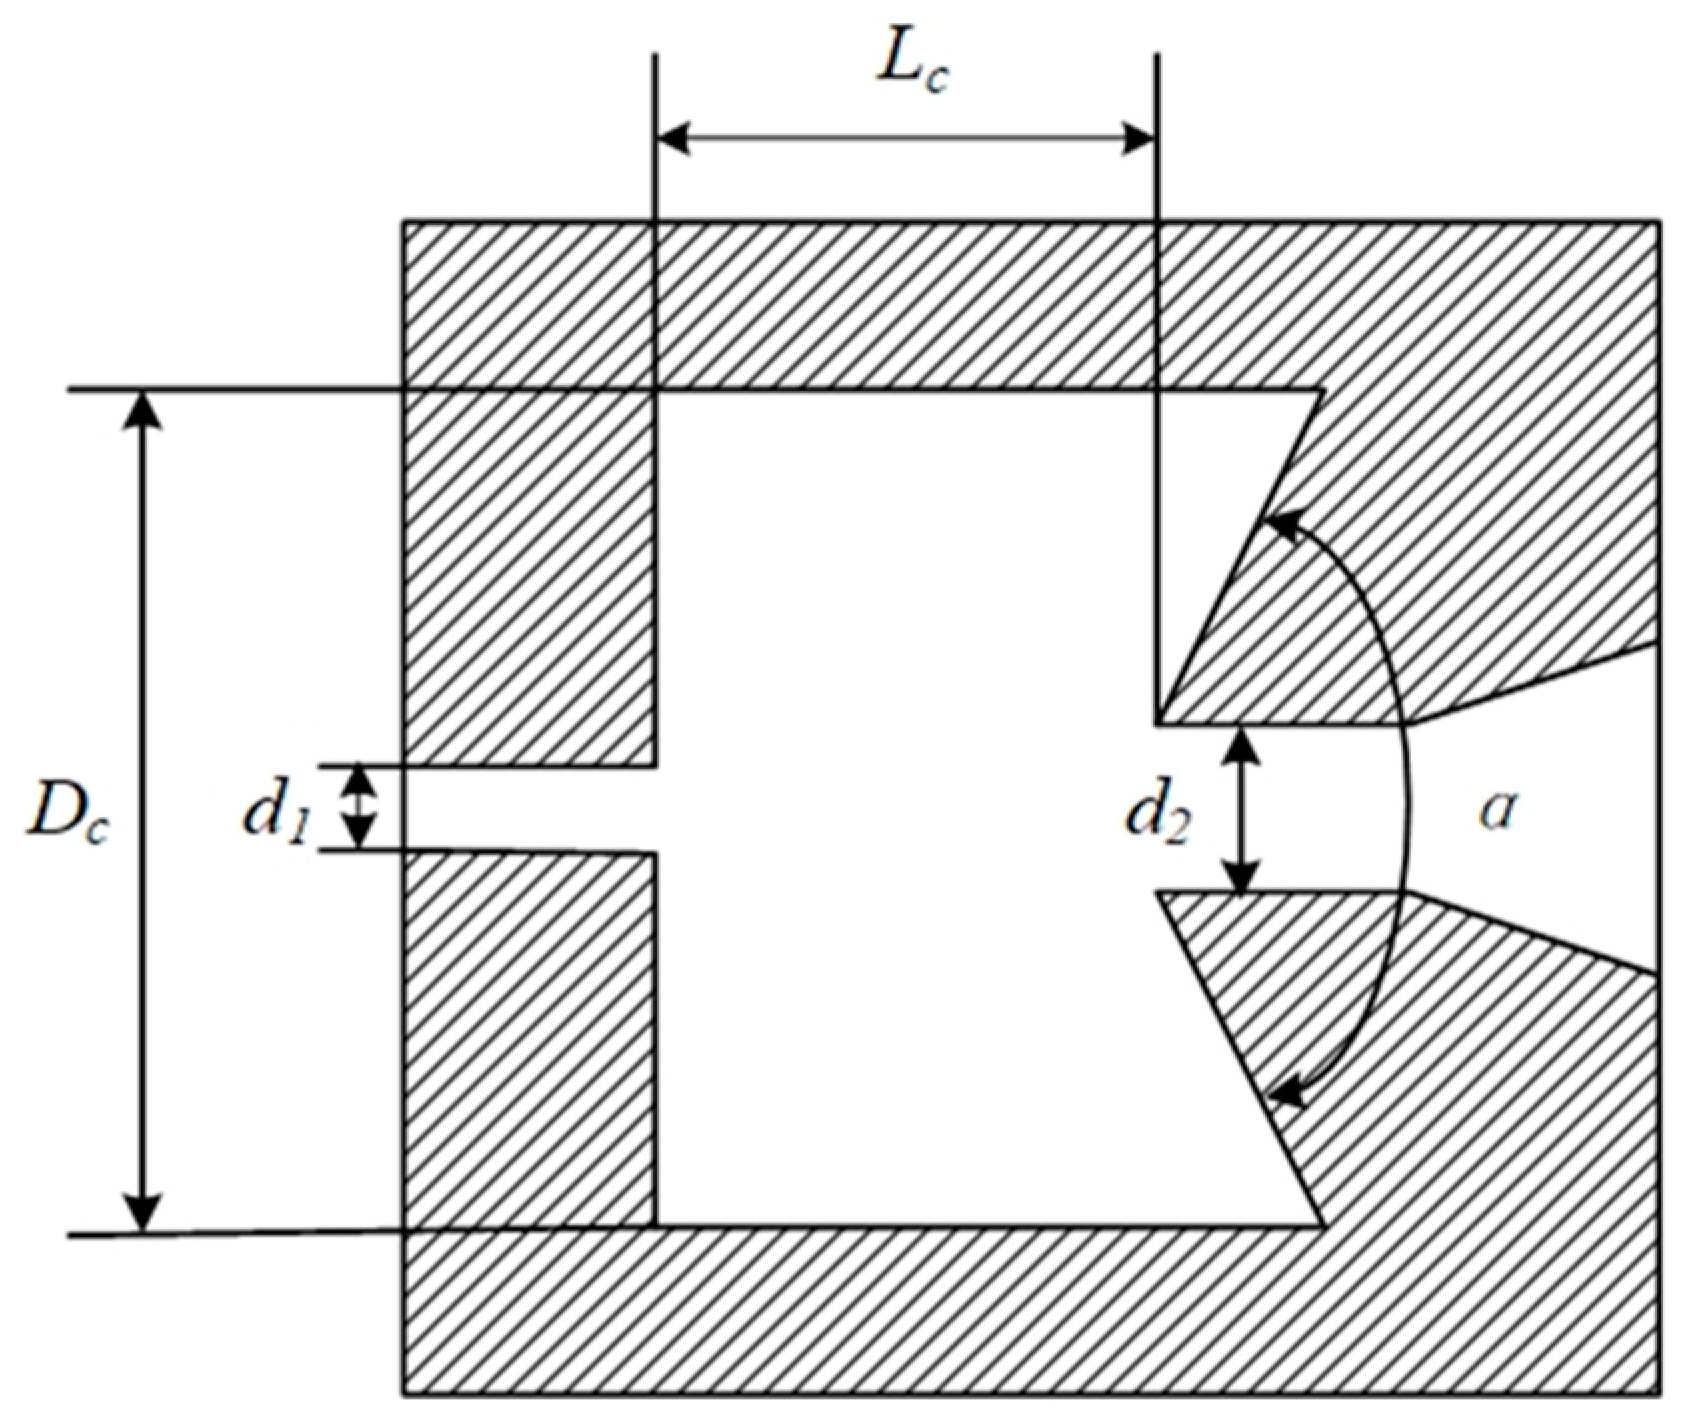
2.1. Design of Broken-Line Chamber SEON

The structure of the broken-line chamber SEON is shown in Figure 1; it consists of an upper nozzle, a lower nozzle, and a self-excited oscillation chamber. The structural parameters of the self-excited oscillation chamber include the chamber length, chamber diameter, and collision wall angle. The length of the chamber refers to the distance from the upper nozzle outlet to the lower nozzle inlet, which affects the state of the jet inside the chamber and the cavitation characteristics of the outflow field. The chamber diameter is the diameter of the circumference of the chamber, which affects the position of the vortex ring in the chamber. The wall profile directly affected by the jet from the upper nozzle outlet in the chamber is the collision wall. The feedback process of the cavitation vortex ring to the upstream depends on the matching of the collision wall and the chamber wall. The angle between them is the collision-wall angle. The diameter of the lower nozzle is slightly larger than that of the upper nozzle, and their ratio has a great influence on the performance of the SEON. In this paper, the upper nozzle diameter of the broken-line chamber SEON is 1 mm. According to the range of dimensionless parameters of the SEON in Table 1 [24], the detailed structural parameters of the broken-line chamber SEON in this paper are shown in Table 2.

2.2. Design of Circular Arc Curve Chamber SEON
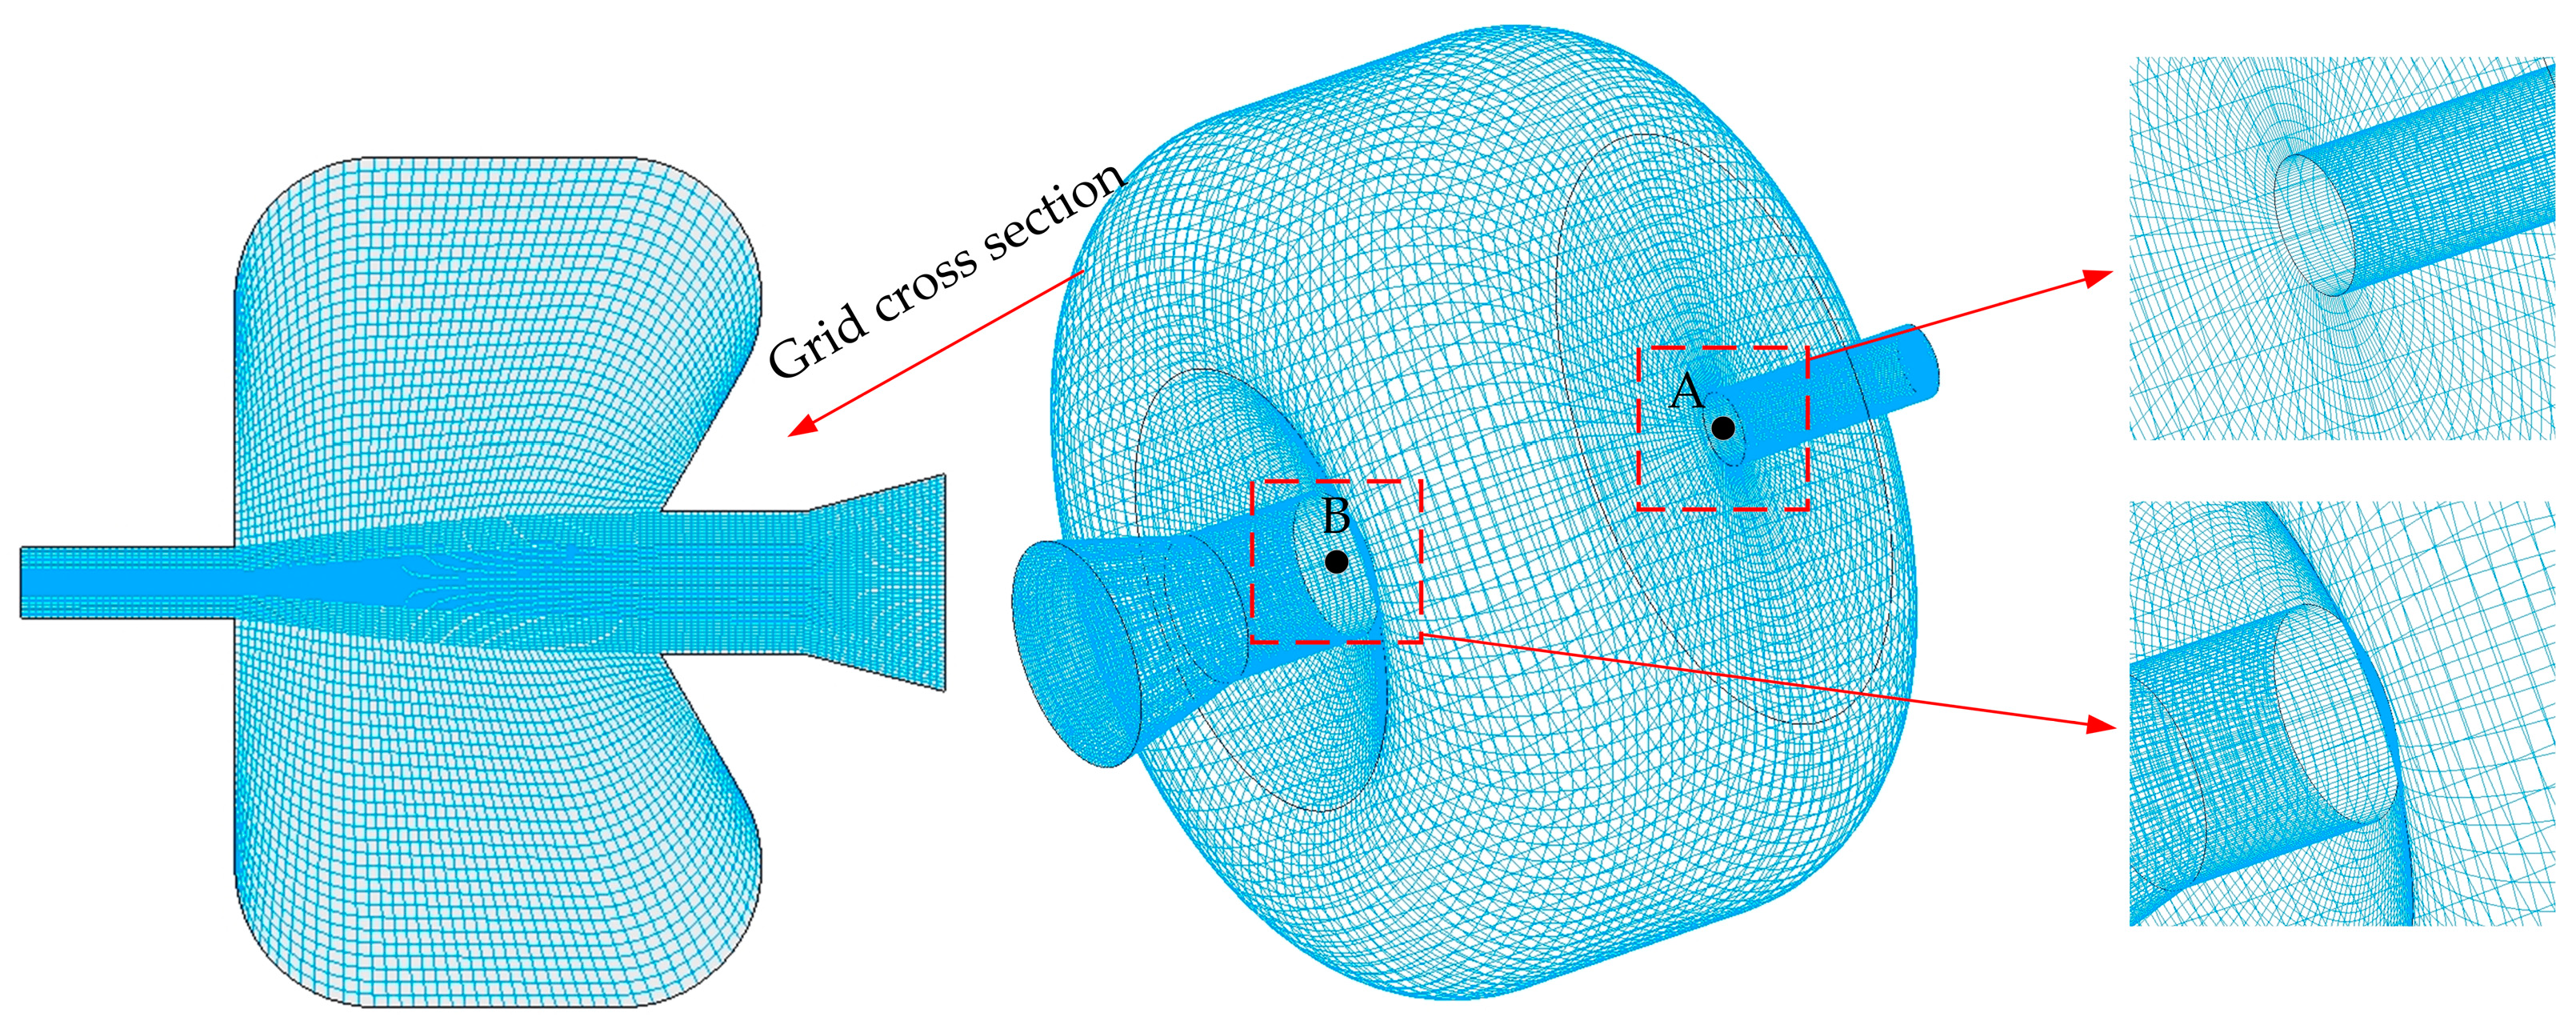
The high-speed jet enters the chamber from the upper nozzle and cavitation incepts in the chamber. Some of the cavitation bubbles leave the chamber from the lower nozzle, and the remainder of the cavitation bubbles return to the upstream part of the chamber through the collision wall to form the cavitation vortex ring. The cavitation vortex ring blocking the jet is the primary reason for the pulse generated by the SEON. The cavitation vortex ring can affect the pulse intensity. Figure 2 shows the accumulation and release process of the jet energy by the cavitation vortex ring in the SEON [2,23]. The high-speed jet enters the chamber and mixes with the stationary liquid. A momentum and energy exchange occur between them, thus generating the cavitation vortex ring. There are two types of cavitation vortex rings: one is the central vortex ring formed in the shape of a ring near the central axis of the chamber, and the other is the secondary vortex ring near the collision wall, as shown in Figure 2a. The central vortex ring accumulates the jet flow at the exit of the upper nozzle. When energy accumulates to some extent, the central vortex ring breaks, and the accumulated energy is released, thus increasing the speed of the jet, as shown in Figure 2b. The cyclic occurrence of the above processes will create a pulsed jet inside the nozzle [25]. As there is an angle between the collision wall and the chamber wall, a vortex will be formed when the high-speed jet flows through the collision wall returning upstream, which is called the secondary vortex ring. However, the secondary vortex ring will interact with the central vortex ring and cause energy dissipation, thus limiting the development of the central vortex ring, which is very unfavorable to the pulse intensity of the SEON. To reduce the generation of secondary vortex rings, in this paper, the wall profile of the SEON chamber was designed as a circular arc curve, as shown in Figure 3. To facilitate the flow of the jet in the nozzle, the wall surface of the chamber is tangent to the circular arc curve. However, the wall structure of the chamber will reduce the space of the chamber with the increase in the radius of the circular arc curve. Therefore, the radius of the circular arc curve needs to be limited. In this paper, three circular arc curve chamber SEONs with circular arc radii o1 mm, 2 mm, and 3 mm were designed based on the broken-line chamber SEON.

3. Modeling

The cavitation jet is a two-phase flow. In this paper, the mixture model was adopted. The governing equations are as follows.
t ρ m + ρ m v m = 0
t ρ m v m + ρ m v m v m = p + μ m v m + v m T + ρ m g + F + k = 1 n α k ρ k v d r , k v d r , k
where v m is the average speed for quality, m/s; ρ m is the density of the mixed phase, kg/m3; μ m is the viscosity of the mixed phase,   Pa s ;   F is the volume force, N; v d r , k is the k-phase slip velocity, m/s.
With the improvement in computational accuracy, the Reynolds-averaged Navier–Stokes (RANS) has been unable to reach the required accuracy in some studies. Although the large-eddy simulation (LES) can get more accurate calculation results, its calculation time is huge, several orders of magnitude higher than the RANS. The high computational cost limits the wide application of the LES. To solve the problems of these two models, the stress-blended eddy simulation (SBES) was adopted, which not only guaranteed the calculation accuracy but also saved the calculation time [26]. The SBES achieves stress mixing between RANS and LES through the following equation:
τ ij SBES = f SBES   τ ij RANS + 1 f SBES τ ij LES
where τ ij RANS and τ ij LES are the stress tensors of RANS and LES, respectively.
At present, the common cavitation models include the Singhal model, the Zwart–Gerber–Belamri model, and the Schnerr–Saure model. These models are derived from the Rayleigh–Plesset equation, which is the fundamental equation of cavitation dynamics. In this paper, the Zwart–Gerber–Belamri model was used as the cavitation model. The mass transfer expression of this model is as follows:
When P P v ,
R c = F vap   3 α nuc 1 α v ρ v R B 2 3 P v P ρ l
When P > P v ,
R c = F cond   3 α v ρ v R B 2 3 P P v ρ l
where R B is the radius of the cavitation bubble, m; P v is the saturation pressure, Pa; P is the environmental pressure, Pa; α nuc is the volume fraction of the gas nucleus; ρ v and ρ l are the density of the gas phase and liquid phase, kg/m3; F vap is the evaporation coefficient; F cond is the condensation coefficient.
For the parameter setting of the cavitation model, the radius of the cavitation bubble is set to be 10−3 mm. Water is the first phase; the density is 998.2 kg/m3, and the viscosity is 1.003 × 10⁻³ kg/m · s. The vapor is the second phase with a density of 0.5542 kg/m3 and a viscosity of 1.34 × 10⁻⁵ kg/m. The evaporation pressure of the water is set at 3450 Pa. The inlet boundary condition is the pressure inlet, and the inlet pressure of the nozzle is 20 MPa. The outlet boundary condition is the pressure outlet, and the outlet pressure of the nozzle is 0.1 MPa. The turbulent intensity was 5% and the turbulent viscosity ratio was 10. The other walls are non-slip walls. The coupled method was chosen as the calculation method. The volume fraction transport equation selects the first-order upwind equation. The continuity equation and the turbulent transport equation are analyzed by the second-order upwind equation. As cavitation is a complex unsteady phenomenon, the transient simulation was adopted in this paper. The time step length is 0.00001 s. The maximum number of iterations for each time step is 20.
To ensure the accuracy of the numerical results, a three-dimensional calculation model was used in this paper. The grid adopts a hexahedral structure grid. In addition, the grid is locally refined. The meshing of the circular arc curve chamber SEON is shown in Figure 4. In order to avoid interference with the number of grids in the calculation results and reduce the amount of computation as much as possible, grid independence verification is required. The number of grids increased from 462,813 to 799,182, and five nozzles with different numbers were calculated. The upper nozzle outlet center (point A) and the lower nozzle inlet center (point B), respectively, of the SEON were selected as reference points. The deviation was calculated by
d e v i a t i o n = x n x n + 1 x n × 100 %
Table 3 shows the results of the grid independence verification. When the grid number gradually increases from 462,813 to 799,182, the velocity deviation and the pressure deviation of the reference points gradually decrease. When the grid number increases from 641,547 to 799,182, both the velocity deviation and the pressure deviation are less than 0.1%, which is negligible. Therefore, the number of grids was determined to be about 641,547 in this paper.

4. Results and Discussion

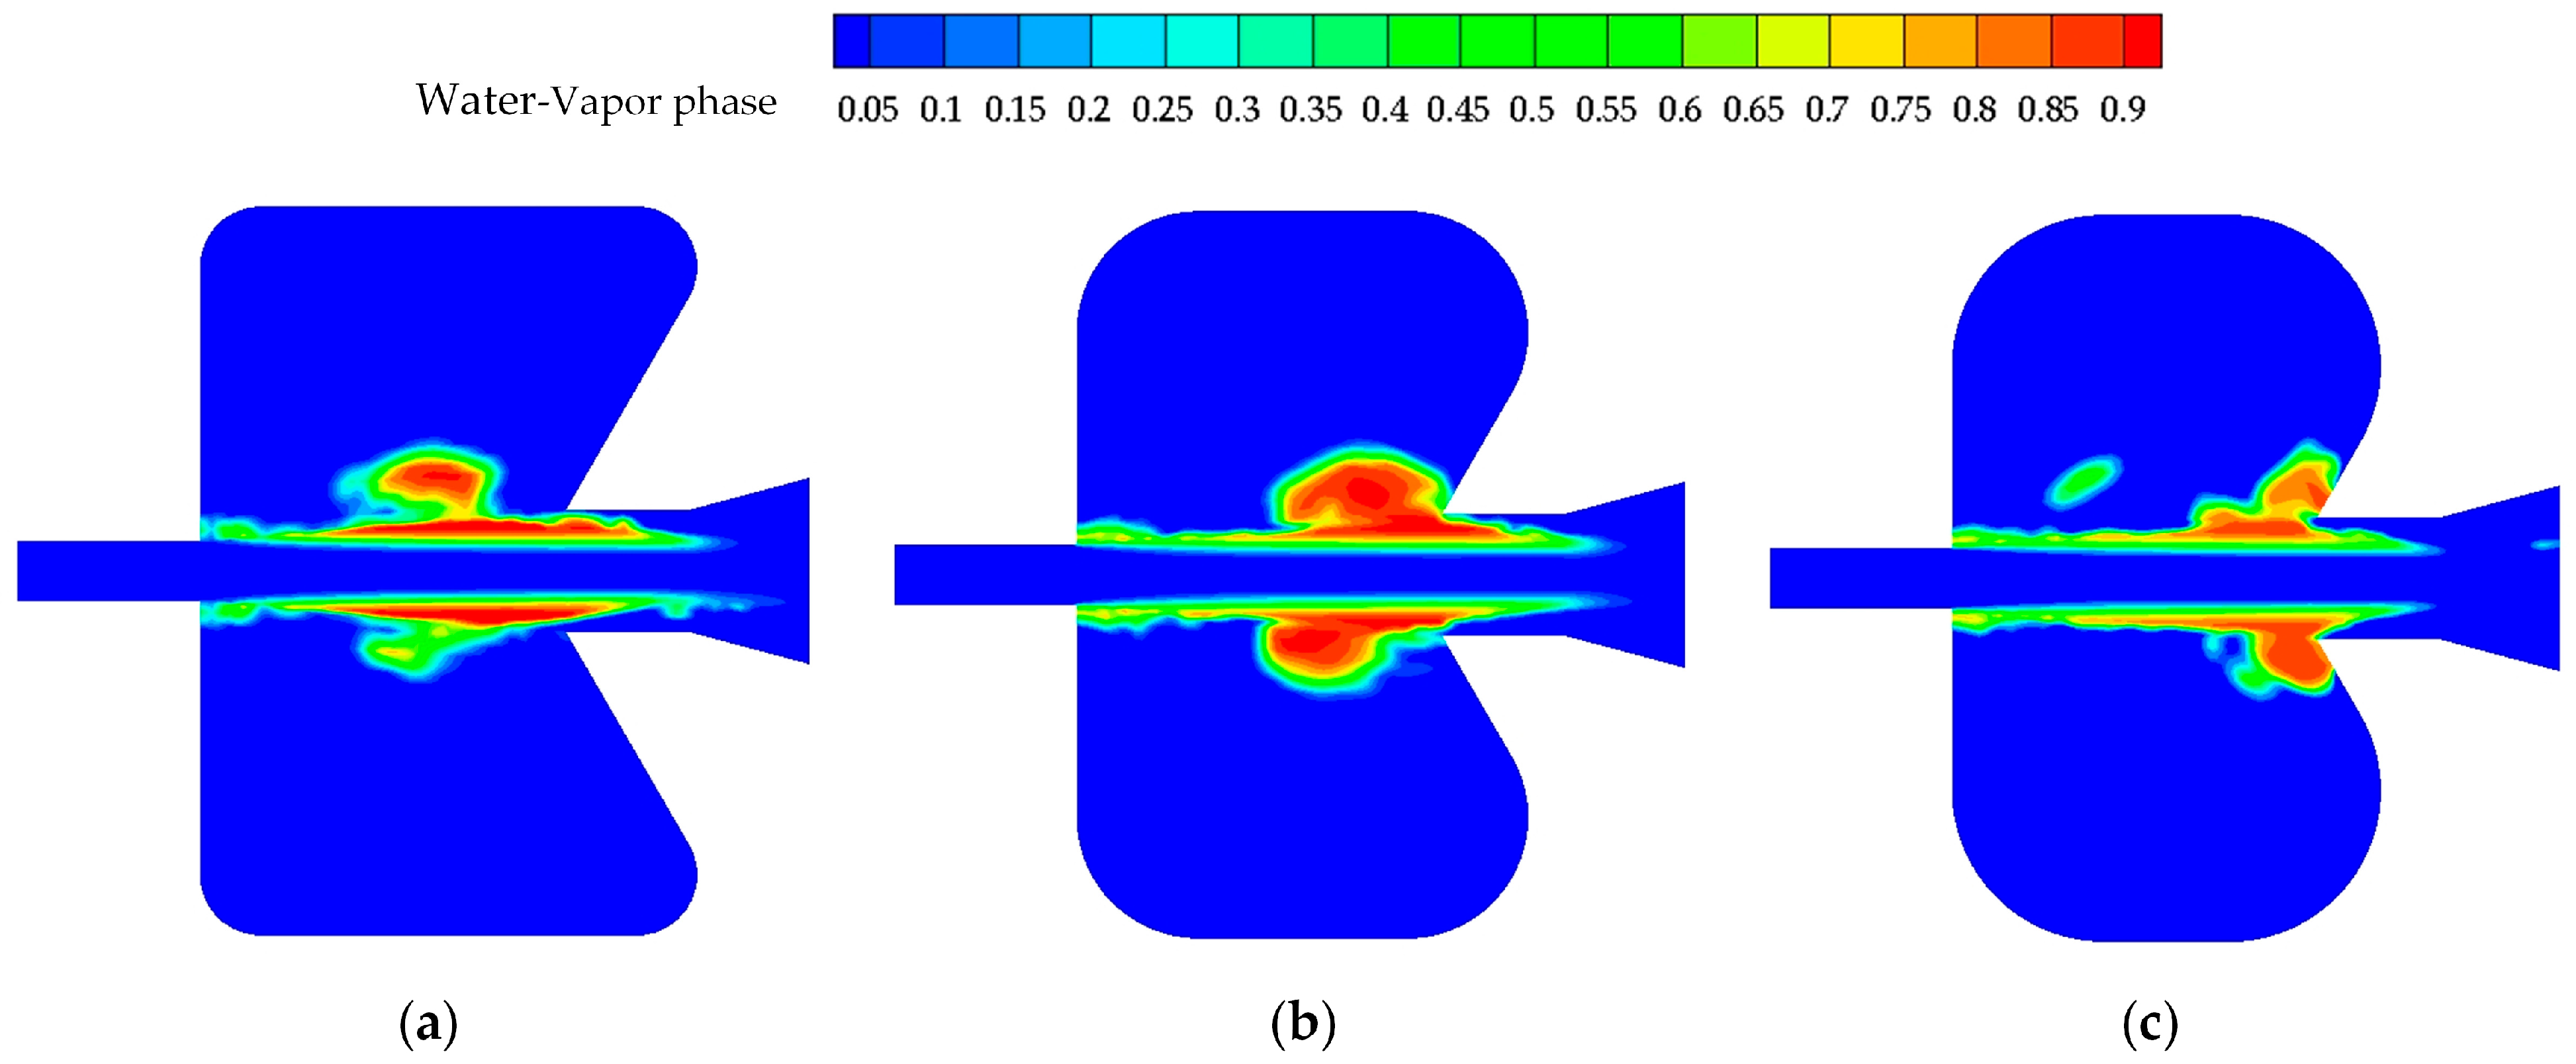
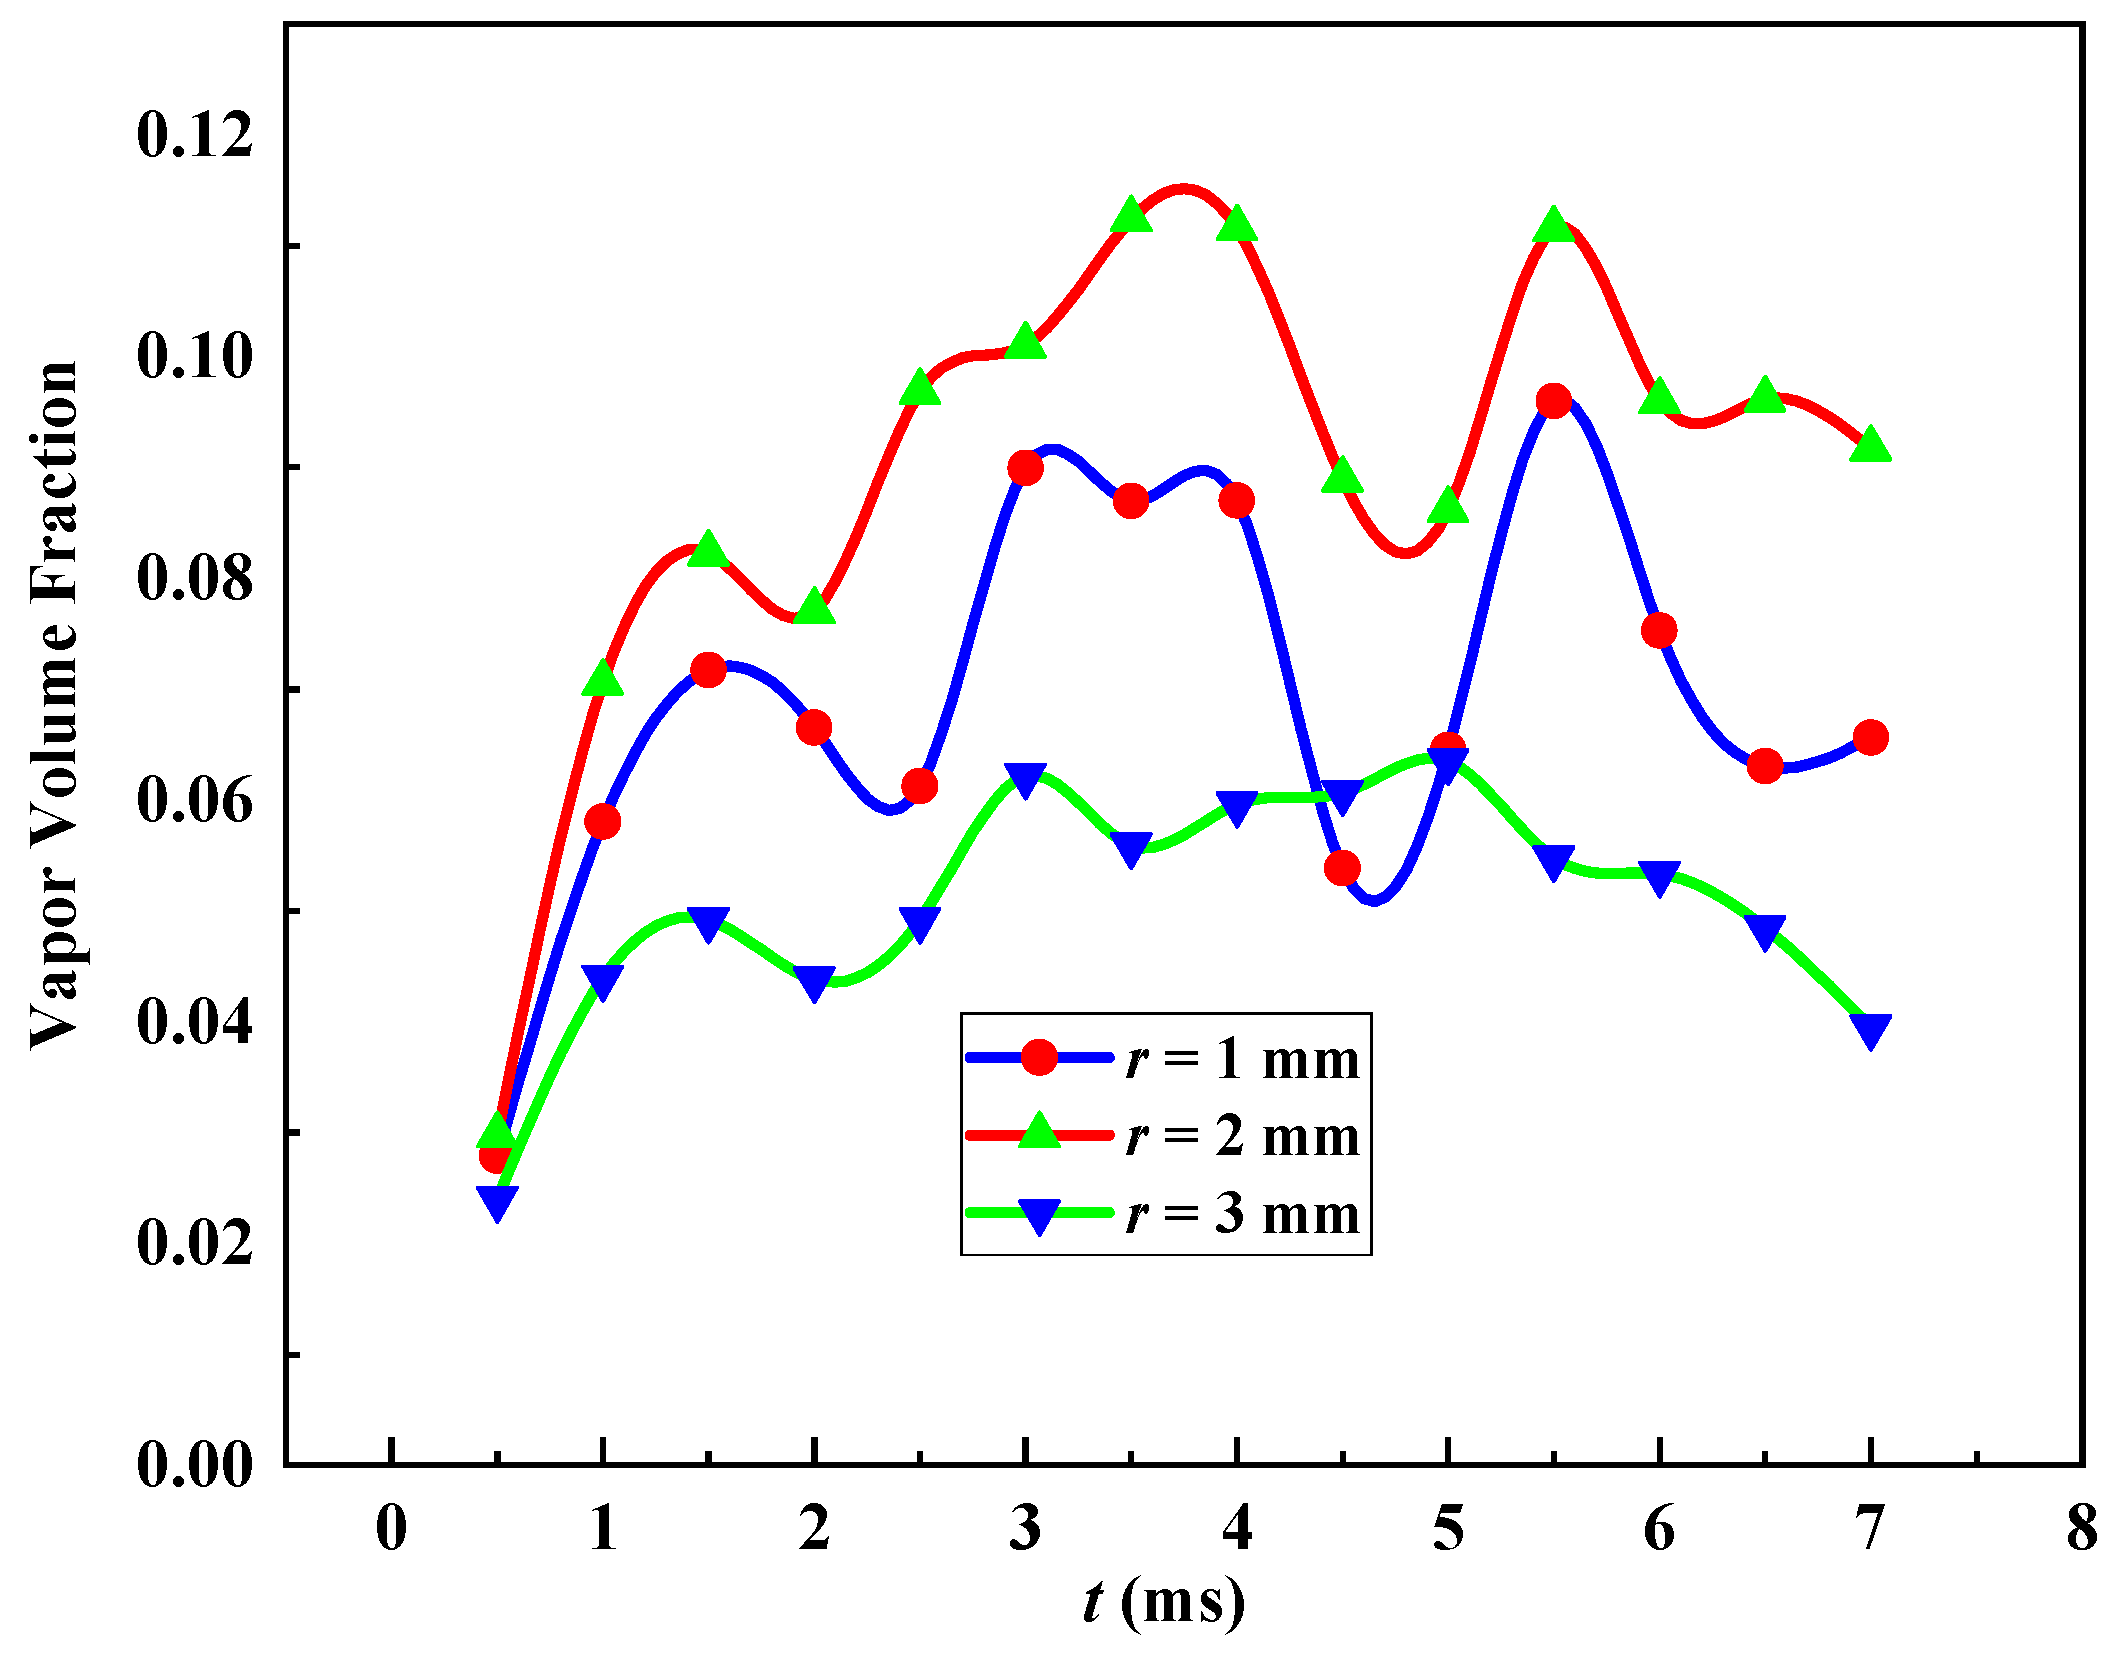
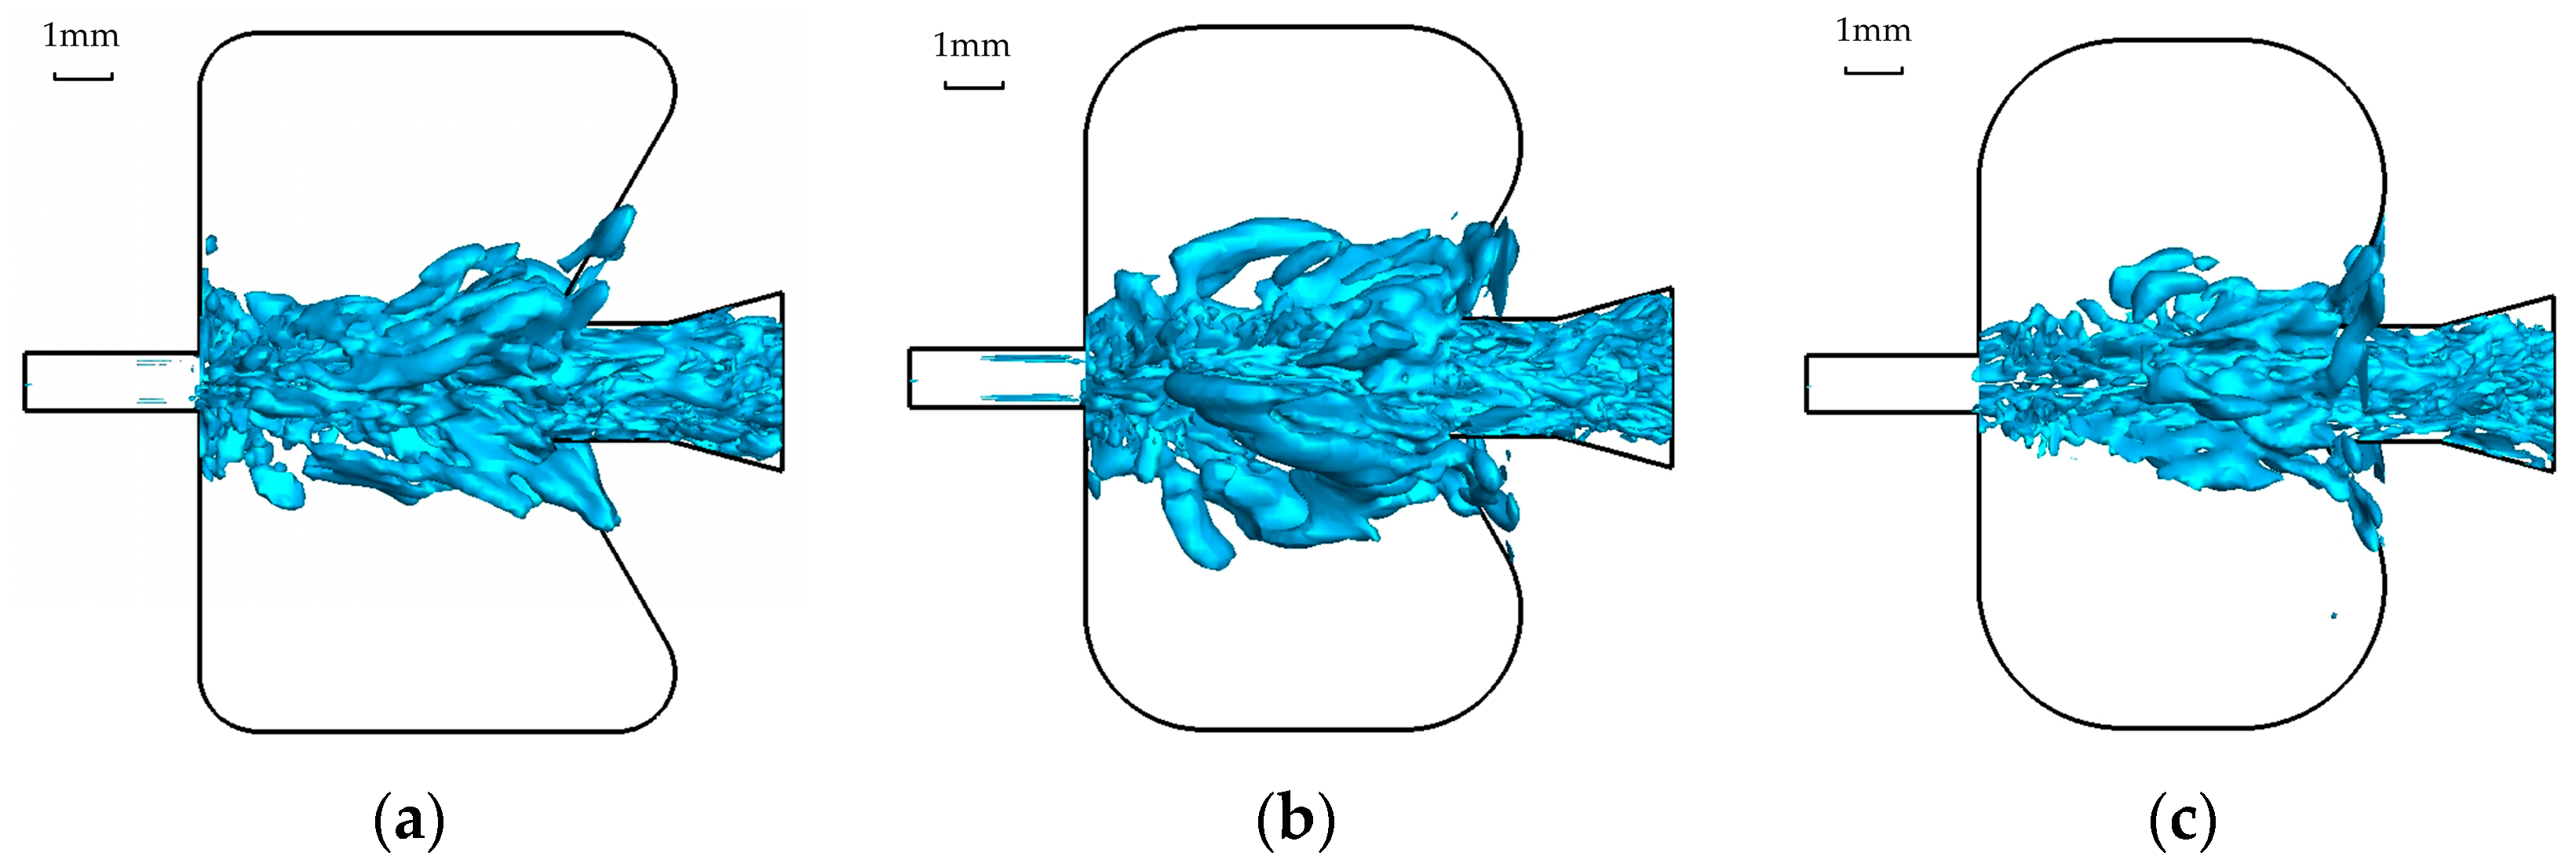
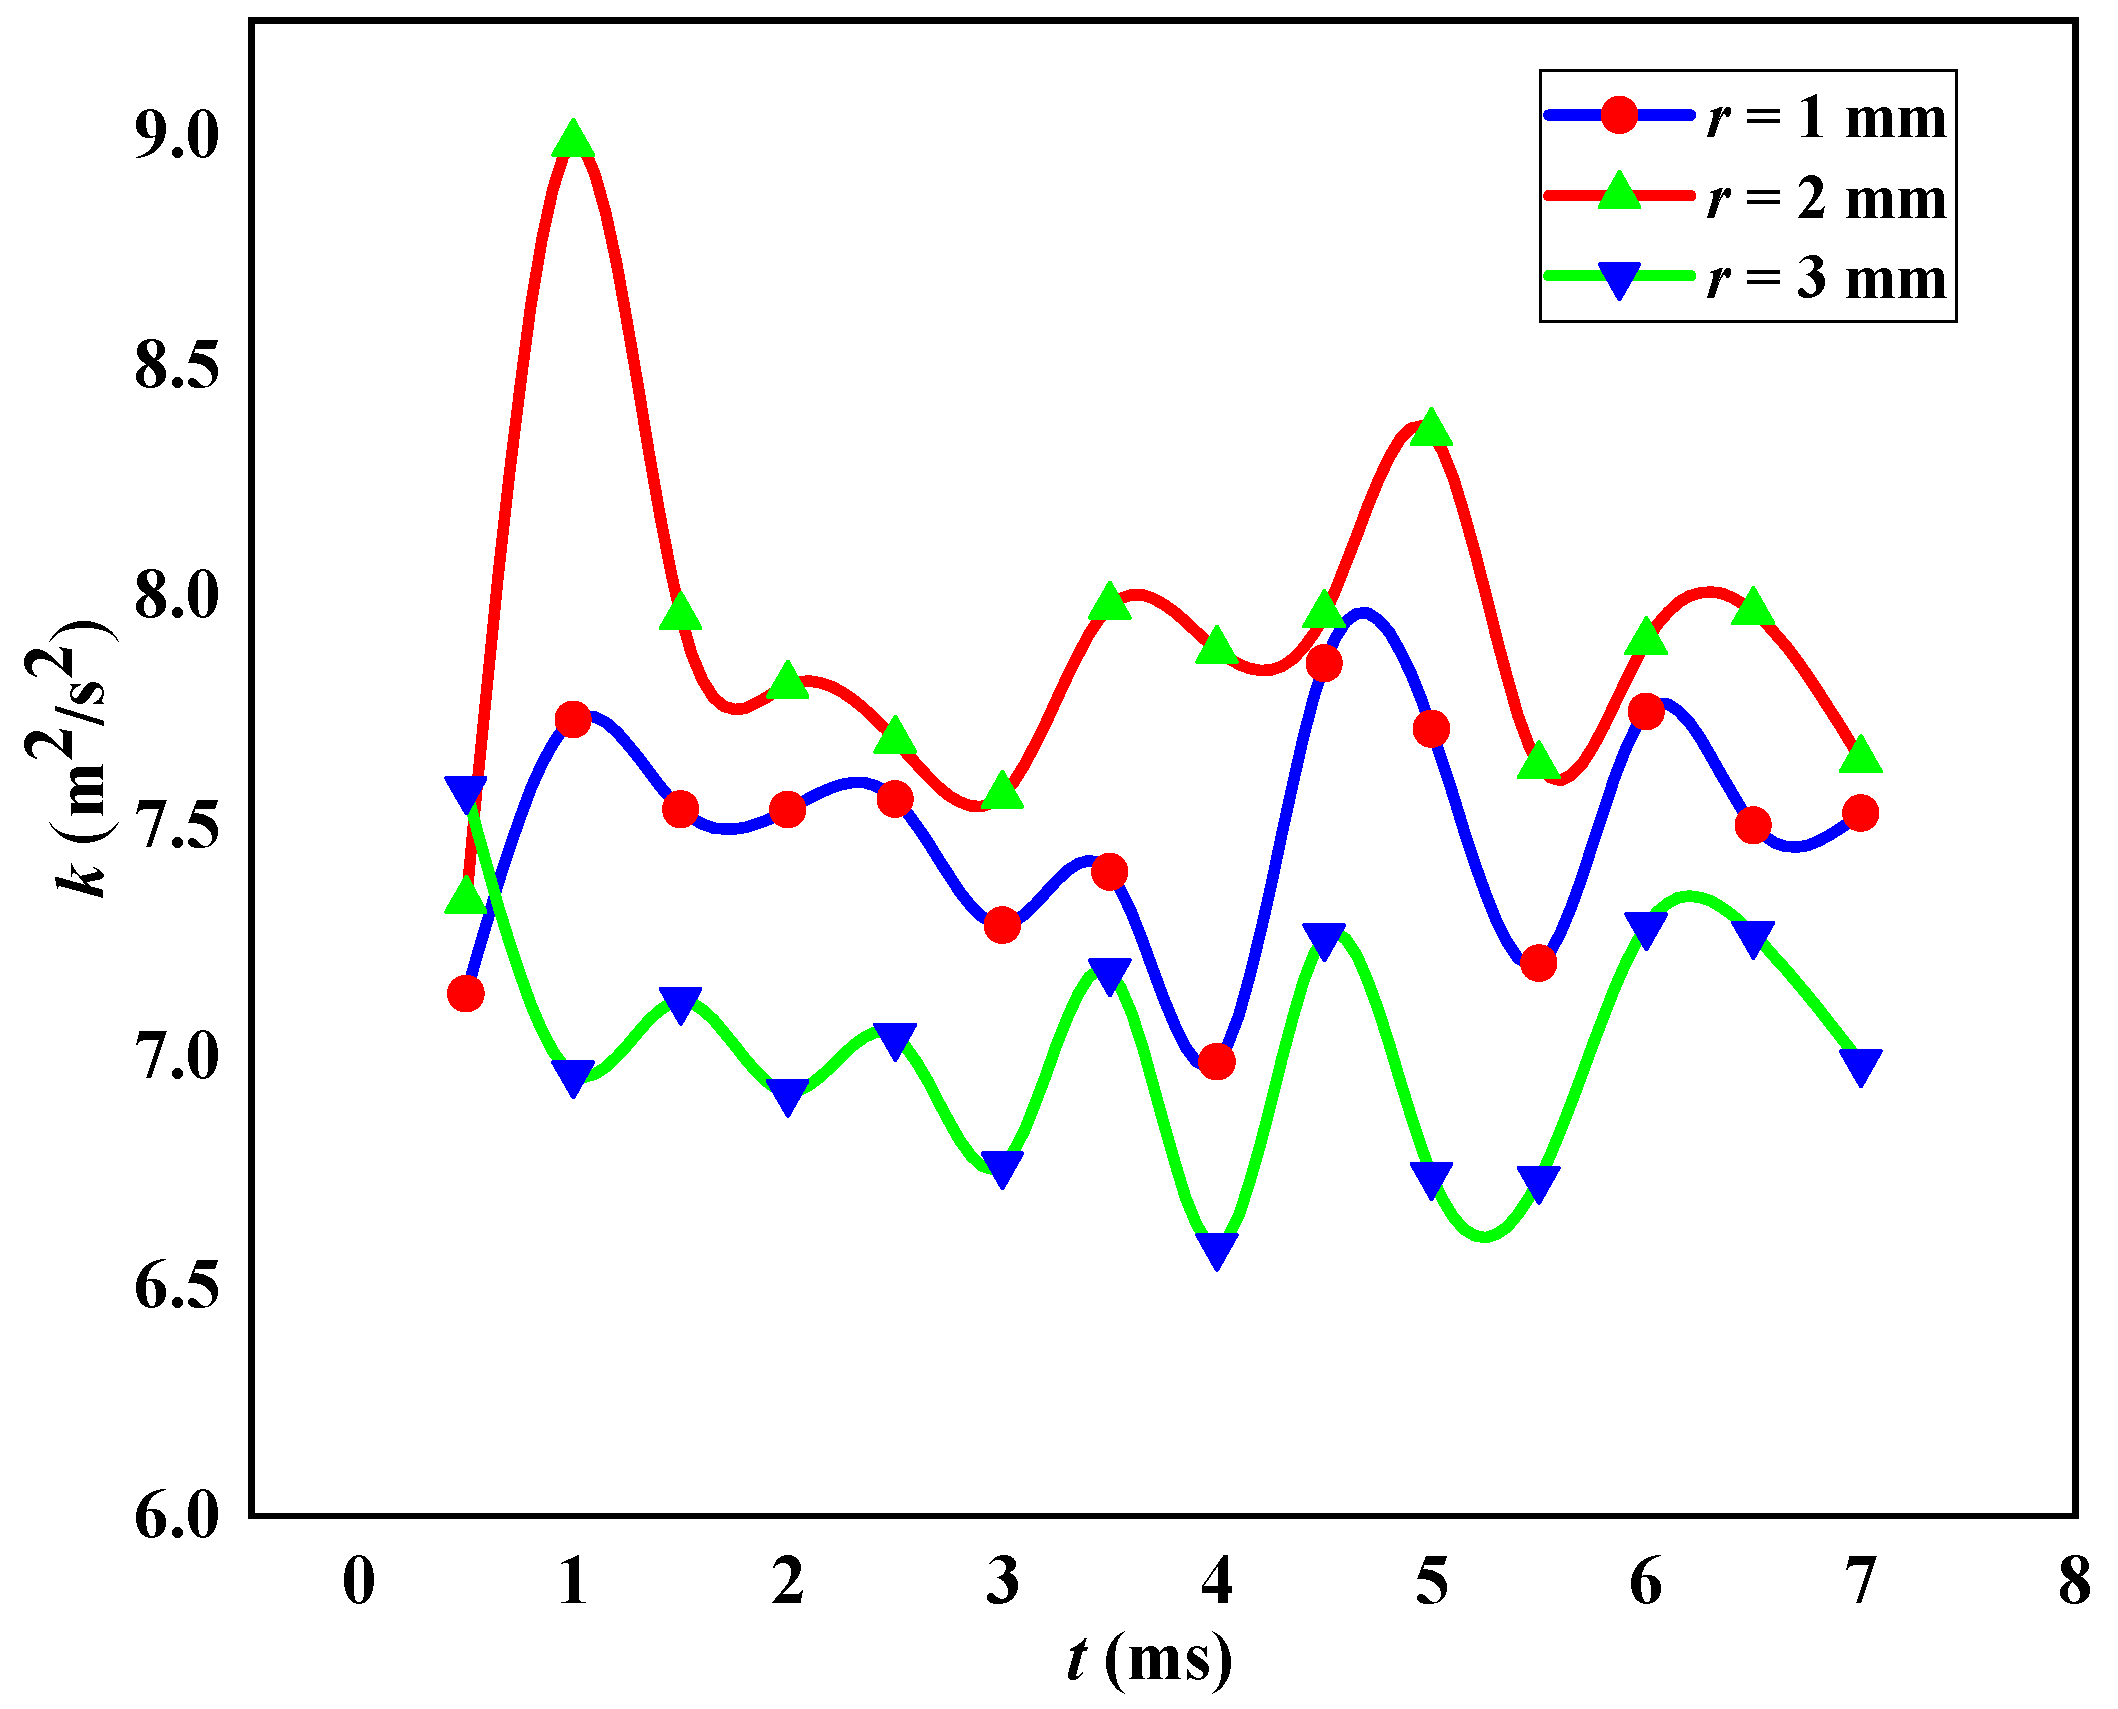
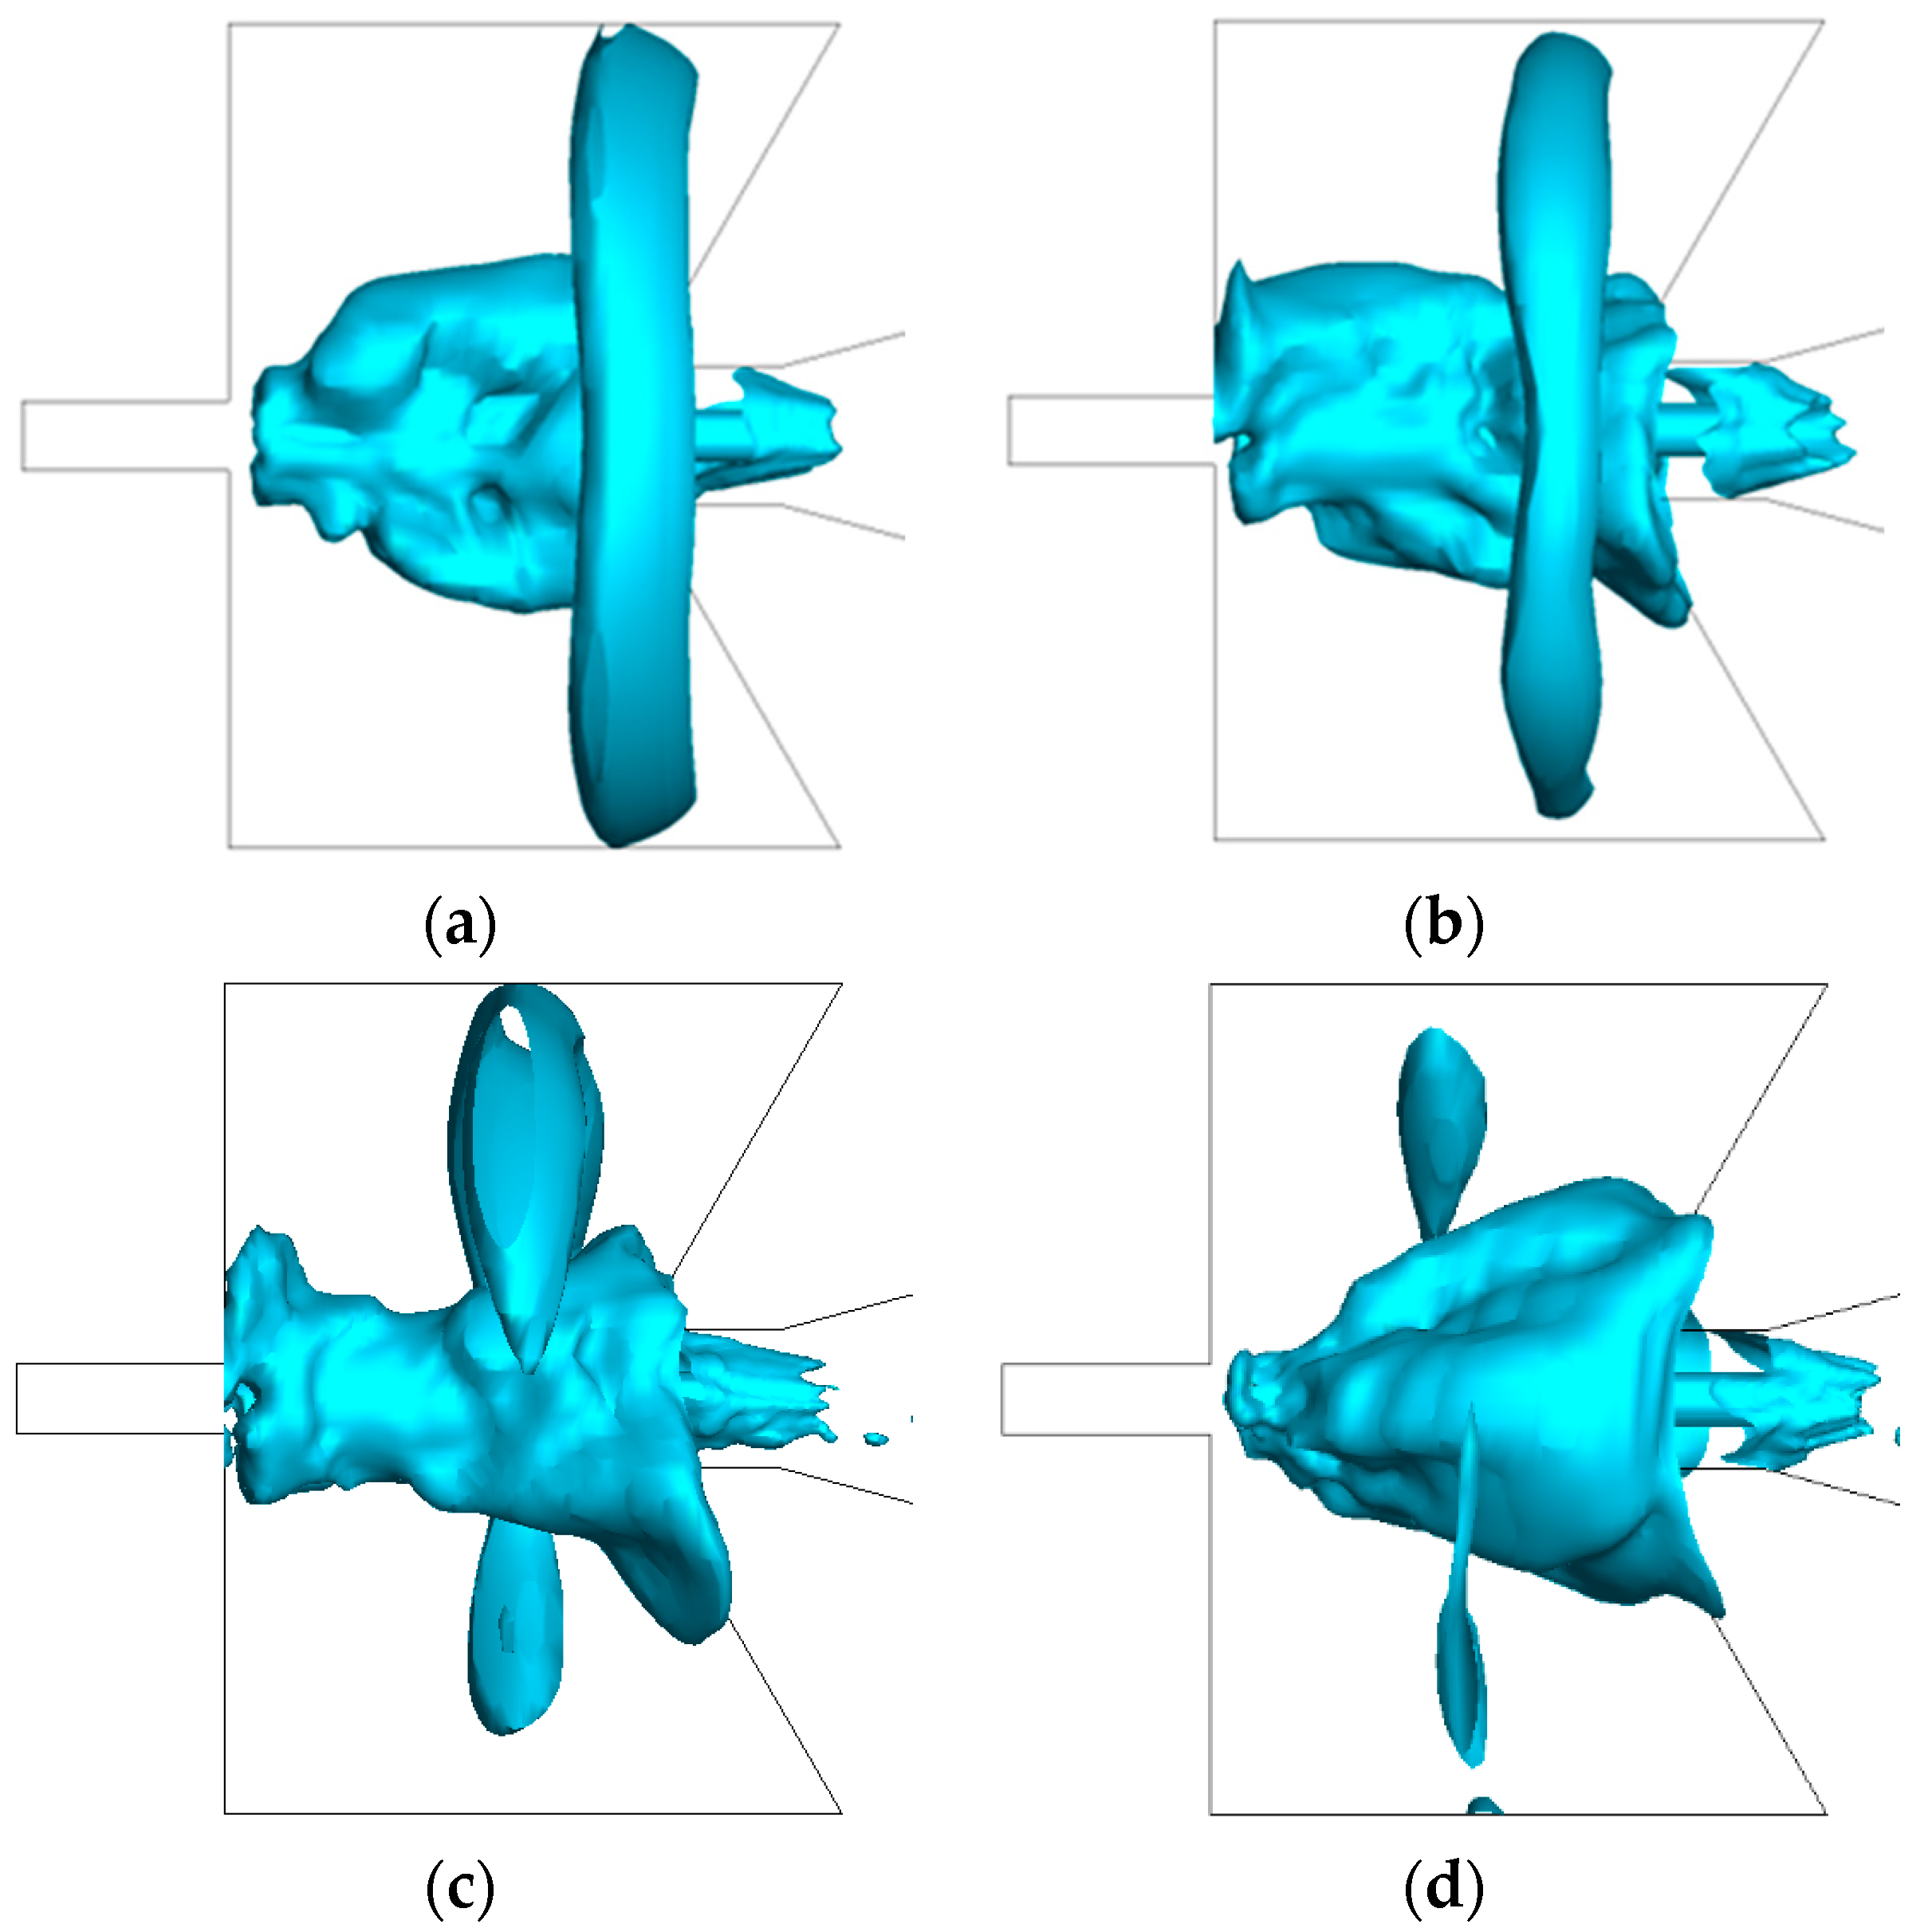
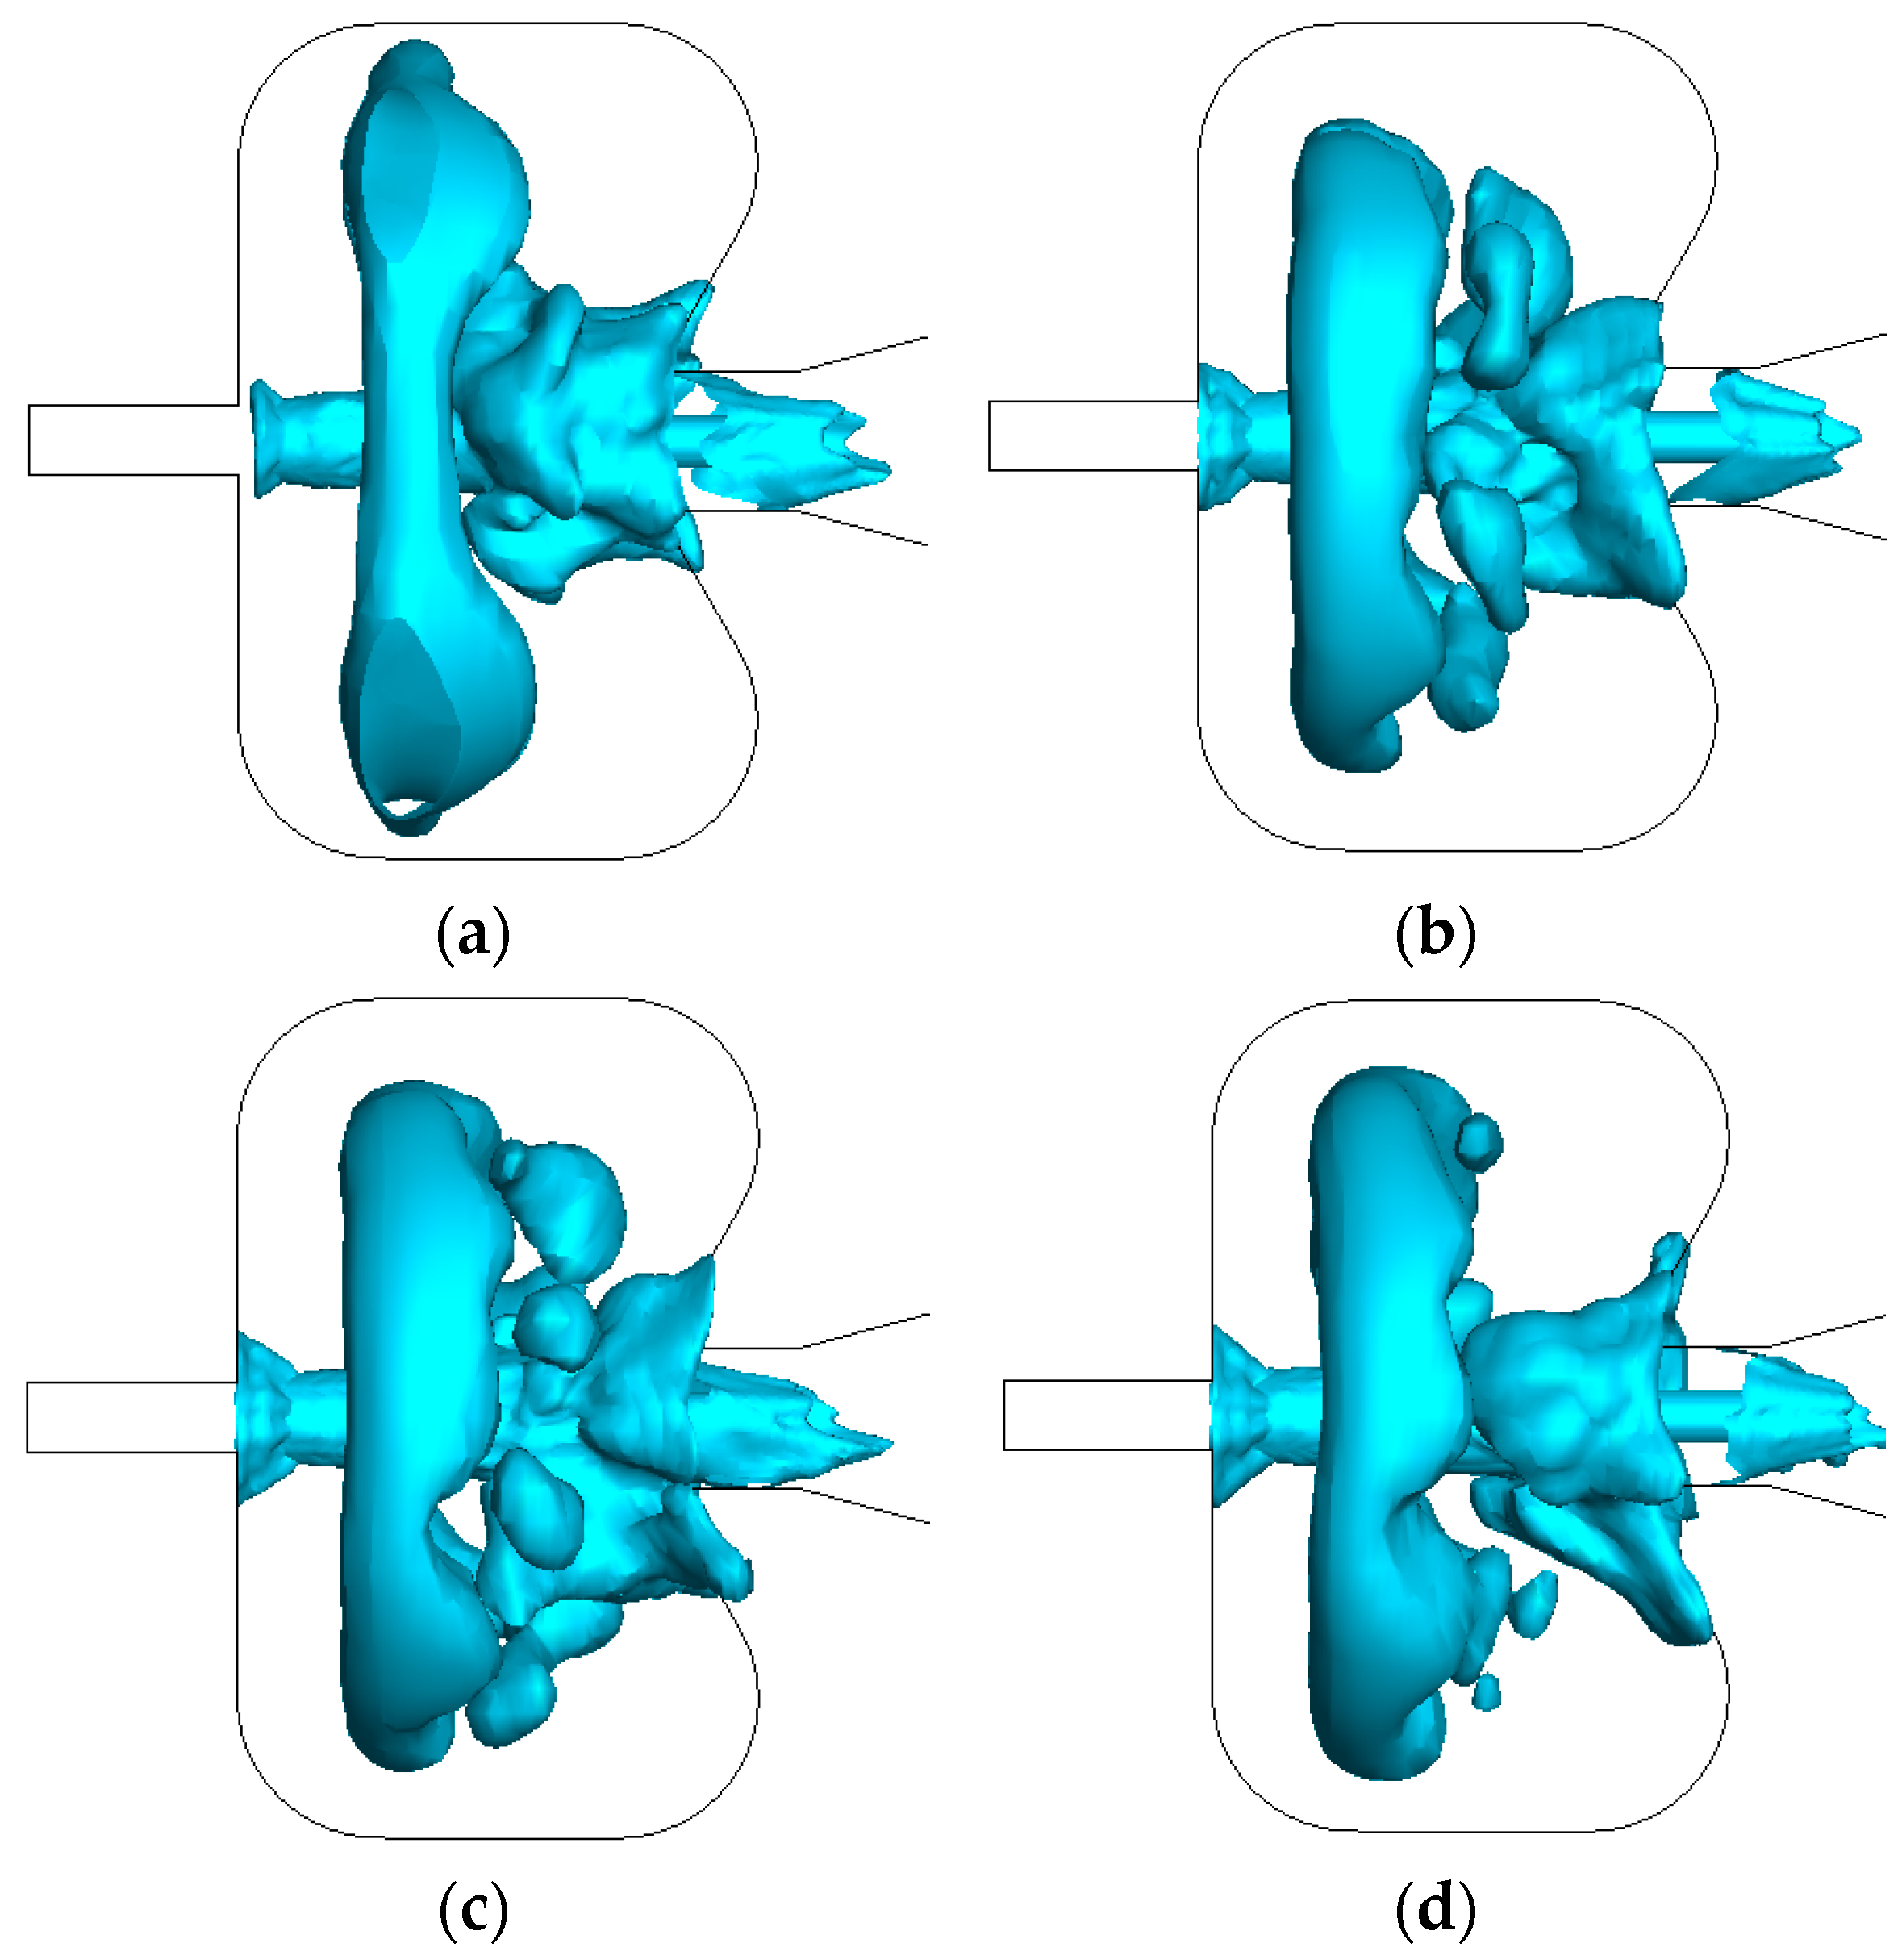
4.1. Effect of Circular Arc Radius on Cavitation Performance of SEON

Vapor volume distribution, vorticity, and turbulent kinetic energy (TKE) are important evaluation indexes of the cavitation performance of the nozzle. The effect of the circular arc radius on the cavitation performance of the SEON was investigated when the circular arc radii were 1 mm, 2 mm, and 3 mm, respectively.
The vapor volume distribution and the vapor volume fraction can most intuitively reflect the intensity of the cavitation vortex ring. Figure 5 shows the vapor volume distribution of the nozzle chamber with different circular arc radii. When the circular arc radius increases from 1 mm to 3 mm, the vapor phase region increases first and then decreases. With the increase in the arc radius, the chamber volume will decrease, which will affect the development of the central vortex ring. Although the circular arc radius can enhance the cavitation vortex ring in the chamber, it can also shorten the length of the collision wall. This will reduce the buffering effect of the collision wall on the cavitation jet at the upper nozzle outlet. The vapor volume fraction can represent the cavitation intensity. Figure 6 shows the variation of the vapor volume fraction in the nozzle chamber with time under different circular arc radii. When the circular arc radius increases from 1 mm to 2 mm, the vapor volume fraction increases. When the radius of the circular arc continues to increase to 3 mm, the curvature of the nozzle chamber becomes smaller, resulting in a sharp reduction of the chamber volume. This variation is very unfavorable to the formation of the central vortex ring. At this time, the vapor volume fraction of the nozzle decreases, and the cavitation performance weakens.
Vorticity is one of the most important physical parameters in describing vortex motion. Under the action of shear stress, a vortex is formed in the shear layer of the outflow field jet, and a low-pressure region is formed in the center of the vortex. Cavitation will occur when the pressure is below the saturated vapor pressure. Therefore, the more vortices formed in the shear layer of the outflow field jet, the easier cavitation is to form. Figure 7 shows the vorticity distribution in the chamber with different circular arc radii. When the circular arc radius is 1 mm, the vorticity is mostly concentrated in the lower nozzle, and the vorticity is small. When the circular arc radius increases to 2 mm, the vorticity in the chamber increases, and the vorticity distribution moves to the upstream part of the chamber. A large number of vortex motions occur at the upper nozzle outlet. This indicates that the cavitation vortex rings increase at the upper nozzle outlet. However, the vorticity distribution is more dispersed when the arc radius is 3 mm. In addition, there is no large vorticity distribution at the upper nozzle outlet, and the vorticity decreases. Figure 8 shows the isosurface of vorticity in the chamber with different circular arc radii, which can reflect the detailed morphological characteristics of the cavitation vortex rings. When the circular arc radius is 1 mm, the vortex rings are evenly distributed along the jet direction, and large-scale vortex rings are generated near the collision wall. In addition, the distribution area of the vorticity in the chamber increases, and the size of the vortex ring also increases obviously when the circular arc radius is 2 mm. This indicates that there is a violent vortex movement in the chamber at this time. When the circular arc radius continues to increase, the vorticity area in the chamber decreases, and the size of the vortex ring becomes smaller. Especially at the outlet of the upper nozzle, the variation is most obvious. The reason for this phenomenon is that the length of the collision wall decreases and the impact of the jet on the collision wall increases with the increase of the circular arc radius. This will cause an energy disturbance in the chamber, and a relatively stable large-scale cavitation vortex ring cannot be formed.
Due to the phase change, the cavitation bubbles absorb a large amount of energy when they incept and release the same amount of energy when they collapse. The inception and collapse of the cavitation bubble are accompanied by the variation of the TKE in the flow field. Therefore, the variation of the TKE can reflect the intensity of the cavitation. Figure 9 shows the variations of the TKE in the chamber with time under different circular arc radii. When the circular arc radius is 1 mm, the TKE changes dramatically with time. This is because the cavitation vortex ring in the chamber has little influence on the pulse intensity of the nozzle at the initial stage of cavitation generation. With the development of the central vortex ring, the pulse intensity of the nozzle is enhanced. When the circular arc radius increases to 2 mm, the TKE increases, and the vortex motion becomes more intense. When the circular arc radius increases from 2 mm to 3 mm, the cavitation intensity and the TKE will decrease due to the smaller chamber space.

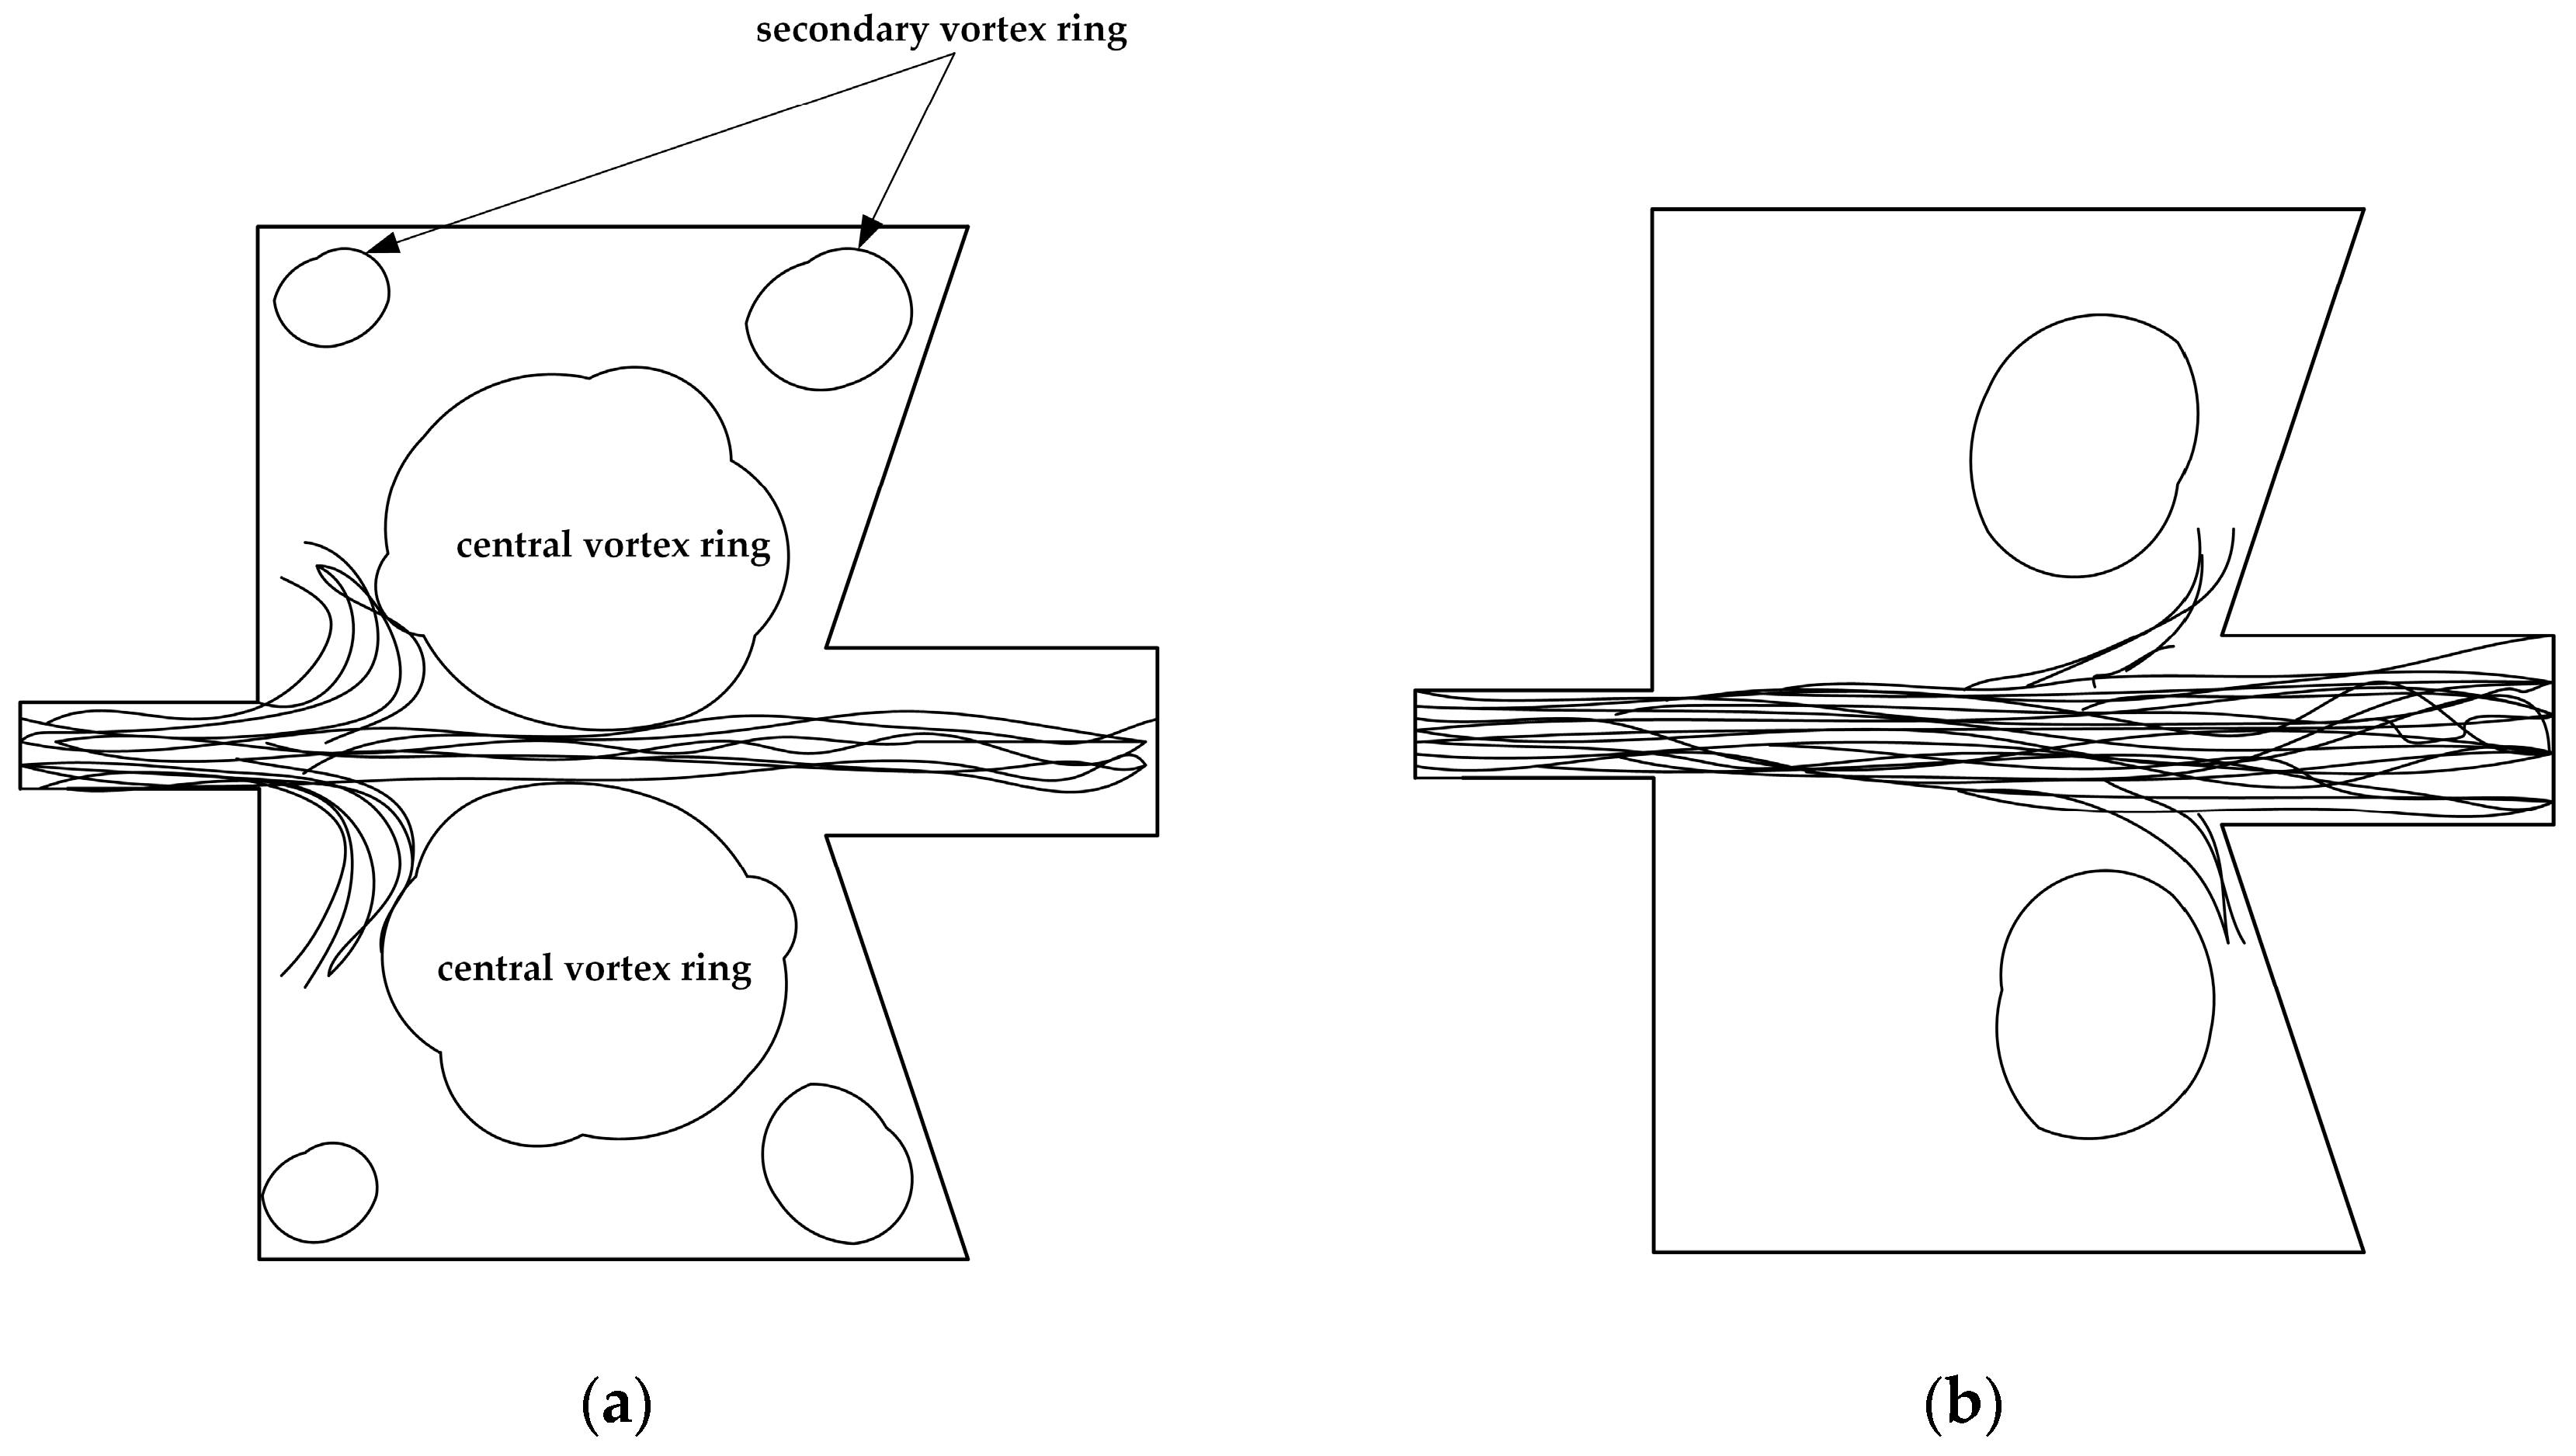
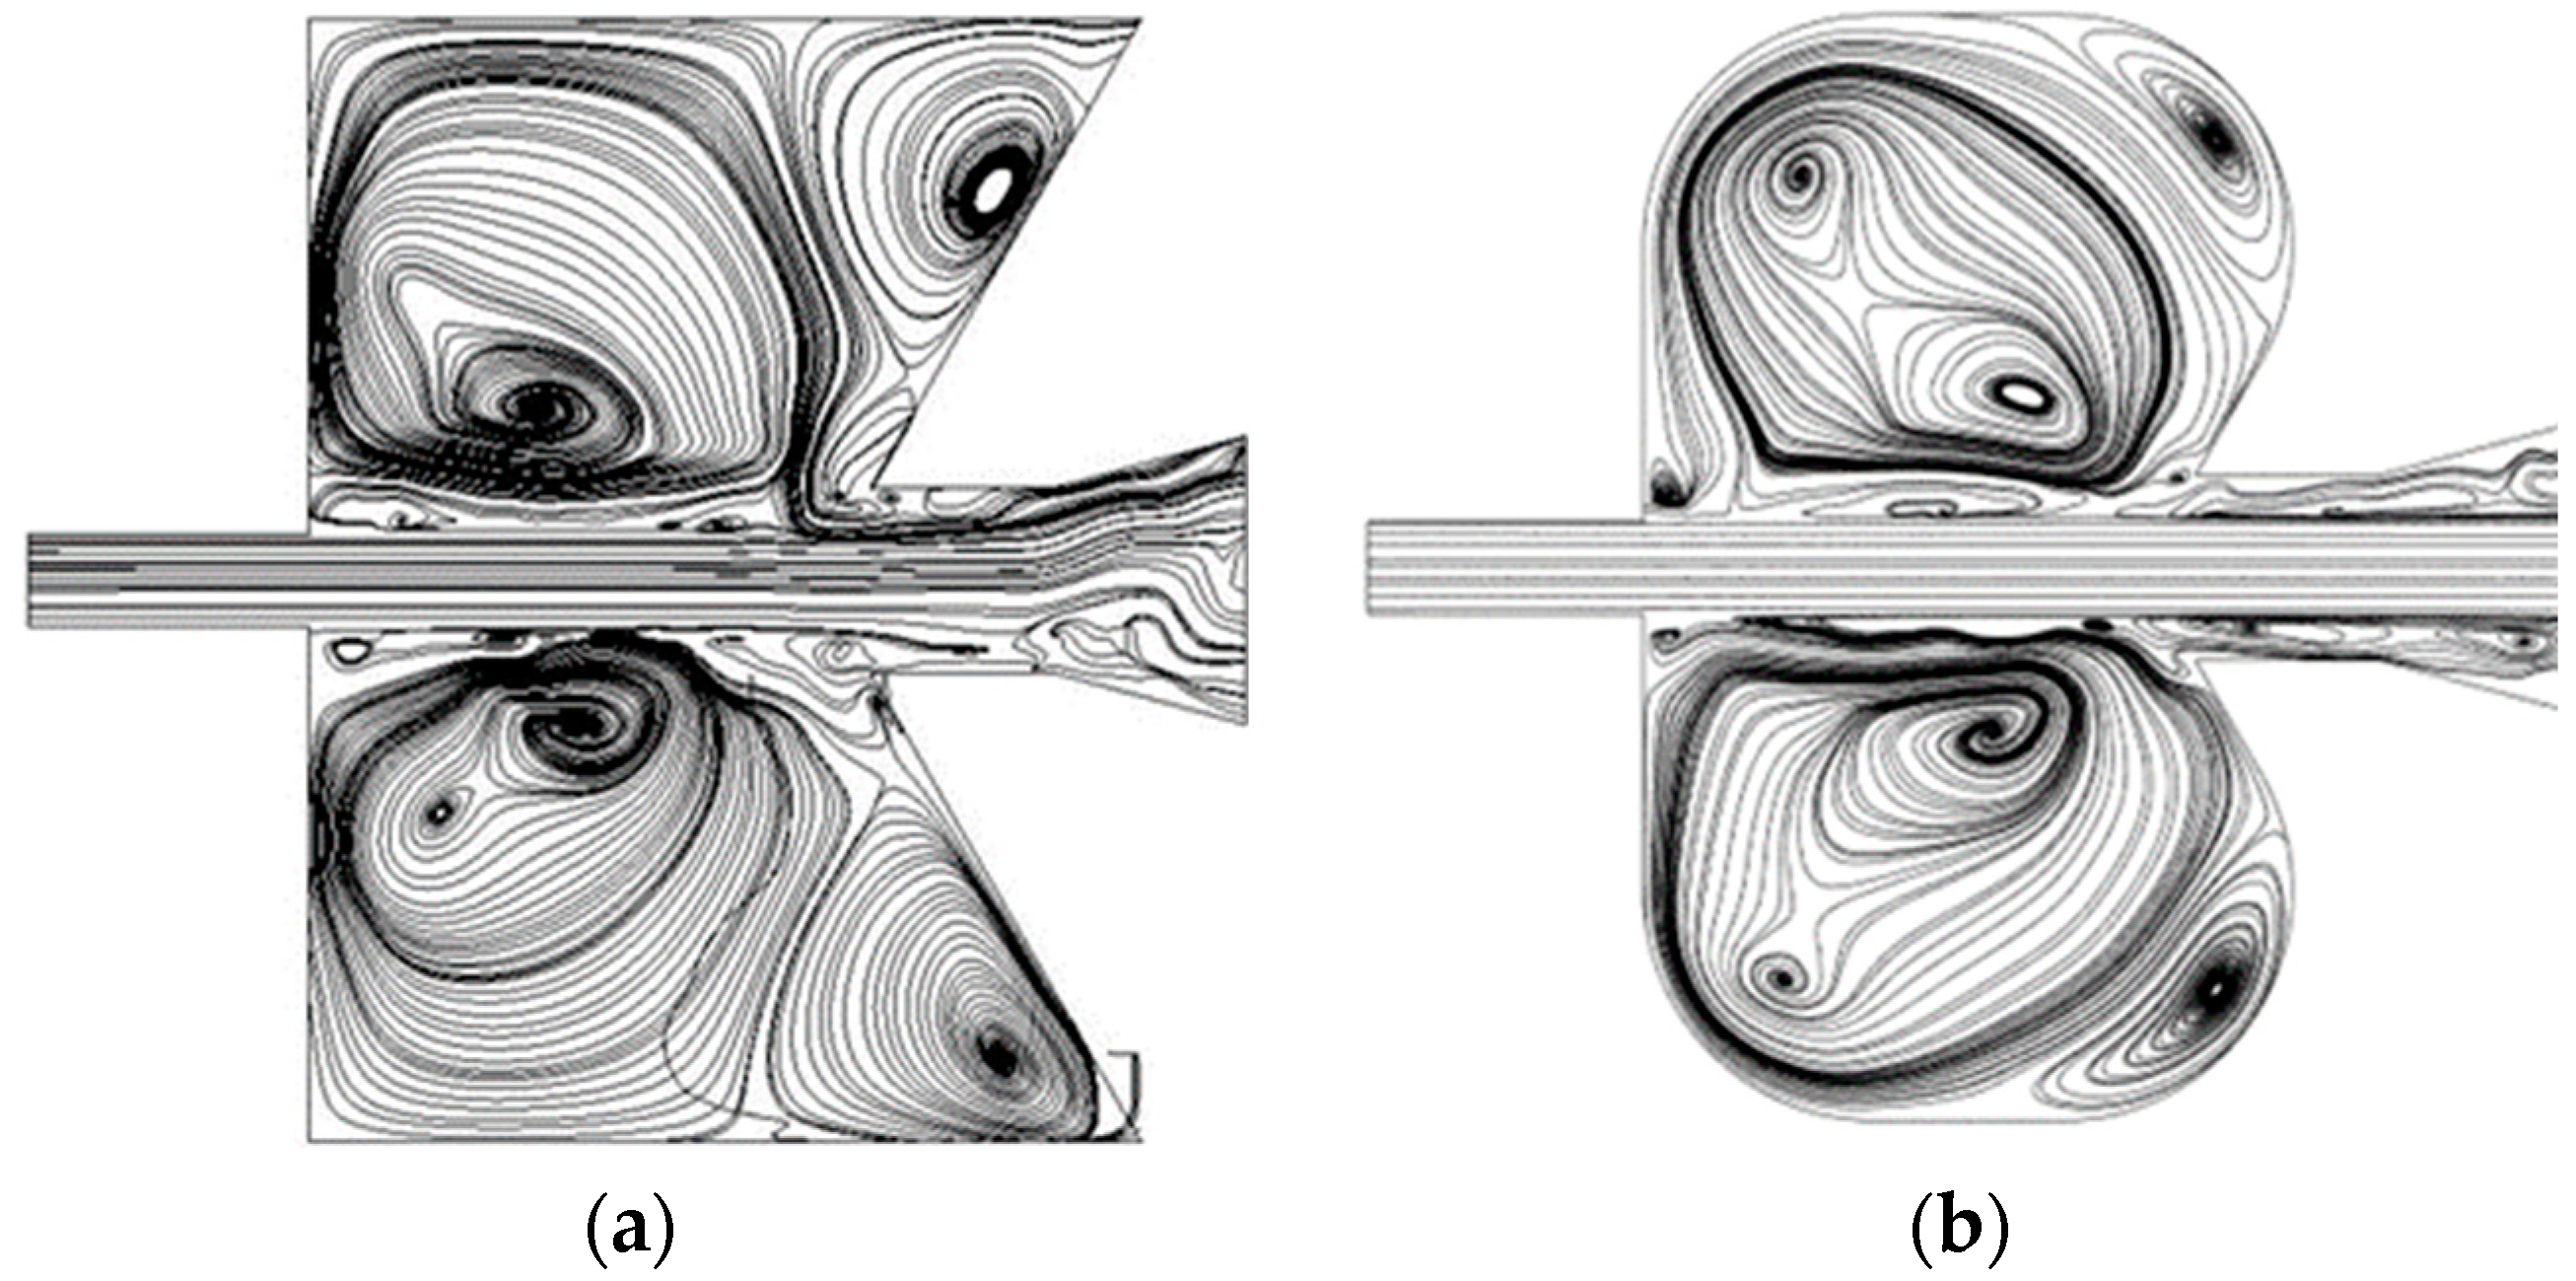
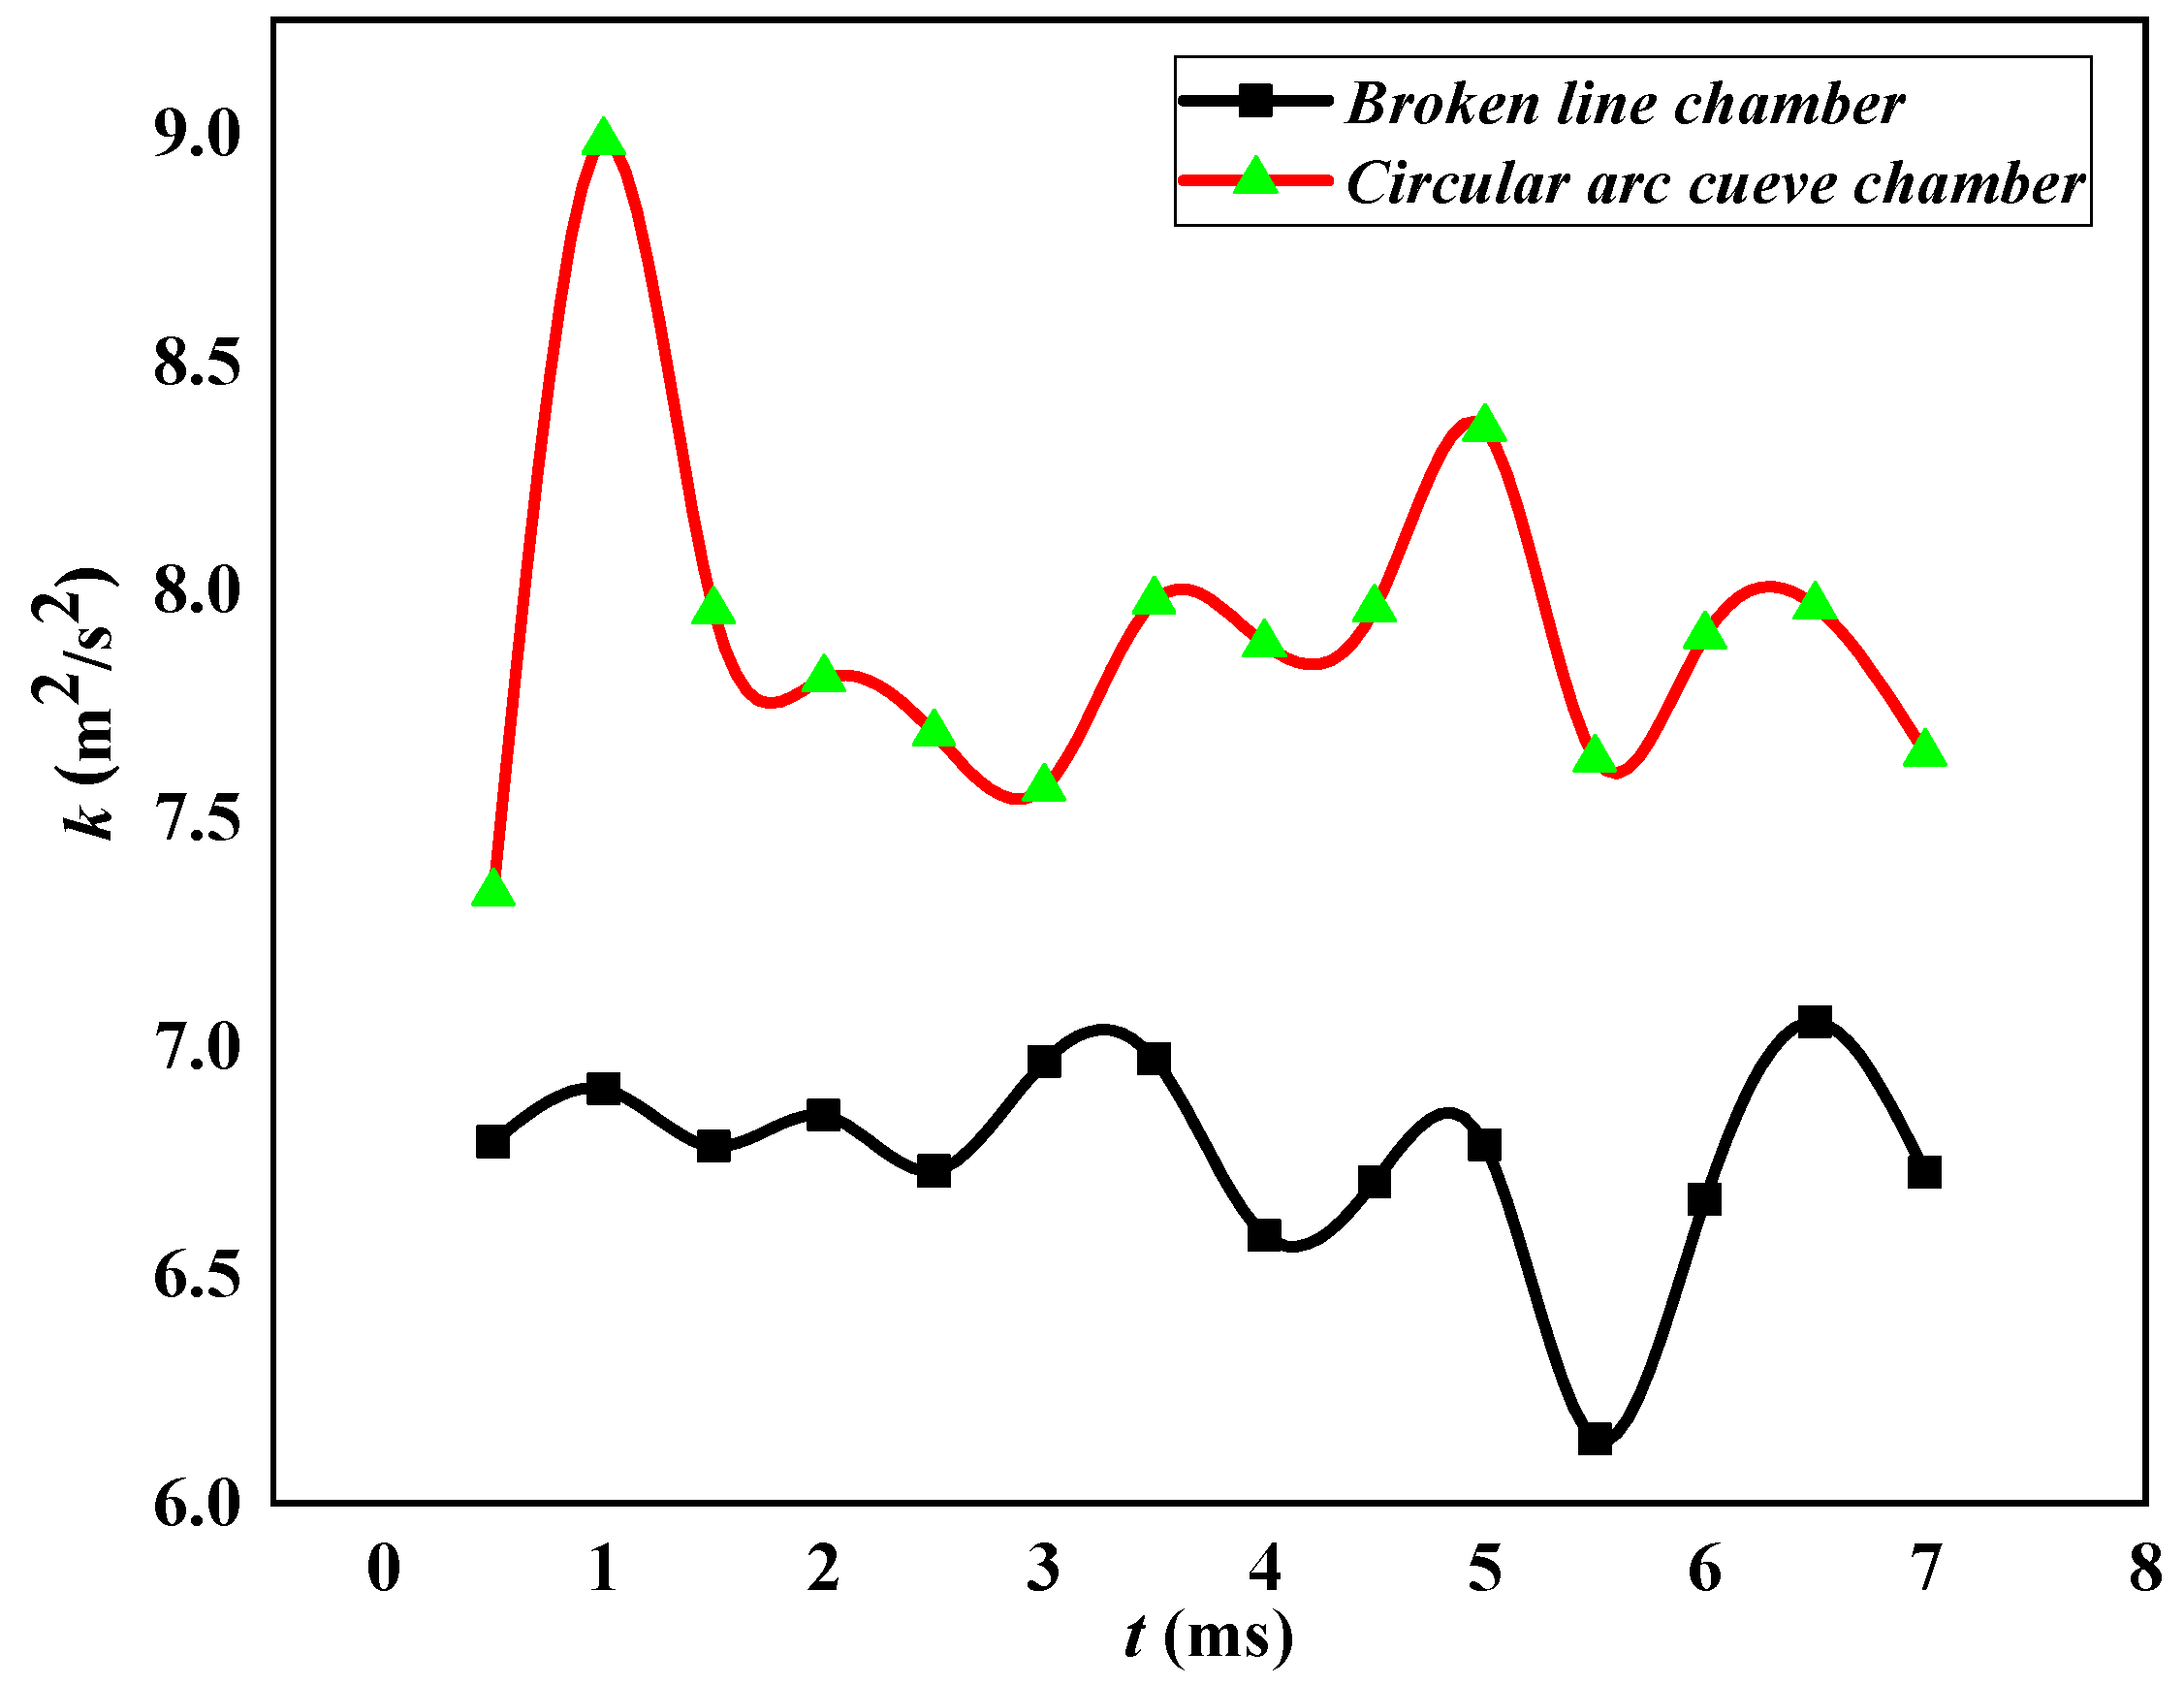
4.2. Comparative Study on Circular Arc Curve Chamber SEON and Broken-Line Chamber SEON

Taking the vapor volume distribution, the vorticity distribution, and the TKE as the comparison parameters, the circular arc curve chamber SEON with the circular arc radius of 2 mm was compared with the broken-line chamber SEON. The isosurface diagram of the vapor volume distribution can reflect not only the size of the vapor phase region but also the morphological characteristics of the cavitation vortex ring. Figure 10 and Figure 11 are the isosurface diagrams of the vapor volume distribution of the broken-line chamber and the circular arc curve chamber, respectively. It can be seen that the central vortex ring forms a circle in the chamber. The position of the central vortex ring in the nozzle of the broken-line chamber is closer to the collision wall. As time goes by, the central vortex ring moves to the upstream of the chamber. In Figure 10d, the collapse of the central vortex ring has basically been completed, and the jet flow completes the accumulation of the energy. The central vortex ring has a long round-trip distance from the downstream to the upstream, and the energy is dissipated in the process. In Figure 11, the position of the central vortex ring in the circular arc curve chamber is closer to the upper nozzle outlet, and the scale of the central vortex ring is larger than that of the broken-line chamber. In addition, the circular arc curve chamber reduces the space of the chamber and the round-trip distance of the vortex ring. Figure 12 shows the comparison of the vapor volume fraction between the broken-line chamber and the circular arc curve chamber. In the figure, the vapor volume fraction of the broken-line chamber ranges from 0.017 to 0.055, and its average value is 0.040. However, the vapor volume fraction of the circular arc curve chamber ranges from 0.030 to 0.112, with an average value of 0.089. The above data indicate that the cavitation area of the circular arc curve chamber SEON is increased by 122.5% compared with that of the broken-line chamber SEON.
Figure 13 shows the distribution of vortex rings in the broken-line chamber and the circular arc curve chamber. As shown in Figure 13a, the central vortex ring is generated in the chamber near the upper nozzle outlet, which can squeeze and block the jet flow at the exit of the upper nozzle. The angle between the collision wall and the chamber wall is altered, and the vortex is formed when the jet flows back upstream through the collision wall. A secondary vortex ring on a smaller scale is generated near the collision wall. The secondary vortex ring is formed in the process of energy dissipation of the jet flow. When the scale is large enough, it will offset the energy of the central vortex ring and weaken the development of the central vortex ring. The distribution of vortex rings inside the circular arc curve chamber nozzle is shown in Figure 13b. It can be seen that the secondary vortex rings at the collision wall are significantly weakened, and their interference with the central vortex ring decreases. This makes the central vortex ring at the upper nozzle outlet effectively enhance the pulse intensity of the SEON. The vorticity distribution of the nozzle outflow field is an intuitive representation of the nozzle vortex motion.
In order to make a further comparative study on circular arc curve chamber SEON and broken-line chamber SEON, the same modeling described above was adopted to investigate the outflow field of the two nozzles. Figure 14 is the isosurface diagram of the vorticity distribution of the nozzle outflow field. The energy of the jet flow from the broken-line chamber SEON is limited. The vortex sheds substantially at the end of the jet flow, as shown in Figure 14a. However, the vorticity distribution of the circular arc curve chamber SEON is much higher than that of the broken-line chamber SEON, especially at the end of the jet flow. This phenomenon is related to the energy of the jet flow. The circular arc curve chamber SEON reduces energy loss, resulting in a more intense shear action of the jet flow and intensified vortex motion. The more intense the vortex, the greater the energy of the jet flow.
When cavitation occurs, it is accompanied by not only the absorption and release of energy, but also the changes in the TKE. Therefore, the variation in the TKE can also reflect the cavitation intensity. Figure 15 shows the comparison of the TKE between the circular arc curve chamber SEON and the broken-line chamber SEON. The TKE of the two nozzles will fluctuate with time. The TKE of the circular arc curve chamber SEON is always higher than that of the broken-line chamber SEON. The TKE of the broken-line chamber SEON ranges from 6.140 m2/s2 to 7.054 m2/s2, and its average value is 6.762 m2/s2. However, the TKE of the circular arc curve chamber SEON ranges from 7.338 m2/s2 to 8.983 m2/s2, and its average value is 7.904 m2/s2. Compared to the broken-line chamber SEON, the TKE of the circular arc curve chamber SEON is increased by 16.9%. The results show that the cavitation intensity of the circular arc chamber SEON is higher. This is due to the regions of low pressure created by the vortex motion that makes cavitation easier to generate.

5. Conclusions

In order to investigate the effect of the chamber wall profile on the cavitation performance of the SEON, a novel circular arc curve chamber SEON was designed. The influence of the circular arc radius on the cavitation performance of the circular arc curve chamber SEON was analyzed by a numerical method. Additionally, a comparative study was conducted between the broken-line chamber SEON and the circular arc curve chamber SEON. The following conclusions were obtained:
(1) With the increase in the circular arc radius, the cavitation performance of the circular arc curve chamber SEON is first enhanced and then weakened. When the circular arc radius is 2 mm, the vortex ring in the chamber reaches the maximum, and the cavitation performance of the nozzle is the best.
(2) Compared to the broken-line chamber SEON, the cavitation performance of the circular arc curve chamber SEON is better. The numerical results show that the cavitation area of the circular arc curve chamber SEON increases by 122.5% and the TKE increases by 16.9%.

Author Contributions

Conceptualization, investigation, writing and editing, project administration, funding acquisition, J.D.; validation, investigation, writing and editing, R.M.; methodology, X.Z.; investigation, J.C. and M.L.; project administration, funding acquisition, X.P. All authors have read and agreed to the published version of the manuscript.

Funding

This research was funded by the National Natural Science Foundation of China, grant number 51979022, and Fundamental Research Funds for the higher education institutions of Liaoning Province, grant number LJKMZ20220356.

Institutional Review Board Statement

Not applicable.

Informed Consent Statement

Not applicable.

Data Availability Statement

Not applicable.

Conflicts of Interest

The authors declare no conflict of interest.

References

  1. Cui, L.H.; Ma, F.; Cai, T.F. Investigation of Pressure Oscillation and Cavitation Characteristics for Submerged Self-Resonating Waterjet. Appl. Sci. 2021, 11, 6972. [Google Scholar] [CrossRef]
  2. Liu, C.T.; Liu, G.; Yan, Z.X. Study on Cleaning Effect of Different Water Flows on the Pulsed Cavitating Jet Nozzle. Shock Vib. 2019, 2019, 1496594. [Google Scholar] [CrossRef]
  3. Yamauchi, Y.; Soyama, H.; Adachi, Y.; Yamauchi, Y.; Soyama, H.; Adachi, Y.; Sato, K.; Shindo, T.; Oba, R.; Oshima, R.; et al. Suitable Region of High-Speed Submerged Water Jets for Cutting and Peening. JSME Int. J. Ser. B 1995, 38, 31–38. [Google Scholar] [CrossRef] [Green Version]
  4. Peng, K.; Tian, S.; Li, G.; Huang, Z.; Zhang, Z. Cavitation in water jet under high ambient pressure conditions. Exp. Therm. Fluid Sci. 2017, 89, 9–18. [Google Scholar] [CrossRef]
  5. Johnson, V.E., Jr.; Chahine, G.L.; Lindenmuth, W.T.; Conn, A.F.; Frederick, G.S.; Giacchino, G.J., Jr. Cavitating and Structured Jets for Mechanical Bits to Increase Drilling Rate—Part I: Theory and Concepts. J. Energy Resour. Technol. 1984, 106, 282–288. [Google Scholar] [CrossRef]
  6. Liu, W.C.; Kang, Y.; Zhang, M.X.; Wang, X.; Li, D.; Xie, L. Experimental and theoretical analysis on chamber pressure of a self-resonating cavitation waterjet. Ocean Eng. 2018, 151, 33–45. [Google Scholar] [CrossRef]
  7. Pan, Y.; Ma, F.; Liu, B.S.; Cai, T. Cavitation intensity and erosion pattern of a self-excited cavitating jet. J. Mater. Process. Technol. 2020, 282, 116668. [Google Scholar] [CrossRef]
  8. Zhou, M.M.; Liu, H.X.; Kang, C.; Wei, X. Resistance of curved surfaces to the cavitation erosion produced through high-pressure submerged waterjet. Wear 2019, 440, 203091. [Google Scholar] [CrossRef]
  9. Hutli, E.; Nedeljkovic, M.S.; Bonyar, A.; Légrády, D. Experimental study on the influence of geometrical parameters on the cavitation erosion characteristics of high speed submerged jets. Exp. Therm. Fluid Sci. 2017, 80, 281–292. [Google Scholar] [CrossRef] [Green Version]
  10. Zhong, X.; Dong, J.M.; Liu, M.S.; Meng, R.; Li, S.; Pan, X. Experimental study on ship fouling cleaning by ultrasonic-enhanced submerged cavitation jet: A preliminary study. Ocean Eng. 2022, 258, 111844. [Google Scholar] [CrossRef]
  11. Peng, C.; Tian, S.C.; Li, G.S. Joint experiments of cavitation jet: High-speed visualization and erosion test. Ocean Eng. 2018, 149, 1–13. [Google Scholar] [CrossRef]
  12. Watanabe, R.; Yanagisawa, K.; Yamagata, T.; Fujisawa, N. Simultaneous shadowgraph imaging and acceleration pulse measurement of cavitating jet. Wear 2016, 358–359, 72–79. [Google Scholar] [CrossRef]
  13. Fujisawa, N.; Fujita, Y.; Yanagisawa, K.; Fujisawa, K.; Yamagata, T. Simultaneous observation of cavitation collapse and shock wave formation in cavitating jet. Exp. Therm. Fluid Sci. 2018, 94, 159–167. [Google Scholar] [CrossRef]
  14. Zhong, X.; Dong, J.M.; Meng, R.X.; Liu, M.; Pan, X. Quantitative Evaluation of Submerged Cavitation Jet Performance Based on Image Processing Method. J. Mar. Sci. Eng. 2022, 10, 1336. [Google Scholar] [CrossRef]
  15. Peng, C.; Tian, S.C.; Li, G.S. Determination of the shedding frequency of cavitation cloud in a submerged cavitation jet based on high-speed photography images. J. Hydrodyn. 2021, 33, 127–139. [Google Scholar] [CrossRef]
  16. Petkovšek, M.; Dular, M. Simultaneous observation of cavitation structures and cavitation erosion. Wear 2013, 300, 55–64. [Google Scholar] [CrossRef]
  17. Soyama, H. High-speed observation of a cavitating jet in air. J. Fluids Eng. Trans. ASME 2005, 127, 1095–1101. [Google Scholar] [CrossRef]
  18. Cai, T.F.; Pan, Y.; Ma, F. Effects of nozzle lip geometry on the cavitation erosion characteristics of self-excited cavitating waterjet. Exp. Therm. Fluid Sci. 2020, 117, 110137. [Google Scholar] [CrossRef]
  19. Li, D.; Kang, Y.; Ding, X.L.; Liu, W. Experimental study on the effects of feeding pipe diameter on the cavitation erosion performance of self-resonating cavitating waterjet. Exp. Therm. Fluid Sci. 2017, 82, 314–325. [Google Scholar] [CrossRef]
  20. Li, Y.J.; Chen, H.S.; Wang, J.D.; Chen, D. Effect of Grooves on Cavitation Around the Body of Revolution. J. Fluids Eng. Trans. ASME 2010, 132, 011301. [Google Scholar] [CrossRef]
  21. Li, D.; Kang, Y.; Wang, X.C.; Ding, X.; Fang, Z. Effects of nozzle inner surface roughness on the cavitation erosion characteristics of high speed submerged jets. Exp. Therm. Fluid Sci. 2016, 74, 444–452. [Google Scholar] [CrossRef]
  22. Cai, T.; Pan, Y.; Ma, F.; Xu, P. Effects of Organ-Pipe Chamber Geometry on the Frequency and Erosion Characteristics of the Self-Excited Cavitating Waterjet. Energies 2020, 13, 978. [Google Scholar] [CrossRef] [Green Version]
  23. Wang, Z.H.; Hu, Y.N.; Chen, S.; Zhou, L.; Xu, W.; Lien, F.S. Investigation of self-excited oscillation chamber cavitation effect with special emphasis on wall shape. Trans. Can. Soc. Mech. Eng. 2020, 44, 244–255. [Google Scholar] [CrossRef]
  24. Wand, L.Q.; Wang, X.M.; Xu, R.L.; Li, J.Y. Structure-parameter Optimized Study of Self-exicited Oscillation Pulsation-jet Nozzle in Low-press and Amount-flux. Fluid Mach. 2004, 32, 7–10. [Google Scholar] [CrossRef]
  25. Lai, S.; Liao, Z. The Theory and Experimental Study of the Self-Excited Oscillation Pulsed Jet Nozzle (Pipeline Pulsed Flow Generator). Nat. Resour. 2013, 4, 395–403. [Google Scholar] [CrossRef] [Green Version]
  26. Yang, Y.; Shi, W.; Tan, L.; Li, W.; Chen, S.; Pan, B. Numerical Research of the Submerged High-Pressure Cavitation Water Jet Based on the RANS-LES Hybrid Model. Shock Vib. 2021, 2021, 6616718. [Google Scholar] [CrossRef]
Figure 1. Structural diagram of the SEON.
Jmse 11 01391 g001
Figure 2. Schematic diagram of the accumulation and release process of the jet energy by the cavitation vortex ring: (a) accumulation process; (b) release process.
Jmse 11 01391 g002
Figure 3. Profile of inner wall of the SEON.
Jmse 11 01391 g003
Figure 4. The meshing of the circular arc curve chamber SEONs.
Jmse 11 01391 g004
Figure 5. Vapor volume distribution in nozzle chamber: (a) r = 1 mm; (b) r = 2 mm; (c) r = 3 mm.
Jmse 11 01391 g005
Figure 6. Variations of vapor volume fraction in nozzle chamber with time.
Jmse 11 01391 g006
Figure 7. Vorticity distribution in the chamber: (a) r = 1 mm; (b) r = 2 mm; (c) r = 3 mm.
Jmse 11 01391 g007
Figure 8. Vorticity isosurface in the chamber: (a) r = 1 mm; (b) r = 2 mm; (c) r = 3 mm.
Jmse 11 01391 g008
Figure 9. Variations of TKE in nozzle chamber with time.
Jmse 11 01391 g009
Figure 10. Isosurface diagrams of vapor volume distribution of broken-line chamber nozzle: (a) t = 2 ms; (b) t = 4 ms; (c) t = 6 ms; (d) t = 8 ms.
Jmse 11 01391 g010
Figure 11. Isosurface diagrams of vapor volume distribution of circular arc curve chamber nozzle: (a) t = 2 ms; (b) t = 4 ms; (c) t = 6 ms; (d) t = 8 ms.
Jmse 11 01391 g011
Figure 12. Comparison of vapor volume fraction of two nozzles.
Jmse 11 01391 g012
Figure 13. Vortex ring distribution in chambers: (a) broken-line chamber; (b) circular arc curve chamber.
Jmse 11 01391 g013
Figure 14. Isosurface diagrams of vorticity distribution of the outflow field: (a) broken-line chamber SEON; (b) circular arc curve chamber SEON.
Jmse 11 01391 g014
Figure 15. Comparison of TKE of two nozzles.
Jmse 11 01391 g015
Table 1. Range of dimensionless parameters of the SEON.
Dimensionless Parametersd2/d1Dc/d2Lc/Dc
Value1.6–2.36.0–9.00.5–0.7
Table 2. Structural parameters of the SEON.
Structural ParameterSymbolValueUnit
Upper nozzle diameterd11mm
Lower nozzle diameterd22mm
Chamber diameterDc12mm
Chamber lengthLc6mm
Collision wall angleα120o
Table 3. Grid independence verification.
Grid NumberVelocity (m/s)Deviation (%)Pressure (Pa)Deviation (%)
Point A462,813200.74 20,130,917
504,214200.420.15920,104,3800.132
576,392200.160.13020,087,3060.085
641,547200.120.01920,076,8670.052
799,182200.090.01520,083,8930.035
Point B462,813200.47 20,275,709
504,214200.800.16420,125,9300.744
576,392200.630.08520,053,3430.362
641,547200.560.03620,077,4350.120
799,182200.610.02420,094,5000.085
Disclaimer/Publisher’s Note: The statements, opinions and data contained in all publications are solely those of the individual author(s) and contributor(s) and not of MDPI and/or the editor(s). MDPI and/or the editor(s) disclaim responsibility for any injury to people or property resulting from any ideas, methods, instructions or products referred to in the content.

