Article

Optimal Control Strategy for Ship Cabin’s Active Chilled Beam System Using Improved Multi-Objective Salp Swarm Algorithm

School of Automation, Wuhan University of Technology, Wuhan 430070, China
*
Author to whom correspondence should be addressed.
J. Mar. Sci. Eng. 2023, 11(7), 1396; https://doi.org/10.3390/jmse11071396
Submission received: 14 June 2023 / Revised: 5 July 2023 / Accepted: 7 July 2023 / Published: 11 July 2023
(This article belongs to the Section Ocean Engineering)

Abstract

:
Heating, ventilation, and air conditioning (HVAC) systems are the second largest energy consumers on cruise ships after the propulsion system. As a kind of HVAC system, active chilled beam (ACB) systems have been widely used for cabin service due to their performance of energy efficiency and good thermal comfort. However, conventional control strategies for ships’ ACB systems are not intelligent enough and cannot balance energy consumption and cabin comfort during the voyages of ships. This study developed an optimal control strategy for cabins’ ACB systems. First, a simulation environment considering dynamic conditions is established in TRNSYS. Second, an artificial neural network model is utilized to predict the energy consumption of the ACB system, while the predicted percentage dissatisfied is adopted to represent cabins’ thermal discomfort. Third, an improved multi-objective salp swarm algorithm is proposed to dynamically minimize both energy consumption and thermal discomfort. A TRNSYS–MATLAB co-simulation testbed is established to simulate the cabins served by an ACB system on a small cruise ship navigating from Hong Kong to Shanghai for validation tests and a comparison study. Compared to the conventional strategies, the proposed strategy can achieve a maximum energy savings of 12% while maintaining a predicted mean vote index less than 0.5, meeting the comfort requirements set by ASHRAE.

1. Introduction

Cruise ships have the highest energy intensity per passenger-kilometer compared to any other form of tourism due to the large amount of energy required to power the ship and maintain comfort and luxury for its passengers [1]. The cruise ship sector has experienced substantial expansion in recent years, especially for small cruise ships, known as luxury yachts, which have particularly undergone a rapid increase with the growth of social wealth [2]. According to the China Cruise Yacht Industry Association (CCYIA), there were more than 160 yacht clubs, 114 marinas, and 25,000 yachts in China by 2019, and the industry is gaining momentum again after the epidemic [3]. Despite having relatively small sizes, these ships with luxury spaces operating along the coast use substantial energy and have negative effects on the environment [4]. Various energy-saving and emission-reduction policies have been implemented in the cruise sector, including China’s efforts to establish ship emissions control areas (ECAs) in coastal regions and the EU’s initiative to monitor and report the fuel consumption and CO2 emissions of cruise ships [5]. Hence, efficient energy management and emissions reductions are crucial for the cruise shipping industry. For cruise ships, HVAC (heating, ventilation, and air conditioning) systems could be the second largest consumers of energy after the propulsion system [6] due to the large amount of air conditioning and ventilation required to maintain comfortable living and working conditions for the crew and passengers.
Thus, as shown in Figure 1, today’s implementation of energy management systems (EMS) not only involves the optimization of engine and propulsor power management but also increasingly considers HVAC systems [7]. Active chilled beam (ACB) systems, as a kind of HVAC system, have been constantly used on ships in recent years due to their performance of being more energy efficient [8].
Figure 2 illustrates the structural diagram of a standard ACB terminal. The primary air, which comes from outside and has been processed by an air conditioning unit (AHU), is sprayed out at a high speed through nozzles and enters the cold beam. According to the Venturi effect, when a high-speed airflow encounters an obstacle, a low-pressure area is created near the port above the obstacle’s windward surface. This phenomenon induces a flow of low-speed secondary air inside the room to pass through the cooling coil. The secondary air, which has been cooled to a low temperature, combines with the primary air to create a high-velocity airflow that effectively supplies the room. The induction capacity of ACB systems is normally measured by the induction ratio (IR), defined as the ratio of induced room air to primary air [9]. Currently, there is relatively little research on ship air conditioning systems. Compared to buildings on land, the ambient conditions aboard ship constantly change with their positions, resulting in more frequent and severe fluctuations in the loads on cabin air conditioning systems as ships navigate.
During the navigation of ships, the temperature, humidity, and average solar radiation intensity outside vary greatly in different navigational areas. Additionally, the ship’s speed and course also change constantly, resulting in even more frequent fluctuations in the actual load of the ship’s air conditioning system [10]. The traditional method of calculating the load of ship air conditioning systems is based on typical climate conditions. When ships navigate across different areas, it is easy for the actual load to deviate from the established conditions, resulting in energy waste. In research on the dynamic load of ship air conditioning systems, Gao [11] established a mathematical model of dynamic heat transfer in cabins based on Fourier’s law and calculated the hourly dynamic cooling load of a crew cabin on a ship sailing in the Malacca Strait. During the calculation process, the solar radiation intensity was considered to be fixed, and only changes in the solar azimuth angle were considered. Cheng Hua et al. [10] calculated the dynamic load for ship cabins using a black-box model and obtained the variation law of dynamic loads for cabins on a typical Eurasian ocean route. For ships operating in offshore waters, the weather conditions outside are not significantly different from those of nearby coastal cities on land [12]. In the absence of actual meteorological parameters from the sea, Cheng et al.’s model used the weather conditions in different navigational areas, the ship’s position, and a representative day to simulate the voyage scenarios. Wang et al. [13] conducted an analysis of how the cooling loads of ships change dynamically while sailing on coastal routes in China. The study showed that, when a ship changes its heading angle, it can alter the angle of incidence of the sun’s radiation on the ship, resulting in a change in the cooling load. Therefore, to accurately control the HVAC system on a moving ship, it is necessary to establish a dynamic meteorological condition that considers the ship’s position and heading angle.
Numerous studies have shown that utilizing model-based optimal control strategies in HVAC systems can result in decreased energy consumption. Kim et al. [14] developed a mathematical cooling capacity model of primary air and an ACB cooling coil. A non-dominated sorting genetic algorithm was adopted to minimize the cooling capacity of primary air, maximize the cooling capacity of the cooling coil by controlling the primary airflow rate, and supply the air temperature, cooling water flow rate, and cooling water temperature. The study showed that controlling ACB systems can be more energy-efficient by optimizing the appropriate variables. Maccarini et al. [15] proposed an empirical model of a heat transfer coefficient, which can be utilized to determine the rate of heat transfer for ACB terminal coils. The model depended on the primary air mass flow rate, the temperature difference between the outlet and inlet water, and the water mass flow rate. Machine learning algorithms have been increasingly applied to optimize the operation of HVAC systems. Lee et al. [16] developed an energy consumption prediction model for variable air volume (VAV) systems based on an artificial neural network (ANN) to achieve the lowest energy consumption through AHU supply air temperature optimal control. Compared with mathematically analytical models, ANNs enable more accurate predictions due to their ability to learn and analyze mapping relationships, including non-linear phenomena. Thermal comfort is another crucial consideration for HVAC systems. Several metrics, for instance, predicted mean vote (PMV) [17], standard effective temperature (SET) [18], and operative temperature (OT) [19], are commonly used to quantitatively evaluate thermal comfort. Azad et al. [20] investigated general thermal comfort for ACB systems and other conventional systems using a PMV–PDD model. For ACB systems, the mean PPD was less than 6% for the conducted tests, resulting in Category A of ISO 7730. Yang et al. [21] demonstrated the implementation of a model predictive control (MPC) system for ACB systems. The objective of the model was to optimize the cooling power and thermal comfort in real time. Both cooling power and thermal comfort are combined into a single function, with each assigned a weighting factor. Similarly, Mossolly et al. [22] developed a cost function that combines energy consumption and thermal comfort with different weighting factors for VAV systems. A genetic algorithm was used to optimize both thermal comfort and energy savings simultaneously. Although combining multiple objective functions into a single objective function can simplify the solution process, the use of varying weighting factors can result in significantly different solutions and even suboptimal outcomes. Determining suitable weighting factors can be a challenging task. Wu et al. [23] developed an energy consumption model for ACB systems and thermal comfort models for rooms. Moreover, through an optimization strategy using the non-dominated sorting genetic algorithm II (NSGA-II), energy consumption and thermal comfort could be balanced. However, the process of building the energy model required extensive parameter settings and empirical knowledge, which may vary under different conditions; thus, it could be difficult to develop an accurate and effective model in a new scenario. Simulation software can also help to optimize HVAC system operation by providing real-time data on temperature, humidity, and other environmental factors, allowing for adjustments to be made to maximize efficiency and comfort. Lee et al. [16] modeled a building and VAV system in EnergyPlus and developed a supply air temperature decision module in MATLAB. The study achieved real-time optimization of the supply air temperature to minimize the energy consumption of HVAC systems through co-simulation. Kim et al. [14] used EnergyPlus to establish ACB models and optimized control variables using jEPlus+EA, an open source tool developed for managing complex parametric simulations. Zhang et al. [24] found that TRNSYS and EnergyPlus lack accurate indoor air velocity information. Therefore, a separate consideration involving indoor air velocity is needed for comfort models when using the simulation software.
After constructing energy consumption and thermal comfort models for HVAC systems, optimization algorithms are used to solve the models. For multi-objective optimization problems, commonly used algorithms include NSGA-II [25], the multi-objective gray wolf algorithm (MGWA) [26], and the multi-objective particle swarm optimization algorithm (MPSO) [27]. The multi-objective salp swarm algorithm is a swarm intelligence algorithm proposed by Mirjalili [28]. Compared to NSGA-II, MPSO, and other algorithms, MSSA has a simpler computational form, which is easy to implement, and it can find relatively accurate and uniformly distributed Pareto-optimal solutions. However, MSSA also has the problems of becoming easily trapped in local optima and a slow convergence speed. The summary of related works on controlling of cabin’s ACB system is shown in Table 1.
To address the aforementioned problems, an optimal control model has been developed for ship cabins’ ACB systems, specifically concerning optimizing energy consumption and thermal comfort under dynamic conditions. The energy consumption of the ACB system is predicted by an energy model based on artificial neural networks (ANNs), while the cabin’s thermal discomfort is measured by the predicted percentage dissatisfied (PPD). The multi-objective optimization is formulated to dynamically minimize both energy consumption and thermal discomfort, which are ever-changing. The improved version of the MSSA is utilized to simultaneously optimize the two objectives, and a TRNSYS–MATLAB co-simulation testbed is established to simulate the cabins served by ACB systems on small cruise ships navigating from Hong Kong to Shanghai for validation tests and a comparison study.
The provided contributions in this paper are emphasized as follows.
(1)
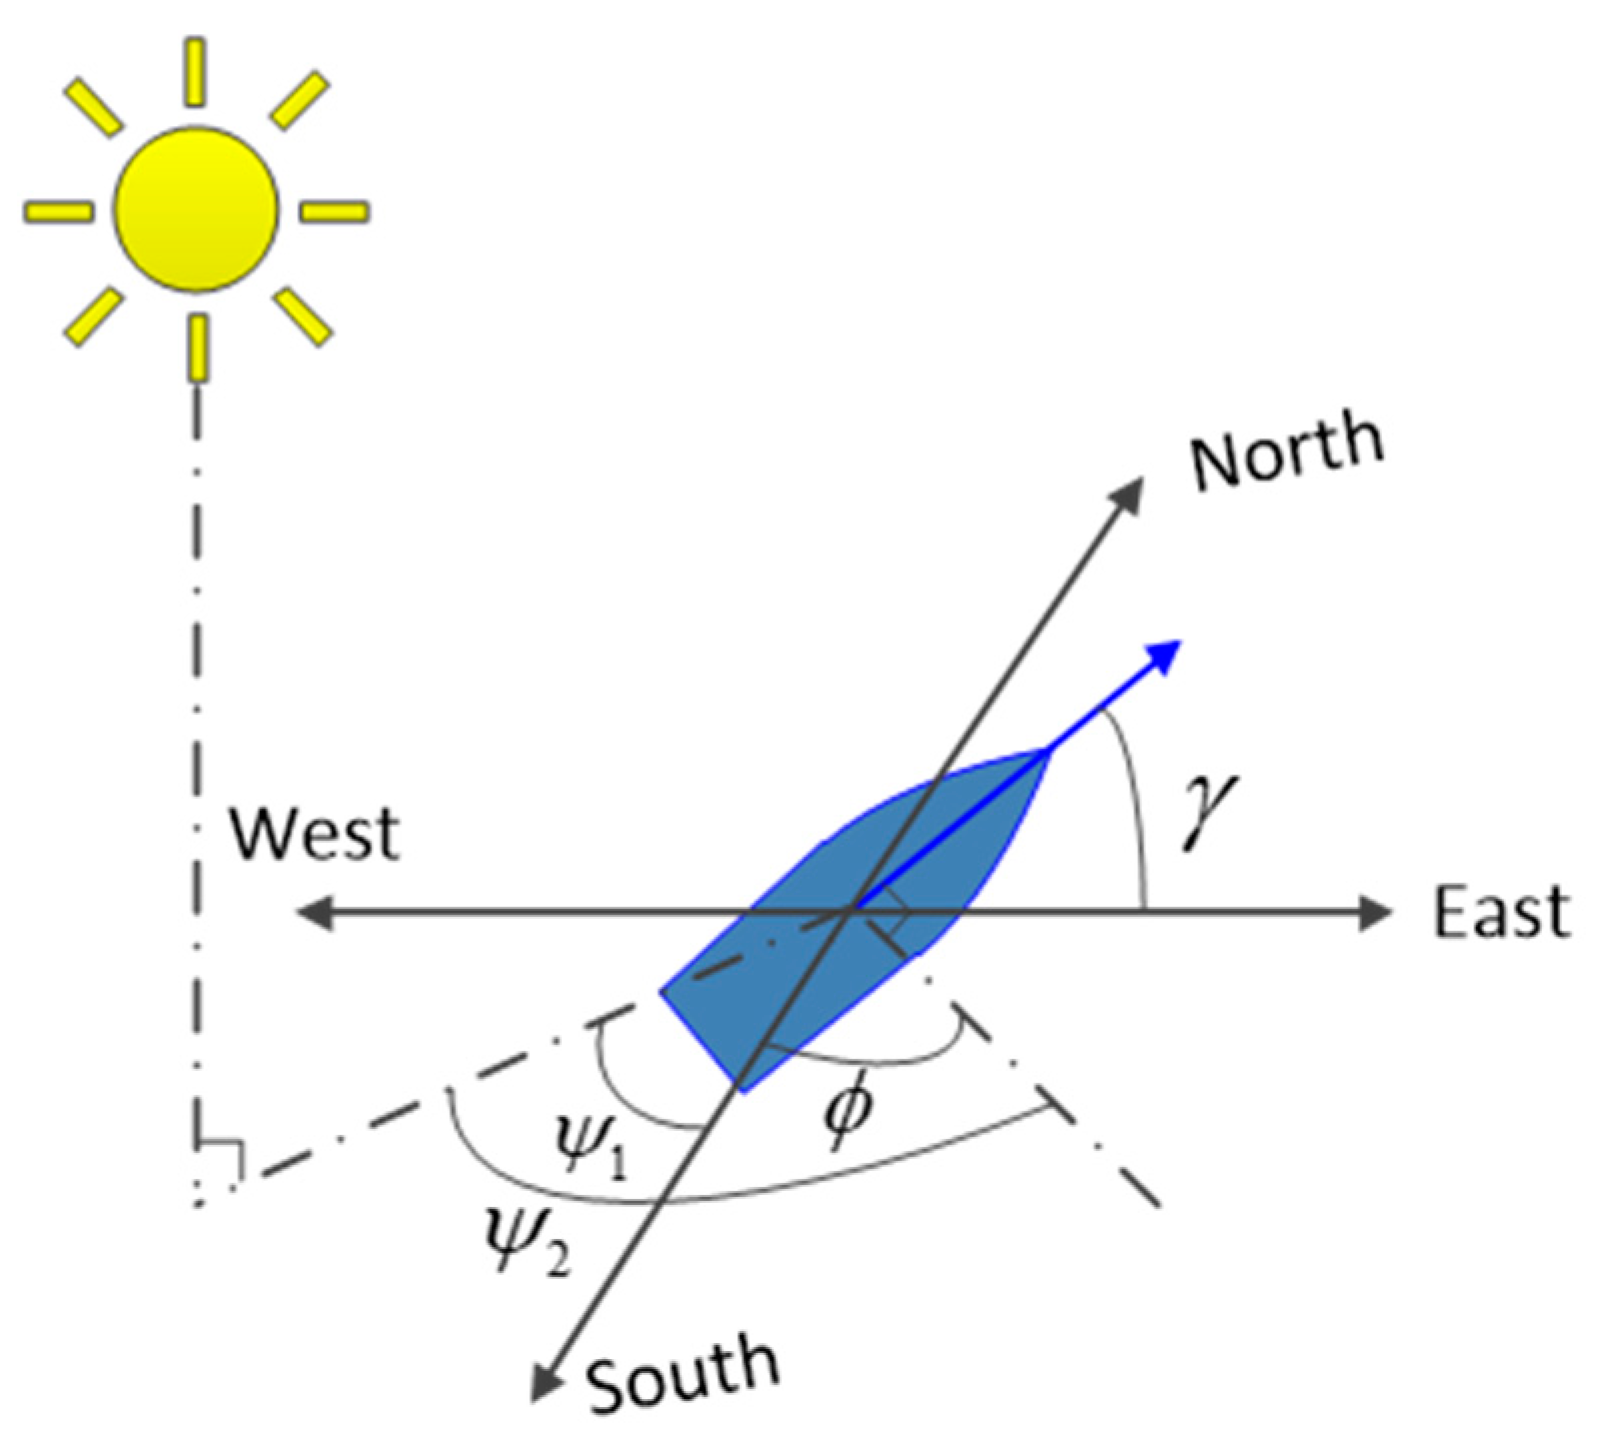
A dynamic simulation environment considering changing weather conditions, the ship’s position, and its heading angle is developed for the optimal control of a cabin’s ACB system. The control of cabin air conditioning systems, considering the movement of ships and the changing weather conditions in different navigation areas, offers a more accurate and realistic scenario compared to controlling systems in fixed locations. However, due to its complexity, this particular aspect has received limited attention in the current literature.
(2)
We propose a modified tent chaotic map, which demonstrates high sensitivity to initial conditions and which can generate a more evenly distributed sequence. These characteristics can significantly enhance the diversity of the population and the efficiency of chaotic searches using optimization algorithms.
(3)
An adaptive weight update strategy and a refinement search mechanism based on the modified tent chaotic map are incorporated into the MSSA, forming the improved multi-objective salp swarm algorithm (IMSSA). The results show that, compared to the original algorithm, the IMSSA can achieve a more accurate and uniform Pareto front with a faster convergence speed and greatest energy savings while maintaining thermal comfort.
The rest of this paper is organized as follows. Section 2 defines the nomenclature utilized in this study. Section 3 introduces the dynamic simulation conditions of the ship and the formulation of the optimization model concerning energy consumption and cabin comfort. The structure of the original MSSA and the improved algorithm with the adaptive refinement search and weight update strategy are presented in Section 4. The MATLAB and TRNSYS co-simulation testbed is presented in Section 5. The simulation results based on comparative experiments are presented and discussed in Section 6. Section 7 provides concluding remarks and future research directions related to our study.

2. Nomenclature

The nomenclature adopted in this study aligns with standard conventions in the field of ocean engineering and thermal engineering, as demonstrated in Table 2.

3. Simulation Model and Conditions

3.1. Overview of the Simulation Model

As shown in Figure 3, a small cruise ship touring along offshore lines is to considered as a case study. The ship departed from the west of Hong Kong at 1:00 p.m. on 10 July and arrived north of Shanghai at 1:00 p.m. on 14 July, taking a total of four days. During this period of time, the relatively high temperature outside the ship’s cabin, coupled with the rapidly changing weather conditions, is of significant importance for studying the ship’s air conditioning system. An ACB system consisting primarily of an AHU and an ACB terminal unit is used for the ship’s cabin, as shown in Figure 4. The cabin’s designed temperature is set to 26 °C, which is considered a neutral temperature for occupant thermal sensation and has been shown to lead to greater satisfaction during sleep [29]. For traveling ships sailing in subtropical regions during the summer, higher cabin relative humidity can cause passengers to feel sleepy, thereby affecting their thinking, and a relative humidity of 50% was shown to be a reasonable level that people find thermally acceptable and energetic [30]. The configuration and the material properties of the simulation model are shown in Table 3.

3.2. Dynamic Simulation Conditions

Compared to onshore buildings, ships experience more frequent changes in navigation areas, courses, and weather conditions during their voyages, resulting in more severe fluctuations in the cooling load inside the cabins. However, it is difficult to gather accurate data on marine weather conditions along the course of a ship’s journey. To model the dynamic meteorological conditions of the ship, a method utilizing weather parameters from a typical city that is geographically closest to the ship over its entire voyage is adopted in this study. These typical cities’ weather parameters, including hourly information, such as temperature, humidity, and solar radiation, can be obtained through EPW format weather files, which are publicly available from the U.S. Department of Energy. Furthermore, during the ship’s voyage, changes in the ship’s heading angle will cause a variation in the azimuth angle of the sun relative to the ship, leading to a change in the intensity of direct solar radiation on the ship and thus affecting the variation in the cooling load inside the cabin. Hence, this influence of the ship’s heading angle on the cooling load inside the cabin was also considered as we modeled the ship’s dynamic conditions in TRNSYS. As shown in Figure 5, at the current position, the ship’s cabin balcony is facing S ϕ ° E . The azimuth angle of the sun relative to the ship ψ 2 is equal to the sum of the sun’s azimuth angle ψ 1 and the ship’s heading angle γ .
ψ 2 = ψ 1 + γ
The case study’s ship departed from western Hong Kong at 1:00 p.m. on 10 July and arrived in southern Shanghai at 10:00 p.m. on 13 July. The geographically closest typical cities along the route are Hong Kong (12 h), Shantou (7 h), Xiamen (15 h), Fuzhou (15 h), Wenzhou (16 h), Ningbo (15 h), and Shanghai (16 h). The ship’s heading angle changed from N70° E to N30° W along the course.
Figure 6 shows the internal heat gain schedule. Each zone is subject to an indoor dynamic load characterized by different schedules for people, lighting, and equipment loads.
The dynamic cooling loads inside the cabin, considering various navigational areas, changing weather conditions, and the ship’s position and heading angle, are shown in Figure 7. It can be seen that the indoor cooling rate is relatively high near Hong Kong, around 4623 h and 4645 h, due to the high ambient temperature, which is greater than 30 °C during these time periods. As the ship sailed from Xiamen toward Fuzhou, the ambient temperature dropped to around 24 degrees Celsius, which is relatively low. This change led to a significant reduction in the indoor cooling load. Furthermore, despite the outdoor temperature remaining around 27 degrees Celsius closer to Shanghai, the incidence of the sun’s radiation decreased as the ship’s heading angle faced northwest. This decrease caused the cabin balcony to move away from the sun’s direction and resulted in a relatively low cooling load. Overall, compared to using one typical weather file, considering the weather conditions in different navigational areas and the changes in the ship’s heading angle can lead to more accurate modeling of the dynamic environment during the ship’s navigation. This greater accuracy, in turn, can enable more effective control of the cabin air conditioning system.

3.3. Energy and Thermal Comfort Model

3.3.1. Energy Predictive ANN Model Development

Figure 4 illustrates the structure of a typical ACB system. The energy consumers include fans, pumps, and chillers, one of which is used to condition the outdoor air as it enters the AHU, and the other of which is responsible for providing chilled water for the cooling coil in ACB terminal units. The performance of the chiller is quantified by its coefficient of performance (COP), which is determined by the part load ratio (PLR), and the correlation is depicted in Figure 8a. Moreover, the part load curves of the fan and pump are shown in Figure 8b,c.
An ANN model is utilized to predict the energy consumption of the ACB system. The construction process of the ANN model consists of two steps. The first step determines the number of neurons in the input layer and output layer of the ANN model. The output layer of the ANN model contains one neuron, with the output variable being the total energy consumption of the ACB system. The energy consumption is generally influenced by environmental conditions, including the outdoor dry bulb temperature T a m b , outdoor relative humidity R H a m b , diffuse solar radiation rate per area D H I , direct solar radiation rate per area D N I , and indoor cooling load demand Q [31]. In Kim’s ANN model of the VAV system, environmental variables are selected, including outdoor dry bulb temperature T a m b , outdoor relative humidity R H a m b , diffuse solar radiation rate per area D H I , direct solar radiation rate per area D N I , and indoor cooling load demand Q . To validate the correlation between the above features and the energy consumption, Pearson’s correlation coefficient R is utilized in this study and listed in Table 4. A positive value indicates a positive correlation between the two variables. It can be seen that all the correlation coefficients are greater than 0.4, indicating that all the variables are correlated with energy consumption [32].
In Kim’s model, the primary air temperature is optimized for VAV systems. For ACB systems, the primary air flow rate V p r i and temperature T p r i are commonly used for optimization. Thus, a total of seven variables are adopted as input neurons to the ANN model. Outdoor dry bulb temperature, outdoor relative humidity, diffuse solar radiation rate per area, direct solar radiation rate per area, and indoor cooling load demand are used as correlated environmental variables, while the primary air flow rate and temperature are optimized variables. The chilled water flow rate is adjusted to meet the indoor cooling demand. The second step is to find the optimal parameters of hidden layers by training and testing ANN models with different numbers of hidden layers and neurons. The commonly used tangent–sigmoid and pure-linear methods were adopted for the hidden and output layer neurons, respectively. The Levenberg–Marquardt algorithm works better on non-linear fitting functions and is utilized for the learning process of the model [33]. The learning rate of the initial model was set to 0.3, and the momentum was set to 0.9. Further, the optimal numbers of hidden layers and neurons can be determined by evaluating the coefficient of variation of the root mean squared error (CV-RMSE) metric, which indicates the model’s predictive performance. The optimal configuration is when the CV-RMSE is lowest and less than 30%, as required by ASHRAE Guideline 14 [34]. The RMSE and CV-RMSE metrics are calculated as follows [35]:
RMSE = i = 1 N ( Y i Y ^ i ) 2 N
CV - RMSE = RMSE Y ¯
where Y i and Y ^ i are the ANN model prediction value and actual measurement value, respectively; N is the number of measurement values; and Y ¯ is the average of the measurement values.
The learning and testing data for the artificial neural network (ANN) model were generated using TRNSYS, with the temperature of primary air increasing by 0.5 °C from 12 °C to 18 °C, and the primary air flow rate increasing by 0.5 × 10 3   m 3 / s from 14 × 10 3   m 3 / s to 60 × 10 3   m 3 / s under different meteorological conditions on navigation days. These conditions varied the cooling loads and were used to derive data for the input neurons, along with parameters and total energy consumption, which served as the output value of the ANN model.
The prediction accuracy of the ANN model increases as the number of hidden neurons and layers grows, but when these parameters reach a certain number, it may result in overfitting and reduced accuracy for new data [36]. In this study, the number of hidden layers N h i d d e n is fixed at 1, 2, 3, 4, and 5. The lower CV(RMSE) values under different hidden neurons in the five cases are shown in Table 5. The best result for CV(RMSE) was achieved using nine hidden neurons and two hidden layers, which resulted in a value of 24.46%; thus, a 7-9-9-1 ANN was adopted to predict the energy consumption of the ACB system.
After determining the structure of the ANN, considering that the model will be used as an objective function for multi-objective optimization and combined simulation with TRNSYS, we selected several models that are commonly used as objective functions in combined simulations to compare their predictive performance. They are supporting vector regression (SVR) models with polynomial kernel functions, radial basis kernel functions and sigmoid kernel functions, multiple linear regression (MLR), and the response surface method (RSM) [37]. The regularization parameter C of the SVR with the radial basis function and the SVR models with the sigmoid kernel and polynomial kernel are 0.3, 0.5, and 11, respectively, while the ε is taken as 0.1. The polynomial kernel’s degree is 3, and the kernel parameter for the radial basis function and the sigmoid kernel is set as the default value of 0.1. In addition to the coefficient of variation of the root mean squared error (CV-RMSE) and the root mean squared error (RMSE), the mean absolute error (MAE) and the mean relative error (MRE) are commonly used to compare the performance of each model, and they can be computed as the following equations. The compassion results are shown in Table 6.
MAE = i = 1 N | Y i Y ^ i | N
MRE = 1 N i = 1 N | Y i Y ^ i | Y i
It can be seen in Table 6 that the SVR with polynomial kernel, sigmoid kernel, MLR, and RSM exhibit poor prediction performance, with CV-RMSE values of 46.71%, 36.90%, 52.23%, and 54.61%, respectively. These values all exceed the 30% threshold set by ASHRAE. On the other hand, the SVR with radial basis function kernel and the ANN model demonstrate good performance, both achieving a CV-RMSE less than the 30% standard specified by ASHRAE. Among these models, the ANN model shows smaller values for RMSE, CV-RMSE, MAE, and MRE compared to SVR. Therefore, in this study, the ANN model was chosen as the objective function for optimization and was applied in subsequent combined simulations.

3.3.2. Thermal Comfort Model

Thermal comfort is the state of mind of a person who is satisfied with the thermal environment, determined by the interaction of environmental and personal factors. Professor Fanger [38] proposed the predicted mean vote (PMV) index, based on a large number of experiments, to predict the average thermal sensation of a large group of people in a specific indoor environment. The PMV index, which is now one of the most widely used thermal comfort indicators, considers factors including indoor air temperature, mean radiant temperature, relative humidity, and air velocity to establish a thermal comfort equation that considers human thermoregulation and heat balance:
PMV = f ( T a , T r , R H , v a r , M , W , I c l )
where T a is the indoor air temperature, T r is the mean radiant temperature, R H is the indoor relative humidity, v a r is the relative air velocity, M is the metabolic rate, W is effective mechanical power, and I c l is the clothing insulation of the clothing worn in summer.
The PMV scale ranges from −3 to +3, with negative values indicating a cold sensation, zero indicating a neutral or comfortable sensation, and positive values indicating a warm sensation. According to ASHRAE 55, the recommended thermal limit on the scale of PMV is between −0.5 and 0.5 [39].
Based on the PMV index, Professor Fanger also developed the predicted percentage of dissatisfied (PPD) model to represent the level of dissatisfaction of occupants with their indoor thermal environment. The relationship between PMV and PPD is as follows:
PPD = 100 - 95 exp ( - 0.003353 PMV 4 - 0.2179 PMV 2 )
PPD scales the thermal discomfort from 5% to 100%. The smaller that the PPD is, the smaller that the absolute value of PMV is, indicating a more neutral and comfortable sensation. In this study, the PPD is calculated and minimized for the thermal comfort of the ship’s cabin. The clothing insulation I c l is 0.67 clo, assuming the typical indoor clothing in summer is short sleeves, shorts, long thin trousers, and thin shoes, based on ISO 7730. The relative humidity is assumed to be 50%, and the mean radiant temperature T r is assumed to be equal to the indoor temperature T a . The metabolic rate M of the human body is 1 met in a quiet or light activity state, and the effective mechanical power W is set at 0. Air velocity is a critical parameter in determining the PPD in indoor environments. High air velocities can promote heat transfer from the human body to the surrounding air, leading to a cooling effect. However, excessively high air velocities can also cause discomfort. Low air velocities can result in stagnant air and increase the feeling of stuffiness [40]. For the resting condition in cabins, the relative air velocity v a r can be set as the maximum air velocity, which is mainly affected by the primary airflow rate and is calculated using the following equation [41]:
v m a x = e 1 V p r i e 2
where v m a x is the maximum air velocity; V p r i is the primary airflow rate; and e 1 and e 2 are determined empirically.

3.3.3. Optimization Model Formulation

The main goal of the optimization strategy is to minimize the total energy consumption of the ACB system while maintaining thermal comfort in the cabin. Thus, the optimization formulation is defined as follows:
min V p r i , T p r i { f 1 ( x ) , f 2 ( x ) }
where f 1 ( x ) is the energy consumption computed by the predictive ANN model and is depicted as follows:
f 1 ( x ) = ANN ( T a m b , R H a m b , D H I , D N I , V p r i , T p r i , Q )
where f 2 ( x ) is the cabin’s PPD, computed from Equations (4) and (5).
The constraints in the model are due to the upper and lower limits imposed on the parameters of the ACB system. The value of the primary air temperature must vary between 12 °C and 18 °C. The primary air flowrate is between 14 × 10 3   m 3 / s and 60 × 10 3   m 3 / s .

4. Proposed Modified Multi-Objective Salp Swarm Algorithm

4.1. Salp Swarm Algorithm (SSA)

Compared to other intelligent optimization algorithms, the SSA offers several advantages, including a simple structure, a smaller number of control parameters, and ease of implementation. The salp chain, the positions of which represent all candidate solutions, is divided into two groups: leaders and followers. The leaders are located at the front of the chain, whereas the rest of the salps are considered followers. The position of the food source represents the optimal solution, which affects the update of the salps’ positions. The formula for updating the positions of the leaders is expressed as follows:
x i , d = F d + c 1 u b d l b d c 2 + l b d ,   c 3 0.5 F d c 1 ( ( u b d l b d ) c 2 + l b d ) ,   c 3 < 0.5
where x i , d and F d are the positions of the i th salp and the food source in the d th dimension, respectively; u b d indicates the upper bound of the d th dimension; l b d indicates the lower bound of the d th dimension; and c 2 and c 3 are random numbers. The parameter c 1 is utilized to balance the exploration and exploitation capabilities of the algorithm and is defined as follows:
c 1 = 2 e ( 4 t / T ) m
where t denotes the current iteration, T represents the maximum number of iterations, and the exponential term is m = 2 . The following equation shows the update of the positions of the followers:
x i , d = 0.5 ( x i , d + x i 1 , d )
where x i , d and x i 1 , d are the positions of the i th salp and the ( i 1 ) th salp in the d th dimension, respectively.
Mirjalili et al. proposed a multi-objective salp swarm algorithm (MSSA) based on the SSA for solving multi-objective optimization problems. The algorithm is equipped with a repository to store non-dominated solutions of the current population. Additionally, the number of neighboring solutions is determined for each individual in the repository.
During the updating process, the food source is randomly generated by the roulette wheel selection from the non-dominated solutions in the repository. The probability of a solution being selected as a food source increases with the decreasing number of neighboring solutions. Subsequently, the current salp chain is utilized to update the repository, which is governed by the following three principles.
(1)
If the current solution dominates a solution in the repository, the two solutions are swapped. If the solution dominates a set of solutions in the repository, the solution is added to the repository, and the set of dominated solutions is removed from the repository.
(2)
If there exists a solution in the repository that dominates the current solution, the current solution should be discarded directly.
(3)
If the current solution is non-dominated in comparison with all solutions in the repository, the current solution is added to the repository.
When principle (3) is met and if the repository is full, some solutions in the repository should be considered for deletion. The probability of a solution being deleted increases with the increasing number of neighboring solutions.
The original MSSA lacks a refinement search mechanism to drive the algorithm to further explore superior regions, resulting in relatively low convergence accuracy. Furthermore, it can be observed from Equation (3) that the current position of the i th follower is the midpoint between the positions of the i th and ( i 1 ) th individuals in the previous generation of the population. This updating method does not consider the influence of previous individuals on the next ones, resulting in the population tending to cluster in the late iterations, leading to convergence stagnation. Additionally, the algorithm has slow convergence speed. To address these issues, several modifications of MSSA are proposed. They are explained in detail below.

4.2. A Modified Tent Chaotic Map and Chaos-Based Strategy

4.2.1. Proposed m-Tent

Chaotic dynamic systems are characterized by the features of sensitivity to initial conditions, randomness, ergodicity, and unpredictability, which make the corresponding chaotic maps a reliable source of stochastic numerical sequences. The chaotic sequences generated by chaotic maps have been shown to be effective in maintaining the diversity of populations in optimization algorithms and helping these algorithms to escape from local optima. The tent chaotic map T ( x k ) is often used to produce chaotic sequences:
T ( x k ) = 2 x k 0 x k 0.5 2 1 x k 0.5 < x k 1
Liang et al.’s study presented the computer-generated Tent sequence at a faster iteration speed. However, the values generated by the tent map are prone to converge to a fixed point after a certain number of iterations. For example, the values x k = 0.0625 ,   0.25 ,   0.75 will all be iterated to the fixed point 0. In addition, the tent sequence may also become trapped in small cycles of period 5 or less. For instance, when x k = 0.8 , there are small periods of 0.8 and 0.4 in the sequence. To effectively address the issues mentioned above and improve the search of utilizing the tent map in the MSSA, this study proposes an m-tent with the following enhancement incorporated into the original tent map when x k { 0 ,   0.125 ,   0.375 ,   0.875 ,     0.625 } or x k = x k m   ( m = 1 ,   2 ,   3 ,   4 ,   5 ) :
T ( x k ) = T ( x k + ( 0.5 x k ) ξ ) 0 x k 0.5 T ( x k + ( 1 x k ) ξ ) 0.5 < x k 1
where ξ follows a uniform distribution on the interval ( 0 ,   1 ) .
Figure 9 shows the probability distribution of m-tent, logistic tent, and improved tent [42]. The improved tent chaotic sequence is relatively evenly distributed over the entire interval, but there are relatively high frequencies around points such as 0.25 and 0.75 due to the limited word length of the computer and the left shift of binary sequences during iteration. Compared to the previous two sequences, the m-tent can effectively prevent the trend of chaotic variables falling into periodic points and fixed points during iteration. The sequence is distributed more uniformly over the entire interval, with a probability density function close to 1, which can significantly enhance the diversity of the population and the efficiency of chaotic searches in optimization algorithms.
Chaotic systems exhibit high sensitivity to initial conditions, also known as the ‘butterfly effect’, which can help to enhance population diversity and enable multi-objective optimization algorithms to avoid local optima. In this paper, minor adjustments are made to the initial values of the previously mentioned chaotic maps, and the resulting alterations in the binary sequence generated through statistical analysis are evaluated using the bit change rate index. A higher rate indicates higher sensitivity to initial conditions. The bit change rate is defined as follows:
T = n / n
where n is the length of the sequence, and n represents the number of bits for which the value of the corresponding position changes after the adjustment of the initial condition.
As shown in Table 7, after slight modifications, the bit change rate of the three generated sequences approached 50%. Notably, the m-tent map exhibited a bit change rate greater than 50%, indicating strong sensitivity to the initial conditions among all three maps.

4.2.2. Adaptive Refinement Search Based on m-Tent

To improve the convergence accuracy and speed of the MSSA, we incorporate the m-tent into the algorithm, which serves to refine the search space of the decision variables. In this process, first, the top 10% individuals in the repository are selected for adaptive refinement searching. Then, for the decision variable x i , d in X i , the search range of the variable is narrowed down to ( l b d ,   u b d ) as follows:
l b d = x d i δ ( u b d l b d ) u b d = x d i + δ ( u b d l b d )
and if l b d < l b d , l b d = l b d ; if u b d > u b d , u b d > u b d . Here, δ is the contraction factor. The chaotic variable t i , d is generated using the m-tent and is then mapped onto ( l b d ,   u b d ) to obtain x i , d . Through a linear combination with x i , d , a new decision variable x is obtained:
x i , d = ( 1 β ) x i , d + β x i , d
where β is the adaptive adjustment coefficient:
β = 1 ( ( k 1 ) / k ) m
where k is the current iteration, and m is an integer determined based on the objective function.

4.3. Adaptive Weight Update Strategy

In the MSSA, the updating method for the follower positions is relatively unsophisticated, which may cause the population to cluster in the late iterations. To overcome this problem and enhance the search accuracy and efficiency of the algorithm, this study introduces an inertia weight factor based on a nonlinear decreasing function to consider the influence of the previous individual on the subsequent one. The modified position updating method is as follows:
x i , d ( t + 1 ) = 0.5 ( x i , d ( t ) + w ( t ) x i 1 , d ( t ) )
w ( t ) = w i ( w i w e ) ( 1 e α ( t / T ) 3 ) ( 1 S ( t ) )
where w i and w e respectively denote the initial and final values of inertia weight, which is a non-linear decreasing function of t . In this study, the nonlinear control parameter α = 45 and w i = 0.9 , w e = 0.4 . S ( t ) represents the population success rate at iteration t, which is obtained as the arithmetic mean of the success values of all individuals in the population.
S i ( t ) = 1 X i ( t ) X i ( t 1 ) 1 X i ( t ) X i ( t 1 ) 0 e l s e
S ( t ) = 1 N i = 1 N S i ( t )
where S i t is the success value of the i th individual at iteration t . The population success rate S ( t ) measures the proportion of individuals performing better up to the current iteration. In the initial stages of iteration, there are more individuals scattered throughout the search space, and a relatively large number of individuals have reduced fitness values, resulting in a higher success rate S ( t ) . Combined with S ( t ) , w ( t ) has strong global search capabilities. In the later stages of iteration, the population gradually converges, S ( t ) gradually decreases, and combined with S ( t ) , w ( t ) has strong local search capabilities. Overall, by introducing S , the inertia weight factor can be adaptively adjusted based on the population quality, which helps the algorithm to continuously balance global exploration and local exploitation. The Pseudocode of IMSSA is given in Appendix A.

4.4. Knee Point Solution Selecting

In multi-objective optimization, the knee point on the Pareto front refers to a point where there is a sharp trade-off between two or more objectives, indicating that achieving further gains in one objective comes at the cost of increasingly significant losses in other objectives [43]. In this study, after using the optimizer to obtain the Pareto front of the optimization problem, the satisfaction level of each optimal solution is calculated to assist the decision-making algorithm in securing the knee point. The satisfaction level γ i m of each optimal solution in the m th objective function is:
γ i m = 1 f i m f m , min ( f m , max f i m ) / ( f m , max f m , min ) f m , min < f i m < 0 f i m f m , min f m , max
where, f i m is the m th objective function value of the i th optimal solution; and m 1 , 2 , , N o b j . f m , min , f m , max are the minimum and maximum values, respectively, of the m th dimension objective function. The satisfaction level of each optimal solution is:
γ i = m = 1 N o b j γ i m i = 1 N p m = 1 N o b j γ i m
where N p represents the number of solutions of the Pareto front. The Pareto optimal solution with the highest satisfaction level is chosen as the knee point solution.

5. Co-Simulation Testbed

The purpose of this study is to minimize the total energy consumption of ACB systems while maintaining thermal comfort for a typical cabin on a moving ship through an improved optimal control strategy. To validate the proposed optimization strategy for ACB systems, a TRNSYS–MATLAB co-simulation testbed is constructed, as shown in Figure 10. The testbed stimulates the optimization process of EMS on a ship. In TRNSYS, the cabin with its dimension, configuration, and internal load profiles served by the ACB system is simulated. Moreover, using the weather files of typical cities, including Hong Kong, Shantou, Xiamen, Fuzhou, Wenzhou, Ningbo, and Shanghai, and considering the ship’s position and heading angle, the dynamic meteorological conditions are developed. The energy predictive ANN model, thermal comfort model, and real-time optimizers are programmed in MATLAB, and their outputs are the hourly primary air temperature and air flow rate. The simulation time step was set to 0.1-h intervals for the accuracy of co-simulation. To validate the effectiveness of the optimal control strategy using IMSSA, three other strategies are also tested and compared. In strategy 1, no optimization is applied. Based on operational experience, the primary air temperature is set as 13 °C and the primary air flowrate as 0.0327 m3/s. In strategy 2, the linear primary air temperature reset schedule is adopted [44]. When the outside air T a m b is less than 20 °C, the primary air temperature is fixed at 18 °C. When the outside air is greater than 30 °C, the primary air temperature is fixed at 13 °C. When the outside air is between 20 °C and 30 °C, the primary air temperature decreases from 18 °C to 13 °C linearly. The primary air flowrate is also fixed at 0.0327 m3/s. In strategy 3, the optimal control strategy through using MSSA is used. In strategy 4, the optimal control strategy through IMSSA is used.
The methodology is depicted via the flowchart in Figure 11. In MATLAB, the energy consumption prediction model and cabin comfort model are developed. The energy consumption prediction model is a three-layer artificial neural network (ANN) with seven input nodes representing the following parameters: outdoor air dry bulb temperature T a m b , outdoor air relative humidity R H a m b , diffuse solar radiation rate per area ( D H I ), direct solar radiation rate per area ( D N I ), indoor cooling load demand Q , supply air temperature T p r i and primary air flow rate V p r i . The first five parameters are obtained from the TRNSYS model, while the remaining two parameters serve as setpoints for the ACB system to be optimized. After offline training of the ANN model to achieve the required accuracy, the trained model is used to accept weather parameters at each step to formulate the energy consumption objective function. The cabin comfort model utilizes Professor Fanger’s predicted percentage of dissatisfied (PPD) index, which considers seven parameters: indoor air temperature T a , mean radiant temperature T r , indoor relative humidity R H , relative air velocity v a r , metabolic rate M , effective mechanical power W, and clothing insulation for summer attire I c l . The relative air velocity can be estimated as the maximum air velocity using a nonlinear model that relies on the primary airflow rate, as demonstrated in Equation (6). Therefore, the objective functions for energy consumption and cabin comfort are represented as follows:
f 1 ( x ) = ANN ( T a m b , R H a m b , D H I , D N I , V p r i , T p r i , Q ) f 2 ( x ) = PPD ( T a , T r , R H , v a r , M , W , I c l )
After constructing multi-objective functions in MATLAB, the improved multi-objective salp swarm algorithm (IMMSA) is utilized to solve the problem and obtain the optimal Pareto front. The knee point solution selection strategy is then applied to identify the optimal values [ T p r i * , V p r i * ] . The TRNSYS model runs using the optimal setpoints until the next timestep. Then, MATLAB receives updated parameters and formulates the multi-objective model again, calculating the optimal values to be passed to TRNSYS. This process repeats until the specified number of timesteps is reached. In this study, a total of 96 timesteps are considered, representing a four-day journey from Hong Kong to Shanghai.

6. Results Analysis and Discussions

6.1. Comparison of MSSA and IMSSA

To compare the convergence accuracy of the MSSA and IMSSA, the Pareto fronts with knee points obtained by both algorithms at 6:00 a.m. on 14 July as an example are shown in Figure 12. On the left side of the knee point, a small increase in energy consumption leads to a significant improvement in thermal comfort; On the right side of the knee point, increasing energy consumption has little effect on PPD, suggesting that further energy consumption does not contribute significantly to improved thermal comfort. Moreover, it can be seen that the solution set produced by the IMSSA is closer to the coordinate axis, which dominates the solutions generated by the MSSA. That is, the IMSSA is more effective in directing the solution set toward the global optimum with higher precision. Furthermore, the IMSSA can also obtain a more widely and uniformly spread out set of non-dominated solutions than the original MSSA, thus producing a more efficient trade-off knee point.
To compare the convergence speed of the algorithms, two-generation distance (TGD) is utilized in this study. TGD describes the distance between the adjacent two generations of non-dominated solutions. A large TGD means a strong global search ability, while a small TGD means a strong local search ability. Figure 13 shows that the TGD of the MSSA and m-MSSA gradually decreases until stabilizing around 0, indicating that they both possess a strong global search ability in the early stage and a strong local search ability in the later stage. Additionally, it can also be seen that the TGD of the m-MSSA is larger than that of the MSSA in the first 100 iterations and then decreases dramatically, indicating that the m-MSSA shows a stronger global search ability in the initial stage, while in the later stage, it can quickly switch to a stronger local search ability. Both algorithms are considered to converge when the TGD of five consecutive iterations is less than 1. As shown in Figure 13, the m-MSSA exhibits a faster convergence speed, which basically converges after 141 iterations, compared to MSSA’s 191 iterations.

6.2. Comparison of Different Control Strategies

Figure 14 illustrates the hourly primary air temperature, air flowrate, energy consumption, and PPD of the ACB system on the first day of the ship under different strategies. In strategy 1, the primary air temperature is fixed at 13 °C and the primary airflow rate at 0.0327 m3/s. Strategy 2 adjusts the primary air temperature in real time based on the outdoor temperature. Specifically, from 1 p.m. to 6 p.m., when the outdoor temperature is relatively high, the primary air temperature is low. Conversely, during periods of low outdoor temperature, between 7 p.m. and 1 a.m., the primary air temperature is relatively high. Afterward, as the outdoor temperature begins to rise again, the primary air temperature starts to decrease. Compared to the fixed value strategy, strategy 2 increases the primary air temperature during the low temperature period, which decreases the cooling demand for the AHU chiller and results in slight energy savings. Strategies 3 and 4 optimize the primary air temperature and primary airflow rate simultaneously with the objectives of minimizing the energy consumption while maintaining cabin comfort. Compared to the MSSA algorithm used in control strategy 3, the IMSSA algorithm used in control strategy 4 can obtain a more accurate Pareto front, with lower energy consumption and lower PPD values. During the period from 1 p.m. to 10 p.m., strategy 4 obtains an optimal primary air temperature that is less than 13 °C, close to 12 °C, with a lower primary airflow rate compared to other control strategies. Moreover, to balance the indoor cooling load, which is relatively high during this time, the chilled water flow rate in the ACB terminal unit is maintained at a relatively high level because the cooling coil typically has higher energy efficiency compared to primary air [20,26]. However, the primary air temperature cannot necessarily be lowered to the minimum temperature because doing so would result in a very low primary airflow rate, leading to an increase in PPD and affecting indoor comfort. Therefore, the IMSSA can balance the energy consumption and thermal comfort while meeting the demand of the cooling load.
Figure 15 shows the hourly energy consumption of different parts of the ACB system under various strategies. For fan energy consumption, both strategy 1 and strategy 2 maintain a constant energy consumption of 0.062 kWh because, with these two strategies, the primary airflow rate is kept at a fixed value. Under strategy 3, the fan energy consumption experiences a gradual decrease, reaching a minimum point of 0.03 kWh, followed by a slow increase. This trend aligns with the variation in the primary airflow rate and also corresponds to changes in the indoor cooling load demand. When the indoor cooling load demand is high, the fan energy consumption increases, and when the indoor cooling load demand is low, the fan energy consumption decreases. Compared to other strategies, strategy 4 significantly reduces the fan energy consumption by maintaining a lower primary airflow rate. For chiller 1 the serving AHU and chiller 2 serving the ACB terminal, it can be observed that both chillers’ hourly energy consumption undergoes a decreasing-to-increasing process, as the cooling demand from the cabin decreases and then increases. Compared to strategy 1, strategies 2–4 all increase the energy consumption of chiller 2 while reducing the energy consumption of chiller 1. This finding also implies that the cooling capacity provided to the room by chiller 1 decreases, while the cooling capacity provided to the room by chiller 2 increases.
The energy consumption of different components of the ACB system is shown in Figure 16. Chillers have the highest energy consumption, with values of 43.74 kWh, 43.34 kWh, 42.31 kWh, and 39.59 kWh for strategies 1–4, respectively. The next highest is the fan, with 6 kWh for strategy 1 and strategy 2, 5.12 kWh for strategy 3, and 3.75 kWh for strategy 4. The pump has the lowest energy consumption, which remains around 1 kWh for all four strategies. Compared to strategy 1, strategy 2 reduces the energy consumption of chiller 1 by 1.06 kWh and increases the energy consumption of chiller 2 by 0.67 kWh because strategy 2 increases the supply air temperature when the outside temperature is relatively low, reducing the cooling demand for chiller 1 and lowering its energy consumption. However, to meet the indoor cooling load requirements, the cooling load on the coil increases, resulting in an increase in the energy consumption of chiller 2. Strategies 3 and 4 optimize the primary air flowrate and temperature. By finding the optimal values, they reduce the fan energy consumption by 0.88 kWh and 2.25 kWh, respectively, and significantly reduce the energy consumption of chiller 1 by 3.6 kWh and 7.43 kWh while slightly increasing the energy consumption of chiller 2 by 2.11 kWh and 3.16 kWh because the cooling coil served by chiller 2 is more energy efficient compared to the primary air cooled by chiller 1. As shown in Figure 17, compared to strategy 1, strategies 2–4 all increase the cooling capacity of the ACB terminal’s coil served by chiller 2. This increase results in an increase of 1.09%, 19.56%, and 23.92%, respectively, compared to 19.89 kW with strategy 1. By allocating more of the room’s cooling load to the cooling coil and reducing the room’s cooling load on the primary air, the overall energy consumption of the entire system can be reduced.
Figure 18 shows the energy consumption for different control strategies during the voyage from Hong Kong to Shanghai. The results indicate that strategy 1, using fixed primary air temperatures and airflow rates, had the highest energy consumption of 50.51 kWh. In contrast, strategy 4, which employs the IMSSA, had the lowest energy consumption of 44.49 kWh, resulting in energy savings of 12.0% compared to strategy 1, 11.1% compared to Strategys 2, and 7.9% compared to the original MSSA.
According to ASHRAE 55, the recommended thermal limit for absolute PMV is less than 0.5, and Table 8 shows the proportions of hours with different PMV intervals during the voyage. It can be seen that the absolute PMV values for all four control strategies are within 0.3, meeting the recommended requirement for cabin comfort. During the voyage, when the cooling demand is particularly low, the optimization algorithm assigns more cooling duty to the ACB terminal to minimize energy consumption, reducing the primary air flowrate, which resulted in a slight increase in PMV, as shown in the table. However, the optimization algorithm that balances thermal comfort and energy consumption does not significantly increase the PMV value. The slight increase is still within the range that satisfies the cabin comfort requirement, and the energy consumption of the air conditioning system is greatly reduced under the proposed IMSSA.

7. Conclusions

A real-time optimal control strategy is proposed for cabins’ active chilled beam systems on moving ships by adopting an improved MSSA algorithm. The improved algorithm is utilized to achieve the optimal energy consumption and thermal comfort by optimizing the primary air temperature and primary airflow rate. A TRNSYS–MATLAB co-simulation testbed is developed and used to test and validate the proposed strategy by comparing it with different control strategies. For the voyage from Hong Kong to Shanghai, a dynamic meteorological condition considering the ship’s position and heading angle is built in TRNSYS. The energy model is developed through an artificial neural network, which has a strong ability to fit non-linear relationships. The model’s accuracy is verified with a CV(RMSE) of 24.46% which is less than the accuracy requirement of 30% specified in ASHRAE Guideline 14. The thermal comfort of the cabin is measured using PPD, which is a commonly used method. The IMSSA is established by adopting adaptive refinement searching based on m-tent and an adaptive weight update strategy to address the optimization of energy and PPD. The experimental results demonstrated that the m-tent is relatively evenly distributed over the entire interval and has strong sensitivity to initial conditions and thus helps the IMSSA to have a stronger global search ability to avoid falling into local optima. By introducing adaptive inertia weight, the algorithm can continuously balance global exploration and local exploitation. Using these improvements, the IMSSA can achieve a more accurate and uniformly Pareto front with a faster convergence speed compared to the MSSA. For the case study, the proposed strategy through the IMSSA shows better performance with energy savings of 12.0% compared to strategy 1, 11.1% compared to strategy 2, and 7.9% compared to the strategy using the original MSSA, while maintaining cabin comfort. Furthermore, with the growing presence of cruise ships touring along the Chinese coastline typically relying on diesel as their main power source, by implementing the proposed strategy, there is the potential to save substantial operational costs and reduce the societal expenses associated with enhancing the coastal air quality. Moreover, our strategy also maintains cabin comfort. Thus, while lowering operational costs, the strategy does not incur additional costs associated with maintaining cabin comfort.
Due to the limited literature on the control of ship active chilled beam systems under dynamic environmental conditions, this study has selected the primary air flow rate and temperature as the variables to be optimized, and they have been commonly used in the current research. Expanding the optimized variables may yield more energy savings. Therefore, future research will consider optimizing other variables under dynamic environmental conditions, such as the frequency of chiller water pumps and chiller water temperatures.

Author Contributions

C.L.: software, writing, methodology; Y.S.: supervision, conceptualization, analysis. D.Z.: resources. All authors have read and agreed to the published version of the manuscript.

Funding

This research received no external funding.

Institutional Review Board Statement

Not applicable.

Informed Consent Statement

Not applicable.

Data Availability Statement

The datasets generated and analyzed during this study are available from the corresponding author upon reasonable request.

Acknowledgments

The authors would like to thank the anonymous reviewers for their useful comments and suggestions.

Conflicts of Interest

The authors declare no conflict of interest.

Appendix A. Pseudocode of IMSSA

Pseudo-code of IMSSA
Inputs: maximum number of iterations T , boundary limits L b and U b , the dimension d , repository size N r and the population X i , i = 1 , 2 , , N
Outputs: the pareto optimal solution
Initialize the population X i ( i = 1 , 2 , , N ) within the solution space via using the m-tent
while ( t < T )
    calculate the fitness of each salp
    determine the non-dominated salps
    update the repository considering the obtained non-dominated salps
    if the repository becomes full
        call the repository maintenance procedure to remove one repository resident
        add the non-dominated salp to the repository
    end if
    while ( k < K ) do
    for p = 1: r o u n d ( N p / 10 )
    obtain a new individual X p ( k + 1 ) by means of adaptive refinement search via Equations (15)–(17)
if X p ( k + 1 ) X p ( k )
replace individual X p ( k ) with X p ( k + 1 )
            end if
        end for
   end while
   choose a source of food from repository: F = SelectFood(repository)
   update c1 by Equation (10)
   for each salp ( X i )
      if  i N / 2
        update the position of the leading salps by Equation (9)
      else
        update the position of the following salps by Equations (18)–(21)
      end if
end for
     amend the salps based on the upper and lower bounds of variables
    end while

References

  1. Simonsen, M.; Walnum, H.J.; Gössling, S. Model for estimation of fuel consumption of cruise ships. Energies 2018, 11, 1059. [Google Scholar] [CrossRef] [Green Version]
  2. Sun, X.; Yip, T.L.; Lau, Y.-Y. Location characteristics of cruise terminals in China: A lesson from Hong Kong and Shanghai. Sustainability 2019, 11, 5056. [Google Scholar] [CrossRef] [Green Version]
  3. Yao, Y.; Zheng, R.; Parmak, M. Factors Influencing the Willingness to Pay in Yachting Tourism in the Context of COVID-19 Regular Prevention and Control: The Case of Dalian, China. Sustainability 2022, 14, 13132. [Google Scholar] [CrossRef]
  4. Li, H.; Jia, P.; Wang, X.; Yang, Z.; Wang, J.; Kuang, H. Ship carbon dioxide emission estimation in coastal domestic emission control areas using high spatial-temporal resolution data: A China case. Ocean Coast. Manag. 2023, 232, 106419. [Google Scholar] [CrossRef]
  5. Wan, Z.; Zhang, Q.; Xu, Z.; Chen, J.; Wang, Q. Impact of emission control areas on atmospheric pollutant emissions from major ocean-going ships entering the Shanghai Port, China. Mar. Pollut. Bull. 2019, 142, 525–532. [Google Scholar] [CrossRef]
  6. Barone, G.; Buonomano, A.; Forzano, C.; Palombo, A.; Vicidomini, M. Sustainable energy design of cruise ships through dynamic simulations: Multi-objective optimization for waste heat recovery. Energy Convers. Manag. 2020, 221, 113166. [Google Scholar] [CrossRef]
  7. Hüffmeier, J.; Johanson, M. State-of-the-art methods to improve energy efficiency of ships. J. Mar. Sci. Eng. 2021, 9, 447. [Google Scholar] [CrossRef]
  8. Nurmi, M. Improving the Energy Efficiency of a Cruise Ship Stateroom. Master’s Thesis, Aalto University, Espoo, Finland, 2017. [Google Scholar]
  9. Filipsson, P.; Trüschel, A.; Gräslund, J.; Dalenbäck, J.-O. Modelling of rooms with active chilled beams. J. Build. Perform. Simul. 2020, 13, 409–418. [Google Scholar] [CrossRef]
  10. Zhao, Z.C.; Cheng, H.; Feng, W.X.; Qin, B.J. Simulation analysis on dynamic load of air-conditioning system of ocean-going ship. Appl. Mech. Mater. 2014, 672, 1693–1699. [Google Scholar] [CrossRef]
  11. Gao, S. Dynamic Cooling Loads of Ship Air-Condition Analysis and Calculation. Master’s Thesis, Dalian University of Technology, Dalian, China, 2006. [Google Scholar]
  12. Huang, Z. Research on Comprehensive Energy Efficiency Evaluation Technology for Ship Air Conditioning System. Master’s Thesis, Huazhong University of Science and Technology, Wuhan, China, 2019. [Google Scholar]
  13. Miao, W.; Yang, Z.; Junlong, X. Simulation analysis of dynamic cooling loads of ship air conditioning in summer. Chin. J. Ship Res. 2018, 13, 199–206. [Google Scholar]
  14. Kim, C.; Lee, J.; Lee, D.; Choi, S. Optimized operation method for an active chilled beam with VAV system. Sci. Technol. Built Environ. 2016, 22, 372–378. [Google Scholar] [CrossRef]
  15. Maccarini, A.; Hultmark, G.; Vorre, A.; Afshari, A.; Bergsøe, N.C. Modeling of active beam units with Modelica. Build. Simul. 2015, 8, 543–550. [Google Scholar] [CrossRef]
  16. Lee, J.M.; Hong, S.H.; Seo, B.M.; Lee, K.H. Application of artificial neural networks for optimized AHU discharge air temperature set-point and minimized cooling energy in VAV system. Appl. Therm. Eng. 2019, 153, 726–738. [Google Scholar] [CrossRef]
  17. Ye, G.; Yang, C.; Chen, Y.; Li, Y. A new approach for measuring predicted mean vote (PMV) and standard effective temperature (SET∗). Build. Environ. 2003, 38, 33–44. [Google Scholar] [CrossRef]
  18. Zhang, S.; Lin, Z. Standard effective temperature based adaptive-rational thermal comfort model. Appl. Energy 2020, 264, 114723. [Google Scholar] [CrossRef]
  19. Jorge, F.; Carlos, P.; Ricardo, M.; Sandra, S.; Luís, B.a. Contribution of Portuguese Vernacular Building Strategies to Indoor Thermal Comfort and Occupants’ Perception. Buildings 2015, 5, 1242–1264. [Google Scholar]
  20. Azad, A.S.; Rakshit, D.; Wan, M.P.; Babu, S.; Sarvaiya, J.N.; Kumar, D.K.; Zhang, Z.; Lamano, A.S.; Krishnasayee, K.; Gao, C.P. Evaluation of thermal comfort criteria of an active chilled beam system in tropical climate: A comparative study. Build. Environ. 2018, 145, 196–212. [Google Scholar] [CrossRef]
  21. Yang, S.; Wan, M.P.; Ng, B.F.; Dubey, S.; Henze, G.P.; Chen, W.; Baskaran, K. Experimental study of model predictive control for an air-conditioning system with dedicated outdoor air system. Appl. Energy 2020, 257, 113920. [Google Scholar] [CrossRef]
  22. Mossolly, M.; Ghali, K.; Ghaddar, N. Optimal control strategy for a multi-zone air conditioning system using a genetic algorithm. Energy 2009, 34, 58–66. [Google Scholar] [CrossRef]
  23. Wu, B.; Cai, W.; Chen, H. A model-based multi-objective optimization of energy consumption and thermal comfort for active chilled beam systems. Appl. Energy 2021, 287, 116531. [Google Scholar] [CrossRef]
  24. Zhang, S.; Cheng, Y.; Fang, Z.; Huan, C.; Lin, Z. Optimization of room air temperature in stratum-ventilated rooms for both thermal comfort and energy saving. Appl. Energy 2017, 204, 420–431. [Google Scholar] [CrossRef]
  25. Deb, K.; Pratap, A.; Agarwal, S.; Meyarivan, T. A fast and elitist multiobjective genetic algorithm: NSGA-II. IEEE Trans. Evol. Comput. 2002, 6, 182–197. [Google Scholar] [CrossRef] [Green Version]
  26. Mirjalili, S.; Saremi, S.; Mirjalili, S.M.; Coelho, L.d.S. Multi-objective grey wolf optimizer: A novel algorithm for multi-criterion optimization. Expert Syst. Appl. 2016, 47, 106–119. [Google Scholar] [CrossRef]
  27. Coello, C.C.; Lechuga, M.S. MOPSO: A proposal for multiple objective particle swarm optimization. In Proceedings of the 2002 Congress on Evolutionary Computation CEC’02 (Cat No 02TH8600), Honolulu, HI, USA, 12–17 May 2002. [Google Scholar]
  28. Mirjalili, S.; Gandomi, A.H.; Mirjalili, S.Z.; Saremi, S.; Faris, H.; Mirjalili, S.M. Salp Swarm Algorithm: A bio-inspired optimizer for engineering design problems. Adv. Eng. Softw. 2017, 114, 163–191. [Google Scholar] [CrossRef]
  29. Lan, L.; Pan, L.; Lian, Z.; Huang, H.; Lin, Y. Experimental study on thermal comfort of sleeping people at different air temperatures. Build. Environ. 2014, 73, 24–31. [Google Scholar] [CrossRef]
  30. Yamtraipat, N.; Khedari, J.; Hirunlabh, J. Thermal comfort standards for air conditioned buildings in hot and humid Thailand considering additional factors of acclimatization and education level. Sol. Energy 2005, 78, 504–517. [Google Scholar] [CrossRef]
  31. Cui, C.; Wu, T.; Hu, M.; Weir, J.D.; Li, X. Short-term building energy model recommendation system: A meta-learning approach. Appl. Energy 2016, 172, 251–263. [Google Scholar] [CrossRef] [Green Version]
  32. Chen, P.; Li, F.; Wu, C. Research on intrusion detection method based on Pearson correlation coefficient feature selection algorithm. J. Phys. Conf. Ser. 2021, 1757, 012054. [Google Scholar] [CrossRef]
  33. Waseem, M.; Lin, Z.; Yang, L. Data-Driven Load Forecasting of Air Conditioners for Demand Response Using Levenberg–Marquardt Algorithm-Based ANN. Big Data Cogn. Comput. 2019, 3, 36. [Google Scholar] [CrossRef] [Green Version]
  34. Studer, D.; Barkyoumb, J.H.; Lee, E.; Ball, B.L.; Frank, S.; Holland, E.; Green, J.; Robinson, W.; Brown, J.; Golda, J. Leveraging Shore-Side, Building Energy Simulation Tools for Use in the Shipboard Environment. Nav. Eng. J. 2018, 130, 129–140. [Google Scholar]
  35. Monetti, V.; Davin, E.; Fabrizio, E.; André, P.; Filippi, M. Calibration of building energy simulation models based on optimization: A case study. Energy Procedia 2015, 78, 2971–2976. [Google Scholar] [CrossRef] [Green Version]
  36. Tran, T.; Lee, T.; Kim, J.S. Increasing Neurons or Deepening Layers in Forecasting Maximum Temperature Time Series? Atmosphere 2020, 11, 1072. [Google Scholar] [CrossRef]
  37. Wang, G.G.; Shan, S. Review of metamodeling techniques in support of engineering design optimization. J. Mech. Des. 2007, 129, 370–380. [Google Scholar] [CrossRef]
  38. Fanger, P.O. Thermal comfort: Analysis and applications in environmental engineering. R. Soc. Health J. 1972, 92, 164. [Google Scholar]
  39. Liaison, S.; Cooper, K.W.; Turner, S.C.; Paliaga, G.; Lynch, B.M.; Arens, E.A.; Aynsley, R.M.; Brager, G.S.; Deringer, J.J.; Ferguson, J.M. ANSI/ASHRAE 55:2010; Thermal Environmental Conditions for Human Occupancy. American Society of Heating: Refrigerating, and Airconditioning Engineers, Inc.: Atlanta, GA, USA, 2010. [Google Scholar]
  40. Adrian, S.-C.; Sergiu, C.; Maria, M.; Anca, S.-C.; Monica, M. Models for the indices of thermal comfort. J. Med. Life 2008, 1, 148. [Google Scholar]
  41. Wu, B.; Cai, W.; Ji, K. Heat source effects on thermal comfort for active chilled beam systems. Build. Environ. 2018, 141, 91–102. [Google Scholar] [CrossRef]
  42. Wang, R.-Q.; Zhang, C.-H.; Li, K. Multi-objective genetic algorithm based on improved chaotic optimization. Control Decis. 2011, 26, 1391–1397. [Google Scholar]
  43. Zou, J.; Li, Q.; Yang, S.; Bai, H.; Zheng, J. A prediction strategy based on center points and knee points for evolutionary dynamic multi-objective optimization. Appl. Soft Comput. 2017, 61, 806–818. [Google Scholar] [CrossRef]
  44. Erbe, D.; Sciarra, L.L.; Glazer, J.; Seeger, K.; Boldt, J.; Hart, R.; Rosenberg, M.I. A Conversation on Standard 90.1-2019. ASHRAE J. 2020, 62, 10–22. [Google Scholar]
Figure 1. Operation schemes for optimization processes of EMS on ships.
Jmse 11 01396 g001
Figure 2. Schematic of the typical ACB terminal unit.
Jmse 11 01396 g002
Figure 3. Schematic diagram of the small cruise ship’s route.
Jmse 11 01396 g003
Figure 4. Schematics of the ACB system for the cabin service.
Jmse 11 01396 g004
Figure 5. Changing heading and azimuth angles of the sun relative to the ship.
Jmse 11 01396 g005
Figure 6. The internal load profile of the cabin: (a) lighting schedule; (b) equipment schedule; (c) occupancy schedule.
Jmse 11 01396 g006
Figure 7. The indoor cooling rate during the voyage.
Jmse 11 01396 g007
Figure 8. Performance curves of chiller, fan, and pump: (a) the variation of the chiller COP with part load ratio (PLR); (b) fan power fraction with air flow fraction; (c) pump power fraction with water flow fraction.
Jmse 11 01396 g008
Figure 9. Probability distribution plot for m-tent, logistic tent, and improved tent.
Jmse 11 01396 g009
Figure 10. TRNSYS–MATLAB co-simulation testbed.
Jmse 11 01396 g010
Figure 11. Flowchart of the methodology.
Jmse 11 01396 g011
Figure 12. Pareto front obtained by MSSA and m-MSSA (At 6:00 a.m. on 14 July).
Jmse 11 01396 g012
Figure 13. TGD obtained by MSSA and m-MSSA.
Jmse 11 01396 g013
Figure 14. Hourly values using different control strategies on the first day of the ship’s navigation: (a) primary air flowrate; (b) primary air temperature; (c) energy consumption; (d) PPD.
Jmse 11 01396 g014aJmse 11 01396 g014b
Figure 15. Hourly energy consumption using different control strategies on the first day of the ship’s navigation: (a) fan; (b) chiller 1 for the AHU; (c) chiller 2 for the ACB terminal; (d) pump.
Jmse 11 01396 g015aJmse 11 01396 g015b
Figure 16. Energy consumption of different components under different control strategies: (a) fan; (b) chiller 1 for the AHU; (c) chiller 2 for the ACB terminal; (d) pump.
Jmse 11 01396 g016aJmse 11 01396 g016b
Figure 17. Room’s cooling load proportions under different control strategies.
Jmse 11 01396 g017
Figure 18. Energy use of the ACB system in the studied case using different control strategies.
Jmse 11 01396 g018
Table 1. The summary of related works on controlling of cabin’s ACB system.
TypeAuthorFeatures
calculation of dynamic cooling loadsCheng Hua et al. [10]They analyzed the effects of weather conditions on cooling loads in different navigational areas.
Gao [11]The advantage of the study is that changes in the solar azimuth angle are considered when calculating the cooling load of a cabin, but the solar radiation intensity was assumed to be fixed.
Wang et al. [13]They presented how a ship’s heading angle influences the cabin’s cooling load.
optimal control strategies in HVAC systemsKim et al. [14]The study showed that, by optimizing the appropriate variables, controlling ACB systems can be more energy-efficient, but the study did not consider the constraints of the models.
Maccarini et al. [15]The study introduced an empirical model for the heat transfer coefficient, which can be beneficial in variable selection.
Lee et al. [16]The study developed an energy consumption prediction model based on artificial neural networks to achieve the lowest energy consumption. One disadvantage is that thermal comfort was not considered.
Yang et al. [21]They implemented a model predictive control system for ACB systems considering thermal comfort. However, cooling power and thermal comfort were combined into a single function, with each being assigned a weighting factor, which is difficult to set.
Mossolly et al. [22]A genetic algorithm is introduced to optimize both the thermal comfort and energy savings of HVAC systems simultaneously, but the solution can result in suboptimal outcomes.
Wu et al. [23]They developed the energy consumption model of ACB systems and a thermal comfort model for a room. The non-dominated sorting genetic algorithm II is utilized to balance the two objectives. However, the process of building the model requires extensive parameter settings.
optimization methodsMPSO, Coello et al. [27]Fast convergence and easy implementation, but it lacks diversity and is prone to converging to local optima.
MGWA, S Mirjalili et al. [26]Capable of generating a Pareto solution set with uniform distribution, but its performance depends on the settings of algorithm parameters.
NSGA-II, Deb et al. [25]Able to ensure that excellent solutions are not lost; however, it is prone to becoming stuck in local optima.
MSSA, Mirjalili in [28]Simpler computational form but easily trapped in local optima.
Table 3. Specifications of the cabin.
ConfigurationMaterials or Parameters
bulkhead materials8 mm steel plate + 50 mm Rockwool + 100 mm air layer + 30 mm interior panel
cabin area4 m × 8.5 m
window-to-wall ratio0.4
cabin height2.75 m
cabin occupancy2
cabin set temperature26 °C
relative humidity of the cabin50%
Table 4. Correlation coefficients (R) of energy consumption and the variables.
T a m b R H a m b D H I D N I Q
R0.760.420.440.470.85
Table 5. The CV-RMSE (%) under different numbers of hidden neurons and hidden layers.
Number of Hidden Neurons N h i d d e n   =   1 N h i d d e n   =   2 N h i d d e n   =   3 N h i d d e n   =   4 N h i d d e n   =   5
635.2232.7931.7930.5831.04
731.2529.1229.0129.1129.77
827.3326.0126.1127.0127.12
927.2124.4625.1226.7226.55
1028.1326.2125.8726.6127.12
1126.4526.6225.6627.1226.69
1227.7625.7724.7225.0128.12
1327.8226.1126.2327.7929.01
1429.0127.5827.1327.9129.87
Table 6. Comparison results of the prediction experiment.
ModelsANNSVRMLRRSM
Performance Polynomial KernelRadial Basis Function KernelSigmoid Kernel
RMSE0.110.220.130.170.240.25
CV-RMSE (%)24.4646.7127.4636.9052.2354.61
MAE0.100.190.120.170.220.23
MRE (%)26.9253.1130.9742.0559.8162.82
Table 7. The bit change rate for m-tent, logistic tent, and improved tent.
Initial value0.1000000.2000000.3000000.4000000.5000000.600000
The changed initial value0.1000010.2000010.3000010.4000010.5000010.600001
m-tent0.50770.50290.50310.50220.50280.5033
Logistic0.50340.50210.49830.49970.49730.5016
Improved tent0.49630.49790.49870.49630.50110.4986
Table 8. The PMV performance for different strategies.
% of Time Cabin Absolute PMV Is Within the Range
Range of DeviationLess than 0.20.2 < PMV ≤ 0.3PMV > 0.5
Strategy 1100%0%0%
Strategy 2100%0%0%
Strategy 386.4%13.6%0%
Strategy 492.7%7.3%0%
Table 2. Nomenclature.
SymbolDefinitionUnit
HVACheating, ventilation, and air conditioning
ACBactive chilled beam
ANNartificial neural network
PPDpredicted percentage dissatisfied %
MSSAmulti-objective salp swarm algorithm
IMSSAimproved multi-objective salp swarm algorithm
NSGA-IInon-dominated sorting genetic algorithm II
MPSOmulti-objective particle swarm optimization algorithm
MGWAmulti-objective grey wolf algorithm
PMVpredicted mean vote
AHUair handling unit
COPcoefficient of performance
PLRpart load ratio
VAVvariable air volume
T a m b outdoor air dry bulb temperature°C
R H a m b outdoor air relative humidity %
D H I diffuse solar radiation rate per area W / m 2
D N I direct solar radiation rate per area W / m 2
Q indoor cooling load demandW
T p r i supply air temperature°C
V p r i primary air flow rate m 3 / s
V w chilled water flow rate m 3 / s
RMSEroot mean squared error
CVcoefficient of variation
CV(RMSE)coefficient of variation of the root mean squared error
Y i prediction value
Y ^ i actual measurement value
N number of measurement values
Y ¯ average of measurement values
T a indoor air temperature°C
T r mean radiant temperature°C
R H indoor relative humidity %
v a r relative air velocity m / s
M metabolic ratemet
W effective mechanical powerW
I c l clothing insulationclo
v m a x maximum air velocity m / s
Disclaimer/Publisher’s Note: The statements, opinions and data contained in all publications are solely those of the individual author(s) and contributor(s) and not of MDPI and/or the editor(s). MDPI and/or the editor(s) disclaim responsibility for any injury to people or property resulting from any ideas, methods, instructions or products referred to in the content.

