Abstract
Macroalgae provide food for microbial, meio- and macro-faunal communities in coastal ecosystems, thus mediating nutrient dynamics and functions in these ecosystems. Because of this vital role, it is important to clarify physiological information about macroalgae as it reflects their growth potential in the field. In this study, we examined the biomass, pigment content, and photosynthetic O2 evolution rate versus irradiance curves of 18 macroalgal species from the intertidal zone of the Guangdong–Hong Kong–Macao Greater Bay Area, China, and investigated their photosynthetic patterns in relation to phyla characteristics, morphology, and growth locations. The results showed that green algae had the highest maximum photosynthetic O2 evolution rate (Pmax), light utilization efficiency (α), and dark respiration (Rd) among the three macroalgal phyla; the sheet-like macroalgal species had the highest Pmax, α, and Rd among the four morphological categories. The macroalgal species in the upper intertidal zone showed higher Pmax and α and lower saturation irradiance (EK) and compensation irradiance (EC) than those species in the lower intertidal location. The PCA results showed that the biomass of sheet-like macroalgal species was positively correlated with factor PC1 (50.34%), and that of finely branched species was negatively correlated with factor PC2 (25.17%). In addition, our results indicate that the light absorption and utilization capabilities of macroalgae could determine whether they could dominate the intertidal zone and that their photosynthetic characteristics could be used as a potential indicator of their biomass distribution in the Greater Bay Area.
1. Introduction
Marine macroalgae, including green algae, red algae, and brown algae, generally inhabit coastal regions from the littoral zone to the deep with sufficient light for photosynthesis [1,2]. They play an important role in marine ecosystems, supplying high trophic levels through the herbivore and detritus food chain, removing excess nutrients from the environment [3], contributing a large amount of organic carbon [4], and serving as refugia [5]. Many macroalgal species are also indicators of ecosystem health [6]. In nature, a complex of environmental variables affects the physiology and growth of macroalgae, shaping their distribution along coastal regions [7,8,9]. Due to the strong environmental gradients in a small spatial scale, intertidal zones, the transitional area between land and sea, are usually inhabited by very diverse macroalgal species [1,2], which differ greatly in their photosynthetic behaviors with respect to certain characteristics such as growth region, phylum, and morphology [10,11]. In addition, macroalgal biomass, the end product of photosynthetic accumulation, also varies widely within different growth regions, phyla, and morphologies [12,13]. Since the variability in photosynthesis and biomass of macroalgae is ultimately due to their species composition in growth regions, it is important to clarify their photosynthetic properties and biomass in nature.
Currently, classifications based on specific traits are commonly used to study the physiological characteristics and community structure of macroalgae, as well as species diversity [14,15,16,17]. For example, in a study by Hurd and co-authors [18], it was reported that sheet-like macroalgal species have a higher maximum net photosynthetic rate (Pmax) and photosynthetic efficiency (α) than other morphological species, which enables them to rapidly accumulate structural material. Another study by Gómez and Huovinen [19] showed that depth of growth, rather than morphology, influences macroalgal community recovery after high light stress in southern Chile. The physiological patterns related to morphology, growth depth, phylum, and biogeographic affiliation of macroalgae from Antarctica highlight the importance of functional traits for their vertical distribution [11]. In contrast, studies on the photosynthetic capabilities of macroalgae with different morphological functions are not sufficient to provide a deeper understanding of community changes at the ecological level. In nature, the biomass of macroalgae is one of the most important parameters for the biodiversity of their communities [20] and is often reflected in the photosynthetic patterns of different morphological functions and zonation [21]. As reported by Rodgers and Shears [22], the Pmax value of Laminaria japonica is positively related to its biomass, although this is only the case in summer at 6 m depth; whether this relationship also exists in the regional macroalgal communities requires further investigation.
The Guangdong–Hong Kong–Macao Greater Bay Area (hereinafter referred to as the “Greater Bay Area”), which consists of nine cities in Guangdong Province plus Hong Kong and Macau, is the fourth-largest Greater Bay Area in the world and one of the regions with the strongest economic vitality and fastest development in China [23]. The Greater Bay Area encompasses the waters of Daya Bay, Wanshan Archipelago, and Kawasan Archipelago (Figure 1) and has a 3201 km coastline [24], providing an abundance of biological resources [25]. There are more than 100 species of macroalgae growing in the intertidal zone of the Greater Bay Area, including green algae, red algae, and brown algae [3]. The abundant macroalgal species, as well as plankton species, give this area high biodiversity and diverse community structure [26,27,28]. However, the ecophysiological basis underlying this community composition is poorly understood, as few studies have focused on the aspects of photosynthetic performance under different environmental variables such as temperature rise [29] and different light qualities [30]. Therefore, the characteristics of macroalgal photophysiology need to be further investigated, as they determine the structure of their communities [31].
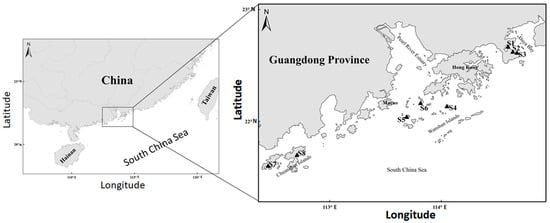
Figure 1.
Map of the Guangdong–Hong Kong–Macao Greater Bay Area, with the triangles showing the 8 investigated locations in the Daya Bay (S1–S3), Wanshan Islands (S4–S6), and Chuanshan Islands (S7–S8), respectively.
In this study, we examined the field biomass, pigment content, and photosynthesis versus irradiance (P vs. E) curves of 18 macroalgal species that are common and have more abundant biomass in the Greater Bay Area and analyzed their photosynthetic performance with the aims of (1) characterizing their photosynthetic patterns in relation to different phyla, morphology, and growth site traits and (2) relating their photosynthetic traits to field biomass in the intertidal zone of the Greater Bay Area. This study also presents the physiological status of macroalgae in nature, which could be a potential basis for estimating their physiological changes in the future under the scenario of rapidly changing environmental conditions in the Greater Bay Area.
2. Materials and Methods
2.1. Sample Collection and Pre-Culture Protocol
During 20–21 March 2020 and 20–21 December 2021, we examined the biomass, pigments, and photosynthetic characteristics of 18 intertidal macroalgae from 8 representative locations (see the detailed coordinates in Supplemental Table S1) in Daya Bay (3 locations), Wanshan Islands (3), and Chuanshan Islands (2) of the Guangdong–Hong Kong–Macao Greater Bay Area, China (Figure 1). These investigated areas have irregular semidiurnal tides with the widths of intertidal zones ranging from 2 to 50 m [32] and are rich in green, red, and brown algae dominated by Ulva spp., Gelidium sp., and Sargassum spp., respectively [33]. The Ulva species occur mainly in the upper intertidal areas and the Sargassum species in the lower intertidal areas. They are both most abundant during certain time periods, while Pterocladiella capillacea, a major species of red algae, occurs throughout the year, and Sargassum spp. can grow up to 5 m long. During the low tide, we carefully collected a total of 18 macroalgal species (Table 1) at 2 intertidal locations (upper and lower) in each sampling area, containing 3 phyla (green algae, red algae, and brown algae) with 4 morphologies (canopy-forming, coarsely branched, finely branched, and sheet-like). Before collecting samples, we estimated the biomass of each algal species in the field using the quadrat method. Using a 25 cm × 25 cm sample square, three sample squares were randomly selected in each sampling site. The algae in the sample squares were collected, and immediately after removal from the water and light blotting, the biomass of the collected algae was measured using an electronic balance scale (accuracy 0.01 g) to make a quantitative determination [34,35]. After sample collection, we identified each algal species according to the Chinese Seaweed Journal [36], placed the algal thalli in a 4 °C insulation box, and returned them to the laboratory within 5 h to determine pigment and photosynthesis as follows. We believe that these 18 algal species can approximate the macroalgal community in the Greater Bay Area, as they are all the most important species, although the small branching, epiphytic, encrusting, or scattered species were not included [33]. In this study, instead of analyzing the effects of seasonal and regional conditions separately, we unified them in the photosynthetic patterns and pigment content exhibited by the algae during their adaptation to their environment.

Table 1.
Phyla, morphologies, and growing locations of the 18 common macroalgal species from the Guangdong–Hong Kong–Macao Greater Bay Area, as well as their biomass (g FW m−2) in the field. Capital letters in parentheses indicate the species and morphologies abbreviation used in graphs as follows.
After returning to the laboratory, the collected algal thalli were maintained in filtered seawater (salinity, 30) at field temperature (20 ± 1.0 °C, the average temperature of two sampling periods) in a light incubator (GXZ-300B, Ningbo East Instrument Co. Ltd., Ningbo, China). Immediately, the photosynthetic O2 evolution rate versus irradiance (P vs. E) curve and pigment content of each algal species was measured as follows. We measured the P vs. E curves of 18 algal species from 8 sites in the Greater Bay Area and obtained a total of 22 P vs. E curves (3 curves for Ulva conglobata from 3 sampling sites; 2 curves for Ulva fasciata; 2 curves for Sargassum hemiphyllum) with 3 replicates for each species.
2.2. Pigment Content Measurements
To measure the pigment content, approximately 0.10 g fresh weight (FW) thalli of each algal species was weighed and extracted in 10 mL methanol at 4 °C in the dark for 24 h. After this, the extracted mixture was shaken well and centrifuged at 5000× g for 10 min (4 °C) in a high-speed refrigerated centrifuge (CT14RD, Techcomp, Beijing, China). Then, the optical absorption spectrum of the supernatant was scanned from 350 to 750 nm using an ultraviolet-visible spectrophotometer (UV-1800, Shimadzu, Kyoto, Japan). The content of chlorophyll a (Chl a) and carotenoids (Car) was calculated as follows [37]:
where A750, A665, A652, A510, and A480 indicate the absorption at 750, 665, 652, 510, and 480 nm, respectively.
Chl a (mg g−1 FW) = [16.29 × (A665 − A750) − 8.54 × (A652 − A750)] × 10 mL × 10−3 g µg × FW−1
Car (mg g−1 FW) = [7.60 × (A480 − A750) − 1.49×(A510 − A750)] × 10 mL × 10−3 g µg × FW−1
2.3. P vs. E Curve and Dark Respiration Measurements
Upon returning to the laboratory, the young and healthy thallus of each algal species was selected to measure the P vs. E curve under 7 irradiances (0, 35, 90, 180, 270, 480, 700, and 1000 μmol photons m−2 s−1). Photosynthetic O2 evolution was measured using an Oxygen Monitor (YSI Model 550A, Yellowspring, OH, USA), permanently installed in a 15 mL photosynthetic chamber that was surrounded by a water jacket connected to a circulating thermostatic bath (Cole Parmer, Chicago, IL, USA) to maintain the desired temperature. Irradiance in the chamber was provided by a flexible LED light rope (10 W), and the irradiance level was controlled by changing the number of rope lights.
To measure the photosynthetic O2 evolution rate, 0.20 g fresh weight (FW) algal thalli was transferred into the photosynthetic chamber. After acclimation in the chamber for 10 min, the O2 evolution rate was monitored for 4–6 min in the dark and then for 40–50 min under the above series irradiations. Then, the respiration rate in the dark (Rd) and the photosynthetic rate under light (Pn) were calculated by normalizing the O2 consumption rate and O2 evolution rate to the fresh weight of algae and expressing them as μmol O2 g FW−1 h−1. Triplicate measurements of Pn and Rd were made for each algal species.
The P vs. E curve was constructed by plotting the photosynthetic rate against light intensity (E, µmol photons m−2 s−1), from which the light utilization efficiency (α, slope), maximum photosynthetic rate (Pmax, μmol O2 g FW−1 h−1), saturation irradiance (EK, µmol photons m−2 s−1), and compensation irradiance (EC, µmol photons m−2 s−1) were derived [38,39] as:
Pn = Pmax × tanh(α × E/Pmax) + Rd
EK = (Pmax + Rd)/α
EC= arctanh(−Rd/Pmax) × (Pmax/α)
2.4. Statistical Analysis
In the figures, we divided the 18 macroalgal species into 3 different categories with the traits of (a) phylum: green algae (n = 3), red algae (n = 11), and brown algae (n = 4); (b) morphology: canopy-forming (n = 4), coarsely branched (n = 4), finely branched (n = 6), and sheet-like (n = 4); and (c) habitat: lower (n = 11) and upper intertidal (n = 7). We used SPSS 22.0 software to compare data with one-way analysis of variance (ANOVA) followed by Tukey’s HSD for unequal N when we detected the differences. We assumed that pigment and photosynthesis parameters did not vary significantly over time [22] and subjected the data to multivariate analysis (MANOVA) with Wilks’ lambda test as a multivariate F value. We tested multivariate homogeneity with Box M and assessed normality for each dependent variable as in the one-way ANOVA.
Since this study involved the correlation analysis between 9 parameters and biomass, we used R4.0.5 with the vegan package for principal component analysis (PCA) of pigments and photosynthetic parameters of 18 algal species in different categories to reduce the complexity of the analysis. We used the mean of each species to estimate the factor coordinates of the variables and used the principal factor characteristics of each species to derive the photosynthetic patterns under different categories and the eigenvalues and factor correlations of the variables with the samples and variables normalized in the data matrix to reduce the complexity of the analysis. Pearson’s correlations between the pooled lg(biomass) and PC1 or PC2 factors were established using the one-way ANOVA. The significance level was set at p < 0.05.
3. Results
3.1. Macroalgal Species and Biomass
During the periods studied, a total of 18 of the major macroalgal species were obtained from the Greater Bay Area, belonging to green algae (3 species), red algae (11), and brown algae (4), respectively (Table 1). These algal species were distributed in the lower (11 species) and upper intertidal zones (7) with the morphologies of canopy-forming (4), coarsely branched (4), finely branched (6), and sheet-like (4). In addition, the biomass of each algal species varied between 149 and 7111 g m−2, with the species-specific density of green algae ranging from 1216 to 2144 g m−2 (median, 1397 g m−2), red algae from 149 to 5813 g m−2 (320 g m−2), and brown algae from 1635 to 7111 g m−2 (4245 g m−2), respectively; the species-specific biomass varied significantly within each phylum (p < 0.05). Among green algae, Ulva linza had the highest density, and Pterocladiella capillacea among red algae; however, among brown algae, all four Sargassum species had high densities (Table 1). In addition, algal biomass was generally higher at lower than upper intertidal sites, while algae with canopy-forming morphology were higher than the other three forms. Based on our collections, more algal species were present in Daya Bay (9) than in Wanshan Islands (6) and Chuanshan Islands (7) (Table 1).
3.2. Patterns of Pigments and Photosynthesis
Figure 2A shows that Chl a content varied significantly among green, red, and brown algae (p < 0.001), as did the Car content and Chl a/Car ratio (p < 0.001). Red algae had the lowest Chl a (mean ± sd, 0.27 ± 0.13 mg g FW−1) and Car content (0.11 ± 0.05 mg g FW−1), whereas green algae had the lowest Chl a/Car ratio (1.40 ± 0.08). The significant variation in Chl a, Car, and Chl a/Car ratio also occurred among the different morphological algal species (p < 0.001) (Figure 2B), with coarsely branched algal species having the lowest Chl a (0.23 ± 0.06 mg g FW−1) and Car content (0.10 ± 0.03 mg g FW−1) and sheet-like ones having the lowest Chl a/Car ratio (1.61± 0.54). Moreover, the Chl a and Car contents and Chl a/Car ratio showed no significant difference between the upper and lower intertidal zones (p > 0.05) (Figure 2C).
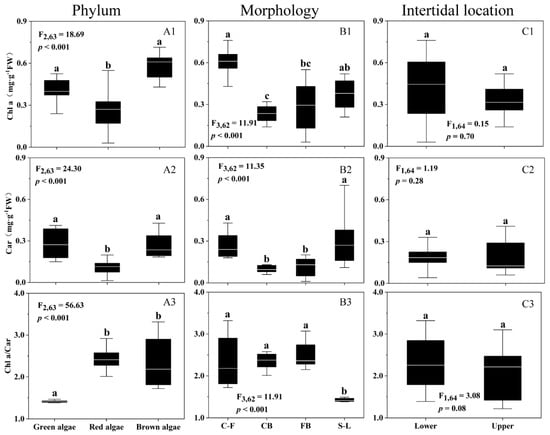
Figure 2.
Chlorophyll a (A1–C1, Chl a) and carotenoid (A2–C2, Car) contents (mg g−1 FW) and ratio of Chl a to Car (A3–C3, Chl a/Car) of 18 macroalgal species, as a function of phyla (A1–A3), morphologies (B1–B3), and intertidal locations (C1–C3). Box-plot represents the median and upper/lower quartiles of each data, the white line indicates the mean, and the similar letters connect homogeneous mean groups (ANOVA, Tukey’s HSD post-hoc test), and the algal morphologies abbreviations are shown in Table 1.
For photosynthetic parameters derived from the P vs. E curves, light utilization efficiency (α, 0.18–0.57) and maximum photosynthetic O2 evolution rate (Pmax, 48–170 μmol O2 g FW−1 h−1) varied significantly (p < 0.01) between different phyla (Figure 3A1,A2), morphologies (Figure 3B1,B2), and intertidal areas (Figure 3C1,C2), with the highest α- and Pmax-value found in green algae, in sheet-like algae, and at upper intertidal areas. Saturation irradiance (EK, 247–363 μmol photons m−2 s−1) and compensation irradiance (EC, 29–41 μmol photons m−2 s−1) varied insignificantly among different phyla and morphologies (p > 0.05), while dark respiration (Rd, 6.5–15 μmol O2 g FW−1 h−1) varied significantly (p < 0.05) (Figure 3A3–B5). The higher EK and EC occurred more at lower than upper intertidal areas, and the highest Rd occurred in green algae and also in sheet-like algae. Furthermore, the Rd/Pmax ratio varied insignificantly among different traits of phyla, morphologies, and intertidal areas (p > 0.05) (Figure 3A6–C6).
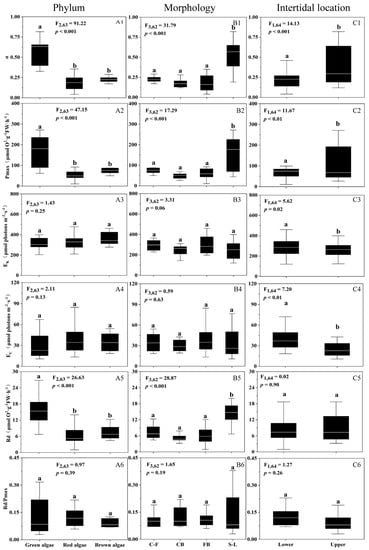
Figure 3.
Photosynthetic parameters derived from the P vs. E curves: light utilization efficiency ((A1–C1), α, initial slope), maximum photosynthetic rate ((A2–C2), Pmax, μmol O2 g FW−1 h−1), saturation irradiance ((A3–C3), EK, µmol photons m−2 s−1), compensation irradiance ((A4–C4), EC, µmol photons m−2 s−1), dark respiration rate ((A5–C5), Rd, μmol O2 g FW−1 h−1), and ratio of Rd to Pmax ((A6–C6), Rd/Pmax) of the 18 macroalgal species, as a function of phyla (A1–A6), morphologies (B1–B6), and intertidal locations (C1–C6). Box-plot represents the median and upper/lower quartiles of each data, the white line indicates the mean, and the similar letters connect homogeneous mean groups (ANOVA, Tukey’s HSD post-hoc test), and the algal morphologies abbreviations are shown in Table 1.
3.3. Multivariate Analysis of Photosynthetic Patterns
Figure 4 shows the principal component analysis (PCA) results for pigments and photosynthetic traits associated with algal photosynthetic performance. PC1 was associated with the light absorption and direct utilization of red, green, and brown algae, defined as increases in Pmax, α, Chl a, and Car content and decreases in the Chl a/Car ratio. PC2 was mainly related to extrinsic biomass accumulation and light demand, defined as increases in EK and decreases in EC, Rd, and Rd/Pmax ratios. PC1 plus PC2 accounted for 75.51% of the variability in pigment and photosynthetic traits (Figure 4). The significant correlations between the levels of Pmax, α, Chl a, and Car could be inferred from the two-dimensional plots, eigenvectors, and correlation analysis (p < 0.05). One-way analysis ANOVA, performed for PC1 and PC2 factors across different phyla, morphologies, and intertidal areas, showed that the main variability in different phyla and intertidal areas was contributed by PC1 (Figure 5A1,C1), whereas the variability in different morphologies by PC1 and PC2 (Figure 5B1,B2).
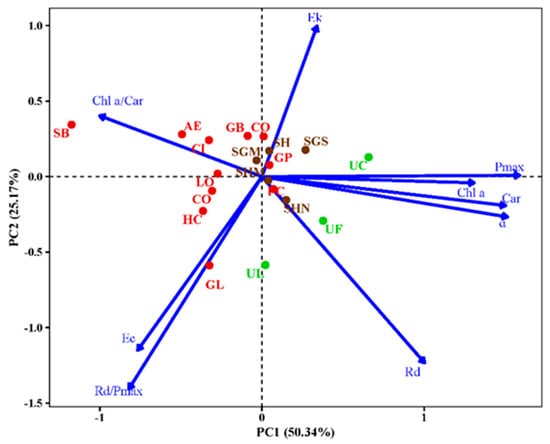
Figure 4.
Principal component analysis (PCA) plots of 9 pigment and photosynthetic parameters of 18 macroalgal species. The dots represent macroalgal species from the 3 phyla: green algae, red algae, and brown algae, and the algal species abbreviations are shown in Table 1.
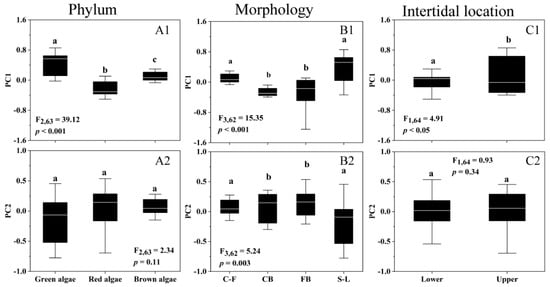
Figure 5.
PCA factor scores of PC1 (A1–C1) and PC2 (A2–C2) of 18 macroalgal species as a function of phyla (A1,A2), morphologies (B1,B2), and intertidal locations (C1,C2). Box-plot represents the median and upper/lower quartiles of each data, the white line indicates the mean, and similar letters connect homogeneous mean groups (ANOVA, Tukey’s HSD post-hoc test), and the algal morphologies abbreviations are shown in Table 1.
3.4. Relationship of Algal Biomass and Photosynthetic Pattern
We plotted the pooled lg(biomass) of algal species per square meter from both intertidal areas against the PC1 and PC2 factors (Figure 6). There was a positive correlation of the lg(biomass) with the PC1 factor (r2 = 0.22, p < 0.001) (Figure 6A) but not with the PC2 factor (Figure 6B), suggesting the distribution of macroalgae was mainly regulated by their light absorption and direct utilization capacity rather than by biomass accumulation and light demand. In addition, there was a strong positive correlation between the lg(Biomass) and PC1 factors in both the upper (r = 0.93, p < 0.001) and lower intertidal zones (r = 0.61, p < 0.001) (Table S2). However, this phenomenon did not occur in all phylum or morpho-functional groups, suggesting that growth location, rather than morphology, mediates the relationship between algal biomass and photosynthetic patterns.
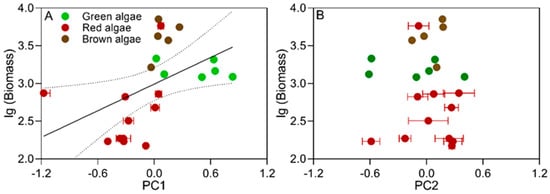
Figure 6.
The lg(Biomass) of each macroalgal species as a function of PC1 (A) and PC2 factor scores (B). Regression equations, regression coefficients, and significance are indicated, with different symbols representing different phyla of macroalgae.
4. Discussion
4.1. Photosynthetic Patterns of Macroalgae in the Greater Bay Area
To our knowledge, this is the first time that species-specific biomass, pigment, and photosynthetic patterns of all 18 major macroalgal species in the Greater Bay Area have been reported, and their photosynthetic characteristics have been linked to community biomass. Under high light or UV conditions, algal cellular protective pigments such as zeaxanthin normally increase [40], as do carotenoids and UV-absorbing compounds [41,42]. It has been shown that the carotenoids can mitigate the damage that macroalgae suffer from stressful light conditions and provide them with protection [43], and the lower ratio of chlorophyll to carotenoids may allow them to better adapt to the stressful light [44]. Consistently, we found that the Chl a/Car ratio of green algae or sheet-like algae was lower than that of other phyla or morphological algae (Table 2), which may allow them to better adapt to the high light and, thus, dominate in the upper intertidal zone (Table 1). However, the Car content of the algal species we observed did not show significant differences between the upper and lower intertidal sites (Figure 2C2). This could be due to the limited number of species and the absence of algal species in the deep water.
Table 2.
Chlorophyll a (Chl a) and carotenoid (Car) contents (mg g−1 FW), and ratio of Chl a to Car (Chl a/Car), and the photosynthetic rate versus irradiance (P vs. E) curve-derived photosynthetic parameters, i.e., maximum photosynthetic rate (Pmax, μmol O2 g FW−1 h−1), light utilization efficiency (α, slope), saturation irradiance (EK, µmol photons m−2 s−1), compensation irradiance (EC, µmol photons m−2 s−1), dark respiration rate (Rd, μmol O2 g FW−1 h−1) and ratio of Rd to Pmax (Rd/Pmax) of the 18 macroalgal species from the Guangdong–Hong Kong–Macao Greater Bay Area. Values of raw data are mean ± sd (n = 3), and the capital letters in parentheses indicate its growth region (D, Daya Bay; W, Wanshan; and C, Chuanshan).
The photosynthetic characteristics of macroalgae showed considerable variability among the different categories (Figure 3). Green algae exhibited higher α- and Pmax-value than red or brown algae, which is consistent with the results of 18 intertidal macroalgal species from southern Chile [45] and with the results from the Greater Bay Area [29,30]. In addition, the algal species from the lower intertidal zone had lower α and Pmax values and higher EK and EC values than those from the upper intertidal zone. This is in contrast to the results of Sant and Ballesteros [15], who found an increase in α and a decrease in EC with increasing depth for the canopy-forming Fucales algae in the western Mediterranean Sea. However, it is possible that the influence of morphologies on the photosynthetic properties of macroalgae dominates at a local scale. In our study, this phenomenon could be related to the fact that the sheet-like algae constituted a higher proportion in the upper intertidal zone (Table 1). The sheet-like algal species usually have higher light absorption and utilization capacity than other morphological species [18], so they can accumulate the structural materials faster due to the lower light requirement. Such a positive correlation also dictates the specificity of the photosynthetic capacity of algae [18].
Macroalgae often show different photosynthetic patterns in different environmental conditions. In this situation, PCA groups Pmax and Rd together and the EK and EC with respect to each other, with lower Pmax associated with lower Rd [46]. In the photosynthetic patterns of macroalgal species from Antarctica, the maximum relative electron transfer rate (rETRmax) and EK were in one group and α in the other, and the rETRmax and EK showed a potential influence on their morphological functions and zonation [11]. However, in this study, the photophysiological parameters Pmax, α, and Chl a and Car content belonged to one group, while Rd, EK, and EC belonged to the other, and the higher Pmax was associated with the higher α (Figure 4). This correlation was widely found in the different growth depths [15], densities [15], and morpho-functional and taxonomic groups [11]. Moreover, this correlation of Pmax and α was insignificantly influenced by phylum, morphology, and intertidal areas, possibly reflecting a unique photosynthetic pattern of macroalgal species in the Greater Bay Area. The photosynthetic patterns of macroalgae in this area were mainly responsible for the PC1 variation (Figure 5), and the variability of PC1 factor in the upper and lower intertidal zones was mainly due to the changes in Pmax and α, rather than pigments, suggesting that they are the main dependent variables for the changes in light absorption and utilization capacity in the intertidal zones.
4.2. Predictability of Macroalgal Biomass through Their Photosynthetic Patterns
The relationship between biomass and photosynthetic patterns of macroalgae differs greatly between the communities where mono-species and multi-species dominated. Rodgers and Shears [22] found that Laminaria japonica exhibited a negative correlation between its biomass and Pmax, although this phenomenon occurred only at 6 m depth in summer. Ulva lactuca, on the other hand, showed a positive correlation between its Pmax or α and biomass in the low-tide zone but a negative correlation in the mid- and high-tide zone [47]. The correlation between biomass and photosynthetic parameters in mono-species communities is often mediated by several factors, such as depth and growth location [11,22]. In this study, we found a positive correlation between algal biomass and PC1 major component (Figure 6), and the algal species with high light absorption and utilization capacity tended to have high biomass (Figure 4). This could be due to the fact that these algal species accumulate the materials for growth faster than the other species, resulting in a regionally scaled distribution [18]. This feature occurred in both upper and lower intertidal areas, suggesting that the correlation between algal biomass and photosynthesis is widespread in the intertidal species-rich community.
Different morphological structures of macroalgal species often differ in their photosynthesis. In this study, photosynthetic parameters related to light absorption and utilization capacity (Pmax, α, etc.) of sheet-like algae were found to be significantly related to their biomass (r = 0.61, p < 0.01), which provides a way to predict their biomass. This is because the variability of algal productivity usually reflects the variability of their biomass [48]. We also found a negative correlation between biomass and parameters related to biomass accumulation and requirements of finely branched algae (r = −0.55, p < 0.05). The same phenomenon was observed in the genus Sargassum. These macroalgae species, such as coralline algae and hornworts, often grow in the low intertidal zone, where their photosynthesis is easily affected by the canopy structures [49]. Therefore, they may be adaptively involved in the lower EC and Rd/Pmax ratio, which allows them to accumulate biomass more efficiently.
When macroalgae grow in high-light-incidence habitats, they need to improve their photoprotective abilities by increasing cellular Car content [50], whereas in low-light-incidence habitats, they need to synthesize more light-absorbing pigments such as Chl a to improve light absorption [14], thus changing the relevant photophysiological parameters of the P vs. E curve accordingly [51]. The physiological changes of algae may also provide a way to predict the variability of their biomass. Many previous studies have shown that the photophysiological properties of macroalgae vary greatly with vertical zonation [11,19,52]. At each depth, algal species that can optimally utilize the light source to complete their life cycle generally dominate [46]. Such a pattern also occurred in our study area when considering the photosynthesis and biomass of algal species in the lower and upper intertidal zones. In addition, the correlation between biomass and light absorption/utilization capacity was significant, suggesting that macroalgal species with high light absorption and utilization capacity may become the dominant species in intertidal zones. Thus, the correlation between photosynthetic characters and biomass in the species-rich algal community could also exist in the subtidal zone of the Greater Bay Area, but further studies are needed.
5. Conclusions
In this study, we found that the variability in the pigment content of 18 macroalgae in the Greater Bay Area was mainly due to different phyla and morphologies rather than growth regions. The Pmax of these algal species was positively correlated with α and was not mediated by phyla, morphologies, and growth regions. Moreover, green algae had higher Pmax and α than red or brown algae, and the sheet-like algal species had higher Pmax and α than other morphological species. Macroalgal species growing in the higher intertidal zone tended to have higher Pmax and α and lower EK and EC than in the lower intertidal zone. Photosynthetic patterns were attributed to two main factors. PC1, related to light absorption and utilization capacity, and PC2, related to biomass accumulation and light demand, with the first factor positively related to algal biomass. Our results suggest that the light absorption and utilization capacity of macroalgae may determine whether they dominate the sites they inhabit and that the photosynthetic characteristics of algal species may serve as a potential indicator of their biomass distribution in the Greater Bay Area.
Supplementary Materials
The following supporting information can be downloaded at: https://www.mdpi.com/article/10.3390/jmse11071409/s1.
Author Contributions
Q.H. and L.L. contributed to performing the experiment. Q.H., L.L., Y.Q. and G.L. contributed to the experimental designs and data analysis. Q.H., L.L., Y.Q., Q.L., G.N., B.C., Z.M., D.Z. and G.L. contributed to the paper writing. All authors approved this submitted version. All authors have read and agreed to the published version of the manuscript.
Funding
This study was funded by the National Key Research and Development Program of China (2022YFC3102405), National Natural Science Foundation (41890853, 31971498), and Natural Science Foundation of Guangdong Province (2022A1515011461, 2022A1515011831).
Institutional Review Board Statement
Not applicable.
Informed Consent Statement
Not applicable.
Data Availability Statement
The data that support the findings of this study are available from the corresponding author upon reasonable request.
Conflicts of Interest
The authors declare no conflict of interest.
References
- Ji, Y.; Gao, K. Effects of climate change factors on marine macroalgae: A review. Adv. Mar. Biol. 2020, 88, 91–136. [Google Scholar] [CrossRef] [PubMed]
- Rybak, A.S. Species of Ulva (Ulvophyceae, Chlorophyta) as indicators of salinity. Ecol. Indic. 2018, 85, 253–261. [Google Scholar] [CrossRef]
- Yang, Y.; Chai, Z.; Wang, Q.; Chen, W.; He, Z.; Jiang, S. Cultivation of seaweed Gracilaria in Chinese coastal waters and its contribution to environmental improvements. Algal Res. 2015, 9, 236–244. [Google Scholar] [CrossRef]
- Krause-Jensen, D.; Duarte, C.M. Substantial role of macroalgae in marine carbon sequestration. Nat. Geosci. 2016, 9, 737–742. [Google Scholar] [CrossRef]
- Ware, C.; Dijkstra, J.A.; Mello, K.; Stevens, A.; O’Brien, B.; Ikedo, W. A novel three-dimensional analysis of functional architecture that describes the properties of macroalgae as a refuge. Mar. Ecol. Prog. Ser. 2019, 608, 93–103. [Google Scholar] [CrossRef]
- Wells, E.; Wilkinson, M.; Wood, P.; Scanlan, C. The use of macroalgal species richness and composition on intertidal rocky seashores in the assessment of ecological quality under the European Water Framework Directive. Mar. Pollut. Bull. 2007, 55, 151–161. [Google Scholar] [CrossRef]
- Nejrup, L.B.; Staehr, P.A.; Thomsen, M.S. Temperature- and light-dependent growth and metabolism of the invasive red algae Gracilaria vermiculophylla—A comparison with two native macroalgae. Eur. J. Phycol. 2013, 48, 295–308. [Google Scholar] [CrossRef]
- Iñiguez, C.; Galmés, J.; Gordillo, F.J.L. Rubisco carboxylation kinetics and inorganic carbon utilization in polar versus cold-temperate seaweeds. J. Exp. Bot. 2019, 70, 1283–1297. [Google Scholar] [CrossRef]
- Li, G.; Qin, Z.; Zhang, J.; Lin, Q.; Ni, G.; Tan, Y.; Zou, D. Algal density mediates the photosynthetic responses of a marine macroalga Ulva conglobata (Chlorophyta) to temperature and pH changes. Algal Res. 2020, 46, 101797. [Google Scholar] [CrossRef]
- Varela, D.A.; Santelices, B.; Correa, J.A.; Arroyo, M.K. Spatial and temporal variation of photosynthesis in intertidal Mazzaella laminarioides (Bory) Fredericq (Rhodophyta, Gigartinales). J. Appl. Phycol. 2006, 18, 827–838. [Google Scholar] [CrossRef]
- Gómez, I.; Navarro, N.P.; Huovinen, P. Bio-optical and physiological patterns in Antarctic seaweeds: A functional trait based approach to characterize vertical zonation. Prog. Oceanogr. 2019, 174, 17–27. [Google Scholar] [CrossRef]
- Borum, J.; Pedersen, M.; Krause-Jensen, D.; Christensen, P.; Nielsen, K. Biomass, photosynthesis and growth of Laminaria saccharina in a high-arctic fjord, NE Greenland. Mar. Biol. 2002, 141, 11–19. [Google Scholar] [CrossRef]
- Pärnoja, M.; Kotta, J.; Orav-Kotta, H.; Paalme, T. Comparisons of individual and community photosynthetic production indicate light limitation in the shallow water macroalgal communities of the Northern Baltic Sea. Mar. Ecol. Evol. Persp. 2013, 35, 19–27. [Google Scholar] [CrossRef]
- Kaewsrikhaw, R.; Ritchie, R.J.; Prathep, A. Variations of tidal exposures and seasons on growth, morphology, anatomy and physiology of the seagrass Halophila ovalis (R.Br.) Hook. f. in a seagrass bed in Trang Province, Southern Thailand. Aquat. Bot. 2016, 130, 11–20. [Google Scholar] [CrossRef]
- Sant, N.; Ballesteros, E. Depth distribution of canopy-forming algae of the order Fucales is related to their photosynthetic features. Mar. Ecol. 2021, 42, e12651. [Google Scholar] [CrossRef]
- Kim, S.H.; Kim, J.W.; Kim, Y.K.; Park, S.R.; Lee, K.-S. Factors controlling the vertical zonation of the intertidal seagrass, Zostera japonica in its native range in the northwestern Pacific. Mar. Environ. Res. 2020, 157, 104959. [Google Scholar] [CrossRef]
- Bruno, J.F.; Lee, S.C.; Kertesz, J.S.; Carpenter, R.C.; Long, Z.T.; Duffy, J.E. Partitioning the effects of algal species identity and richness on benthic marine primary production. Oikos 2006, 115, 170–178. [Google Scholar] [CrossRef]
- Hurd, C.L.; Harrison, P.J.; Bischof, K.; Lobban, C.S. Seaweed Ecology and Physiology; Cambridge University Press: Cambridge, UK, 2014; p. 562. [Google Scholar]
- Gómez, I.; Huovinen, P. Morpho-functional patterns and zonation of South Chilean seaweeds: The importance of photo-synthetic and bio-optical traits. Mar. Ecol. Prog. Ser. 2011, 422, 77–91. [Google Scholar] [CrossRef]
- Bruno, J.F.; Boyer, K.E.; Duffy, J.E.; Lee, S.C.; Kertesz, J.S. Effects of macroalgal species identity and richness on primary production in benthic marine communities. Ecol. Lett. 2005, 8, 1165–1174. [Google Scholar] [CrossRef]
- Migné, A.; Delebecq, G.; Davoult, D.; Spilmont, N.; Menu, D.; Gévaert, F. Photosynthetic activity and productivity of inter-tidal macroalgae: In situ measurements, from thallus to community scale. Aquat. Bot. 2015, 123, 6–12. [Google Scholar] [CrossRef]
- Rodgers, K.L.; Shears, N.T. Modelling kelp forest primary production using in situ photosynthesis, biomass and light measurements. Mar. Ecol. Prog. Ser. 2016, 553, 67–79. [Google Scholar] [CrossRef]
- Gao, L.; Ning, J.; Bao, W.; Yan, A.; Yin, Q. A study on the marine ecological security assessment of Guangdong-Hong Kong-Macao Great Bay Area. Mar. Pollut. Bull. 2022, 176, 113416. [Google Scholar] [CrossRef] [PubMed]
- Wang, W.; Han, B.; Zheng, H.; Ouyang, Z. Evolution and simulation of ecosystem patterns in Guangdong-Hong Kong-Macau Bay Area. Acta Ecol. Sin. 2020, 40, 3364–3374. [Google Scholar]
- Wang, Y.; Lou, Z.; Sun, C.; Sun, S. Ecological environment changes in Daya Bay, China, from 1982 to 2004. Mar. Pollut. Bull. 2008, 56, 1871–1879. [Google Scholar] [CrossRef] [PubMed]
- Song, X.; Huang, L.; Zhang, J.; Huang, X.; Zhang, J.; Yin, J.; Tan, Y.; Liu, S. Variation of phytoplankton biomass and primary production in Daya Bay during spring and summer. Mar. Pollut. Bull. 2004, 49, 1036–1044. [Google Scholar] [CrossRef]
- Liu, H.; Huang, L.; Song, X.; Zhong, Y. Using primary productivity as an index of coastal eutrophication: A case study in Daya Bay. Water Environ. J. 2012, 26, 235–240. [Google Scholar] [CrossRef]
- Zhu, W.; Zhang, A.; Qin, C.; Guo, Y.; Pan, W.; Chen, J.; Yu, G.; Li, C. Seasonal and spatial variation of protist communities from reef water and open ocean water in patchy coral reef areas of a semi-enclosed bay. Mar. Environ. Res. 2021, 169, 105407. [Google Scholar] [CrossRef]
- Shi, X.; Zou, D.; Hu, S.; Mai, G.; Ma, Z.; Li, G. Photosynthetic characteristics of three cohabitated macroalgae in the Daya Bay, and their responses to temperature rises. Plants 2021, 10, 2441. [Google Scholar] [CrossRef]
- Wan, M.; Wang, Z.; Mai, G.; Ma, Z.; Xia, X.; Tan, Y.; Li, G. Photosynthetic characteristics of macroalgae Ulva fasciata and Sargassum thunbergii in the Daya Bay of the South China Sea, with special reference to the effects of light quality. Sustainability 2022, 14, 8063. [Google Scholar] [CrossRef]
- Desmond, M.J.; Pritchard, D.W.; Hurd, C.L.; Richards, D.K.; Schweikert, K.; Wing, S.; Hepburn, C.D. Superior photosynthetic performance of the invasive kelp Undaria pinnatifida may contribute to continued range expansion in a wave-exposed kelp forest community. Mar. Biol. 2019, 166, 1–11. [Google Scholar] [CrossRef]
- Wu, W.; Yan, J.; Song, D. Study on the tidal dynamics in Daya Bay, China-Part I. Observation and numerical simulation of tidal dynamic system. J. Trop. Oceanogr. 2017, 36, 34–45. [Google Scholar]
- Liu, L.; Liu, Z.; He, Q.; Yang, Y.; Zou, D. Distribution patterns of intertidal macroalgal diversity and biomass in the intertidal zone of Guangdong-Hong Kong-Macao Greater Bay Area. Chin. J. Ecol. 2023, 42, 677–684. [Google Scholar]
- Wernberg, T.; Goldberg, N. Short-term temporal dynamics of algal species in a subtidal kelp bed in relation to changes in environmental conditions and canopy biomass. Estuar. Coast. Shelf Sci. 2008, 76, 265–272. [Google Scholar] [CrossRef]
- Spector, M.; Edwards, M.S. Species-specific biomass drives macroalgal benthic primary production on temperate rocky reefs. Algae 2020, 35, 237–252. [Google Scholar] [CrossRef]
- Zeng, C. Chinese Seaweed Flora; Science Press: Beijing, China, 2000. [Google Scholar]
- Wellburn, A.R. The spectral determination of chlorophylls a and b, as well as total carotenoids, using various solvents with spectrophotometers of different resolution. J. Plant Physiol. 1994, 144, 307–313. [Google Scholar] [CrossRef]
- Jassby, A.D.; Platt, T. Mathematical formulation of the relationship between photosynthesis and light for phytoplankton. Limnol. Oceanogr. 1976, 21, 540–547. [Google Scholar] [CrossRef]
- Henley, W.J. Measurement and interpretation of photosynthetic light-response curves in algae in the context of photoinhibition and diel changes. J. Phycol. 1993, 29, 729–739. [Google Scholar] [CrossRef]
- Torres, P.B.; Chow, F.; Santos, D.Y.A.C. Growth and photosynthetic pigments of Gracilariopsis tenuifrons (Rhodophyta, Gracilariaceae) under high light in vitro culture. J. Appl. Phycol. 2015, 27, 1243–1251. [Google Scholar] [CrossRef]
- Li, X.; Feng, Z.; He, P. Effects of solar radiation on photosynthesis and pigmentation in the red alga Pyropia yezoensis Ueda (Bangiales, Rhodophyta). Indian J. Geo-Mar. Sci. 2014, 43, 473–480. [Google Scholar]
- Schneider, G.; Figueroa, F.L.; Vega, J.; Avilés, A.; Chaves, P.; Horta, P.A.; Korbee, N.; Bonomi-Barufi, J. Physiological and biochemical responses driven by different UV-visible radiation in Osmundea pinnatifida (Hudson) Stackhouse (Rhodophyta). Photochem. Photobiol. Sci. 2020, 19, 1650–1664. [Google Scholar] [CrossRef]
- Takaichi, S. Carotenoids in algae: Distributions, biosyntheses and functions. Mar. Drugs 2011, 9, 1101–1118. [Google Scholar] [CrossRef] [PubMed]
- Marschall, M.; Proctor, M.C.F. Are Bryophytes Shade Plants? Photosynthetic light responses and proportions of chlorophyll a, chlorophyll b and total carotenoids. Ann. Bot. 2004, 94, 593–603. [Google Scholar] [CrossRef] [PubMed]
- Gómez, I.; López-Figueroa, F.; Ulloa, N.; Morales, V.; Lovengreen, C.; Huovinen, P.; Hess, S. Patterns of photosynthesis in 18 species of intertidal macroalgae from southern Chile. Mar. Ecol. Prog. Ser. 2004, 270, 103–116. [Google Scholar] [CrossRef]
- Sant, N.; Ballesteros, E. Photosynthetic activity of macroalgae along a bathymetric gradient: Interspecific and seasonal variability. Sci. Mar. 2020, 84, 7. [Google Scholar] [CrossRef]
- Jiang, H.; Gong, J.; Lou, W.; Zou, D. Photosynthetic behaviors in response to intertidal zone and algal mat density in Ulva lactuca (Chlorophyta) along the coast of Nan’ao Island, Shantou, China. Environ. Sci. Pollut. Res. Int. 2019, 26, 13346–13353. [Google Scholar] [CrossRef]
- Reed, D.C.; Rassweiler, A.; Arkema, K.K. Biomass rather than growth rate determines variation in net primary production by giant kelp. Ecology 2008, 89, 2493–2505. [Google Scholar] [CrossRef]
- Tait, L.W.; Schiel, D.R. Dynamics of productivity in naturally structured macroalgal assemblages: Importance of canopy structure on light-use efficiency. Mar. Ecol. Prog. Ser. 2011, 421, 97–107. [Google Scholar] [CrossRef]
- Park, S.R.; Kim, S.; Kim, Y.K.; Kang, C.K.; Lee, K.S. Photoacclimatory responses of Zostera marina in the intertidal and subtidal zones. PLoS One 2016, 11, e0156214. [Google Scholar] [CrossRef]
- Desmond, M.J.; Pritchard, D.W.; Hepburn, C.D. Light dose versus rate of delivery: Implications for macroalgal productivity. Photosynth. Res. 2017, 132, 257–264. [Google Scholar] [CrossRef]
- Abidizadegan, M.; Khalesi, M.K.; Ajdari, D. Depth-dependent pigment fluctuations in the agarophyte Gracilaria corticata at intertidal waters. Thalassas 2018, 34, 247–253. [Google Scholar] [CrossRef]


Disclaimer/Publisher’s Note: The statements, opinions and data contained in all publications are solely those of the individual author(s) and contributor(s) and not of MDPI and/or the editor(s). MDPI and/or the editor(s) disclaim responsibility for any injury to people or property resulting from any ideas, methods, instructions or products referred to in the content. |
© 2023 by the authors. Licensee MDPI, Basel, Switzerland. This article is an open access article distributed under the terms and conditions of the Creative Commons Attribution (CC BY) license (https://creativecommons.org/licenses/by/4.0/).