Article

Investigation of Multi-Timescale Sea Level Variability near Jamaica in the Caribbean Using Satellite Altimetry Records

by
Deron O. Maitland
*,
Michael A. Taylor
and
Tannecia S. Stephenson
Department of Physics, The University of the West Indies, Kingston 07 JMAAW15, Jamaica
*
Author to whom correspondence should be addressed.
J. Mar. Sci. Eng. 2023, 11(8), 1499; https://doi.org/10.3390/jmse11081499
Submission received: 31 May 2023 / Revised: 1 July 2023 / Accepted: 3 July 2023 / Published: 27 July 2023
(This article belongs to the Special Issue Sea Level Rise: Drivers, Variability and Impacts)

Abstract

:
There is a dearth of studies characterizing historical sea level variability at the local scale for the islands in the Caribbean. This is due to the lack of reliable long term tide gauge data. There is, however, a significant need for such studies given that small islands are under increasing threat from rising sea levels, storm surges, and coastal flooding due to global warming. The growing length of satellite altimetry records provides a useful alternative to undertake sea level analyses. Altimetry data, spanning 1993–2019, are used herein to explore multi-timescale sea level variability near the south coast of Jamaica, in the northwest Caribbean. Caribbean basin dynamics and largescale forcing mechanisms, which could account for the variability, are also investigated. The results show that the average annual amplitude off the south coast of Jamaica is approximately 10 cm with a seasonal peak during the summer (July–August). The highest annual sea levels occur within the Caribbean storm season, adding to the annual risk. The annual trend over the 27 years is 3.3 ± 0.4 mm/yr when adjusted for Glacial Isostatic Adjustment (GIA), instrumental drift, and accounting for uncertainties. This is comparable to mean global sea level rise, but almost twice the prior estimates for the Caribbean which used altimetry data up to 2010. This suggests an accelerated rate of rise in the Caribbean over the last decade. Empirical Orthogonal Function (EOF) and correlation analyses show the long-term trend to be a basin-wide characteristic and linked to warming Caribbean sea surface temperatures (SSTs) over the period. When the altimetry data are detrended and deseasoned, the leading EOF mode has maximum loadings over the northwest Caribbean, including Jamaica, and exhibits interannual variability which correlates significantly with a tropical Pacific-tropical Atlantic SST gradient index, local wind strength, and the Caribbean Low Level Jet (CLLJ). Correlations with the El Niño Southern Oscillation (ENSO) in summer, seen in this and other studies, likely arise through the contribution of the ENSO to the SST gradient index and the ENSO’s modulation of the CLLJ peak strength in July. The results demonstrate the usefulness of altimetry data for characterizing sea level risk on various timescales for small islands. They also suggest the potential for developing predictive models geared towards reducing those risks.

1. Introduction

The Caribbean region is largely composed of small island developing states (SIDS) that are vulnerable to sea level rise (SLR)—one of the key indicators of climate change [1,2,3]. This vulnerability arises in part from large proportions of island populations that live on the coast [3,4], the high concentration of economic activities, e.g., tourism, that depend on the coast [5,6,7,8], and the risk from storm surge due to annual extreme weather events within the region [9]. SLR contributes to coastal flooding and erosion in low-lying areas in the Caribbean [10], in turn leading to loss of infrastructure, livelihoods, natural resources, and economic viability [11].
Generally, SLR variability at regional and local scales has not been as extensively investigated and characterized as at the global scales [12], notwithstanding that greater understanding is necessary to develop local adaptation and risk reduction strategies [13,14,15]. The Caribbean is significantly underrepresented in ocean research [16,17], with only a few basin-wide studies and even fewer island-specific studies examining historical sea level change across multi-timescales.
The Caribbean’s underrepresentation has largely been due to limited tide gauge records of sufficient length, completeness, and spatial coverage [16]. The availability of satellite altimetry since the early 1990s is helping to address the challenge by offering an option for assessing historical sea level change at regional and local scales [18,19]. For the Caribbean, the availability of altimetry data has resulted in an increased number of SLR studies in recent years—albeit, still too few considering the magnitude of the threat. For relevant examples, see the altimetry-based studies in [16,17,20,21,22]. These studies have been variously focused, including validating the altimetry data against tide gauge records to show its usefulness for the region, e.g., [16,22,23]; establishing long term trends, especially in the context of global trends, e.g., [17,22,23]; and examining seasonal to interannual variability and the associated drivers, e.g., [17,20,21,23].
All of the aforementioned Caribbean studies utilize available altimetry data prior to or up to 2010, i.e., their results are premised on altimetry datasets of 18 years or less. This is true even for Palanisamy et al. (2012) [17] who integrate altimetry into a 60-year reconstructed dataset of gauge, altimetry, and ocean model data. Torres and Tsimplis (2012) [21] note the need for at least 20 years of observations to obtain steady estimates of seasonal and annual characteristics. One of the motivating factors for this study is the (re)examination of multi-timescale variability of SLR in the Caribbean region given the availability of an additional decade and more of altimetry data. This paper aims to corroborate and/or update prior altimetry studies and provide new insights.
Beyond that, however, most Caribbean studies largely focus on basin-wide historical trends in SLR. This is not surprising, since the global warming impact on sea levels is large-scale and not limited to sub-region or island [12], but also because of the previously noted limited spread of tide gauge data for the Caribbean. There are very few altimetry studies specific to the islands of the Caribbean, notwithstanding that impacts are felt at the local level, and it has been noted that there is spatial variation in interannual variability across the Caribbean basin [23]. Miller et al. (2012) [22] is one such study which examines SLR characteristics for Barbados using altimetry data. Jury (2018) [24] also examines sea level trends for Puerto Rico, but from other data (non-altimetry) sources. It is also noted that, in comparison, there are many more sub-regional and island scale projection studies—though still not enough—due to the greater availability of ocean model data.
The focus of this paper is the use of altimetry data to examine multi-scale sea level variability near Jamaica, the third-largest Caribbean island, located in the northwestern region (Figure 1). The impact of sea level rise on the Jamaican coastline has largely been documented anecdotally (e.g., [25]) or in a few studies focussed on projected change, (e.g., [26,27,28,29]). There are no studies for Jamaica that we are aware of characterizing seasonal, interannual, or longer trends using altimetry. In this study, the focus is on the southeast coast of Jamaica, where the capital city, Kingston, and other major population centres, e.g., Portmore, are located. It is also the site of an international airport and major port facilities that are already deemed threatened by future sea level rise [28], significant telecommunication and electricity generation infrastructure, and the financial district. Sea level variability and trends for southeastern Jamaica are examined using 27 years of satellite altimetry data. The results are contextualized with respect to the wider Caribbean basin, and potential drivers of Jamaica’s sea level variability are also explored using statistical techniques. These include Empirical Orthogonal Functions (EOFs) [30,31], correlations, and composites [32,33] applied to the altimetry data, as well as other datasets for sea surface temperature (SST) and near surface winds. This study also represents a methodological approach that can be replicated for other islands in the Caribbean.
The following sections describe the data and methodology used in the study, the results of the analyses, and provide discussion of the major findings using a risk lens. The paper concludes with a summary of key takeaways.

2. Data and Methodology

2.1. Geographical Setting

The Caribbean is defined using the area 10° N–25° N and 59° W–85° W (Figure 1). There is large variability in the depth of the Caribbean Sea within the basin. For example, there are relatively shallow areas around islands such as the Jamaica Ridge [34] versus the Cayman trench, which is beyond 7600 m deep, located in the north Caribbean [35]. There are no studies we are aware of that quantify the impact of vertical land motion on sea level in the wider Caribbean Basin [36]; however, some studies have indicated an impact of vertical land motion on relative sea level rise in the Colombia Caribbean area in the southern Caribbean basin [36,37].
Jamaica is located at 18.11° N, 77.30° W in the northwestern Caribbean. The study area surrounding Kingston and Portmore is on the southeast coast of Jamaica. While there is significant evidence of past uplift in Jamaica (especially on the north coast, which is closer to the edge of the Caribbean plate [38,39,40]); the vertical land motion in Jamaica is on the order of less than 1 m/ka over the last 4000 years and, as such, is considered insignificant when considering sea level variability [23,41].

2.2. Data

Satellite altimetry data were obtained from the Copernicus Climate Change Service (C3S). C3S provides a dataset of gridded monthly sea level anomalies from satellite altimetry measurements, where anomalies are defined as the surface height above mean sea level from 1993 to 2019. Anomalies are calculated relative to a 20-year (1993–2012) baseline. The altimetry dataset was derived using an optimal interpolation method which combined the sea level anomalies output produced by two-satellite merged constellations at any given time. The combination of two satellites provides adequate spatial sampling while optimizing stability during the interpolation process. The C3S data are considered appropriate for climate applications such as investigating the evolution of sea level change on a regional or local scale [42]. Recently updated altimetry data (DT2018) using the Data Unification and Altimeter Combination System (DUACS) were used. The DT2018 ensemble of products incorporates 25 years of observations, tidal corrections, and mean sea surface corrections to significantly improve the accuracy of altimetry estimates in coastal areas [42]. This was considered important for this study, which analyses sea level change along the coast of a small island. For more information on the processing of the altimetry data, see [42,43]. DT2018 altimetry products do not include corrections for Global Isostatic Adjustment (GIA) nor TOPEX-A satellite instrumental drift that was characteristic of the early years of altimetry data collection. To account for GIA, the ICE-5G (VM2) model was used to correct the altimetry values [23,44]. The instrumental drift was accounted for by using an approximation for the examined altimetry period. Details on the calculation of this approximation are provided by [18,42].
Research quality tide gauge data for Jamaica are unavailable for the altimetry era spanning 1993 to present. Tide gauge data for nearby stations in Grenada, Puerto Rico, Dominica, Haiti, and Cuba (see Figure 1) were obtained from The University of Hawaii Sea Level Centre (see Table 1). The locations of the tide gauges, in these islands, are shown in Table 2. The tide gauge data were used to offer a simple validation of the use of the altimetry dataset in the Caribbean.
To investigate ocean–atmospheric phenomena which may be linked to variations in sea levels for Jamaica and the wider Caribbean Sea, ten (10) climate/oceanic indices and variables were considered. These indices were chosen based on current understanding of Caribbean climatology, particularly rainfall, and the atmospheric/oceanic modes that influence interannual and decadal climate variability within the region. For a more fulsome discussion on Caribbean climate variability, see, for example, [45,46,47]. Table 1 provides details about the climate indices, including how they are derived and the data sources from which they were extracted. Table 1 also shows the information for the sea surface temperatures and surface wind datasets used in the composite analyses described in the following section.
Table 1. (a) Data sources, and (b) climate/ocean indices used in the study.
(a) Data TypeDetailsLengthSourceReference
Tide GaugeStation data of relative sea level rise for Cuba, Haiti, Puerto Rico, Dominica, Grenada.Varying Record LengthsUniversity of Hawaii Sea Level Centre. Retrieved from: http://uhslc.soest.hawaii.edu/data/ (accessed on 16 March 2020).[23,48]
Satellite AltimetryDaily Data Sea surface height above mean Sea Surface (‘sla’ sea level anomaly). 0.25° × 0.25° Gridded Dataset.1993–2019Copernicus Climate Change Service (C3S): https://cds.climate.copernicus.eu/cdsapp#!/dataset/satellite-sea-level-global?tab=overview (accessed on 5 September 2019).[42,49]
Sea Surface TemperatureExtended Reconstructed Sea Surface Temperature (ERSST) v5 Monthly 2.0° × 2.0° Gridded Dataset.1993–2019https://www.ncdc.noaa.gov/data-access/marineocean-data/extended-reconstructed-sea-surface-temperature-ersst-v5 (accessed on 2 November 2022). [50]
Surface WindEuropean Centre for Medium-Range Weather Forecasts (ECMWF) ERA5 climate reanalysis. Reanalysis, land based zonal and meridional wind dataset from 1990–2020. 9 km resolution. Monthly. 1993–2019https://cds.climate.copernicus.eu/cdsapp#!/dataset/reanalysis-era5-land-monthly-means?tab=overview (accessed on 2 November 2022).[50,51]
(b) Climate/Ocean Indices and VariablesDescriptionPeriodSourceReference
Caribbean Sea Surface Temperature (Carib SST)Caribbean Index (CAR). Carib SST Anomaly averaged over 10°–25° N, 100°–60° W.1950–2019Derived using ERSSTv5 Monthly anomaly data (see above)[17,52]
Nino3.0Eastern Tropical Pacific SST Anomaly averaged over 5° N–5° S, 150°–90° W.1950–2020Derived using ERSSTv5 Monthly anomaly data (see above)[17,23]
Nino3.4Anomaly average SST in Nino3.4 Region (5° N–5° S, 120°–170° W)1950–2020Derived using ERSSTv5 Monthly anomaly data (see above)
Jamaica WindSurface wind anomaly at 18.038° N, 76.849° W.1990–2020Derived using ECMWF ER5 Monthly climate reanalysis data (see above)[50,53]
Caribbean Low Level Jet (CLLJ)The CLLJ index is an anomaly mean of the easterly zonal wind at 925 hPa in the CLLJ emergence region (11.25°–18.75° N, 81.25°–68.75° W). The CLLJ is located south of Jamaica.1949–2020US Weather Service—National Met. Center via NOAA NCEP-NCAR CDAS-1 database obtained from: http://iridl.ldeo.columbia.edu/SOURCES/.NOAA/.NCEP-NCAR/.CDAS-1/.MONTHLY/.Intrinsic/.PressureLevel/.u/P/925/VALUE/Y/12.5/17.5/RANGE/X/-80/-70/RANGE/[X/Y]average/dup/T/(1981)/(2010)/RANGE/[T]average/sub/-1/mul/DATA/-10/10/RANGE//name//cllji/def//long_name/(Caribbean%20Low%20Level%20Jet%20Index)/def/dup/index.html (accessed on 9 September 2021).[45,54,55,56]
Sea Level Pressure (SLP)Reanalysis data of mean sea level pressure at 17.5° N, 77.5° W. Gridded monthly reanalysis dataset at 2.5° × 2.5° resolution.1949–2020Extracted from US Weather Service—National Met. Center’s NOAAData Obtained from: http://iridl.ldeo.columbia.edu/SOURCES/.NOAA/.NCEP-NCAR/.CDAS-1/.MONTHLY/.Intrinsic/.MSL/.pressure/ (accessed on 9 September 2021).[56]
Pacific Decadal Oscillation (PDO)Long-term climate variability phenomenon centred around the North Pacific and produced from analysis of SST anomalies in this region.1950–2019NOAA Database obtained from: https://psl.noaa.gov/data/climateindices/list (accessed on 9 September 2021).[30]
Atlantic Multidecadal Oscillation (AMO)Multi-decadal cycle of sea surface temperatures in the Pacific Ocean characterised by warm and cool phases. 1950–2020NOAA Physical Sciences Laboratory. Data obtained from: http://www.psl.noaa.gov/data/timeseries/AMO (accessed on 9 September 2021).[57,58]
North Atlantic Oscillation (NAO)Large scale atmospheric teleconnection pattern associated with pressure differences in North Atlantic.1950–2020NOAA Climate Prediction Centre. Dat aobtained from:https://www.cpc.ncep.noaa.gov/products/precip/CWlink/pna/nao.shtml (accessed on 10 September 2021).[59]
Pacific-Atlantic Sea Surface Temperature Gradient (Pacific-Atl)SST gradient index calculated using the difference in the SST anomalies in the Nino 3.0 region of the Pacific (5° N–5° S, 150°–90° W) and the Tropical North Atlantic (6° S–22° N, 80°–15° W). A known modulator of Caribbean rainfall.1993–2019Index was produced using ERSSTv5 SST datasets. Obtained from https://www.ncdc.noaa.gov/data-access/marineocean-data/extended-reconstructed-sea-surface-temperature-ersst-v5 (accessed on 10 September 2021).[45,55,58]
Table 2. Correlations between Caribbean tide gauge stations and altimetry. Significant correlations are in bold.
Tide GaugeLocationCorrelation CoefficientPeriod of OverlapDistance to Nearest Grid Corner from Tide Gauge (km)
Tide GaugeAltimetry Grid Box
Port-au Prince, Haiti18.567° N, 72.350° W18.625° N, 72.625° W0.352012–20157.02
San Juan, Puerto Rico18.460° N, 66.117° W18.875° N, 66.125° W0.892000–200818.37
Prickley Bay, Grenada12.005° N, 61.765° W12.125° N, 61.875° W0.772012–201518.01
Roseau, Dominica15.313° N, 61.390° W15.375° N, 61.625° W0.742014–201627.02
Cabo Cruz,
Cuba
19.833° N,
77.733° W
19.875° N,
77.875° W
0.811993–201916.47

2.3. Methodology

The linear trend in the altimetry records was obtained using linear least-square fitting. This allowed for the trend to be determined from the timeseries by fitting it to a linear model:
S = i = 1 n y i p 1 x i + p 2
where S is a set of simultaneous equations with unknowns p 1 and p 2 . The equation was solved to determine the values of p 1 and p 2 , where the result is represented by a first-order polynomial of the form:
y = p 1 x + p 2  
The first-order differential equation gives the linear trend, where y is the sea level at time x. Uncertainties in the satellite altimetry trends were obtained from analysis of the altimetry error budget and least-squared error variance–covariance assessment of the global mean sea level (GMSL) trends at a 90% confidence level [60]. The annual trend was computed for the monthly values, averaged annually.
The Mann–Kendall Test was used to determine statistical significance of the trend. It is a non-parametric test of the null hypothesis that there is no monotonic trend in the tide gauge and satellite altimetry data [30]. The mean seasonal cycle of sea level change was calculated following [21,24]. Pearson’s correlation coefficients were calculated between the tide gauge records for the five locations shown in Figure 1 and the closest altimetry grid point. Spearman’s correlation was also used for comparison.
Empirical Orthogonal Functions (EOFs) were used to investigate seasonal, interannual, and long-term sea level variability for the wider Caribbean Sea in which Jamaica is located. EOF analysis is commonly used in atmospheric sciences to identify spatial patterns in data over time by isolating statistically independent modes in the data [61]. EOF analysis was first applied to the unaltered (‘raw’) satellite altimetry data of sea level anomalies for the Caribbean region (10–24° N, 59–89° W). The linear trend was then removed (i.e., the altimetry data was ‘detrended’) and EOF analysis re-performed to investigate seasonal and interannual signals [23,30]. Likewise, to investigate the interannual and long-term trends, the seasonal signal identified in the altimetry data (i.e., by averaging for each month in the year over the entire record) was subtracted from the altimetry record so that a non-seasonal altimetry dataset was obtained (i.e., the data was ‘deseasoned’) and EOFs determined. Finally, to investigate the interannual variability, the data were detrended and deseasoned, and a 13-month running mean applied before EOF analysis was carried out. The application of the running mean was to account for the eddy-rich nature of the Caribbean Sea [23]. Because summer (June–July–August) is climatologically when the highest sea levels occur for southeastern Jamaica (see Section 3.2), variability in this period was also investigated. Extracted sea level anomalies for June to August (JJA) were averaged for each year, and the EOF analyses previously described were repeated for the summer dataset.
Correlation analysis was used to investigate possible connections between the dominant EOF modes and (i) large scale climate phenomenon such as ENSO, (ii) climate and ocean indices capturing variability in sea level pressures, sea surface temperatures (SSTs), and near surface wind in the Caribbean, and (iii) the SST gradient between the tropical north Atlantic and tropical Pacific oceans, which is a known influence on the strength of the Caribbean low level jet (CLLJ) [55]. See again Table 1 for a detailed description of the indices. Spearman’s correlation analysis is non-parametric and can reveal non-linear trends and relationships between two variables which may not be captured by Pearson’s correlation [62,63,64]. This was used to calculate correlation coefficients between the leading principal components and the climate indices.
Finally, composite analysis was performed to examine the extent to which surface wind variability and SSTs act as potential drivers of sea level change in the region and, specifically, for the south coast of Jamaica. The analysis was restricted to the summer season. To derive the composites, the summer (averaged over JJAS) sea level anomalies timeseries for Jamaica was divided into quartiles, and high (upper quartile) and low (bottom quartile) sea level years isolated. Composite maps of mean summer SST and near surface wind anomalies were created for the high versus low sea level years, as well as for the difference between high and low sea level years. A Student’s t-test with confidence interval 0.95 was used to determine regions of statistically significant difference [65,66].

3. Results

3.1. Satellite Altimetry Validation

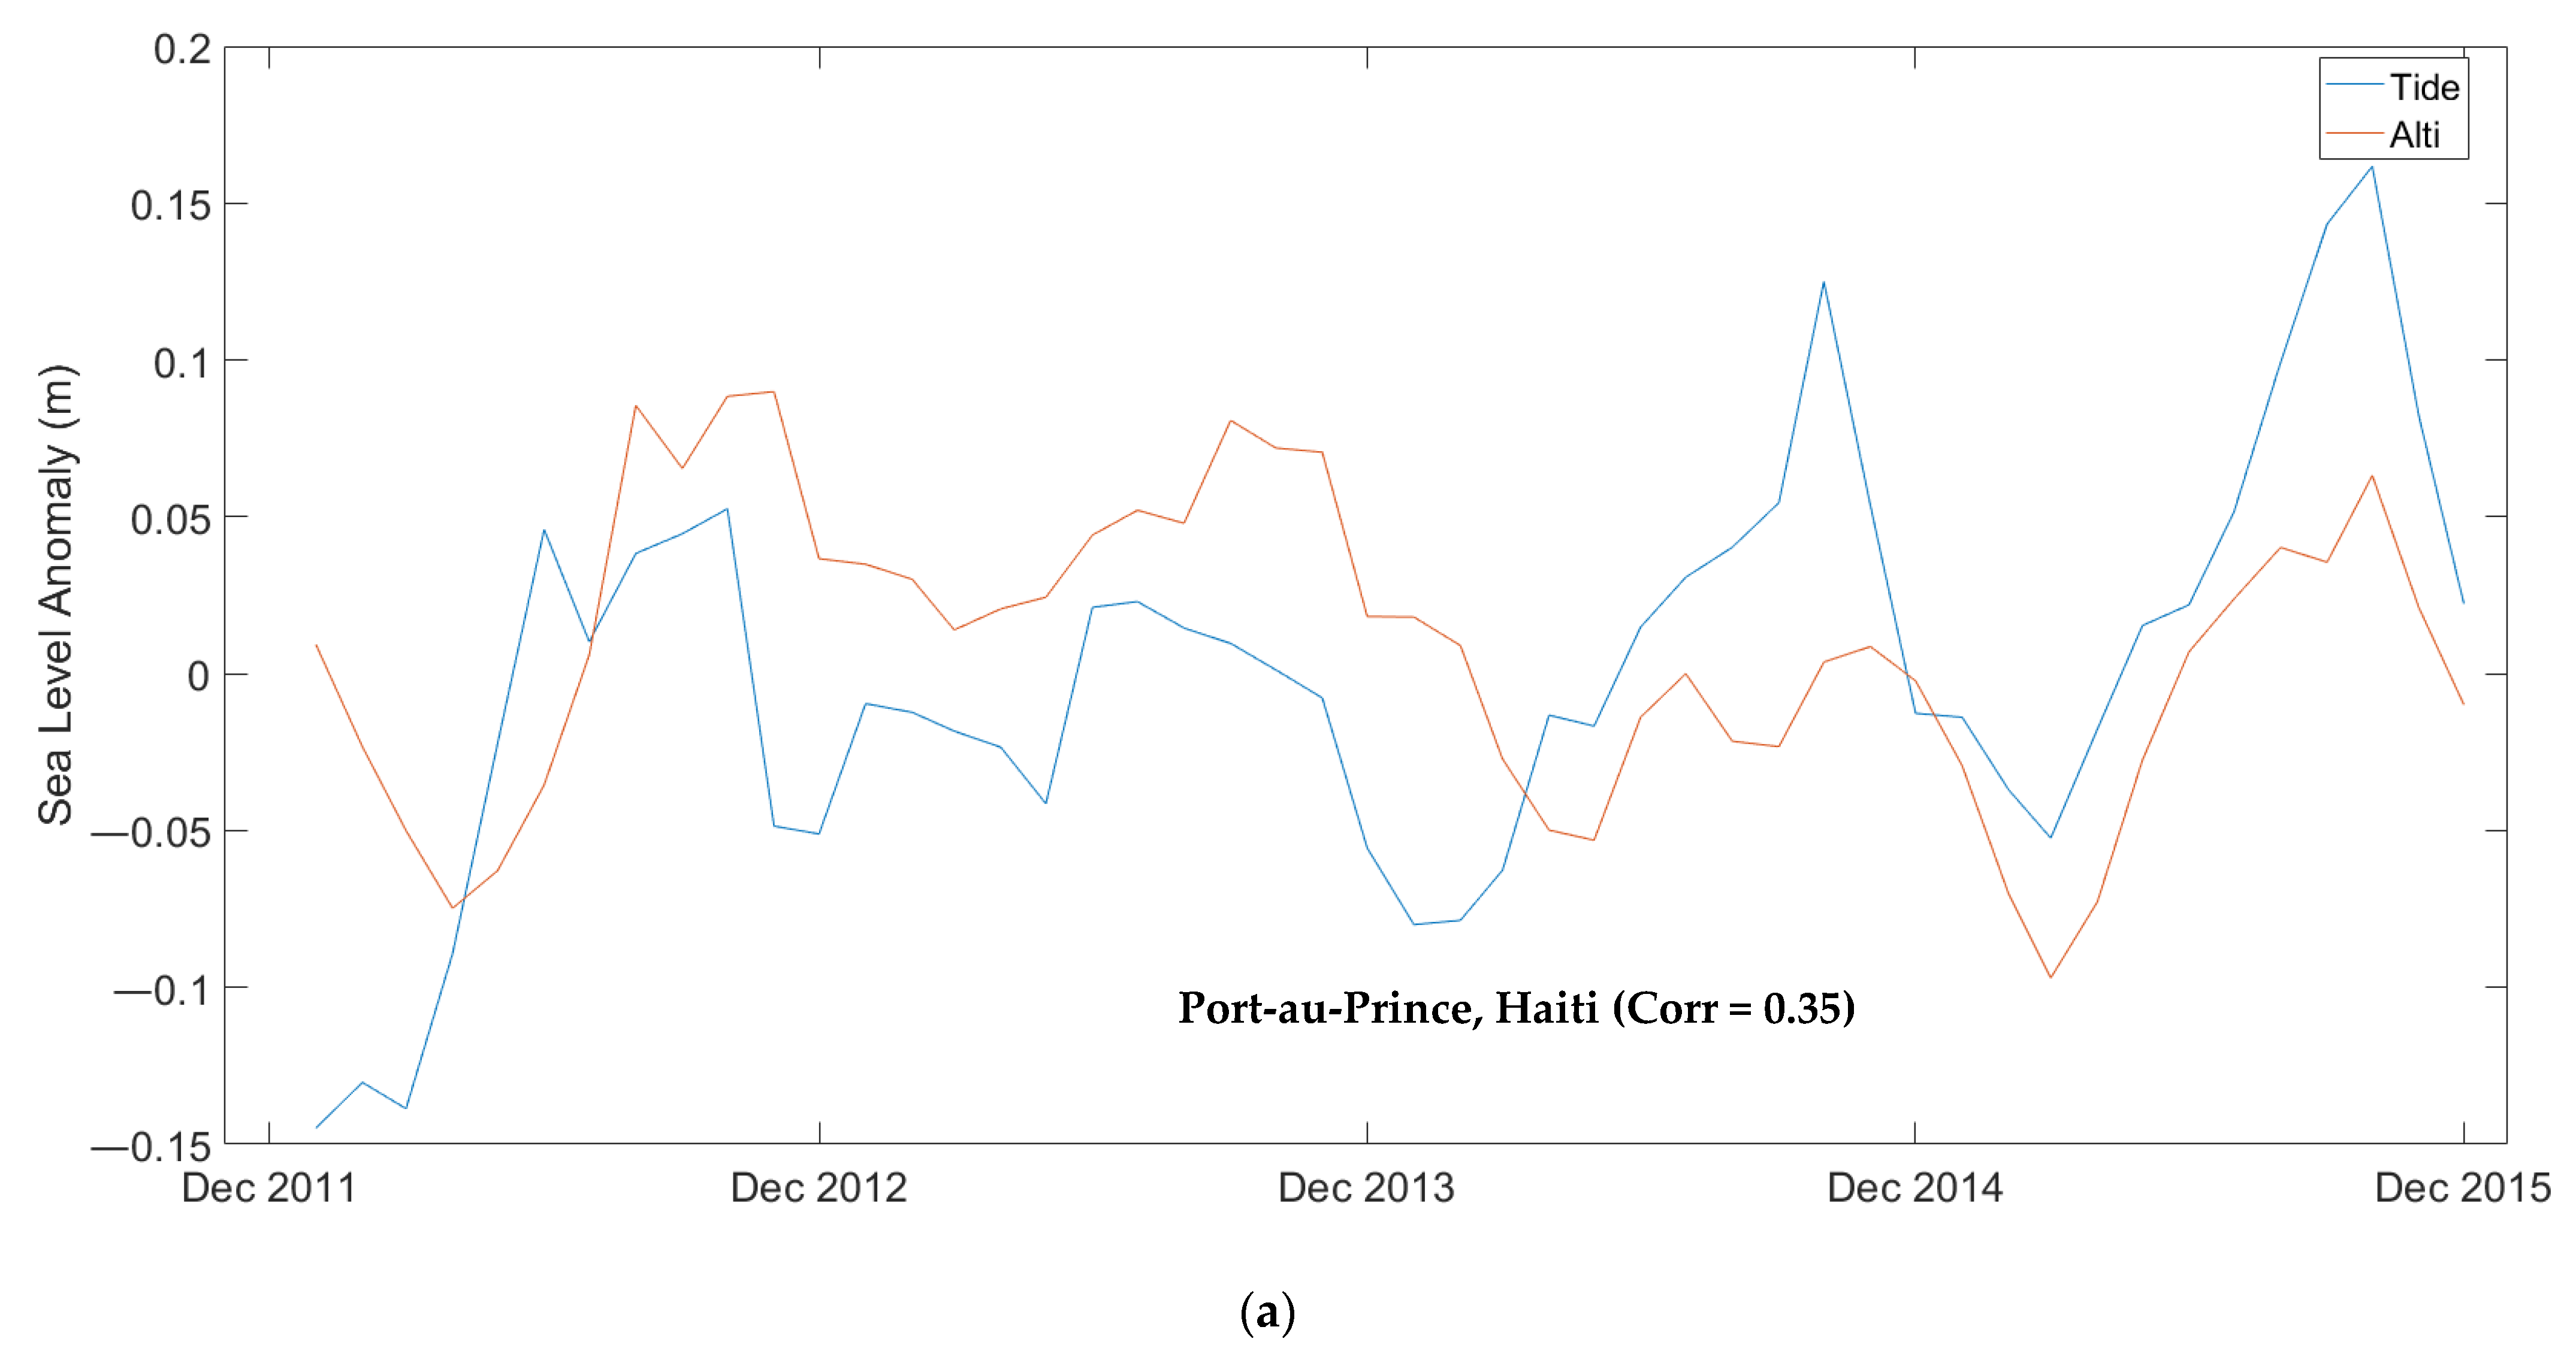
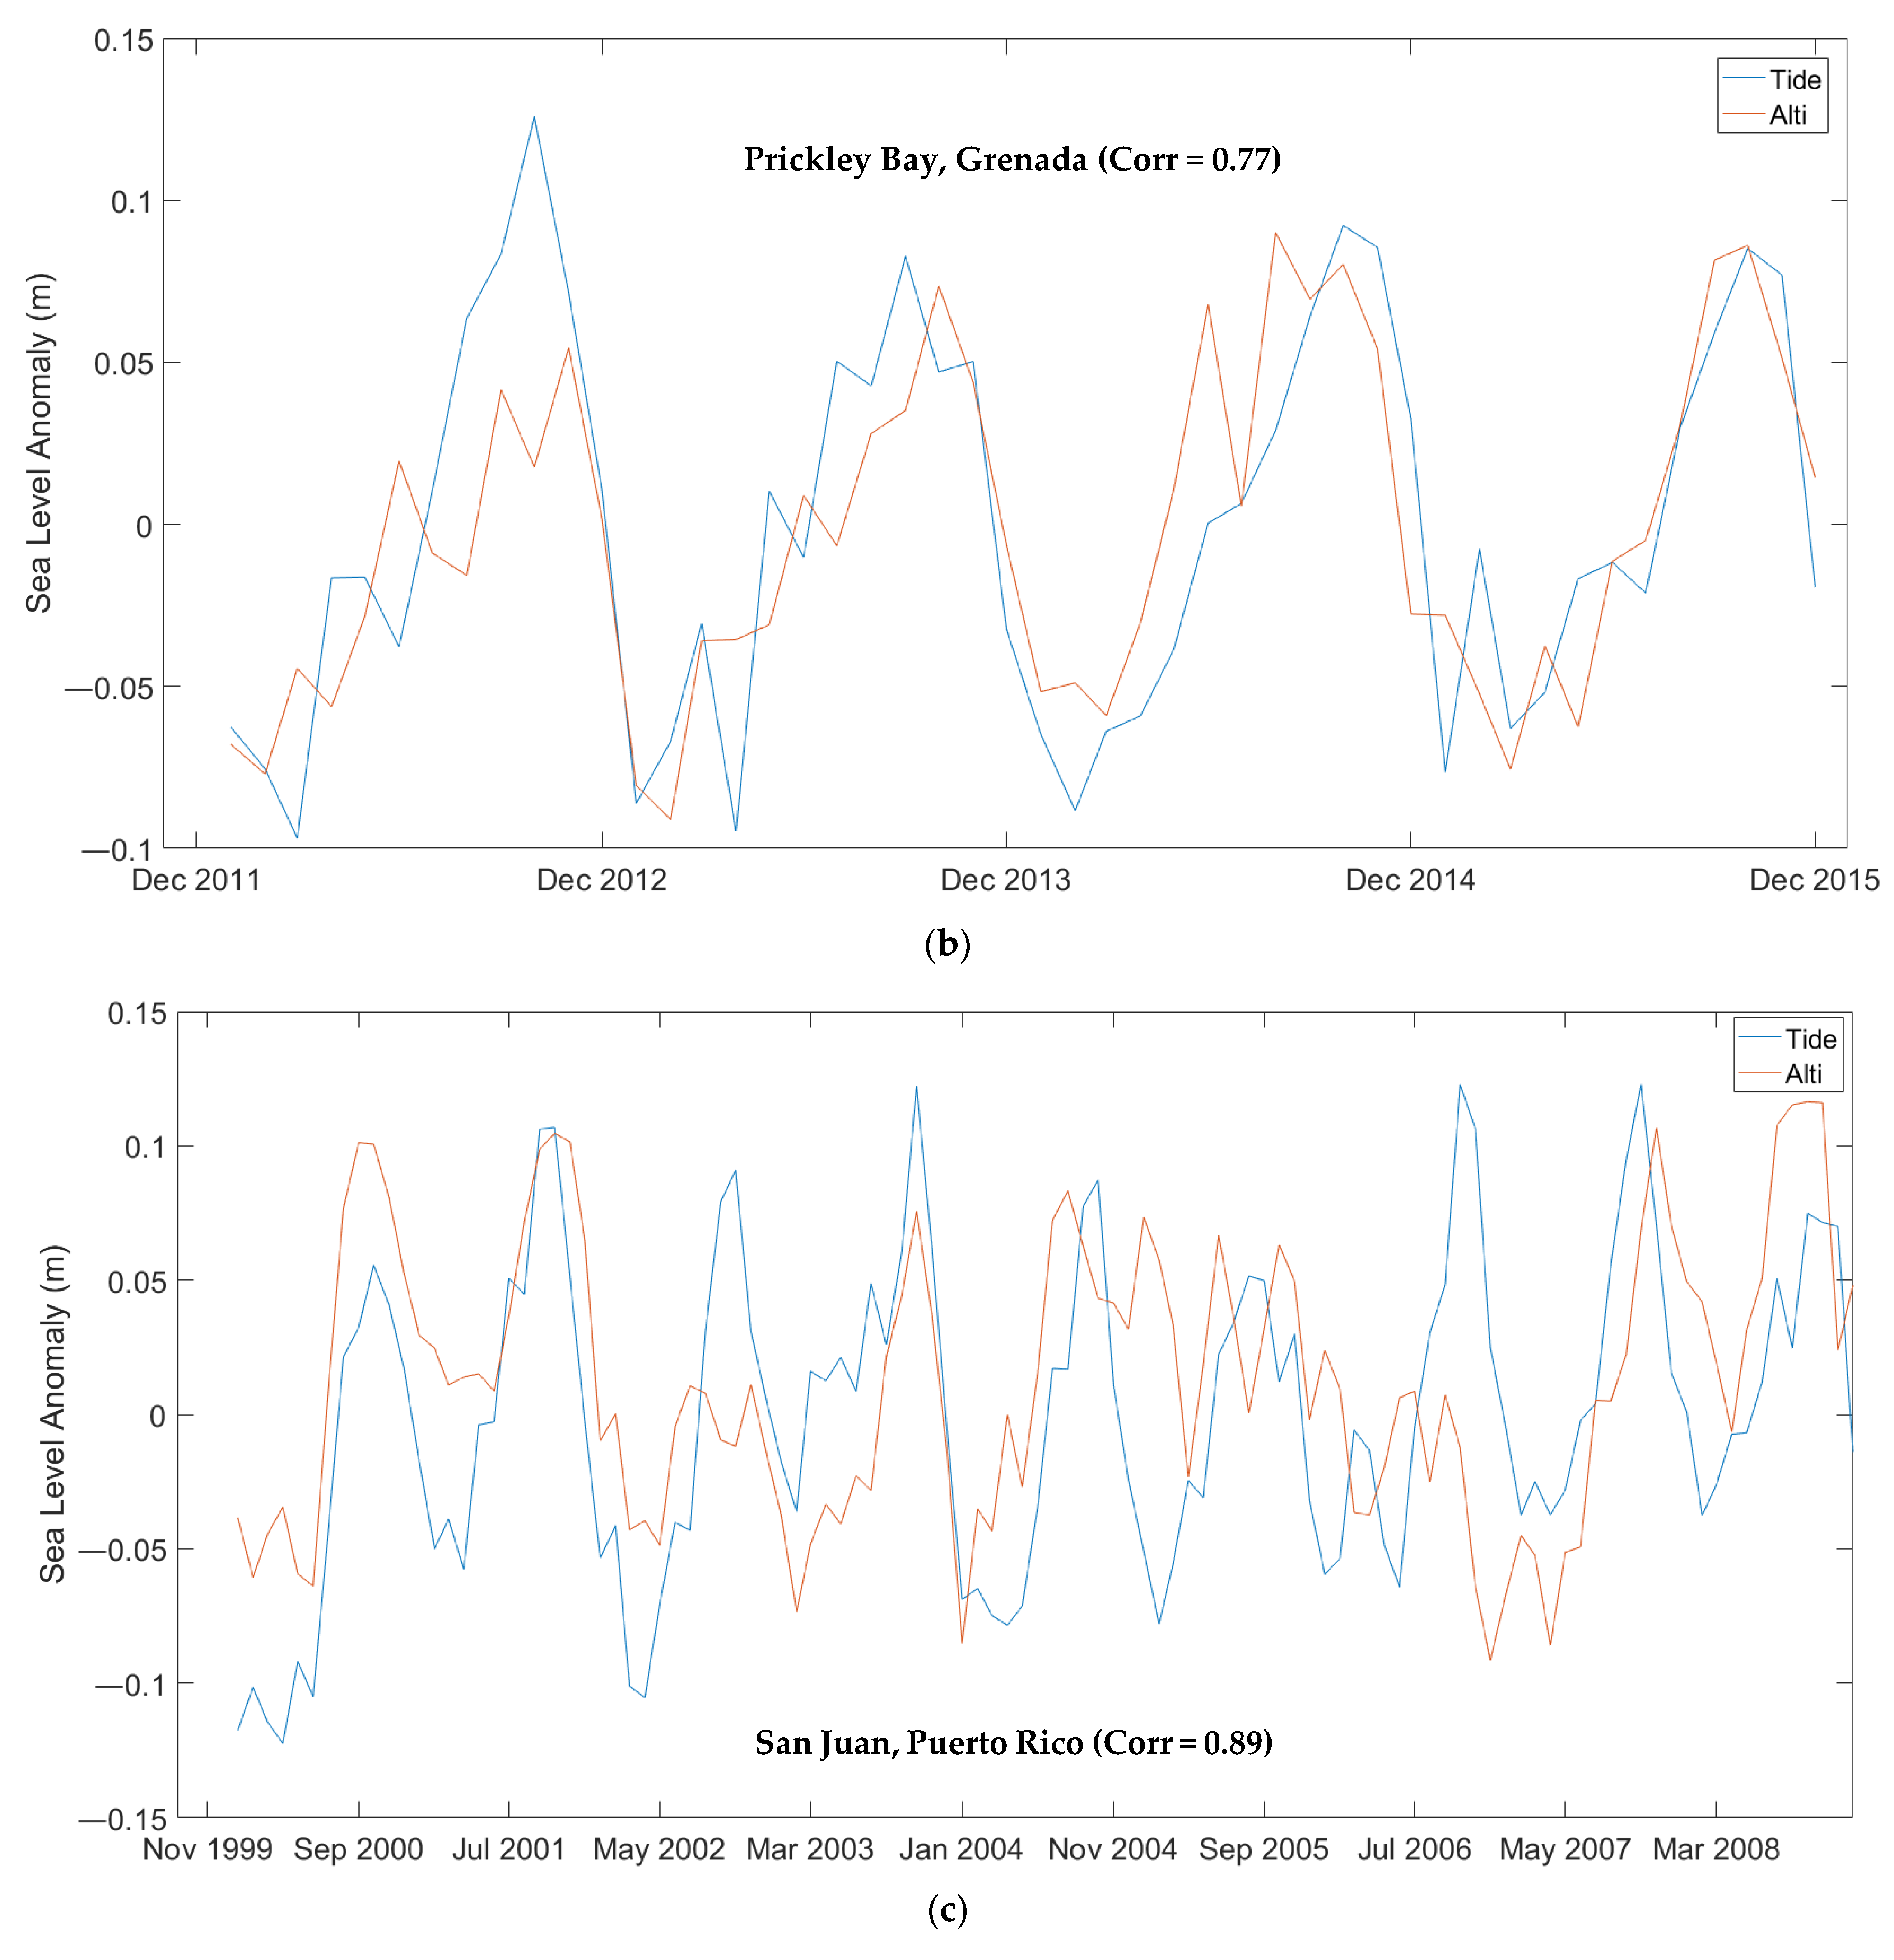
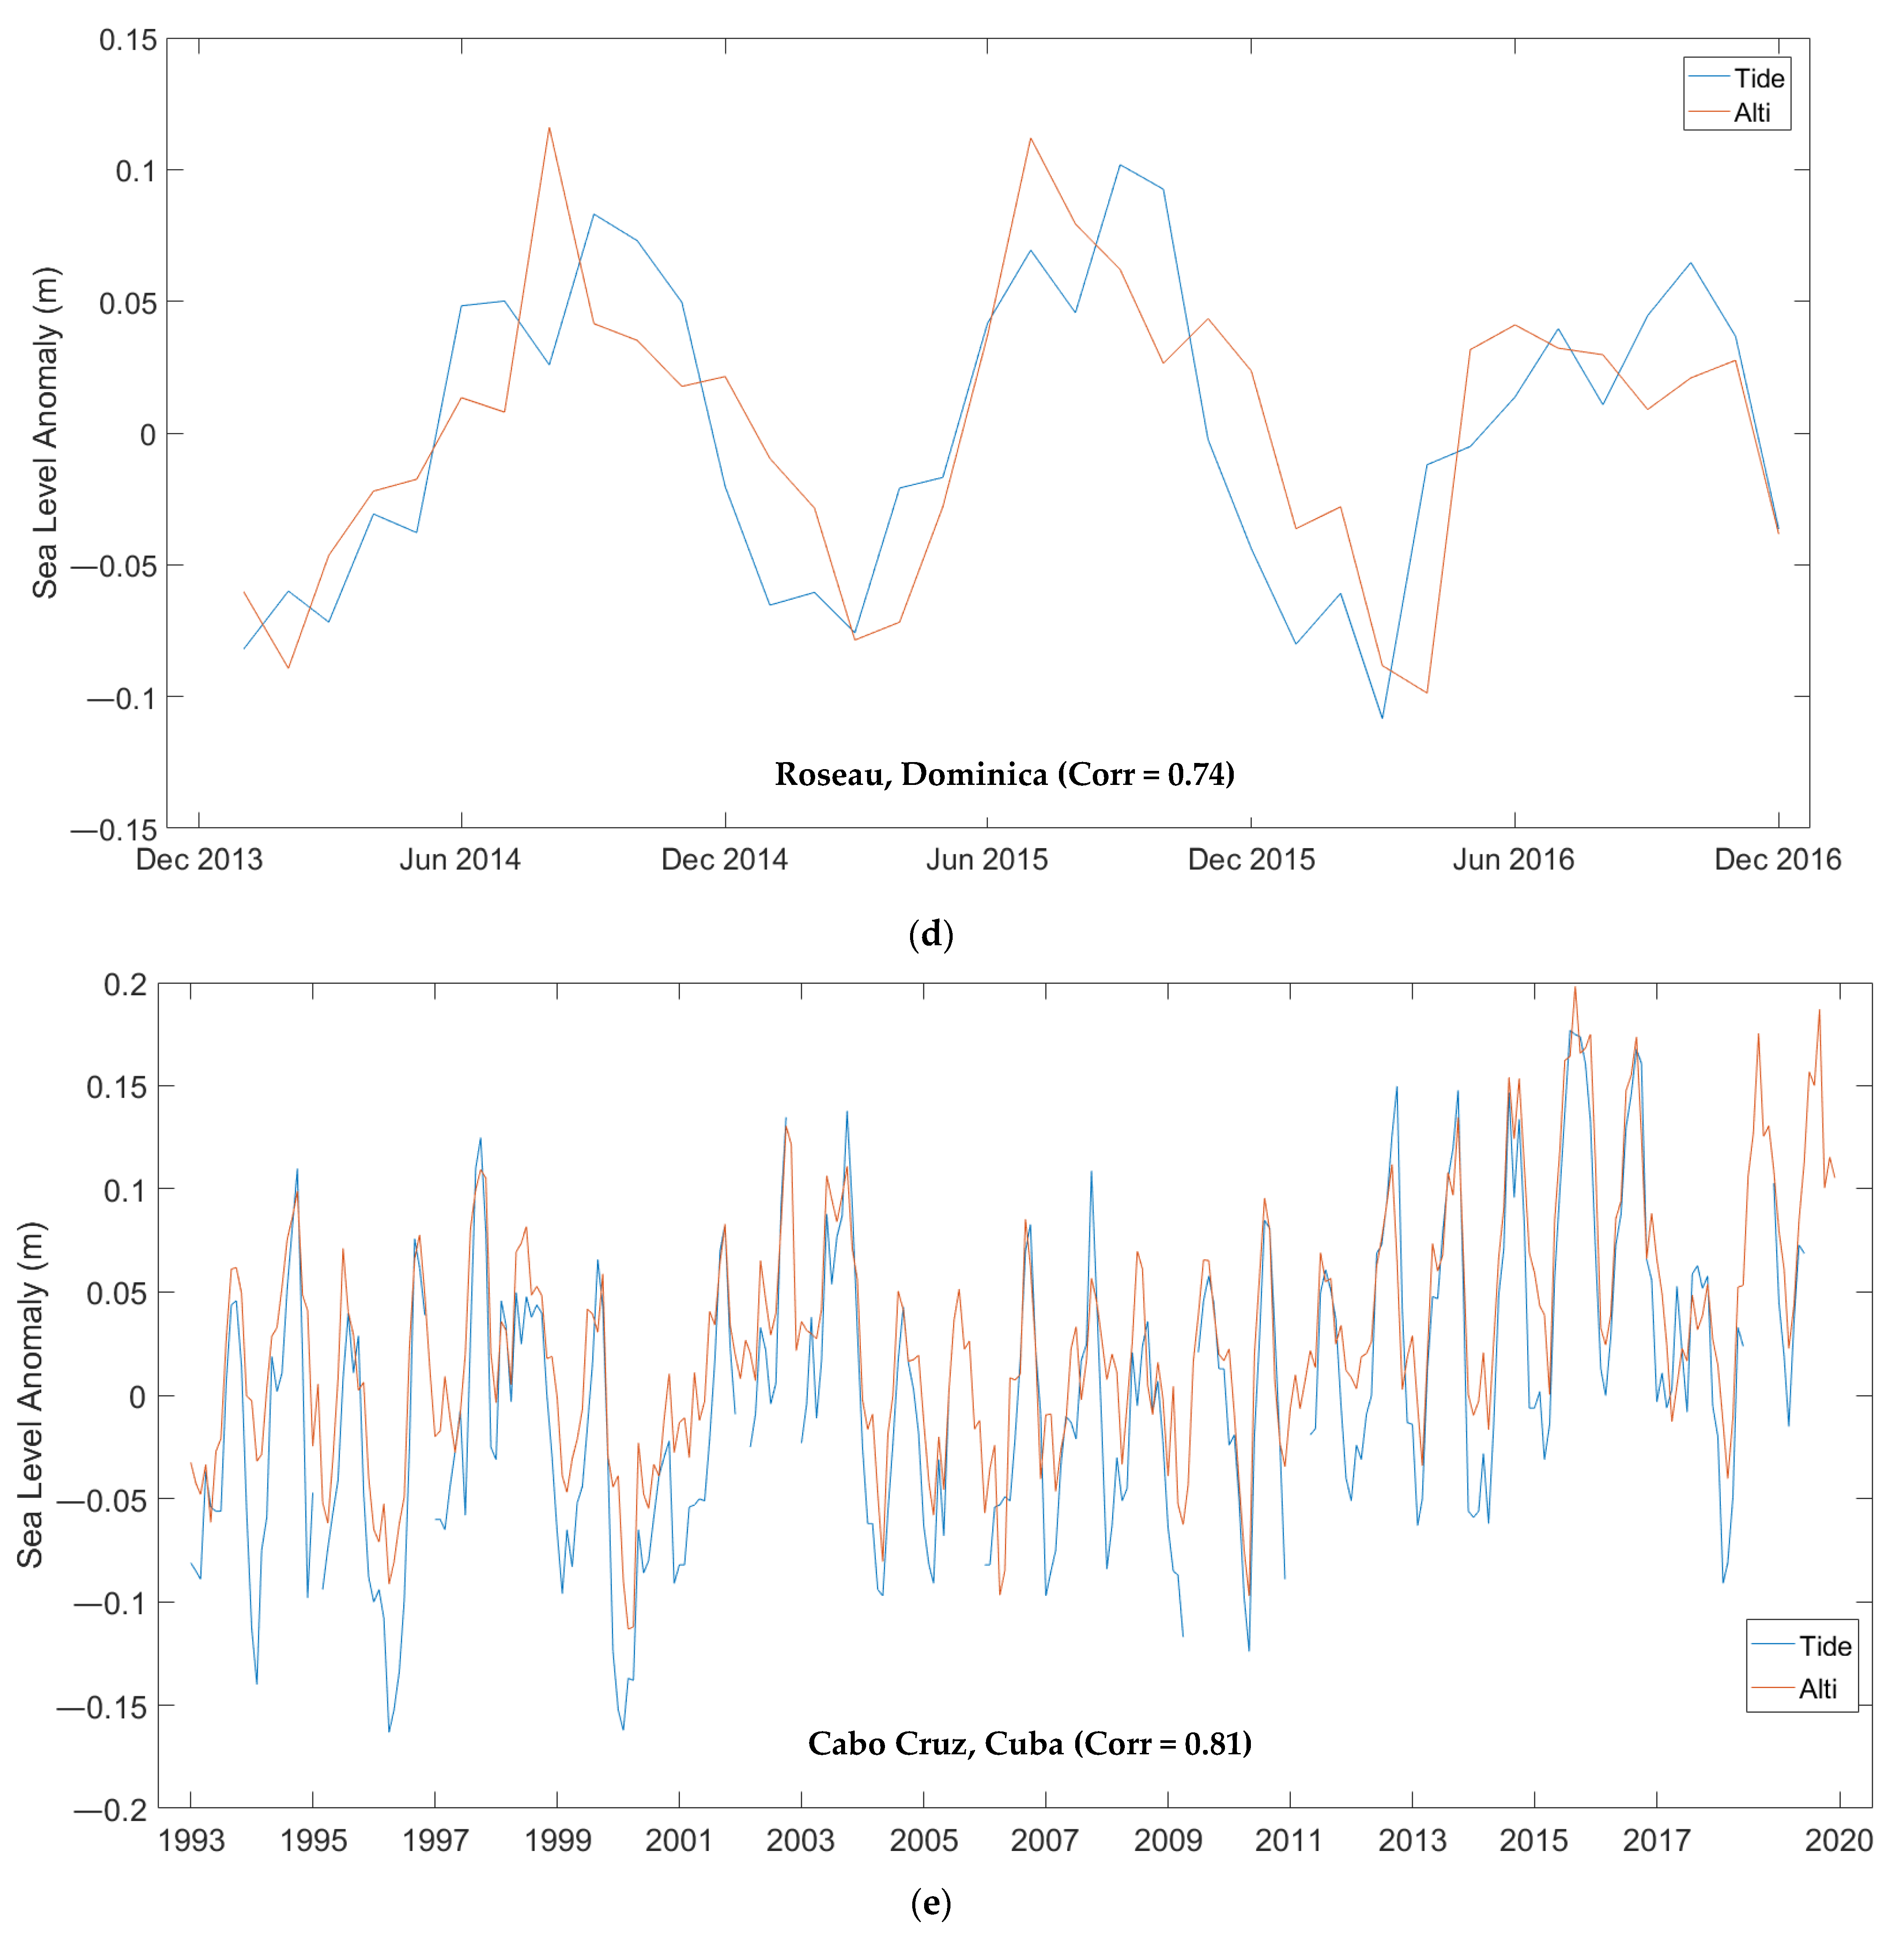
Correlations were calculated between altimetry data, for the grid box over five Caribbean locations (Figure 1) for which local tide gauge records exist, and the gauge records. As already noted, research quality tide gauge data for Jamaica are unavailable for the altimetry era. The five stations were chosen because (i) their data are freely accessible, (ii) they are in countries which share large-scale climate characteristics with Jamaica, and (iii) there was a period of overlap of the record with available altimetry data. Table 2 provides details for the tide gauge stations, the corresponding altimetry grid boxes, and the correlation values. Plots of the altimetry and gauge data for the respective periods of overlap are provided in the Appendix (Figure A1).
Correlations were significant for four of the five stations and exceeded +0.7, ranging from 0.74 in the southeast Caribbean (Dominica) to 0.89 in the north Caribbean (Puerto Rico). The correlation magnitudes are consistent with similar analyses establishing satellite altimetry as viable for use in the Caribbean [16,22]. Jury (2018) [24] suggests that sea) level fluctuation trends may be shared between Jamaica and Puerto Rico, which, in this study, showed the highest correlation between station data and altimetry. For one station (Haiti), the correlation was low (0.35) but still significant. The variation in values across the four stations may be due to a number of factors, including the distance between the altimetry grid points and the tide gauge station, or local considerations such as wave reflection, which may reduce the ability of satellite altimetry to capture small changes in sea level very close to the coast.
Satellite altimetry data for the grid box closest to Kingston, Jamaica (17.875° N, 76.652° W) were extracted and used to investigate sea level change off the south coast of Jamaica.

3.2. Sea Level Characteristics for Jamaica

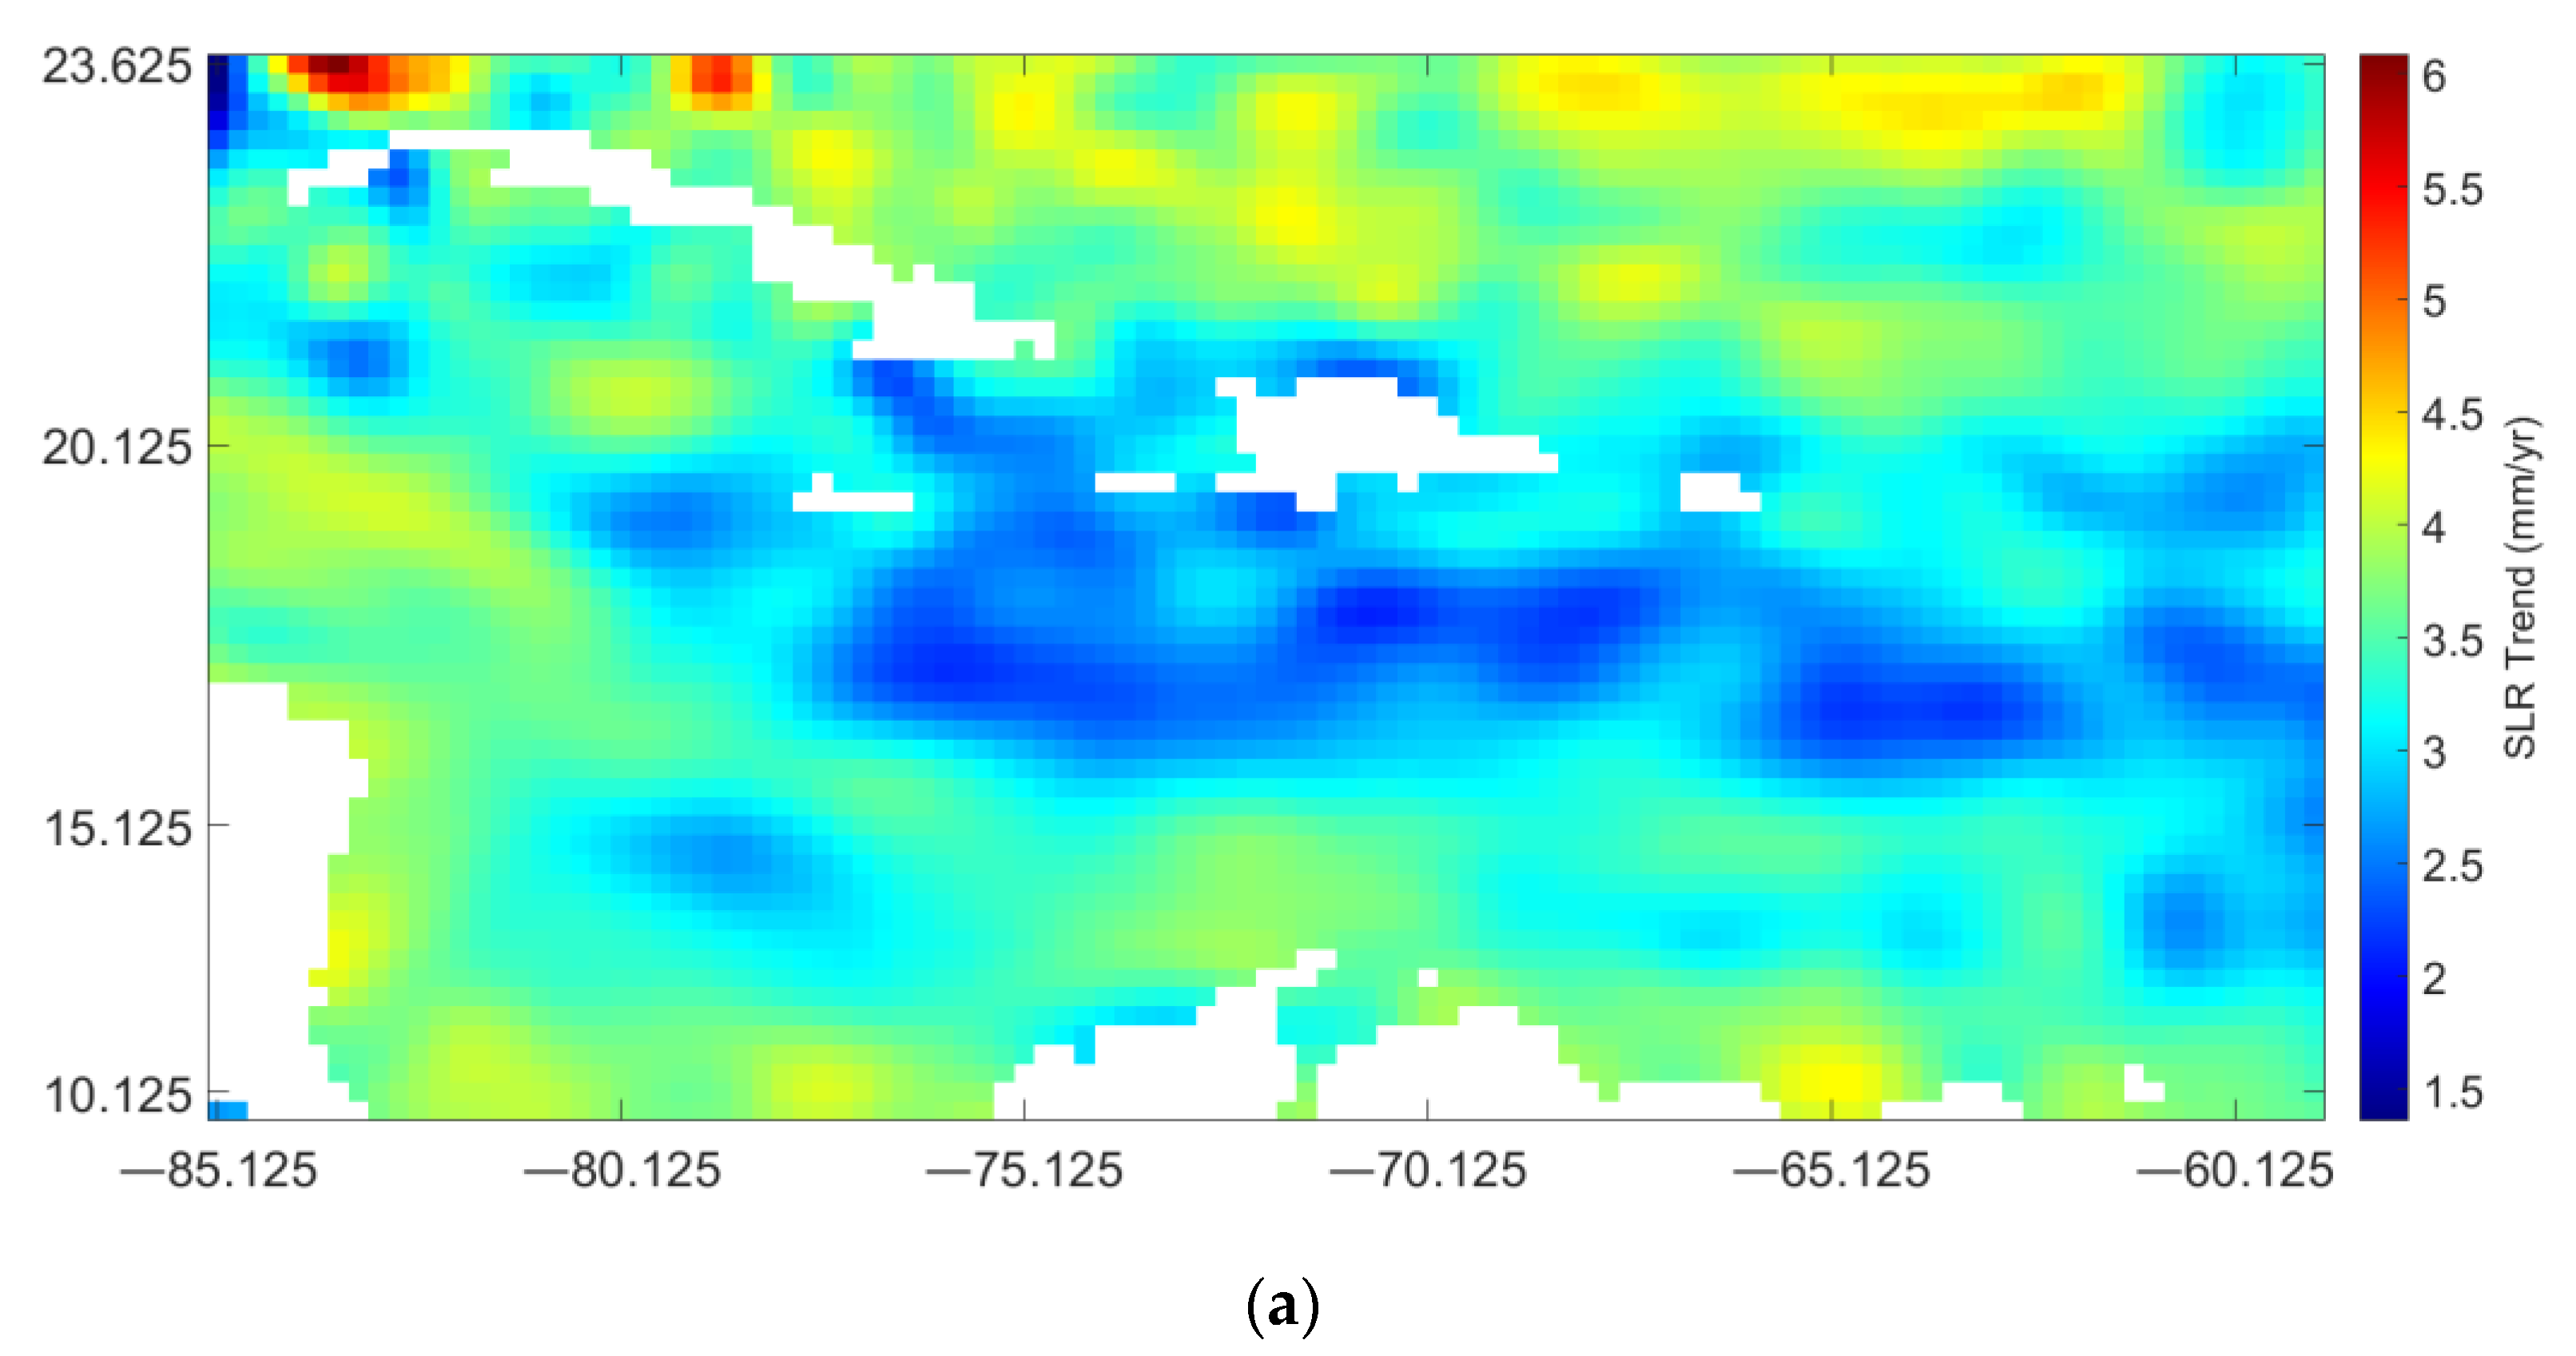
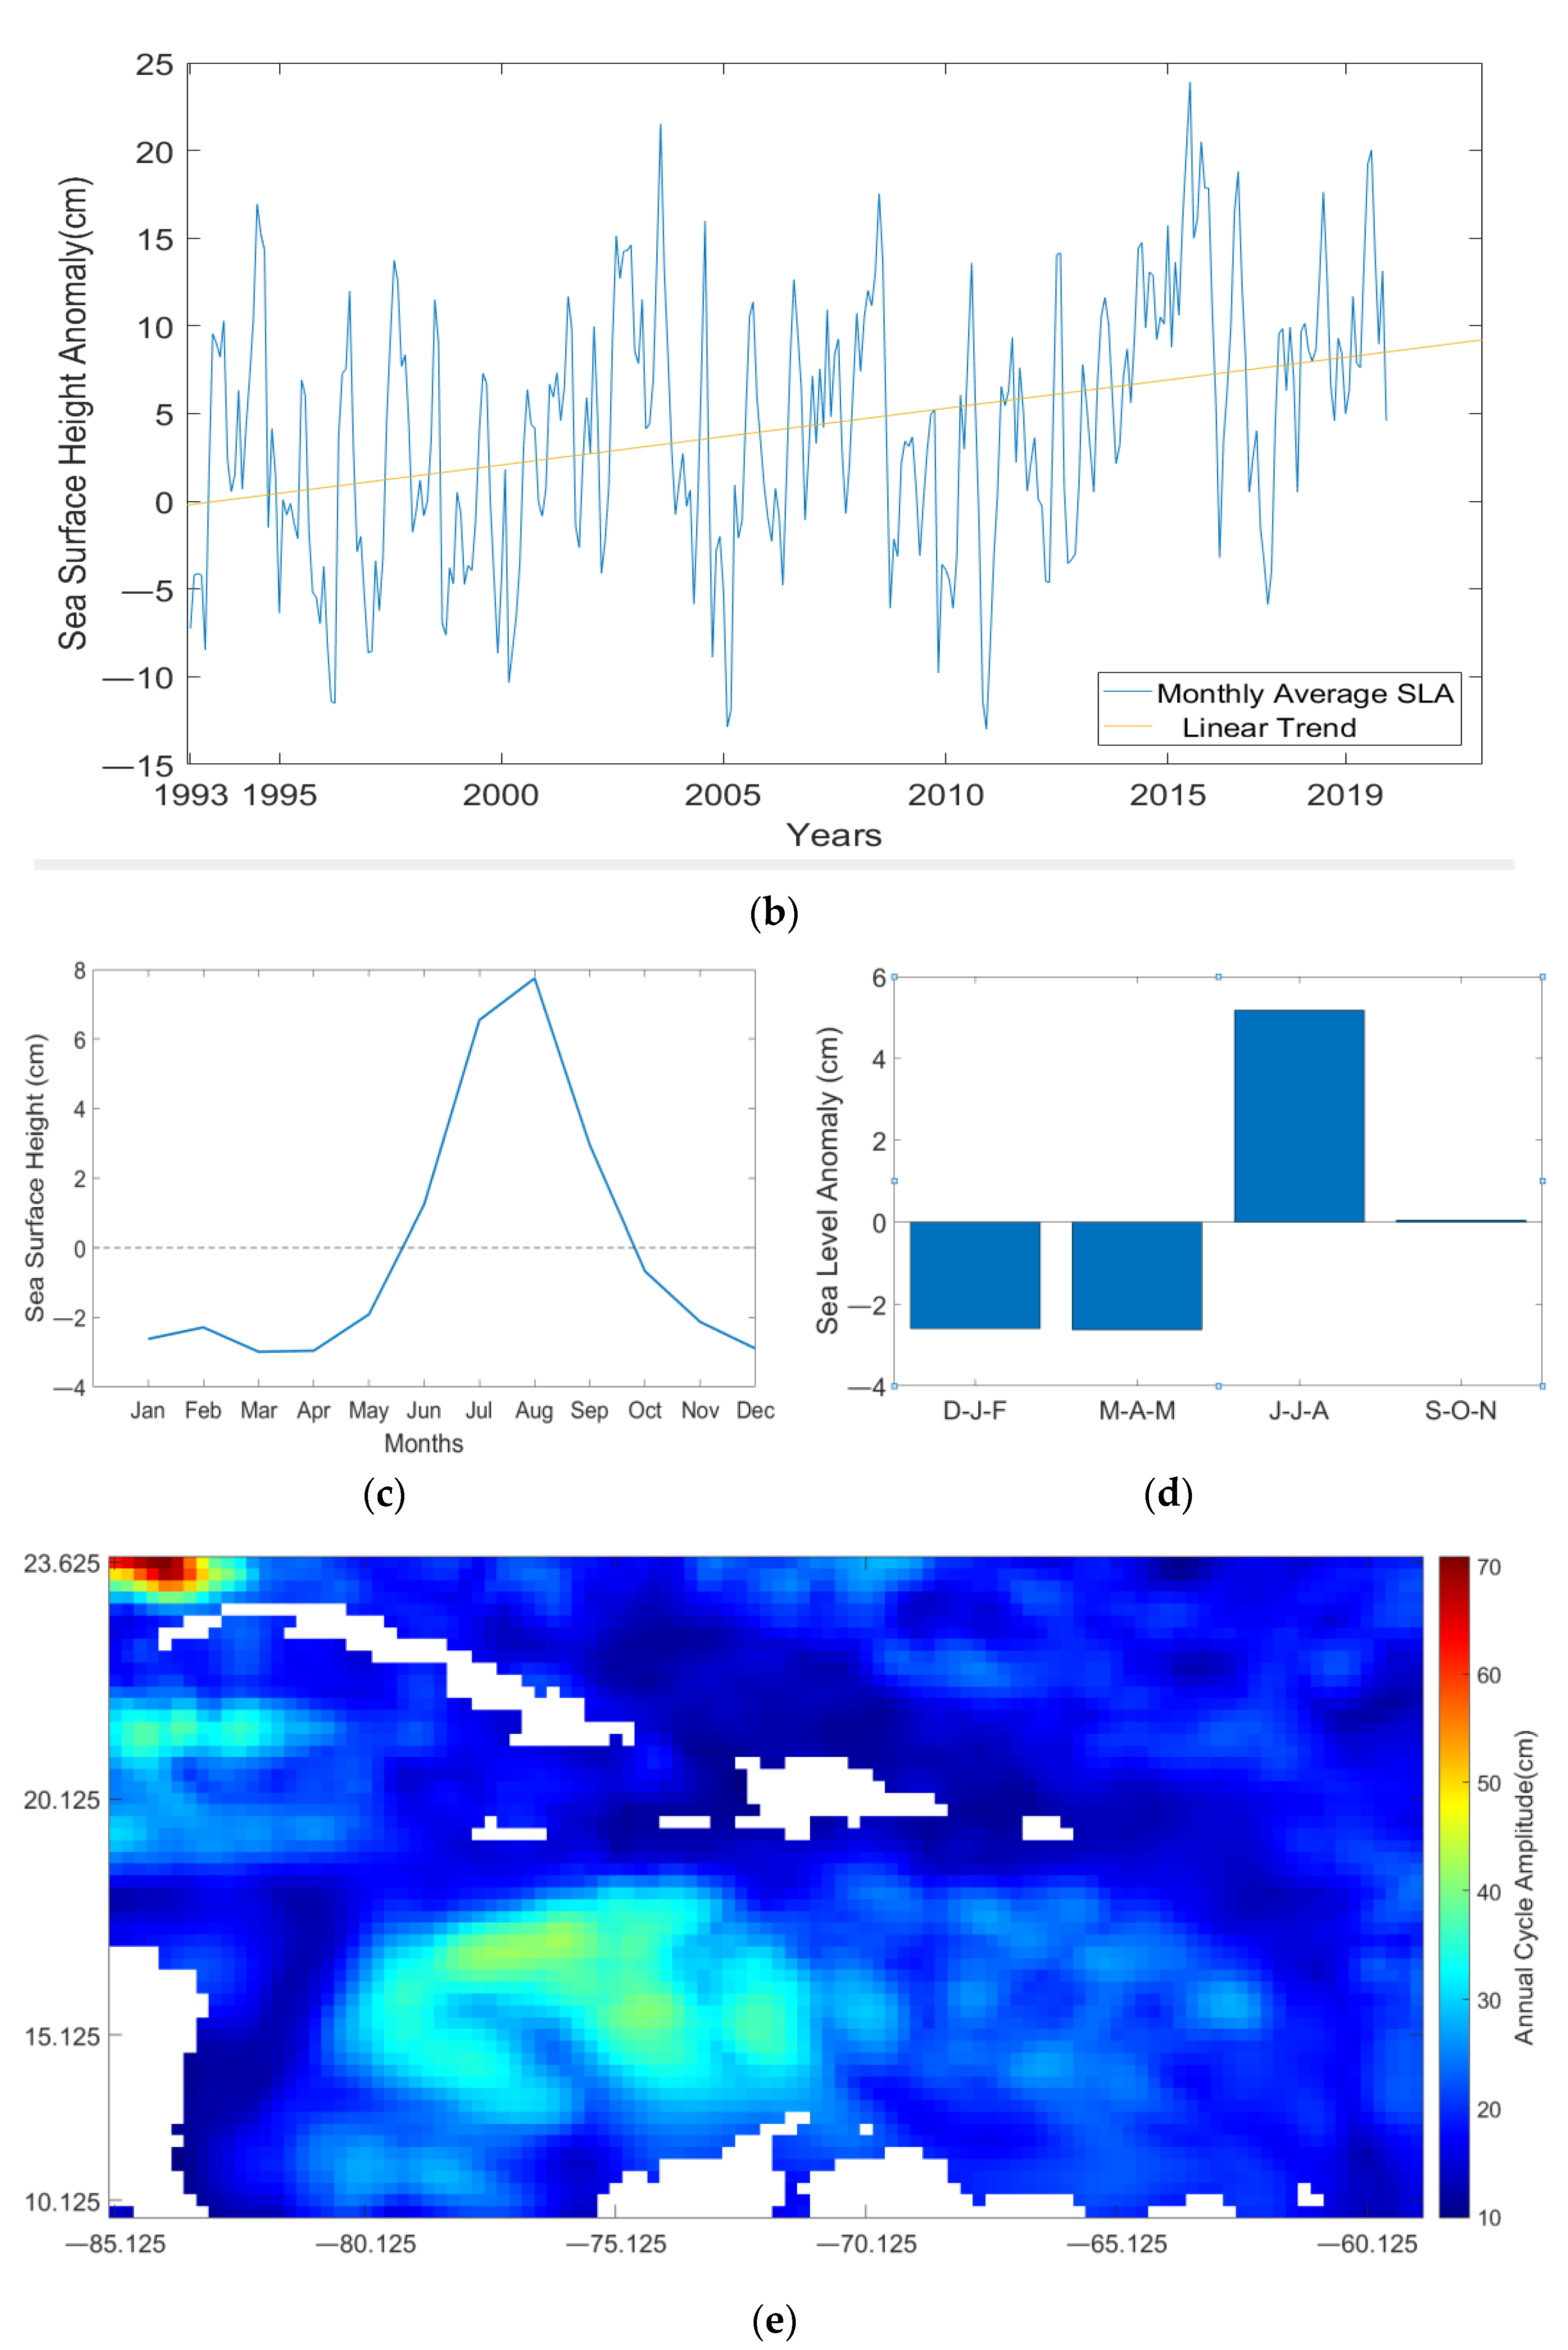
Figure 2a shows that southern Jamaica is located in a region with annual increasing sea level trend of approximately 3.1 mm/year for the 27-year period from 1993 to 2019. The Kingston altimetry data had a linear slope value of +3.2 mm/year (Figure 2b). When the estimate was adjusted for GIA of 0.6 mm/year, instrumental drift of 0.1 mm/year, and after accounting for uncertainties [60], the final rate of rise was estimated as 3.3 ± 0.4 mm/year. This is slightly higher than the global mean SLR estimate of 3.1 ± 0.3 mm/year from 1993 to 2018 [18], but lower than the 3.7 ± 0.5 mm/year reported in the Sixth Assessment Report of the IPCC for 2006 to 2018 [12].
Both the calculated Kingston trend and the regional values shown in Figure 2a are higher than that determined by previous studies utilising altimetry. For example, Palanisamy et al. (2012) [17] determined the basin average sea level rise from altimetry to be ~1.7 ± 0.6 mm/year over the period 1993–2009 and up to 2 mm/year around the Greater Antilles islands of Jamaica and Cayman. Torres and Tsimplis (2013) [23] also estimated the basin average to be ~1.7 mm/year using altimetry data spanning 1993–2010. This suggests an acceleration of sea level rise in the Caribbean including for the seas near Jamaica, driven by changes post-2010. This is also visually evident in Figure 2b. The value of re-examining some of the previous analyses with the extended timeseries is also clear.
Seasonally, southern Jamaican sea levels reach an annual maximum in July–August (Figure 2c). Ref. [21] also identified a summer peak for the wider Caribbean basin using altimetry data from 1993 to 2010. Figure 2c supports the findings of [61] with respect to seasonal variation but for a longer 27-years altimetry timeseries. The annual cycle is attributed to the steric response of the Caribbean Sea to heat fluxes at the surface as it warms and cools throughout the year [20,21]. The July–August peak also coincides with the summer intensification of the CLLJ and the northward movement of the Intertropical Convergence Zone (ITCZ). The ITCZ moves southwards in the winter, when sea level anomalies are negative, and northwards in the summer, when sea level anomalies are positive [20]. The summer sea level peak also falls within the north tropical Atlantic hurricane season (June–November), which peaks in August–September [67].
With respect to an annual mean, the climatology of Jamaican sea level is characterized by largest negative anomalies for the three-month season March through May (Figure 2d). There is a positive summer season phase (June through August) when sea levels are higher by 7 cm or more than at the start of the year. The mean annual amplitude in the annual cycle around Jamaica (and for much of the eastern island chain) is ~10 cm (Figure 2e). Highest amplitudes in the main Caribbean basin occur south of Jamaica and coincide with the CLLJ region.

3.3. Variability and Drivers

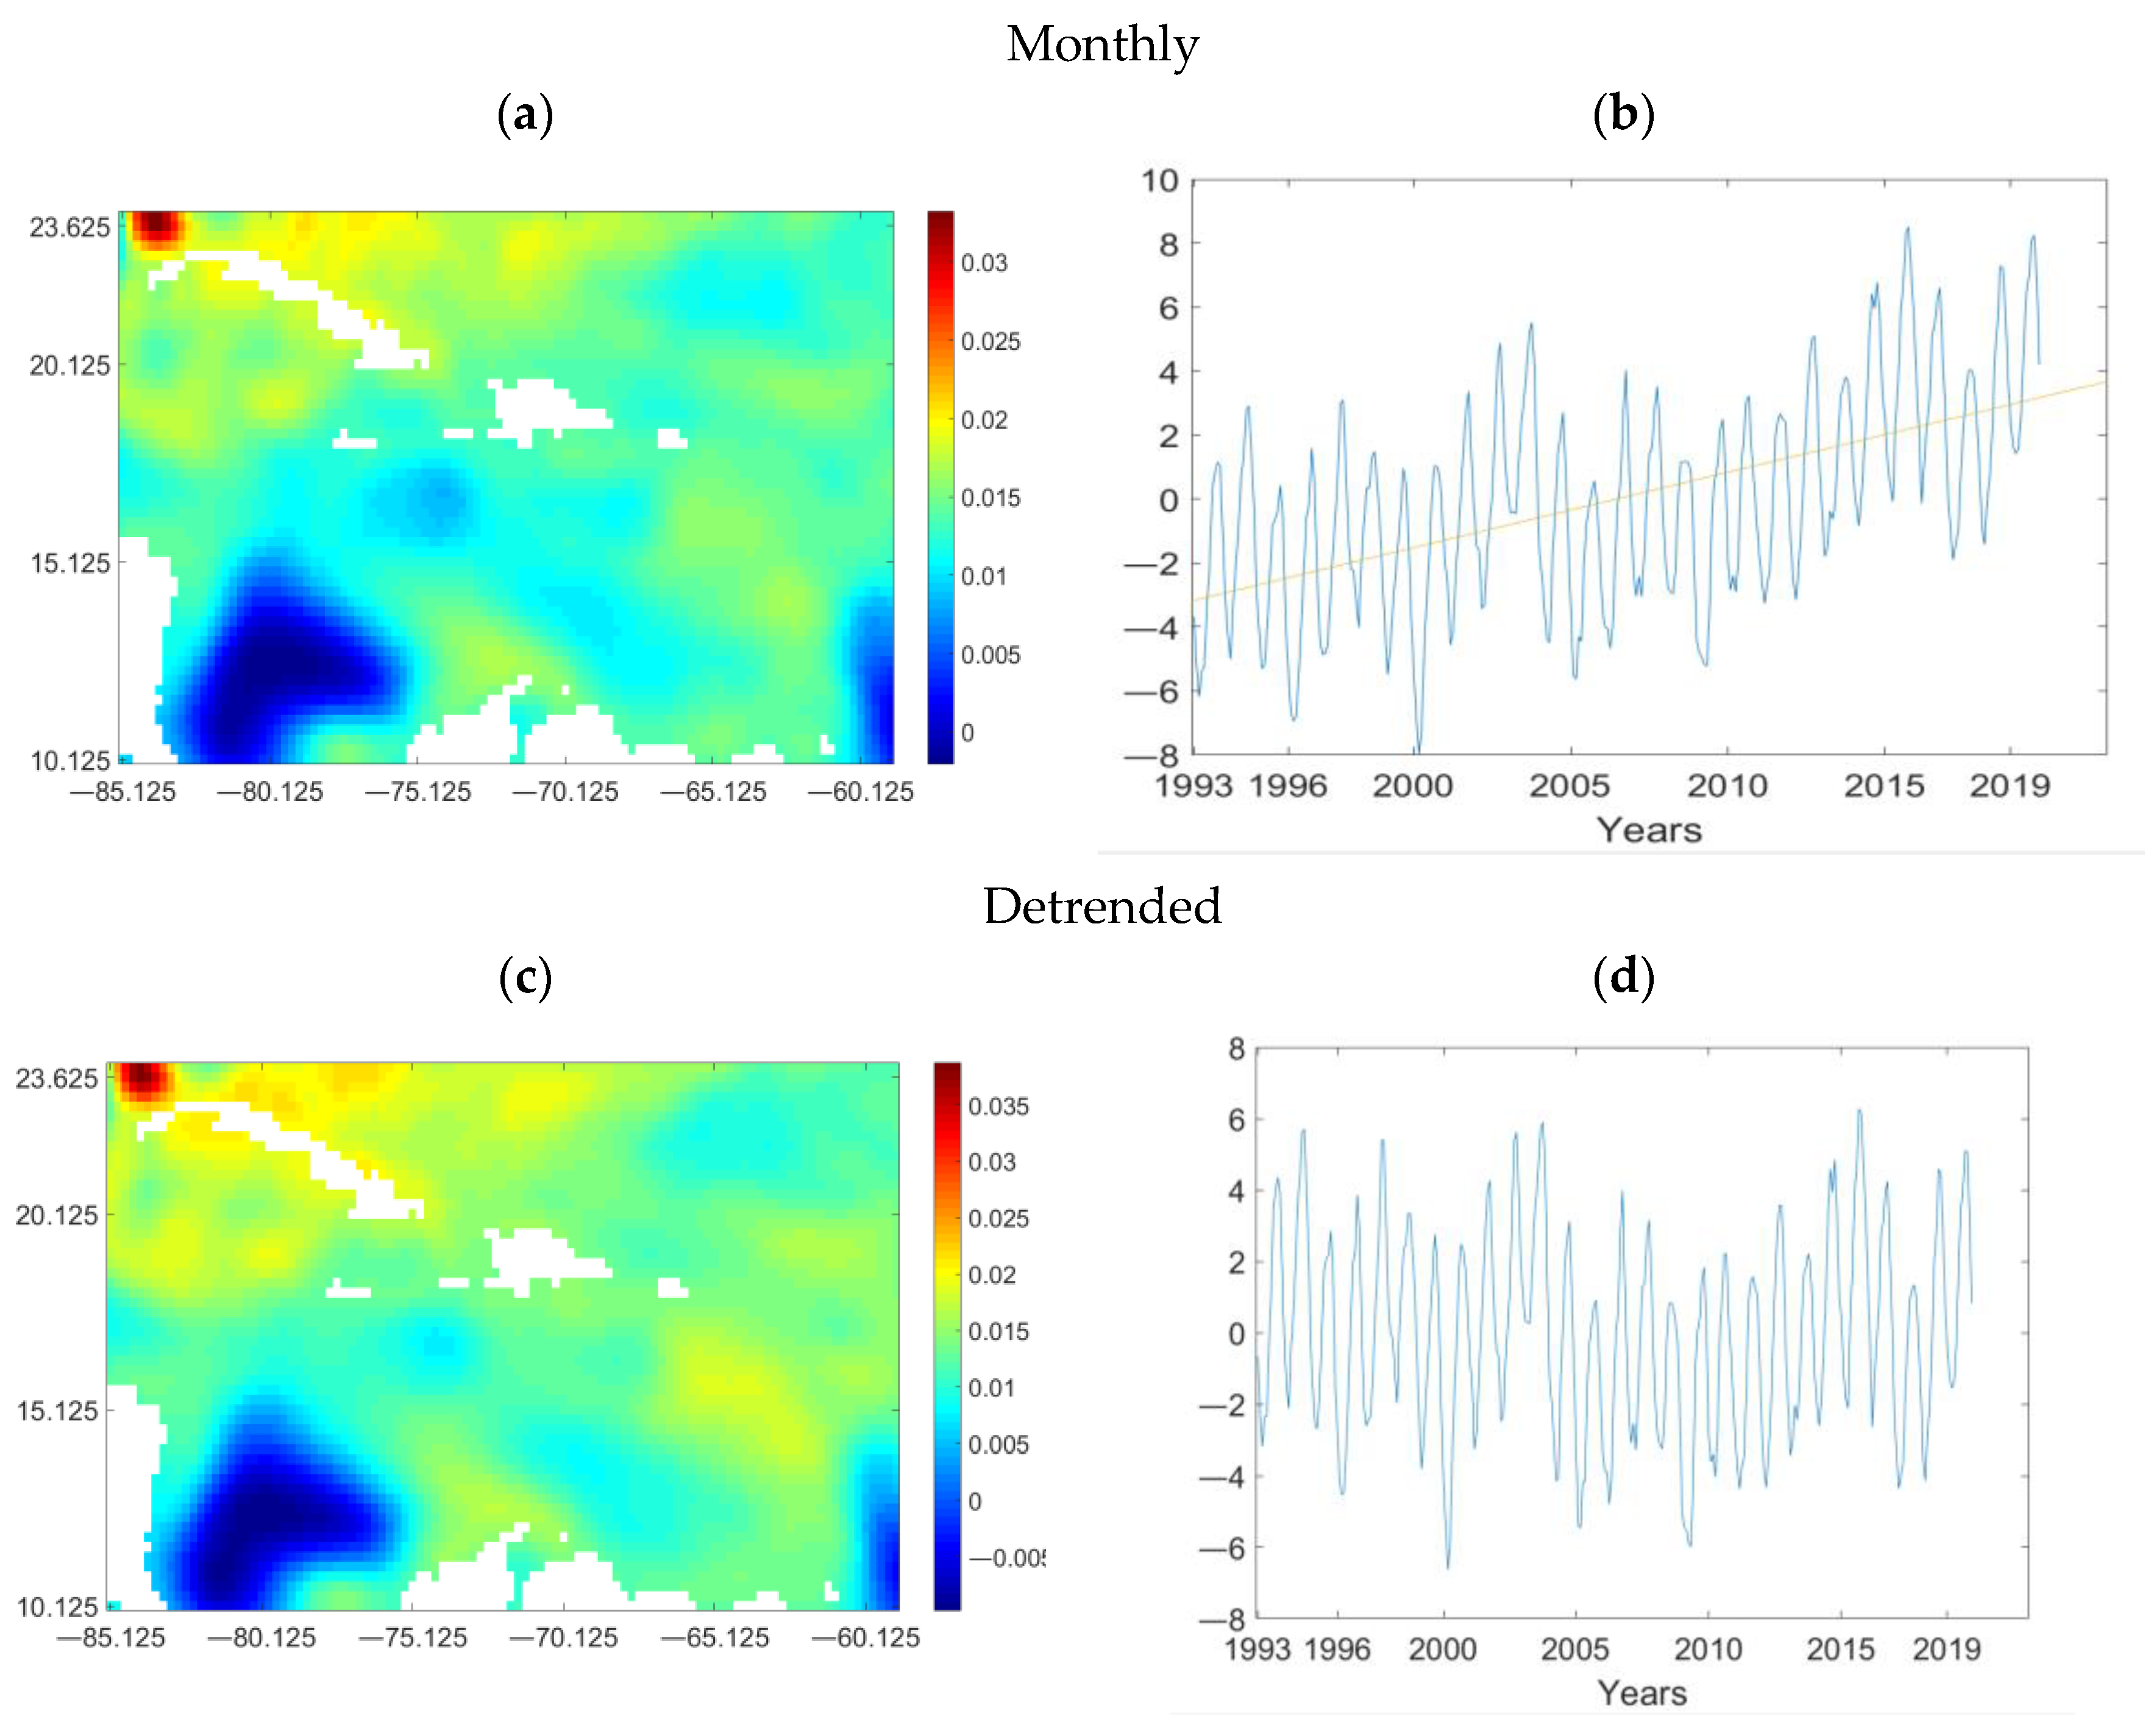
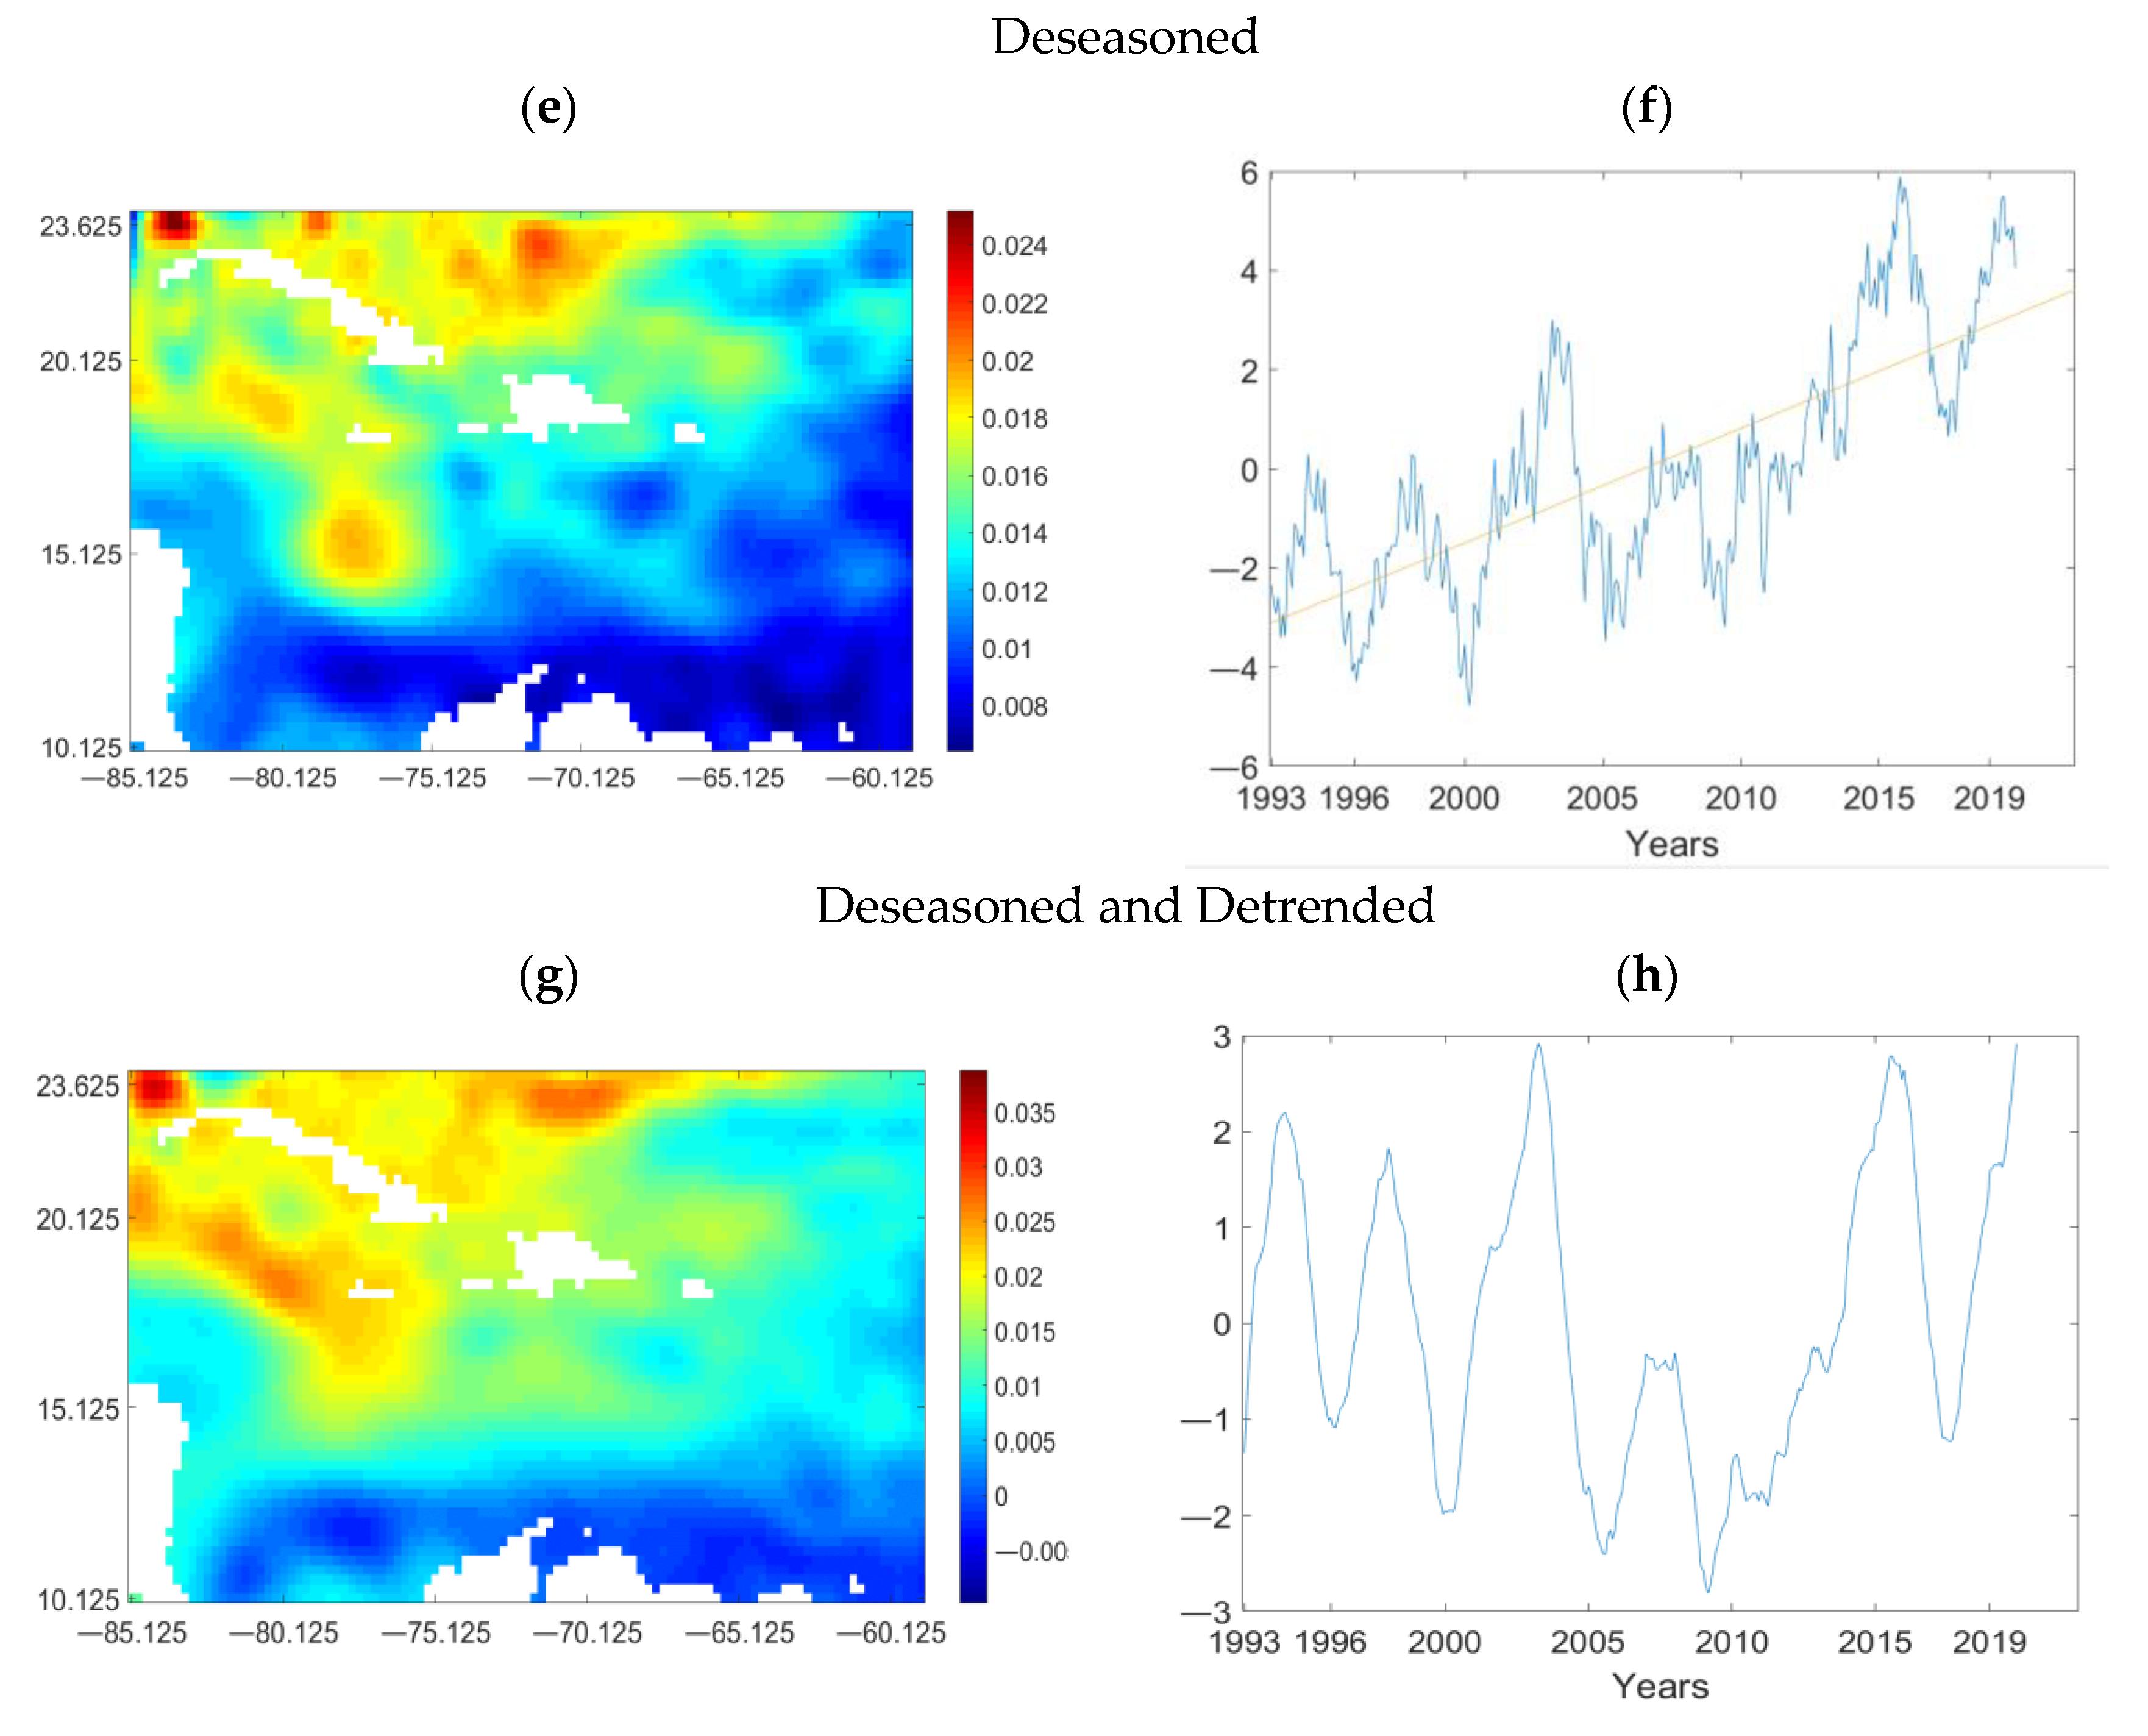
EOFs are used to explore timescales and drivers of variability of sea heights in the Caribbean basin where Jamaica is located. As previously noted, EOF analysis was performed (i) on the raw data, (ii) with the linear trend removed (detrended), (iii) with the seasonal cycle removed (deseasoned), and (iv) the detrended, deseasoned and smoothed data. The variance explained by the first three principal components in each case (PC1, PC2, and PC3) are shown in Table 3. The spatial loadings and corresponding timeseries for the first principal components for each case (referred to respectively as PC1_raw, PC1_detrended, PC1_deseasoned, and PC1_des_det) are shown in Figure 3. The calculated correlations between the PC1 and PC2 timeseries and the 10 indices listed in Table 2 are shown in Table 4.

3.3.1. EOF Analysis of the Raw Versus Detrended Data

The first three PCs of the raw data explain approximately half (49%) of the variance. PC1_raw accounts for 36% of the variance and shows a distinct annual cycle peaking in August each year, superimposed on an upward linear trend (Figure 3b). The annual cycle is the dominant mode of variability in the Caribbean sea level record. When interannual variability in the annual amplitude is also considered, the upward linear trend is, for at least one year, close to the end of the record (e.g., 2015) when sea levels at their lowest in the annual cycle are comparable to or higher than the annual sea level maxima attained in the early record (e.g., 1995). (This also supports the idea of an accelerated rate of rise in the most recent decade represented in the data.) One implication of this is that, at the present rate of rise, the threat that arises from higher sea levels is becoming an all-year risk. When the linear trend is removed from the raw data, the first three PCs explain approximately 44% of the variance, with PC1_detrended accounting for nearly 30%. The timeseries for PC1_detrended is again dominated by the annual cycle with, however, the interannual variations in amplitude being more pronounced (Figure 3d).
The spatial loadings for PC1_raw and PC1_detrended are almost identical (Figure 3a,c). This is due to the dominance of the annual cycle in both analyses. The spatial patterns show high values along the northern coast of South America; smaller but similarly signed loadings going northward from the Caribbean coast of South America over the Caribbean Sea and up to 17° N (the south coast of Jamaica); a maximum in the southwestern Caribbean between 10° N and 15° N and 80° W to 85° W; and high loadings in the northwest corner of the domain (Cayman Sea and toward the Gulf of Mexico). Figure 3a,c mirror the mean spatial variation of sea level across the Caribbean from dominant sea level forcing parameters with annual frequencies e.g., see Figure 1 of [17] or Figure 3a [21]. For example, higher sea levels just north of South America and in the southwest of the domain are associated with the Panama–Colombia Gyre, as well as the Caribbean Current [23]. The Caribbean Current transports significant volumes of water from the South Atlantic to join the Florida Current and, eventually, the Gulf Stream [34]. These southern Caribbean ocean circulatory features are largely wind driven, with annual variation in the strength of easterlies, which parallel the north coast of the south Caribbean, playing strong modulating roles [17,21].
The largest significant correlations for PC1_raw are with north Atlantic SST indices (Table 4a). These include +0.46 with Carib SST, +0.38 with the AMO, and −0.55 with the Pac–Atl gradient index, which includes north tropical Atlantic SSTs in its calculation. Sea level pressure in the vicinity of Jamaica also has a significant correlation (−0.4), and there are smaller significant correlations with the NINO3 (+0.22) and NINO3.4 (+0.25) regions. The north Atlantic SST associations likely derive from long term decadal trends which are common to both timeseries. SSTs in the tropical north Atlantic become much warmer after 1995 [68,69], with the linear rise evident across all seasons, ranging from 0.1 °C/decade in spring to 0.2 °C/decade in winter and summer [69]. Warm Caribbean SSTs also associate with lower sea level pressures [70], and El Niño events influence the warm SST peaks observed in the trend [69,71]. Caribbean SSTs seemingly play a significant role in regional sea level variability, especially in the long term. The steric response of the surface layers of the Caribbean Sea to changes in atmospheric heat fluxes has been highlighted as a major reason for variability in sea levels by [20]. This suggests that continued ocean warming because of climate change will result in increasing sea levels in the Caribbean.
Correlations with Carib SST and the AMO are smaller but still significant for PC1_detrended (+0.18 and +0.23 respectively) in comparison to PC1_raw. This reinforces the idea of the long-term trends in north Atlantic SSTs being a significant background factor. The PC1_detrended correlations are, however, higher (than for PC1_raw) for both Pac–Atl and sea level pressure (−0.61 and −0.46 respectively) and comparable for NINO3 and NINO3.4 (+0.2 and +0.25 respectively). The annual cycle of the interbasin SST gradient associates with climatological variation in both Caribbean basin sea level pressures and surface wind strengths through changes in large scale circulation features in the Caribbean [66]. A significant correlation, albeit small (−0.18), exists between PC1_detrended and the CLLJ index.
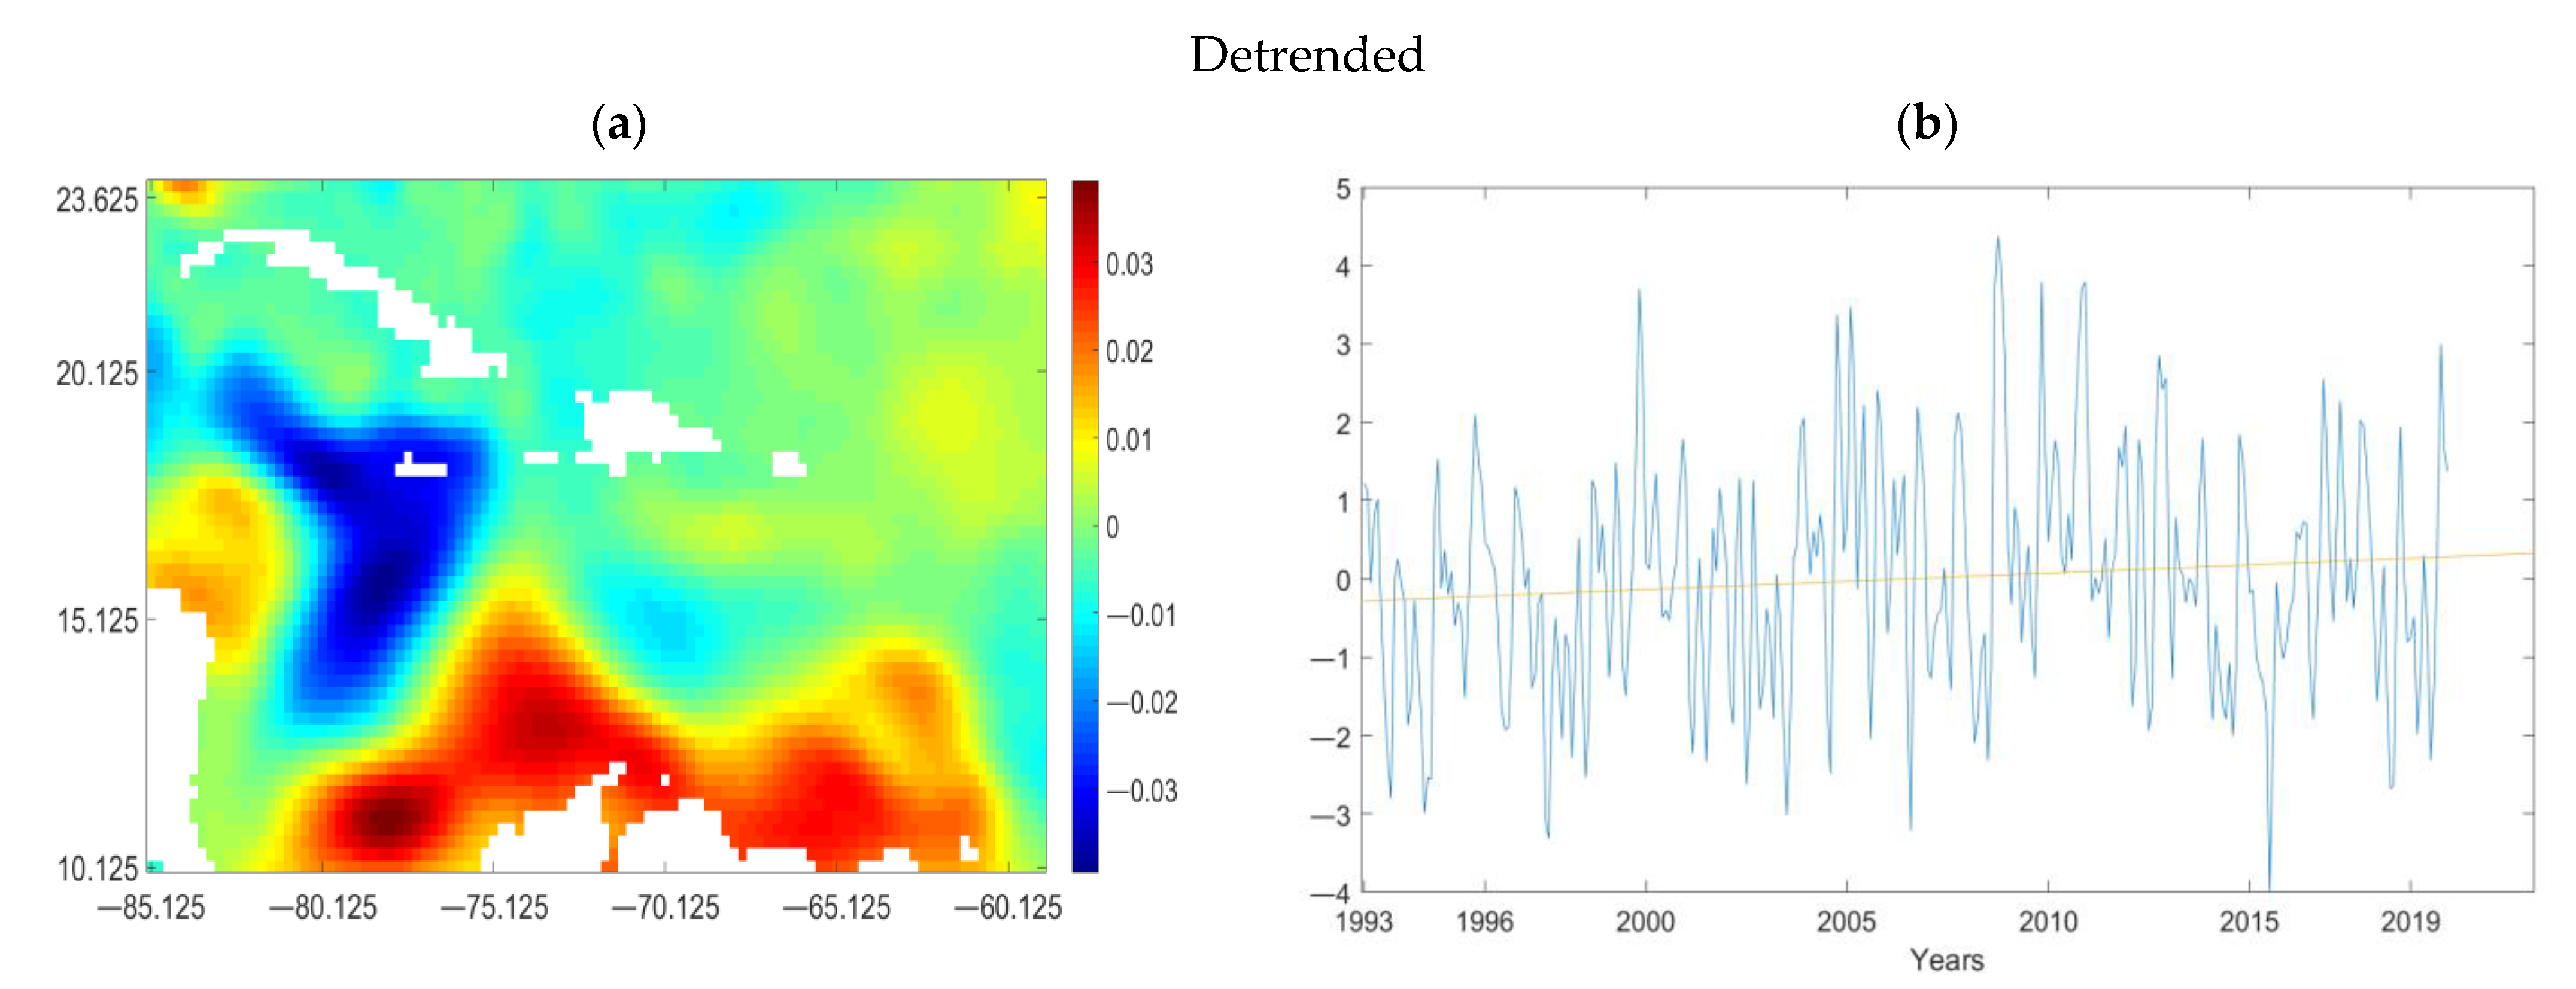
It is noted that the spatial pattern for PC2_detrended (Figure A2) depicts high but oppositely signed spatial loadings around Jamaica (and extending westward to Cayman and south and south-westward) versus off the north Coast of South America and westward to the Panama–Colombia Gyre. (PC2_raw has an almost identical spatial pattern). The corresponding timeseries captures seasonal and interannual variations. The CLLJ and Jamaica wind indices show highest correlations with the timeseries for PC2_raw (magnitudes 0.50 and 0.49, respectively) and PC2_detrended (magnitudes 0.54 and 0.51 respectively) (Table 4a). These correlation magnitudes increase with lag, e.g., when PC2_detrended lags CLLJ and Jamaica wind by one month, the correlations increase to 0.65 and 0.59, respectively. The CLLJ has a July peak [72] and, as previously shown, sea levels on the south coast of Jamaica peak in August. The Pac–Atl gradient and ENSO, through its influence on the gradient, also impact the CLLJ summer strength [55,73], likely accounting for the significant correlations seen with the index in Table 4a. This suggests a significant role for the CLLJ in driving sea level change on seasonal and interannual timescales. Based on the signs of the loadings, trend, and correlations, the suggestion is that a strengthened CLLJ associates with higher sea levels in the vicinity of Jamaica.

3.3.2. EOF Analysis of the Deseasoned Versus Detrended and Deseasoned Data

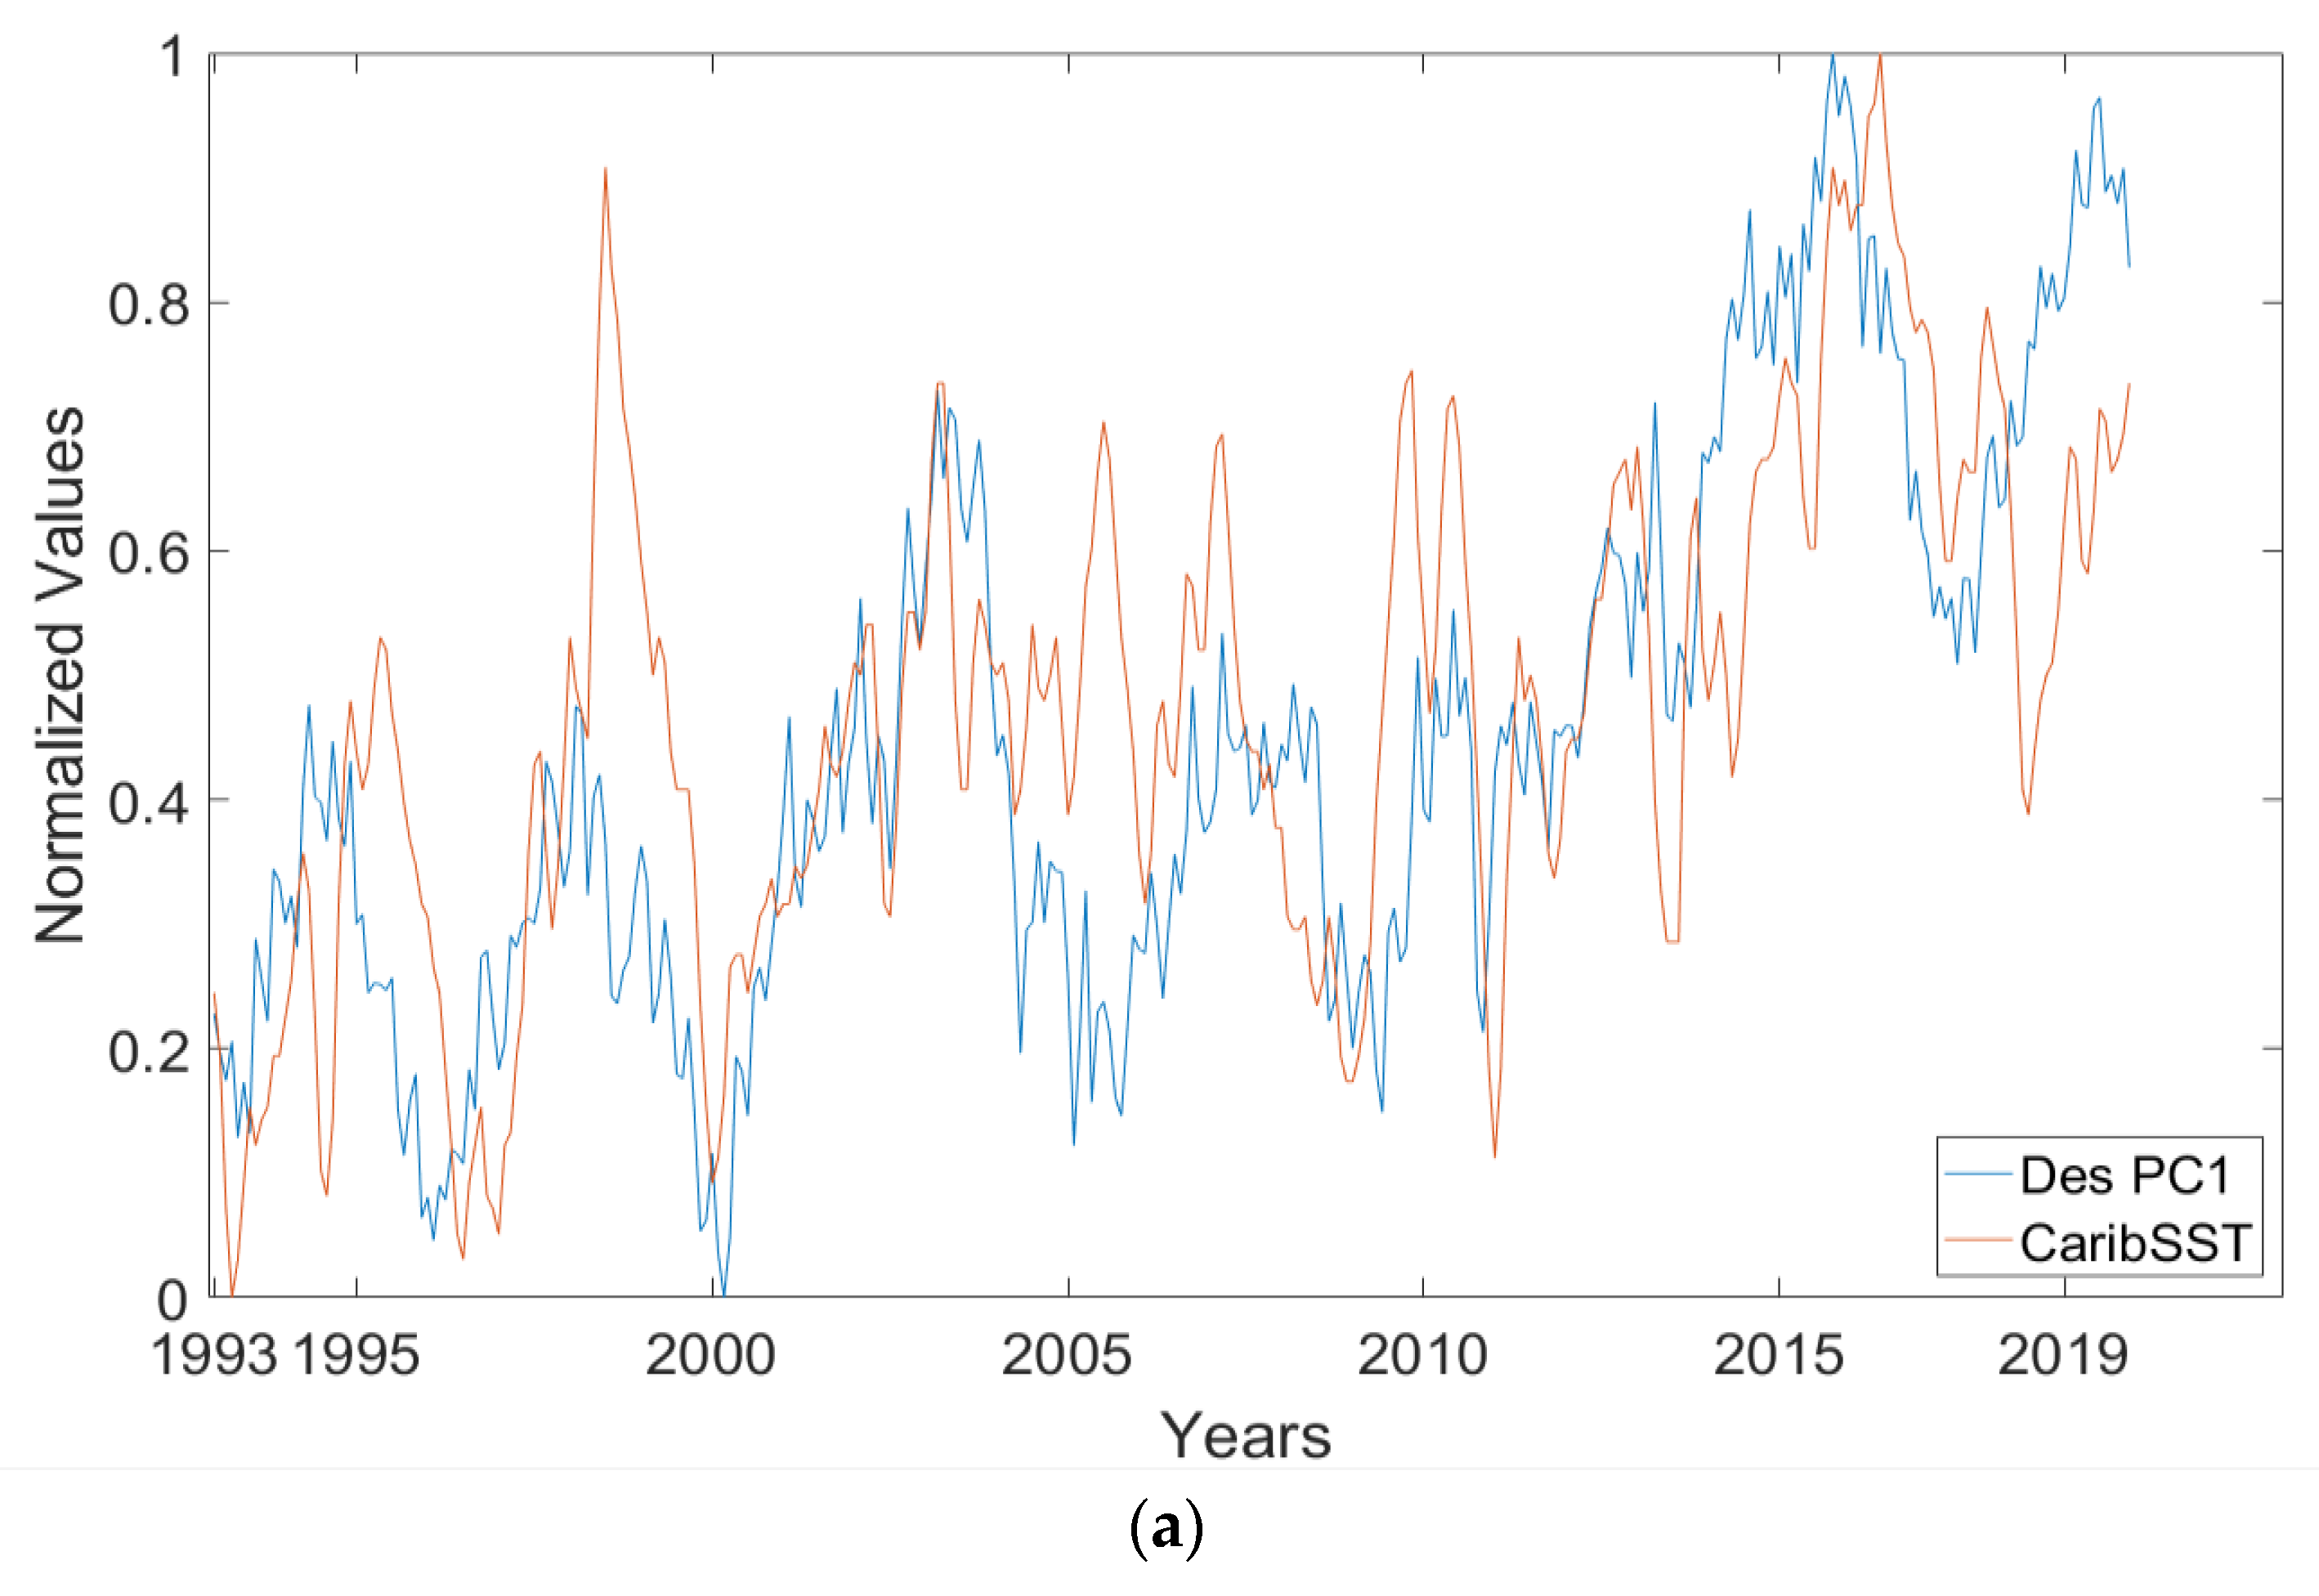
The first three principal components of the deseasoned data explain just under 40% of the variance (Table 3), with PC1 explaining approximately 27%. Spatial loadings for PC1_deseasoned show a northward gradient (Figure 3e), with the north/northwest Caribbean having higher loadings than the southern Caribbean Sea bordering South America, where sea level variability is in part driven by the Caribbean Current and the Panama–Colombia Gyre [20,23]. The PC1_deseasoned timeseries shows an interannual signal superimposed on a long-term rising trend (Figure 3f). A high and significant correlation with Carib SST (+0.63) reinforces the idea that Caribbean SSTs are an important driver of the long-term sea-level trend (see also Figure 4a). The PC1_deseasoned timeseries also shows a 4–5 year cycle. This 4–5 year cycle may be associated with ENSO, which has a 3–5 year cycle [74] and which has been shown to impact sea levels in the Caribbean on the interannual time scale [17,21,23,24,48]. Significant correlations exist between PC1_deseasoned and both NINO3 (+0.31) and NINO3.4 (+0.33).
PC1 explains 54% of the detrended and deseasoned data. The explained variability is comparable to the upper range of the variance explained by interannual variability (53%) presented in [23]. The spatial loadings show the north–south gradient exhibited by PC1_deseasoned but with the high loadings in the northwest Caribbean, including around Jamaica and Cuba, being more pronounced (Figure 3g). The timeseries captures the interannual signal minus the long term trend (Figure 3h). Pacific SST indices exhibit strong correlations with PC1_des_det. The correlations are +0.55 with NINO3, +0.60 with NINO3.4, and +0.54 with PDO. This again supports the idea of ENSO being a significant driver of interannual variability in the Caribbean. There are, however, also high correlations with wind related indices (0.71 with Jamaica wind and 0.57 with CLLJ) and the Pacific–Atl gradient (0.66). These latter correlations increase with lag (PC1 lagging the index), e.g., to 0.75 with Jamaica wind (lag of 4 months), 0.68 with CLLJ (lag of 5 months), and 0.68 for the Pacific-Atl SST gradient (lag of 2 months). The PC1_des_det correlates strongly (+0.80) with the deseasoned and detrended timeseries of Jamaica altimetry data (Figure 4b). Interannual variability of sea levels off the south coast of Jamaica is, therefore, linked to variations in the abovementioned basin wide and large-scale climate and ocean phenomena.

3.3.3. Summer Season

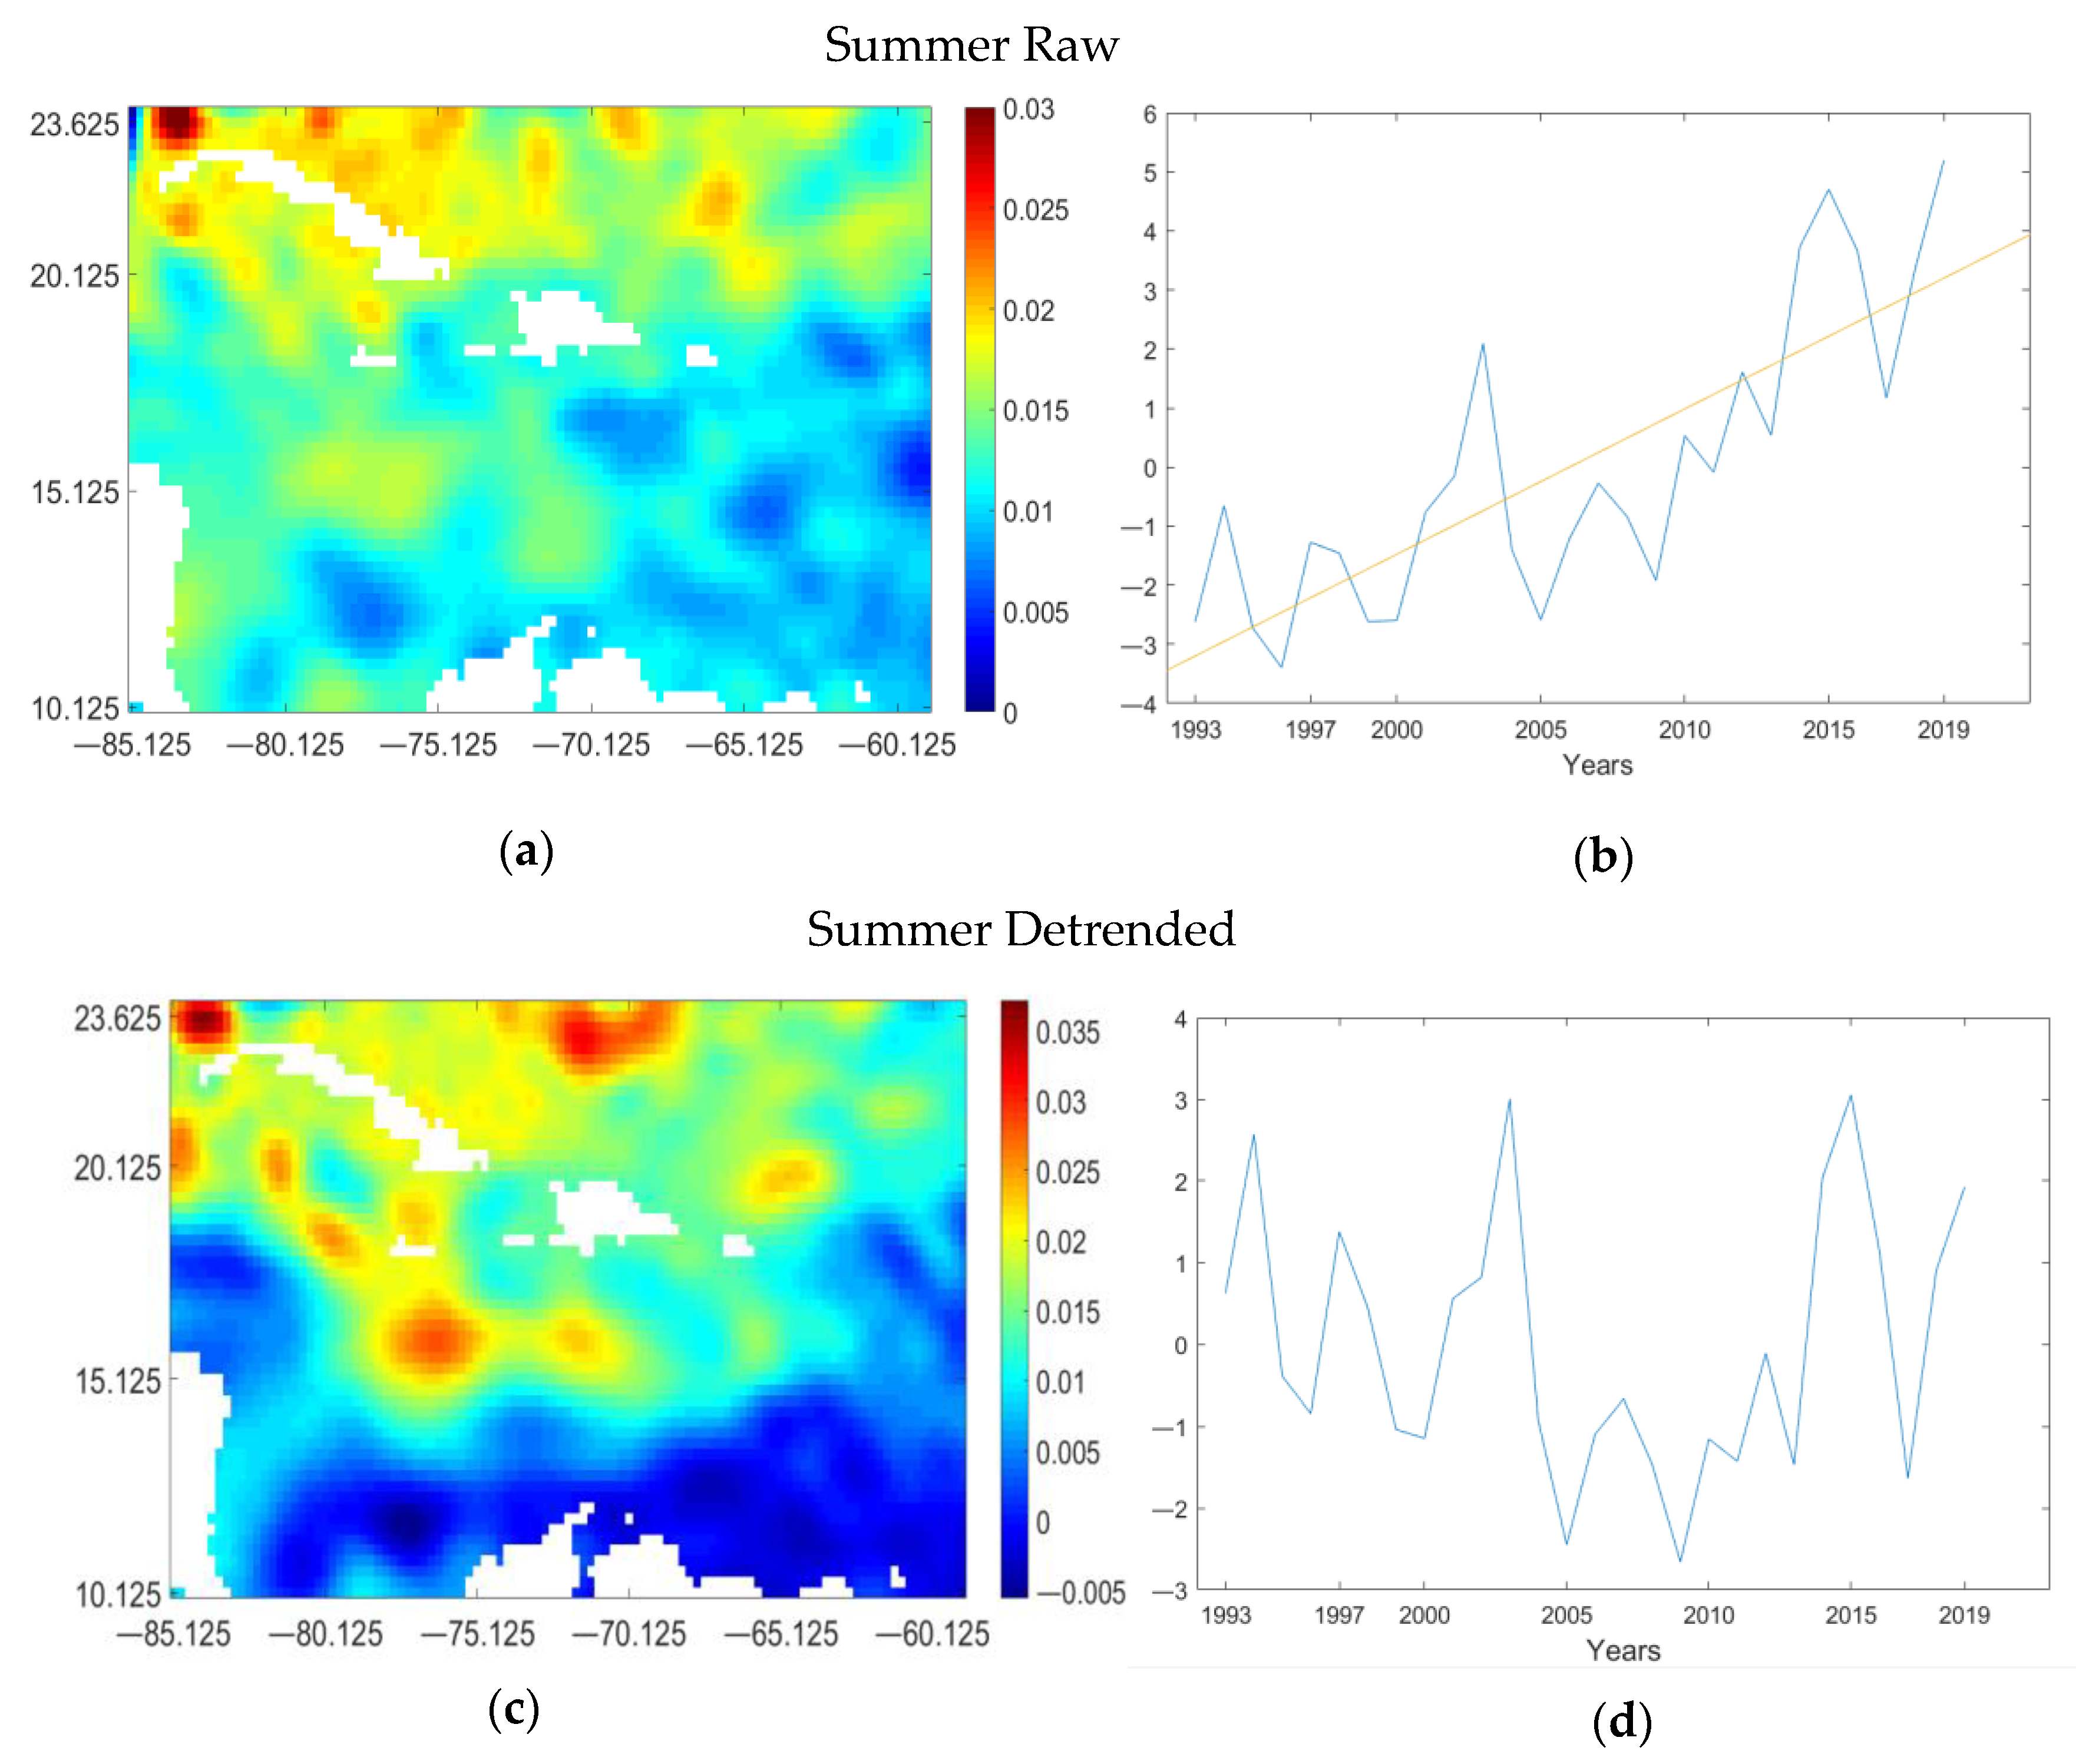
The EOF analyses were repeated for the summer season, when sea levels are at a maximum, using data for June through September. The monthly data were extracted and averaged annually, and EOFs were calculated before and after detrending. Figure 5 shows the PC1 spatial loadings and timeseries for the raw (SumPC1_raw) and detrended (SumPC1_detrended) summer data. Table 4b shows the correlations between the summer PC1 timeseries (raw and detrended) and the 10 indices. The summer season coincides with an intensification of the CLLJ [55], an eastward expansion of the Atlantic part of the western hemisphere warm pool [70], and a July intensification of sea level pressure [54]. These phenomena have a known seasonal influence on Caribbean summer climate, e.g., modulating the mid-summer drought [33,75,76]. Their association with an enhanced or diminished amplitude of the sea level summer maximum was examined.
PC1 explains 50% and 33% of the raw and detrended data, respectively. For the raw data, the spatial pattern (Figure 5a) shows almost uniform loadings across the Caribbean south and east of Jamaica, suggesting a basin-wide response. The SumPC1_raw timeseries (Figure 5b) is dominated by a linear trend with interannual variability superimposed. It correlates significantly with Carib SST (+0.45) and the two wind indices (+0.43 and +0.53 with CLLJ and Jamaica wind, respectively). The linear trend is indicative of basin-wide increases in summer sea levels in the long-term which, as noted previously, coincides with a similar long-term warming in Caribbean SSTs. The implication for increasing risk under continued global warming during the time of the year (summer) when climatologically sea level risk is highest is noted. This is discussed further in the final section. In contrast, the timeseries for the detrended data does not significantly correlate with Carib SST.
The spatial pattern for the detrended data (Figure 5c) shows similarly signed loadings over most of the Caribbean basin, except for just north of South America. Highest loadings are in the north Caribbean. There is a significant correlation with SLP (+0.58), highlighting the role of SLP in driving seasonal sea level variability in the Caribbean basin, also suggested by [21]. Caribbean summer sea level pressures are associated with a southward jog in the North Atlantic Subtropical High [77,78], which modulates trade wind strengths [68,79]. The significant and robust correlations with the CLLJ (−0.54) and Jamaica summer wind (−0.68) indices are consistent with this.
Interestingly, there are oppositely signed maxima in the southwestern Caribbean between the location of the CLLJ (around 15° N, 76° W) and immediately south in the vicinity of the Colombia–Panama Gyre and the Panama Colombia Current. An explanation could be that the SST gradient between the tropical Atlantic and equatorial Pacific influences not only the strength of the CLLJ [55], but also the veering of the winds in its exit region, either northward toward the Gulf (warm Atlantic) or southward toward the Pacific (warm Pacific) [80]. Veering north could influence the strength of the counter flow in the Panama–Colombia Gyre. The SumPC1_detrended timeseries correlates significantly with Pac–Atl (−0.50) index, Nino3.4 (−0.39), and the PDO (−0.51).

3.4. Composites

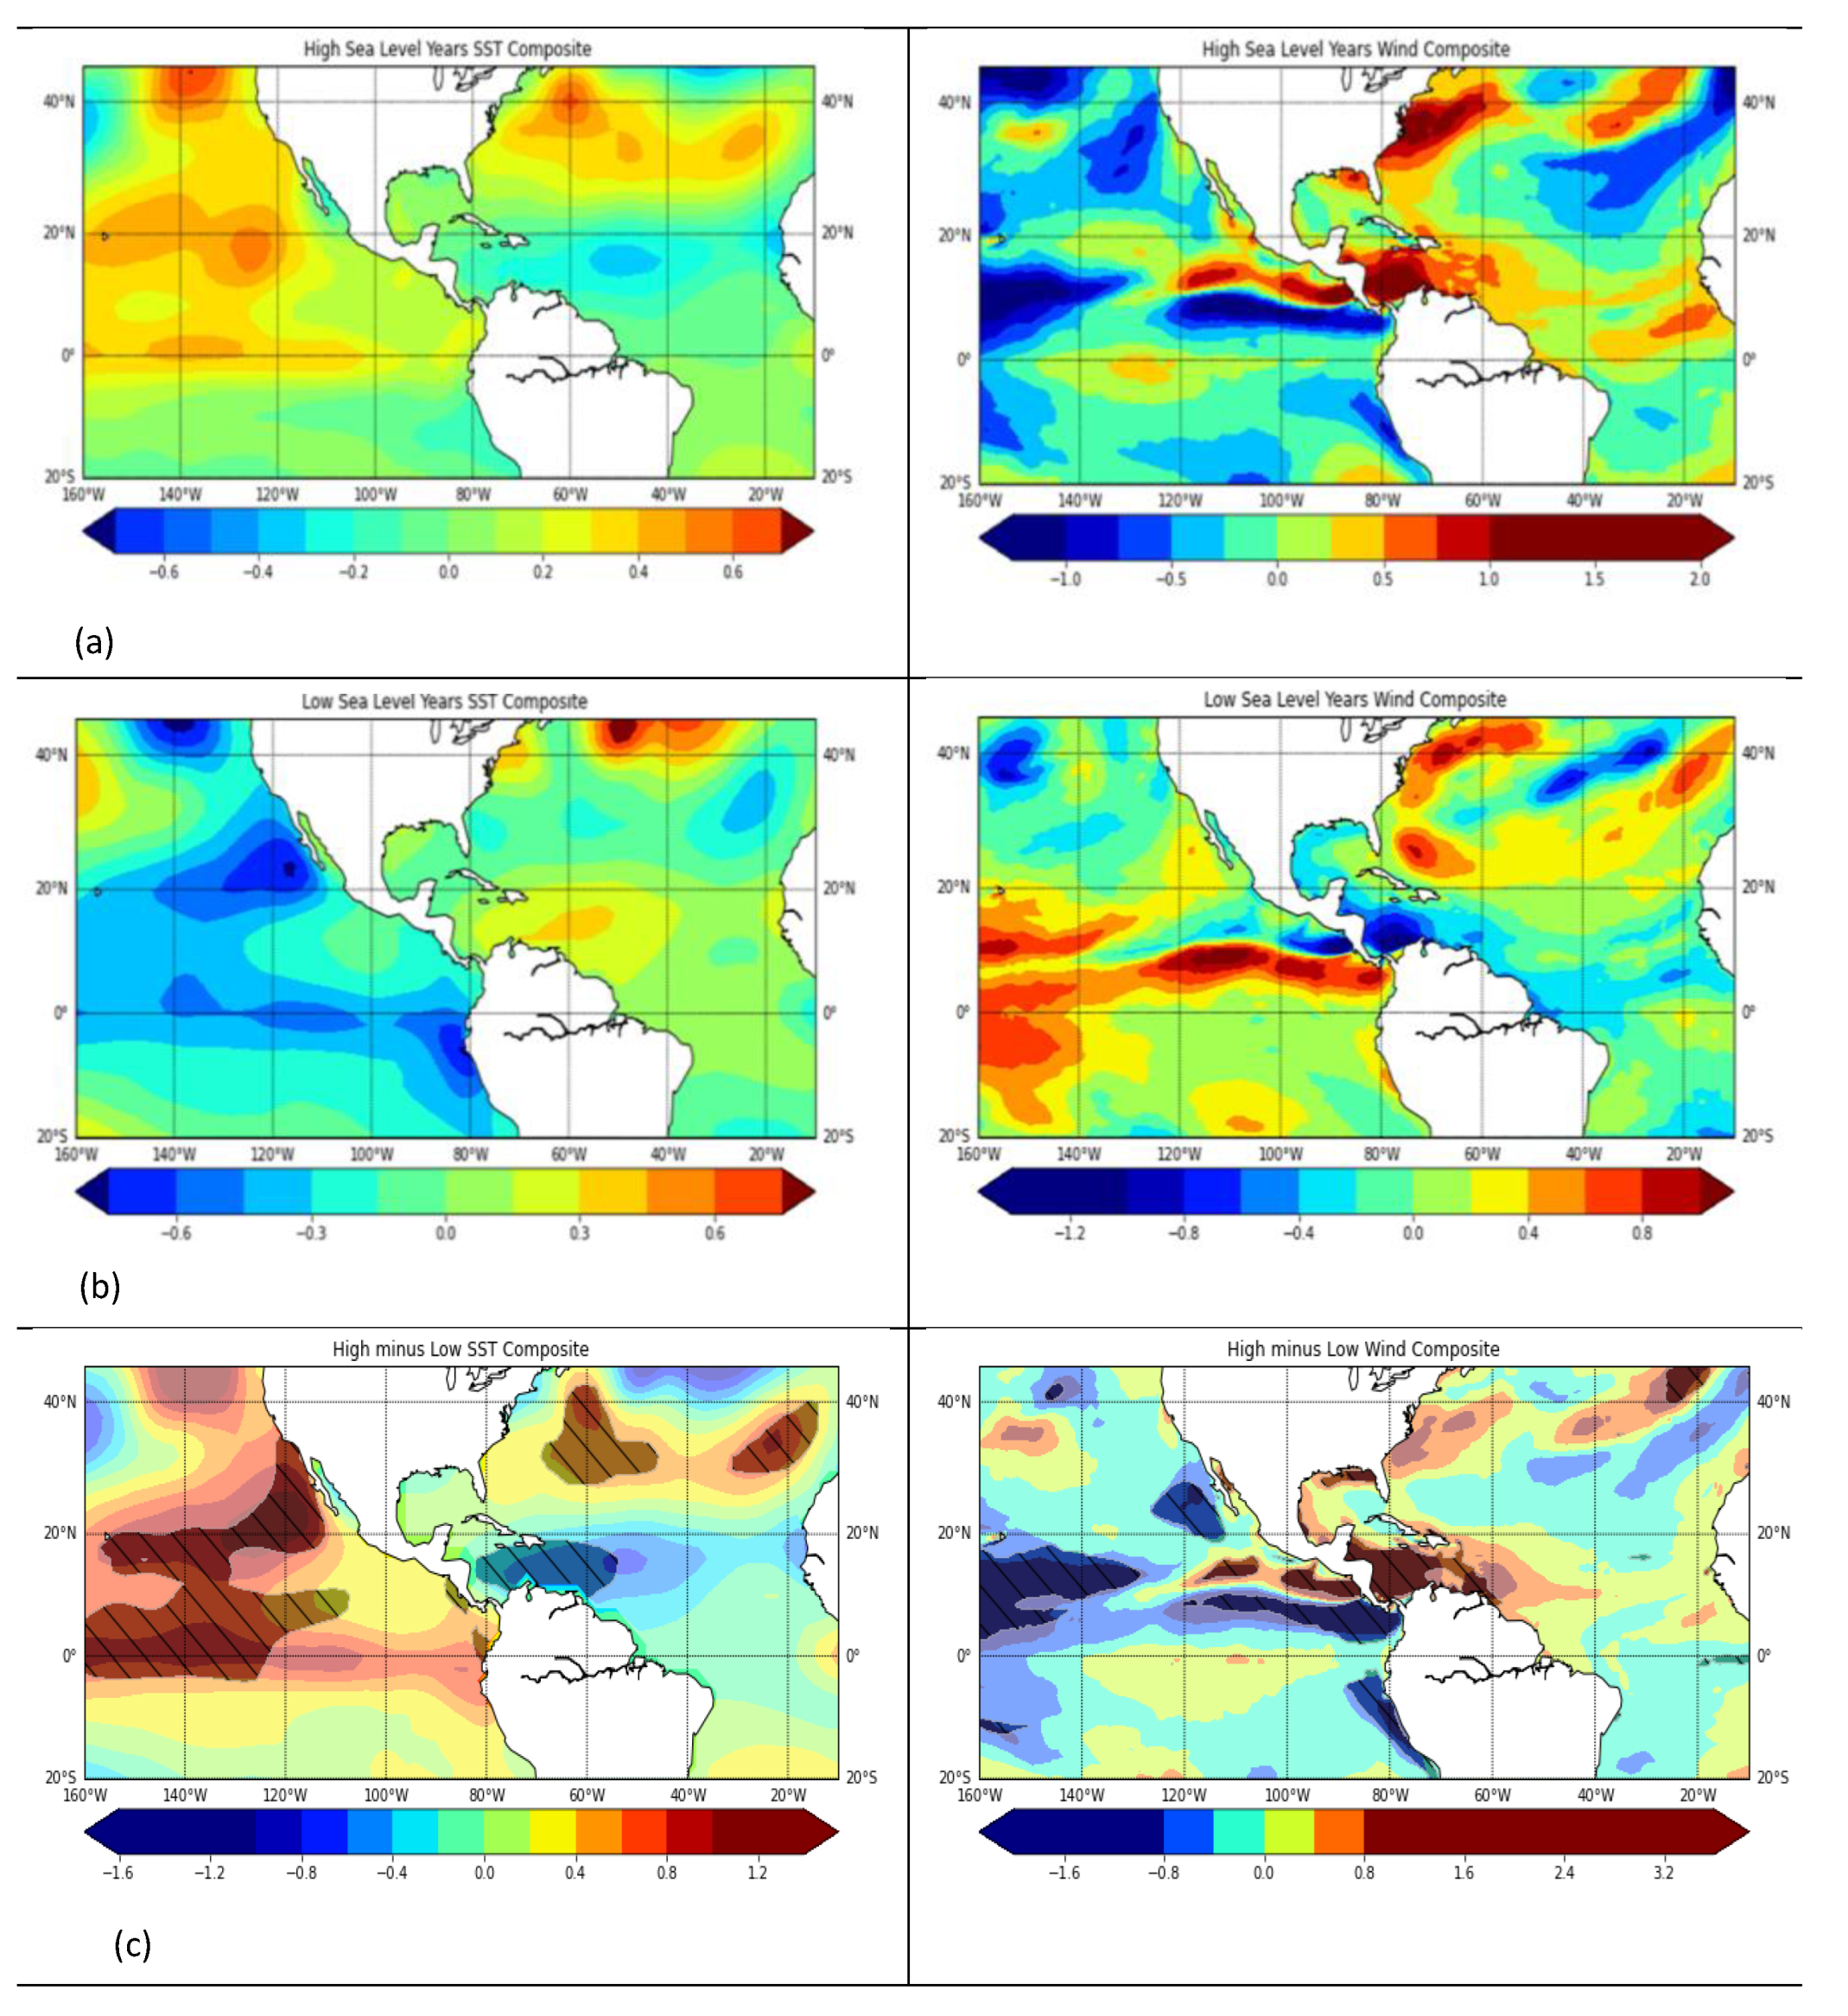
Composites were utilized to further explore the dynamics associated with high sea levels off the south coast of Jamaica during summer. The detrended Jamaica sea level anomaly data were averaged for June to September, and the resulting timeseries was divided into quartiles. Six high summer sea level years (75th quartile) and six low summer sea level years (25th quartile) are shown in Table 5. They were also classified according to whether they fell in years during which the Pacific experienced El Niño or La Niña conditions. Four out of six high summer sea level years associated with warm equatorial Pacific conditions during the summer months (classified as El Niño), while three of six low summer years coincided with cool Pacific conditions (La Niña). The EOF analysis had previously indicated significant correlations with equatorial Pacific SST anomalies. Composites of summer SST and wind strength anomalies over the Atlantic and eastern Pacific were created for the high years, low years, as well as for the difference between high and low years (Figure 6). Statistically significant differences were hatched on the difference maps.
High sea level years are characterised by an SST gradient between the tropical Atlantic and equatorial Pacific. Warm SST anomalies occur across the parts of the equatorial, north, and eastern tropical Pacific captured in the domain. There is evidence of a warm tongue across the equator, characteristic of an El Niño event, as well as SST maxima at 20° N and northward of 40° N off the west coast of America. Temperatures are up to 0.5 °C greater than average for the summer season. In contrast, cool anomalies dominate the Caribbean basin and north tropical Atlantic up to 20° N. Warm anomalies exist in the far north Atlantic. The low sea level composite shows a reversal in the pattern, with, notably, a cool equatorial Pacific and warm north tropical Atlantic pattern being present. The difference map highlights that the changes seen in the Caribbean basin and north Atlantic, as well as the equatorial and north tropical Pacific, are statistically significant.
The corresponding composite wind maps show that, for high summer sea level years, wind strength across the entire Caribbean basin is higher, with a maximum in the southwestern basin in the vicinity of the CLLJ. Stronger winds stretch across the Central American isthmus with a narrow tongue stretching westward into the Pacific (to 120° W) from the west coast of Costa Rica. Weaker winds just north of the equator stretch westward from Panama and parallel the strong winds noted previously. The composite for low sea level years shows a reversal of the above pattern with weaker winds in the Caribbean basin and a minimum in the vicinity of the CLLJ. The difference map shows statistically significant differences in wind speed strengths across the entire Caribbean basin between high and low sea level years.
Figure 6 is consistent with several studies [54,55,58,73,75] that indicate an association between a tropical basin SST gradient and modification of the Caribbean trade wind regime and the CLLJ. Refs. [45,55] note that the gradient may be driven by one or both basins, e.g., by an El Niño event, by a cool tropical north Atlantic, or by simultaneous anomalies in both basins. Ref. [55] also suggest that the spatial pattern of the CLLJ intensification is linked to the basin modulating the SST gradient. For example, when the gradient arises due to an El Niño event, the intensification of the trades is not uniform across the CLLJ axis but, rather, there is preferential strengthening just south of Jamaica and in the lower southwestern basin in the vicinity of Costa Rica [55]. When the gradient arises primarily from tropical north Atlantic cool anomalies, the intensification is uniform across the jet axis [55]. This may help explain why high or low summer sea level years can occur even in the absence of an El Niño/La Niña event, i.e., it is the gradient which is important for modulating Caribbean basin summer wind strength. Irrespectively, higher sea levels are driven by a stronger CLLJ, which transfers more energy to wind-driven waves, increasing wave heights. The results confirm wind velocity as a key driver of sea level anomalies in the Caribbean.

4. Discussion

The major discussion points that emerge from this study are framed in the context of what the results imply for the regional risk due to sea level change.
The potential usefulness of altimetry data for small island states: Jamaica, similar to many other Caribbean nations, does not have long, continuous, and complete tide gauge records. This has proven to be a limitation for characterizing long term changes in sea level, as well as variability over seasonal to decadal timescales [16,17]. Satellite altimetry has been used globally as a relatively accurate representation of sea level change [18]. This study corroborates the usefulness of altimetry as a reliable representation of sea level change in the region, given the reasonable correlations with selected Caribbean tide gauge data. Though there is a concerted effort to build out gauge stations across the region [81], it will take some time before records of sufficient spatial and temporal coverage exist. Altimetry records provide a useful dataset to (in the meantime) characterize aspects of sub-regional and island-specific risk due to sea level rise and on which to begin to premise planning action.
The importance of the seasonal cycle: Though seasonal variations in rainfall and temperature have been extensively characterized for the Caribbean and individual islands, there is comparatively little documented about the seasonal cycle of sea heights at the country level [66,76]. The EOF analyses identify the seasonal cycle as a prominent feature of the altimetry record across the entire Caribbean basin. Annual variation results from the steric response of the Caribbean Sea to heat fluxes at the surface as it warms and cools throughout the year [20,21]. Sea levels on the Jamaican south coast are lowest in the spring months (MAM) and peak in the summer months of July–August. On average, the summer season peak is at least 7 cm higher than the boreal spring minimum. Highest sea levels occur within the hurricane season and lead peak activity by 1–2 month(s) [82,83], exacerbating risks from storm surge and inland flooding due to strong winds associated with tropical storm events. As for climate variables, an understanding of the seasonal variation supports risk management efforts by providing bounds within which planning should occur, e.g., for constructing sea defences or determining coastal setbacks. In much the same way that knowledge of the rainfall or hurricane climatologies supports (for example) water management [84] and disaster risk reduction efforts [85], respectively, the possibility exists to better characterize the changing risk to coastal communities from sea level rise throughout the course of a year.
Increasing sea levels are a cause for alarm: Altimetry data suggests that, for the period 1993–2019, the rate of sea level rise for Kingston, Jamaica was 3.3 ± 0.4 mm/year when adjusted for GIA and instrumental drift. This is similar to the global mean but almost double the estimate for the Caribbean and Jamaica from prior altimetry-based studies which used 18 years or less of data available at the time they were undertaken more than a decade ago. This suggests an acceleration of the rate of sea level rise. EOF analysis shows that the increase is a feature of the entire Caribbean, though there is some spatial variability. Significantly, seasonal variability for Jamaica occurs against the background of the increasing trend such that, towards the end of the analysed period, there are years when the lowest annual sea levels (for example, over the last two years) are higher than minima recorded at the beginning of the period of analysis (for example, the first seven years). The highest maximum achieved in the seven years up to 2000 was also exceeded four times since 2015 (Figure 2b). The implication is that risk is increasing, and not only for times of the year when, climatologically, sea levels are expected to be highest. Sea levels during climatologically low periods of the year are also higher than before (for example, compared to the early 1990s). The EOF and correlation analysis suggest that Caribbean SSTs play an important role in driving the long-term trend. It has already been noted that SSTs in the tropical north Atlantic similarly exhibit an increasing trend, becoming much warmer after 1995 [68,69].
SST gradients and their influence on regional wind modulate interannual sea level changes: Detrending and deseasoning the data revealed interannual variations in the regional and local sea level record. The interannual variability is strongly correlated with wind strength both off the coast of Jamaica and in the vicinity of the CLLJ. The summer peak especially reflects these linkages. Several regional studies have linked both Caribbean trade and CLLJ wind strength in the summer months with a gradient in SST strength between the tropical Pacific and tropical Atlantic oceans. This association is also reflected in the correlations between the principal components of the regional sea level and an index representative of the gradient. Composite analysis suggests that it is a warm equatorial Pacific-cool tropical Atlantic and correspondingly strong surface winds across the Caribbean basin which associate with high Jamaican sea levels in the summer (and vice versa). Importantly, the SST gradient may be driven by changes in any one of the basins, including via the influence of an El Niño event. Not surprisingly, ENSO indices feature among the significant correlations with those principal components capturing the interannual signal. There is, then, the potential to develop predictive models with sufficient lead time (of at least a few months) for annual sea level variations off the coast of Jamaica, particularly for the season when sea levels are highest. This would facilitate planning for years of enhanced risk. These would complement seasonal early warning systems already being developed for other climate phenomena under regional climate services initiatives, such as the Climate Risk Early Warning Systems (CREWS) Caribbean project [86].

5. Conclusions

Sea level rise in regions such as the Caribbean has significant impact on the lives and livelihoods of people, but has been historically understudied, in part due to inadequate gauge data. Satellite altimetry is found to be a reliable source of information about sea level variability that can address this deficiency. This study uses altimetry data to examine multi-timescale sea level variability near Jamaica in the Caribbean. It updates prior Caribbean-focussed altimetry studies by using a longer timeseries, covering 1993–2019.
Sea levels off the south coast of Jamaica are rising at a rate of 3.3 ± 0.4 mm/year. This is comparable to the global mean estimate, but significantly higher than previous Caribbean estimates using altimetry data up to 2010. There is seemingly an acceleration of the rate of rise in the last decade. The steric effect associated with increasing Caribbean sea surface temperatures seems to be driving the long-term increase in the sea levels over the altimetry era.
The Jamaican record shows seasonal variability characterized by a single peak during July–August (summer season) and lowest sea levels in the spring season. The major drivers of interannual variability (including for the summer season) are a tropical Pacific-tropical Atlantic SST gradient index, local winds, and the Caribbean low-level jet (CLLJ). These drivers are not unrelated, since (for example) the SST gradient index (i.e., which tropical basin is warmer) is strongly associated with the strength of the CLLJ. Previous studies also show ENSO to be a significant driver of interannual variability in the Caribbean. This study corroborates this, but further suggests that it plays this role through modulation of both the Pacific–Atlantic index and the strength of the CLLJ. The CLLJ should be included in predictive models of Caribbean sea levels.
An understanding of sea level variability on multiple timescales provides a platform from which planning for enhanced risk from interannual cycles and sea level extremes associated with tropical cyclones may be possible. Future work will focus on further characterisation of historical sea level change (variability and drivers) across the entire Caribbean basin and for individual countries, especially given the noted variations between north and south Caribbean. This study provides a template for doing so. Furthermore, as illustrated by this study, a number of previous studies (e.g., those investigating variation in annual and semi-annual harmonics across the Caribbean Sea) need to be replicated using the longer altimetry data now available. This will complement research already being carried out to investigate the future sea level change from coupled models. Finally, notwithstanding the value of the altimetry data, this work also highlights the need for more reliable tide gauge data within the Caribbean region, especially for validation of the results at the sub-regional and island scales. This remains the greatest limitation to local sea level variability studies.

Author Contributions

Conceptualization, D.O.M., M.A.T. and T.S.S.; methodology, D.O.M., M.A.T. and T.S.S.; software, D.O.M.; validation, D.O.M., M.A.T. and T.S.S.; formal analysis, D.O.M.; investigation, D.O.M.; data curation, D.O.M.; writing—original draft preparation, D.O.M.; writing—review and editing, D.O.M., M.A.T. and T.S.S.; visualization, D.O.M.; supervision, M.A.T. and T.S.S.; funding acquisition, M.A.T. and D.O.M. All authors have read and agreed to the published version of the manuscript.

Funding

This research was funded by CCRIF SPC through the 2018 CCRIF-UWI Graduate Programme, and by The University of the West Indies (Mona) through the UWI Postgraduate Research fund.

Institutional Review Board Statement

Not applicable.

Informed Consent Statement

Not applicable.

Data Availability Statement

Data are available for tide gauge (http://uhslc.soest.hawaii.edu/data, accessed on 16 March 2020), satellite altimetry (https://cds.climate.copernicus.eu/cdsapp#!/home, accessed on 5 September 2019), and all the climate indices, as outlined in Table 1.

Acknowledgments

The authors would like to thank the funding institutions for this research, including CCRIF SPC, who provided a grant through the 2018 CCRIF-UWI ScholarshipProgramme, and The University of the West Indies (Mona), who provided a grant from the UWI Postgraduate Research Fund. The authors would also like to thank the School of Geographical Sciences, University of Bristol (UoB), UK for facilitating a Graduate Student research visit for D.M. at the conceptualization stage of this research. Special thanks to Rory Bingham, Tony Payne, and Dann Mitchell at UoB who provided guidance in scoping this research and acquiring data. Lastly, the authors thank Natalia Gomez, Department of Earth and Planetary Sciences, McGill University and the members of the Climate Studies Group Mona—in particular, Leonardo Clarke and Jayaka Campbell—for their helpful insights and discussions about the work.

Conflicts of Interest

The authors declare no conflict of interest.

Appendix A

Figure A1. Altimetry and tide gauge records for (a) Port-au-Prince, Haiti, (b) San Juan, Puerto Rico, (c) Prickley Bay, Grenada, (d) Roseau, Dominica, (e) Cabo Cruz, Cuba.
Jmse 11 01499 g0a1aJmse 11 01499 g0a1bJmse 11 01499 g0a1c
Figure A2. (a) Spatial variability and (b) timeseries of the principal component of the 2nd leading EOF of sea levels in the Caribbean from detrended altimetry data, spanning 1993–2019.
Jmse 11 01499 g0a2

References

  1. Bueno, R.; Herzfeld, C.; Stanton, E.A.; Ackerman, F. The Caribbean and climate change: The costs of inaction. Stockholm Environment Institute, US Center and Global Development and Environment Institute, Tufts University (2008). Available online: https://tamug-ir.tdl.org/bitstream/handle/1969.3/29240/Caribbean-full-Eng.pdf?sequence=1 (accessed on 12 December 2019).
  2. Macpherson, C.; Akpinar-Elci, M. Impacts of climate change on Caribbean life. Am. J. Public Health 2013, 103, 2013. [Google Scholar] [CrossRef]
  3. Reguero, B.G.; Losada, I.J.; Díaz-Simal, P.; Méndez, F.J.; Beck, M.W. Effects of climate change on exposure to coastal flooding in Latin America and the Caribbean. PLoS ONE 2015, 10, e0133409. [Google Scholar] [CrossRef]
  4. Dasgupta, S.; Laplante, B.; Meisner, C.; Wheeler, D.; Yan, J. The impact of sea level rise on developing countries: A comparative analysis. Clim. Chang. 2009, 93, 379–388. [Google Scholar] [CrossRef]
  5. Richards, A. Development Trends in Jamaica’s Coastal Areas and the Implications for Climate Change. Sustainable Development and Regional Planning Division, Planning Institute of Jamaica. 2008. Available online: https://www.pioj.gov.jm/Portals/0/Sustainable_Development/Climate%20Change%20and%20Jamaica.pdf (accessed on 19 June 2021).
  6. Sheller, M. Reconstructing tourism in the Caribbean: Connecting pandemic recovery, climate resilience and sustainable tourism through mobility justice. J. Sustain. Tour. 2020, 29, 1436–1449. [Google Scholar] [CrossRef]
  7. Jayawardena, C.; Ramajeesingh, D. Performance of tourism analysis: A Caribbean perspective. Int. J. Contemp. Hosp. Manag. 2003, 15, 176–179. [Google Scholar] [CrossRef]
  8. Mackay, E.A.; Spencer, A. The future of Caribbean tourism: Competition and climate change implications. Worldw. Hosp. Tour. Themes 2017, 9, 44–59. [Google Scholar] [CrossRef]
  9. Banton, J.D.; Dowding, D.D. Caribbean storm surge mapping—An overview towards guidelines. In Proceedings of the Institution of Civil Engineers: Maritime Engineering; ICE Publishing: London, UK, 2013; Volume 166, pp. 3–13. [Google Scholar] [CrossRef]
  10. Simpson, M.; Scott, D.; New, M.G.; Sim, R.; Smith, D.; Harrison, M.; Eakin, C.M.; Warrick, R.; Strong, A.E.; Kouwenhoven, P.; et al. An Overview of Modelling Climate Change: Impacts in the Caribbean Region with contribution from the Pacific Islands. 2009. Available online: https://coralreefwatch.noaa.gov/satellite/publications/UNDP_Final_Report.pdf (accessed on 30 May 2023).
  11. IPCC. Global Warming of 1.5 °C; An IPCC Special Report on the Impacts of Global Warming of 1.5 °C above Pre-Industrial Levels and Related Global Greenhouse Gas Emission Pathways, in the Context of Strengthening the Global Response to the Threat of Climate Change; Blackwell Publishing Ltd.: Oxford, UK, 2018; Available online: https://www.ipcc.ch/site/assets/uploads/sites/2/2019/06/SR15_Full_Report_High_Res.pdf (accessed on 30 May 2023). [CrossRef]
  12. Fox-Kemper, B.; Hewitt, H.; Xiao, C.; Aðalgeirsdóttir, G.; Drijfhout, S.; Edwards, T.; Golledge, N.; Hemer, M.; Kopp, R.; Krinner, G.; et al. Ocean, Cryosphere and Sea Level Change. In Climate Change 2021: The Physical Science Basis; Contribution of Working Group I to the Sixth Assessment Report of the Intergovernmental Panel on Climate Change Science Basis; Cambridge University Press: Cambridge, UK; New York, NY, USA, 2021; Volume 2018. [Google Scholar]
  13. Kopp, R.E.; Horton, R.M.; Little, C.M.; Mitrovica, J.X.; Oppenheimer, M.; Rasmussen, D.J.; Strauss, B.H.; Tebaldi, C. Probabilistic 21st and 22nd century sea-level projections at a global network of tide-gauge sites. Earths Future 2014, 2, 383–406. [Google Scholar] [CrossRef]
  14. Milne, G.A.; Gehrels, W.R.; Hughes, C.W.; Tamisiea, M.E. Identifying the causes of sea-level change. Nat. Geosci. 2009, 2, 471–478. [Google Scholar] [CrossRef] [Green Version]
  15. Passaro, M.; Müller, F.L.; Oelsmann, J.; Rautiainen, L.; Dettmering, D.; Hart-Davis, M.G.; Abulaitijiang, A.; Andersen, O.B.; Høyer, J.L.; Madsen, K.S.; et al. Absolute Baltic Sea Level Trends in the Satellite Altimetry Era: A Revisit. Front. Mar. Sci. 2021, 8, 1–16. [Google Scholar] [CrossRef]
  16. Jaggan, S.; Davis, D. Evaluating Satellite Altimetry for Monitoring Caribbean Sea Level Rise. West Indian J. Eng. 2012, 35, 66–72. Available online: https://sta.uwi.edu/eng/wije/vol3501_jul2012/documents/EvaluatingSatelliteAltimetry.pdf (accessed on 5 September 2019).
  17. Palanisamy, H.; Becker, M.; Meyssignac, B.; Henry, O.; Cazenave, A. Regional sea level change and variability in the Caribbean sea since 1950. J. Geod. Sci. 2012, 2, 125–133. [Google Scholar] [CrossRef]
  18. WCRP Global Sea Level Budget Group. Global sea-level budget 1993–present. Earth Syst. Sci. Data 2018, 1, 1551–1590. [Google Scholar]
  19. Woodruff, J.D.; Irish, J.L.; Camargo, S.J. Coastal flooding by tropical cyclones and sea-level rise. Nature 2013, 504, 44–52. [Google Scholar] [CrossRef] [Green Version]
  20. Alvera-Azcárate, A.; Barth, A.; Weisberg, R.H. The surface circulation of the Caribbean Sea and the Gulf of Mexico as inferred from satellite altimetry. J. Phys. Oceanogr. 2009, 39, 640–657. [Google Scholar] [CrossRef] [Green Version]
  21. Torres, R.R.; Tsimplis, M.N. Seasonal sea level cycle in the Caribbean Sea. J. Geophys. Res. Oceans 2012, 117, 1–18. [Google Scholar] [CrossRef] [Green Version]
  22. Miller, K.; Hart, B.; Sydney, P. Sea levels around Barbados from tide gauges and satellite altimetry. Surv. Rev. 2012, 44, 215–222. [Google Scholar] [CrossRef]
  23. Torres, R.R.; Tsimplis, M.N. Sea-level trends and interannual variability in the Caribbean Sea. J. Geophys. Res. Oceans 2013, 118, 2934–2947. [Google Scholar] [CrossRef]
  24. Jury, M.R. Puerto Rico sea level trend in regional context. Ocean Coast. Manag. 2018, 163, 478–484. [Google Scholar] [CrossRef]
  25. Serju, C. A Beloved Jamaican Beach Is Succumbing to Climate Change. It Won’t Be the Last. The Guardian, 27 October 2020. p. 27. Available online: https://www.theguardian.com/us-news/2020/oct/27/jamaica-hellshire-beach-climate-change (accessed on 30 May 2023).
  26. Robinson, E.; Khan, S.; Coutou, R.; Johnson, M. Shoreline changes and sea-level rise at Long Bay, Negril, western Jamaica. Caribb. J. Earth Sci. 2012, 43, 35–49. [Google Scholar]
  27. Lyew-Ayee, P.; Maxam, A.; Mishiro, K.; Lyew-Ayee, A. Son of a Beach: Jamaica and the Coastal Zone. 2015. Available online: http://demo.monagis.com/EFJ%2010th%20Annual%20Public%20Lectue%20Booklet.pdf (accessed on 6 August 2021).
  28. Monioudi, I.; Asariotis, R.; Becker, A.; Bhat, C.; Dowding-Gooden, D.; Esteban, M.; Feyen, L.; Mentaschi, L.; Nikolaou, A.; Nurse, L.; et al. Climate change impacts on critical international transportation assets of Caribbean Small Island Developing States (SIDS): The case of Jamaica and Saint Lucia. Reg. Environ. Chang. 2018, 18, 2211–2225. [Google Scholar] [CrossRef] [Green Version]
  29. Simpson, S.; Clarke, M.C.; Scott, J.F.; New, D.J.; Karmalkar, M.; Day, A.; Taylor, O.J.; Gossling, M.; Wilson, S.; Chadee, M.; et al. The Caribsave Climate Change Risk Atlas (CCCRA)—Jamaica. 2012; Caribsave: Kent, UK.
  30. Gharineiat, Z.; Deng, X. Description and assessment of regional sea-level trends and variability from altimetry and tide gauges at the northern Australian coast. Adv. Space Res. 2018, 61, 2540–2554. [Google Scholar] [CrossRef] [Green Version]
  31. Forget, G.; Ponte, R.M. The partition of regional sea level variability. Prog. Oceanogr. 2015, 137, 173–195. [Google Scholar] [CrossRef] [Green Version]
  32. Boschat, G.; Simmonds, I.; Purich, A.; Cowan, T.; Pezza, A.B. On the use of composite analyses to form physical hypotheses: An example from heat wave—SST associations. Sci. Rep. 2016, 6, 29599. [Google Scholar] [CrossRef] [PubMed] [Green Version]
  33. Maldonado, T.; Rutgersson, A.; Amador, J.; Alfaro, E.; Claremar, B. Variability of the Caribbean low-level jet during boreal winter: Large-scale forcings. Int. J. Clim. 2016, 36, 1954–1969. [Google Scholar] [CrossRef]
  34. Richardson, P.L. Caribbean Current and eddies as observed by surface drifters. Deep. Sea Res. Part II Top. Stud. Oceanogr. 2005, 52, 429–463. [Google Scholar] [CrossRef]
  35. Heyman, W.D.; Cuevas, E.; Requena, N.; Garbutt, D.; Bolser, D.; Wade, B.; Olivares, M.; Kobara, S.; Welbrock, N.; Salceda, A.; et al. The Cayman Crown: Newly protected coral reefs at the edge of the Cayman Trench. Coral Reefs 2023, 42, 615–620. [Google Scholar] [CrossRef]
  36. Restrepo-Ángel, J.D.; Mora-Páez, H.; Díaz, F.; Govorcin, M.; Wdowinski, S.; Giraldo-Londoño, L.; Tosic, M.; Fernández, I.; Paniagua-Arroyave, J.F.; Duque-Trujillo, J.F. Coastal subsidence increases vulnerability to sea level rise over twenty first century in Cartagena, Caribbean Colombia. Sci. Rep. 2021, 11, 18873. [Google Scholar] [CrossRef]
  37. Gómez, J.F.; Kwoll, E.; Walker, I.J.; Shirzaei, M. Vertical land motion as a driver of coastline changes on a deltaic system in the colombian Caribbean. Geosciences 2021, 11, 300. [Google Scholar] [CrossRef]
  38. Domínguez-González, L.; Andreani, L.; Stanek, K.P.; Gloaguen, R. Geomorpho-tectonic evolution of the jamaican restraining bend. Geomorphology 2015, 228, 320–334. [Google Scholar] [CrossRef]
  39. Skrivanek, A.; Dutton, A.; Stemann, T.; Vyverberg, K.; Mitrovica, J.X. Evidence of tectonism based on differential uplift of the Falmouth Formation of Jamaica. GSA Bull. 2018, 130, 707–720. [Google Scholar] [CrossRef]
  40. James-Williamson, S.A.; Mitchell, S.F.; Ramsook, R. Tectono-stratigraphic development of the Coastal Group of south-eastern Jamaica. J. South Am. Earth Sci. 2014, 50, 40–47. [Google Scholar] [CrossRef]
  41. Khan, N.S.; Ashe, E.; Horton, B.P.; Dutton, A.; Kopp, R.E.; Brocard, G.; Engelhart, S.E.; Hill, D.F.; Peltier, W.; Vane, C.H.; et al. Drivers of Holocene sea-level change in the Caribbean. Quat. Sci. Rev. 2017, 155, 13–36. [Google Scholar] [CrossRef]
  42. Taburet, G.; Sanchez-roman, A.; Ballarotta, M.; Pujol, M.; Legeais, J. DUACS DT2018: 25 years of reprocessed sea level altimetry products. Ocean Sci. 2019, 2014, 1207–1224. [Google Scholar] [CrossRef] [Green Version]
  43. Pujol, M.-I.; Faugère, Y.; Taburet, G.; Dupuy, S.; Pelloquin, C.; Ablain, M.; Picot, N. DUACS DT2014: The new multi-mission altimeter data set reprocessed over 20 years. Ocean Sci. 2016, 12, 1067–1090. [Google Scholar] [CrossRef] [Green Version]
  44. Peltier, W.R. Global glacial isostasy and the surface of the ice-age earth: The ICE-5G (VM2) model and GRACE. Annu. Rev. Earth Planet. Sci. 2004, 32, 111–149. [Google Scholar] [CrossRef]
  45. Taylor, M.A.; Enfield, D.B.; Chen, A.A. Influence of the tropical Atlantic versus the tropical Pacific on Caribbean rainfall. J. Geophys. Res. Atmos. 2002, 107107, 3127. [Google Scholar] [CrossRef] [Green Version]
  46. Stephenson, T.S.; Vincent, L.A.; Allen, T.L.; Van Meerbeeck, C.J.; McLean, N.; Peterson, T.C.; Taylor, M.A.; Aaron-Morrison, A.P.; Auguste, T.; Bernard, D.; et al. Changes in extreme temperature and precipitation in the Caribbean region, 1961–2010. Int. J. Clim. 2014, 34, 2957–2971. [Google Scholar] [CrossRef]
  47. Spence, J.M.; Taylor, M.A.; Chen, A.A. The Effects of Concurrent Sea-Surface Temperature Anomalies in the Tropical Pacific and Atlantic on Caribbean Rainfall. Int. J. Climatol. 2004, 1541, 1531–1541. [Google Scholar] [CrossRef]
  48. Losada, I.J.; Reguero, B.G.; Méndez, F.J.; Castanedo, S.; Abascal, A.J.; Mínguez, R. Long-term changes in sea-level components in Latin America and the Caribbean. Glob. Planet. Chang. 2013, 104, 34–50. [Google Scholar] [CrossRef]
  49. Ablain, M.; Legeais, J.F.; Prandi, P.; Marcos, M.; Fenoglio-Marc, L.; Dieng, H.B.; Benveniste, J.; Cazenave, A. Satellite Altimetry-Based Sea Level at Global and Regional Scales. Surv. Geophys. 2017, 38, 7–31. [Google Scholar] [CrossRef]
  50. Hersbach, H.; Bell, B.; Berrisford, P.; Hirahara, S.; Horányi, A.; Muñoz-Sabater, J.; Nicolas, J.; Peubey, C.; Radu, R.; Schepers, D.; et al. The ERA5 global reanalysis. Q. J. R. Meteorol. Soc. 2020, 146, 1999–2049. [Google Scholar] [CrossRef]
  51. Barbariol, F.; Davison, S.; Falcieri, F.M.; Ferretti, R.; Ricchi, A.; Sclavo, M.; Benetazzo, A. Wind Waves in the Mediterranean Sea: An ERA5 Reanalysis Wind-Based Climatology. Front. Mar. Sci. 2021, 8, 760614. [Google Scholar] [CrossRef]
  52. Chang, P.; Ji, L.; Li, H.; Penland, C.; Matrosova, L. Prediction of tropical Atlantic sea surface temperature. Geophys. Res. Lett. 1998, 25, 1193–1196. [Google Scholar] [CrossRef]
  53. Soukissian, T.H.; Karathanasi, F.E.; Zaragkas, D.K. Exploiting offshore wind and solar resources in the Mediterranean using ERA5 reanalysis data. Energy Convers. Manag. 2021, 237, 114092. [Google Scholar] [CrossRef]
  54. Wang, C. Variability of the Caribbean Low-Level Jet and its relations to climate. Clim. Dyn. 2007, 29, 411–422. [Google Scholar] [CrossRef] [Green Version]
  55. Whyte, F.S.; Taylor, M.A.; Stephenson, T.S.; Campbell, J.D. Features of the Caribbean low level jet. Int. J. Climatol. 2008, 28, 119–128. [Google Scholar] [CrossRef]
  56. Jury, M.R. Long-Term Variability and Trends in the Caribbean Sea. Int. J. Oceanogr. 2011, 2011, 465810. [Google Scholar] [CrossRef]
  57. Antuña-Marrero, J.C.; Otterå, O.H.; Robock, A.; Mesquita, M.D.S. Modelled and observed sea surface temperature trends for the Caribbean and Antilles. Int. J. Clim. 2015, 36, 1873–1886. [Google Scholar] [CrossRef]
  58. Jones, J.J.; Stephenson, T.S.; Taylor, M.A.; Campbell, J.D. Statistical downscaling of North Atlantic tropical cyclone frequency and the amplified role of the Caribbean low-level jet in a warmer climate. J. Geophys. Res. Atmos. 2016, 121, 3741–3758. [Google Scholar] [CrossRef]
  59. Volkov, D.L.; Lee, S.-K.; Domingues, R.; Zhang, H.; Goes, M. Interannual Sea Level Variability Along the Southeastern Seaboard of the United States in Relation to the Gyre-Scale Heat Divergence in the North Atlantic. Geophys. Res. Lett. 2019, 46, 7481–7490. [Google Scholar] [CrossRef] [Green Version]
  60. Ablain, M.; Meyssignac, B.; Zawadzki, L.; Jugier, R.; Ribes, A.; Cazenave, A.; Picot, N. Uncertainty in Satellite estimate of Global Mean Sea Level changes, trend and acceleration. Earth Syst. Sci. Data Discuss. 2019, 2, 1–26. [Google Scholar] [CrossRef] [Green Version]
  61. Zhang, Z.; Moore, J.C. Empirical Orthogonal Functions. Mathematical and Physical Fundamentals of Climate Change; Elsevier: Amsterdam, The Netherlands, 2015; pp. 161–197. [Google Scholar] [CrossRef]
  62. Gravetter, F.J.; WaLLnau, L.B. Statistics for the Behavioral Sciences, 10th ed.; Cengage Learning: Boston, MA, USA, 2017. [Google Scholar]
  63. Field, A. An Adventure in Statistics; SAGE Publications Ltd.: London, UK, 2016. [Google Scholar]
  64. Hipel, A.I.; McLeod, K.W. Time Series Modelling of Water Resources and Environmental Systems; Elsevier: Amsterdam, The Netherlands, 1994. [Google Scholar]
  65. Welhouse, L.J.; Lazzara, M.A.; Keller, L.M.; Tripoli, G.J.; Hitchman, M.H. Composite analysis of the effects of ENSO events on Antarctica. J. Clim. 2016, 29, 1797–1808. [Google Scholar] [CrossRef]
  66. Taylor, M.A.; Stephenson, T.S.; Owino, A.; Chen, A.A.; Campbell, J.D. Tropical gradient influences on Caribbean rainfall. J. Geophys. Res. Atmos. 2011, 116, 1–14. [Google Scholar] [CrossRef]
  67. Wang, X.; Liu, H.; Foltz, G.R. Persistent influence of tropical North Atlantic wintertime sea surface temperature on the subsequent Atlantic hurricane season. Geophys. Res. Lett. 2017, 44, 7927–7935. [Google Scholar] [CrossRef]
  68. Glenn, E.; Comarazamy, D.; González, J.E.; Smith, T. Detection of recent regional sea surface temperature warming in the Caribbean and surrounding region. Geophys. Res. Lett. 2015, 42, 6785–6792. [Google Scholar] [CrossRef]
  69. Duan, X.; Xue, F.; Zheng, F. Sea surface temperature anomaly in the tropical North Atlantic during El Niño decaying years. Atmos. Ocean. Sci. Lett. 2021, 14, 100077. [Google Scholar] [CrossRef]
  70. Wang, C.; Enfield, D.B.; Lee, S.-K.; Landsea, C.W. Influences of the Atlantic warm pool on western hemisphere summer rainfall and Atlantic hurricanes. J. Clim. 2006, 19, 3011–3028. [Google Scholar] [CrossRef]
  71. Enfield, D.B.; Mayer, D.A. Tropical atlantic sea surface temperature variability and its relation to El Niño-Southern Oscillation. J. Geophys. Res. C Oceans 1997, 102, 929–945. [Google Scholar] [CrossRef] [Green Version]
  72. Rodriguez-Vera, G.; Romero-Centeno, R.; Castro, C.L.; Castro, V.M. Coupled interannual variability of wind and sea surface temperature in the Caribbean Sea and the Gulf of Mexico. J. Clim. 2019, 32, 4263–4280. [Google Scholar] [CrossRef] [Green Version]
  73. Vega, M.J.; Alvarez-Silva, O.; Restrepo, J.C.; Ortiz, J.C.; Otero, L.J. Interannual variability of wave climate in the Caribbean Sea. Ocean Dyn. 2020, 70, 965–976. [Google Scholar] [CrossRef]
  74. Fedorov, A.V.; Philander, S.G. Is El Nino Changing? Science 2000, 288, 1997–2002. [Google Scholar] [CrossRef] [PubMed] [Green Version]
  75. García-Martínez, I.M.; Bollasina, M.A. Sub-monthly evolution of the Caribbean Low-Level Jet and its relationship with regional precipitation and atmospheric circulation. Clim. Dyn. 2020, 54, 4423–4440. [Google Scholar] [CrossRef] [Green Version]
  76. Climate Studies Group Mona (CSGM). The State of the Jamaican Climate (Volume III): Information for Resilience Building; Planning Institute of Jamaica: Kingston, Jamaica, 2022.
  77. Martinez, C.; Goddard, L.; Kushnir, Y.; Ting, M. Seasonal climatology and dynamical mechanisms of rainfall in the Caribbean. Clim. Dyn. 2019, 53, 825–846. [Google Scholar] [CrossRef] [Green Version]
  78. Martinez, C.; Kushnir, Y.; Goddard, L.; Ting, M. Interannual variability of the early and late-rainy seasons in the Caribbean. Clim. Dyn. 2020, 55, 1563–1583. [Google Scholar] [CrossRef]
  79. Curtis, S.; Gamble, D.W. Regional variations of the Caribbean mid-summer drough. Theor. Appl. Clim. 2008, 94, 25–34. [Google Scholar] [CrossRef]
  80. Muñoz, E.; Busalacchi, A.J.; Nigam, S.; Ruiz-Barradas, A. Winter and summer structure of the Caribbean low-level jet. J. Clim. 2008, 21, 1260–1276. [Google Scholar] [CrossRef] [Green Version]
  81. Jevrejeva, S.; Matthews, A.; Williams, J. Development of a Coastal Data hub for Stakeholder Access in the Caribbean Region; National Oceanography Centre: Liverpool, UK, 2019. [Google Scholar]
  82. Caviedes, C.N. Five hundred years of hurricanes in the Caribbean: Their relationship with global climatic variabilities. GeoJournal 1991, 23, 301–310. [Google Scholar] [CrossRef]
  83. Kimball, S.K.; Mulekar, M.S. A 15-year climatology of North Atlantic tropical cyclones. Part I: Size parameters. J. Clim. 2004, 17, 3555–3575. [Google Scholar] [CrossRef]
  84. Cashman, A.; Nurse, L.; John, C. Climate change in the caribbean: The water management implications. J. Environ. Dev. 2010, 19, 42–67. [Google Scholar] [CrossRef]
  85. Mercer, J. Disaster risk reduction or climate change adaptation: Are we reinventing the wheel? J. Int. Dev. 2010, 22, 247–264. [Google Scholar] [CrossRef]
  86. CREWS. Climate Risk Early Warning Systems (CREWS) Caribbean: Strengthening Hydro-Meteorological and Early Warning Services in the Caribbean. Available online: https://www.crews-initiative.org/en (accessed on 15 January 2023).
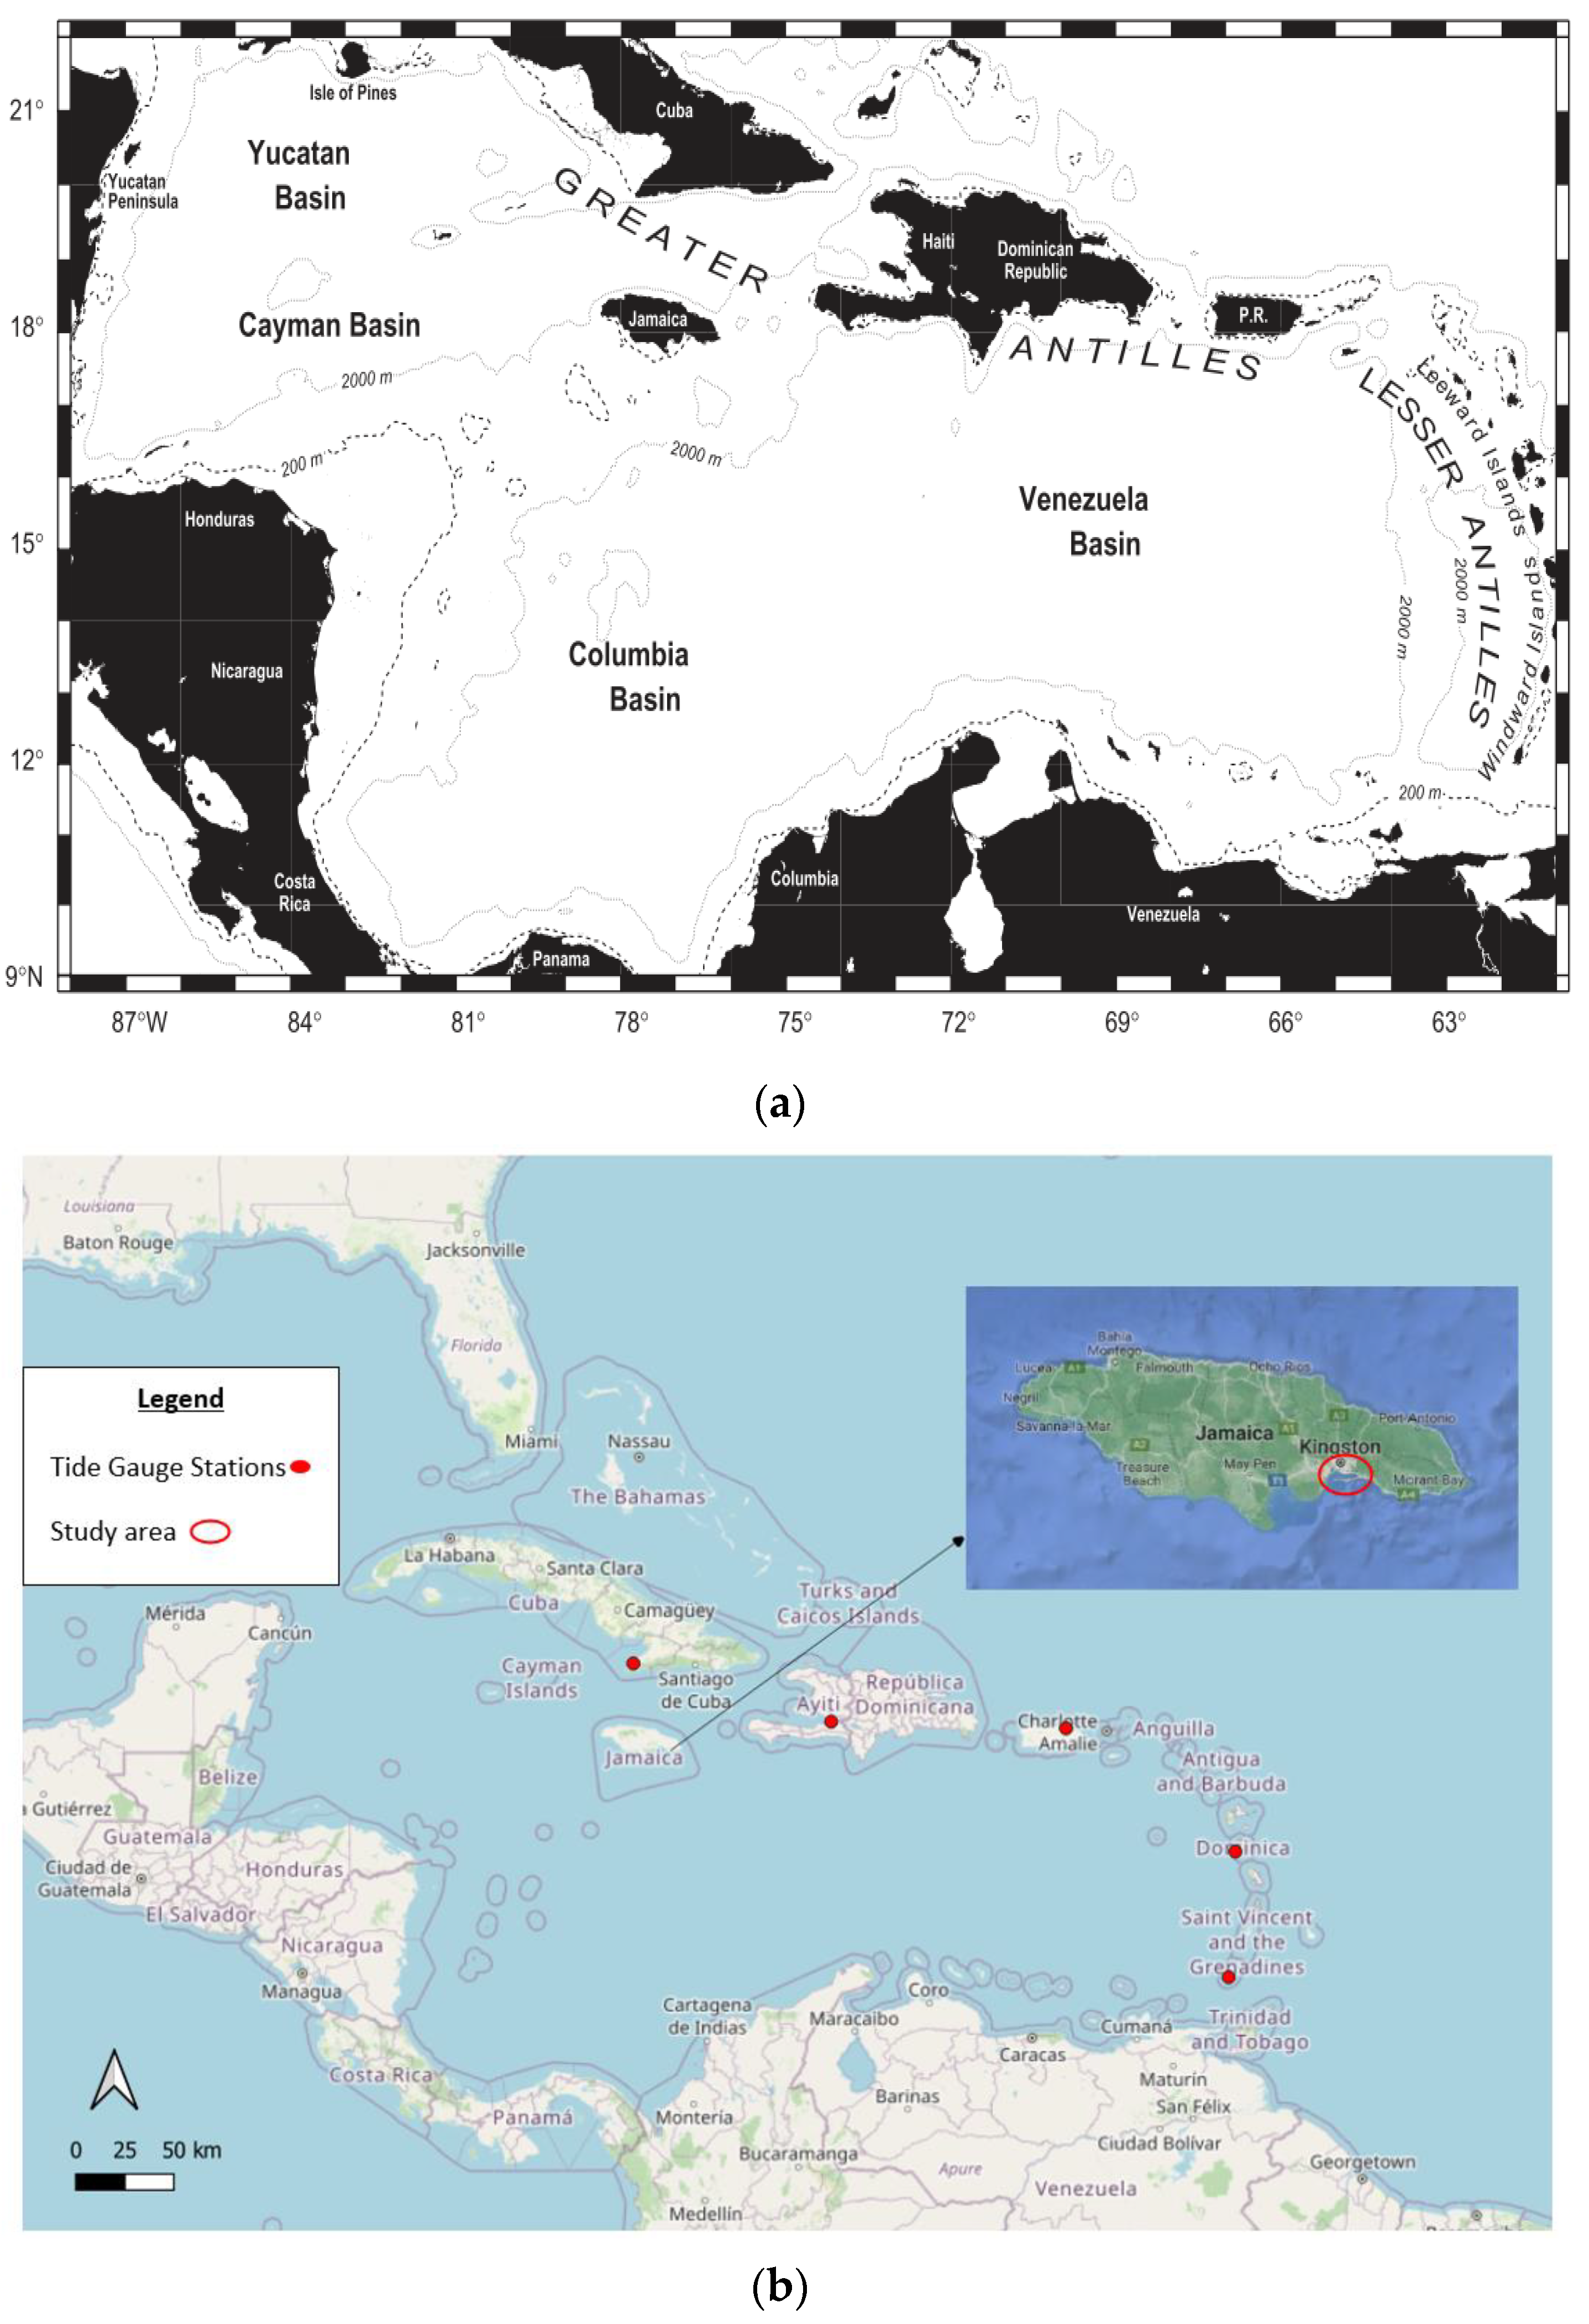
Figure 1. (a) Map of Caribbean Sea showing depth (Reprinted/adapted with permission from Richardson (2005) [34], 2005, Elsevier). (b) Map of the Caribbean, Jamaica and study area highlighted.
Jmse 11 01499 g001
Figure 2. (a) Sea level trend in the Caribbean basin (mm/year). (b) Sea level anomalies 1993–2019 (mm). (c) Annual cycle of sea level anomalies, for Kingston, Jamaica. Anomalies with respect to 1993–2019 baseline. (d) Seasonal variation with respect to the annual cycle mean (mm). (e) Seasonal sea level variability (annual cycle amplitude, cm).
Jmse 11 01499 g002aJmse 11 01499 g002b
Figure 3. Spatial variability (Left column) and timeseries of principal components (Right column) of the leading EOF of sea levels in the Caribbean for raw (a,b), detrended (c,d), deseasoned (e,f), and detrended and deseasoned (g,h) altimetry data, spanning 1993–2019.
Jmse 11 01499 g003aJmse 11 01499 g003b
Figure 4. (a) PC1_deseasoned and Caribbean Sea Surface temperature anomalies (Corr = 0.65), (b) PC1_des_det and Deseasoned + Detrended Kingston altimetry data (Corr = 0.86).
Jmse 11 01499 g004aJmse 11 01499 g004b
Figure 5. Spatial variability (Left column) and timeseries of principal components (Right column) of the leading EOF of summer (June–September) sea levels in the Caribbean for raw (a,b) and detrended (c,d) altimetry data. Period of analysis is 1993–2019.
Jmse 11 01499 g005
Figure 6. Composite of sea surface temperatures (left panels) and ERA5 Reanalysis resultant wind (right panels) for (a) high summer sea level years, (b) low summer sea level years, (c) difference between high and low years. Hatching in (c) indicates regions with statistically significant difference.
Jmse 11 01499 g006
Table 3. The explained variance of the first three principal components (PCs) from EOF analysis of altimetry data from 1993–2019 for the Caribbean basin. Columns two through four show, respectively, (i) the raw monthly data, (ii) the data with linear trend removed (detrended), (iii) the data with the seasonal cycle removed (deseasoned), and (iv) the detrended and deseasoned data.
Explained Variance (%)
RawDetrendedDeseasonedDetrended and Deseasoned
PC136.8429.8826.6854.28
PC27.178.096.678.40
PC35.656.066.366.47
Table 4. (a) Correlations between climate and ocean indices and the 2 leading PCs of the Raw, Detrended, Deseasoned, and Deseasoned & Detrended altimetry data. (b) As in (a), but for the leading PCs of the Raw and Detrended data for the summer season (June to September).
(a) Full Dataset
VariableNino 3.0Nino 3.4Carib SSTWind CLLJ SLPPDOAMONAOPac–Atl
PC1_raw0.220.250.46−0.03−0.09−0.40−0.040.380.00−0.55
PC2_raw−0.19−0.190.03−0.49−0.50−0.25−0.240.11−0.01−0.29
PC1_detrended0.200.250.18−0.09−0.18−0.460.080.23−0.02−0.61
PC2_detrended−0.19−0.19−0.02−0.51−0.54−0.32−0.220.11−0.04−0.35
PC1_deseasoned0.310.330.630.200.21−0.010.080.270.050.09
PC2_deseasoned−0.06−0.070.11−0.05−0.11−0.08−0.130.18−0.09−0.09
PC1_des_det0.550.600.290.710.570.210.54−0.130.290.66
PC2_des_det0.040.01−0.14−0.090.120.01−0.07−0.13−0.060.07
(b) Summer
Sum_PC10.210.220.450.530.430.200.050.28−0.240.11
Sum_PC1_det−0.29−0.39−0.02−0.68−0.54−0.58−0.510.160.05−0.50
Table 5. High and low summer sea level anomaly years for Jamaica classified according to ENSO modes of variability. High (low) sea level years correspond to the 75th (25th) quartile. ENSO mode determined using the Oceanic Niño Index (ONI), accessed from https://origin.cpc.ncep.noaa.gov/products/analysis_monitoring/ensostuff/ONI_v5.php (accessed on 1 November 2022).
Low Sea Level YearsHigh Sea Level Years
El Niño 1994, 2015, 2018, 2019,
La Niña1999, 2007, 2011 2008
Neutral2005, 2006, 20132003
Disclaimer/Publisher’s Note: The statements, opinions and data contained in all publications are solely those of the individual author(s) and contributor(s) and not of MDPI and/or the editor(s). MDPI and/or the editor(s) disclaim responsibility for any injury to people or property resulting from any ideas, methods, instructions or products referred to in the content.