Article

Field Measurements of Longshore Sediment Transport along Denu Beach, Volta Region, Ghana

by
Kwami Serge Foga Agbetossou
1,2,*,
Denis Worlanyo Aheto
1,2,
Donatus Bapentire Angnuureng
1,2,
Leo Cornelius van Rijn
3,
Koko Zébéto Houédakor
4,
Emmanuel Kwadzo Brempong
1,2,5 and
Folly Serge Tomety
6
1
Africa Centre of Excellence in Coastal Resilience (ACECoR), Centre for Coastal Management (CCM), University of Cape Coast, Cape Coast PMB TF0494, Ghana
2
Department of Fisheries and Aquatic Sciences, University of Cape Coast, Cape Coast PMB TF0494, Ghana
3
LVRS-Consultancy, 8356DS Blokzijl, The Netherlands
4
Department of Geography, University of Lomé, Lomé 01 BP 1515, Togo
5
Laboratoire d’Etudes en Géophysique et Océanographie Spatiales (LEGOS), Université de Toulouse/CNRS/CNES/IRD, 31400 Toulouse, France
6
Nansen-Tutu Centre, Department of Oceanography, University of Cape Town, Cape Town 7700, South Africa
*
Author to whom correspondence should be addressed.
J. Mar. Sci. Eng. 2023, 11(8), 1576; https://doi.org/10.3390/jmse11081576
Submission received: 27 April 2023 / Revised: 8 June 2023 / Accepted: 19 June 2023 / Published: 10 August 2023
(This article belongs to the Section Coastal Engineering)

Abstract

:
Field measurements of longshore sediment transport have been performed in the surf zone along Denu Beach, located in the Volta Region of Ghana, West Africa. This study consisted of measuring sediment transport rates by the deployment of modified versions of Kraus streamer traps on a cross-shore distance, which was about half the average surf zone width. In addition to the measured transport rates, data on waves, longshore currents, and other morphological parameters were collected with simple and low-cost instrumentation. In total, about 22 datasets were obtained through several days of data collection spanning a period of 5 months. Mathematical formulae proposed by CERC (1984), Kamphuis (1991), and the new van Rijn (2014) were used to compute theoretical transports for the entire surf zone, which were validated by measured data. Applying the CERC equation with a K-value of 0.39, the theoretical transports were about one order of magnitude higher than the measured rates. The rates computed by the Kamphuis formula were slightly higher than those yielded by the van Rijn equation. They produced values that were, on average, about 3.5 and 2.9 times higher than the measured rates, respectively. This study then confirmed the capabilities of both the Kamphuis and van Rijn equations to provide closer estimates of longshore sediment transport on Denu Beach. It especially sheds light on the new van Rijn formula, which has not been used extensively in LST quantification across the world. We, therefore, concluded that both the Kamphuis and van Rijn equations could be particularly useful to local engineers in the prediction of LST prior to the design of coastal protection structures. Further long-term studies employing available cutting-edge technologies were also recommended to provide more information on longshore transport not only in Ghana but also in the entire Gulf of Guinea and for the establishment of a reliable sediment budget for the country and the entire region.

1. Introduction

Nearshore sediment transportation occurs in two ways. These include cross-shore transport and longshore transport [1]. The cross-shore transport describes the movement of sediment particles in a direction that is normal to the shoreline. This movement can either occur in the shoreward direction along with the wave runup or in the seaward direction along with undertows or rip currents. The alongshore movement of sediment particles begins with an oblique attack of waves which, after energy dissipation through shallow waters, trigger a shore parallel movement of water that is strong enough to move particles along the coast [2]. This shore parallel movement of water induced by the momentum of breaking waves is also known as the longshore current and constitutes a driving force of longshore sediment transport (LST) [3]. In the Gulf of Guinea, the LST involves about 1 million cubic meters of sand per year: a value which is known to be one of the highest rates in the world [4]. The disturbance of this rate by some infrastructures built both inland (such as river dams) and at some points on the coast (harbor jetties) has caused serious implications to coastal stability in the region due to a reduction in riverine sediment discharge and the blockage of littoral sediment transit. This situation has evolved drastically in recent years. Several funds have, therefore, been provided to initiate strategies and come up with better management plans to provide a long-lasting solution to the issue of coastal erosion in this region [4]. It is worth highlighting one of the programs, which is the West Africa Coastal Areas Management Program (WACA) of the World Bank, a regional Program operating in several West African countries and under which several commendable activities and projects are currently being undertaken.
The fight against coastal erosion is mostly conducted through the construction of engineering structures along the coast. This is particularly obvious in developing countries, especially those in West Africa, where numerous protection structures, mostly hard engineering in nature, are constructed along the regional coastline. An important part of these structures consists essentially of groynes, which are constructed to counteract the coastal erosion induced by longshore sediment transport. However, it is surprising to note that no field measurements have been performed to quantify LST at several parts where these structures are built in the region. This is rather imprudent given that the longshore transport is the major conveyor of the littoral sediment transport in the region. Though some studies (e.g., [5,6,7,8]) have been undertaken, these were uniquely based on the application of some mathematical formulae to estimate the transport rates from somewhat coarse resolution data. However, the combination of both field experiments and mathematical predictions is necessary to have a perfect understanding of the sediment dynamics and reduce as much as possible uncertainties in the quantification process.
In the process of estimating the LST, the reconciliation of both measured and theoretical rates is still one of the major challenges faced by coastal engineers worldwide. This situation is due to the complexity of different stochastic parameters operating in the coastal environment [9], which work together to render the surf zone the most dynamic component of the nearshore area [10]. Nevertheless, an accurate estimation of the sand transport rates in the surf zone is crucial for every engineering intervention, either hard or soft, to be successful [11]. Obtaining a satisfying agreement between both the measured and computed sand transport could be very useful in the design of coastal protection structures and could avoid instances where structures fail to fulfill their tasks due to an incorrect prediction of the sand rates. This exercise could also help improve the trapping efficiency of structures (groynes), right from the design stage, as well as beach nourishment schemes, especially in this era in which soft measures are promoted.
The goal of this study was, therefore, to make use of simple and low-cost techniques to provide reliable estimates of the longshore sand transport in Denu at low wave conditions and compare these results with those obtained by three different formulae including the CERC (1984) formula [12], the Kamphuis (1991) [13] formula and the van Rijn (2014) equation [14]. This could be a low-cost alternative to local engineers who, for some reason, do not usually perform such studies before constructing protection structures along the coast. The idea is also to share more light on the van Rijn formula in Africa.

2. Materials and Methods

2.1. Study Area

The study took place along Denu Beach (Figure 1). Denu is located in the Volta Delta, which itself lies in the Gulf of Guinea. Denu shares most of the characteristics of the Volta Delta. The Volta Delta is located in the lower Volta River basin and covers an estimated area of 4562 km2, between longitudes 0°40′ E and 1°10′ E and latitudes 5°25′ N and 6°20′ N [7]. It is a sub-component of the Keta geological setting, which is characterized by a fault-controlled sedimentary basin underlain by the Dahomeyan system of gneiss and schist, which consists of 870 m of Paleozoic marine and non-marine sediments [15]. The grain size ranged from medium to coarse (0.4–1 mm), with a median value (d50) of about 0.6 mm [16]. The delta coastal area receives a number of precipitations ranging from 146 to 750 mm per year [17], with the major rainy season occurring between March and July and the dry season from November to February [18]. The warmest temperature of 30° is experienced in March, while the lowest occurs in August and is about 26°.
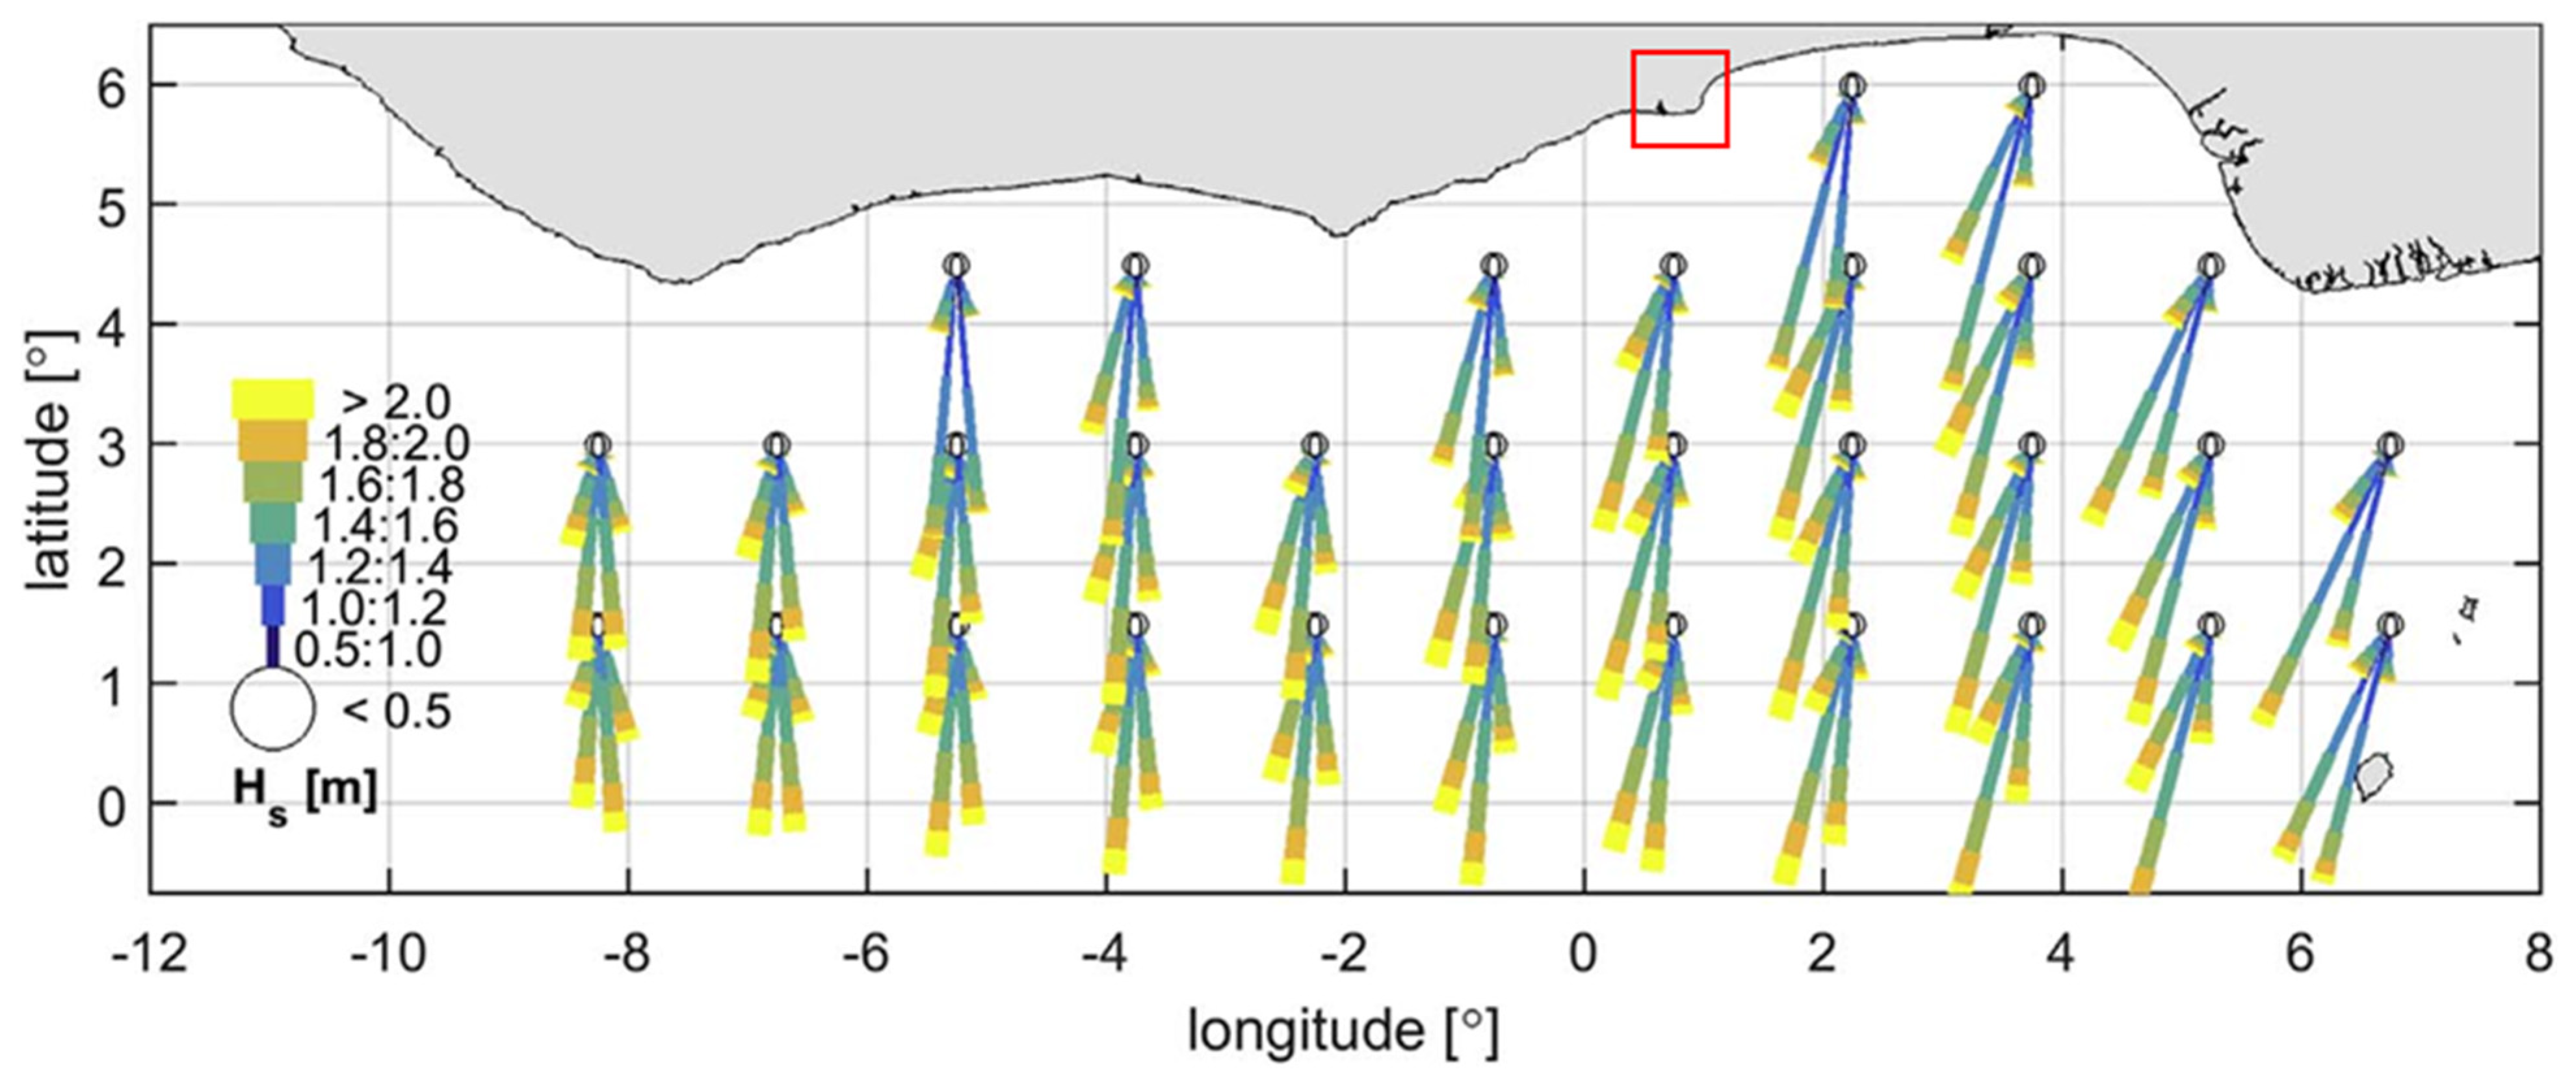
The Volta delta experiences waves with periods ranging between 6 to 16 s and an average significant wave height of 1.4 m [16]. As shown in Figure 2, the waves mainly come from a southwest direction (210–240°), as well as the wind which has an average speed in the range of 1.7 to 2.6 m/s [19].
The coastline orientation changes significantly (SW-NE) from Keta towards the east. The tides are semi-diurnal with an average tidal range of about 1 m (micro-tidal) [20] and a characteristic amplitude of about 0.5 m; the average upper beach slope is about 1:3 while the lower beach slope ranges from 1:10 to 1:15 [21].

2.2. Data Collection

2.2.1. Wave Parameters

To achieve the objectives of this study, a wide range of data were collected concurrently with sediment sampling during mild wave conditions (no storms). The breaker height was measured based on the Hoyt technique presented by [22]. The waves breaking just behind a scaled rod were videotaped. This rod was placed at a position that was as close as possible to the average breaker line and was painted in alternating black and white colors to facilitate the readings. Each spot of color spanned 10 cm on the rod. Each breaker height was carefully determined from the video images to be the difference between the wave crest and the wave trough. The significant wave height was then determined as the average of the highest one-third of the wave heights. The wave period was measured with a stopwatch (e.g., [23]), and the breaker angle by sighting with a compass the acute angle between the wave direction and the shore normal at the breaker line (e.g., [24]).

2.2.2. Longshore Velocity Measurement

Both the longshore current direction and velocity in the mid-surf zone were determined by a drifting material, using the time it took for it to travel a 20 m stretch alongshore: a distance which encompassed the cross-shore transect on which the sediment trapping operations were undertaken. This technique was similar to the one used by [24]. During each deployment of the traps, this procedure was repeated several times as allowed by the sediment sampling duration. This was to obtain the most representative velocity. However, the drifting wood only provided the surface velocity. Therefore, the surface velocity was converted into a depth-averaged velocity with the following equation by [25], based on the channel experiments performed under a uniform and steady flow:
u ¯ = 0.8   V s
in which u ¯ is the depth-averaged velocity and Vs is the surface velocity; the factor of 0.8 was obtained experimentally by the ratio of the average velocity to the surface velocity, considering several data points.

2.2.3. Computation of Longshore Velocity

For comparison purposes, the longshore velocity at the mid-surf zone was computed using three different formulae.
According to Longuet-Higgins [26], the longshore velocity at the mid-surf could be obtained by:
V m s = 20.7   t a n β g H b sin θ b r
where tanβ is the beach slope, g is the acceleration of gravity, Hb is the breaking wave height, and θbr is the breaking wave angle.
Komar [27] estimate for the longshore velocity was given by:
V m s = 1.17 g H b sin θ b r   c o s θ b r
The current velocity in the mid-surf zone induced by the breaking waves, according to van Rijn [28] and in which the effect of the wind on the longshore current was also taken into account, could be obtained by the following:
V m s = K 2 g H s , b r sin ( 2 θ b r )
where K2 is a coefficient usually taken as 0.3 and Hs,br is the significant wave height at the breaker line.

2.2.4. The Sediment Transport Measurement

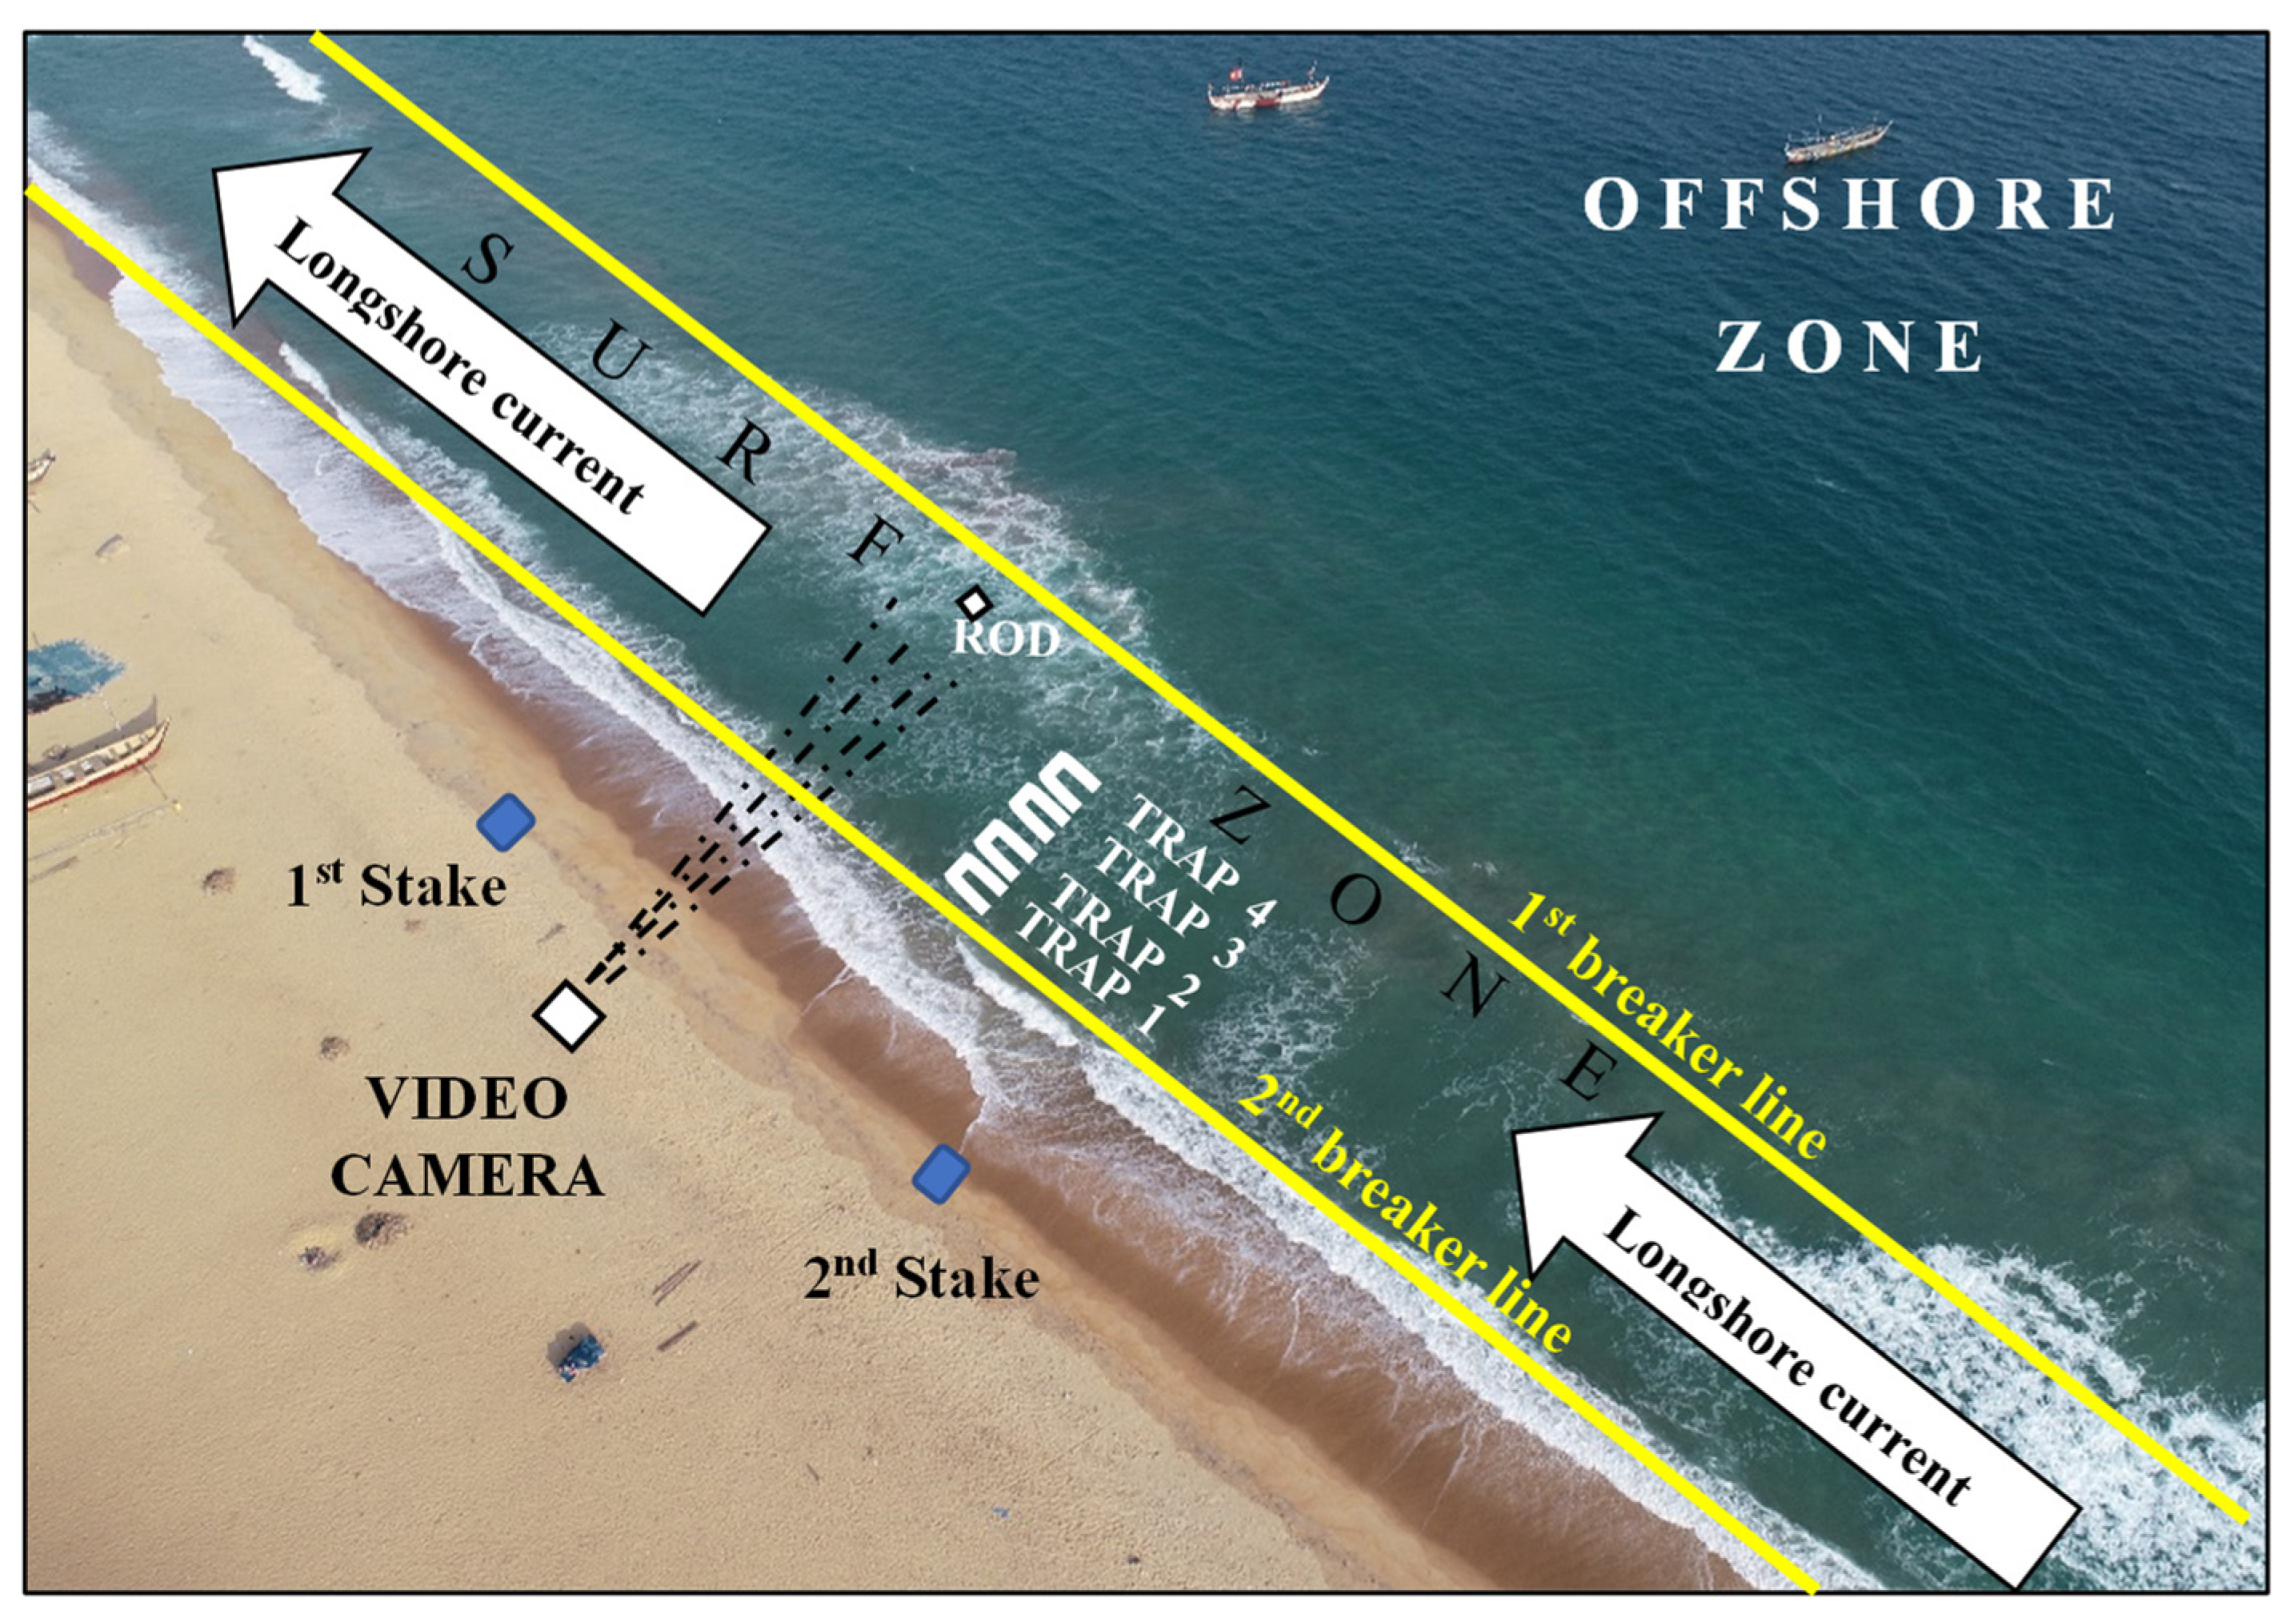
The sand transport rates were measured with streamer traps similar to those designed during the Duck85 experiments [29,30]. A single structure consisted of different nozzles placed at different heights on a vertical frame. A nozzle was associated with a 1 m-long rectangular bag of 63 microns of mesh to capture particles from fine sand and above and allow the water to pass through. This particular configuration of the trap structure was meant to capture the sediment fluxes at desired depths in the water column. The dimensions of each nozzle were 15 cm × 9 cm, and a constant gap of 7 cm was maintained between two consecutive nozzles. The bottom nozzle was always resting on the bed. To minimize scour, the legs of the structures were reduced to 20 cm (e.g., [31]) instead of the original 40 cm in the Duck85 experiments. One person operated one trap. However, sometimes, two operators were needed at the outermost trap to provide more stability since it was the closest to breaking waves and where their strength is felt the most. Additionally, during the measurements, the bed nozzle was closely monitored and carefully adjusted by the operators, who reported negligible scour at the bottom nozzle and no significant disturbance in the flow. Figure 3 shows a sketch of some of the instrumentation used throughout the study period.
The measurements were undertaken during low, rising, and falling tides. Usually, four structures were deployed facing the longshore current and spanning from just seaward of the second breaker to the middle surf zone. They were of different heights in order to accommodate varying depths in the surf zone and to ensure that there would be no sediment fluxes over the topmost nozzle. The tallest frame (1.8 m) was usually placed in a trough in the surf zone. The shortest (1.2 m) was placed just seaward of the second breaker in order to avoid disturbances with the second breaking process, which occurred at the shoreline. The other two structures were 1.5 m tall and were usually deployed on a plateau-like form in the surf zone. The shoreline was considered to be the average line where the swash started. Sometimes, due to unfavorable conditions experienced in the surf zone or the availability of the operators, only three traps were deployed. The average duration of each sediment trapping and the associated hydrodynamic parameter measurements was about 2 to 3 min. Figure 4 shows the deployment of the traps. No measurements were undertaken in the swash. From March to July, several campaigns were undertaken, making about 22 datasets available.
The different sediment fluxes were computed using the formulae presented in Equations (5)–(8), as also used during the Duck85 experiments [30]. The sediment flux at any net of any trap was obtained by:
F ( i ) = S ( i ) w h t
in which F(i) is the sediment flux at the net i (kg·m−2·s−1); S(i) is the dry weight of the sediment at net i (kg); w is the width of the mouth of the net (m); h is the height of the mouth of the net (m); t is the sampling duration (s).
The estimate of the flux between two nozzles was given by:
F E = 0.5 ( F ( i ) + F ( i + 1 ) )
The integration of the fluxes throughout the water column at the particular position of each trap (depth-integrated flux) was given by:
I = h i = 1 N F ( i ) + i = 1 N a ( i ) F E ( i )
in which I is the depth-integrated flux at a given trap (kg·m−2·s−1); N is the number of nets; a(i) is the distance between two consecutive nets (m).
Finally, the sediment fluxes at each trap frame were also integrated over the cross-shore distance spanned by all the traps which were deployed. This was conducted using the following expression:
I T O T A L = [ ( I 1 ) ( d i ) ] + [ 0.5 ( I 1 + I 2 ) ( d 1 ) ] + [ 0.5 ( I 2 + I 3 ) ( d 2 ) ] + [ 0.5 ( I 3 + I 4 ) ( d 3 ) ]
in which ITOTAL is the total flux over the cross-distance; I 1 : depth-integrated flux at Trap 1; d i : distance between the average shoreline and Trap 1; I 2 : depth-integrated flux at Trap 2; d 1 : distance between Trap 1 and Trap 2; I 3 : depth-integrated flux at Trap 3; d 2 : distance between Trap 2 and Trap 3; I 4 : depth-integrated flux at Trap 4; d 3 : distance between Trap 3 and Trap 4.
It is also worth noting that since the measurements were performed during mild wave conditions, the results and comparisons were limited to low wave energy conditions.

2.2.5. Standardization of the Cross-Shore Positions of the Traps

The number of traps deployed was not uniform throughout the different runs. Four structures were deployed during some runs, while only three were deployed during other ones. Additionally, a constant distance was not maintained throughout the runs because of the changing surf width. It is, therefore, difficult to compare the rates among themselves. Therefore, the cross-shore position of each trap from the shoreline was normalized, following the works of [32], which consisted of comparing the rates on the same scale, irrespective of the cross-shore distances spanned by the traps during each deployment. This was conducted by unifying each of these distances (i.e., each of the actual distances spanned by either 3 or 4 traps during each run was taken as 1). Then, the normalized position of each trap was obtained by the ratio of the actual distance of the trap from the shoreline to the actual surf zone width spanned by all the traps deployed. This yielded, for each trap, a number between 0 and 1. The sediment rates were, therefore, re-calculated across new normalized distances to obtain normalized rates.

2.2.6. Prediction of Longshore Sediment Transport Rates

The different theoretical longshore sediment transport rates (LSTRs) were computed using three different expressions, which included the CERC (1984) formula [12], the Kamphuis (1991) formula [13], and the van Rijn (2014) equation [14], was presented as follows:
The CERC formula constitutes a widely used equation that provides an estimate of the sediment transport based on the wave energy approach and where the immersed total LST is proportional to the longshore component of the wave energy flux factor:
Q = K P l
in which Q is the immersed longshore transport expressed in N/s and K is a dimensionless coefficient taken as 0.39, as proposed in [33]. The longshore component of the wave power Pl (in N/s) was obtained by:
P l = E C g , b r sin θ b r c o s θ b r
where E is the wave energy at the breaker line and Cg,br is the wave group celerity at the breaker line. The wave height, which was used in the CERC equation, is the root mean square wave height (Hrms).
Kamphuis estimated the LST reads as follows:
Q c = 2.33 ρ s / ( ρ s ρ ) ( T p ) 1.5 ( t a n β ) 0.75 ( d 50 ) 0.25 ( H s , b r ) 2 [ s i n ( 2 θ b r ) ] 0.6
in which Q c is the longshore transport (dry mass in Kg/s); Tp is the peak wave period, d50 is the median particle size in the surf zone (m); 2.33 is a dimensional coefficient assuming saltwater (1020 kg·m−3) and is related to SI system.
The LST, according to van Rijn, could be obtained by the following expression:
Q c = 0.00018 ρ s g 0.5 ( t a n β ) 0.4 ( d 50 ) 0.6 ( H s , b r ) 3.1 sin ( 2 θ )
where ρ s is the particle density. Regarding the beach slope tanβ, it was recommended by the author that the inner surf zone slope should be used on sandy beaches while the beach slope itself should be used when dealing with shingle beaches. In this study, the beach slope was obtained from the ratio of the breaker depth to the surf zone width.
The sediment samples obtained from each nozzle were used to determine the inner surf zone median grain size (d50) for computation purposes. A specific d50 was obtained for each run and through a standard sieve analysis.

3. Results

3.1. Wave Parameters and Longshore Current

The wave parameters considered in this study included the wave height, the wave period, and the wave angle. The average values of these parameters, as well as the longshore velocity, are presented in Table 1. As in the Duck85 experiments, the run ID 214270914, for example, corresponded to the year (2021), the month (4), the day (27th), and the time (09:14) when the traps were deployed. These wave conditions were relatively calm during the different runs, with average heights ranging from 0.4 m to 0.8 m and significant heights ranging from 0.7 to 1.1 m. The wave period varied from 6 s to 13 s, while the wave angle ranged between 12 and 17 degrees. As far as the current strength is concerned, the measured surface velocity at the mid-surf zone ranged from 0.4 m·s−1 to 0.65 m·s−1, while the depth-averaged ones varied from 0.32 m·s−1 to 0.52 m·s−1. The longshore current direction was unique on the days of measurement, which was from west to east.
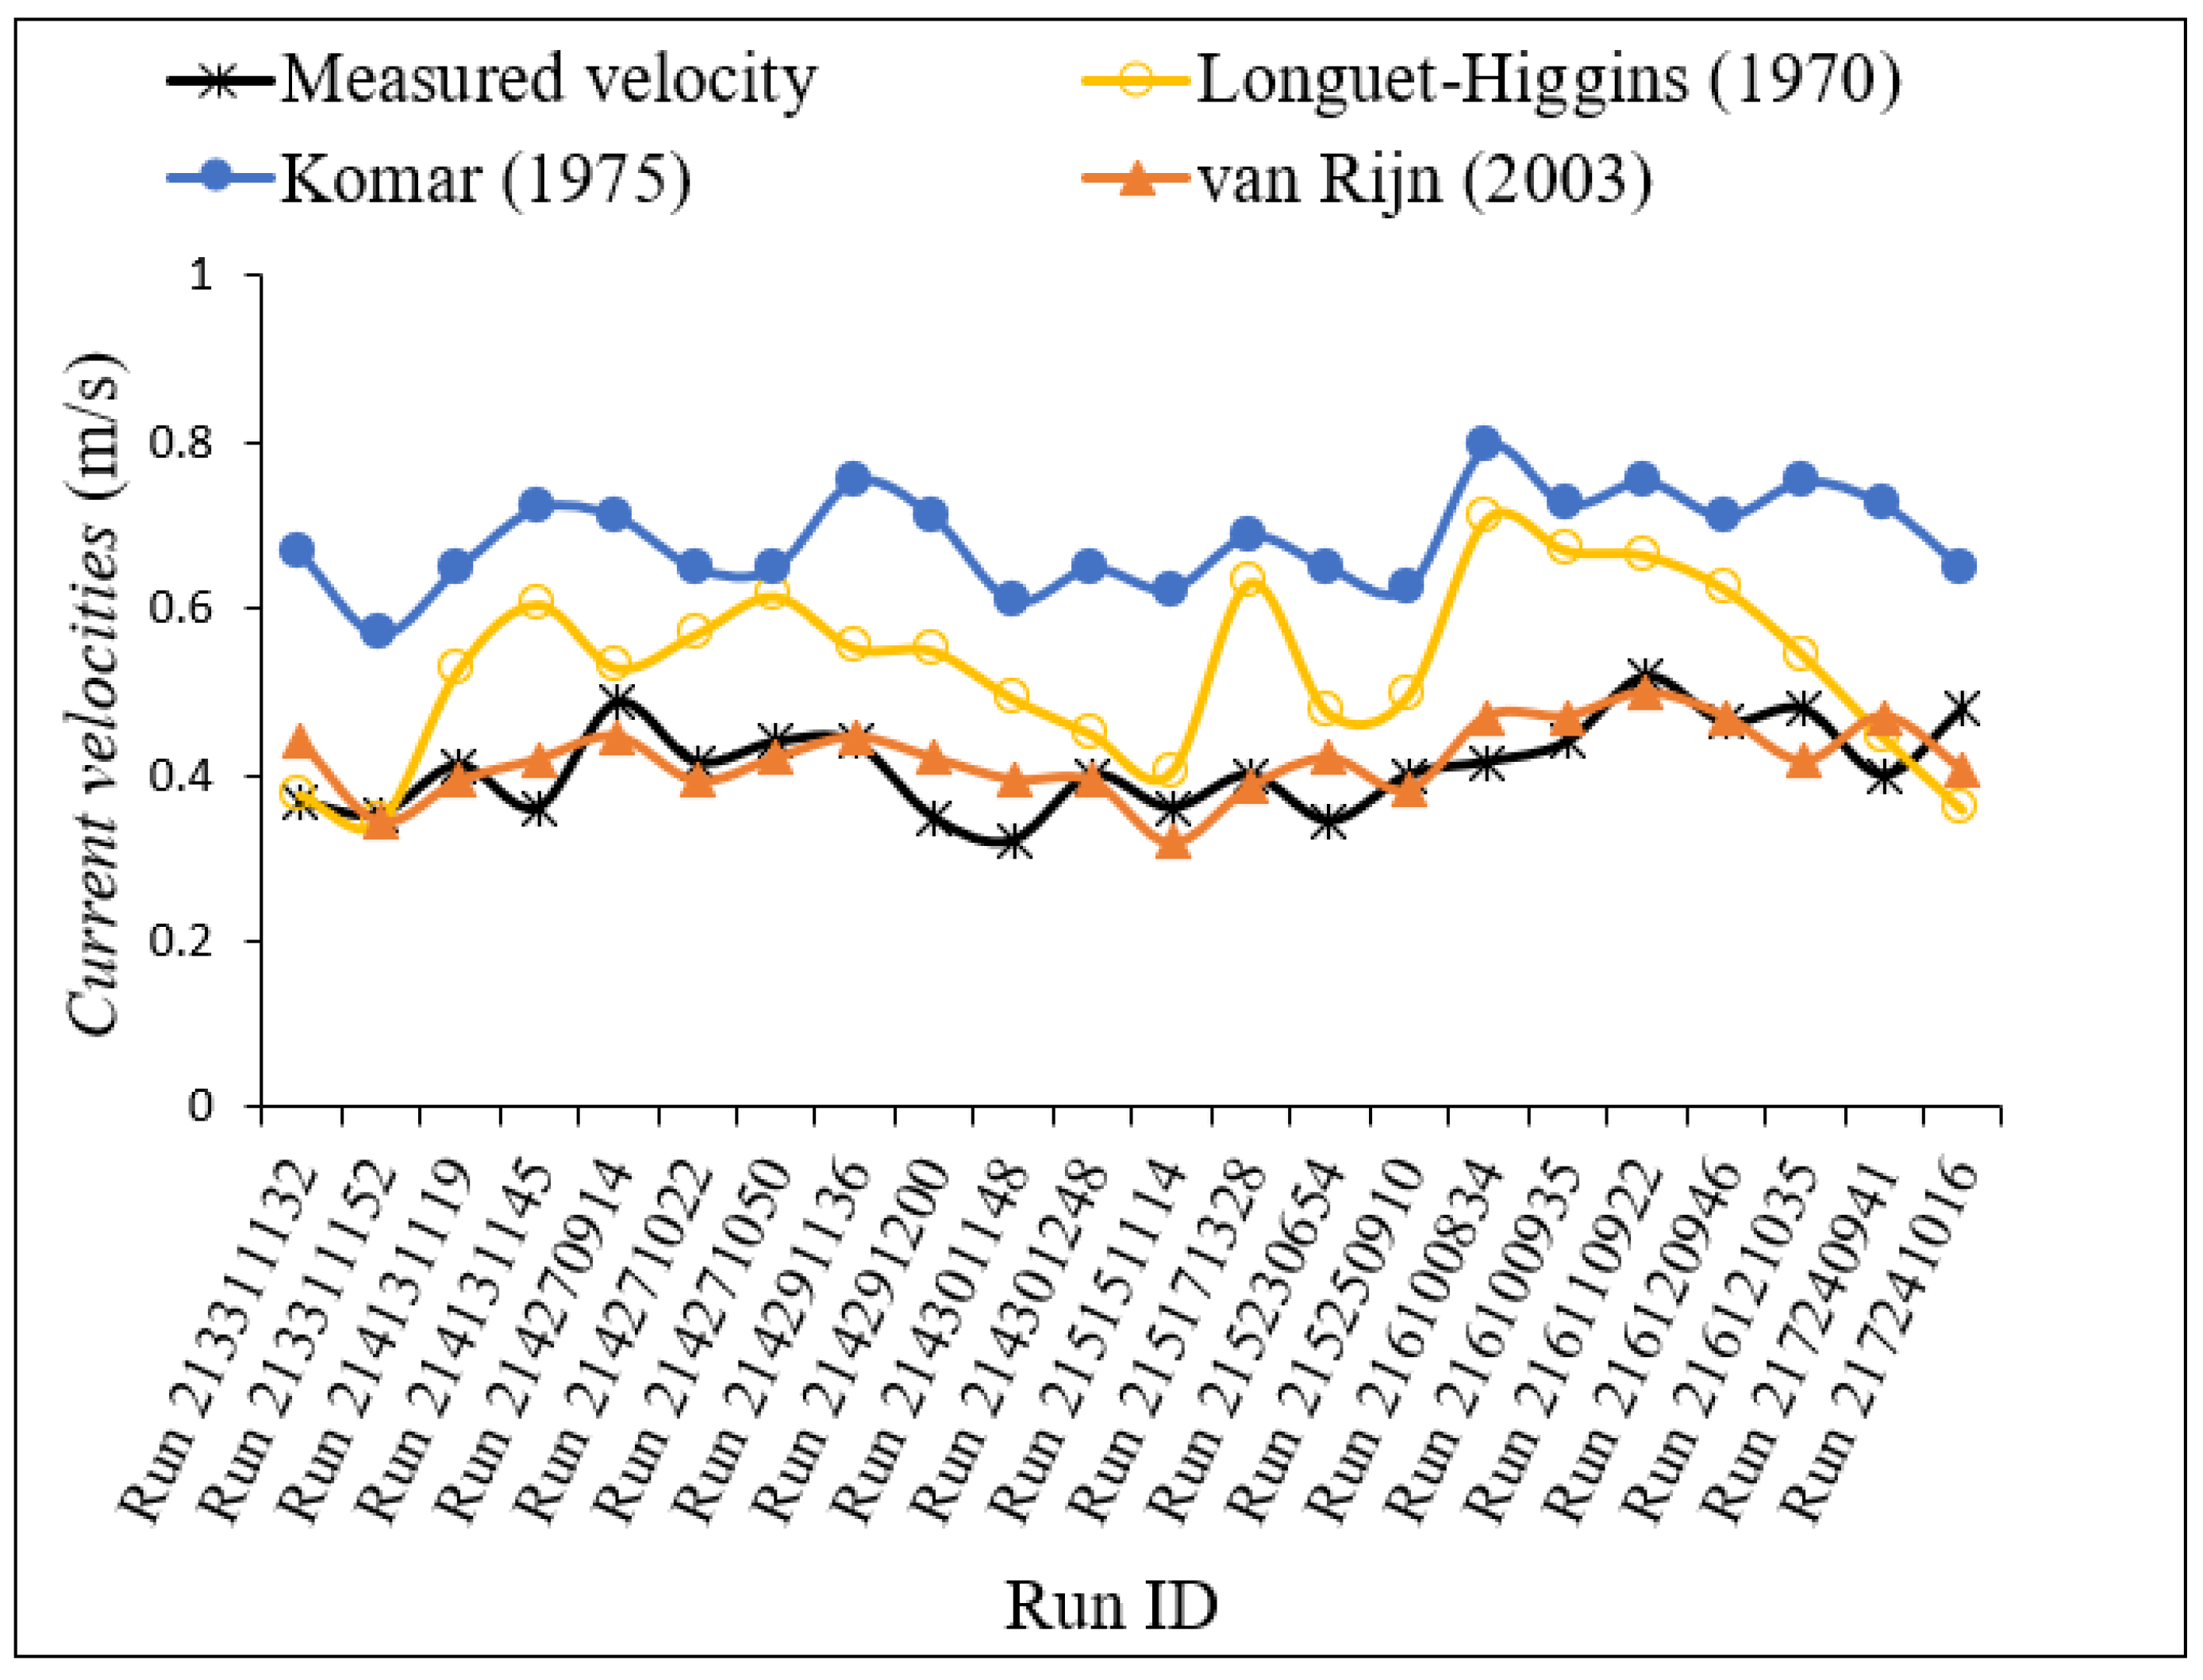
The computed velocities compared well with the measured ones, as shown in Figure 5. The closest estimates to the measured velocities were obtained with the van Rijn (2003) formula [28], which yielded values ranging from 0.31 m·s−1 to 0.55 m·s−1 with an RMSE of 0.07 m·s−1.

3.2. Longshore Sediment Transport Rates

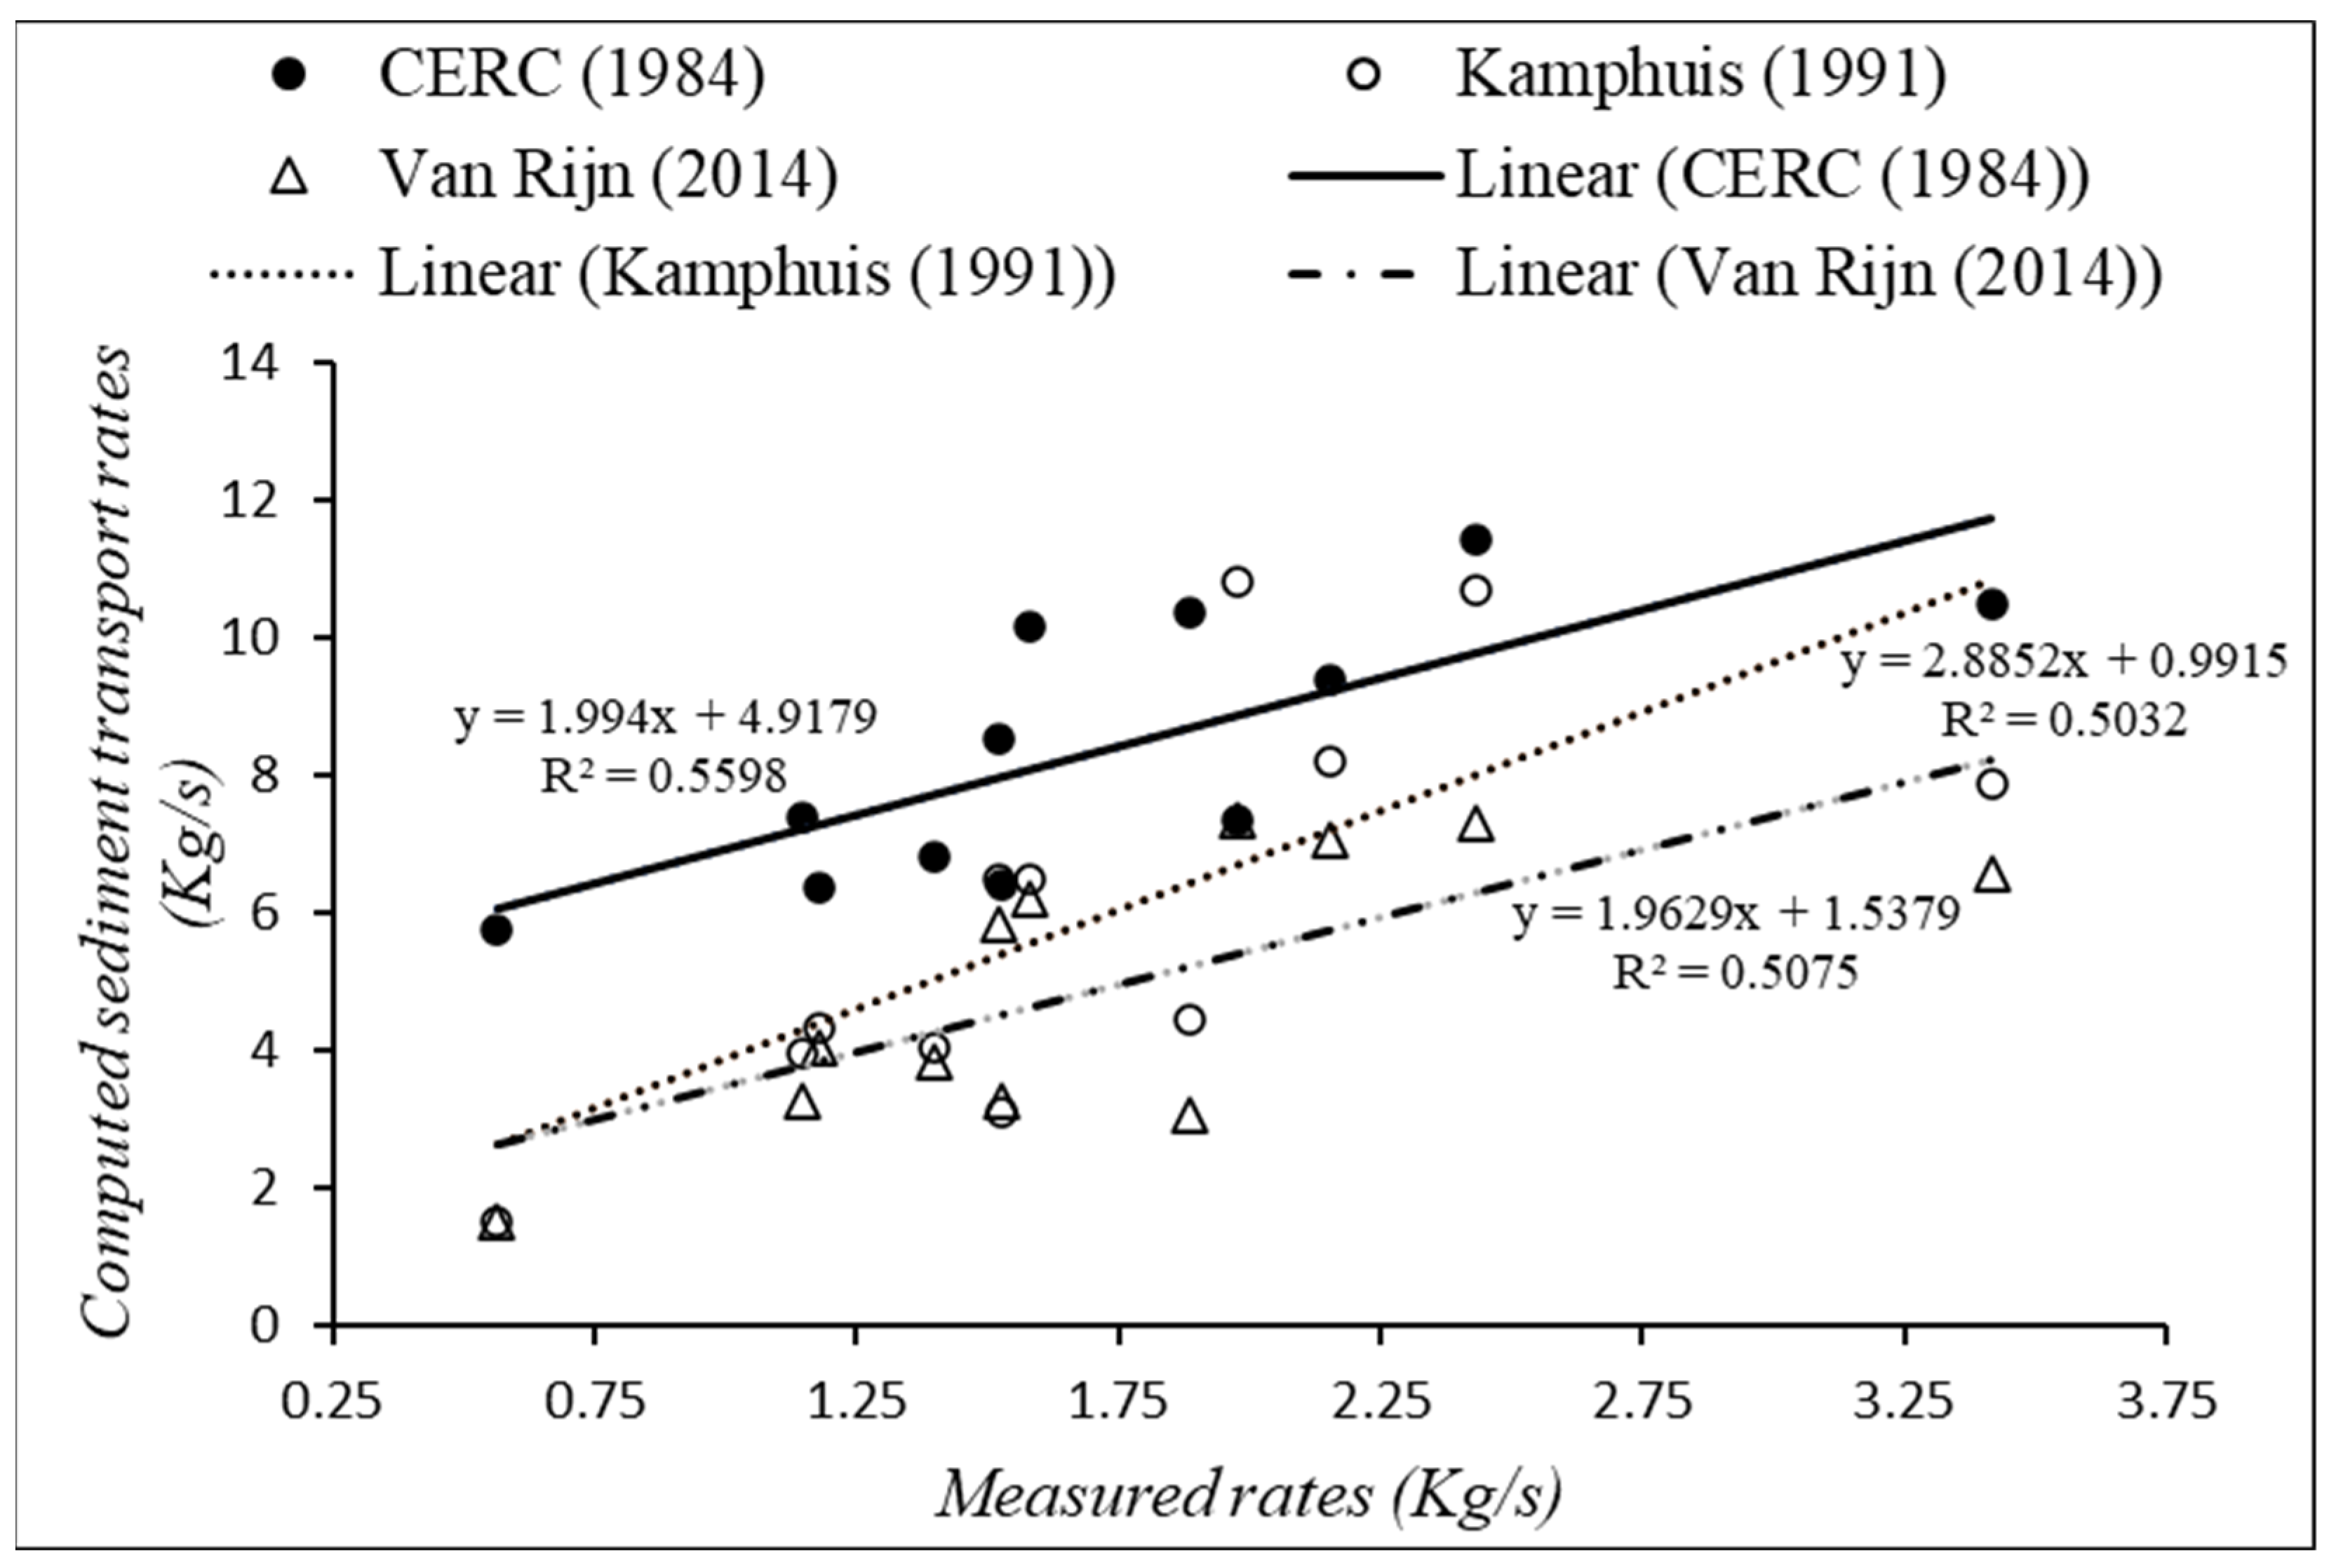
From the sediment trapping runs performed throughout the study period, four sediment samples were not reported since their reliability was questionable. The total LSTRs that were obtained for each run by their integration over the cross-shore distances spanned by the streamer traps varied from 0.56 kg/s to 3.42 kg/s with an average rate of 1.58 kg/s and a standard deviation of 0.69 kg/s. This rate only represented the transport occurring from the shoreline to the middle surf zone. The different coefficients of determination (R-square values) between both the measured and computed rates, as presented in Figure 6, were satisfying.
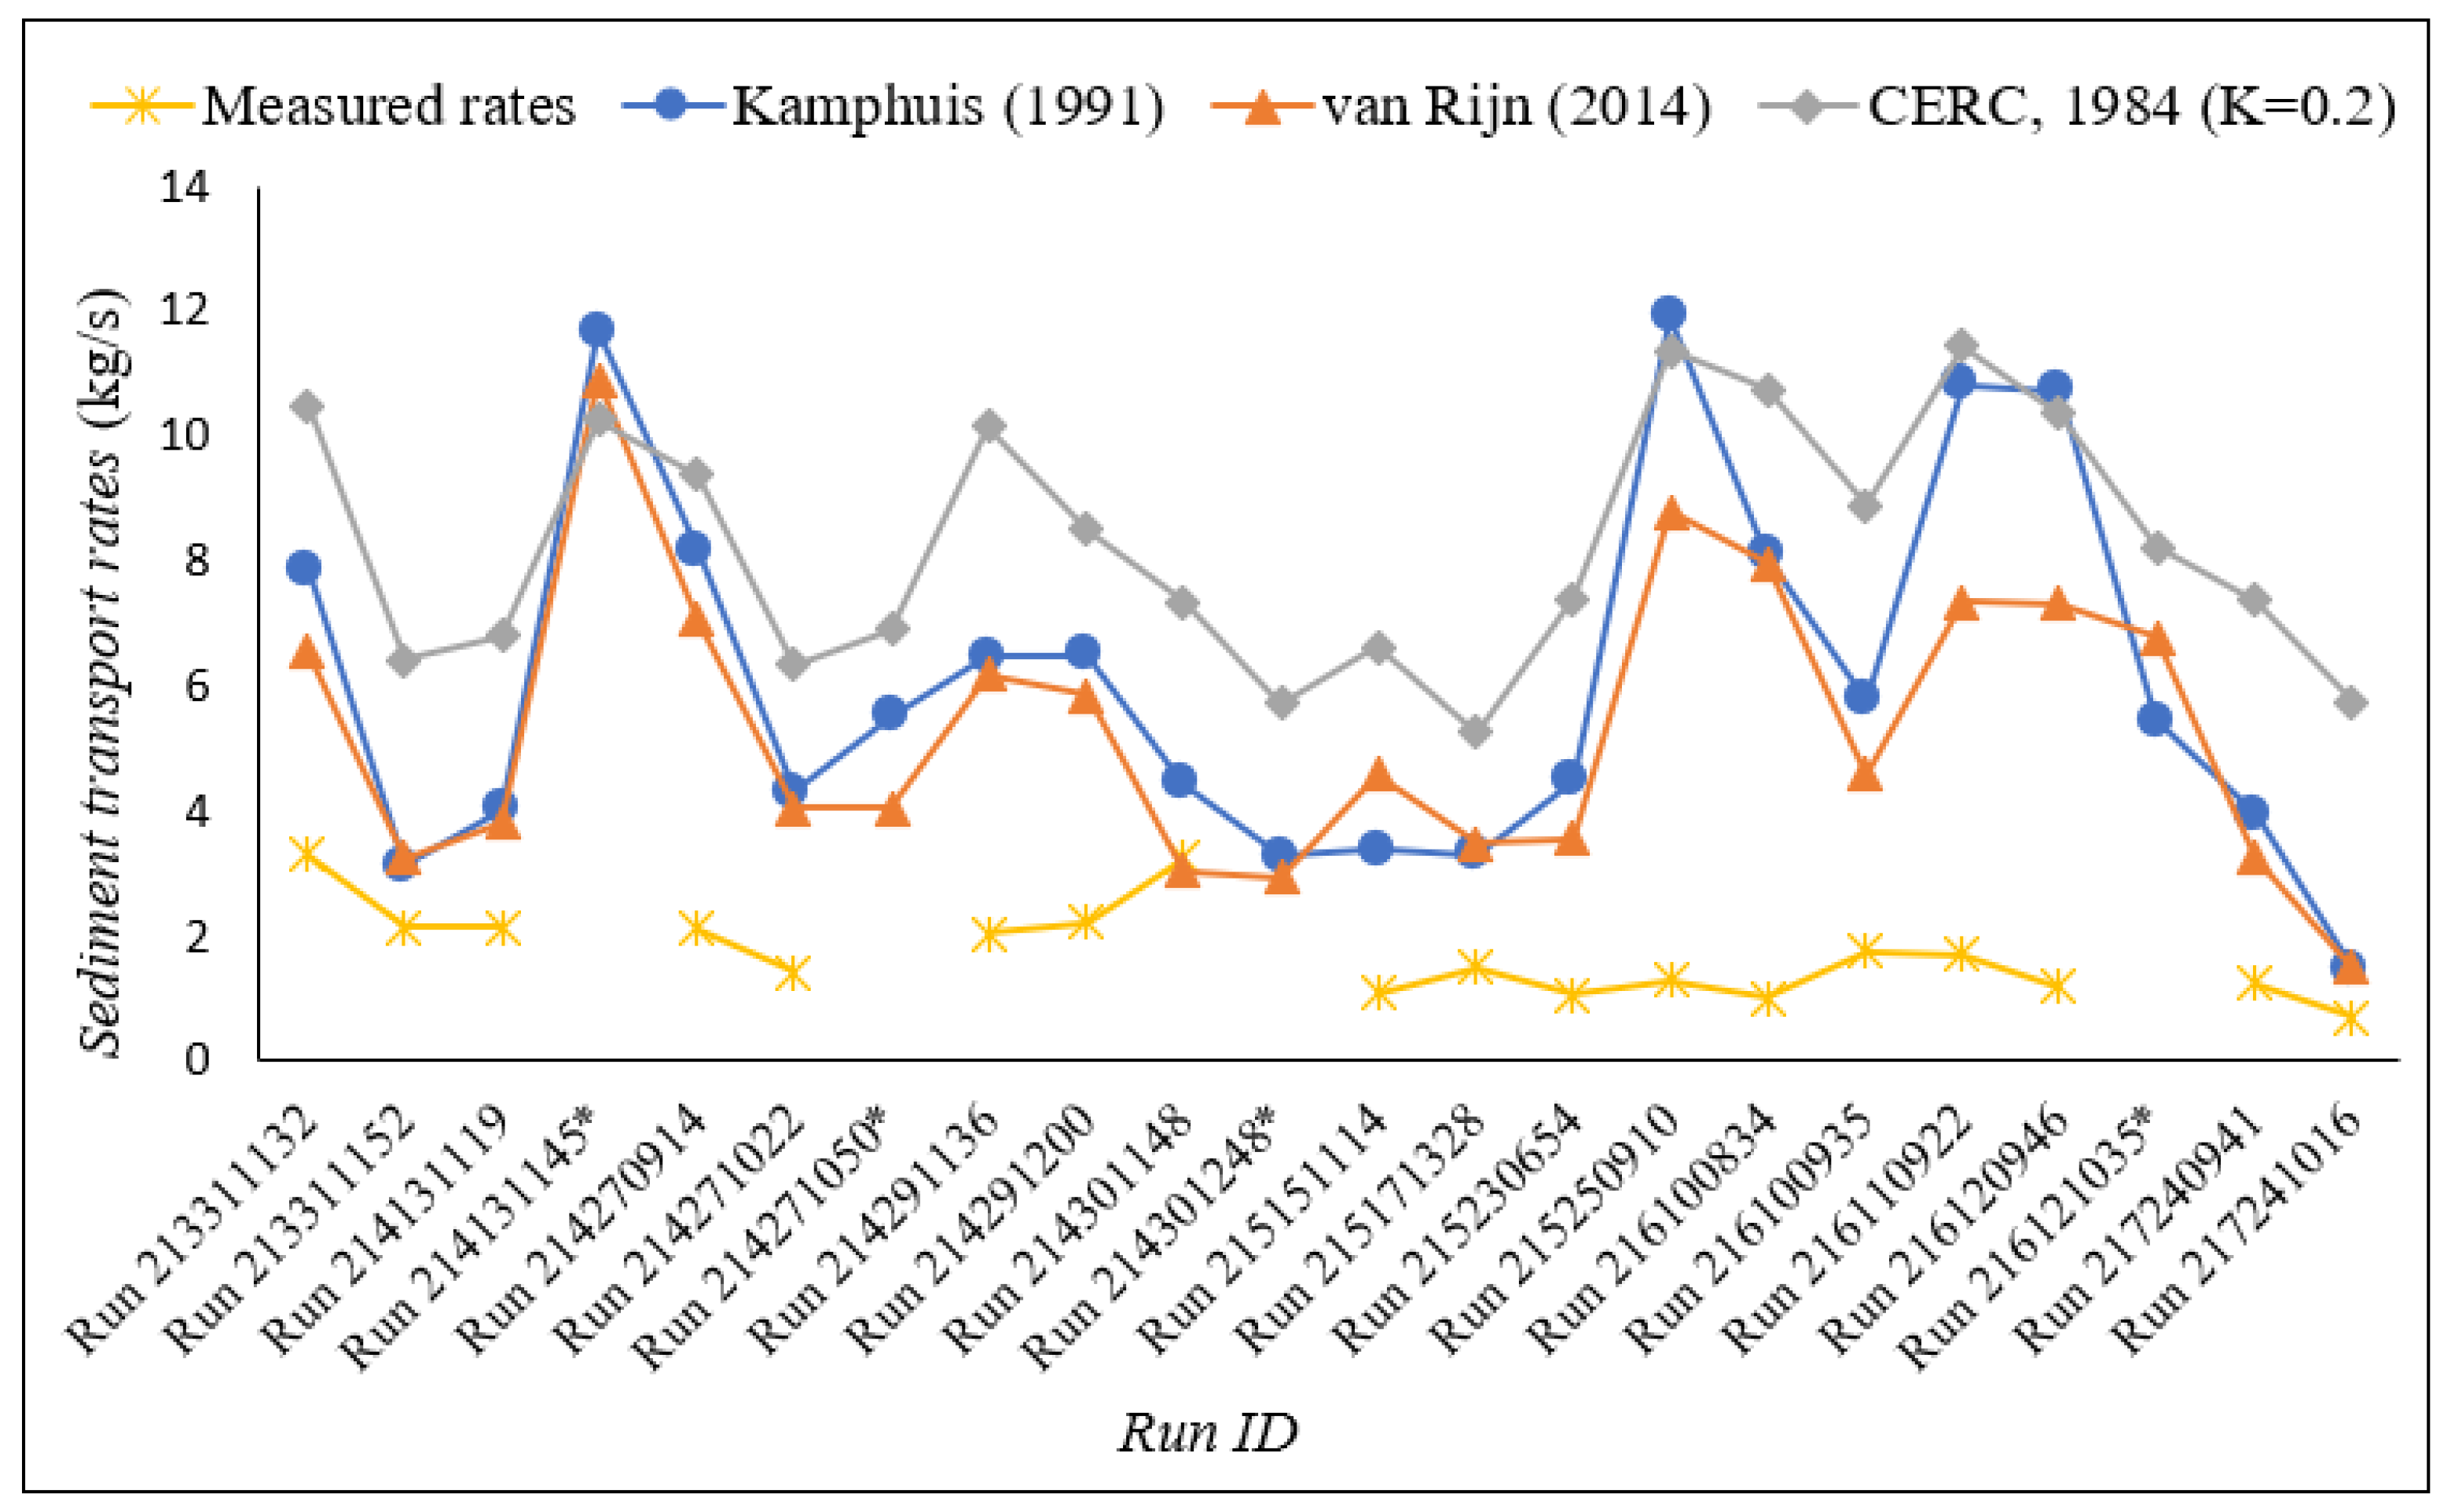
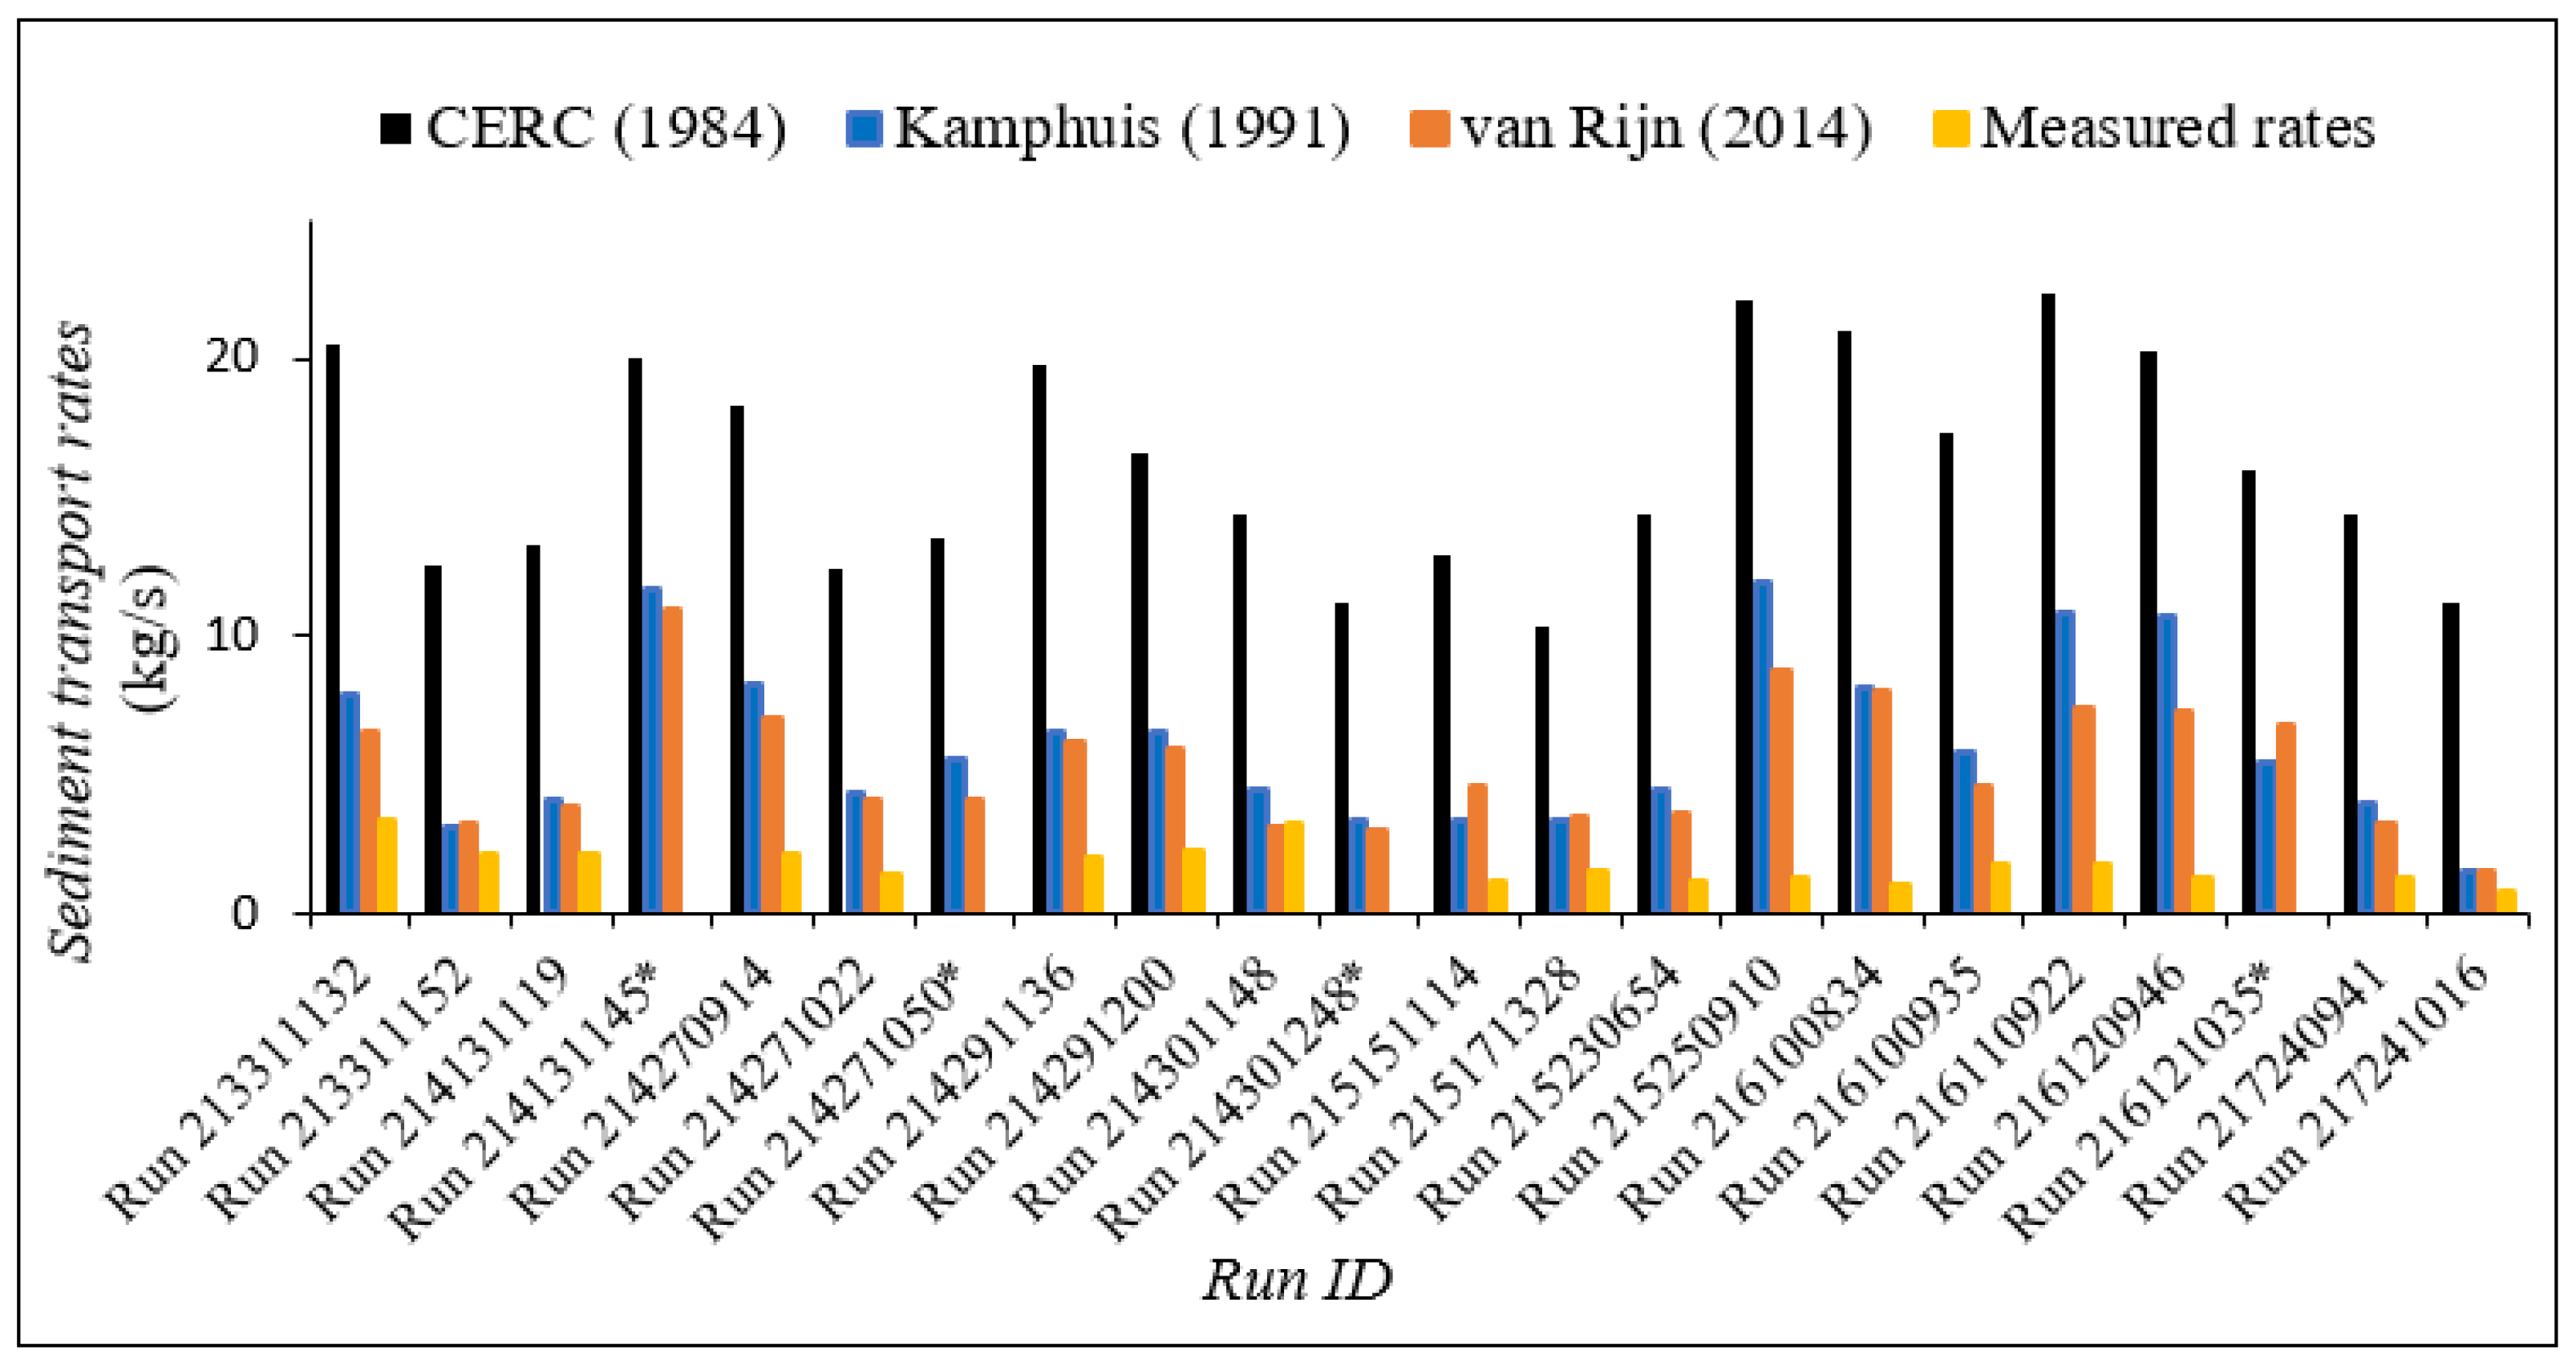
As shown in Figure 7, the trend in the evolution of the different rates was relatively similar. However, as presented in Figure 8, the magnitude of change differed from one formula to another. On average, the CERC formula produced rates that were about one order of magnitude (x10) higher than the measured rates, while the Kamphuis rates and those predicted by the van Rijn equation were only about 3.5 and 2.9 times higher, respectively. The results produced by these three formulae were this high because they represented the longshore transport rates occurring in the entire surf zone, whereas these measurements only concerned the inner and middle surf zone.

3.3. Beach and Surf Zone Median Grain Size

The surf zone grain size ranged from 0.17 to 0.32 mm with an average value of 0.25 mm, which fell into the category of fine sand. Meanwhile, the beach was composed of medium particles with sizes ranging between 0.32 and 0.59 mm with a mean value of 0.46 mm. The beach particle size was always found to be higher than the surf zone materials. Table 2 presents a detailed summary of both the surf zone and beach median sizes.

3.4. Vertical and Cross-Shore Distribution of LST and the Grain-Size

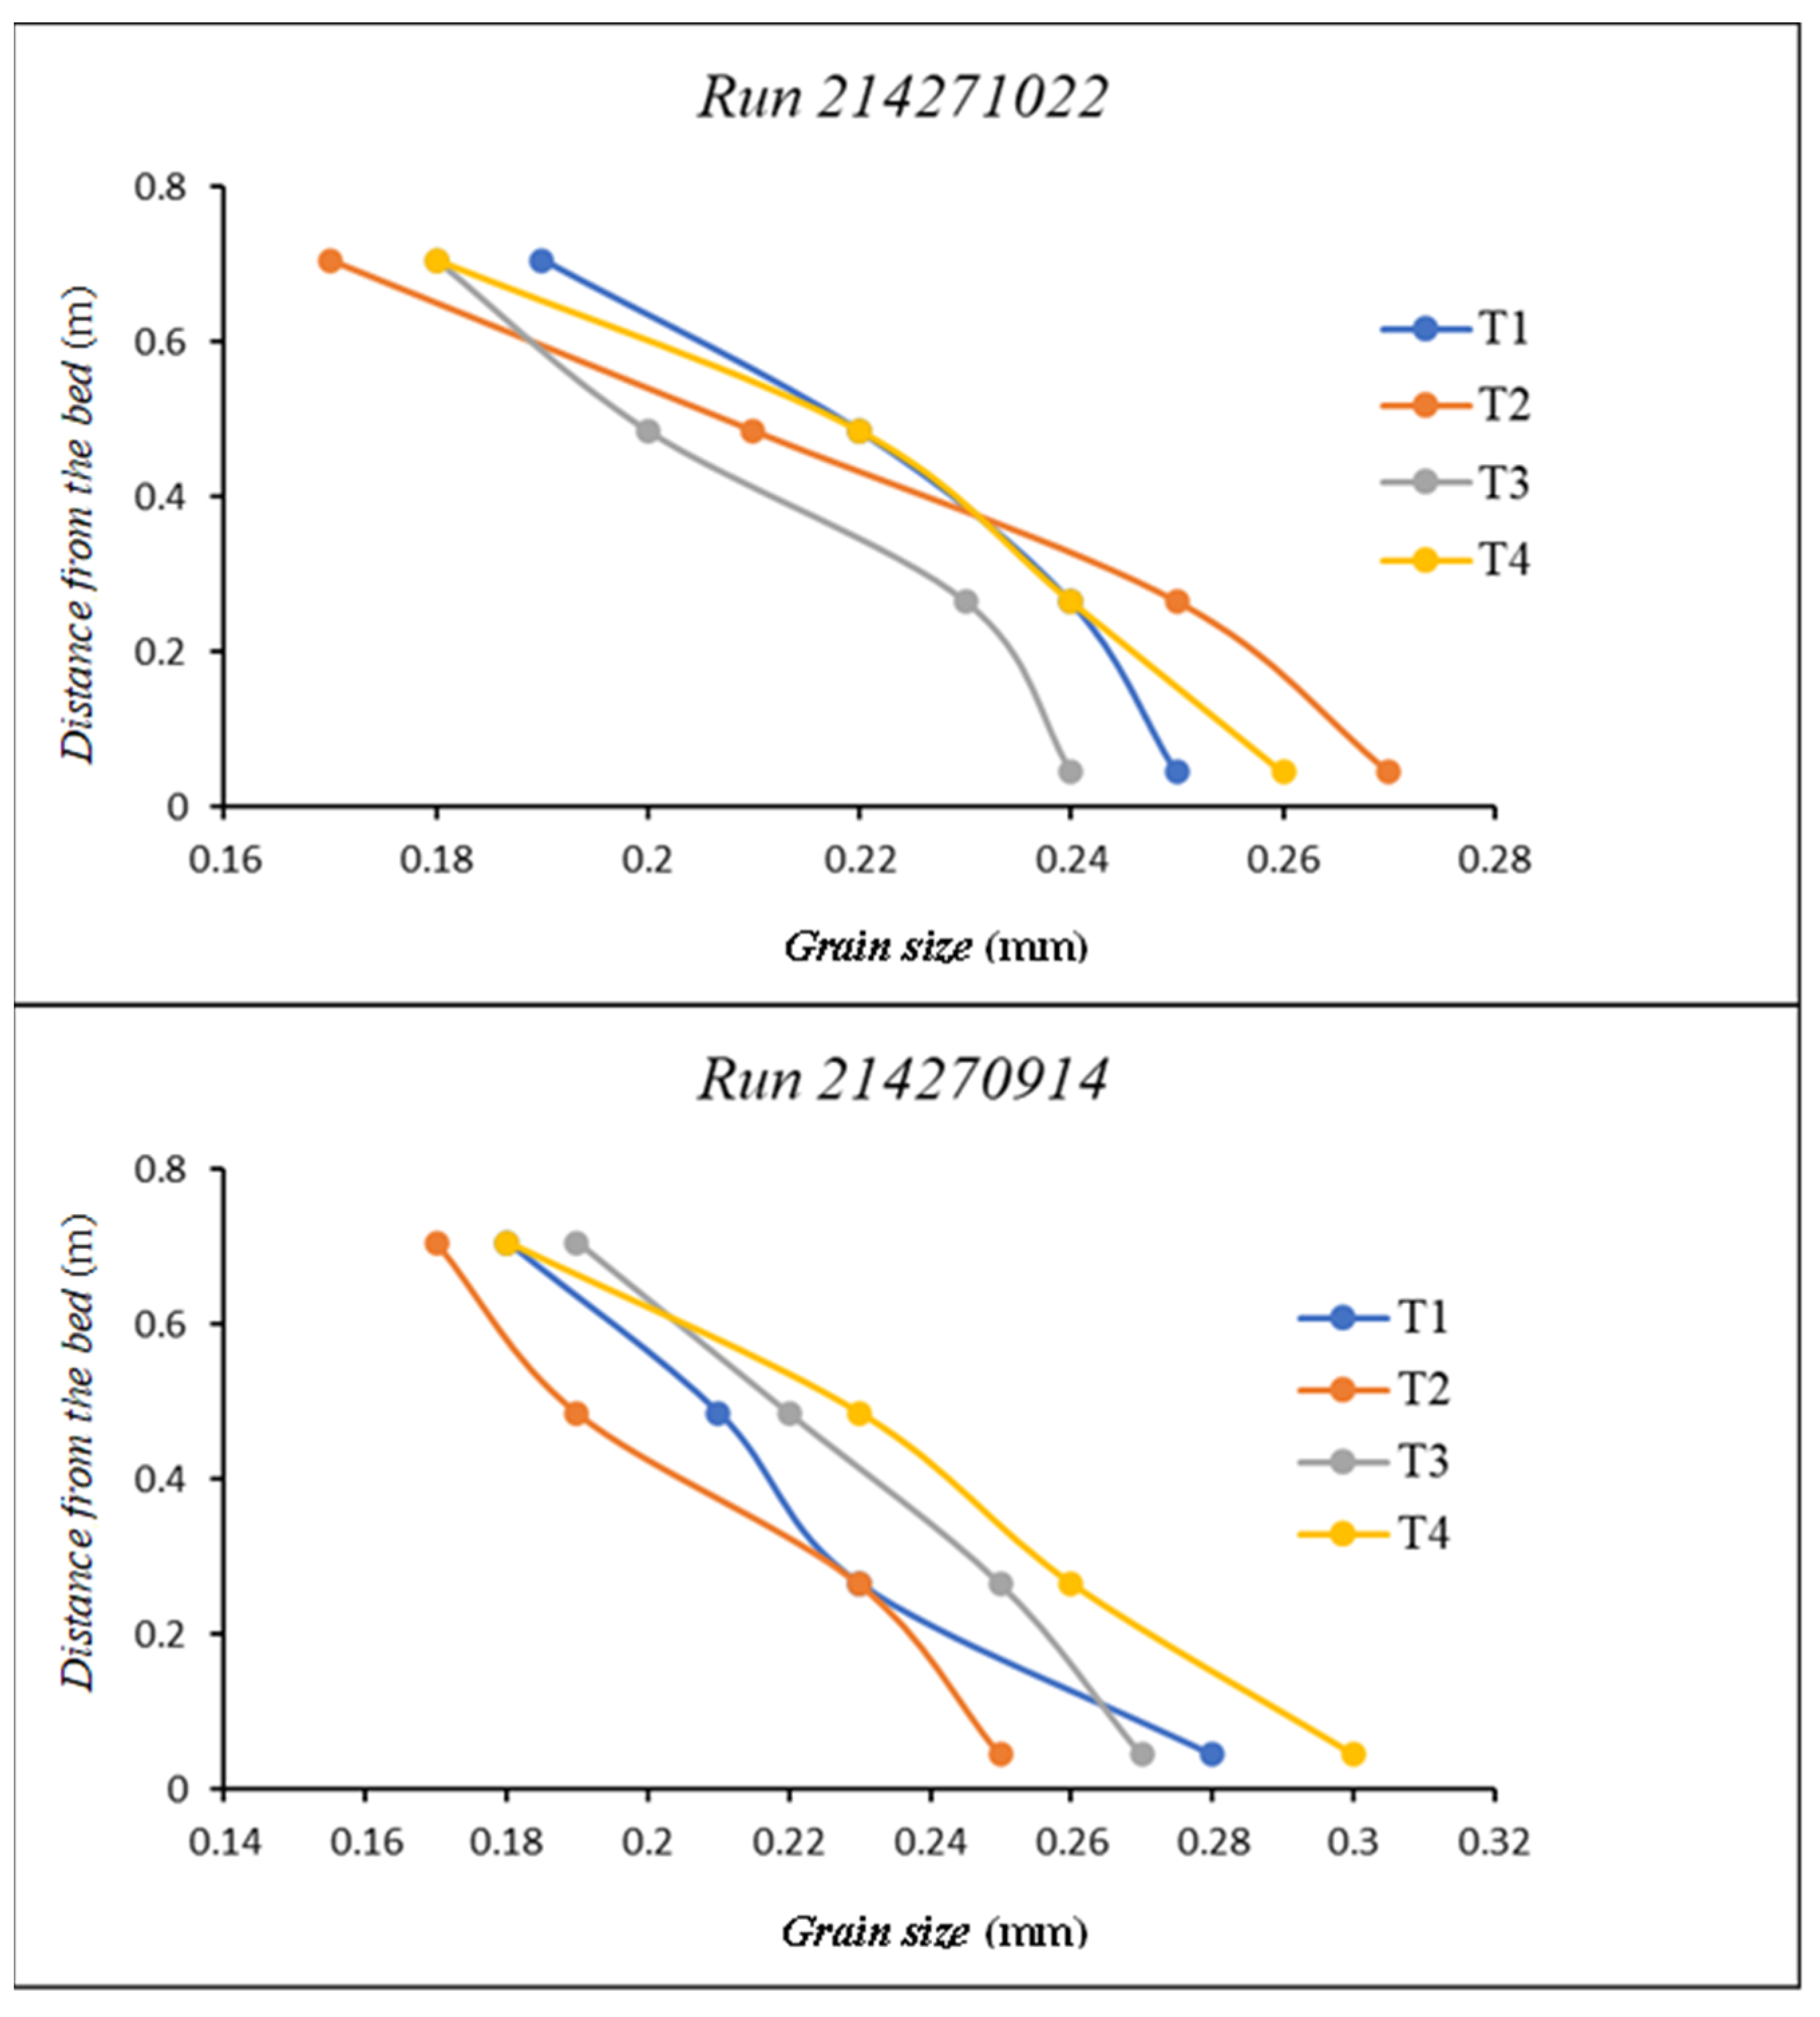
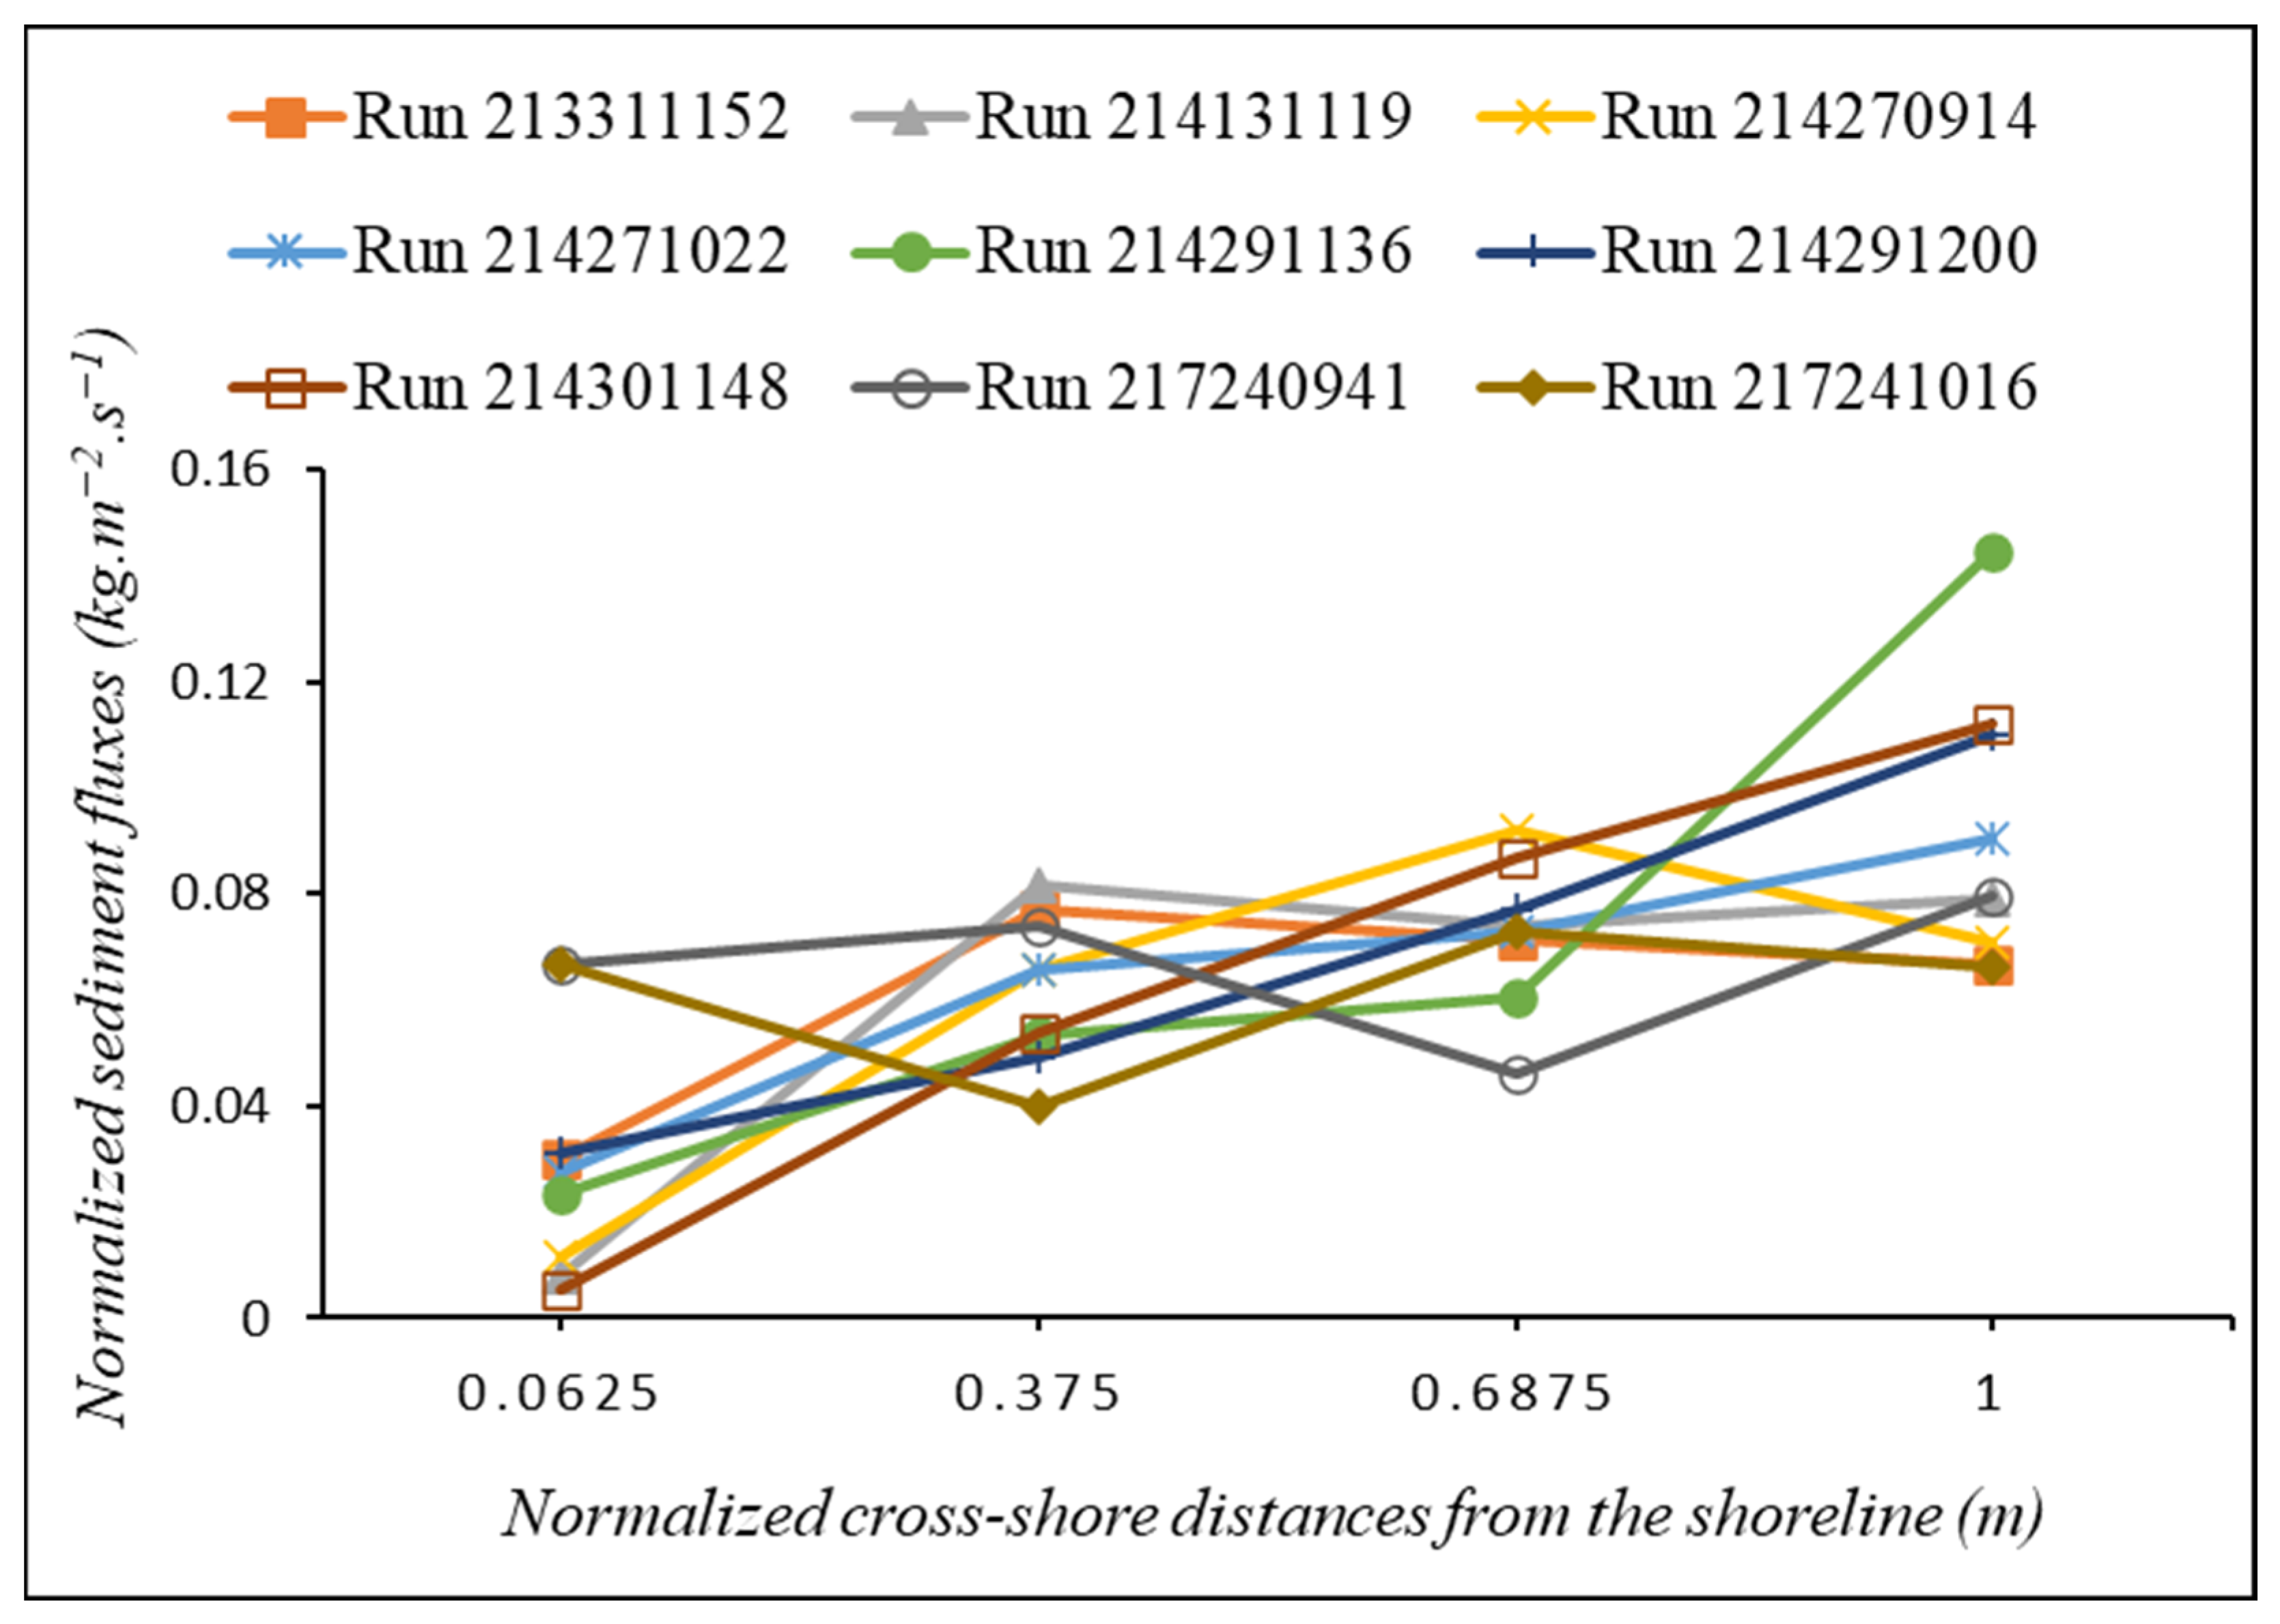
The sediment trapped in each net allowed the characterization of both LST and grain-size distributions not only throughout the water column but also on the cross-shore distance traversed by the traps. Almost all the runs showed a decrease in the fluxes from the bottom net to the top one. Likewise, most of the LSTRs at each trap decreased from the outermost sea trap to the shoreline. Figure 9 shows an example of the transport distributions using Run 214271022. These trends found in the LST distribution were relatively similar to those observed with the grain size. Throughout the water column, coarser grains were found in the bottom nets, while the fines were trapped in the top ones (Figure 10). Additionally, in most runs, the average median sizes tended to decrease from the outermost trap toward the first trap positioned close to the average shoreline (Figure 11). The particles trapped in the nets were essentially sand grains.

3.5. Influence of the Hydrodynamic Factors on the Longshore Sediment Transport

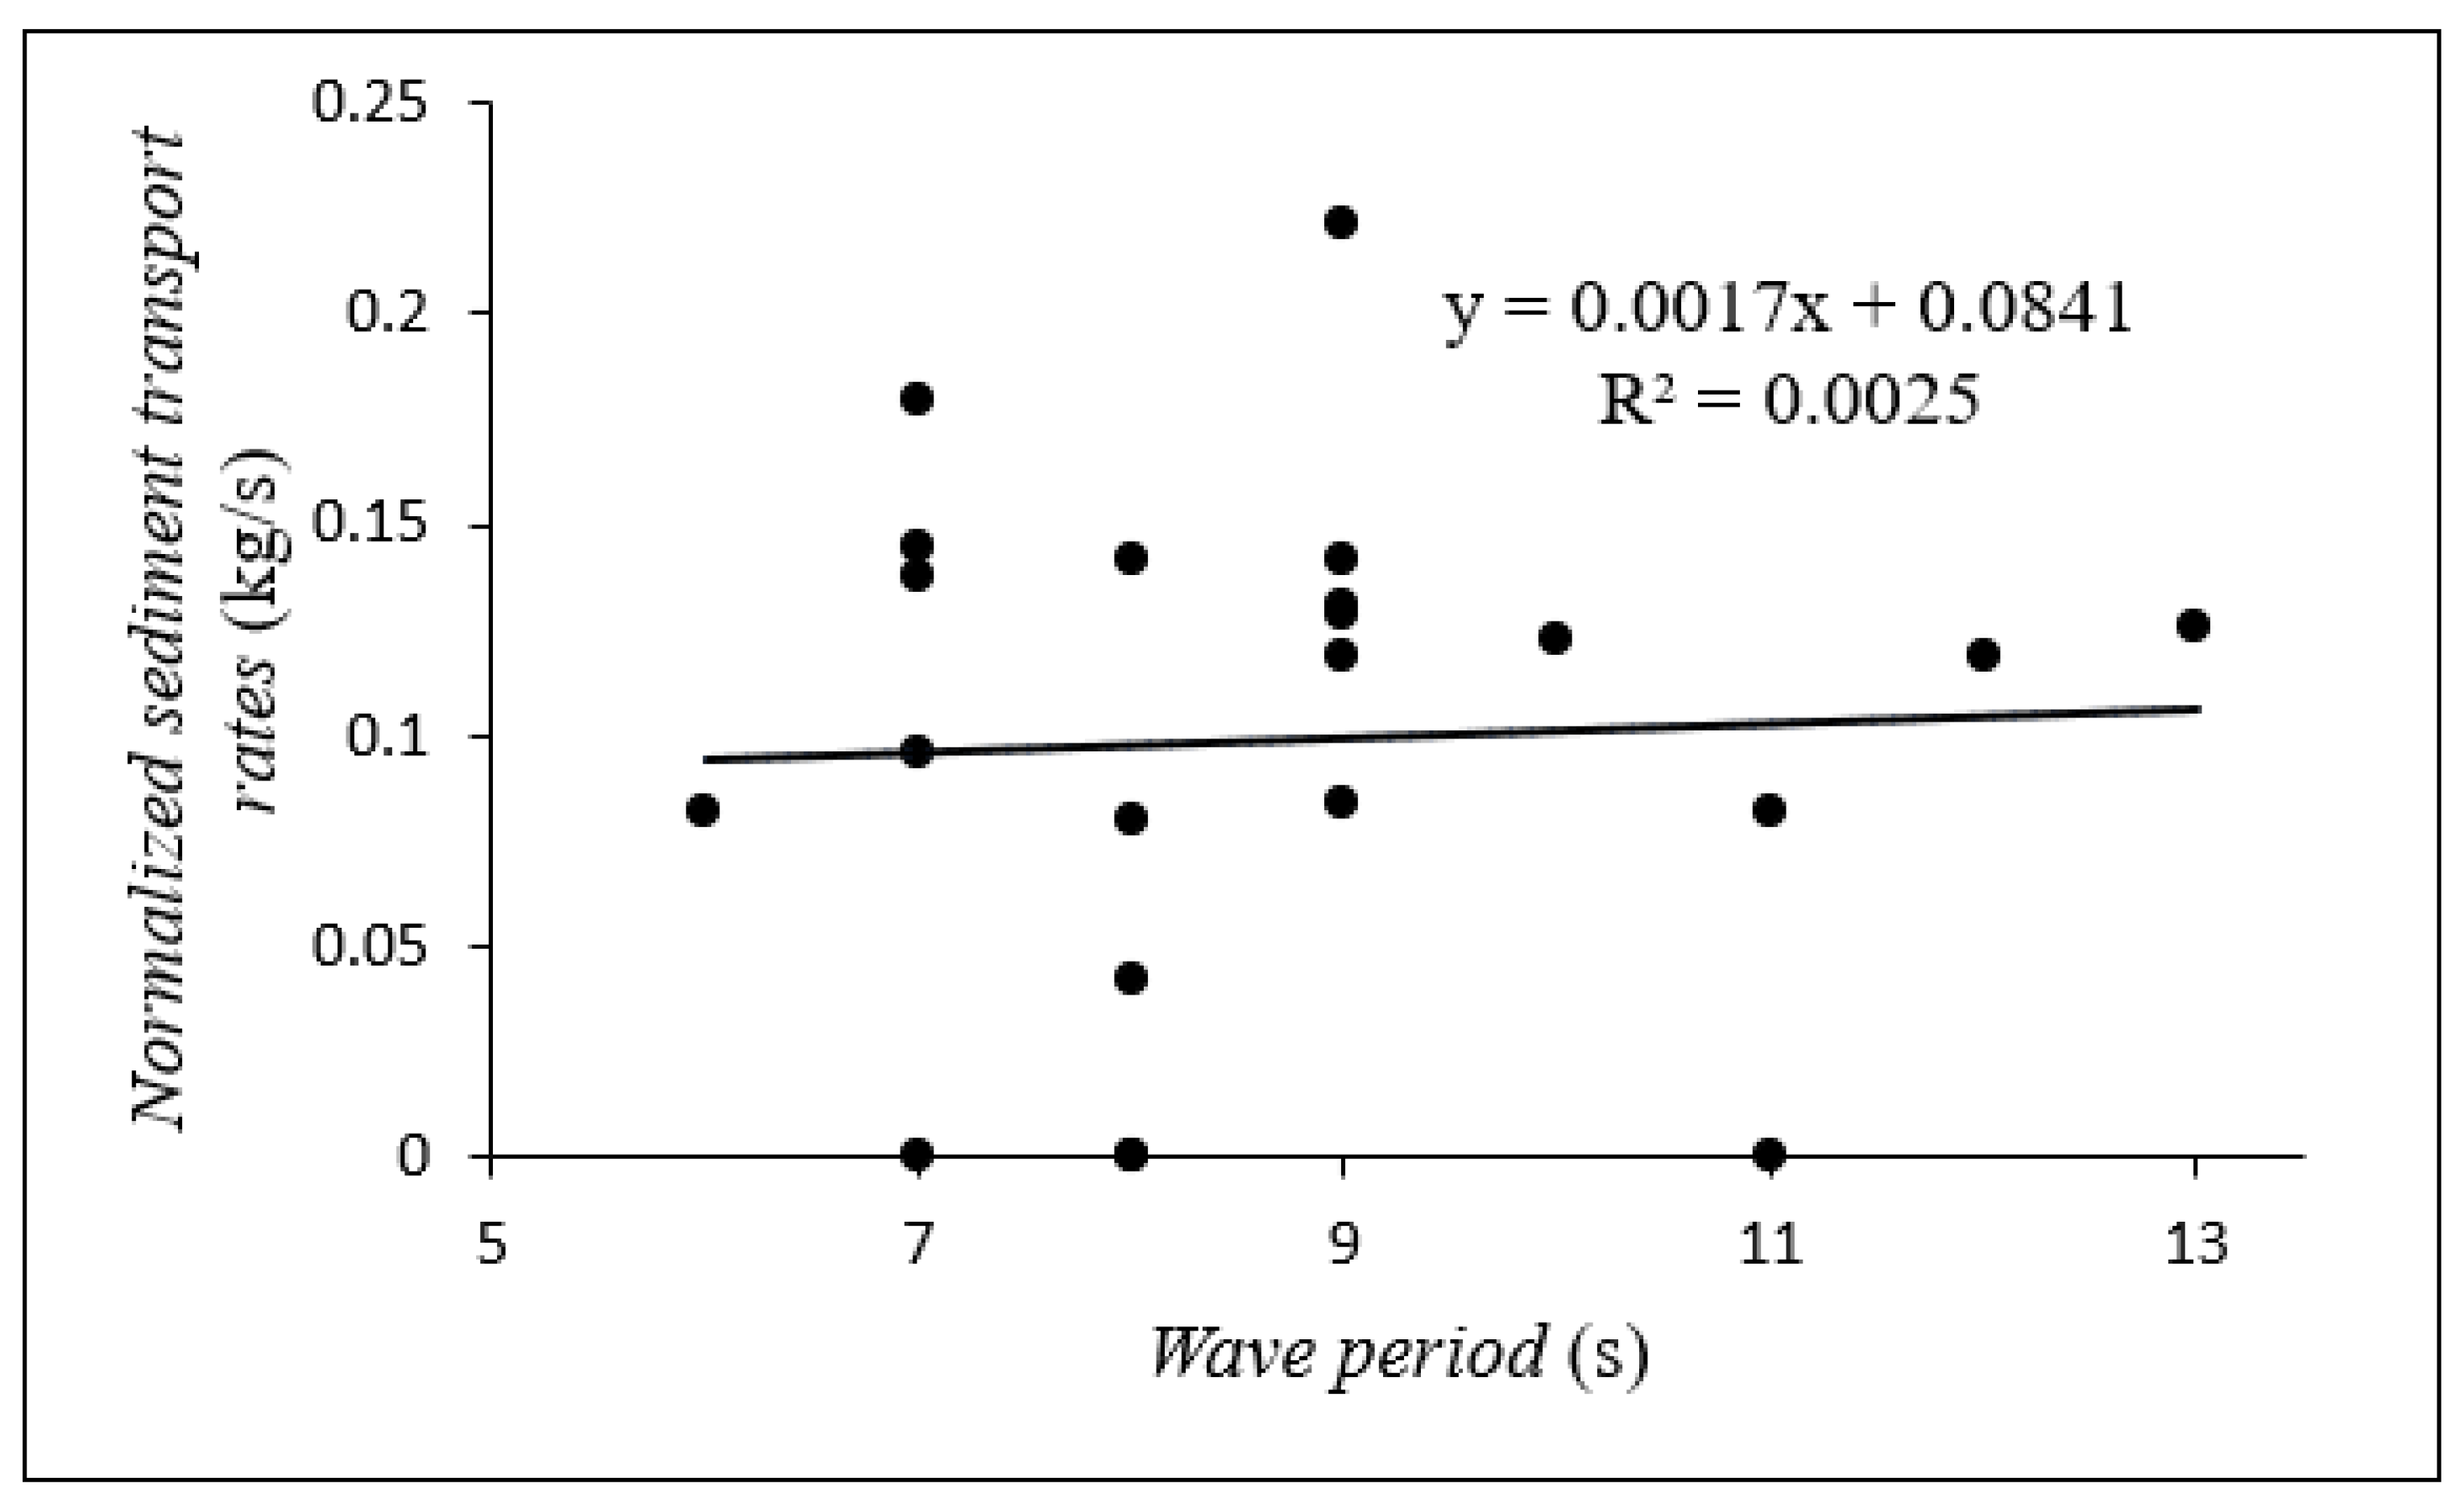
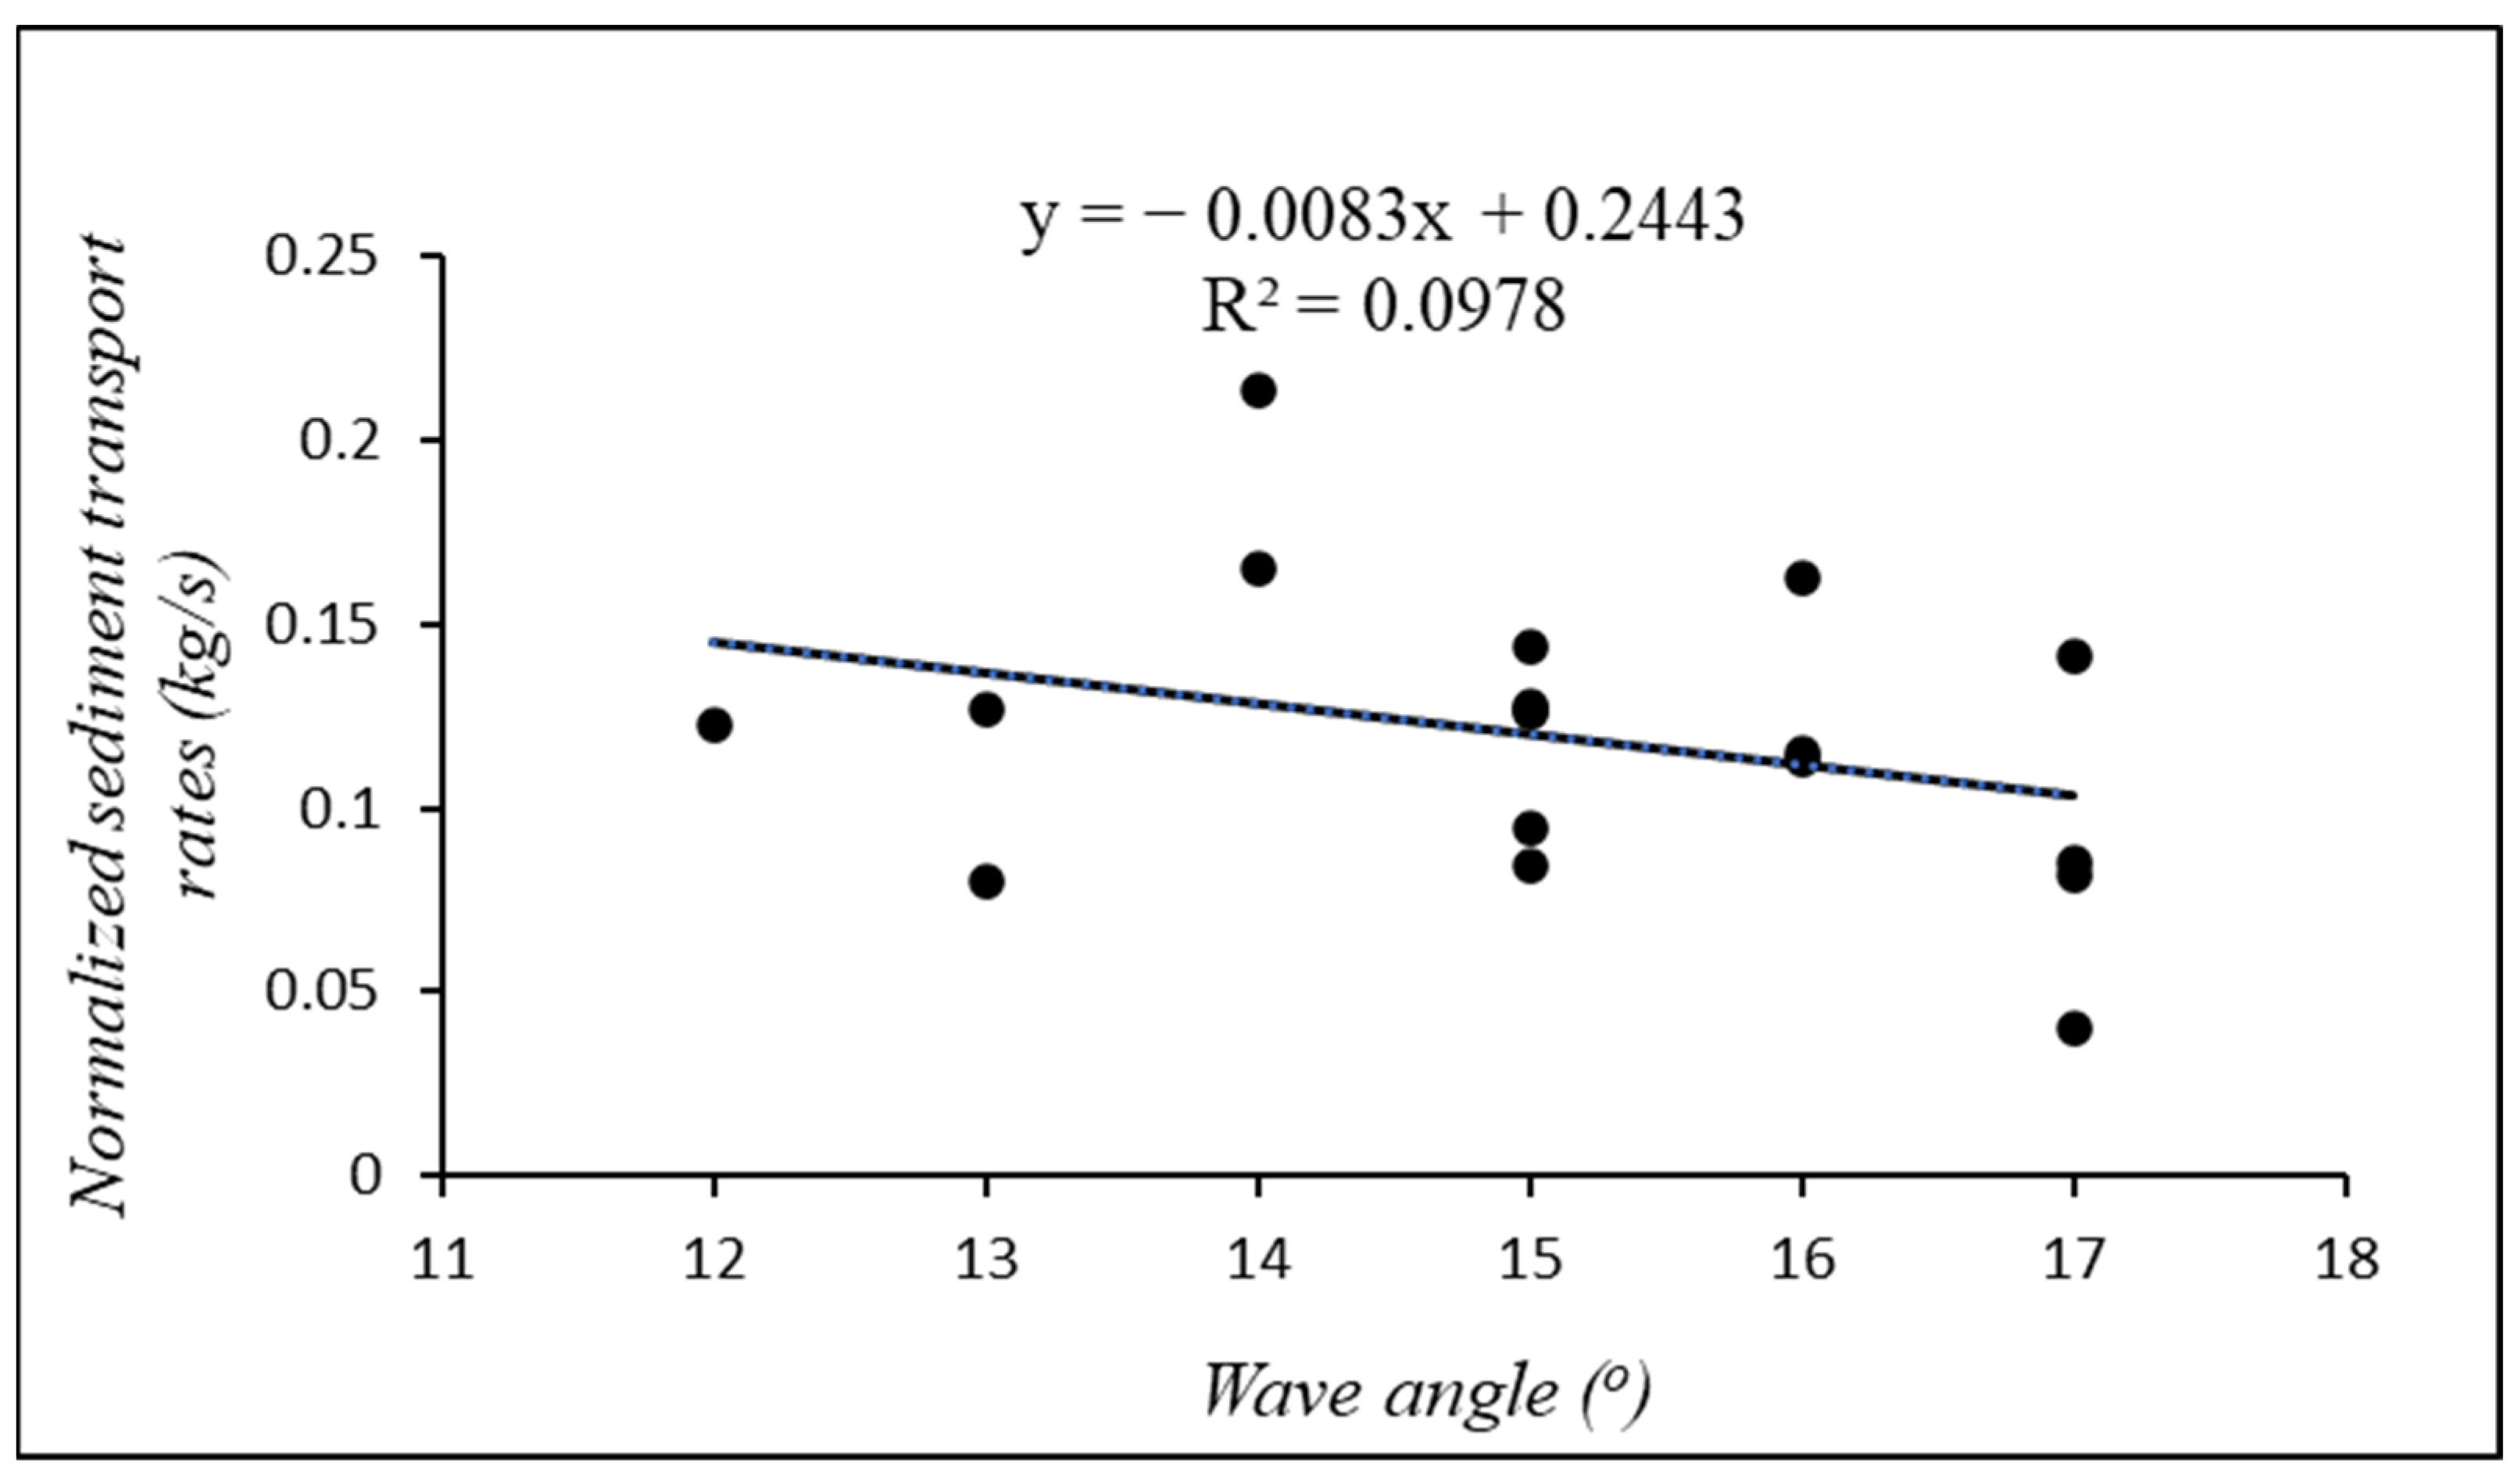
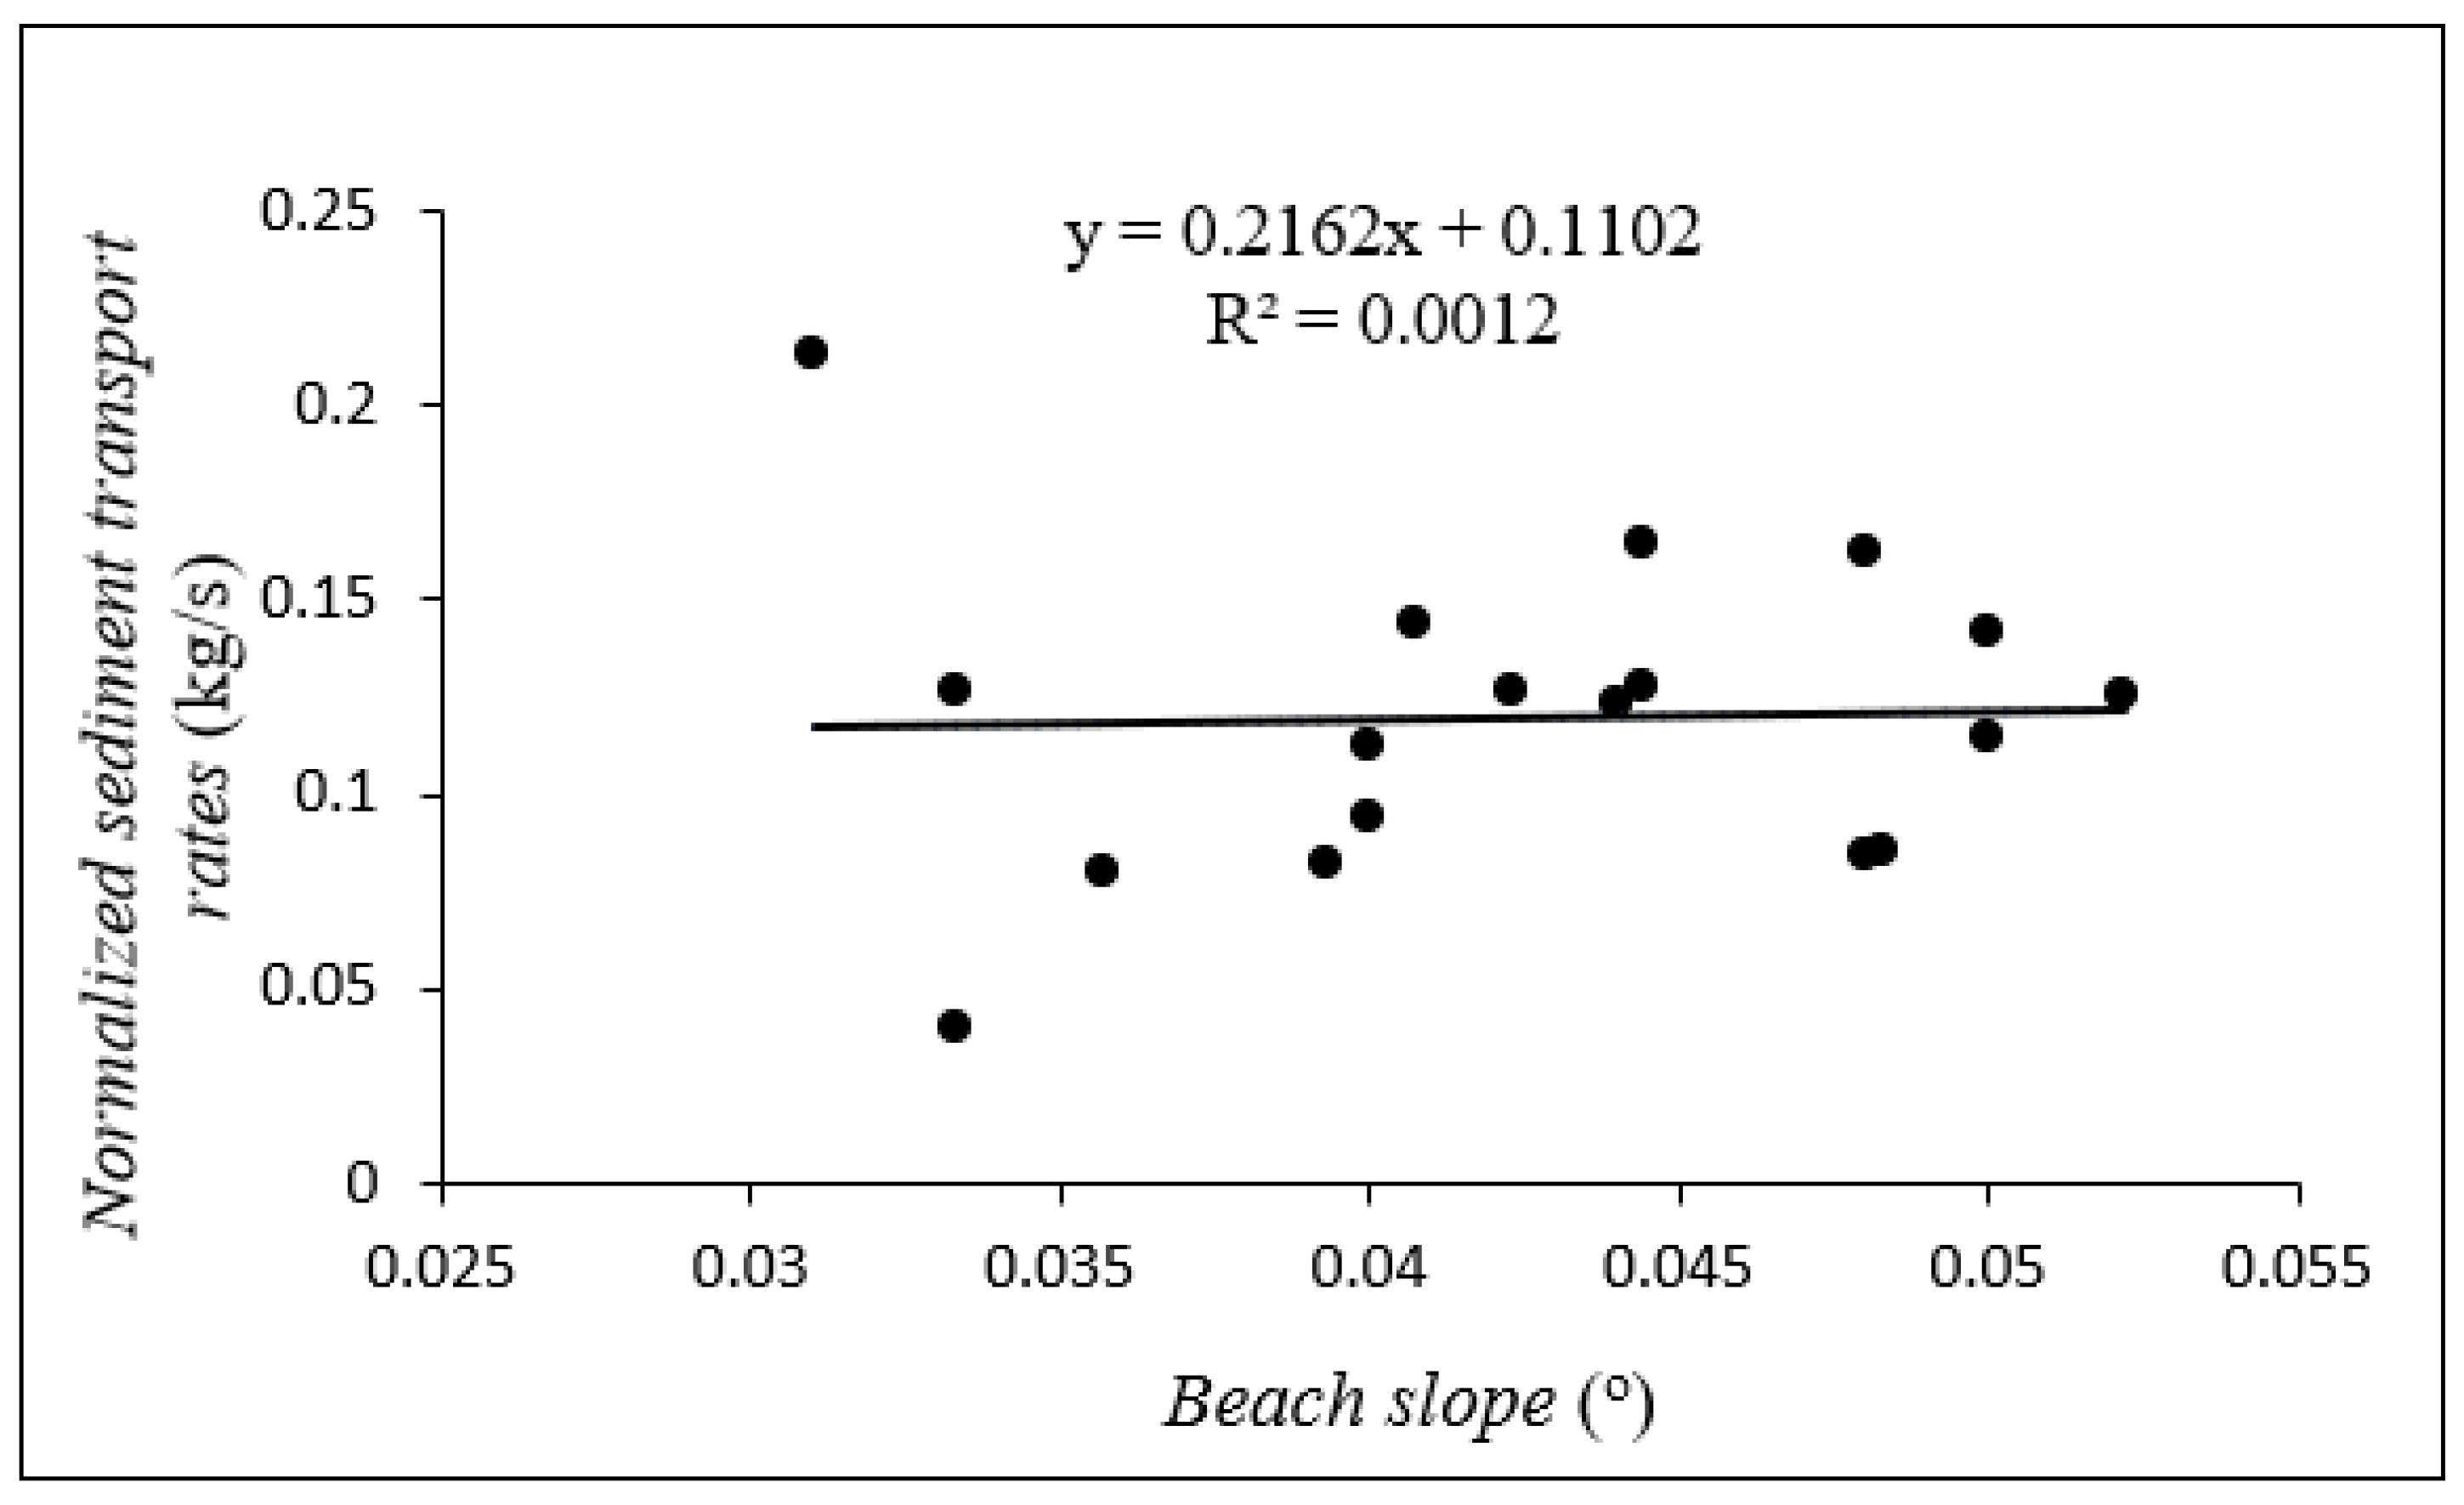
The influences of the hydrodynamic parameters and other morphological parameters were also investigated to determine how these factors interacted with sediment transport. This was performed using the new normalized rates in order to show the relationships with a maximum number of runs. These four runs where the sand transport measurements were not reliable were not taken into account in the scatters. As shown in Figure 12 and Figure 13, the sediment transport did not seem to have any relationship with the wave period (6–13 s) and the wave angle (12–17°). This situation was also similar to the relationship observed with the current velocity in Figure 14. However, there was a relatively good dependence of the sand transport on the wave height, as presented in Figure 15. On the other hand, these transport rates seemed to decrease with an increase in the grain size but did not have any relationship with the beach slope (Figure 16 and Figure 17).

4. Discussion

4.1. Sand Transport Rates

The traps did not span the entire surf zone during all the runs. It is, therefore, impossible to accurately predict the sand rates which would have occurred in the unmeasured zone toward the breaker line. To extrapolate the rates occurring in the unmeasured zone, it was assumed that the transport rates kept increasing and linearly toward the breaker line. Therefore, knowing the average surf zone widths throughout the study period, if additional traps were deployed in the unmeasured zone, the CERC rates became about 4.5 times higher than the measured rates. The CERC formula is often known to give an overestimation of the measured rates. Following the Kamphuis and van Rijn equations, the new rates obtained were about 1.51 and 1.32 times higher than the measured rates, confirming their high potential to give very close predictions to the actual LSTRs. The higher prediction was given by the CERC formula, unlike the Kamphuis and van Rijn equations. Though this specific reason may not be applied to this study, the high overestimation factor often yielded by the CERC formula is generally explained by the fact that, other parameters were not considered in the development of the equation and, therefore, did not take into account all the other factors that could influence the sediment transport. The most important parameters taken into account in the CERC formula were the wave height and the wave angle. It could, therefore, be qualified as a ‘crude formula’ [14]. Furthermore, the equation relies on the wave energy-based approach, with the assumption that the sediment particles were available in enough quantity in the water column to compensate for the transport capacity of the fluid [34], whereas this is not always the case. This could possibly explain why this formula tended to operate better during storms, where more particles are generally mobilized and tend to compensate for the transport capacity of the fluid. Another important reason lies in the choice of the K-parameter. Indeed, though some values have been proposed and are in use worldwide, a specific K-value should be determined for each study area, depending on the characteristics of the site [33]. From the studies performed using both the Kamphuis and Van Rijn equations, the strength of these formulae in predicting close estimates to the sediment transport rates was attributed to the fact that additional parameters were incorporated, such as the wave period, the grain size and the beach slope. For example, the computation of LST could really be improved if the characteristic grain size of the area is well represented [35].
Regarding the scouring effect, it is stated that the traps did not experience much scour, considering the similarity observed between the measured rates and both the Kamphuis and van Rijn equations. Based on this, it was concluded that the sediment transport operations were performed well in general.
In some experiments where traps with similar designs were used, the portion of the sediment that was trapped in the bottom net was called the bedload (e.g., [30,31]). However, due to some definitions given to the bedload by [36,37], this characterization needs to be taken with caution. Ref. [31] defined the bedload as occurring in a layer whose thickness is only about two particles’ diameters. For [37], the bedload layer is only 1 cm thick. Therefore, the portion of materials trapped in the bottom net (15 cm × 9 cm) during this study should not be exclusively considered as a bedload but rather a mixture of both a bedload and suspended load occurring at the vicinities of the bed, as also suggested by [38].

4.2. Distribution of the Sand Transport Rates and the Grain Size

The exponential decrease in the sediment fluxes from the bottom to the top is also similar to that observed during several other studies (e.g., [38,39]. Actually, most of the particles are usually made available in the water column from the bottom. During the interactions between the water and the bottom, a lot of particles are mobilized. This process explains the reason why higher amount of particles were trapped in the bottom nets. Additionally, after the passage of each wave crest, the bigger-sized particles that are lifted into the water column tend to settle rapidly and move on or close to the bed under the effect of gravity. Indeed, for a fixed particle density, the particle’s weight increases with an increasing sediment diameter, causing heavier particles to perform smaller jumps than lighter ones [40]. This transport on the bed is also known as massive particle or heavy particle transport [41], with a thickness that is equal to the height of the saltation of a sediment grain near the bed [42]. The finer portion usually remains longer in the water column and is more susceptible to resuspension [43]. Regarding the cross-shore distribution of the LSTRs, the trend observed in this study was different from those found in other studies. During the measurements of suspended sediment concentrations on Galveston Island (Texas), Ref. [44] found two peaks in the inner to middle surf zone. Ref. [45] noticed along the ‘’Saidia-Cap de l’Eau’’ coast that higher total rates (bedload and suspended) occurred at the first trap, which was located close to the shoreline. Like [44], [32] also identified two peaks on the Normandy macrotidal beach, but the major one was in the swash zone and the second one close to the breaker line; meanwhile, these rates were homogeneous in the inner and mid-surf zone. A similar trend was also identified in the measurements performed at the Longshore Sediment Transport Facility of the USACE [46]. These changes in the LST profiles could be controlled by different morphological features which could be present in the surf zone; nevertheless, even on a plane profile, LSTRs may not have a uniform distribution [30]. The wave climate intensity may also play a role.
With regard to the cross-shore distribution of the grain size, ref. [47] found that for bottom materials, bigger-sized particles could be found close to the breaker zone, while finer ones could be found close to the shoreline. Levoy et al. (1994) also noticed coarser sediments in the swash and finer ones in suspension in the breaker zone. In this study, the trend observed was characterized by a relative decrease in the grain size from the outermost trap to the shoreline. This trend was not similar to the findings of the previous study. This was obvious since the distribution found in this study for the grain size was just valid for the inner and middle surf, whereas that observed in the study by Levoy et al. (1994) pertained to the entire surf zone, including the swash.

4.3. Sand Transport and Hydrodynamic Factors

In the surf zone, the transportation of sediment particles is very sensitive to hydrodynamic parameters [3]. However, the fact that no relationship was found between the sand transport rates and both the wave angle and current velocity was probably due to the small variations in these two parameters throughout the study period, in such a way that the little changes observed in these parameters were not accompanied with a significant change in the sand transport rates. The standard deviations were only 1.38 degrees for the wave angle and 0.006 m·s−1 for the current velocity, respectively. The very slight decrease in the LST with the current velocity was certainly due to the coincidence of a data point, the influence of which became prominent because of the narrow range in the measured velocity. Another factor could be the area of study under consideration. In this study, although the grain size also played a non-negligible role, the wave height appeared to be the key parameter that accounted most for the sediment transport. This suggests that higher wave heights induced a higher transport due to wave-breaking phenomena. Even if the coefficient of determination was somewhat low, field experiments are sometimes known to be characterized by somewhat low coefficients because of the difficulties involved in measurements.

5. Conclusions

During this super challenging surf zone data collection, the measured sand transport rates were compared with theoretical rates computed by three equations. Given that the measurements were only performed in the inner and middle surf zone, it would be invalid to make a direct comparison between both the measured and computed rates. However, using the assumption that the rates increased linearly toward the breaker zone, the one order of magnitude factor in the overestimation found with the CERC rates was reduced to only 4.5, while the best estimates were obtained with the van Rijn equation followed straightly by the Kamphuis formula, which confirmed the capabilities of these equations to provide close estimates to the measured transport rates during mild wave conditions. The overestimation factor obtained for the CERC equation could possibly be due to the K-parameter used and the assumption of saturation in the fluid with sediment particles, which is one of the important assumptions upon which the CERC formula is based.; meanwhile, the several parameters involved in the development of the other two equations, such as the wave period, the grain size and the beach slope, have increased their efficiency. The relationships between the measured sand transport rates and the wave parameters found in this study were similar to those found in other studies (e.g., [31]). However, the relationship between the longshore velocity and the sand transport was not clear: a situation which was due to the narrow range in the velocities recorded throughout the study period. Nevertheless, the wave height had an obvious relationship with the sand transport rates, making it the main parameter that was responsible for the sand trapped in the nets.
As far as both the Kamphuis and van Rijn equations were concerned, we suggest that these formulas could also be considered in the design of coastal engineering structures in West Africa, especially when it comes to the longshore sediment transport prediction under mild wave conditions. This was particularly important in the West Africa context, where field data availability could be challenging and where prior studies were hardly undertaken before the construction of protection structures along the coast. Furthermore, a longer-term study could be also performed with cutting-edge instrumentation, including numerical approaches, to provide more detail on longshore transport along the entire coast of Ghana and that of the Gulf of Guinea with the ultimate goal of establishing a reliable sediment budget for the region.

Author Contributions

Conceptualization, K.S.F.A., D.W.A., D.B.A. and L.C.v.R.; methodology, K.S.F.A., D.W.A., D.B.A., L.C.v.R., F.S.T. and K.Z.H.; software, K.S.F.A.; validation, K.S.F.A., D.W.A., D.B.A. and L.C.v.R.; formal analysis, K.S.F.A.; investigation, K.S.F.A. and E.K.B.; data curation K.S.F.A.; writing—original draft preparation, K.S.F.A.; writing—review and editing, K.S.F.A., D.W.A., D.B.A., L.C.v.R., K.Z.H., E.K.B. and F.S.T.; supervision, D.W.A. and D.B.A. All authors have read and agreed to the published version of the manuscript.

Funding

This study has been fully funded by the World Bank Africa Centre of Excellence in Coastal Resilience (ACECoR) Project (World Bank ACE Grant Number 6389-G).

Informed Consent Statement

Not applicable.

Data Availability Statement

ACECoR policies do not support the sharing of the survey data publicly.

Acknowledgments

Special thanks to the World Bank for financing this research. We are equally grateful to the workers in the workshop of the University of Cape Coast for their help in constructing the traps, and also to the Denu fishermen crew for their great assistance during the field work.

Conflicts of Interest

The authors declare no conflict of interest.

References

  1. Sundar, V.; Sannasiraj, S. Longshore sediment transport rate from the field measured wave and sediment characteristics along the coast of Karaikal, India. ISH J. Hydraul. Eng. 2022, 1–12. [Google Scholar] [CrossRef]
  2. O’grady, J.; Babanin, A.; McInnes, K. Downscaling Future Longshore Sediment Transport in South Eastern Australia. J. Mar. Sci. Eng. 2019, 7, 289. [Google Scholar] [CrossRef] [Green Version]
  3. Ostrowski, R. On Uncertainties in Determination of Sediment Transport Rates in Coastal Regions. Arch. Hydro-Eng. Environ. Mech. 2016, 63, 265–280. [Google Scholar] [CrossRef] [Green Version]
  4. Giardino, A.; Schrijvershof, R.; Nederhoff, C.; de Vroeg, H.; Brière, C.; Tonnon, P.-K.; Caires, S.; Walstra, D.; Sosa, J.; van Verseveld, W.; et al. A quantitative assessment of human interventions and climate change on the West African sediment budget. Ocean Coast. Manag. 2018, 156, 249–265. [Google Scholar] [CrossRef]
  5. Xorse, T.M. Impact of Wave Dynamics on the Coast of Ghana. Ph.D. Thesis, University of Ghana, Accra, Ghana, 2013. [Google Scholar]
  6. Almar, R.; Kestenare, E.; Reyns, J.; Jouanno, J.; Anthony, E.; Laibi, R.; Hemer, M.; Du Penhoat, Y.; Ranasinghe, R. Response of the Bight of Benin (Gulf of Guinea, West Africa) coastline to anthropogenic and natural forcing, Part1: Wave climate variability and impacts on the longshore sediment transport. Cont. Shelf Res. 2015, 110, 48–59. [Google Scholar] [CrossRef]
  7. Addo, K.A. Assessing Ocean Wave Dynamics, Potential Sediment Transport, and Coastal Erosion along Accra Coast in Ghana. J. Coast. Res. 2018, 81, 86. [Google Scholar] [CrossRef]
  8. Angnuureng, D.B.; Jayson-Quashigah, P.-N.; Addo, K.A.; Aheto, D.W.; Almar, R.; Bonou, F.; Brempong, E. Quantification of the Shoreline Evolution of an Open Beach between Coastal Defenses. In Proceedings of the 9th International Conference: Coastal Sediments 2019, Petersburg, FL, USA, 27–31 May 2019; pp. 1562–1576. [Google Scholar] [CrossRef]
  9. Shaeri, S.; Etemad-Shahidi, A.; Tomlinson, R. Revisiting Longshore Sediment Transport Formulas. J. Waterw. Port Coast. Ocean Eng. 2020, 146, 04020009. [Google Scholar] [CrossRef]
  10. Sadeghifar, T.; Barati, R. Application of Adaptive Neuro-Fuzzy Inference System to Estimate Alongshore Sediment Transport Rate (A Real Case Study: Southern Shorelines of Caspian Sea). J. Soft Comput. Civ. Eng. 2018, 2, 72–85. [Google Scholar] [CrossRef]
  11. Gholami, Z.; Lari, K.; Bidokhti, A.A.; Javid, A. Revisiting the derivation of bulk longshore sediment transport rates using meta-heuristic algorithms. Ocean Coast. Res. 2021, 69, 1–11. [Google Scholar] [CrossRef]
  12. US Army. Shore Protection Manual; Corps of Engineers, Beach Erosion Board: Fort Belvoir, VA, USA, 1984; pp. 1–230. [Google Scholar]
  13. Kamphuis, J.W. Alongshore sediment transport rate. J. Waterw. Port Coast. Ocean. Eng. 1991, 117, 624–640. [Google Scholar] [CrossRef]
  14. van Rijn, L.C. A simple general expression for longshore transport of sand, gravel and shingle. Coast. Eng. 2014, 90, 23–39. [Google Scholar] [CrossRef]
  15. Adjei, P.O.W.; Cazcarro, I.; Arto, I.; Ofori-Danson, P.K.; Asenso, J.K.; Codjoe, S.N. Biophysical and socioeconomic state of the Volta Delta region of Ghana from the perspectives of gender and spatial relations. In Deltas, Vulnerability and Climate Change: Migration and Adaptation; Working Paper; DECCMA: Southampton, UK, 2018; pp. 1–26. [Google Scholar]
  16. Jayson-Quashigah, P.-N.; Addo, K.A.; Amisigo, B.; Wiafe, G. Assessment of short-term beach sediment change in the Volta Delta coast in Ghana using data from Unmanned Aerial Vehicles (Drone). Ocean Coast. Manag. 2019, 182, 104952. [Google Scholar] [CrossRef]
  17. Nicholls, R.J.; Adger, W.N.; Hutton, C.W.; Hanson, S.E. Delta Challenges and Trade-Offs from the Holocene to the Anthropocene BT-Deltas in the Anthropocene; Nicholls, R.J., Adger, W.N., Hutton, C.W., Hanson, S.E., Eds.; Springer International Publishing: Cham, Germany, 2020; pp. 1–22. [Google Scholar]
  18. Gampson, E.K.; Nartey, V.K.; Golow, A.A.; Akiti, T.T.; Sarfo, M.A.; Salifu, M.; Fuseini, A.R. Physical and isotopic characteristics in peri-urban landscapes: A case study at the lower Volta River Basin, Ghana. Appl. Water Sci. 2017, 7, 729–744. [Google Scholar] [CrossRef] [Green Version]
  19. Sørensen, T.H.; Vølund, G.; Armah, A.K.; Christiansen, C.; Jensen, L.B.; Pedersen, J.T. Temporal and spatial varations in concentrations of sediment nutrients and carbon in the Keta lagoon, Ghana. West Afr. J. Appl. Ecol. 2003, 4. [Google Scholar]
  20. Appeaning Addo, K.; Jayson-Quashigah, P.N.; Codjoe SN, A.; Martey, F. Drone as a tool for coastal flood monitoring in the Volta Delta, Ghana. Geoenviron. Disasters 2018, 5, 13. [Google Scholar] [CrossRef] [Green Version]
  21. Roest, L.W.M. The Coastal System of the Volta Delta, Ghana: Strategies and Opportunities for Development; TU Delft Delta Infrastures and Mobility Initiative (DIMI): Delft, The Netherlands, 2018. [Google Scholar]
  22. Horikawa, K. Nearshore Dynamics and Coastal Processes: Theory, Measurement, and Predictive Models; University of Tokyo Press: Tokyo, Japan, 1988. [Google Scholar]
  23. Hamid, N. Study of Community Capacity in Dealing with The Threat of Shore Erosion in Kragan Subdistrict Rembang District. Pancar. Pendidik. 2018, 7, 57–70. [Google Scholar] [CrossRef]
  24. Quadrado, G.P.; Goulart, E.S. Longshore sediment transport: Predicting rates in dissipative sandy beaches at southern Brazil. SN Appl. Sci. 2020, 2, 1–13. [Google Scholar] [CrossRef]
  25. Bradford, S.F.; Sanders, B.F. Finite-Volume Model for Shallow-Water Flooding of Arbitrary Topography. J. Hydraul. Eng. 2002, 128, 289–298. [Google Scholar] [CrossRef]
  26. Longuet-Higgins, M.S. Longshore currents generated by obliquely incident sea waves: 1. J. Geophys. Res. 1970, 75, 6778–6789. [Google Scholar] [CrossRef]
  27. Komar, P.D. Nearshore Currents: Generation by Obliquely Incident Waves and Longshore Variations in Breaker Height. In Nearshore Sediment Dynamics and Sedimentation; John and Wiley and Sons: Hoboken, NJ, USA, 1975. [Google Scholar]
  28. van Rijn, L.C. Longshore Sand Transport. In Proceedings of the 28th ICCE, Cardiff, UK, 1–13 July 2003. [Google Scholar]
  29. Kraus, N.C. Application of portable traps for obtaining point measurements of sediment transport rates in the surf zone. J. Coast. Res. 1987, 3, 139–152. [Google Scholar]
  30. Kraus, N.C.; Gingerich, K.J.; Rosati, J.D. DUCK85 SURF ZONE SAND; US Army Corps of Engineers: Bronx, NY, USA, 1989. [Google Scholar]
  31. Wang, P.; Kraus, N.C.; Davis, R., Jr. Total longshore sediment transport rate in the surf zone. J. Coast. Res. 1998, 14, 269–282. [Google Scholar]
  32. Levoy, F.; Monfort, O.; Rousset, H.; Larsonneur, C. Quantification of Longshore Transport in the Surf Zone on Macrotidal Beaches. In Coastal Engineering; Taylor and Francis: Abingdon, UK, 1994. [Google Scholar]
  33. CEM. U.S. Army Engineer Research and Development Center, Coastal and Hydraulics Laboratory. In Coastal Engineering Manual; CEM: Vicksburg, MS, USA, 2003. [Google Scholar]
  34. Smith, E.R.; Wang, P.; Ebersole, B.A.; Zhang, J. Dependence of Total Longshore Sediment Transport Rates on Incident Wave Parameters and Breaker Type. J. Coast. Res. 2009, 253, 675–683. [Google Scholar] [CrossRef] [Green Version]
  35. Soltau, C. The Cross-Shore Distribution of Grain Size in the Longshore Transport Zone. Ph.D. Thesis, University of Stellenbosch, Stellenbosch, South Africa, 2009. [Google Scholar]
  36. Einstein, H.A. The Bed-Load Function for Sediment Transportation in Open Channel Flows (No. 1026); US Department of Agriculture: Washington, DC, USA, 1950. [Google Scholar]
  37. van Rijn, L.C. Unified view of sediment transport by currents and waves. I: Initiation of motion, bed roughness, and bed-load transport. J. Hydraul. Eng. 2007, 133, 649–667. [Google Scholar] [CrossRef] [Green Version]
  38. Cartier, A. Évaluation des Flux Sédimentaires sur le Littoral du Nord-Pas de Calais: Vers Une Meilleure Compréhension de la Morphodynamique des Plages Macrotidales. Ph.D. Thesis, Université du Littoral Côte d’Opale, Calais, France, 2011. [Google Scholar]
  39. Briggs, T.R.; Figlus, J.; Torres-Freyermuth, A.; Puleo, J.A.; Warren, W.; Alrushaid, T. Variability in Onshore Sediment Transport on a Natural Beach during a Central American Cold Surge Event. J. Coast. Res. 2020, 36, 487–497. [Google Scholar] [CrossRef]
  40. Kumbhakar, M.; Kundu, S.; Ghoshal, K. An explicit analytical expression for bed-load layer thickness based on maximum entropy principle. Phys. Lett. A 2018, 382, 2297–2304. [Google Scholar] [CrossRef]
  41. Guta, H.; Hurther, D.; Chauchat, J. Bedload and Concentration Effects on Turbulent Suspension Properties in Heavy Particle Sheet Flows. J. Hydraul. Eng. 2022, 148, 04022012. [Google Scholar] [CrossRef]
  42. Zhu, Z.; Yu, J. Estimating the Bed-Load Layer Thickness in Open Channels by Tsallis Entropy. Entropy 2019, 21, 123. [Google Scholar] [CrossRef] [PubMed]
  43. Storlazzi, C.D.; Norris, B.; Rosenberger, K.J. The influence of grain size, grain color, and suspended-sediment concentration on light attenuation: Why fine-grained terrestrial sediment is bad for coral reef ecosystems. Coral Reefs 2015, 34, 967–975. [Google Scholar] [CrossRef]
  44. Rogers, A.L.; Ravens, T.M. Measurement of longshore sediment transport rates in the surf zone on Galveston Island, Texas. J. Coast. Res. 2008, 24, 62–73. [Google Scholar] [CrossRef]
  45. Lasgaa, H. Evaluation du Transport Sédimentaire Longshore–Cross Shore du Littoral de Saidia–Cap de l’Eau (Maroc Nord-Est). Rev. Maroc. De Géomorpholo 2018, 1–17. [Google Scholar]
  46. Wang, P.; Smith, E.R.; Ebersole, B.A. Large-scale laboratory measurements of longshore sediment transport under spilling and plunging breakers. J. Coast. Res. 2002, 18, 118–135. [Google Scholar]
  47. Yu, X.; Li, S.; Li, S. Sandy Coast (Shore) and Neritic Depositional System. In Clastic Hydrocarbon Reservoir Sedimentology; Springer: Cham, Switzerland, 2018; pp. 573–632. [Google Scholar] [CrossRef]
Figure 1. Map of the study area.
Jmse 11 01576 g001
Figure 2. Part of a West Africa wave rose, showing the Volta delta in the small red square (adapted from [4]).
Jmse 11 01576 g002
Figure 3. Some of the deployed instruments during each run.
Jmse 11 01576 g003
Figure 4. Sketch of the trap deployment showing the employed symbols in Equation (8).
Jmse 11 01576 g004
Figure 5. Comparison between measured and computed velocities (note the relatively similar trend but different magnitude) [26,27,28].
Jmse 11 01576 g005
Figure 6. Relationship between measured and computed sand transport rates (A smaller K-value of 0.2 has been used for a better representation).
Jmse 11 01576 g006
Figure 7. Distribution of transport rates across different runs (a lower K-value of 0.2 was used for the CERC formula for better representation; notice the similar trend). * Measured rates not reliable.
Jmse 11 01576 g007
Figure 8. Comparison between different transport rates (K = 0.39 for the CERC rates). * Measured rates not reliable.
Jmse 11 01576 g008
Figure 9. Vertical (A) and cross-shore (B) distribution of LST during Run 214271022.
Jmse 11 01576 g009
Figure 10. Vertical distributions of the grain size during two runs (the first four nozzles from bottom were considered).
Jmse 11 01576 g010
Figure 11. Cross-shore distribution of LST using the normalized distances and the normalized LSTRs (the normalized distances shown on the x-axis also stand for the positions of the four traps T1, T2, T3, and T4; nine rates where all the 4 traps were deployed and where uniform distances were maintained between the traps are presented).
Jmse 11 01576 g011
Figure 12. Relationship between wave period and normalized LSTRs.
Jmse 11 01576 g012
Figure 13. Relationship between wave angle and normalized LSTRs.
Jmse 11 01576 g013
Figure 14. Relationship between current velocity and normalized LSTRs.
Jmse 11 01576 g014
Figure 15. Relationship between wave height and normalized LSTRs.
Jmse 11 01576 g015
Figure 16. Relationship between grain size and normalized LSTRs.
Jmse 11 01576 g016
Figure 17. Relationship between beach slope and normalized LSTRs.
Jmse 11 01576 g017
Table 1. Information on wave parameters and current velocity.
DateRun
ID
Significant Wave Height
(m)
Wave Period
(s)
Breaker Angle
(°)
Mean Longshore Velocity
(m·s−1)
31/03/20212133111321.09140.37
2133111520.79130.35
13/04/20212141311190.77150.41
2141311450.97140.36
27/04/20212142709140.98150.49
2142710220.78150.42
2142710500.88150.44
29/04/20212142911360.810160.44
2142912000.89150.35
30/04/20212143011480.87140.32
2143012480.78150.40
15/05/20212151511140.69130.36
17/05/20212151713280.89160.40
23/05/20212152306540.67150.34
2152307420.67160.40
25/05/20212152509100.813120.42
10/06/20212161008341.16170.44
21610093519170.52
11/06/20212161109220.87160.46
2161109560.89170.48
12/06/2021216120946112150.4
2161210350.711160.48
24/07/20212172409411.011170.37
2172410161.18170.35
Table 2. Surf zone and beach median grain-size.
Run IDSurf Zone d50Beach d50
Run 2133111320.170.32
Run 2133111520.20.33
Run 2141311190.230.43
Run 2141311450.210.45
Run 2142709140.20.46
Run 2142710220.220.47
Run 2142710500.230.47
Run 2142911360.270.48
Run 2142912000.280.47
Run 2143011480.30.5
Run 2143012480.320.48
Run 215151114 *0.30.32
Run 215171328 *0.320.59
Run 215230654 *0.240.47
Run 215250910 *0.230.5
Run 2161008340.220.57
Run 216100935 *0.220.58
Run 216110922 *0.230.56
Run 216120946 *0.210.5
Run 216121035 *0.230.51
Run 2172409410.30.37
Run 2172410160.320.37
* Only three traps deployed.
Disclaimer/Publisher’s Note: The statements, opinions and data contained in all publications are solely those of the individual author(s) and contributor(s) and not of MDPI and/or the editor(s). MDPI and/or the editor(s) disclaim responsibility for any injury to people or property resulting from any ideas, methods, instructions or products referred to in the content.