Article

Identifying Transshipment Hubs in a Global Container Shipping Network: An Approach Based on Reinforced Structural Holes

College of Transport and Communications, Shanghai Maritime University, Shanghai 201308, China
*
Author to whom correspondence should be addressed.
J. Mar. Sci. Eng. 2023, 11(8), 1585; https://doi.org/10.3390/jmse11081585
Submission received: 25 July 2023 / Revised: 7 August 2023 / Accepted: 11 August 2023 / Published: 12 August 2023
(This article belongs to the Special Issue Port Management and Maritime Logistics)

Abstract

:
Transshipment hubs are important components of the global container shipping network. Nowadays, hybrid ports are emerging, handling both gateway and transshipment container traffic depending on their significant maritime connectivity. Effectively identifying transshipment hubs, including traditional transshipment hubs with high transshipment incidences and hybrid ports with sufficient transshipment capabilities, is crucial to gain a good understanding of container shipping networks. The method of reinforced structural holes (RSHs) has been introduced from the sociology to detect transshipment hubs at the global level, as it can fully consider the existence of separated cohesive port communities. The results show that the RSH-based approach is feasible to identify those hubs playing the role of bridges across different port communities worldwide, which is demonstrated from the perspective of maritime connectivity. The higher ranked hubs with higher RSH values generally have better maritime connections with ports from various port communities. Several policy implications have been further elaborated for relevant decision makers, such as liner companies and port operators.

1. Introduction

A maritime network of container shipping features a complicated compound of various types of liner services among ports [1]. As a complex network, the global container shipping network has certain properties, such as a small-world effect and scale-free architecture, that are common to many other networks in the social domain [2,3]; although, the shipping network configuration is influenced by various factors [4]. In addition to these overall properties, the existence of port communities is one of the important characteristics of the global container shipping network from the perspective of subgraphs [5,6,7], which indicates that ports belonging to the same community connect well with each other, while ports from different communities have relatively fewer connections [8,9]. Thus, intermediary ports, through which different communities connect closely with each other, function as transshipment hubs [10,11]. These hub ports generally possess good maritime connectivity by playing a crucial role of bridges between different systems of shipping services, especially in the era of containerization with the increase of long-distance containerized trade [12,13,14]. In this sense, the importance of a transshipment hub is largely related to how many port communities and ports are connected through it, and the operation of transshipment hubs is crucial to the reliability and resilience of the global container shipping network.
It has been noted that the transshipment incidence, referring to the proportion of transshipment containers in the annual total container throughput of a port, is traditionally used as a critical indicator to evaluate the port transshipment business [15,16]. According to Rodrigue and Ashar [12], only a container port with a transshipment incidence of around 50% or over can be considered as a transshipment hub. Although it is easy and useful to determine whether a port can be classified as a transshipment port by adopting the transshipment incidence, this indicator merely shows the consequential performance regarding the transshipment business of a port rather than the maritime connectivity from the perspective of connecting port communities. Nowadays, hybrid ports are emerging, handling both gateway and transshipment container traffic, such as Cartagena Port in Colombia and Qingdao Port in China [17,18]. For these hybrid ports, while they currently may have relatively lower transshipment shares, they enjoy good maritime connectivity across different port communities. The underlying maritime connectivity enables hybrid ports to further develop their transshipment business. Therefore, it is essential to identify transshipment hubs in the global container shipping network by focusing on the maritime connectivity among the port communities worldwide beyond the traditional transshipment incidence. With the rise of network analysis, the method of betweenness centrality has been often used to identify transshipment hubs in the past decade as it can evaluate the extent to which a port functions as an intermediate location for other ports in a shipping network [19,20]. However, the measure of the betweenness centrality of a port is based on the connections between pairs of ports, without consideration of the existence of the port communities themselves.
To effectively detect transshipment hubs, including potential ones, with full consideration of their maritime connectivity among the port communities, we have introduced the method of reinforced structural holes (RSHs), the development of the structural hole theory, from the sociology pertaining to social networks, which can help to identify the nodes playing the intermediary role of network brokers between separated cohesive groups [21]. More information on the RSH method will be presented in the methodology section to detail the reasons why we chose to adopt it in our study. In addition, the Louvain algorithm [22] was used to determine port communities of the global container shipping network, and the maritime connectivity of transshipment hubs that are identified via the RSH method was measured using the number of their connected ports in various shipping services across different port communities. In doing so, we can further demonstrate the feasibility of the RSH method in identifying transshipment hubs in the global container shipping network.
The remainder of this paper is organized as follows. Section 2 presents a brief literature review on transshipment hubs and the methods that are used to identify these transshipment hubs in shipping networks. In Section 3, the RSH method and Louvain algorithm are elaborated. The results of our empirical study are presented in Section 4. Section 5 provides several policy implications for relevant decision makers in shipping and port industries. Section 6 outlines the conclusions of this study.

2. Literature Review

In this section, we conducted a review on the existing studies associated with the topic of transshipment hubs by focusing on two aspects: the maritime connectivity of the transshipment hubs, and the methods that are used to identify transshipment hubs in shipping networks.

2.1. Transshipment Hubs and Their Maritime Connectivity

Multi-hub spatial agglomeration is one of basic characteristics of the global container shipping network [23]. Many transshipment hubs develop their market shares beyond their regional boundaries [24]; they transship goods through transcontinental travel from one community to another and have a far-reaching impact on the planning of ship routes. Compared to the transshipment ports at the regional level, transshipment hubs are more conducive to realize economies of scale and improve economic benefits for the whole network by transshipping cargo cross-regionally [13]. Therefore, these hubs have attracted extensive attention in academic circles [12,25,26]. Traditionally, transshipment hubs usually have several advantages, such as geographical conditions that can defend their own status. For example, Singapore has high-strength connections with ports around the world by virtue of its critical geographical location [27]; Hong Kong benefits from China’s open-door policy, which makes a large number of ships gather [28]. However, with the dynamics of the global economy, these advantages are not unchanging. According to Tan and Hilmola [29], changes in the source of goods caused by industrial transfer may reduce the geographical advantages of transshipment ports. Moreover, policy changes can also affect the prospects for the development of transshipment ports [30].
Generally speaking, transshipment hubs highlight themselves in the global shipping network by their superior maritime connectivity, which usually reflects in the frequency of shipping services, the number of destinations served, transport costs, etc. [31,32]. Since the global shipping network is actually composed of multiple communities with close internal links and few external links [6], the ports connecting a large number of shipping communities have advantages to develop their transshipment functions and evolve to become transshipment hubs due to their considerable maritime connectivity [33]. Maritime connectivity is one of important factors affecting shipping carriers’ decisions when they select transshipment hubs in their businesses [34]. Better maritime connectivity indicates greater access to physical resources, more possibilities to expend business markets for shippers, and a higher port efficiency [35]. In order to assess the maritime connectivity, the United Nations Conference on Trade and Development (UNCTAD) has proposed two indicators: the liner shipping connectivity index (LSCI) and the liner shipping bilateral connectivity index (LSBCI); although, their applicability and relevance remain to be further evaluated [36]. It is worth noting that the LSBCI is measured at the national level rather than at the port level. Compared to the country-based maritime connectivity, inter-port connectivity can better manifest the important roles of transshipment hubs in shipping networks [3].

2.2. Methods Used to Identify Transshipment Hubs in Shipping Networks

Due to the crucial roles of transshipment hubs in shipping networks, how to effectively identify transshipment hubs has been an important research question for scholars in the maritime domain. In addition to the traditional indicators, such as the transshipment incidence [12], a number of quantitative methods have been introduced from the research field of complex networks to detect transshipment hubs, due to the network nature of maritime transportation [37,38,39]. For example, betweenness centrality, one of the most usual measures of centralities proposed by Freeman [40], represents the potential of nodes acting as intermediate locations on the shortest paths between pairs of nodes within a given network. Hence, it is often used to identify intermediate transshipment ports in shipping networks [1,19,20]. However, the method of betweenness centrality has some inherent defects in detecting transshipment hubs effectively [3]. For instance, betweenness centrality is measured based on the number of shortest paths, but the shortest paths do not necessarily connect nodes in reality [41].
In recent years, alongside the conventional approach of centralities, scholars have introduced other analytical methods from the complex network research domain to further explore shipping networks. Specifically, Pan et al. [7] identified regional hub ports with transshipment functions within port communities using the eigenvalue decomposition method. Zhang et al. [3] applied the structural hole theory to identify transshipment ports at the regional level and pointed out that the port occupying a structural hole position is generally the regional hub with a significant function of cargo transshipment. As an emerging method used in transportation network studies [42,43], the structural hole theory was initially proposed by Burt [44] to study the relationships in social networks. According to Burt [44], structural holes are described as “network gaps between players which create entrepreneurial opportunities for information access, timing, referrals, and for control”. Generally speaking, if two or more individuals fail to connect in a social network, then it can be argued that a structural hole exists, which is a gap that can be filled using a connector as the “bridge” [45]. Put simply, filling the structural holes indicates that the contacts in a network are bridged, and relevant information and control benefits are generated consequently [46]. Due to the fact that the structural hole theory concentrates on the ego network [47], in which the node set consists of a node as the ego and the neighboring nodes that are directly linked to the ego as the alters [48], this method only shows its effectiveness in identifying transshipment ports at the regional level rather than at the global level, without fully considering the connections among the port communities [3]. Table 1 lists the main methods that can be used to identify transshipment hubs at the regional and global levels from the existing literature. It is worth pointing out that although the methods of betweenness centrality and transshipment incidence are adopted to detect transshipment hubs at various levels by dealing with the different geographical scopes of shipping data, the logic behind these methods is the focus for the global graph rather than for the local one.
Alongside the development of the structural hole theory, the RSH method, proposed by Burt [21], can be used to detect transshipment hubs that are connecting different port communities, as this method not only focuses on the ego networks but also the networks around each of the ego’s contacts, which enables it to identify those structural holes reinforced by coordination within each community to the exclusion of the other [48]. Since the global shipping network is actually consisted of several main regional port communities [6], the RSH method shows its great potential in identifying transshipment hubs at the global level. It is indeed meaningful to introduce and apply this method to enrich the research on the identification of the transshipment hubs.

3. Methodology and Data

In this section, the RSH method has been presented in detail by showing how to measure the extent that a structural hole is reinforced, and the Louvain algorithm is briefly articulated. In addition, we present a necessary introduction to our research data.

3.1. Reinforced Structural Holes Method

Compared to the structural hole method, the RSH approach focuses on the reinforcement around the structural holes in a given network. From the perspective of groups or communities, structural holes are actually gaps that exist between different communities of a network [49]. Bridging these structural holes results in the improved connection between separate communities, which can generate benefits of information and control [48]. Due to the fact that nodes belonging to the same community are usually well connected with each other, and that communities typically have few connections between one another, structural holes between communities are generally reinforced with the close inner connection of each community [21]. Thus, the more reinforced a structural hole, the greater the importance of occupying this hole and playing the function of brokerage across cohesive communities. When it comes to the global container shipping network, transshipment hubs, in fact, hold the positions of reinforced structural holes by connecting the different port communities.
According to Burt [21], it is important to measure the access to reinforced structural holes. The RSH method aims to detect the nodes that are occupying the positions of reinforced structural holes by having contacts in many separate communities within a given network. Assuming that A and B are the adjacent connected nodes of the focal node (i.e., ego), the extent to which the structural hole between A and B is reinforced with the ego network of B (i.e., B’s network) can be measured as:
R S H b a = ( 1 m b a ) [ k p b k ( 1 m k a ) ] N b ,   k = 1   t o   N b ; k a ,
where m b a , as the marginal strength of B’s connection with A, is defined as: m b a = z b a / m a x b z b k . z b a indicates the connection value between A and B. m a x b z b k represents B’s maximum connection value in B’s network, where k is one of B’s contacting nodes. Note that ( 1 m b a ) actually measures B’s disconnection from A. In the case where no direct connection exists between A and B, m b a would be zero and the term ( 1 m b a ) would equal one, which indicates the existence of a structural hole between A and B in B’s network. Similarly, ( 1 m k a ) measures k’s disconnection from A. p b k , as the proportional strength for B of its connection with k, is measured as: p b k = z b k / k l z b l , where z b k denotes the connection value between B and k. k l z b l represents the sum of connections’ value between B and its other contacts. k p b k ( 1 m k a ) is integrated to measure the extent to which all of B’s contacts k, reinforcing the structural hole between A and B for B. N b represents the total number of B’s contacts.
The value of R S H b a varies from 0 to 1. However, R S H b a can never reach 1 due to the fact that the connection between A and B exists via the ego. It approximately approaches to 1 when all of B’s contacts, except the ego, are disconnected from A. Comparatively, R S H b a equals 0 when there is a direct connection between A and B (i.e., m b a = 1) or all of B’s other contacts are connected with A (i.e., m k a = 1). Thus, 0 R S H b a < 1 . Considering the extent of the connection between A and B, the higher value R S H b a reaches, the more extent that the gap, namely, the structural hole between A and B, is reinforced by B’s network.
Since there are a number of pairs of ego’s contacts, in light of Burt [21], the extent to which the ego’s access to reinforced structural holes can be defined as:
R S H i = q j R S H q j 2 ,   q j ,  
where both q and j are contacts of the focal node i (i.e., ego), and summation is across all ordered pairs of the ego’s contacts. Note that the total number of ordered pairs of the ego’s contacts equals N ( N 1 ) . N denotes the total number of the ego’s contacts. The value of R S H varies from 0 to a maximum approaching N ( N 1 ) / 2 . According to the abovementioned Formula (1), it is obvious that the calculation of the R S H (i.e., Formula (2)) has fully considered the disconnection among individual subnetworks of each ego’s contact. In general, the higher the node’s R S H , the more likely that the node has access to reinforced structural holes with a bridging function among different communities, and vice versa.

3.2. The Louvain Algorithm

In order to demonstrate that the RSH method can help identify those transshipment hubs connecting different port communities, the Louvain algorithm was adopted to detect port communities within the global container shipping network. According to De Meo et al. [22], the Louvain Algorithm is suitable for analyzing large, weighted networks based on local information. Moreover, the communities detected from the Louvain algorithm have dense structures but are weakly coupled to each other. The concept of network modularity has been proposed to investigate the community structure of networks [50]. Assuming the graph G = ( V , E ) representing the given network, which is partitioned into n communities, the network modularity is defined as:
Q = s = 1 n [ l s | E | ( d s 2 | E | ) 2 ] ,
where l s denotes the number of edges among the nodes belonging to the s -th community, and d s indicates the sum of the degrees of the nodes in the s -th community. | E | is the number of edges in the network. The logic of Louvain algorithm is maximizing the network modularity [22].
Specifically, the algorithm can be divided into two iterative stages [51]. Firstly, each node is assigned to a given community with the aim of maximizing the network modularity Q . The gain generated from clustering a node i into a community C can be measured as:
Δ Q = C + k i C 2 m ( C ^ + k i 2 m ) 2 [ C 2 m ( C ^ 2 m ) 2 ( k i 2 m ) ] ,  
where C denotes the sum of the weights of the edges in the community C , C ^ represents the sum of the weights of the edges among the nodes in C , k i indicates the sum of the weights of the edges of node i , k i C is the sum of the weights of the edges from i to the other nodes in C , and m is the sum of the weights of all the edges. The community is determined until the largest non-negative increment of network modularity is achieved, and node i is subsequently assigned to this community. If the Δ Q is always not positive, the node i remains in its original community [52]. Secondly, a new network is created based on the community results previously gained from the first stage. Edges from multiple nodes in the same community to another community in the original network are represented by a weighted edge in the new network. This process iterates until an obvious improvement of the modularity is obtained [22,53].

3.3. Data Collection

The empirical data of global liner shipping services in March 2021 were collected from Alphaliner https://public.alphaliner.com/ (accessed on 17 April 2021), a famous international shipping consulting agency. Specifically, the information on 1490 liner shipping services (e.g., weekly capacities and calling ports) of full containerships was included. Due to the relatively small market size, the liner shipping services provided by Ro-Ro ships, general cargo ships, and semi-containerships were not covered by our sample database.
In general, there are two means to construct a shipping network, namely the Space P and Space L models [20]. In the shipping network constructed using the Space P model, any two ports are considered to have the connection between each other if they are on the same shipping routes regardless of whether they are directly connected or not [54]. Comparatively, in the shipping network built with the Space L model, the connection only exists between the consecutive ports having direct successive calls [3]. According to Ducruet and Zaidi [10], the tightly connected port communities are more likely to appear in the shipping network based on the Space P model. Therefore, this paper adopted the Space P model to construct the global container shipping network, including 746 ports. Notably, we gave full consideration to the scales of container shipping services among ports; thus, the edges between all pairs of ports were weighted using the weekly capacities deployed in the services.

4. Empirical Results of the Analysis

In this section, we present the top transshipment hubs that were identified with the RSH method. In order to demonstrate the robustness of the empirical results on transshipment hubs, the maritime connectivity of these identified transshipment hubs has been investigated from the perspective of port connections among port communities.

4.1. Transshipment Hubs Identified by RSHs

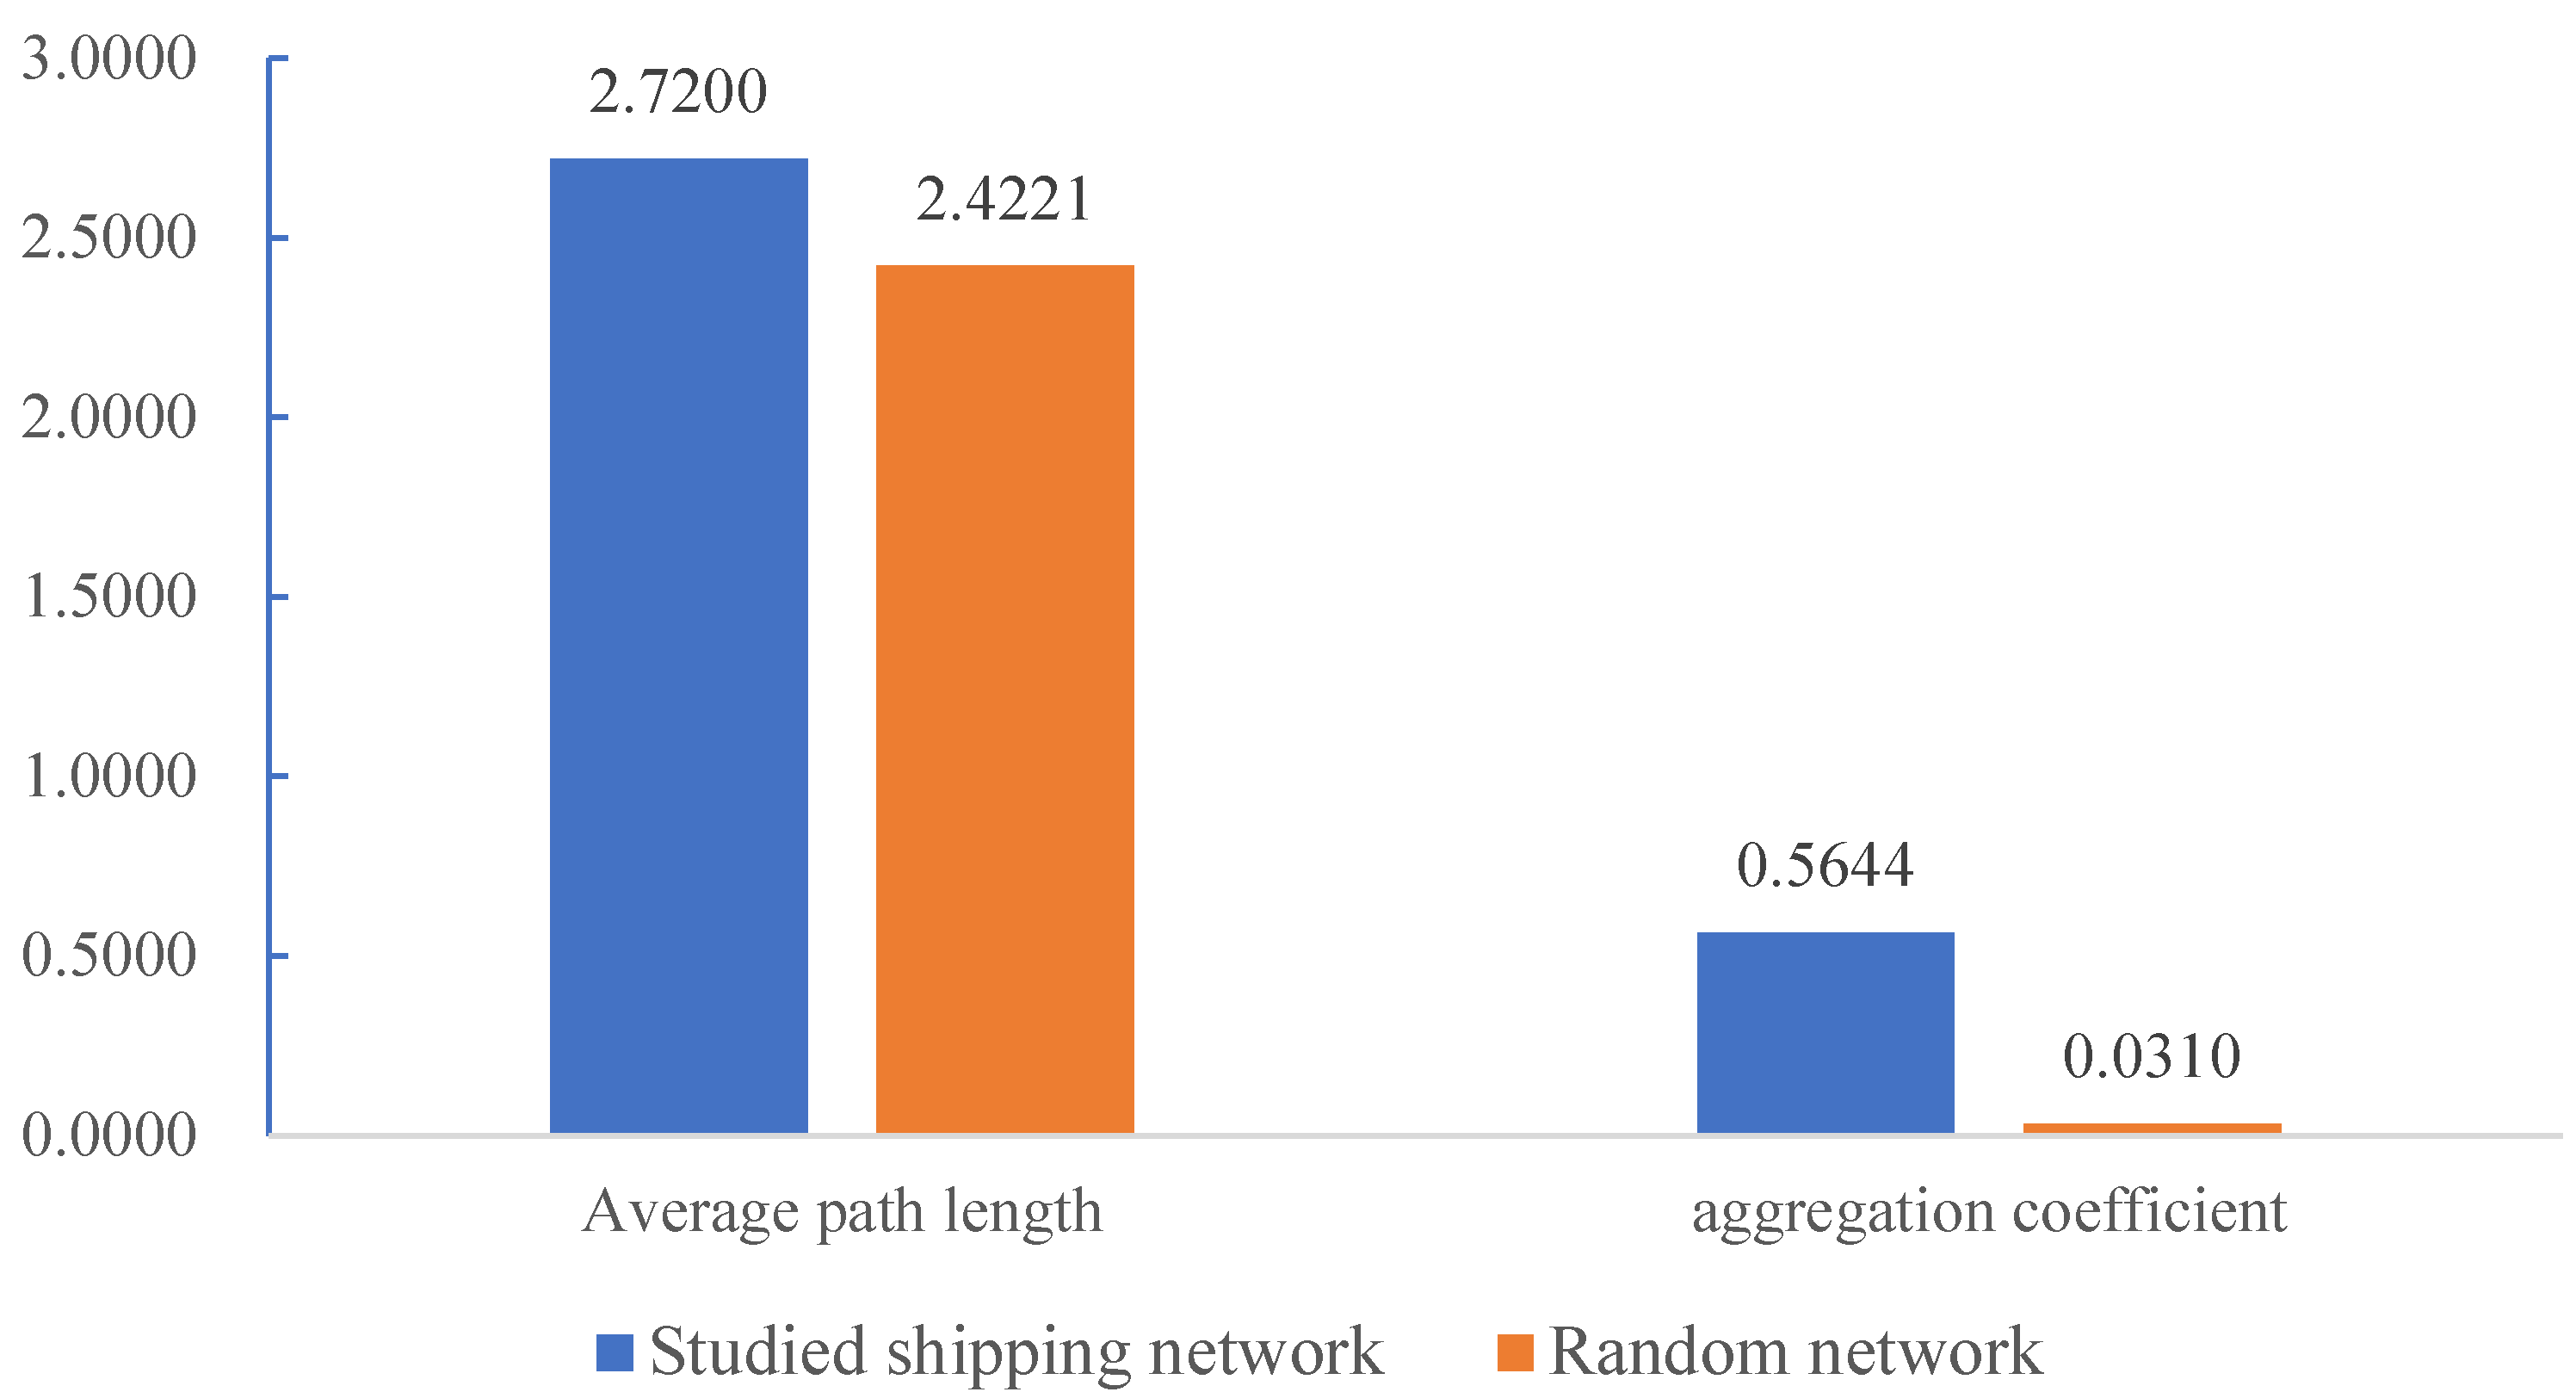
The precondition of the application of the structural hole theory is that the studied shipping network should be a scale-free and small-world network [42], which also works for the use of the RSH method. Figure 1 presents the degree distribution of our studied global container shipping network that was constructed using the Space P model. It is obvious that the degree distribution is a power law, which indicates that the global container shipping network is free of scale [55]. Thus, the global container shipping network can resist random attacks to a great extent but be vulnerable to targeted attacks from hubs with high degrees [56]. Furthermore, Figure 2 shows two measures of the topology (i.e., the average path length and the aggregation coefficient) of our studied global container shipping network and the random network. Although the value of the average path length of the studied shipping network (2.7200) and that of the random network (2.4221) were almost at the same level, the shipping network’s aggregation coefficient (0.5644) was nearly twenty times higher than that of the random network (0.0310), which manifests that the shipping network is significantly clustered with acceptable short paths. In light of Strogatz [56], it can be concluded that the global container shipping network is characterized by a “small world” effect. Therefore, the precondition of the use of the RSH method has been satisfied.
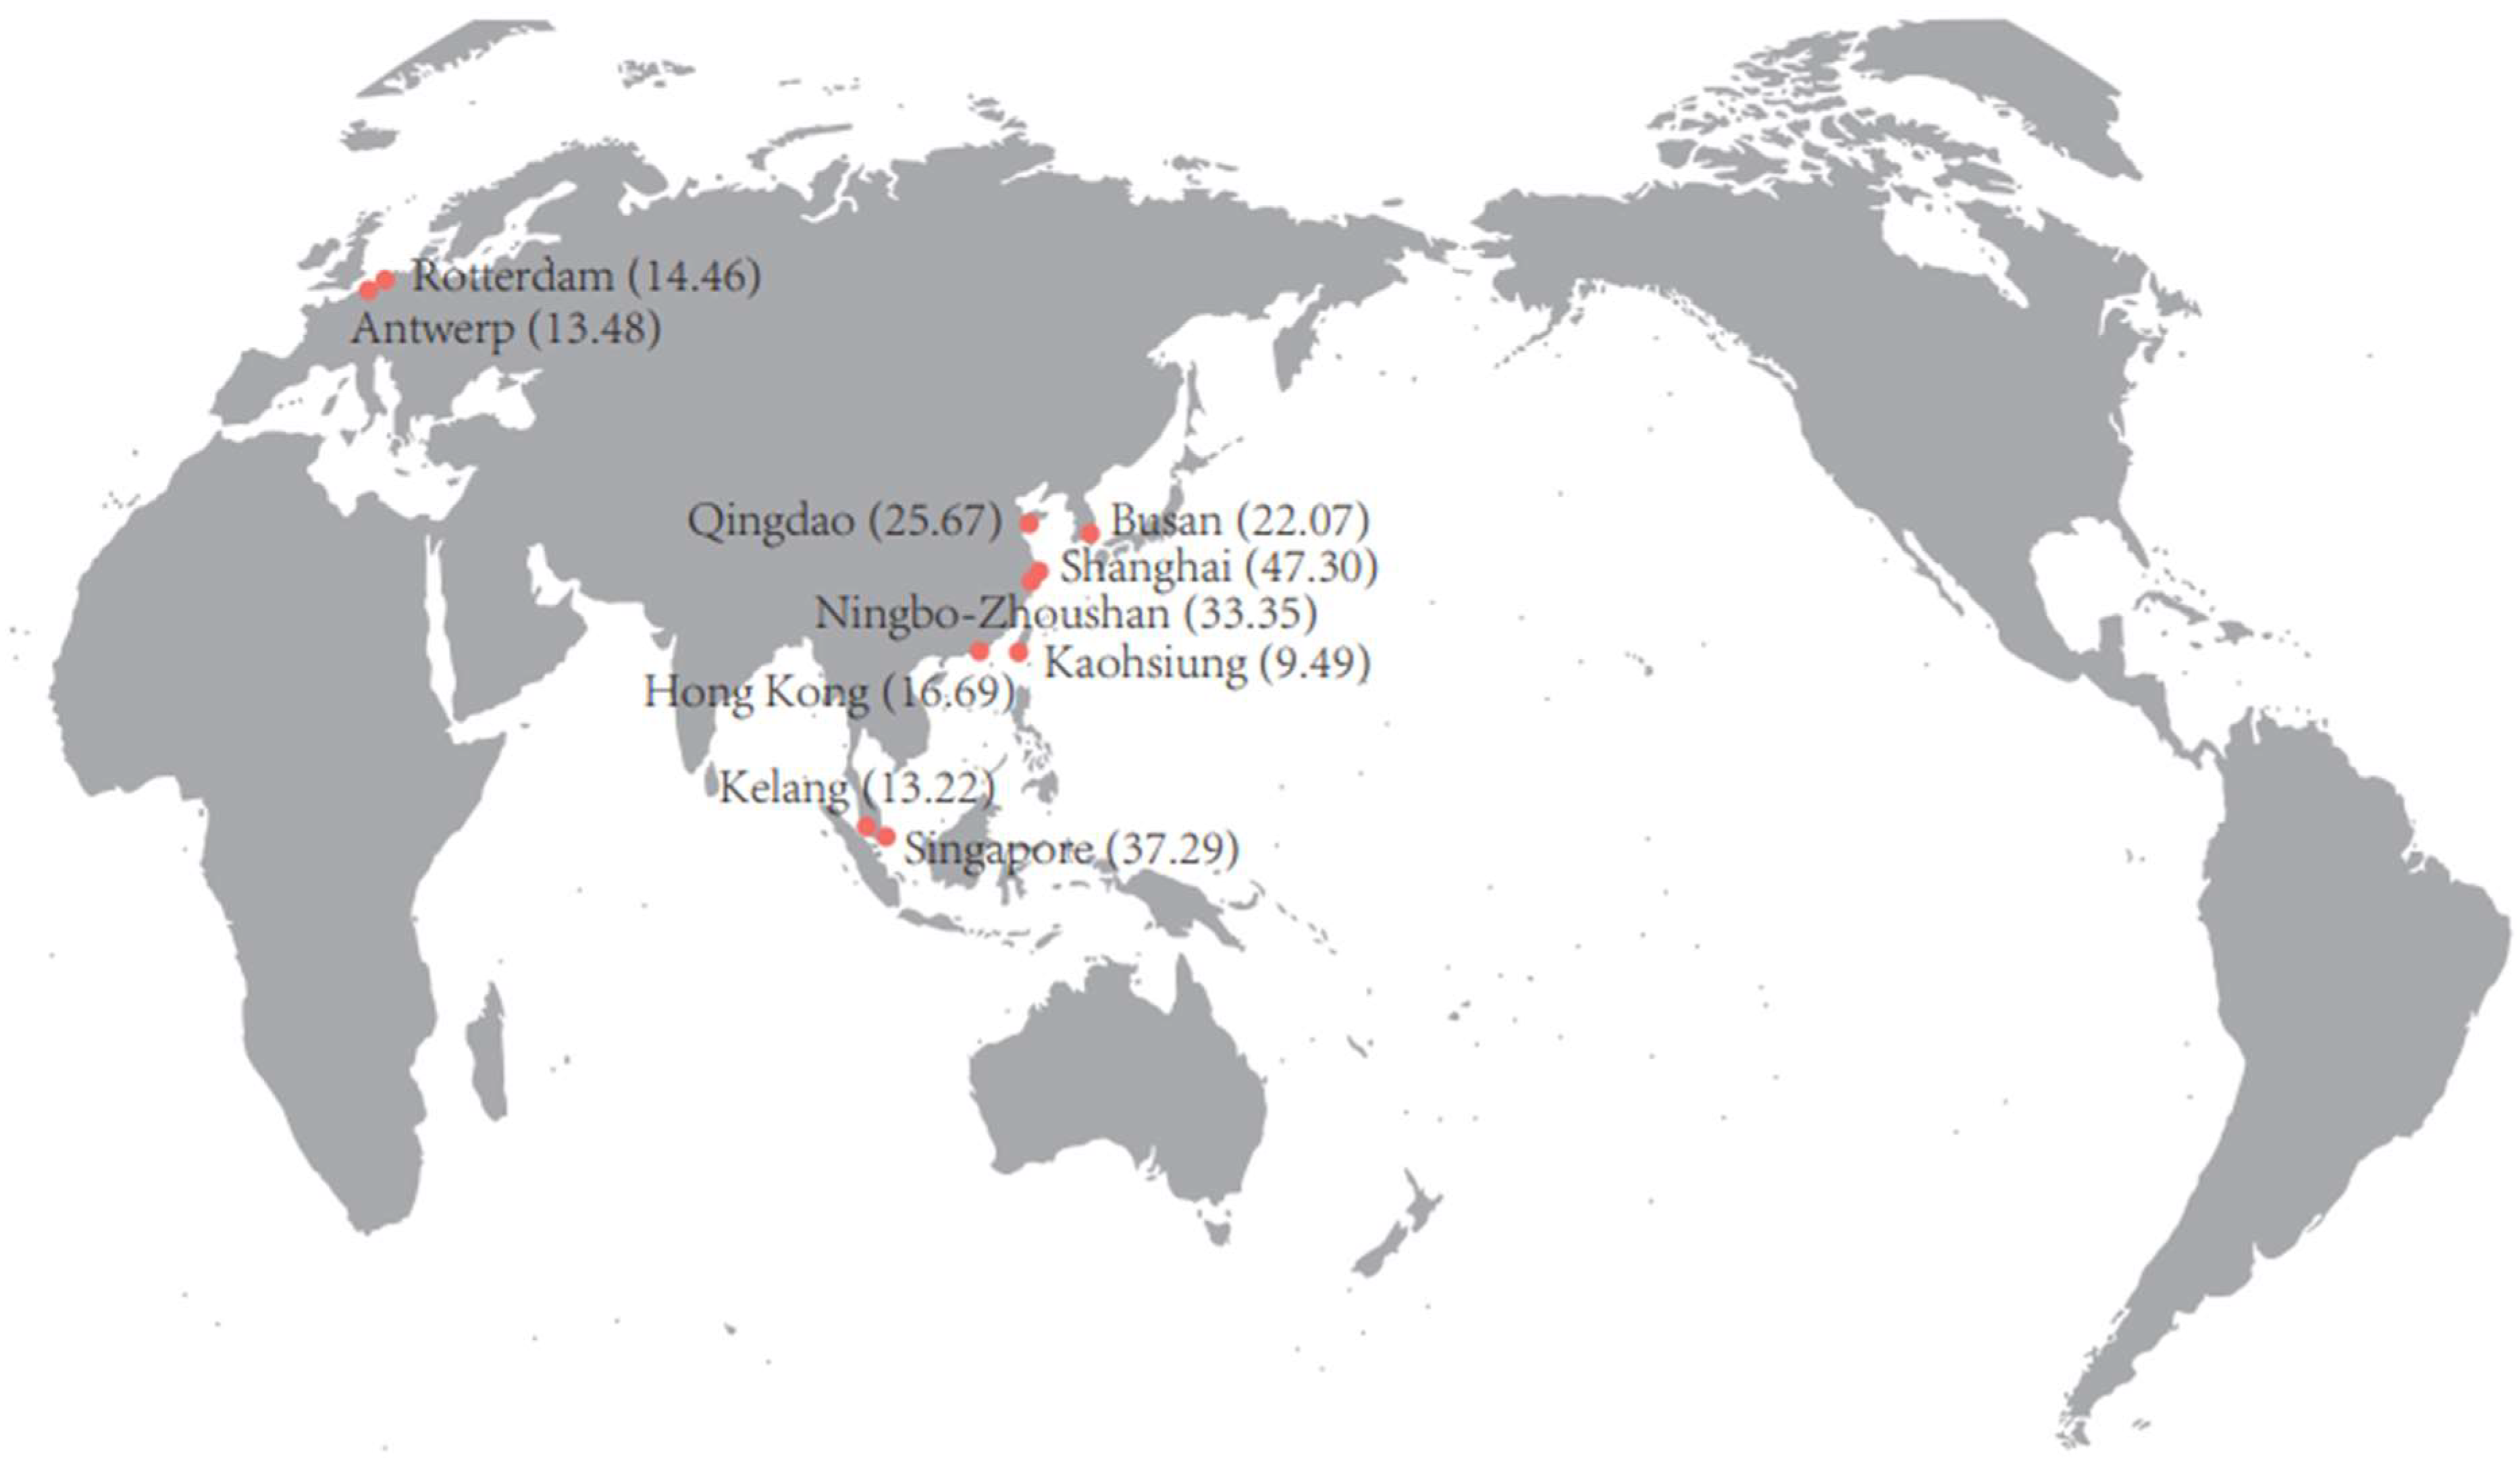
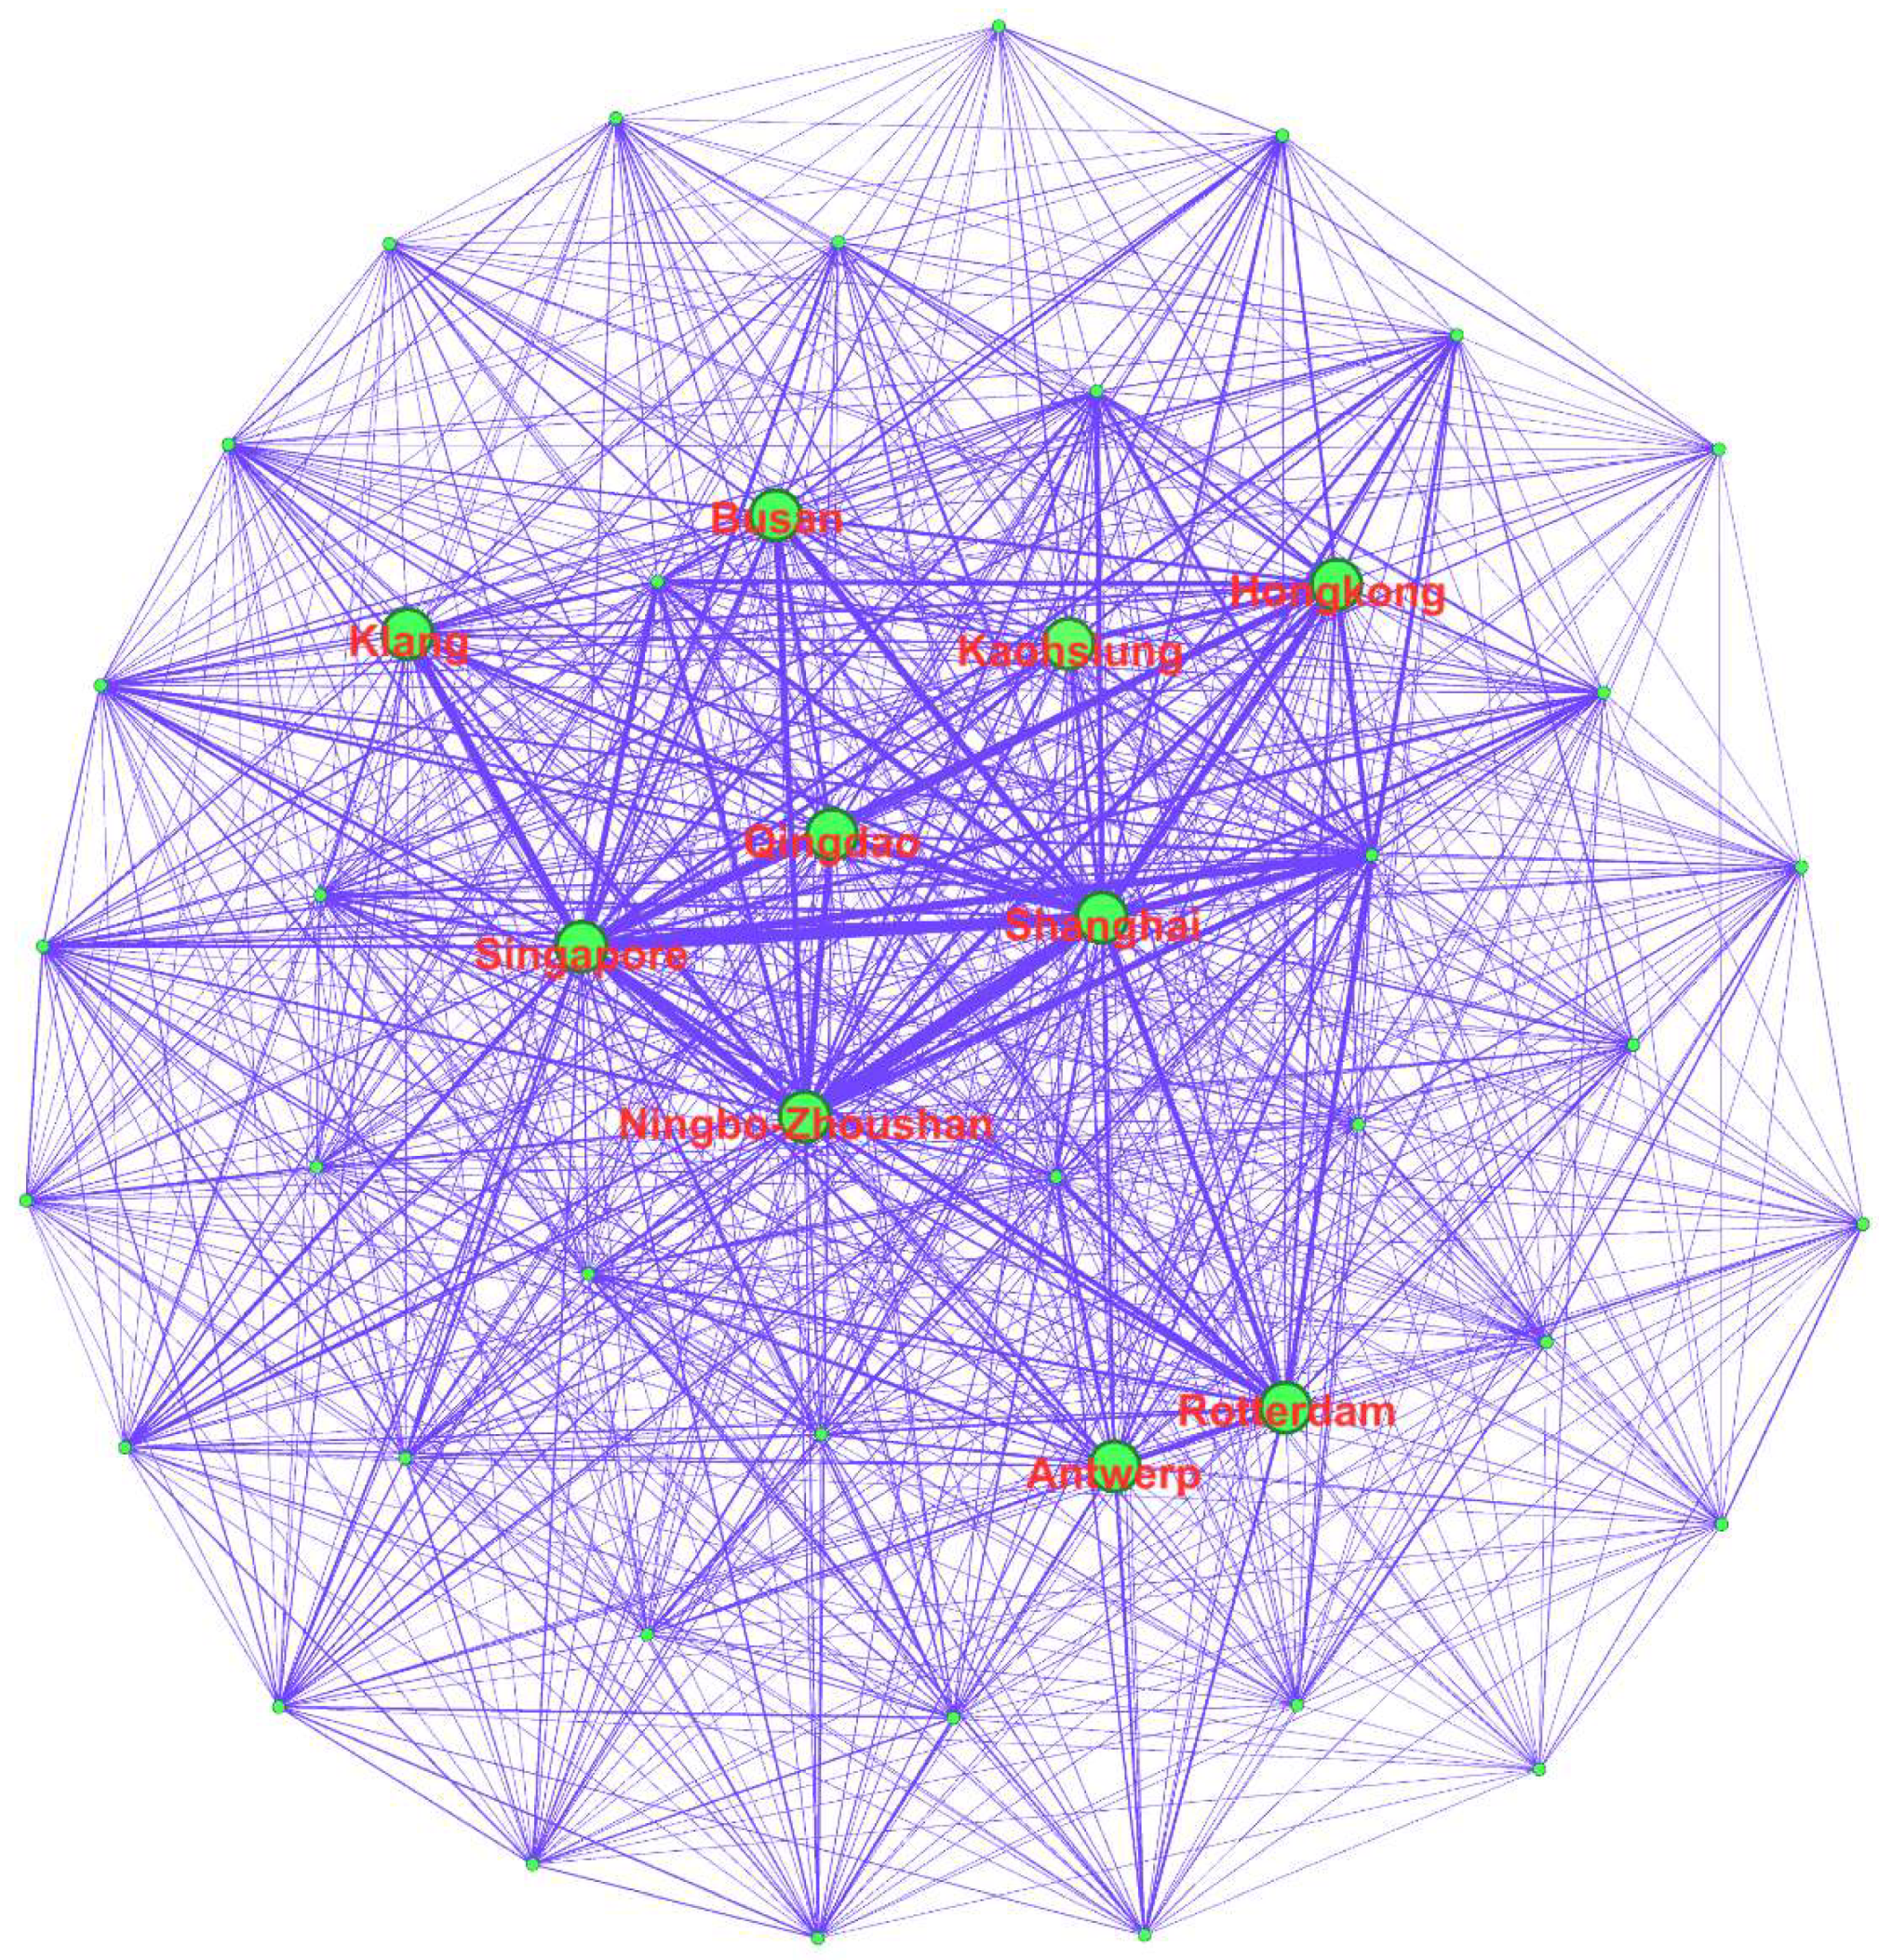
As presented in the methodology section, unlike the traditional structural hole method, the RSH method focuses on the reinforcement effect caused by communities within a network based on connections among nodes, and it aims to detect the nodes occupying positions of reinforced structural holes with the function of bridges among different communities [21]. In this sense, the approach of RSHs is conductive to helping identify transshipment hubs connecting multiple port communities in the global container shipping network. Specifically, the higher RSH value a port scores, the higher the potential the port has to connect different port communities by playing the role of a transshipment hub within a shipping network. Table 2 lists the top 10 ports with the highest RSH values in our studied global container shipping network. In addition, Figure 3 shows these top ports’ geographical locations and their container throughputs in 2022, and Figure 4 presents the topological graph of the studied shipping network, in which the top 10 identified hubs are highlighted.
According to Table 2, it is easy to find that traditionally recognized transshipment hubs with high transshipment incidences, such as Singapore Port, Busan Port, and Hong Kong Port, can be detected using the RSH method. Furthermore, important hybrid ports combining both gateway cargo and transshipment flows, such as Shanghai Port, Rotterdam Port, and Qingdao Port, can also be identified. As mentioned in the introduction section, hybrid ports are emerging as the distinctions between the gateway ports and the transshipment hubs, which are becoming blurred, particularly when the gateway ports are playing greater transshipment roles [57]. Strictly speaking, the identified hybrid ports cannot be categorized as transshipment hubs merely from the perspective of transshipment incidence. However, hybrid ports are laying more emphasis on developing their transshipment business by making full advantage of numerous liner shipping services [17]. Such ports insert themselves in between local and global container flows by providing transshipment services for transshipped containers and direct shipping services for gateway traffic [18]. In terms of maritime connectivity, these hybrid ports actually have sufficient transshipment capabilities for international transit containers. In this sense, hybrid ports can be considered as potential transshipment hubs to a certain extent. Taking Shanghai Port as an example, this port is the world’s best connected port with an average quarterly connectivity rate of 146.625 points in 2022, according to UNCTAD’s port LSCI dataset [58]. In more detail, Shanghai Port provides liner shipping services on over 300 international shipping routes [59]. Depending on the significantly frequent shipping services and numerous routes, Shanghai Port actively expands its transshipment business with the aim of attracting more cargoes from neighboring countries, as, compared to the inland-bound cargo, transshipment cargo flows can be changed to some extent and thus are highly contestable [16]. In 2021, the throughput of international transshipped containers exceeded 6 million TEUs at Shanghai Port with an annual increase of 13.4 percent [60]. Although the proportion of transshipped container throughput to Shanghai Port’s total throughput is not relatively high, the absolute number of transshipment container traffic is considerable.
With regard to geographical locations, the top ten ports identified via the RSH method are concentrated in Asia, particularly in East Asia and Southeast Asia. Specifically, there are five ports (i.e., Shanghai Port, Hong Kong Port, Qingdao Port, Ningbo-Zhoushan Port, and Kaohsiung Port) located in China, one port (i.e., Busan Port) located in South Korea, one port (i.e., Singapore Port) located in Singapore, and one port (i.e., Klang Port) from Malaysia. This is mainly because the past few decades have witnessed the thriving of maritime container transportation in these mentioned Asian regions, which are well known as “Factory Asia” [61]. According to Cheung et al. [62], these Asian ports are central ports in the global container shipping network due to their significant maritime connectivity. In addition to these Asian ports, two European ports (i.e., Rotterdam Port and Antwerp Port) were determined in light of the RSH method. Both Rotterdam Port and Antwerp Port are top connected ports with high maritime connectivity rates [58].

4.2. Maritime Connectivity of Identified Hubs across Different Communities

To verify the robustness of the results on transshipment hubs based on the RSH method, this sub-section aims to illustrate the maritime connectivity of those top identified hubs from the view of port connections among port communities, as significant maritime connectivity is an important precondition for sufficient transshipment capacity. Using the Louvain algorithm, the global container shipping network was divided into nine main separated cohesive port communities, each with over twenty ports. Table 3 shows the port numbers of each community and a number of representative ports within these communities. It is worth mentioning that these port communities, to a great extent, are characterized by distinct regional agglomeration. Among the top 10 hubs that were identified using the RSH method, only Rotterdam Port and Antwerp Port belong to the No. I port community; the remaining eight hubs are all included in the No. II port community.
Regarding the numbers of port communities that have direct shipping routes with the identified hubs, they can generally indicate the maritime connectivity of those hubs across different communities. The majority of hubs have access to all port communities worldwide, and thus these hubs can play intermediary roles between different communities, particularly in the transshipment business. It is important to note that four identified hubs (i.e., Busan Port, Antwerp Port, Kaohsiung Port, and Klang Port) are not connected to all port communities. According to our dataset, Busan Port and Kaohsiung Port do not have direct shipping routes with ports that belong to the No. IX port community, which mainly contains small- and medium-sized ports in Brazil and Argentina. Moreover, Antwerp Port is not connected with the No. VIII port community that is roughly located in the Japanese archipelago, and Klang Port has no direct access to the No. IV port community that mainly includes ports from the Gulf of Mexico and Caribbean region.
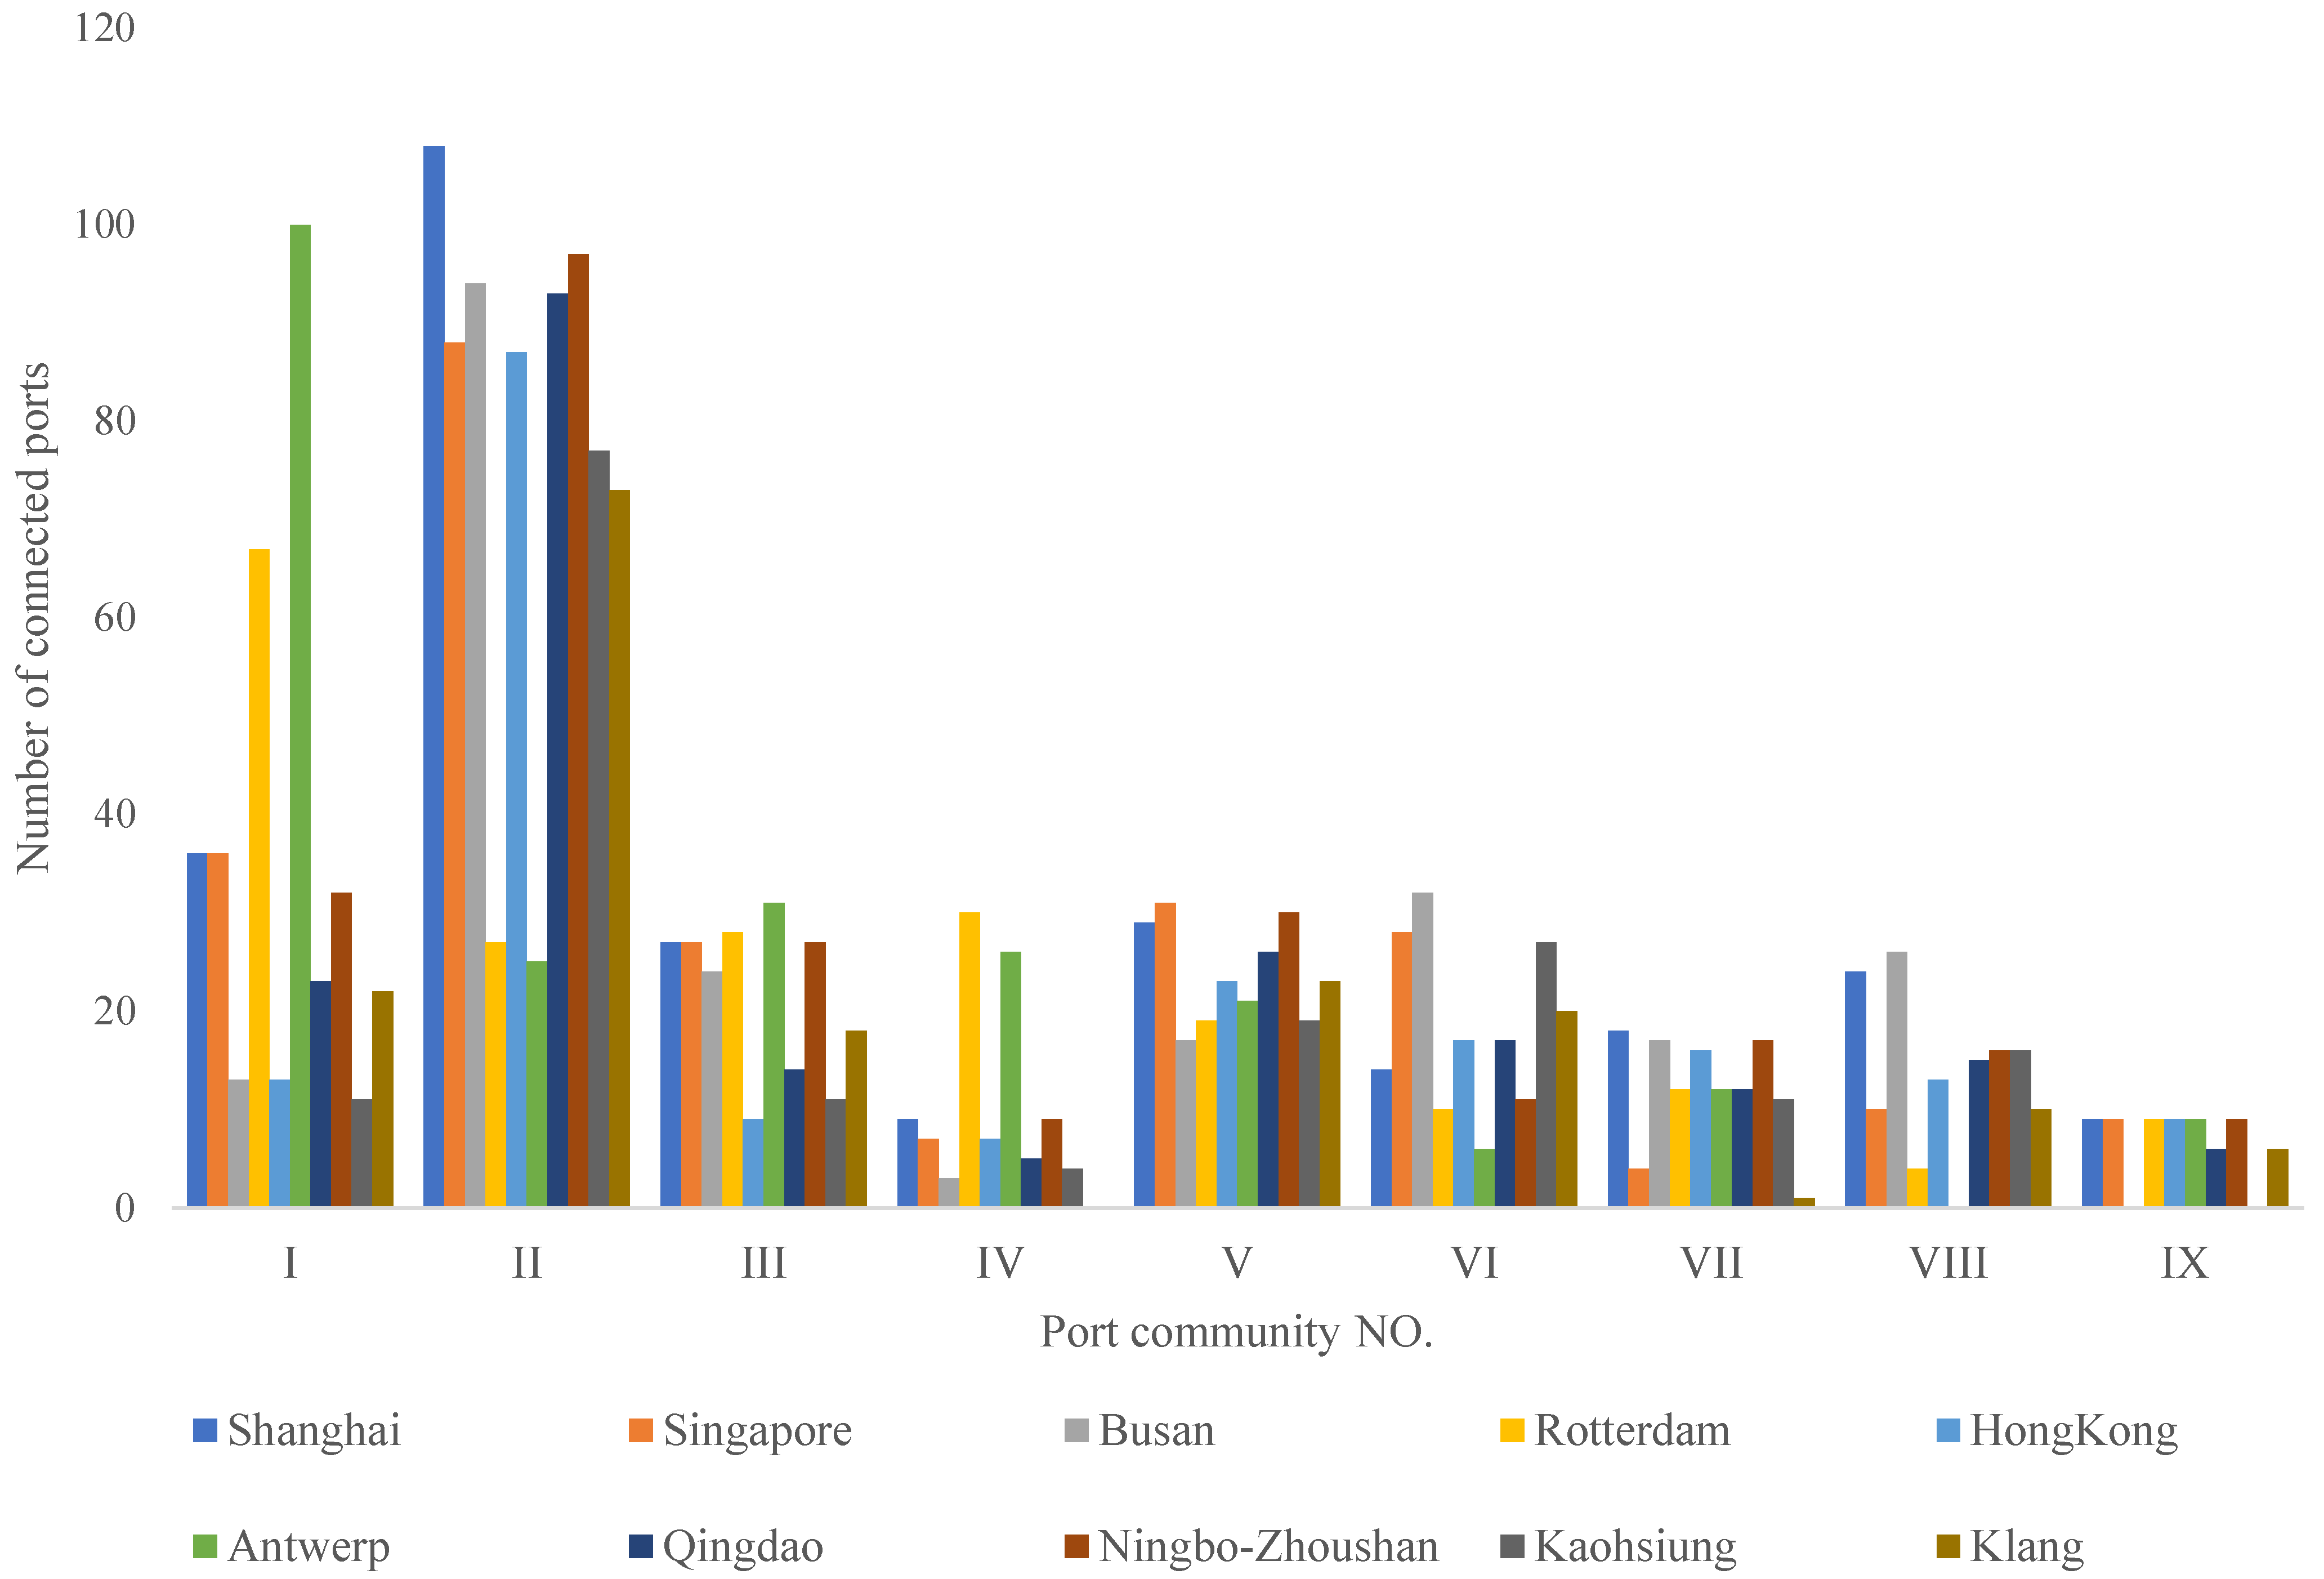
To further manifest the maritime connectivity of the identified hubs, Figure 5 shows the number of connected ports of each hub in different port communities. It is not hard to find that each hub actually has the most connected ports in the port community it belongs to. More specifically, both Rotterdam Port and Antwerp Port have the largest number of connected ports from their own community (i.e., the No. I port community). Similarly, the other eight hubs, as the members of the No. II port community, have the most connections with ports from this community. This is easy to understand, as the port community itself is characterized by the cohesiveness and well connectivity among internal ports [7]. Regarding the quantitative distribution of connected ports across different communities, for the hubs categorized in the same port communities, the distributions of their connected ports are basically consistent with each other. In general, the higher ranked hubs, with higher RSH values, have better maritime connections with ports from various communities. What should be further mentioned is that Figure 5 does not take the weekly capacities deployed in the shipping services into the consideration; therefore, it can only roughly mirror the maritime connectivity from the view of the absolute number of connected ports. Comparatively, the RSH method has fully considered the weekly capacities deployed in the shipping routes.

5. Discussion: Implications for Policy Makers

Transshipment hubs are key components of the global container shipping network due to their important roles as intermediaries [12]. Unlike regional transshipment ports, transshipment hubs not only serve feeder ports in regional port communities, but also provide transshipment services in long-haul, main-line transportation across various port communities [3]. Traditionally, a transshipment hub is determined in light of its transshipment incidence, namely the proportion of transshipment containers in the annual total container throughput of that port [16]. However, with the development of hybrid ports that can handle both gateway cargo and transshipment flows, depending on their significant maritime connectivity, it becomes necessary to identify transshipment hubs by fully taking those hybrid ports as potential transshipment ports with sufficient transshipment capabilities into consideration. In this paper, a number of transshipment hubs holding the positions of reinforced structural holes by connecting various port communities have been identified in light of the RSH method. According to the results of our analysis, the following policy implications can be drawn for decision makers.
First of all, due to the fact that separated cohesive port communities exist in the global container shipping network [7], the ports playing the function of brokerage across port communities have the advantages of being able to develop their transshipment business due to their good maritime connectivity. Since transshipment can bring many beneficial outcomes to ports, such as traffic consolidation, scale economies, and rationalization of shipping routes [12], both traditional transshipment ports with high transshipment incidences and emerging hybrid ports as potential hubs with sufficient transshipment capabilities should take measures to enhance and improve their transshipment businesses. Notably, hybrid ports with significant maritime connectivity should make full use of their advantages in numerous shipping routes and optimize their business processes for transshipment with the aim of improving their transshipment efficiency.
Secondly, as liner companies are operators of shipping routes among ports and port communities, to improve business competitiveness, they have real needs to expand their service networks and rationalize their shipping routes. In this sense, liner companies should reasonably deploy shipping capacities in transshipment hubs by not only considering the links between the hubs and the regional feeder ports, but also taking into account the connections among hubs from different port communities. Therefore, priorities should be given to the top transshipment hubs identified by the liner companies as these hubs have superior maritime connectivity within and across the port communities.
Finally, for international port operators, it is very important to invest in appropriate port projects worldwide with development potential [63]. Generally speaking, investing in transshipment hubs is a good choice for investors due to their high container throughput, which, to a great extent, ensures considerable investment returns. Thus, the top transshipment hubs that were identified via the RSH method in this paper can be potential investment targets for those global port operators. According to the geographical locations of the identified transshipment hubs, East Asia and Southeast Asia are still valuable areas for port investments.

6. Conclusions

This paper has introduced the RSH method, the development of the structural hole theory, from the sociology to identify global transshipment hubs occupying positions of reinforced structural holes with the function of bridges across various port communities. The research results indicate that the RSH method can not only detect traditional transshipment hubs with high transshipment incidences (e.g., Singapore Port, Busan Port, and Hong Kong Port), but also identify hybrid ports (e.g., Shanghai Port, Rotterdam Port, and Qingdao Port) characterized by significant maritime connectivity with sufficient transshipment capabilities. Geographically, the top ten ports that were identified via the RSH method are concentrated in Asia, particularly in East Asia and Southeast Asia. To demonstrate the robustness of the empirical results of the RSH method, the current study showed that the global container shipping network can be divided into nine main separated cohesive port communities, and these port communities are characterized by distinct regional agglomeration. In general, the majority of the identified hubs have access to all port communities worldwide, and these hubs play intermediary roles across different communities. From the perspective of maritime connectivity, the higher ranked hubs with higher RSH values generally have better maritime connections with ports from various communities.
Regarding the future research, two research directions are worth to investigate. Firstly, a systematic review should be conducted to sort out the main existing methods that are used to study the shipping networks. It is very useful to summarize the advantages and disadvantages of those methods, and a comprehensive approach needs to be developed to effectively synthesize the advantages of these existing methods if possible. Second, more emerging complex network methods can be introduced into the research of shipping networks. For example, the K-core method can be adopted to categorize the nodes into different layers of different importance [64], which differs in the methods of centrality or structural holes that focus on the network itself. By doing so, we can gain a deeper understanding of the characteristics underlying these shipping networks.

Author Contributions

Conceptualization, Q.Z. and M.Y.; methodology, S.P.; software, S.P.; validation, Q.Z. and M.Y.; formal analysis, Q.Z.; investigation, Q.Z. and S.P.; data curation, S.P.; writing—original draft preparation, Q.Z.; writing—review and editing, M.Y.; supervision, M.Y.; project administration, M.Y.; funding acquisition, Q.Z. All authors have read and agreed to the published version of the manuscript.

Funding

This research was funded by the Chinese National Natural Foundation Project (42001114) and the Chinese Ministry of Education (MOE) Project of Humanities and Social Sciences (22YJA630013).

Institutional Review Board Statement

Not applicable.

Informed Consent Statement

Not applicable.

Data Availability Statement

Not applicable.

Acknowledgments

We would like to thank the editors and anonymous reviewers for their constructive comments.

Conflicts of Interest

The authors declare no conflict of interest.

References

  1. Ducruet, C.; Notteboom, T. The worldwide maritime network of container shipping: Spatial structure and regional dynamics. Glob. Netw. 2012, 12, 395–423. [Google Scholar]
  2. Li, Z.; Xu, M.; Shi, Y. Centrality in global shipping network basing on worldwide shipping areas. GeoJournal 2015, 80, 47–60. [Google Scholar]
  3. Zhang, Q.; Pu, S.H.; Luo, L.H.; Liu, Z.C.; Xu, J. Revisiting important ports in container shipping networks: A structural hole-based approach. Transp. Policy 2022, 126, 239–248. [Google Scholar]
  4. Dai, W.L.; Fu, X.W.; Yip, T.L.; Hu, H.; Wang, K. Emission charge and liner shipping network configuration—An economic investigation of the Asia-Europe route. Transp. Res. Part A Policy Pract. 2018, 110, 291–305. [Google Scholar]
  5. Kaluza, P.; Kolzsch, A.; Gastner, M.T.; Blasius, B. The complex network of global cargo ship movements. J. R. Soc. Interface 2010, 7, 1093–1103. [Google Scholar]
  6. Liu, C.L.; Wang, J.Q.; Zhang, H. Spatial heterogeneity of ports in the global maritime network detected by weighted ego network analysis. Marit. Policy Manag. 2018, 45, 89–104. [Google Scholar]
  7. Pan, J.J.; Bell, M.G.H.; Cheung, K.F.; Perera, S.; Yu, H. Connectivity analysis of the global shipping network by eigenvalue decomposition. Marit. Policy Manag. 2019, 46, 957–966. [Google Scholar]
  8. Girvan, M.; Newman, M.E.J. Community Structure in Social and Biological Networks. Proc. Natl. Acad. Sci. USA 2002, 99, 7821–7826. [Google Scholar]
  9. Tagawa, H.; Kawasaki, T.; Hanaoka, S. Evaluation of international maritime network configuration and impact of port cooperation on port hierarchy. Transp. Policy 2022, 123, 14–24. [Google Scholar]
  10. Ducruet, C.; Zaidi, F. Maritime constellations: A complex network approach to shipping and ports. Marit. Policy Manag. 2012, 39, 151–168. [Google Scholar]
  11. Zheng, J.F.; Qi, J.W.; Sun, Z.; Li, F. Community structure based global hub location problem in liner shipping. Transp. Res. Part E 2018, 118, 1–19. [Google Scholar]
  12. Rodrigue, J.P.; Ashar, A. Transshipment hubs in the New Panamax Era: The role of the Caribbean. J. Transp. Geogr. 2016, 51, 270–279. [Google Scholar]
  13. Corey, J.; Wang, Q.; Zheng, J.F.; Sun, Y.L.; Du, H.M.; Zhu, Z.H. Container transshipment via a regional hub port: A case of the Caribbean Sea region. Ocean Coast. Manag. 2022, 217, 105999. [Google Scholar]
  14. Liu, T.; Wang, H.Y. Evaluating the Service Capacity of Port-Centric Intermodal Transshipment Hub. J. Mar. Sci. Eng. 2023, 11, 1403. [Google Scholar]
  15. McCalla, R.J. Container transshipment at Kingston, Jamaica. J. Transp. Geogr. 2008, 16, 182–190. [Google Scholar]
  16. Notteboom, T.; Parola, F.; Satta, G. The relationship between transhipment incidence and throughput volatility in North European and Mediterranean container ports. J. Transp. Geogr. 2019, 74, 371–381. [Google Scholar]
  17. Wilmsmeier, G.; Monios, J.; Pérez-Salas, G. Port system evolution—The case of Latin America and the Caribbean. J. Transp. Geogr. 2014, 39, 208–221. [Google Scholar]
  18. Monios, J.; Wilmsmeier, G.; Adolf, K.Y.N. Port system evolution—The emergence of second-tier hubs. Marit. Policy Manag. 2019, 46, 61–73. [Google Scholar]
  19. Wang, Y.H.; Cullinane, K. Determinants of port centrality in maritime container transportation. Transp. Res. Part E Logist. Transp. Rev. 2016, 95, 326–340. [Google Scholar]
  20. Wan, C.; Zhao, Y.; Zhang, D.; Yip, T.L. Identifying important ports in maritime container shipping networks along the Maritime Silk Road. Ocean Coast. Manag. 2021, 211, 105738. [Google Scholar]
  21. Burt, R.S. Reinforced structural holes. Soc. Netw. 2015, 43, 149–161. [Google Scholar]
  22. De Meo, P.; Ferrara, E.; Fiumara, G.; Provetti, A. Generalized Louvain method for community detection in large networks. In Proceedings of the 11th International Conference on Intelligent Systems Design and Applications, Córdoba, Spain, 22–24 November 2011; pp. 88–93. [Google Scholar]
  23. Wang, L.H.; Zhu, Y.; Ducruet, C.; Bunel, M.; Lau, Y.Y. From hierarchy to networking: The evolution of the “twenty-first-century Maritime Silk Road” container shipping system. Transp. Rev. 2018, 38, 416–435. [Google Scholar]
  24. Kavirathna, C.A.; Kawasaki, T.; Hanaoka, S. Transshipment Hub Port Competitiveness of the Port of Colombo against the Major Southeast Asian Hub Ports. Asian J. Shipp. Logist. 2018, 34, 071–082. [Google Scholar]
  25. Jin, J.G.; Meng, Q.; Wang, H. Feeder vessel routing and transshipment coordination at a congested hub port. Transp. Res. Part B 2021, 151, 1–21. [Google Scholar]
  26. Chen, G.; Cheung, W.M.; Chu, S.C.; Xu, L. Transshipment hub selection from a shipper’s and freight forwarder’s perspective. Expert Syst. Appl. 2017, 83, 396–404. [Google Scholar]
  27. Cullinane, K.; Yap, W.Y.; Lam, J.S.L. The port of Singapore and its governance structure. Res. Transp. Econ. 2007, 17, 285–310. [Google Scholar]
  28. Wong, W.H.; Wong, E.; Mo, D.; Leung, L. Impact of cabotage relaxation in mainland China on the transshipment hub of Hong Kong. Marit. Econ. Logist. 2019, 21, 464–481. [Google Scholar]
  29. Tan, A.W.K.; Hilmola, O.P. Future of transshipment in Singapore. Ind. Manag. Data Syst. 2012, 112, 1085–1100. [Google Scholar]
  30. Fan, G.H.; Xie, X.K.; Chen, J.H.; Zheng, W.; Yu, M.Z.; Shi, J. Has China’s Free Trade Zone policy expedited port production and development? Mar. Policy 2022, 137, 104951. [Google Scholar]
  31. Wilmsmeier, G.; Hoffmann, J.; Sanchez, R.J. The impact of port characteristics on international maritime transport costs. Res. Transp. Econ. 2006, 16, 117–140. [Google Scholar]
  32. Parola, F.; Risitano, M.; Ferretti, M.; Panetti, E. The drivers of port competitiveness: A critical review. Transp. Rev. 2017, 37, 116–138. [Google Scholar]
  33. Rumaji; Adiliya, A. Port maritime connectivity in South-East Indonesia: A new strategic positioning for transshipment port of Tenau Kupang. Asian J. Shipp. Logist. 2019, 35, 172–180. [Google Scholar]
  34. Wang, Y.; Yeo, G.T. Transshipment hub port selection for shipping carriers in a dual hub-port system. Marit. Policy Manag. 2019, 46, 701–714. [Google Scholar]
  35. Tovar, B.; Wall, A. The relationship between port-level maritime connectivity and efficiency. J. Transp. Geogr. 2022, 98, 103213. [Google Scholar]
  36. Guerrero, D.; Nierat, P.; Thill, J.C. Visualizing maritime connectivity at national level: The case of LSBCI links of West European countries. Case Stud. Transp. Policy 2021, 9, 1818–1824. [Google Scholar]
  37. Ducruet, C.; Rozenblat, C.; Zaidi, F. Ports in multi-level maritime networks: Evidence from the Atlantic (1996–2006). J. Transp. Geogr. 2010, 18, 508–518. [Google Scholar]
  38. Wang, Y.H.; Cullinane, K. Traffic consolidation in East Asian container ports: A network flow analysis. Transp. Res. Part A Policy Pract. 2014, 61, 152–163. [Google Scholar]
  39. Wen, T.; Gao, Q.; Chen, Y.W.; Cheong, K.H. Exploring the vulnerability of transportation networks by entropy: A case study of Asia-Europe maritime transportation network. Reliab. Eng. Syst. Saf. 2022, 226, 108578. [Google Scholar]
  40. Freeman, L.C. Centrality in social networks conceptual clarification. Soc. Netw. 1979, 1, 215–239. [Google Scholar]
  41. Opsahl, T.; Agneessens, F.; Skvoretz, J. Node centrality in weighted networks: Generalizing degree and shortest paths. Soc. Netw. 2010, 32, 245–251. [Google Scholar]
  42. Zhang, X.; Zhang, W.; Lee, P.T.W. Importance rankings of nodes in the China Railway Express network under the Belt and Road Initiative. Transp. Res. Part A Policy Pract. 2020, 139, 134–147. [Google Scholar] [PubMed]
  43. Guedes, A.; Rebelo, J. River cruise holiday packages: A network analysis combined with a geographic information system framework. Tour. Manag. Perspect. 2021, 37, 100779. [Google Scholar]
  44. Burt, R.S. Structural Holes: The Social Structure of Competition; Harvard University Press: Cambridge, MA, USA, 1992. [Google Scholar]
  45. Hansen, D.L.; Shneiderman, B.; Smith, M.A.; Himeboim, I. Analyzing Social Media Networks with NodeXL: Insights from a Nonnected World, 2nd ed.; Morgan Kaufmann: Cambridge, MA, USA, 2020. [Google Scholar]
  46. Burt, R.S. Structural holes and good ideas. Am. J. Sociol. 2004, 110, 349–399. [Google Scholar]
  47. Burt, R.S.; Kilduff, M.; Tasselli, S. Social network analysis: Foundations and frontiers on advantage. Annu. Rev. Psychol. 2013, 64, 527–547. [Google Scholar]
  48. Lin, Z.; Zhang, Y.; Gong, Q.; Oksanen, A.; Ding, Y.A. Structural hole theory in social network analysis: A review. IEEE Trans. Comput. Soc. Syst. 2022, 9, 724–739. [Google Scholar]
  49. Burchard, J.; Cornwell, B. Structural holes and bridging in two-mode networks. Soc. Netw. 2018, 55, 11–20. [Google Scholar]
  50. Wang, P.; Deng, X.D.; Liu, Y.; Guo, L.; Zhu, J.; Fu, L.; Xie, Y.; Li, W.; Lai, J. A Knowledge Discovery Method for Landslide Monitoring Based on K-Core Decomposition and the Louvain Algorithm. ISPRS Int. J. Geo-Inf. 2022, 11, 217. [Google Scholar]
  51. Li, S.Y.; Song, W.B.; Zhao, C.; Zhang, Y.F.; Shen, W.M.; Hai, J.; Lu, J.W.; Xie, Y.S. An Anomaly Detection Method for Multiple Time Series Based on Similarity Measurement and Louvain Algorithm. Procedia Comput. Sci. 2022, 200, 1857–1866. [Google Scholar]
  52. Qin, J.D.; Li, M.X.; Liang, Y.Y. Minimum cost consensus model for CRP-driven preference optimization analysis in large-scale group decision making using Louvain algorithm. Inf. Fusion 2022, 80, 121–136. [Google Scholar]
  53. Xie, X.P.; Zhang, Y.; Zhang, C. Research on the division of container shipping network community based on Louvain Algorithm. Sci. J. Intell. Syst. Res. 2021, 3, 136–145. [Google Scholar]
  54. Hu, Y.H.; Zhu, D.L. Empirical analysis of the worldwide maritime transportation network. Physica A 2009, 388, 2061–2071. [Google Scholar]
  55. Barabási, A.L.; Albert, R. Emergence of scaling in random networks. Science 1999, 286, 509–512. [Google Scholar] [PubMed] [Green Version]
  56. Strogatz, S.H. Exploring complex networks. Nature 2001, 410, 268–276. [Google Scholar] [PubMed] [Green Version]
  57. Gouvernal, E.; Debrie, J.; Slack, B. Dynamics of change in the port system of the western Mediterranean. Marit. Policy Manag. 2005, 32, 107–121. [Google Scholar]
  58. UNCTAD. Port Liner Shipping Connectivity Index, Quarterly. 2023. Available online: https://unctadstat.unctad.org/wds/TableViewer/tableView.aspx (accessed on 18 April 2023).
  59. Xinhua Net. Shanghai Port Has over 300 International Shipping Routes with Connectivity Ranking First in the World. Available online: https://baijiahao.baidu.com/s?id=1725062391968398789&wfr=spider&for=pc (accessed on 18 April 2023).
  60. China Daily. Shanghai Port Continues to Rank First in Container Throughput Worldwide. 2022. Available online: http://www.chinadaily.com.cn/a/202201/04/WS61d39e9da310cdd39bc7edb2.html (accessed on 18 April 2023).
  61. Wang, L.H.; Lau, Y.Y.; Su, H.; Zhu, Y.; Kanrak, M. Dynamics of the Asian shipping network in adjacent ports: Comparative case studies of Shanghai-Ningbo and Hong Kong-Shenzhen. Ocean Coast. Manag. 2022, 221, 106127. [Google Scholar]
  62. Cheung, K.F.; Bell, M.G.H.; Pan, J.J.; Perera, S. An eigenvector centrality analysis of world container shipping network connectivity. Transp. Res. Part E 2020, 140, 101991. [Google Scholar]
  63. Yang, D.; Li, L.; Notteboom, T.E. Chinese investment in overseas container terminals: The role of investor attributes in achieving a higher port competitiveness. Transp. Policy 2022, 118, 112–122. [Google Scholar]
  64. Eidsaa, M.; Almaas, E. Investigating the relationship between k-core and s-core network decompositions. Phys. A 2016, 449, 111–125. [Google Scholar]
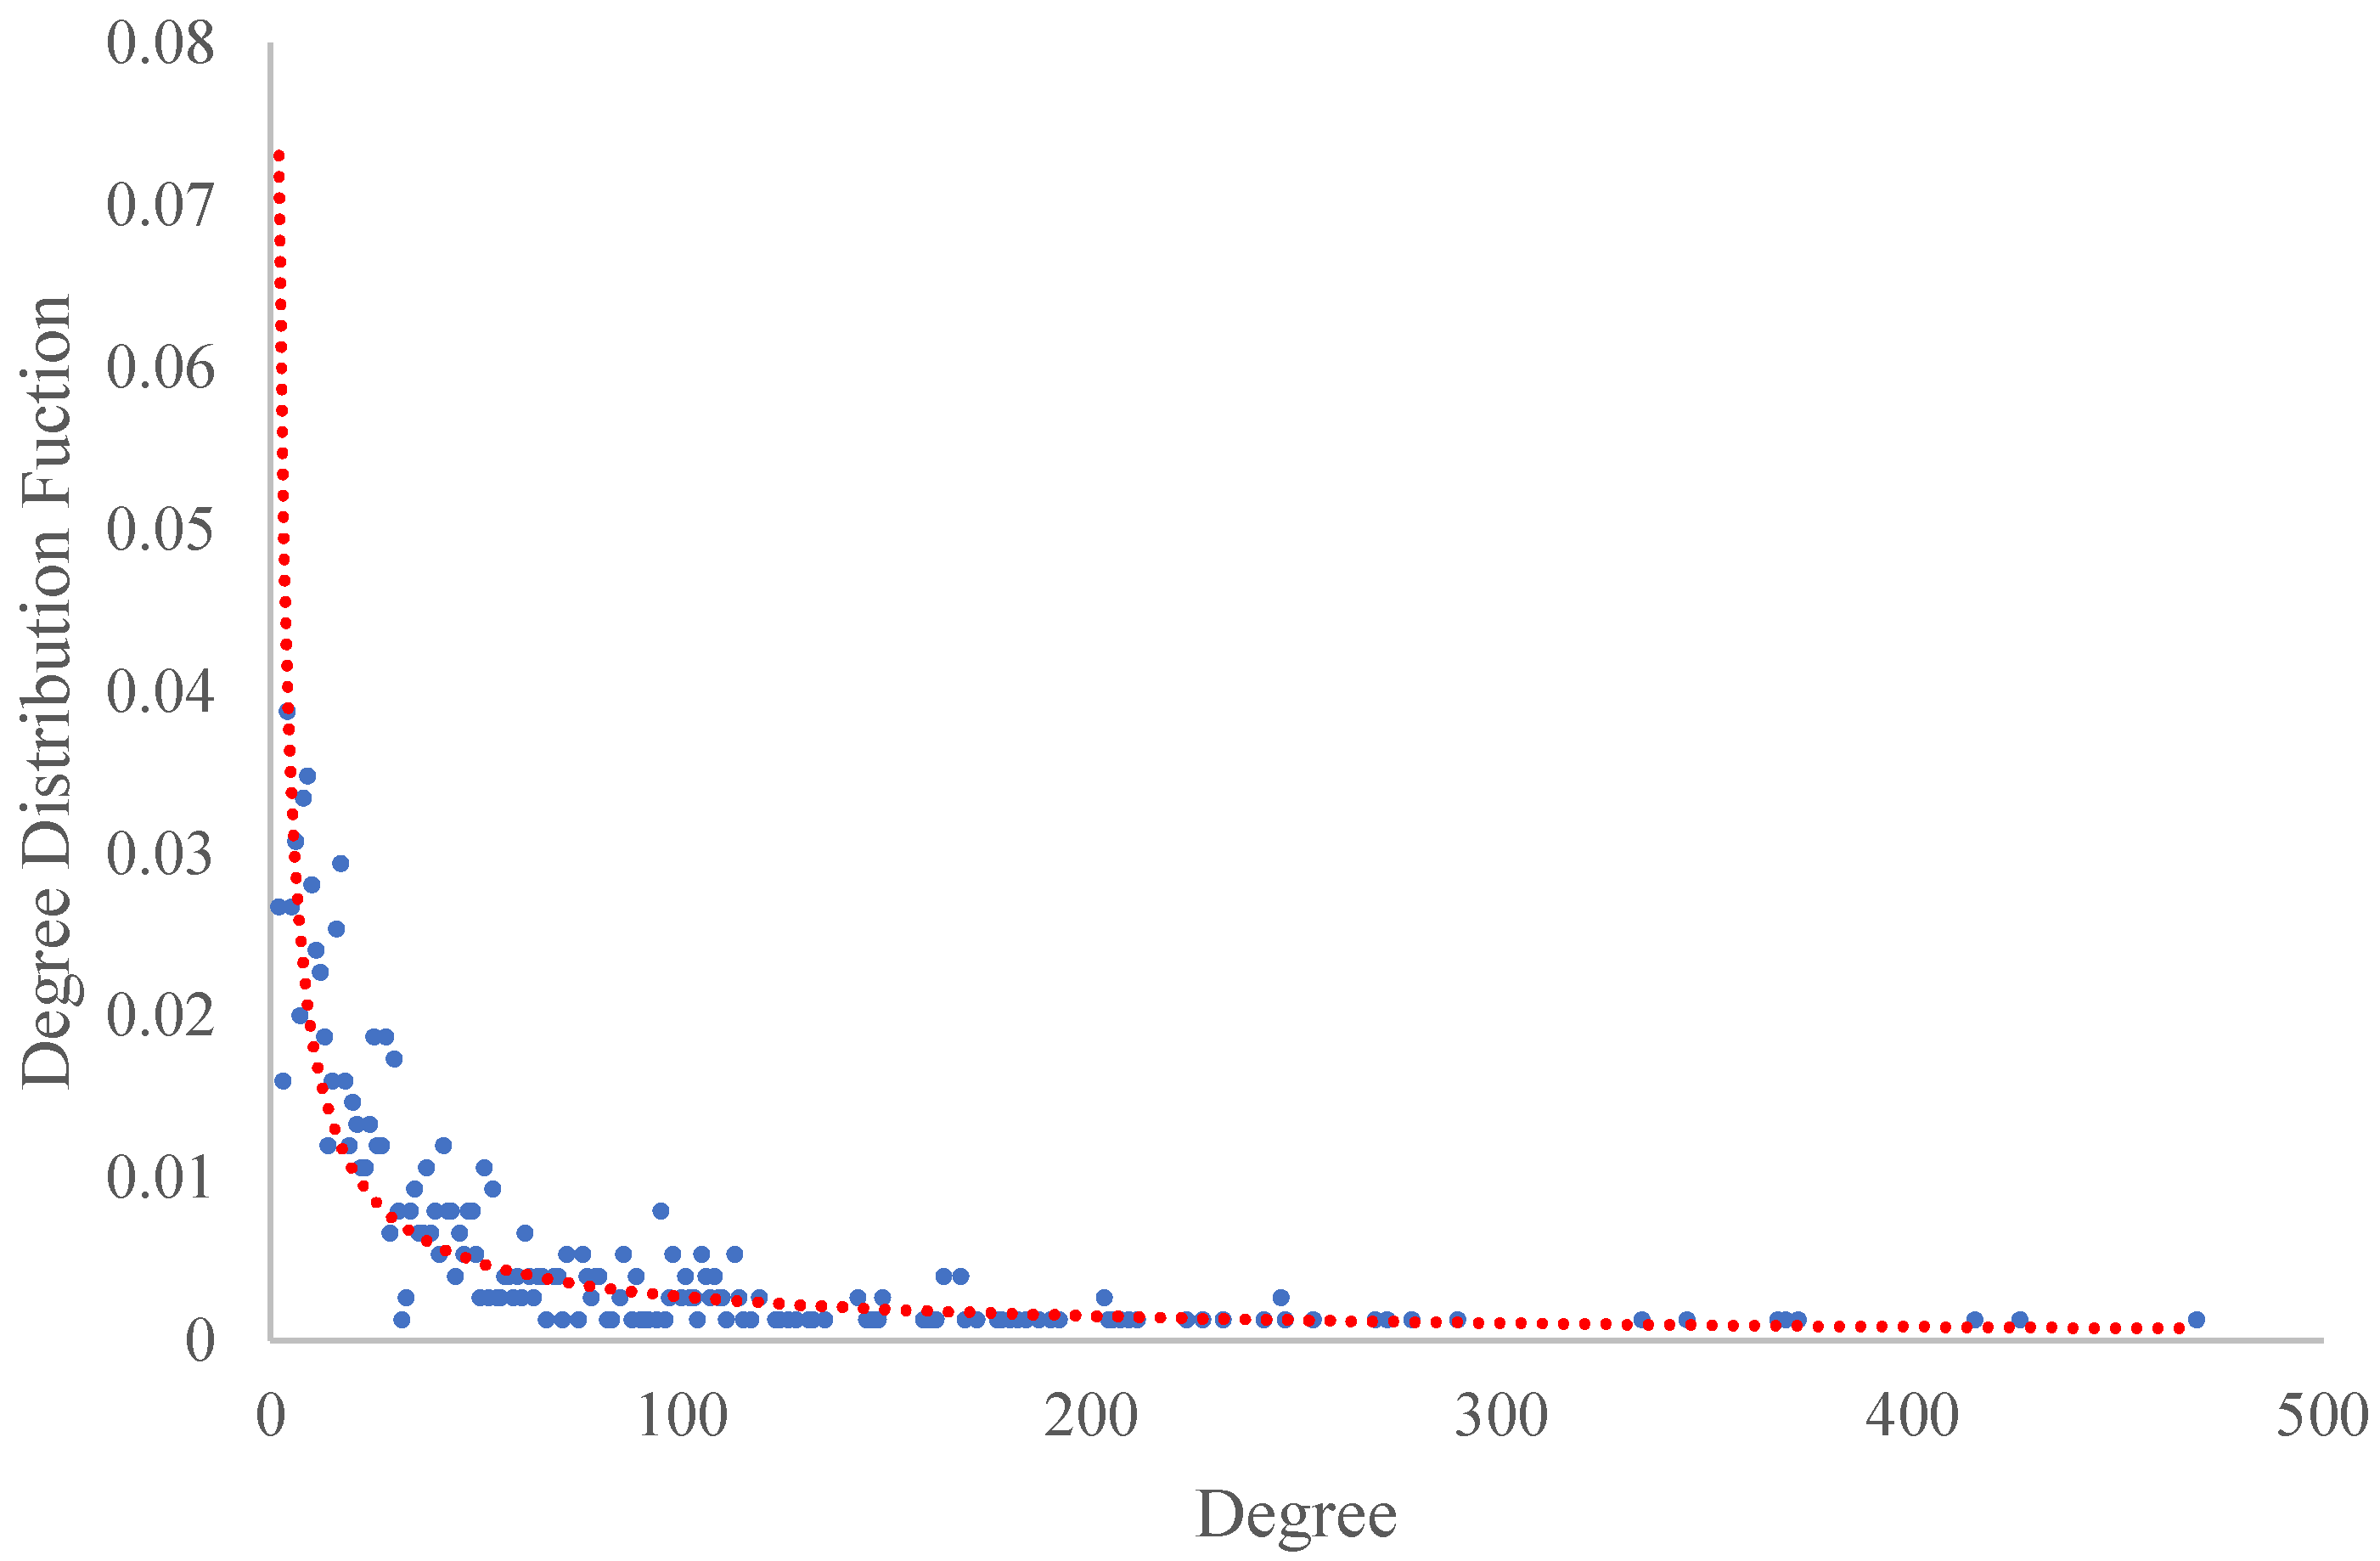
Figure 1. Degree distribution of the studied global container shipping network.
Jmse 11 01585 g001
Figure 2. Topological characteristics comparison between the random network and the studied shipping network.
Jmse 11 01585 g002
Figure 3. The geographical locations of the top 10 ports with the highest RSH values and ports’ container throughputs in 2022 (in million TEUs).
Jmse 11 01585 g003
Figure 4. Topological graph of the global container shipping network.
Jmse 11 01585 g004
Figure 5. Number of connected ports of each hub in the port communities.
Jmse 11 01585 g005
Table 1. The methods used to identify transshipment hubs.
Name of methodReferences
Identify transshipment hubs at the global levelBetweenness centrality[1,19]
Transshipment incidence[12]
Multiple linkage analysis[38]
Neighborhood-based centrality[39]
Identify transshipment hubs at the regional levelStructural hole theory[3]
Eigenvalue decomposition[7]
Transshipment incidence[15,16]
Betweenness centrality[20,37]
Table 2. Top 10 ports with the highest RSH values.
RankPort NameCountryRSH Value
1stShanghaiMainland of China15,890.741
2ndSingaporeSingapore15,668.165
3rdBusanSouth Korea14,274.507
4thRotterdamNetherlands10,273.165
5thHong KongMainland of China8263.750
6thAntwerpBelgium7714.973
7thQingdaoMainland of China7301.486
8thNingbo-ZhoushanMainland of China6095.064
9thKaohsiungTaiwan of China4876.624
10thKlangMalaysia4844.443
Table 3. Port communities and representative ports within these communities.
Port CommunityNumber of PortsRepresentative Ports
I153Rotterdam, Antwerp, Hamburg, Le Havre, Tanger Med, Algeciras, etc.
II149Shanghai, Hong Kong, Singapore, Busan, Kaohsiung, Tanjung Pelepas, etc.
III101Jeddah, Port Said, Haifa, Piraeus, Marseille, Marsaxlokk, etc.
IV78Houston, Port Everglades, Galveston, Philipsburg, Mariel, etc.
V60New York, Baltimore, Savannah, Boston, Colon, etc.
VI54Sydney, Melbourne, Tauranga, Auckland, Wellington, etc.
VII36San Antonio, Cristobal, Puerto Caldera, Guayaquil, Paita, etc.
VIII34Tokyo, Osaka, Nagoya, Kobe, etc.
IX24Santos, Rio Grande, Rosario, Itajai, etc.
Disclaimer/Publisher’s Note: The statements, opinions and data contained in all publications are solely those of the individual author(s) and contributor(s) and not of MDPI and/or the editor(s). MDPI and/or the editor(s) disclaim responsibility for any injury to people or property resulting from any ideas, methods, instructions or products referred to in the content.