Article

Influence of Load Conditions on the Propeller Wake Evolution

1
Key Laboratory of Fishery Equipment and Engineering, Ministry of Agriculture and Rural Affairs, Fishery Machinery and Instrument Research Institute, Chinese Academy of Fishery Sciences, Shanghai 200092, China
2
Qingdao National Laboratory for Marine Science and Technology, Qingdao 266237, China
*
Author to whom correspondence should be addressed.
J. Mar. Sci. Eng. 2023, 11(9), 1674; https://doi.org/10.3390/jmse11091674
Submission received: 21 July 2023 / Revised: 13 August 2023 / Accepted: 21 August 2023 / Published: 25 August 2023
(This article belongs to the Special Issue Failure Analysis of Marine Structure II)

Abstract

:
The present work presents numerical research on the wake flows behind a propeller operating under three advance coefficients. Large eddy simulations are adopted to obtain the viscous flow information behind the propeller. In particular, the study highlights the comparison of the evolution characteristics and the flow physics within the propeller wakes with three advance coefficients. The predicted global force and moment coefficients and phase-average statistics of streamwise velocity agree well with the available experimental data. Compared to all other flow structures in the wake, the tip vortices are found to play the most significant role according to the results. During the pairing process of adjacent tip vortices, the tip vortices diffuse circumferentially, leading to enhanced mutual-induction effects. When the advance coefficient is low, the wake becomes distorted, and the pairing process takes place in the middle region of the flow field. As a result of their unstable motion, the four tip vortices generated by the propeller cannot be distinguished individually in the far field. Instead, they break down into smaller vortices and tend to distribute themselves uniformly in the azimuthal direction. The increase in the advance coefficient delays the pairing process. This study offers valuable insights for the design and optimization of marine propellers.

1. Introduction

With the introduction and enforcement of maritime regulations by international and domestic associations, conventions, and major classification societies in recent years, the performance of large aquaculture workboats throughout their lifecycle, including design, construction, and operation, has been significantly impacted. The designers of large aquaculture workboats are increasingly focusing on ship performance design that meets regulatory standards, including ship speed related to energy efficiency guidelines, maneuverability and stability related to minimum safe power guidelines, and ship radiated noise related to underwater radiated noise guidelines [1,2,3,4,5,6]. As the requirements of regulatory standards continue to increase, ship refinement design technology based on sophisticated computational models and experimental evaluation methods becomes more important. In the context of the shipbuilding industry’s emphasis on green ship design concepts, there is a growing need to study the details and fundamental issues of fluid motion that cause macroscopic changes in ship hydrodynamic performance. Thus, the demand for ship refinement design and optimization concepts based on the motion of water particles around ships and the flow state of the viscous flow field around ships is becoming increasingly prominent [7,8,9,10,11].
The measurement and precise acquisition of flow field details can record in detail the phenomena that cannot be observed by the naked eye, and they present a large amount of physical field information. Through the repeated observation and analysis of scientific research and design personnel, effective improvement methods and design ideas for ship design and optimization can be formed. After breaking through the scale constraints of time and the physiological structure, the detailed flow information and characteristics that reflect the macroscopic integral quantity changes can be observed. This is the scientific significance of fine flow field measurement and one of the most important ways to understand the world and major scientific innovations. The study and analysis of ship navigation performance from the perspective of flow details and flow mechanics are increasingly valued by researchers in various countries. Researchers hope that the study of flow field mechanics can reveal the inherent reasons for changes in hydrodynamic integral macroscopic quantities related to force, displacement, angles of rotation, amplitude, response, sound levels and other aspects involved in ship navigation performance [12,13,14,15].
Propellers have been extensively used in vessels sailing in inland rivers and costal environments. Numerous studies focus on the hydrodynamic performance of propellers, and research on the mechanisms of wake instability has attracted the most attention [16,17,18]. This is because vibration, noise and structure are important problems related to propeller wake evolution.
Particle image velocimetry (PIV) is an optical-based flow visualization measurement method that is widely used in education, scientific research and other fields. PIV is a non-intrusive flow velocity measurement technique used to measure transient flow velocities and velocity-derived parameters. During the measurement process, tracer particles that are small enough and have good flow-following characteristics are seeded into the fluid for particle tracking. The flow field with tracer particles is recorded by an image acquisition module. Through computer image processing and velocity solving algorithms, the velocity and direction of the fluid being measured are finally obtained. PIV technology was originally based on the dual-image exposure of particle motion in the fluid using film photography techniques. The characteristics of propeller wake have been experimentally investigated using the PIV method. In order to analyze the viscous wake behind the propeller blade within a cavitation tunnel, Di Felice et al. [19] integrated the longitudinal progression of the wake using PIV equipment with a proposed image analysis algorithm. The hub and tip cortices were found to be unstable, and their breakdown mechanism was reported by the researchers. Through the application of detailed time-resolved visualizations and velocity estimations, the study investigated the influence of the separation distance between spirals on the transitional instability of both the hub vortices and propeller tip vortices within the evolving trajectories of the wake system [20]. In this study, the distance between tip vortex spirals was found to play important roles in mutual inductance effects. The mechanisms governing the development of the propeller vortices were excavated using time-resolved 2D-PIV for the first time by Felli and Falchi [21]. Their research offered a comprehensive understanding of the fundamental mechanisms that govern the initiation of wake instability, along with the intricate sequence of processes that facilitates the organization and interaction of various vortex formations; they found that the far-field evolution of the wake exhibits deterministic behavior at the macroscopic scale. The experimental outcomes captured by PIV were contrasted with the numerical findings from the wake produced by a propeller on a generic submarine functioning in close proximity to the surface, as reported by Wang et al. [22]. They found that the free surface significantly affects the inception of propeller wake instabilities, producing less coherent vortex structures on the top of the propeller wake. In the work by Friedhoff et al. [23], a novel hardware design was merged with the Shake-the-Box algorithm to create a volumetric particle tracking velocimetry method. The researchers validated the outcomes pertaining to the wake produced by a ducted propeller under bollard pull conditions, employing traditional 2D3C PIV. Additionally, they found that the newly implemented technique is suitable for phase-averaged evaluations, and it also offers advantages for the examination of three-dimensional flow dynamics.
Computational fluid dynamics (CFD) is an important numerical method for the study of the viscous flow field and hydrodynamic performance of ships. It can provide rapid, accurate and low-cost predictions of ship hydrodynamic performance and comprehensive and detailed flow field information, which complements the shortcomings of physical water tank experiments. Combining CFD with model experiments can greatly reduce the number of model experiments, reduce testing costs and shorten the research and development cycle. Therefore, the combination of model experiments and numerical calculations has always been considered a reliable and reasonable method for the study of ocean engineering problems.
CFD is a powerful engineering and scientific research tool that utilizes numerical methods and high-performance computers to model and analyze the fluid flow. The core of CFD is to simulate the behavior of fluids under various conditions. This enables researchers to study and predict fluid flow phenomena without conducting experiments. The utilization of CFD has become prevalent in the numerical analysis of the flow information behind rotating propellers. Kumar and Mahesh [24] examined the flow patterns in a five-bladed marine propeller based on large eddy simulation (LES). Their primary emphasis was on evaluating both phase-averaged and azimuthal-averaged wake properties. Their research uncovered a mechanism of instability based on mutual induction between the trailing edge vortices and tip vortices. The propeller wake dynamics were analyzed by Sun et al. [25] to examine the physics using detached eddy simulations (DES). They found that the azimuthal diffusion of vorticity plays a vital role in mutual inductance effects, and the alternating strong and weak vortex structures appearing downstream of the propeller signify the onset of instability. Large eddy simulation was employed to numerically investigate the loads exerted on the hydrofoil functioning behind the propeller, with consideration given to both the propeller wake and the collision of the hydrofoil [26]; they found that significant enhancements in stress levels can be achieved for rudders operating within the wake generated by upstream propellers. DES was employed to contrast the propeller vortex formation under different conditions, using numerical evaluation. Vortex topologies were exposed under different loading conditions, and they demonstrated that the pronounced interference effects led to the premature collapse of the vortex system, thereby preventing the tip vortex pairing process from occurring [27]. In their study, Posa [28] replicated the wake produced at distinct propulsive coefficients based on the LES method. The objective of the study was to investigate the impact of the propeller’s rotational velocity on the formation of the tip and hub vortices. The findings elucidated the correlation between pressure minima, instability and the initial decay of turbulence, all of which were influenced by the rotational velocity.
The preceding literature review demonstrates that the utilization of the CFD technique in the numerical modeling of propeller wakes is faced with the challenge of expensive computational resources resulting from the accurate capture of the fine vortex structure, because the numerical simulation of the propeller wakes needs a high-resolution turbulence model utilizing a minute time interval and high grid resolution to solve the numerical dissipation problem of downstream vortex structures and to accurately capture the vortex strength. Furthermore, the utilization of distinct CFD techniques is necessary to capture diverse wake features, leading to varying computational expenses. For example, if the wake field’s phase-averaged physical quantities are exclusively taken into account, the unsteady RANS method’s outcomes are frequently in agreement with the PIV tests. However, the complex nature of the process requires the use of DES or LES approaches to precisely represent the detailed vortex formations, which requires a high temporal and spatial resolution. The hybrid LES/RANS (like DES) method is very popular and most commonly used in the study of rotor wake instabilities. The available literature seldom studies the propeller wake dynamics (from the near to far field) in detail, pointing to the destabilization mechanisms using the LES method. This study conducted LES simulations of a marine propeller functioning in unrestricted water environments, utilizing an overset technique, at two distinct advance coefficients. A comprehensive analysis of the wake dynamics was conducted, comparing the topological features under varying working conditions.

2. Research Model

The form and physical evolution of propeller wake vortices are greatly related to the working conditions and propeller geometry. Propellers with different geometric parameters can generate wake systems with varying strengths of vortex components. Selecting specific standard models is beneficial in conducting both qualitative and quantitative numerical verification work. The test geometry was the E779A propeller, which was designed at CNR-INM. This propeller was designed to generate tip vortices with high strength, making it suitable for the examination of wake development traits. Furthermore, there are extensive numerical [29,30,31,32] and experimental studies of the selected propeller [19,20,21]. There are numerous available public experimental and numerical data for validation and verification. Figure 1 shows the geometric model and reference coordinate system. The geometry details of the E779A propeller are summarized in Table 1.

3. Numerical Simulation

3.1. Numerical Method

CFD technology is based on the fundamental laws of physics, which include the conservation of mass, momentum and energy. In this study, the medium water is treated as an incompressible Newtonian fluid with negligible heat exchange, so the energy conservation equation can be ignored when constructing the basic equations. The filtered N-S equations under incompressible-flow conditions are numerically solved based on the LES method to carry out the simulations.
u ˜ = 0
u ˜ t + u ˜ u ˜ = p ˜ τ + 1 Re 2 u ˜
where u ˜ and p ˜ are the filtered velocity vector and filtered pressure scalar, respectively. The first term in Equation (2) is the time derivative of u ˜ . Re is the Reynolds number. The subgrid-scale (SGS) stress tensor τ is defined as τ = u u ˜ u ˜ u ˜ . It should be noted that only large-scale flow structures are solved. In the present work, the WALE model is selected to model the flow structures on a small scale. The WALE model can provide accurate scaling at solid wall boundaries automatically. The precision and stability of the WALE model have been validated for the computation of complex flows across a variety of scenarios [33,34], including propeller wake instabilities [24,35].
The numerical solution of partial differential equations in the computational domain can be classified into three different discretization methods based on the distribution of the assumed dependent variable among the nodes and the expression form of the discretized equations. The finite volume method (FVM) has been employed in recent years due to its excellent computational efficiency. OpenFOAM, a freely available CFD C++ code repository, is used in this study to solve the partial differential equations governing the propeller wake flows. OpenFOAM solves the three-dimensional Navier–Stokes equation on unstructured grids using FVM. The PISO algorithm is employed to address the pressure–velocity coupling issue. The propeller motion is achieved by the dynamic overset grid method [36,37,38]. To cause the propeller to advance 1° degree per step, an unsteady simulation time step is chosen.

3.2. Computational Details

The rotating domain, which spins with the propeller, is a cylinder possessing a diameter of 1.5D and extending 0.35D in both the upstream and downstream directions. The computational domain’s dimensions are selected to avert blockage effects. The size of the computational domain is selected according to references [25,39,40].
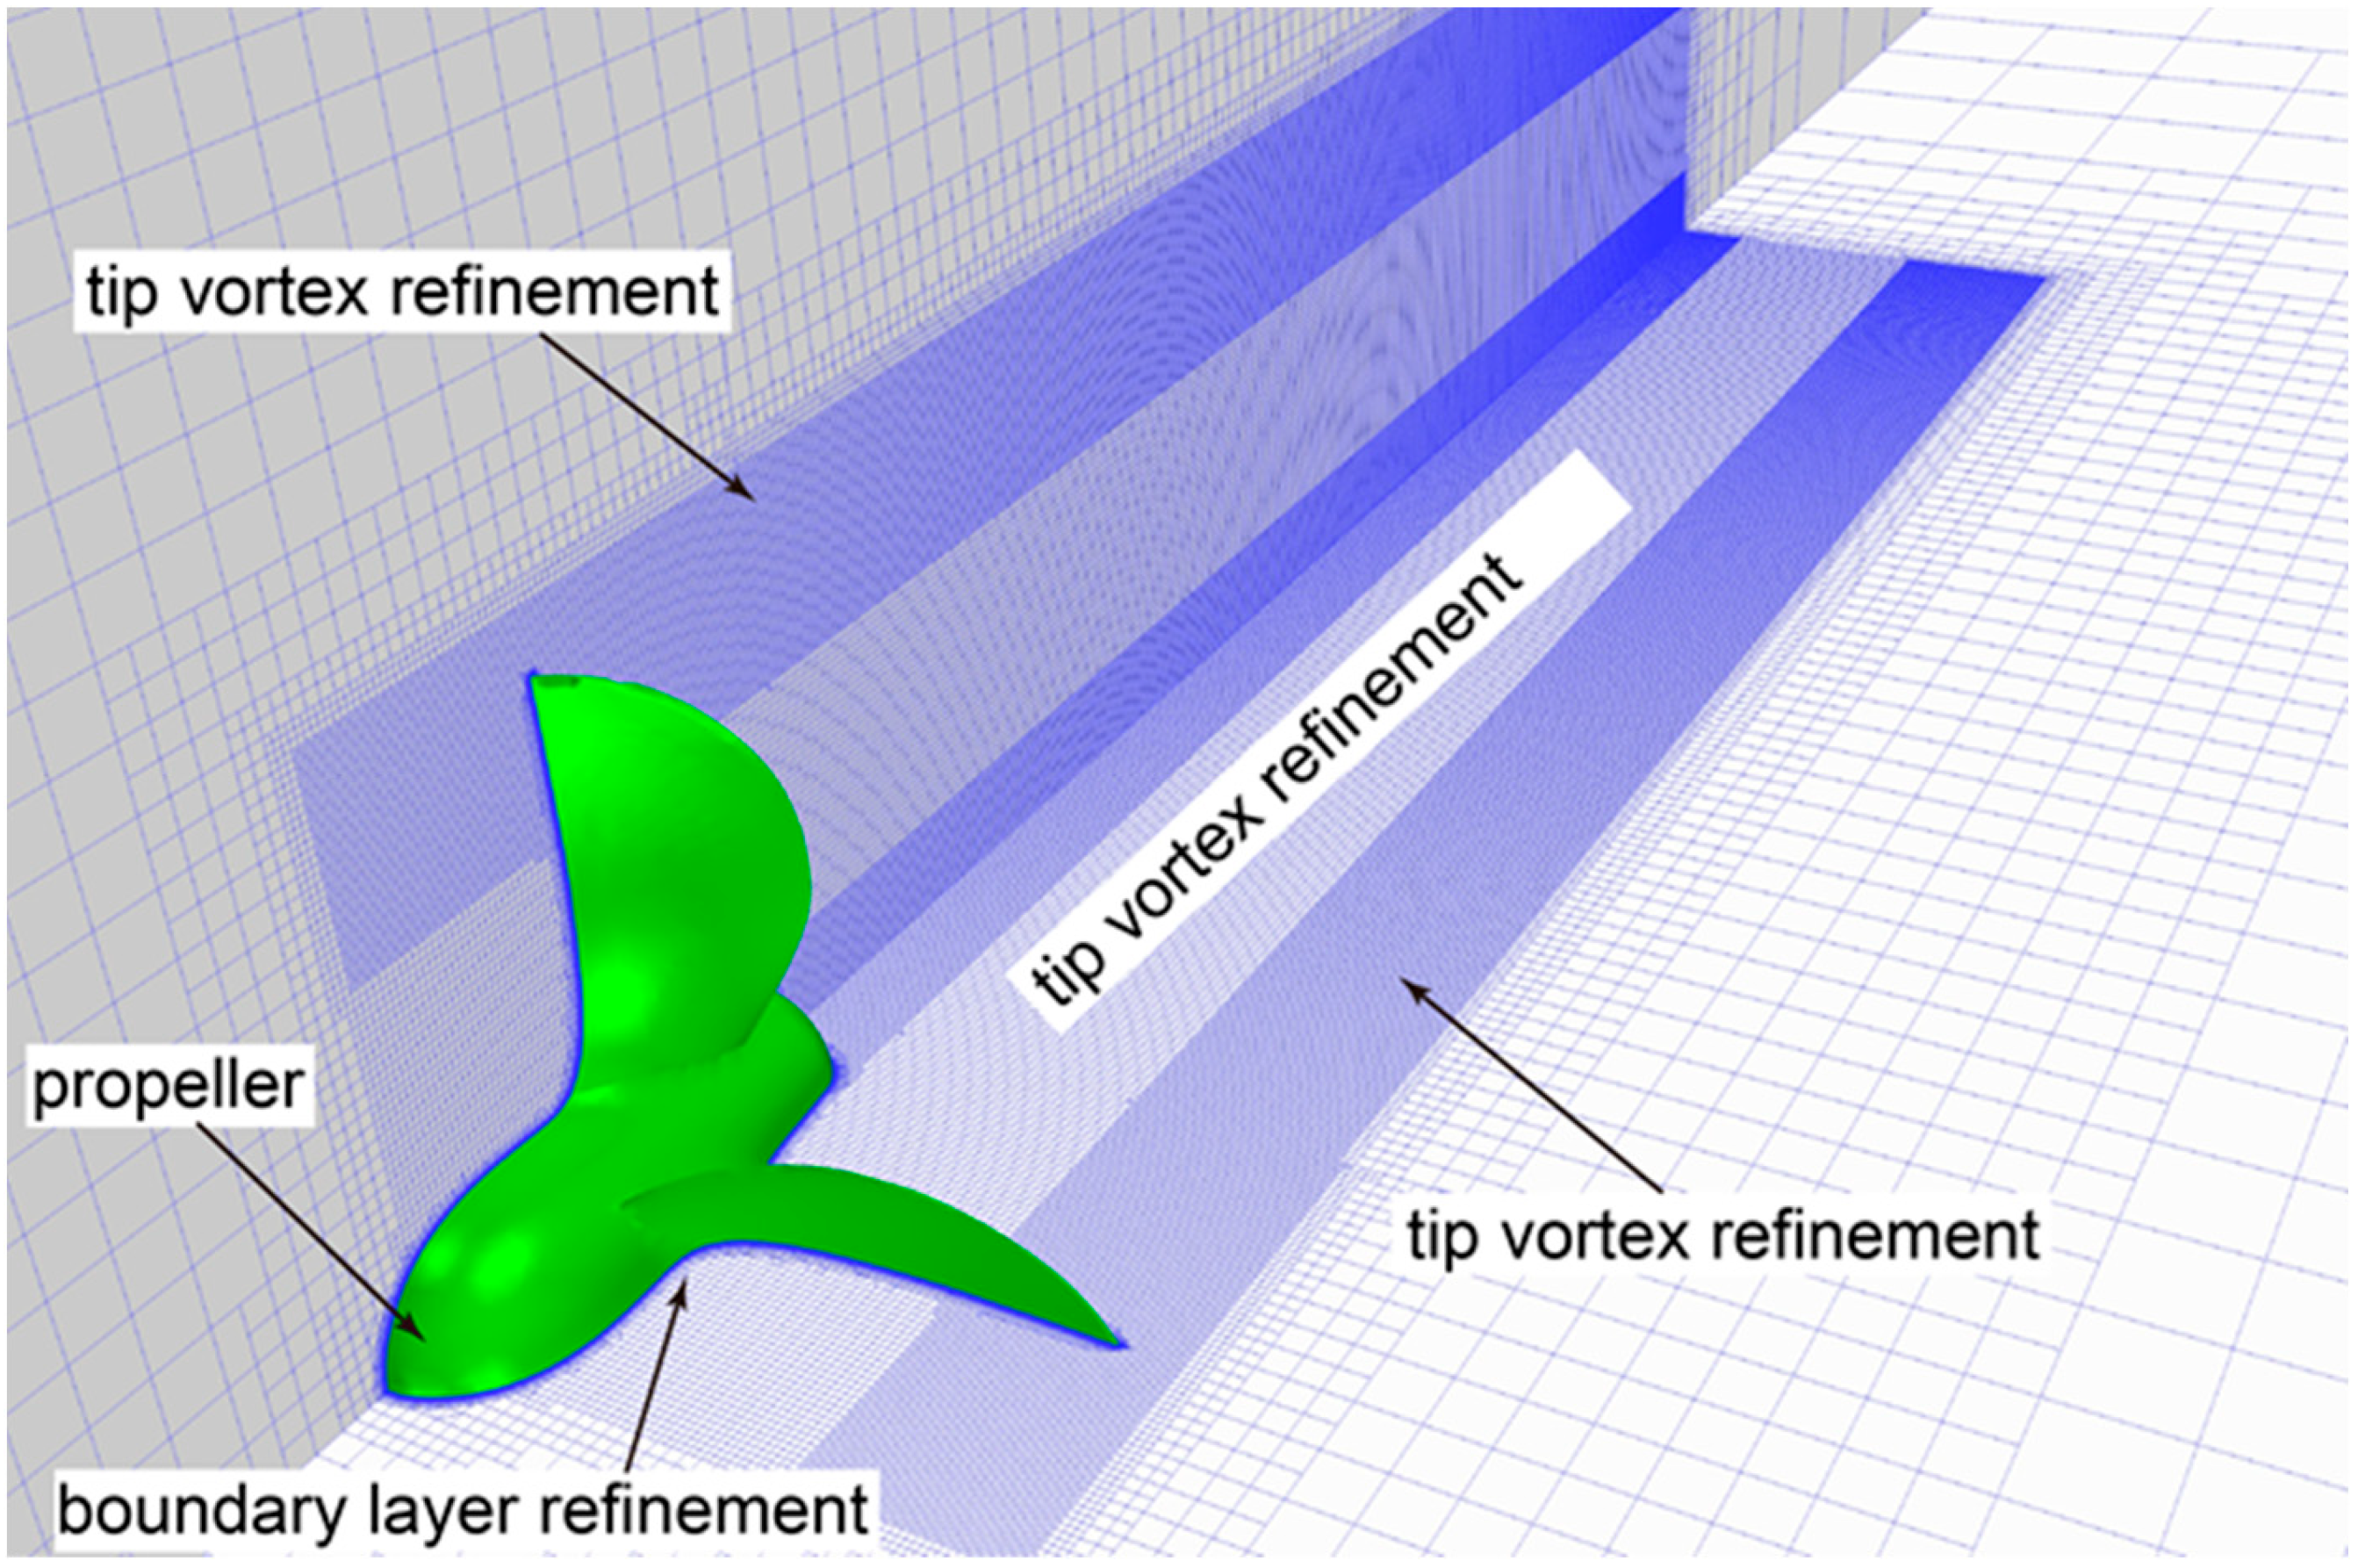
The spatial discretization of the computational domain is achieved through unstructured grid techniques. In order to achieve a higher resolution in the propeller wake and emphasize turbulence details, a refined mesh is created. Figure 2 depicts the mesh details, such as the hub and tip vortex refinements. The wall y+ < 1 is satisfied on the propeller blades and the hub, and there are 48 million cells in total. Within the grid refinement area of the tip vortex, the smallest grid size constitutes approximately 1.5% of the characteristic length at 0.7R of the propeller blade, translating to 1.3125 mm. Conversely, the largest grid size equates to the entire chord at the same location, or 86 mm. The Reynolds numbers are 4.3 × 10⁵ for the condition of J = 0.38 and 7.4 × 10⁵ for J = 0.65, respectively. A grid with the same number of grid points as those in References [39,40,41,42,43,44] is used, and it is finer than the grid used in Reference [45]. For the current calculations, simulations are carried out for 30 propeller rotations, with the last 20 being used for time-averaged statistics. Since the time step is selected to allow the propeller to advance 1° per step, the results of 7200 time steps are taken into consideration for the time-averaged analysis.
The RANS simulation is utilized to decipher the initial flow fields, after which the transient LES simulation is initiated using the corresponding RANS results.

3.3. Numerical Validation

Three distinct working conditions are taken into account during this evaluation. The definition of the advance coefficient is shown below:
J = U n D
where U is the free stream velocity and n is the propeller rotating speed in revolutions per second. Thrust and torque coefficients can be readily calculated from the numerical findings. The definitions are shown below:
K t = T ρ n 2 D 4
K q = Q ρ n 2 D 5
where T and Q are the propeller thrust and torque, respectively. Figure 3a compares the experimental results and CFD of open-water curves. The mean thrust and torque coefficients of the numerical simulation results and experimental results [46] fit well in general, with a mild overestimation of the torque coefficient for CFD under the heavy loading condition.
The phase average for a general quantity f, which depends on both space and time, is defined as follows:
< f > = 1 m i = 1 m f x , y , z , t 0 + i 1 ϵ n
The total number of snapshots captured when the propeller blades pass the same azimuthal position is denoted by m. The sampling starting time, t0, occurs after the propeller wake has fully developed. As demonstrated in Figure 3b, the experimental outcomes [19] align well with the numerical findings.
The aforementioned analysis of the propeller wake validates the numerical approach utilized in the present work, indicating that the modeling and mesh generation are suitable for research on propeller wake instability.
Building on the work of References [47,48], the two-grid assessment procedure is employed to conduct the uncertainty analysis. This method has been widely utilized to evaluate grid convergence and numerical uncertainty in DES and LES simulations. The total numbers of grids for the two grid sets are 25 million and 48 million, respectively. The grid refinement ratio between the two grid sets is expressed as
r = N fine N coarse 1 / d
In this equation, N represents the total grid count, while d corresponds to the simulation dimension. The error of the results calculated by the fine grid is computed as
E = f 2 f 1 1 r p
where f1 and f2 denote the results computed through the fine and medium grid sets, respectively, and the formal order of accuracy is denoted as p (p = 3). The numerical uncertainty can be obtained by
U N = F S | E |
where F S denotes the safety factor, which is equal to 3.
The numerical uncertainties for the numerical simulation at different conditions are presented in Table 2. The numerical uncertainties for the two loading conditions are all less than 2%.

4. Results and Analysis

To examine the development of the wake features, several probes Pi (i = 1–6) are set at z/R = 0.95 vertically and x/R = 0.4, 0.8, 1.6, 2.4, 3.2 and 4.4 axially, with R signifying the propeller radius. The time series of the streamwise velocity under two advance coefficients are presented in Figure 4, where the streamwise velocity at probes P1, P3 and P6 is recorded after the computation is stable. In general, it can be observed that the most significant fluctuations in the streamwise velocities occur over time on the probes near the propeller plane. This is accompanied by the appearance of the simplest fluctuation frequency components, which means that the wake vortex is strong and coherent. Away from the rotating center, the frequency components of the fluctuations become more complex. This suggests that the wake vortex loses stability gradually with the increasing distance from the propeller center. Compared to the condition with a high advance coefficient, the streamwise velocity fluctuation amplitude on the same probe is larger at J = 0.38, and the frequency components of the fluctuations are more complex. This implies that the tip vortex is more susceptible to destabilization during downstream evolution under the low advance coefficient. The streamwise velocity fluctuations on probe P6 exhibit complete irregularity, along with intricate frequency components, which suggests the discretization of the vortex system behind the rotating propeller.
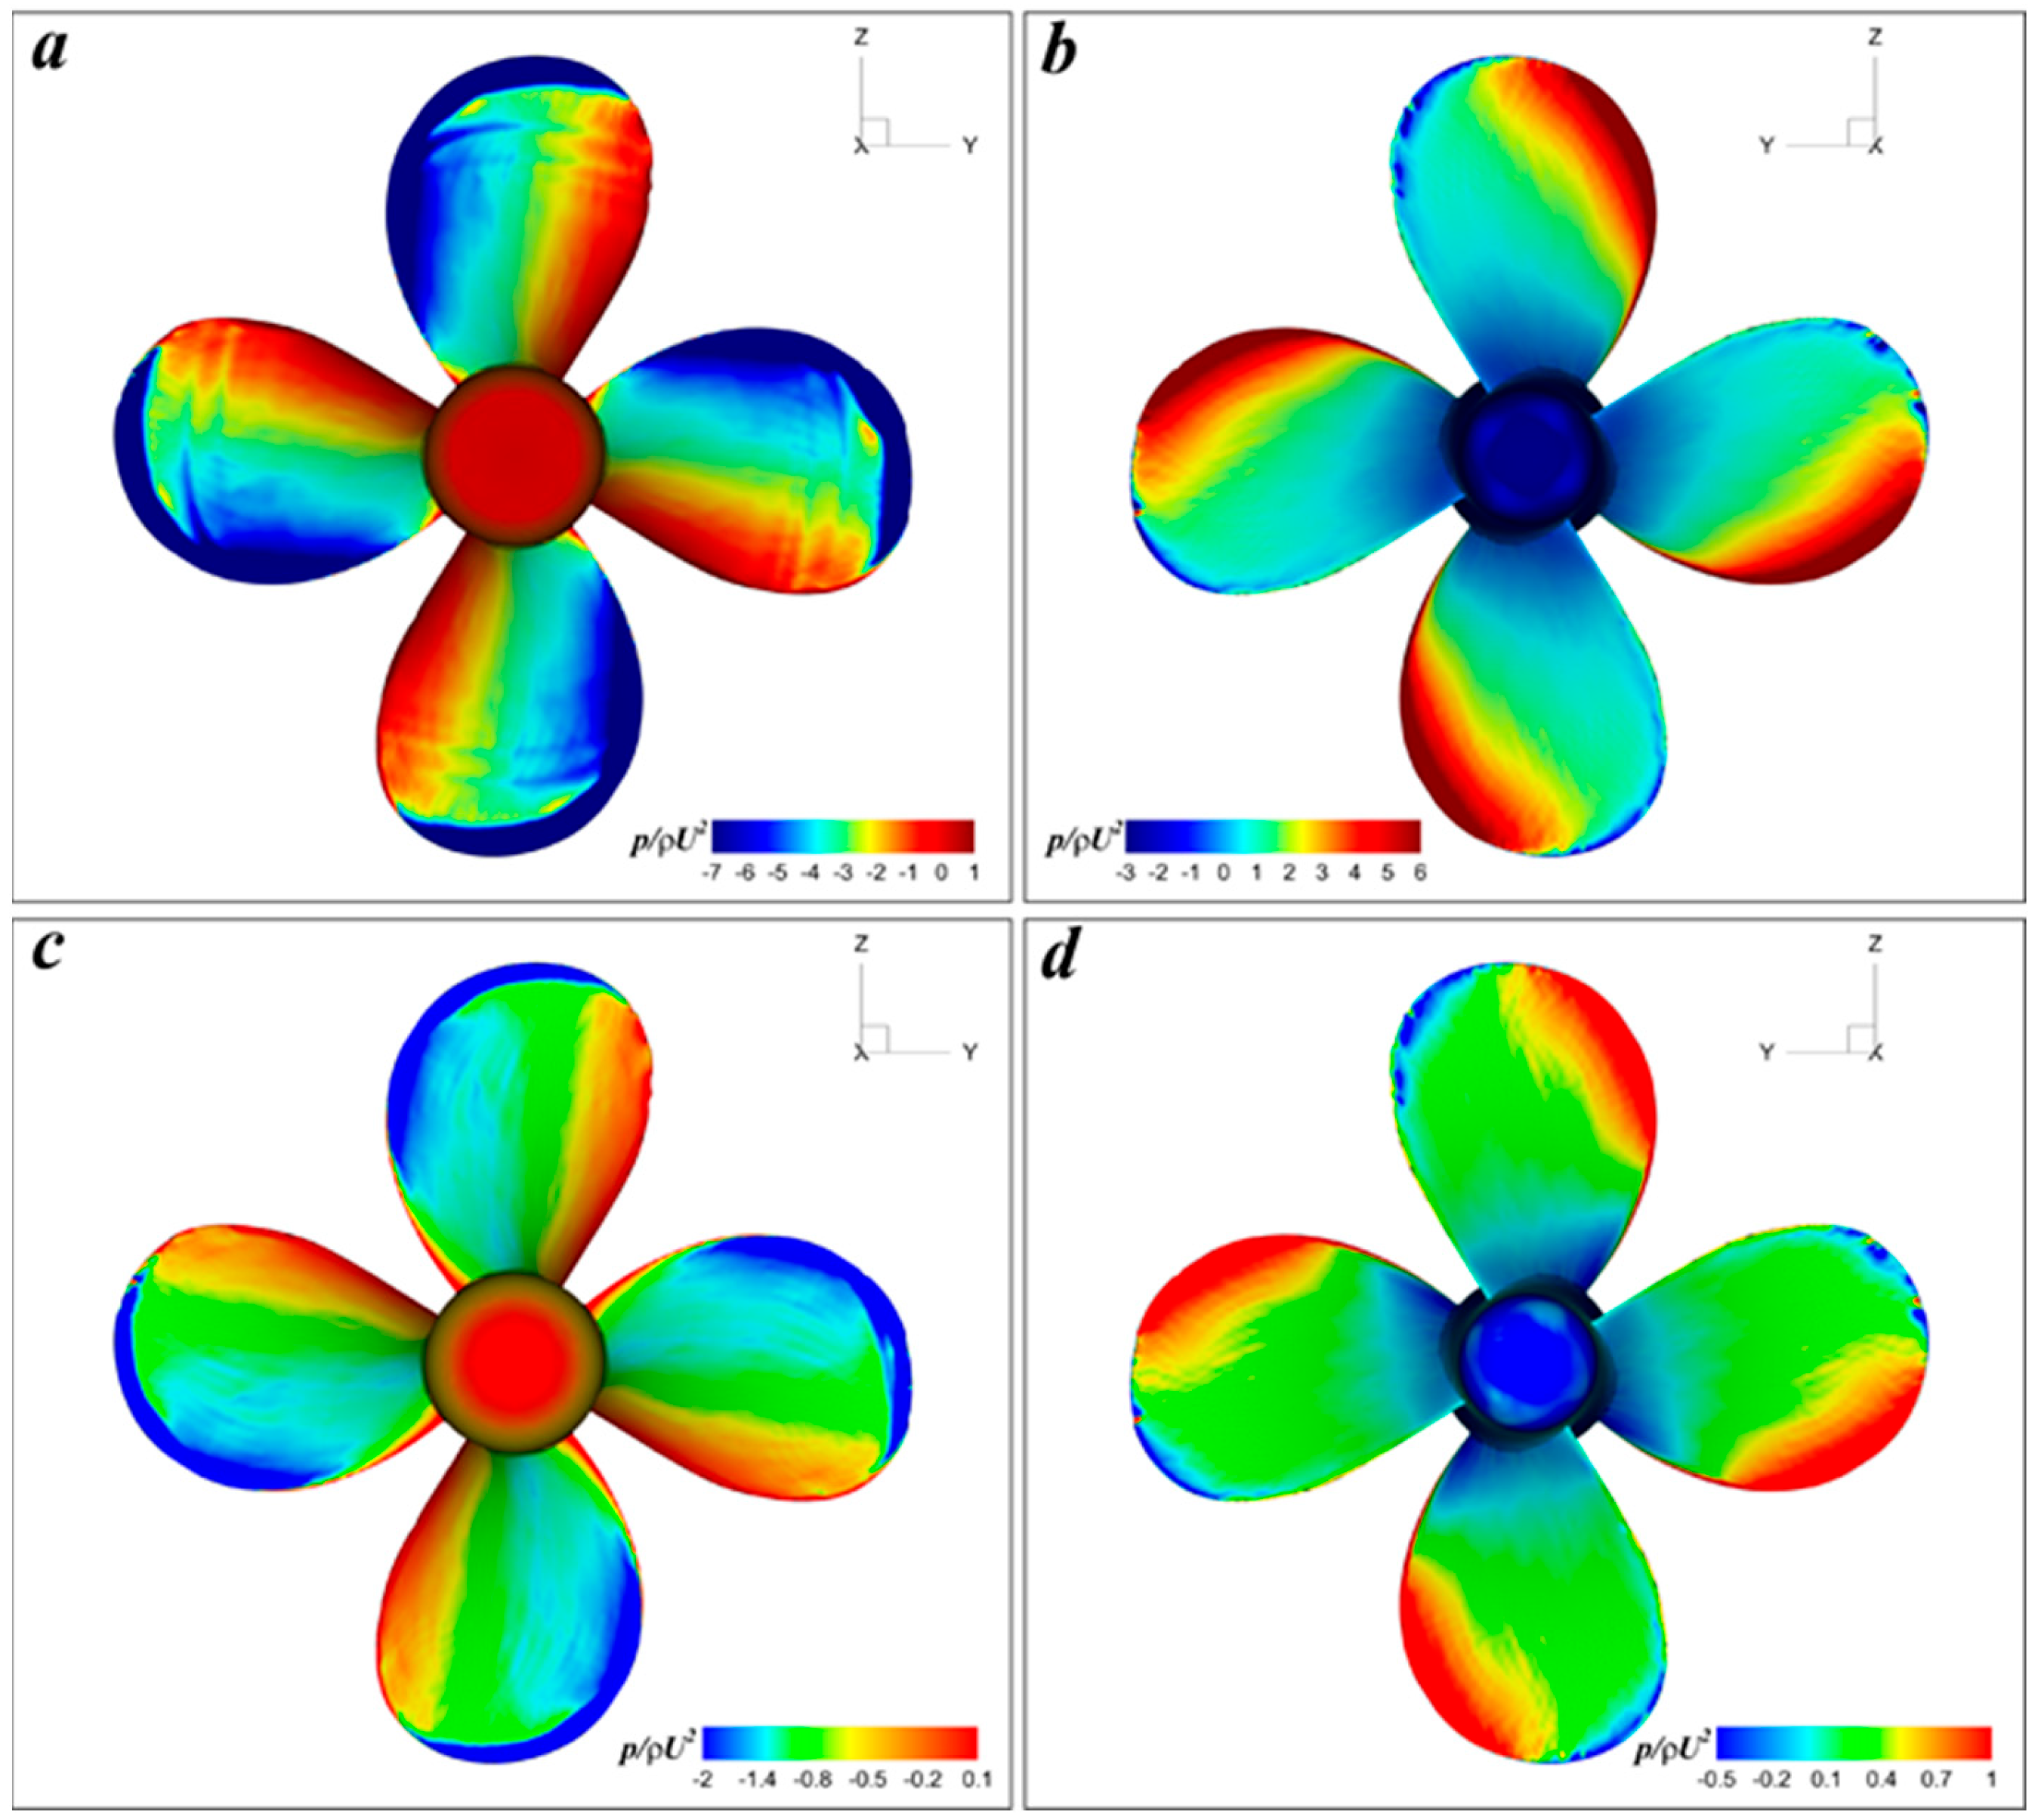
Figure 5 presents the pressure distribution on the blades under two advance coefficients. The difference in the pressure with a low advance coefficient is larger, indicating that the propeller takes a larger axial thrust force at the heavy loading condition. Figure 3a also shows consistent results. For J = 0.38, relatively lower pressure is observed at the leading edge. The region at the blade root marks the higher pressure distribution, indicating the shedding of the different vortices, such as the tip vortices, root vortices and trailing edge vortices. The same pressure distribution can be observed on the pressure side for the condition of J = 0.65, but the amplitude of the pressure is smaller, suggesting the production of a weaker vortex system. Some strips appear on the pressure side, which suggests that strong trailing vortices are generated. The pressure distribution is relatively concentrated on the pressure side. Higher and lower pressure is identified and is contrary to the results of the pressure side, which is the source of axial propulsion forces.
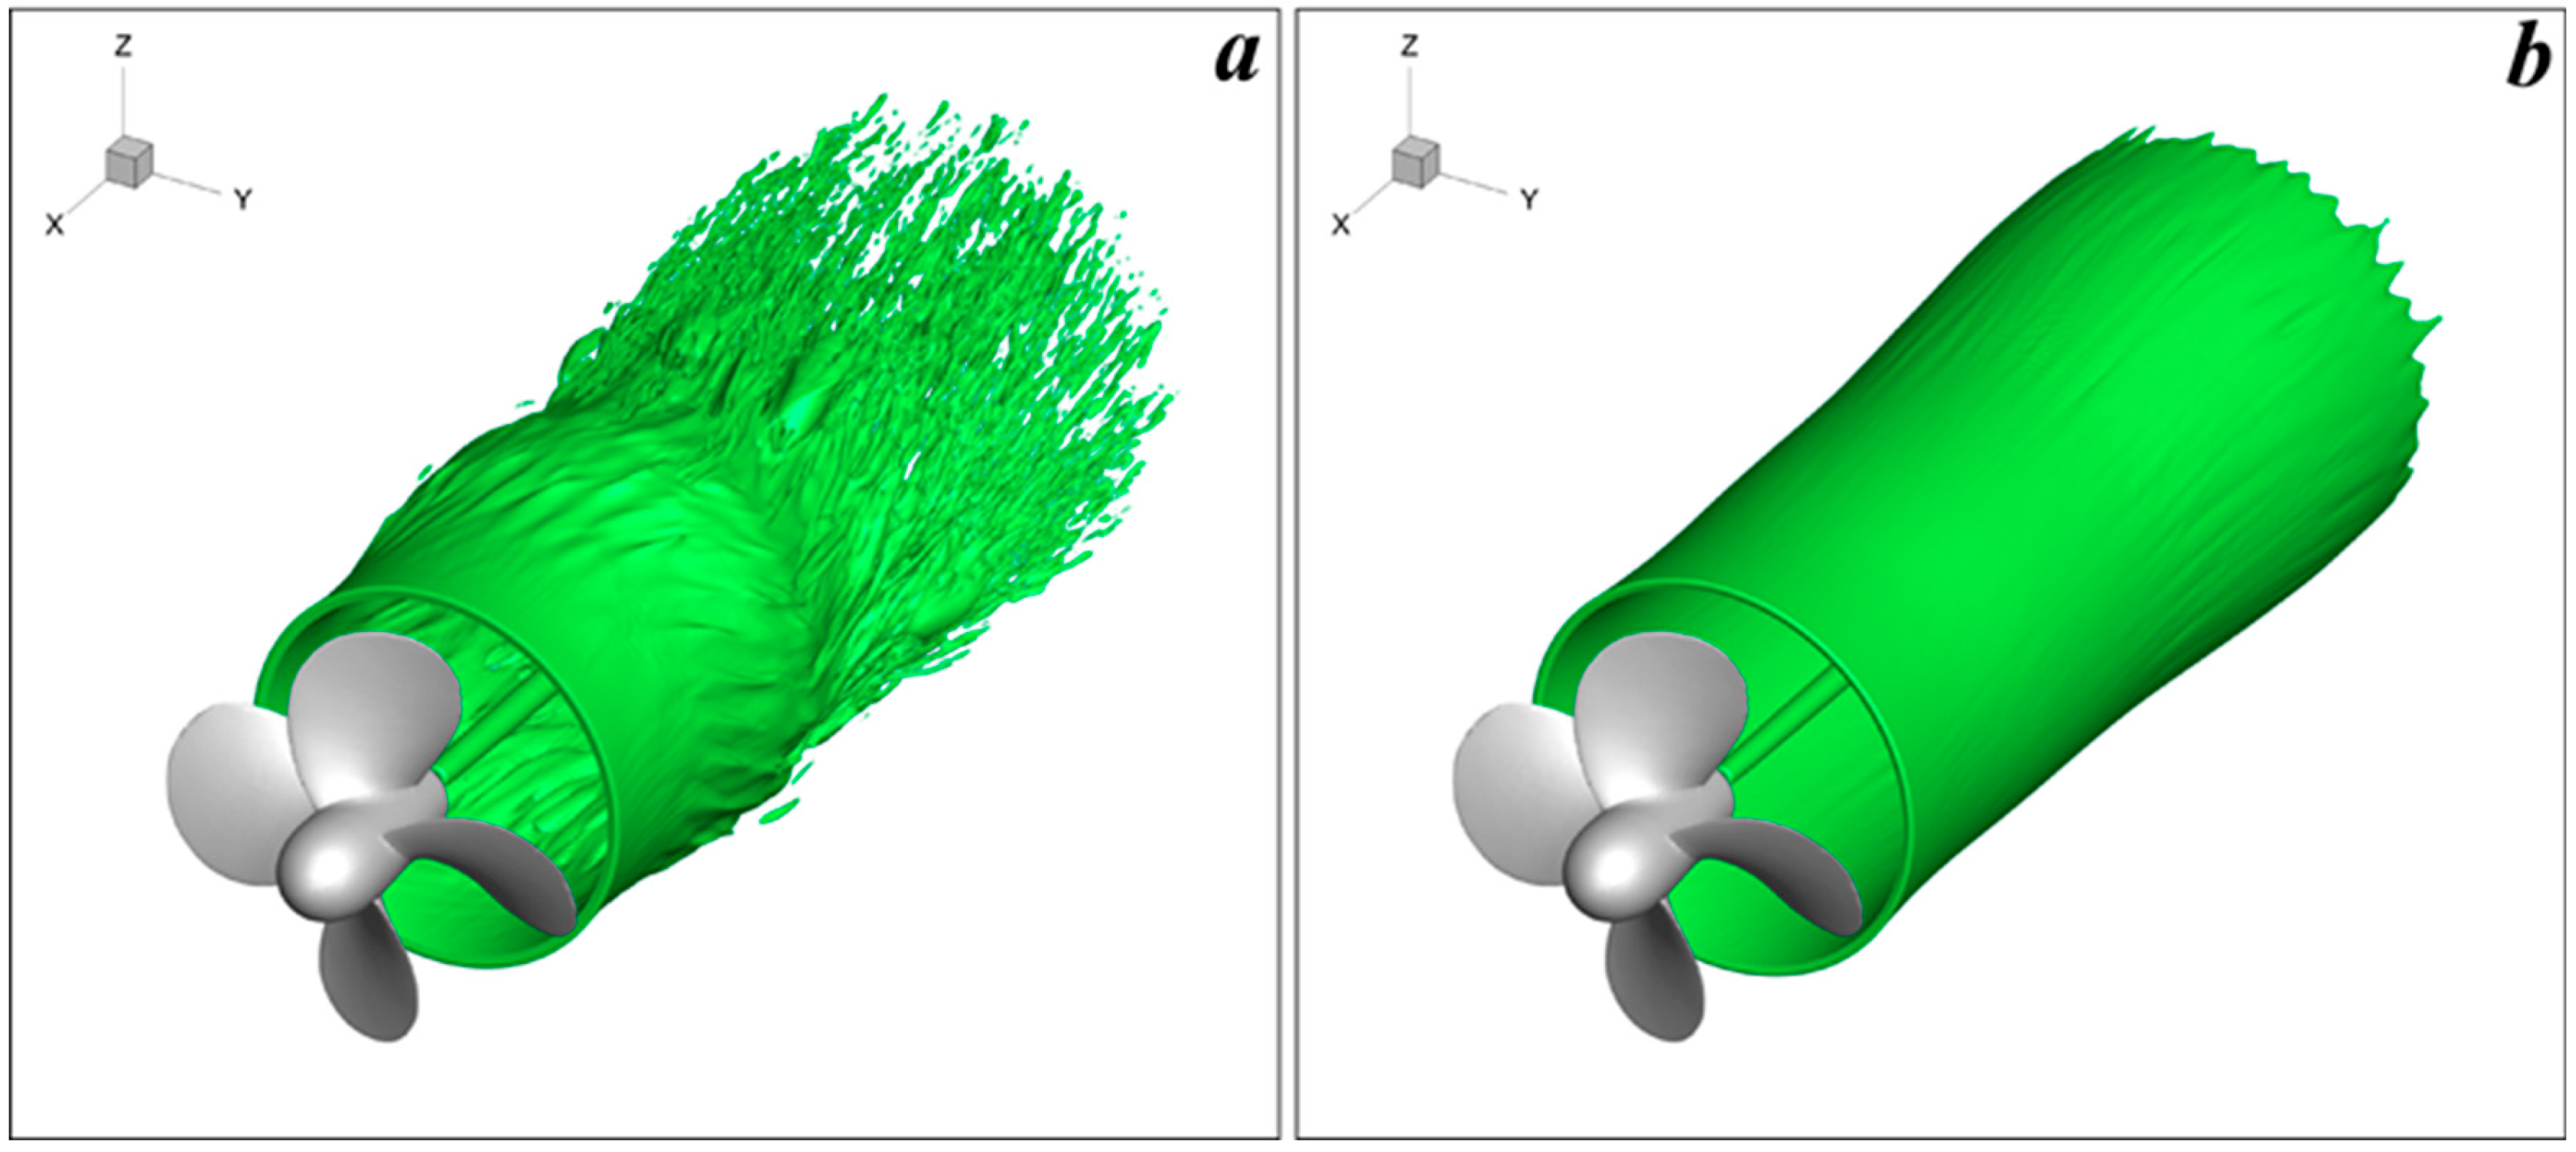
For various operational states, Figure 6 displays the time-averaged vortical patterns of the propeller. To depict the vortex structure, the Q-criterion iso-surface is utilized.
Q = 1 2 u x 2 + v y 2 + w z 2 u y v x + u z w x + v z w y
The three-dimensional vortical structure in time-averaged terms is obtained through the temporal averaging of the physical quantity Q, following the full development of the wake. It must be noted that the rotating domain is unable to provide stable time-averaged statistics; hence, the time-averaged vortical structure only represents the flow state within the stationary background domain. The three-dimensional vortical structure, when time-averaged, can reflect the trajectory and envelope of the propeller’s wake vortex evolution, which holds significant importance for the study of wake instability. For the condition of J = 0.38, a regular tube-like vortical structure is produced; this suggests that the vortex remains relatively stable within the immediate wake region. In addition, the wake tube contracts noticeably due to flow acceleration. As the wake continues to evolve downstream, the shape of the wake tube becomes distorted with significant protuberance because the middle region experiences significant instability in the vortex motion. The mean structure of the tip vortices is unable to form a wake tube in the far field and presents small-scale vortices; this implies that the flow coherence becomes weak. In the case of J = 0.65, for a considerable distance downstream, the propeller wake maintains a consistent tube-like profile and the protuberance only occurs in the far field, suggesting that the flow exhibits stability in the near and middle fields and starts to show elliptic instability only in the far field. Additionally, it is important to note that the time-averaged trailing edge vortex, as well as the root vortex structure, are not shown in Figure 6. This absence is attributed to the weak trailing edge vortex structure generated by the current propeller geometry, which quickly becomes unstable in the near field. The folds on the vortex tube mark the onset of elliptical instability, serving as an indicator of the initiation of instability within the tip vortex system. From the figure, it can be observed that the elliptical instability is noticeable in the near field when J = 0.38, whereas it is only observable in the mid to far field when J = 0.65. This also signifies that the delay in the occurrence of vortex system instability under light load conditions is related to the deferred onset of elliptical instability.
Figure 7 shows the vortical structures colored by the velocity magnitude. Compared with J = 0.65, the topology of the propeller wake structure under J = 0.38 is more complex, exhibiting a rich range of turbulent scales and vortex instability behaviors. The behavior of the vortex during high loading conditions is noticeable, with four helical tip vortices emerging from the propeller blade tips. These vortices interact to form an exceptionally stable and uniform vortex pattern within the immediate vicinity field. Elliptical instabilities become apparent as the wake progresses downstream. Additionally, the adjacent tip vortices exhibit pairing behavior resulting from the mutual induction effects between them. As the wake travels further downstream, the elliptical instabilities within the tip vortices rapidly intensify. This process leads to eventual disintegration. The ultimate result is the formation of a vortex with a consistent distribution pattern. When operating under a light loading condition, the wake system exhibits a regular helical structure that remains coherent even at great distances downstream. However, the far-field region presents the emergence of elliptical instabilities and tip vortex pairing. Irrespective of the loading conditions, the hub vortex structure of the propeller displays greater stability than the tip vortex structure.
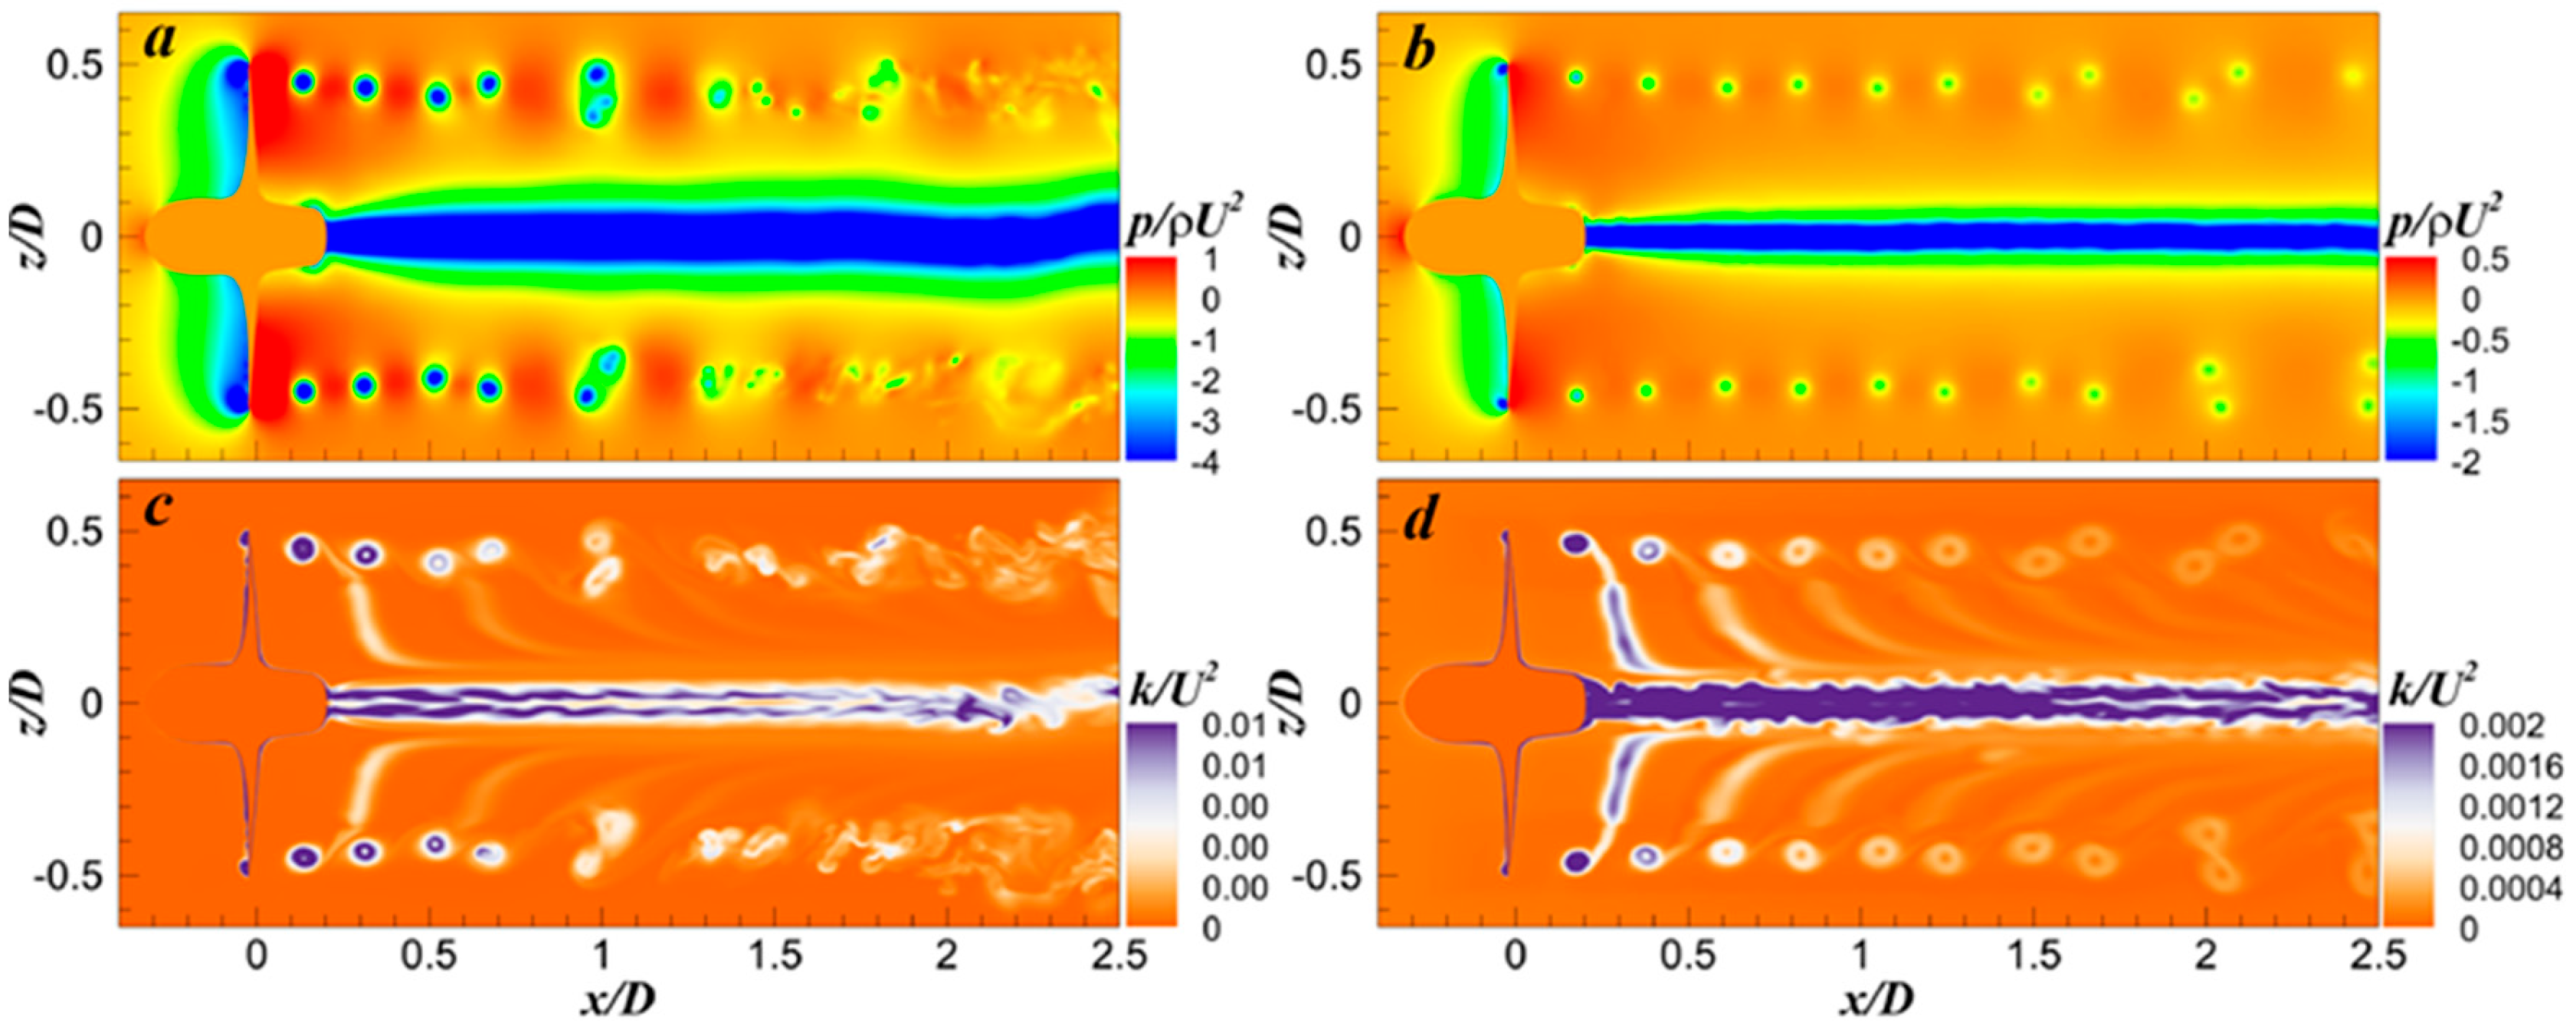
To better investigate the mechanism behind instantaneous propeller wakes, the turbulent kinetic energy (TKE) and the non-dimensional pressure are depicted in Figure 8. The intensity of the tip vortex cores can be inferred from the gradients of the pressure and turbulent kinetic energy. The tip vortex evolution can be identified from these physical quantities. For J = 0.38, the tip vortices represented by these two physical quantities experience contraction in the near field, which is consistent with what is described in Figure 6. Within the middle region of the wake, the mutual induction is pronounced, leading to pairing behavior. Interestingly, the vortex pair near x/D = 1 shows that the paring behavior characterizes one weak and one strong vortex and is accompanied by the diffusion process, which is more pronounced in the pressure field. Negative pressure in the propeller wake refers to pressure that is lower than the surrounding atmospheric pressure. This occurs due to the movement of the propeller blades, which displace water and create a flow pattern, resulting in areas of high pressure and low pressure (negative pressure). This is a key element in how propellers (and wings) generate lift, due to Bernoulli’s principle. In the wake of the propeller, this negative pressure can cause vortices. The negative pressure can draw surrounding water into these vortices, contributing to the overall wake turbulence experienced behind a propeller.
The TKE fields demonstrate that the energy within the wake decreases as it progresses. The instability emerges within the far-field region subsequent to the breakdown. When compared with heavy loading conditions, the case of J = 0.38 experiences a delayed pairing process. Despite this, the wake remains relatively stable and regular within both the near- and far-field regions. As two vortex pairs are formed within the far field, the pitch between adjacent vortices increases accordingly. It can be inferred that the tip vortices will not merge into one vortex because the increased pitch weakens the mutual inductance effect.
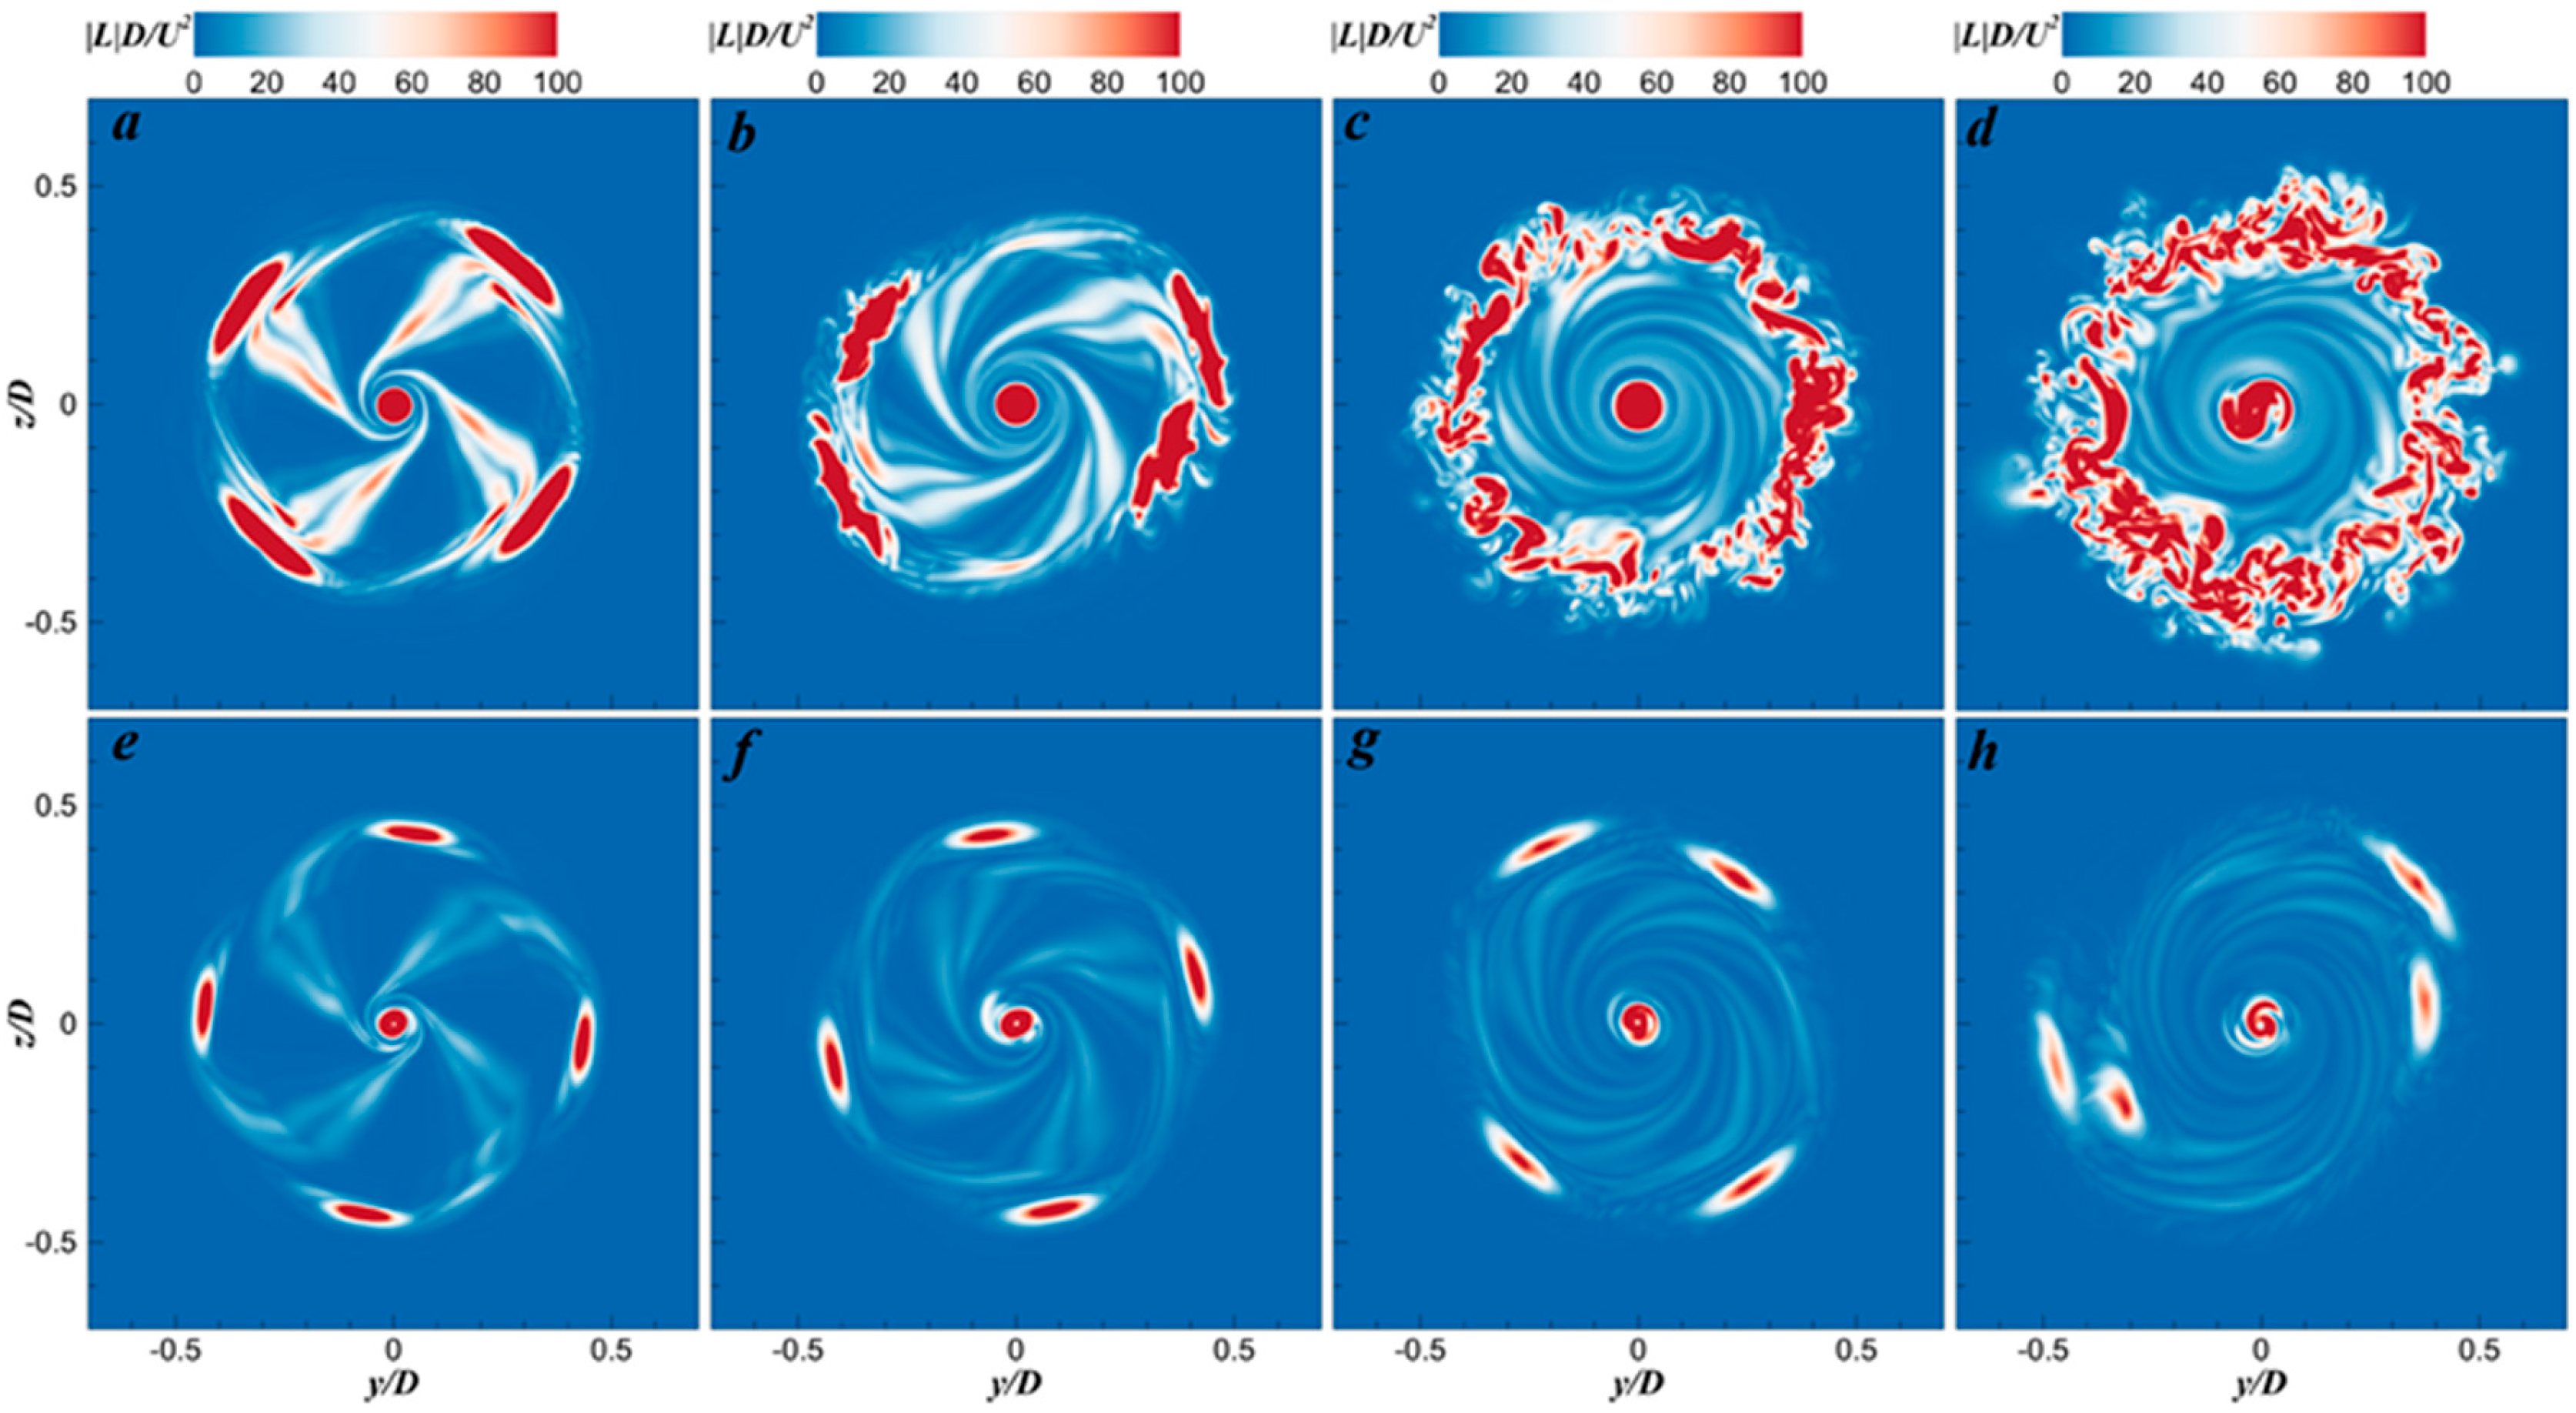
Figure 9 offers a comprehensive visual depiction of the wake. This representation is achieved by contouring the magnitude of the Lamb vector, providing a detailed insight into the intricate patterns formed. The near field exhibits local maxima indicating the signatures of vortices, with the latter being the most dominant feature throughout the wake. The wake distortion occurs at x/D = 0.8. In the far field, at x/D = 1.6 and 2.2, the four tip vortices become indistinguishable due to their instability motion, and they completely break down into small-scale vortices that tend to be evenly distributed circumferentially.
The magnitude of the Lamb vector decays faster downstream for J = 0.65. The vortex system displays a stable and simple topology in the downstream region, with the pairing of adjacent tip vortices causing circumferential diffusion and enhancing mutual induction effects.
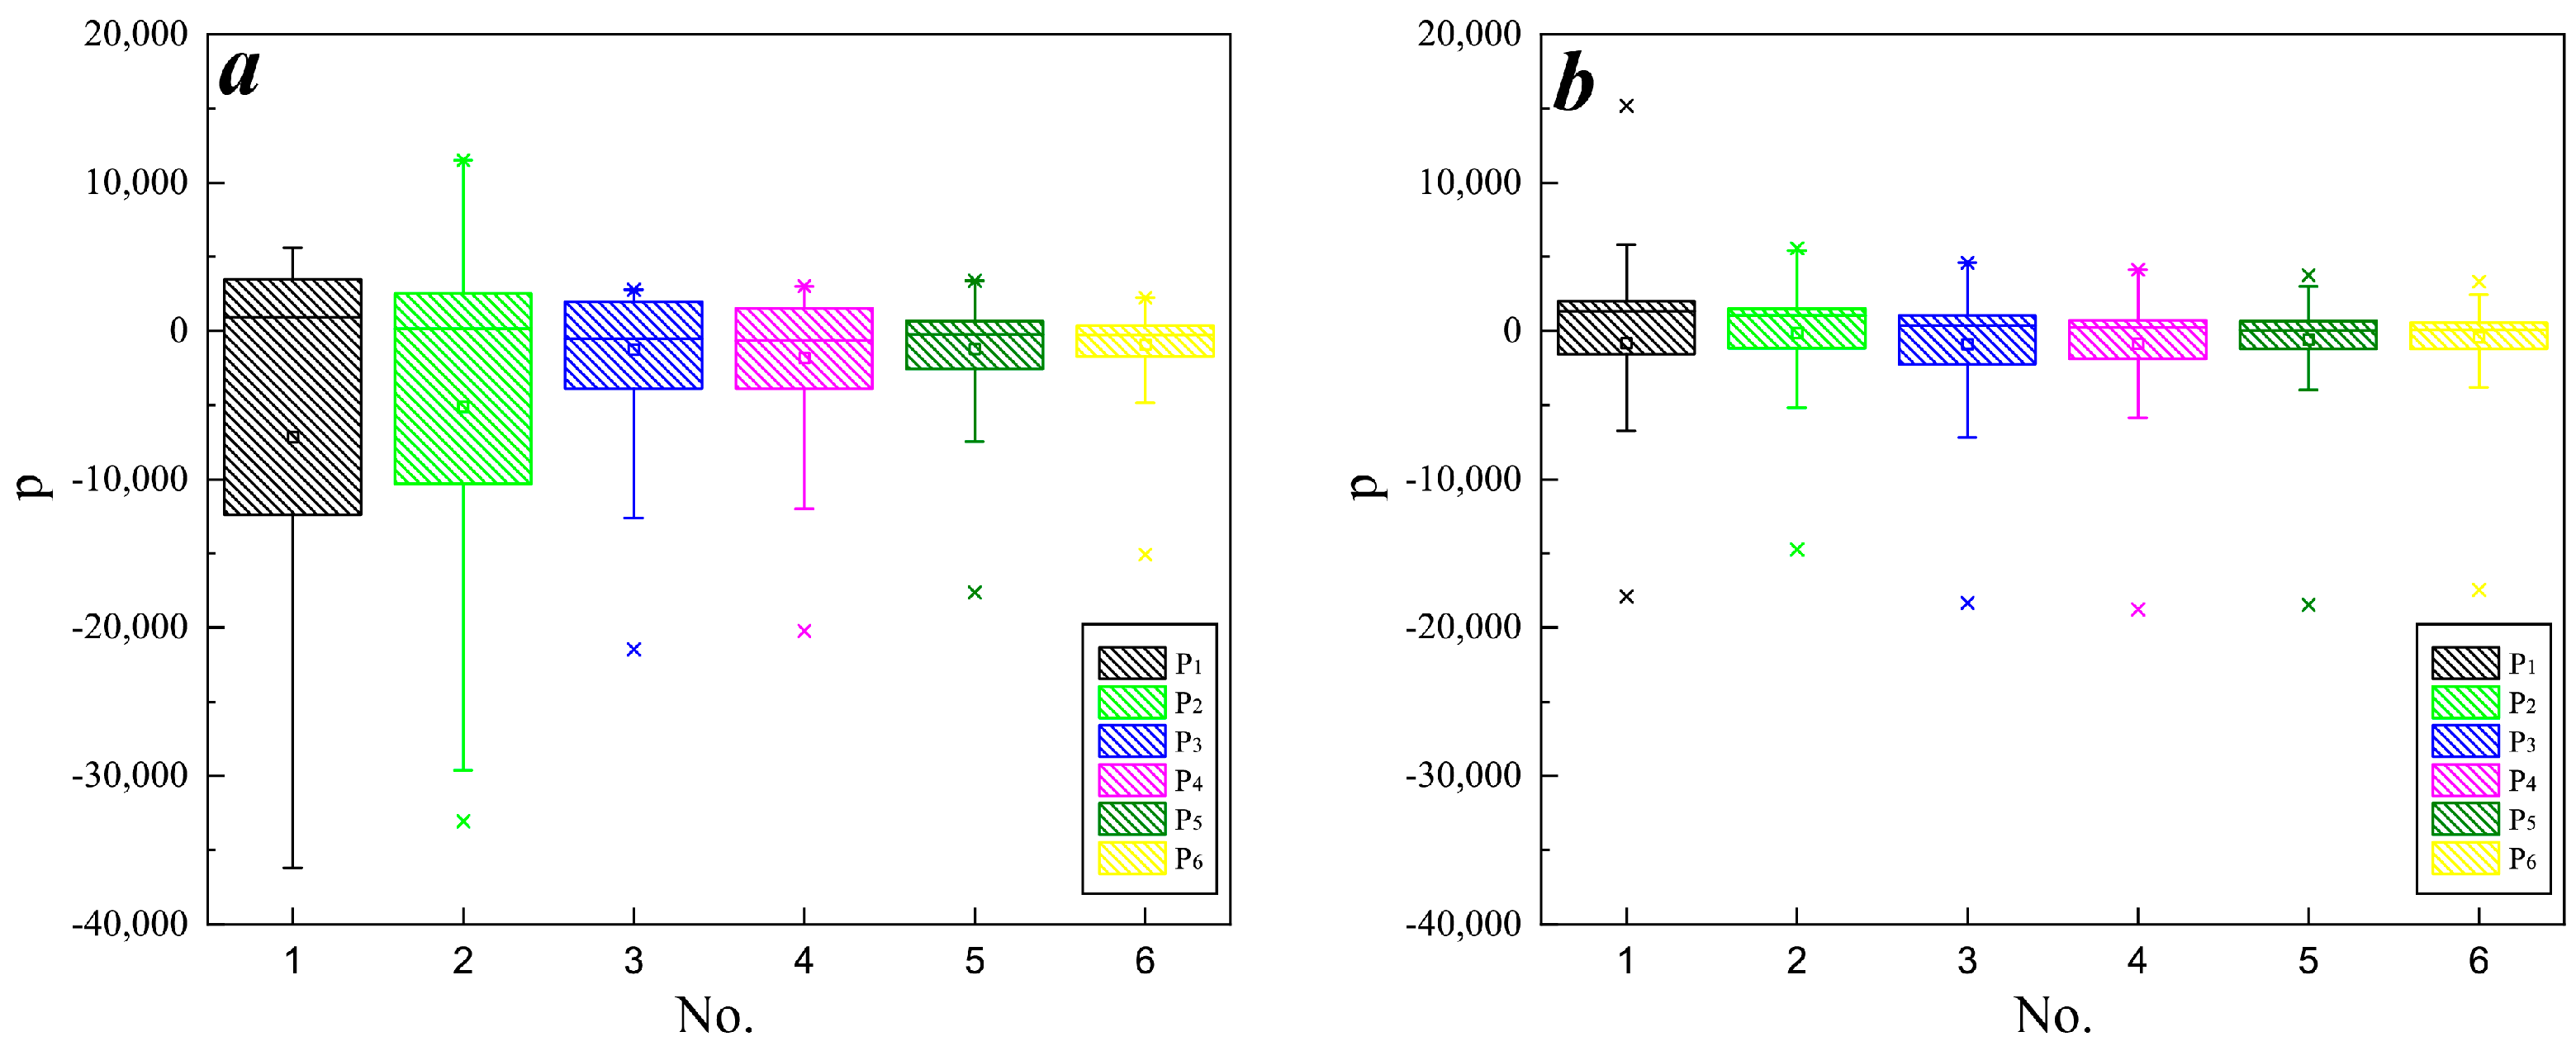
It should be noted that these probes are set in the trajectory of the wake to accurately capture the wake dynamics [49,50,51,52]. The pressure box plots recorded by typical probes for both advance coefficients are shown in Figure 10, which displays the fluctuations and mean values of the pressure signals. It can be observed that the mean values of pressure remain almost constant with the increasing downstream distance under both loading conditions, suggesting the persistence of the pressure during wake evolution. The probes in the downstream region record different fluctuations in pressure, which indicate different flow features. For J = 0.38, the fluctuation pressure is most significant in the near field at P1 and P2, where the tip vortices are of strong coherence and intensity. The largest pressure fluctuation occurs at P2, where the vortex pairing phenomenon is significant. However, the same location with the most remarkable pressure fluctuation is P3 for the light loading condition, where the pairing behavior takes place in Figure 9. The pressure fluctuations decrease with increasing downstream distance, which can be attributed to the loss of coherence in the vortex system.
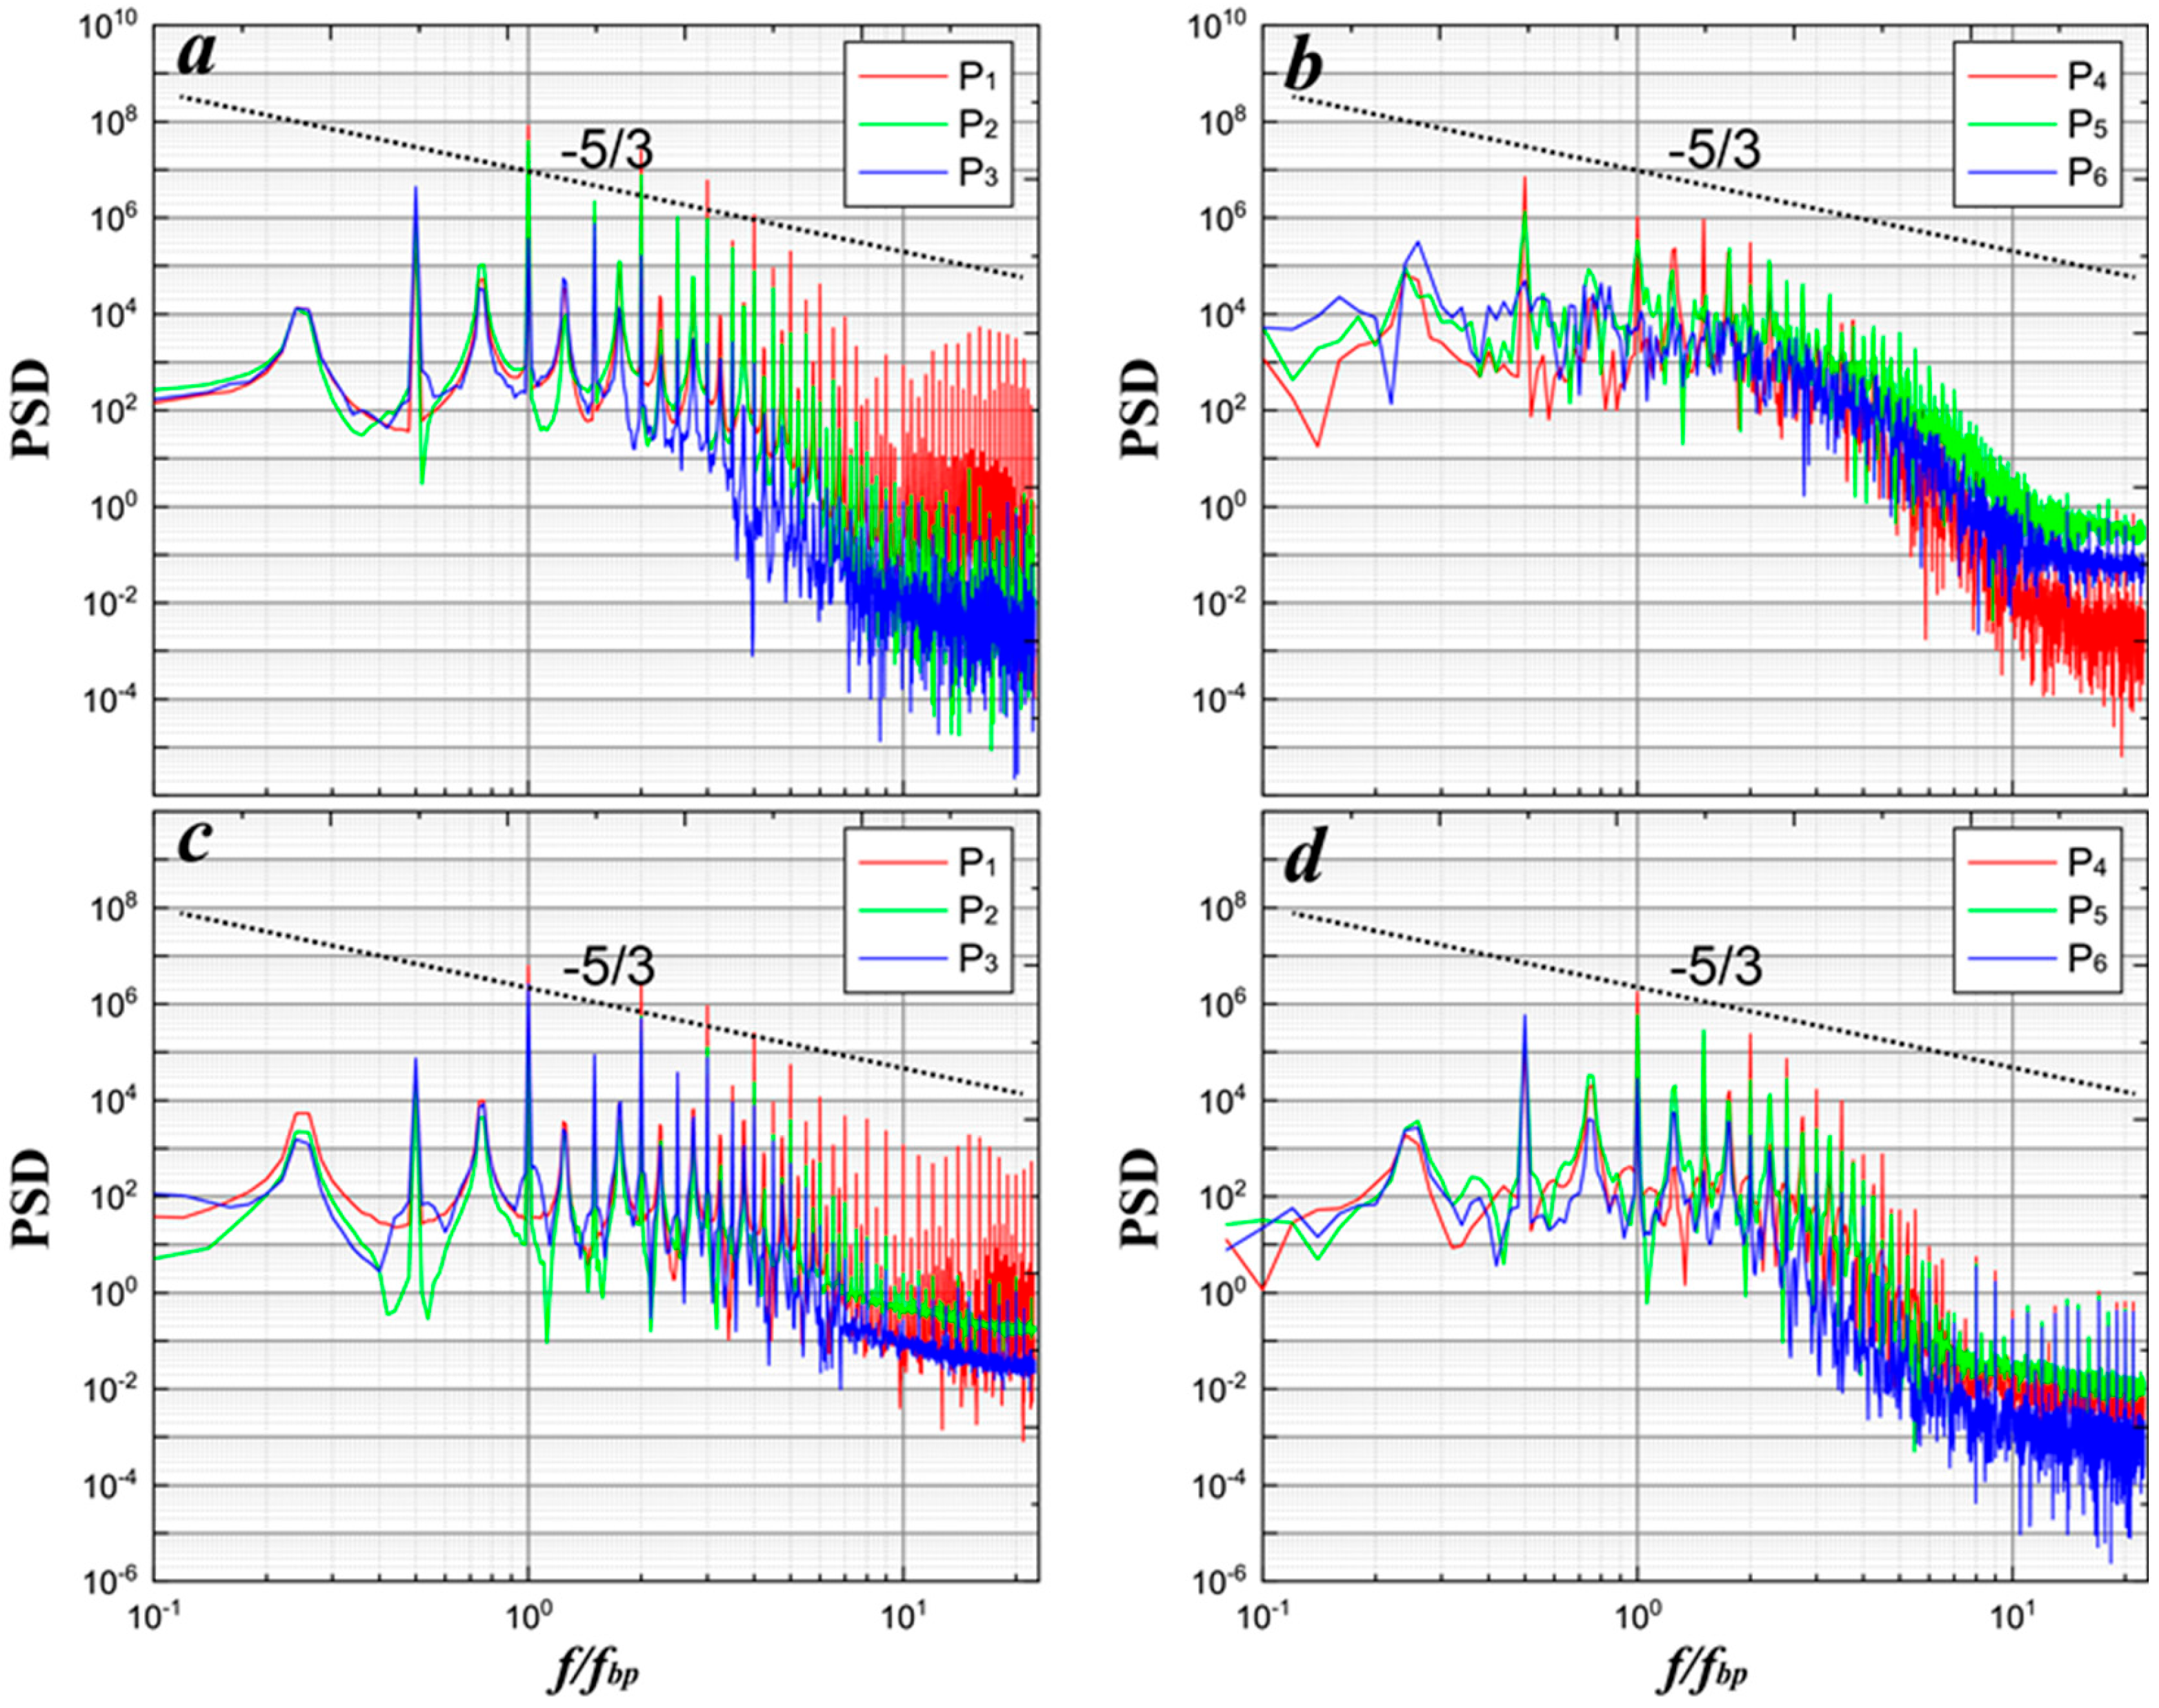
Figure 11 presents the power spectral densities (PSDs) of the pressure signals recorded at various probes downstream. The PSD analysis of the pressure signals provides valuable insights into the instabilities of the tip vortices [53,54,55,56]. Remarkably, the calculations accurately reproduce this slope, affirming the numerical methods’ reliability and the grid resolution’s ability. Notably, the amplitudes of the PSDs of the pressure signals gradually decrease with increasing downstream distance, irrespective of the loading conditions. In the near field, the PSD analysis reveals prominent peaks, indicating the higher coherence of the tip vortex system. However, as the downstream distance increases, the amplitudes of the PSDs gradually diminish, and the coherence diminishes as well. Under heavy loading conditions, the PSDs exhibit weaker and higher-order peaks compared to the light loading condition, suggesting an earlier loss of coherence in the tip vortex system. Moreover, as the vortex system evolves downstream, the dominant frequency transitions from the blade frequency to 0.5 fbp, signifying the occurrence of tip vortex pairing. This transition is observed at P2, which aligns with the conclusion presented in Figure 10.
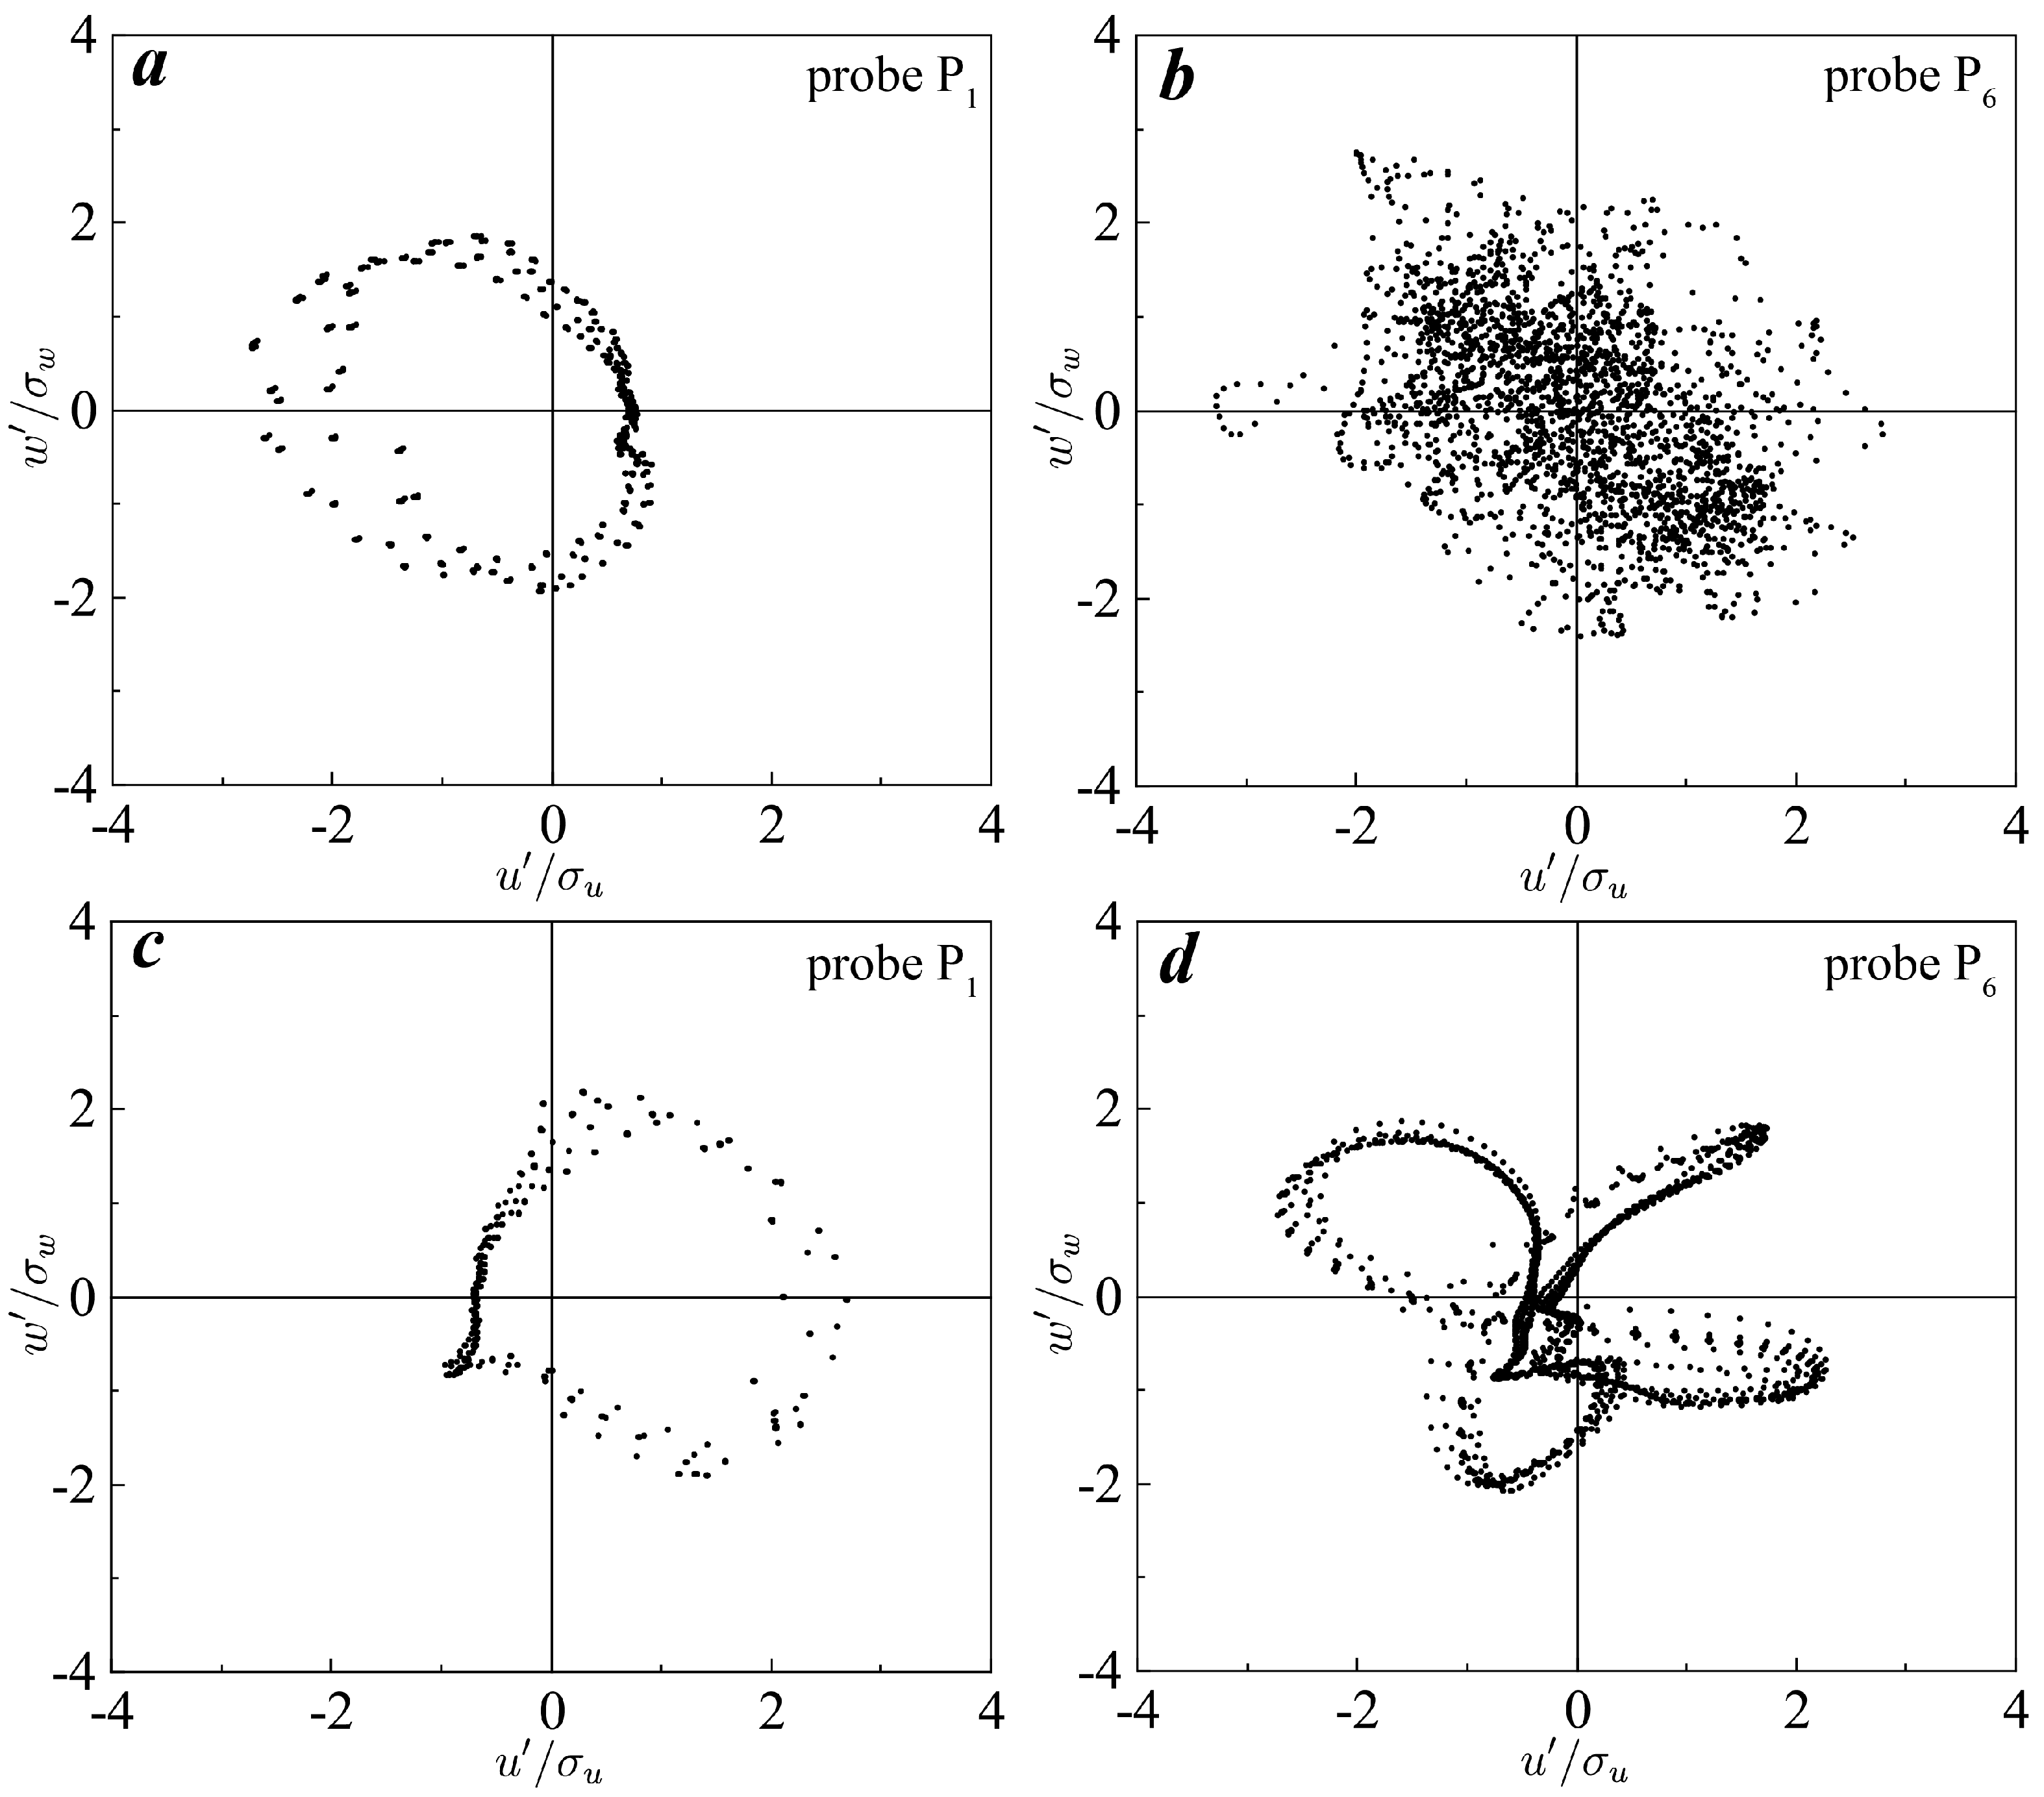
The velocity fluctuations’ statistics are analyzed. Figure 12 presents the joint probability density functions (PDFs) of the streamwise and vertical velocity fluctuations under different loading conditions. To examine the wake’s near and middle fields, velocity fluctuations at probes P1 and P6 are recorded. The velocity’s standard deviation is represented by σ. In the near field, the joint PDF distributions exhibit an ellipse-like pattern, with the major semiaxis oriented in the first and third quadrants. This pattern is due to the stable topology. Notably, the joint PDF distributions at P1 are highly concentrated due to the coherent structure. For the lower advance coefficient, the joint PDF distribution at P6 shows a broad range of scatter distribution, indicating the homogeneous distribution of the tip vortex after breakdown in the far field. However, the joint PDF distribution at P6 is still concentrated at some specific trajectories under the light loading condition, suggesting the tip vortices’ coherence.
A numerical simulation of the propeller wake under J = 0.88 is carried out. The grid system is refined within a 9D range downstream of the propeller, with a total grid count reaching 82.5 million, with the aim of further exploring the instability mechanisms of the full-field propeller wake.
Figure 13 depicts the instantaneous propeller wake vortex system at J = 0.88 as captured by the large eddy simulation. This visualization reveals the evolution of the propeller wake vortex structures from their genesis in the near field to their dispersion in the far field. The wake vortex system is primarily composed of four robust tip vortices along with a central hub vortex [57,58,59,60,61,62]. In the near field, the tip vortex exhibits a well-ordered topological structure marked by strong coherence. However, as the tip vortex advances downstream, it begins to show signs of short-wave instability within its structure. This instability, compounded by the growth of elliptic instability and secondary vortex structures, leads to the breakdown of the tip vortex system into smaller-scale vortices in the mid-field. This breakdown results in a rapid loss of coherence. In the far field, the tip vortex system becomes entirely discretized, with a tendency towards a homogeneous distribution. Meanwhile, the coherence of the hub vortex remains more consistent compared to the tip vortex. Following the disintegration of the tip vortex system, the hub vortex begins to exhibit significant instability motions, which are discernible as circumferential oscillating motions.
Figure 14 presents the contours of the instantaneous out-of-plane vorticity, axial velocity and pressure fields. The vorticity contours in Figure 14a illustrate the evolution trajectory of both the tip vortex and hub vortex. In the near field, where x/D is less than 2, the tip vortex is evenly distributed and maintains a relatively regular shape. Progressing to the region between 2 and 3.8 of x/D, the tip vortex becomes unstable, with its topology becoming distorted and deformed. The emergence of small-scale vortices around the tip vortex signifies the generation of secondary vortices, aligning with the phenomena observed in Figure 13. When x/D exceeds 4, the tip vortex has entirely broken down into small-scale vortex structures. Substantial destabilization of the hub vortex structure only occurs once x/D surpasses 5.4. The axial velocity contour in Figure 14b depicts a wake significantly accelerated by the propeller’s rotation. This acceleration of the flow induces a degree of contraction in the wake. It is worth noting that the axial velocity contour exhibits some radial diffusion in the far field, attributable to the destabilization of the downstream wake and energy dissipation. Lastly, Figure 14c provides data on the pressure field within the propeller wake, further highlighting the evolution of the tip and hub vortices. The pressure field also reveals the instability motion of the hub vortex following downstream destabilization, mirroring the phenomenon portrayed in Figure 13.
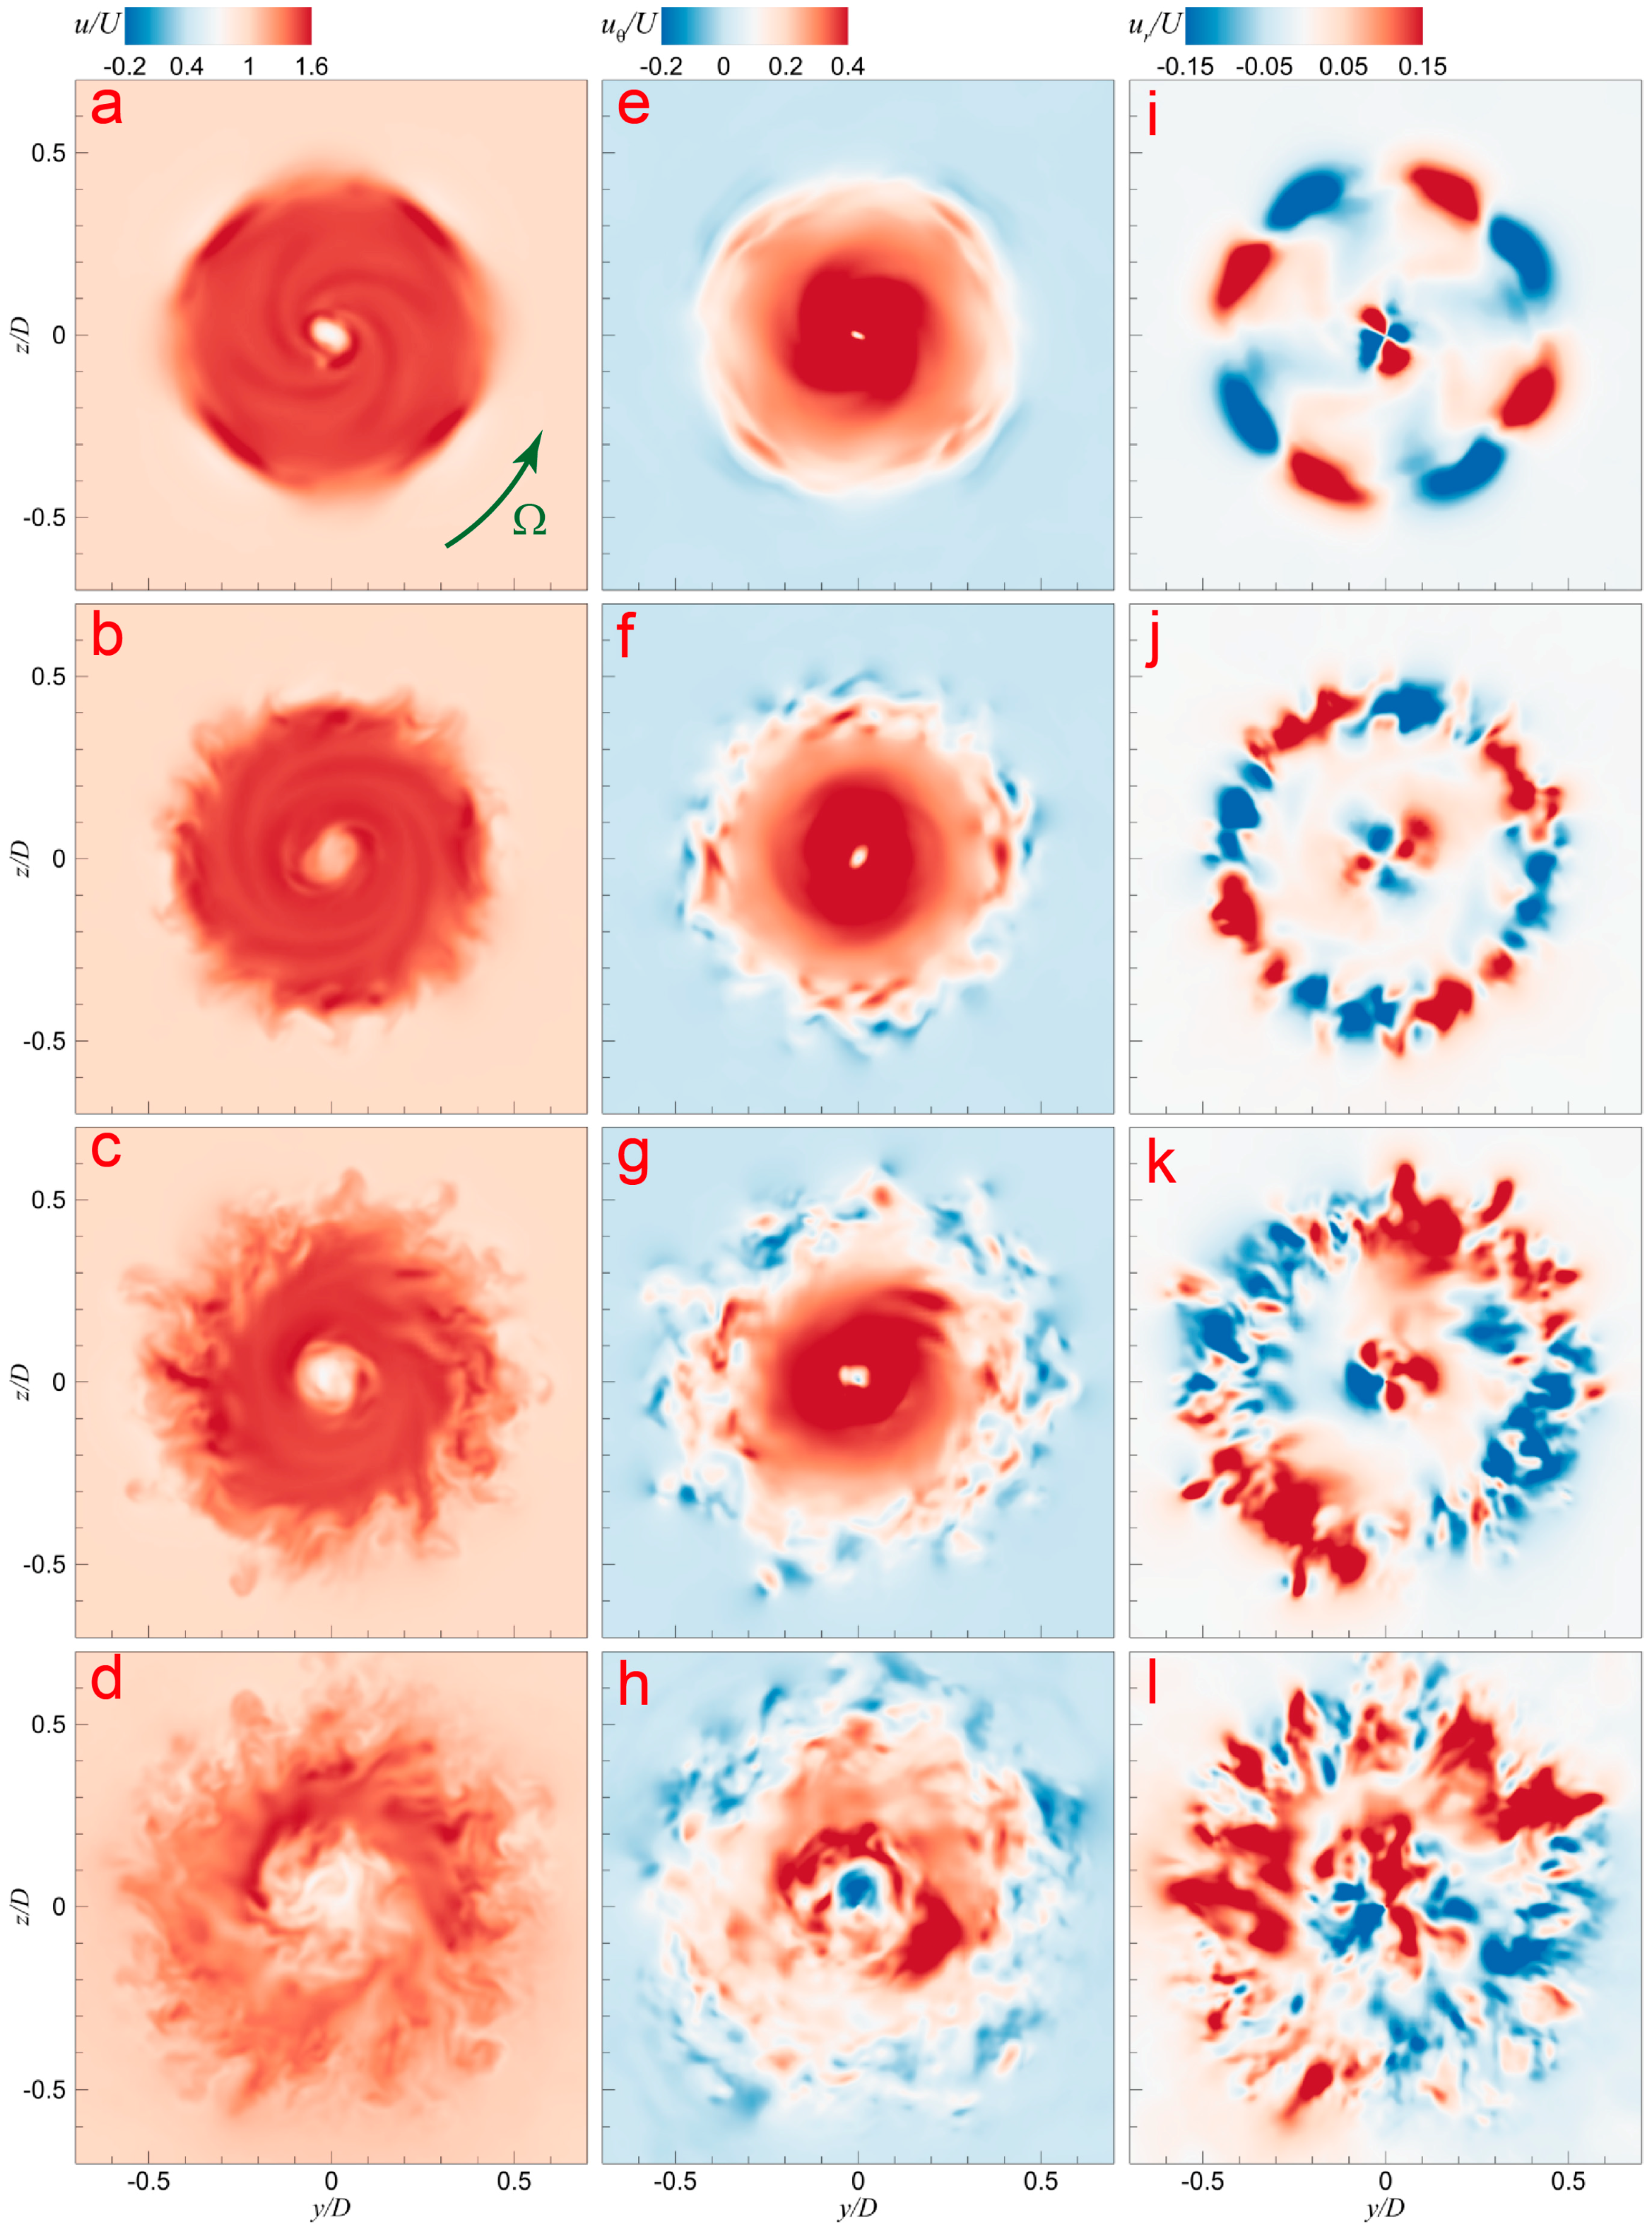
Figure 15 presents the instantaneous axial, azimuthal and radial velocities at various downstream locations, which contribute to a more profound understanding of the wake evolution’s flow dynamics. In the near field at x/D = 1, the wake displays a fairly regular topology, reflecting the local physical quantity distribution of the four tip vortices. These are uniformly distributed in the circumferential direction, signifying a coherent and relatively stable tip vortex topology. However, the trailing edge vortex is noticeable for its destabilization and distortion, especially evident in the streamwise velocity field. At the cross-section of x/D = 3, substantial viscous dissipation is visible within the wake field, and the intensity of each physical field is diminished. The trailing edge vortex distortion becomes more pronounced, most prominently in the axial velocity field. The occurrence of elliptical instability and the emergence of secondary vortices lead to the formation of small-scale turbulent structures surrounding the tip vortex. The primary tip vortex topology, destabilized due to turbulent perturbations and tip vortex mutual inductance effects, shows a non-uniform circumferential distribution. Despite this, the instability motion of the four tip vortices is not significant, and thus their radial positions remain stable. At the x/D = 5 cross-section, the tip vortex loses coherence due to the influence of the secondary vortex and elliptical instability. The radial instability motion of the tip vortex results in an irregular shape of the vortex system. Finally, at the x/D = 7 cross-section, the tip vortex system disintegrates into small-scale vortex structures. The tip vortex structures associated with each physical quantity are virtually completely discretized, with small-scale turbulent structures rapidly intermixing. This leads to a tendency for the wake system to distribute homogeneously in the far field.
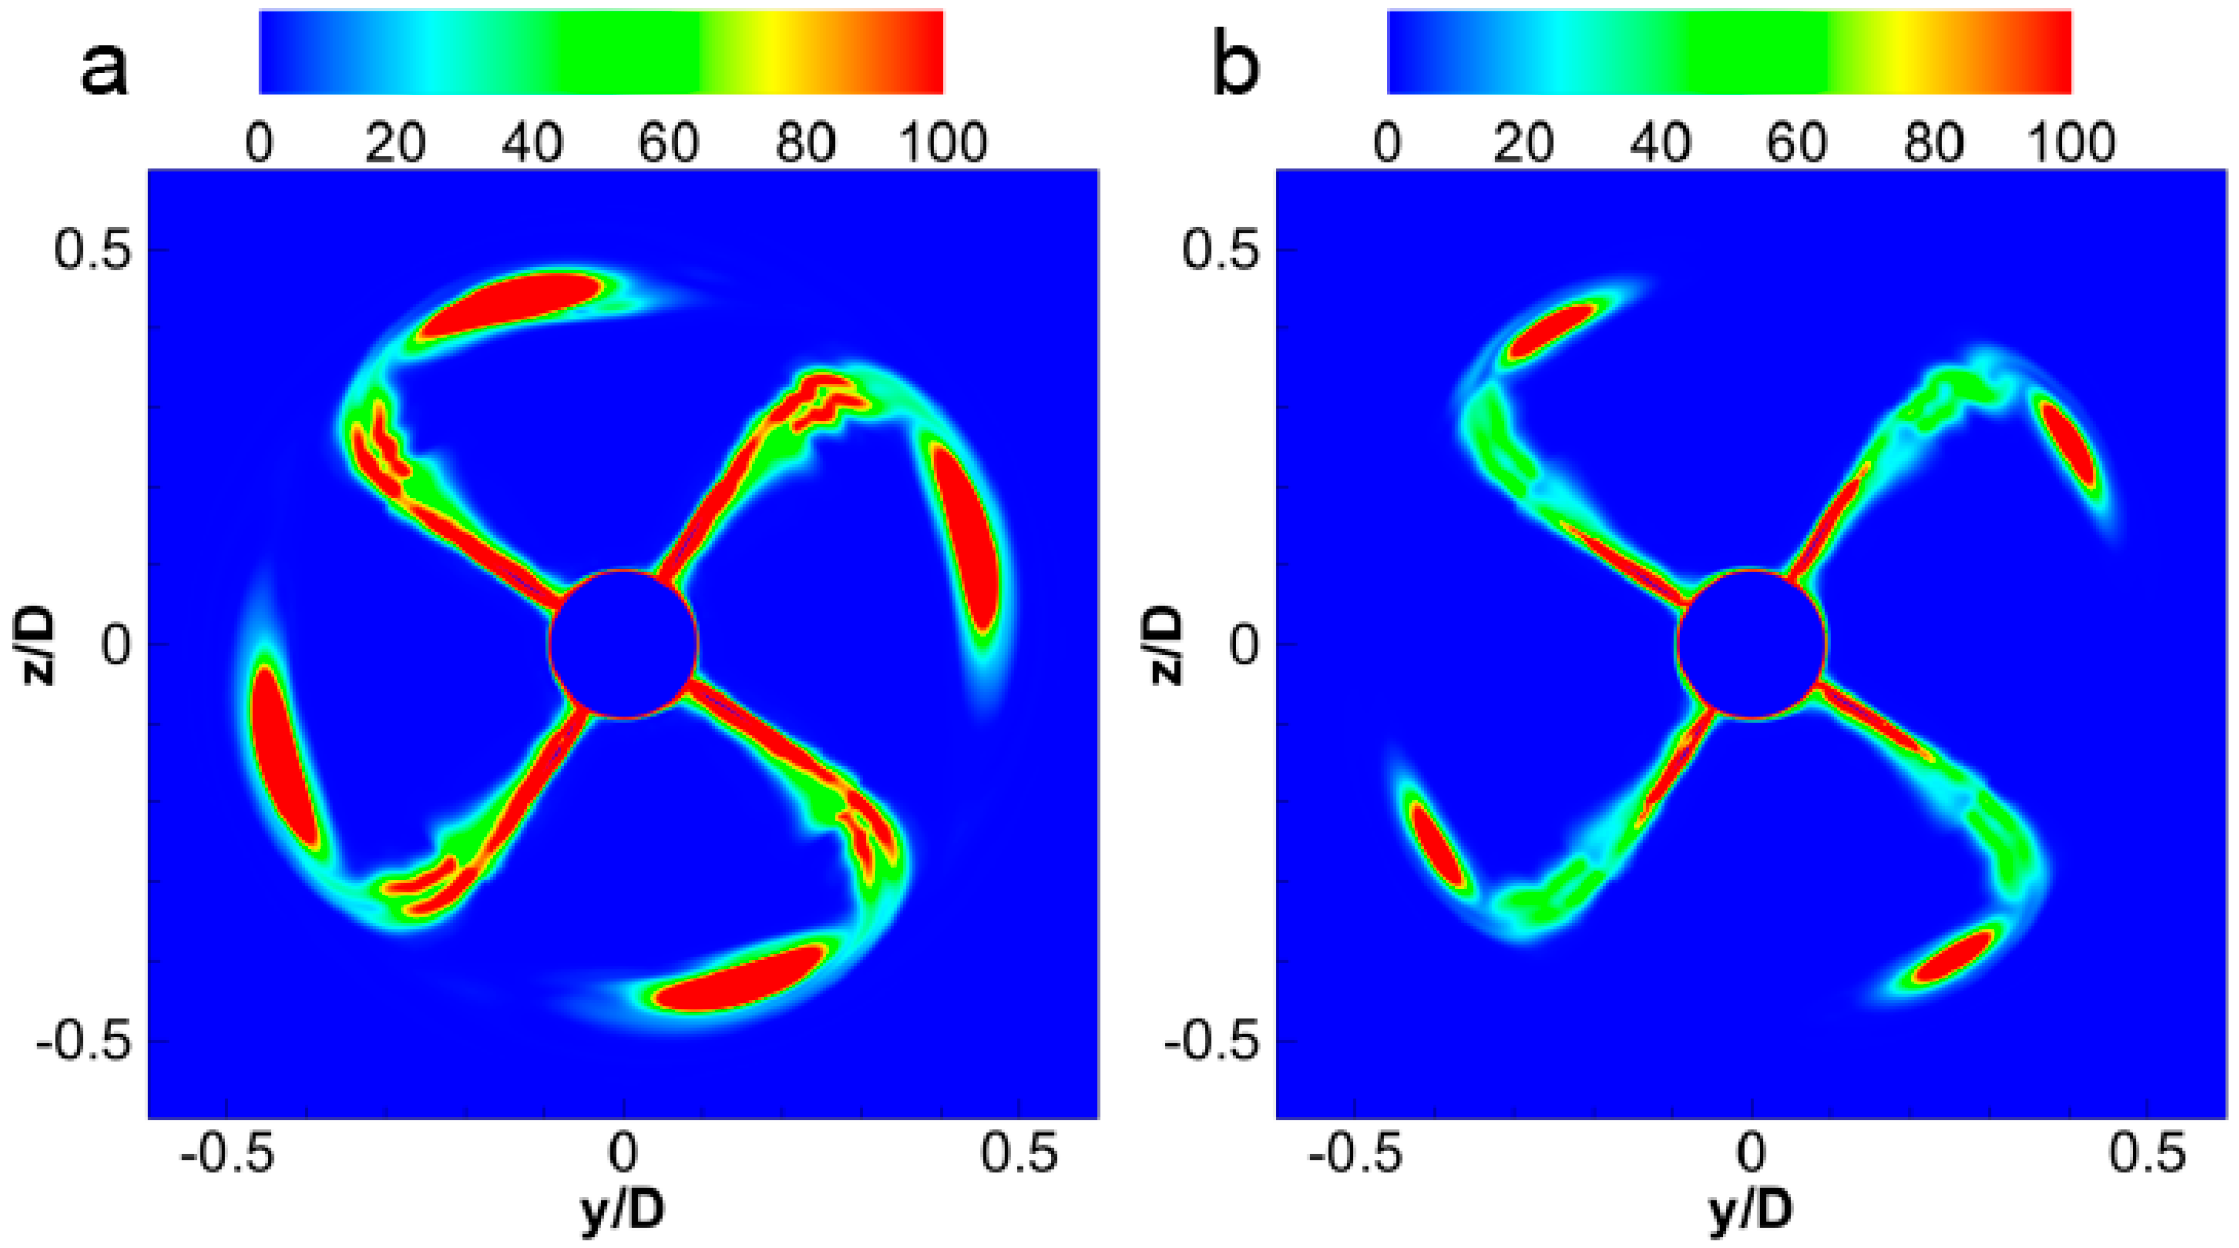
Figure 16 depicts contours demonstrating the magnitude of vorticity near the propeller blades under two distinct advance coefficient scenarios. These visual representations highlight the impact of the propeller geometry and its operational loading conditions on the distribution of vorticity within the wake. The vortex structures originating from the blade surface, evident in the contours, encompass tip vortices generated from the blade tips and trailing vortices produced from the blade trailing edges. These vortex formations demonstrate significant alignment with the geometric contours of the blade in the near-field region. Trailing vortices appear more pronounced at the blade root and less prominent at their intersection with the tip vortices. Under high-load scenarios, the vorticity magnitude and its distribution widen, consequently resulting in a more compressed pitch within the tip vortex system.

5. Discussions

The improvement of propeller wakes through propeller design, consequently enhancing various aspects of propeller performance, is an intricate and comprehensive issue. It requires the consideration of interrelated physical mechanisms, such as the evolution of the propeller wake and its association with propeller cavitation, noise, etc. The improvement of propeller wake behavior through propeller design may be contemplated from the following perspectives.
(1)
The first step in improving the flow behavior is understanding the existing flow patterns and challenges.
(2)
Improvements in propeller design can have a profound impact on flow behavior. Key considerations include the following.
(a)
Blade Shape: Modifying the shape of the blades can alter the flow patterns to reduce turbulence and cavitation. Airfoil profiling and chord distribution can be adjusted to enhance the flow.
(b)
Blade Number: Increasing or decreasing the number of blades can affect the flow pattern and efficiency, but this needs to be optimized for specific applications. Increasing the number of propeller blades can augment the pitch of the tip vortex system, thereby attenuating the mutual inductive effects between adjacent tip vortices and consequently delaying the breakdown of the wake vortex system behind the propeller.
(c)
Pitch Control: Adjusting the pitch of the blades (either fixed or variable pitch) can give better control over the flow behavior across different operating conditions.
(d)
Tip Design: Modifying the tips of the propellers, such as adding winglets, can reduce the tip vortices and energy loss, thus reducing drag and improving efficiency.
(e)
Material Selection: Choosing materials that resist cavitation damage and provide the desired flexibility and strength.
(f)
Surface Roughness: Polishing or applying coatings to reduce the surface roughness can minimize friction and turbulent flow.

6. Conclusions

In this study, the mechanisms that contribute to the destabilization of a propeller wake under two distinct loading conditions were studied. The hydrodynamic characteristics of the wake through the downstream pressure distribution, Lamb vector magnitude, pressure signals in the time and frequency domains and turbulence energy distribution were explored. The simulations provided accurate predictions of forces and moments, along with phase-averaged statistics of the streamwise velocity, which aligned well with the existing literature data. Additionally, the calculations exhibited a −5/3 slope, as predicted by Kolmogorov theory, indicating the faithful representation of the fluid behavior across a broad range of scales and frequencies. The key conclusions are summarized as follows.
(1)
Tip vortices emerge as the dominant structures within the propeller wake, surpassing all others. The pairing of adjacent tip vortices coincides with the circumferential diffusion of vortices, leading to enhanced mutual induction effects.
(2)
The instability, compounded by the growth of elliptic instability and secondary vortex structures, leads to the breakdown of the tip vortex system into smaller-scale vortices in the mid-field. This breakdown results in a rapid loss of coherence.
(3)
In the far field, the tip vortex system becomes entirely discretized, with a tendency towards a homogeneous distribution. Meanwhile, the coherence of the hub vortex remains more consistent compared to the tip vortex.
This study significantly enhances the understanding of the complex processes involved. This newfound knowledge is valuable for the design and optimization of marine propellers, allowing for improved efficiency and performance in various operational scenarios. Future research should focus on the vortex–cavitation interaction in propeller cavitation wakes, which is commonly encountered in blunt body flow around hydraulic machinery and marine propellers. This two-phase flow problem involving the interaction of cavitation with turbulence is a cutting-edge fundamental issue in fluid mechanics.

Author Contributions

Conceptualization, D.Y., L.W. and H.L.; funding acquisition, D.Y.; methodology, D.Y. and H.L.; project administration, D.Y.; writing—original draft, D.Y.; writing—review and editing, L.W. and M.C. All authors have read and agreed to the published version of the manuscript.

Funding

This research was funded by the National Key Research and Development Program of China (Grant No. 2022YFD2401101), the Program of Qingdao National Laboratory for Marine Science and Technology (Grant No. 2021WHZZB1301), the Marine S&T Fund of Shandong Province for Qingdao Marine Science and Technology Center (Grant No. 2022QNLM030001-3) and the Central Public Interest Scientific Institution Basal Research Fund, YSFRI, Chinese Academy of Fisheries Science (Grant No. 2021YJS005).

Institutional Review Board Statement

Not applicable.

Informed Consent Statement

Not applicable.

Data Availability Statement

The data that support the findings of this study are available within the article.

Conflicts of Interest

The authors declare no conflict of interest.

References

  1. Deng, R.; Zhang, Z.; Luo, F.; Sun, P.; Wu, T. Investigation on the Lift Force Induced by the Interceptor and Its Affecting Factors: Experimental Study with Captive Model. J. Mar. Sci. Eng. 2022, 10, 211. [Google Scholar] [CrossRef]
  2. Deng, R.; Song, Z.; Ren, H.; Li, H.; Wu, T. Investigation on the effect of container configurations and forecastle fairings on wind resistance and aerodynamic performance of large container ships. Eng. Appl. Comp. Fluid Mech. 2022, 16, 1279–1304. [Google Scholar] [CrossRef]
  3. Gong, J.; Luo, W.Z.; Wu, T.C.; Zhang, Z.Y. Numerical analysis of vortex and cavitation dynamics of an axial-flow pump. Eng. Appl. Comp. Fluid Mech. 2022, 16, 1921–1938. [Google Scholar] [CrossRef]
  4. Ha, J.; Park, J.; Park, G.; Kim, J.; Kim, J.; Seo, J.; Rhee, S.H. Experimental study on the propulsion performance of a partially submerged propeller. Int. J. Nav. Archit. Ocean Eng. 2023, 15, 100516. [Google Scholar] [CrossRef]
  5. Song, K.; Guo, C.; Sun, C.; Wang, C.; Gong, J.; Li, P.; Wang, L. Simulation strategy of the full-scale ship resistance and propulsion performance. Eng. Appl. Comp. Fluid Mech. 2021, 15, 1321–1342. [Google Scholar] [CrossRef]
  6. Wang, L.Z.; Guo, C.Y.; Su, Y.M.; Wu, T.C. A numerical study on the correlation between the evolution of propeller trailing vortex wake and skew of propellers. Int. J. Nav. Archit. Ocean Eng. 2018, 10, 212–224. [Google Scholar] [CrossRef]
  7. Deng, T.; Chen, Z.; Fu, J.Y.; Li, Y. An improved inflow turbulence generator for large eddy simulation evaluation of wind effects on tall buildings. Eng. Appl. Comp. Fluid Mech. 2023, 17, e2155704. [Google Scholar] [CrossRef]
  8. Kan, K.; Xu, Y.; Li, Z.; Xu, H.; Chen, H.; Zi, D.; Shen, L. Numerical study of instability mechanism in the air-core vortex formation process. Eng. Appl. Comp. Fluid Mech. 2023, 17, 2156926. [Google Scholar] [CrossRef]
  9. Li, T.; Liang, H.; Zhang, J.; Zhang, J. Numerical study on aerodynamic resistance reduction of high-speed train using vortex generator. Eng. Appl. Comp. Fluid Mech. 2023, 17, e2153925. [Google Scholar] [CrossRef]
  10. Pan, Y.C.; Zhang, H.X.; Zhou, Q.D. Numerical simulation of unsteady propeller force for a submarine in straight ahead sailing and steady diving maneuver. Int. J. Nav. Archit. Ocean Eng. 2019, 11, 899–913. [Google Scholar] [CrossRef]
  11. Yin, G.; Ong, M.C.; Zhang, P. Numerical investigations of pipe flow downstream a flow conditioner with bundle of tubes. Eng. Appl. Comp. Fluid Mech. 2023, 17, e2154850. [Google Scholar] [CrossRef]
  12. Bontempo, R.; Manna, M. Actuator disc methods for open propellers: Assessments of numerical methods. Eng. Appl. Comp. Fluid Mech. 2017, 11, 42–53. [Google Scholar] [CrossRef]
  13. Ni, S.; Zhao, G.; Chen, Y.; Cao, H.; Jiang, C.; Zhou, W.; Tao, Y.; Shuai, Z. Modulation effect on rotor-stator interaction subjected to fluctuating rotation speed in a centrifugal pump. Eng. Appl. Comp. Fluid Mech. 2023, 17, 2163703. [Google Scholar] [CrossRef]
  14. Paik, K.J.; Hwang, S.; Jung, J.; Lee, T.; Lee, Y.Y.; Ahn, H.; Van, S.H. Investigation on the wake evolution of contra-rotating propeller using RANS computation and SPIV measurement. Int. J. Nav. Archit. Ocean Eng. 2015, 7, 595–609. [Google Scholar] [CrossRef]
  15. Shin, H.W.; Paik, K.J.; Jang, Y.H.; Eom, M.J.; Lee, S. A numerical investigation on the nominal wake of KVLCC2 model ship in regular head waves. Int. J. Nav. Archit. Ocean Eng. 2020, 12, 270–282. [Google Scholar] [CrossRef]
  16. Jiang, J.; Cai, H.; Ma, C.; Qian, Z.; Chen, K.; Wu, P. A ship propeller design methodology of multi-objective optimization considering fluid–structure interaction. Eng. Appl. Comp. Fluid Mech. 2018, 12, 28–40. [Google Scholar] [CrossRef]
  17. Wang, Q.; Jiang, Z.; Zhang, Q. Regionalized actuator disk model designed by optimization method for propeller slipstream computation. Eng. Appl. Comp. Fluid Mech. 2014, 8, 127–139. [Google Scholar] [CrossRef]
  18. Zhao, S.; Li, J.; Jiang, Y.; Qian, R.; Xu, R. Investigation of propeller slipstream effects on lateral and directional static stability of transport aircraft. Eng. Appl. Comp. Fluid Mech. 2022, 16, 551–569. [Google Scholar] [CrossRef]
  19. Di Felice, F.; Di Florio, D.; Felli, M.; Romano, G.P. Experimental investigation of the propeller wake at different loading conditions by particle image velocimetry. J. Ship Res. 2004, 48, 168–190. [Google Scholar] [CrossRef]
  20. Felli, M.; Camussi, R.; Di Felice, F. Mechanisms of evolution of the propeller wake in the transition and far fields. J. Fluid Mech. 2011, 682, 5–53. [Google Scholar] [CrossRef]
  21. Felli, M.; Falchi, M. Propeller tip and hub vortex dynamic from the near to the very far field by time-resolved PIV measurements. In Proceedings of the 33rd Symposium on Naval Hydrodynamics, Osaka, Japan, 31 May–5 June 2020; Volume 136. [Google Scholar]
  22. Wang, L.; Martin, J.E.; Felli, M.; Carrica, P.M. Experiments and CFD for the propeller wake of a generic submarine operating near the surface. Ocean Eng. 2020, 206, 107304. [Google Scholar] [CrossRef]
  23. Friedhoff, B.; Roettig, F.; Wennemar, K.; Hoyer, K.; Beslac, R.; Hesseling, C.; Beck, T. Comparison of stereoscopic particle image velocimetry and volumetric particle tracking velocimetry in the wake of a ducted propeller. Ocean Eng. 2021, 234, 109291. [Google Scholar] [CrossRef]
  24. Kumar, P.; Mahesh, K. Large eddy simulation of propeller wake instabilities. J. Fluid Mech. 2017, 814, 361–396. [Google Scholar] [CrossRef]
  25. Sun, P.; Pan, L.; Liu, W.; Zhou, J.; Zhao, T. Wake Characteristic Analysis of a Marine Propeller under Different Loading Conditions in Coastal Environments. J. Coast. Res. 2022, 38, 613–623. [Google Scholar] [CrossRef]
  26. Posa, A.; Broglia, R. Spanwise distribution of the loads on a hydrofoil working in the wake of an upstream propeller. Ocean Eng. 2022, 264, 112542. [Google Scholar] [CrossRef]
  27. Di Mascio, A.; Dubbioso, G.; Muscari, R. Vortex structures in the wake of a marine propeller operating close to a free surface. J. Fluid Mech. 2022, 949, A33. [Google Scholar] [CrossRef]
  28. Posa, A. Dependence of tip and hub vortices shed by a propeller with winglets on its load conditions. Phys. Fluids 2022, 34, 105107. [Google Scholar] [CrossRef]
  29. Wang, L.; Guo, C.; Su, Y.; Xu, P.; Wu, T. Numerical analysis of a propeller during heave motion in cavitating flow. Appl. Ocean Res. 2017, 66, 131–145. [Google Scholar] [CrossRef]
  30. Magionesi, F.; Dubbioso, G.; Muscari, R.; Di Mascio, A. Modal analysis of the wake past a marine propeller. J. Fluid Mech. 2018, 855, 469–502. [Google Scholar] [CrossRef]
  31. Zhou, J.; Sun, P.; Pan, L. Modal Analysis of the Wake Instabilities of a Propeller Operating in Coastal Environments. J. Coast. Res. 2022, 38, 1163–1171. [Google Scholar] [CrossRef]
  32. Posa, A.; Balaras, E. A numerical investigation of the wake of an axisymmetric body with appendages. J. Fluid Mech. 2016, 792, 470–498. [Google Scholar] [CrossRef]
  33. Wang, C.; Li, P.; Guo, C.; Wang, L.; Sun, S. Numerical research on the instabilities of CLT propeller wake. Ocean Eng. 2022, 243, 110305. [Google Scholar] [CrossRef]
  34. Posa, A.; Broglia, R.; Felli, M.; Falchi, M.; Balaras, E. Characterization of the wake of a submarine propeller via large-eddy simulation. Comput. Fluids 2019, 184, 138–152. [Google Scholar] [CrossRef]
  35. Carrica, P.M.; Wilson, R.V.; Noack, R.W.; Stern, F. Ship motions using single-phase level set with dynamic overset grids. Comput. Fluids 2007, 36, 1415–1433. [Google Scholar] [CrossRef]
  36. Wang, L.; Guo, C.; Wan, L.; Su, Y. Numerical analysis of propeller during heave motion near a free surface. Mar. Technol. Soc. J. 2017, 51, 40–51. [Google Scholar]
  37. Wang, L.; Guo, C.; Su, Y.; Wu, T.; Wang, S. Numerical study of the viscous flow field mechanism for a non-geosim model. J. Coast. Res. 2017, 33, 684–698. [Google Scholar]
  38. Wang, L.; Guo, C.; Su, Y.; Zhang, D. Numerical study of the propeller-induced exciting force under the open freedom condition. J. Harbin Eng. Univ. 2017, 38, 822–828. [Google Scholar]
  39. Wang, L.; Wu, T.; Gong, J.; Yang, Y. Numerical simulation of the wake instabilities of a propeller. Phys. Fluids 2021, 33, 125125. [Google Scholar] [CrossRef]
  40. Wang, L.; Wu, T.; Gong, J.; Yang, Y. Numerical analysis of the wake dynamics of a propeller. Phys. Fluids 2021, 33, 095120. [Google Scholar] [CrossRef]
  41. Wang, L.; Luo, W.; Li, M. Numerical investigation of a propeller operating under different inflow conditions. Phys. Fluids 2022, 34, 105118. [Google Scholar] [CrossRef]
  42. Wang, L.; Liu, X.; Wu, T. Modal analysis of the propeller wake under the heavy loading condition. Phys. Fluids 2022, 34, 055107. [Google Scholar] [CrossRef]
  43. Wang, L.; Liu, X.; Wang, N.; Li, M. Propeller wake instabilities under turbulent-inflow conditions. Phys. Fluids 2022, 34, 085108. [Google Scholar] [CrossRef]
  44. Wang, L.; Liu, X.; Chao, X.; Guo, J.; Liao, J. Modeling of wake features of a propeller using the vorticity confinement method. Phys. Fluids 2023, 35, 075134. [Google Scholar] [CrossRef]
  45. Wang, L.; Guo, C.; Xu, P.; Su, Y. Analysis of the wake dynamics of a propeller operating before a rudder. Ocean Eng. 2019, 188, 106250. [Google Scholar] [CrossRef]
  46. Salvatore, F.; Testa, C.; Ianniello, S.; Pereira, F. Theoretical modelling of unsteady cavitation and induced noise. In Proceedings of the CAV 2006 Symposium, Wageningen, The Netherlands, 11–15 September 2006; pp. 1–13. [Google Scholar]
  47. Gong, J.; Ding, J.; Wang, L. Propeller–duct interaction on the wake dynamics of a ducted propeller. Phys. Fluids 2021, 33, 074102. [Google Scholar] [CrossRef]
  48. Muscari, R.; Di Mascio, A.; Verzicco, R. Modeling of vortex dynamics in the wake of a marine propeller. Comput. Fluids 2013, 73, 65–79. [Google Scholar] [CrossRef]
  49. Sun, C.; Wang, L. Modal analysis of propeller wake dynamics under different inflow conditions. Phys. Fluids 2022, 34, 125109. [Google Scholar] [CrossRef]
  50. Guo, C.Y.; Xu, P.; Wang, C.; Wang, L.Z.; Zhang, C.S. Influence of ice size parameter variation on hydrodynamic performance of podded propulsor. China Ocean Eng. 2020, 34, 30–45. [Google Scholar] [CrossRef]
  51. Zhou, Y.; Pavesi, G.; Yuan, J.; Fu, Y.; Gao, Q. Effects of duct profile parameters on flow characteristics of pump-jet: A numerical analysis on accelerating and decelerating ducts distinguished by cambers and angles of attack. Ocean Eng. 2023, 281, 114733. [Google Scholar] [CrossRef]
  52. Felli, M. Underlying mechanisms of propeller wake interaction with a wing. J. Fluid Mech. 2021, 908, A10. [Google Scholar] [CrossRef]
  53. Felli, M.; Guj, G.; Camussi, R. Effect of the number of blades on propeller wake evolution. Exp. Fluids 2008, 44, 409–418. [Google Scholar] [CrossRef]
  54. Felli, M.; Di Felice, F.; Guj, G.; Camussi, R. Analysis of the propeller wake evolution by pressure and velocity phase measurements. Exp. Fluids 2006, 41, 441–451. [Google Scholar] [CrossRef]
  55. Di Mascio, A.; Muscari, R.; Dubbioso, G. On the wake dynamics of a propeller operating in drift. J. Fluid Mech. 2014, 754, 263–307. [Google Scholar] [CrossRef]
  56. Felli, M.; Falchi, M. Propeller wake evolution mechanisms in oblique flow conditions. J. Fluid Mech. 2018, 845, 520–559. [Google Scholar] [CrossRef]
  57. Wang, L.; Liu, X.; Wang, N.; Li, M. Modal analysis of propeller wakes under different loading conditions. Phys. Fluids 2022, 34, 065136. [Google Scholar] [CrossRef]
  58. Heydari, M.; Sadat-Hosseini, H. Analysis of propeller wake field and vortical structures using k − ω SST Method. Ocean Eng. 2020, 204, 107247. [Google Scholar] [CrossRef]
  59. Wang, L.; Guo, C.; Wang, C.; Xu, P. Modified phase average algorithm for the wake of a propeller. Phys. Fluids 2021, 33, 035146. [Google Scholar] [CrossRef]
  60. Zhang, W.; Ning, X.; Li, F.; Guo, H.; Sun, S. Vibrations of simplified rudder induced by propeller wake. Phys. Fluids 2021, 33, 083618. [Google Scholar] [CrossRef]
  61. Posa, A.; Broglia, R.; Balaras, E. The wake structure of a propeller operating upstream of a hydrofoil. J. Fluid Mech. 2020, 904, A12. [Google Scholar] [CrossRef]
  62. Wang, L.; Guo, C.; Xu, P.; Su, Y. Analysis of the performance of an oscillating propeller in cavitating flow. Ocean Eng. 2018, 164, 23–39. [Google Scholar] [CrossRef]
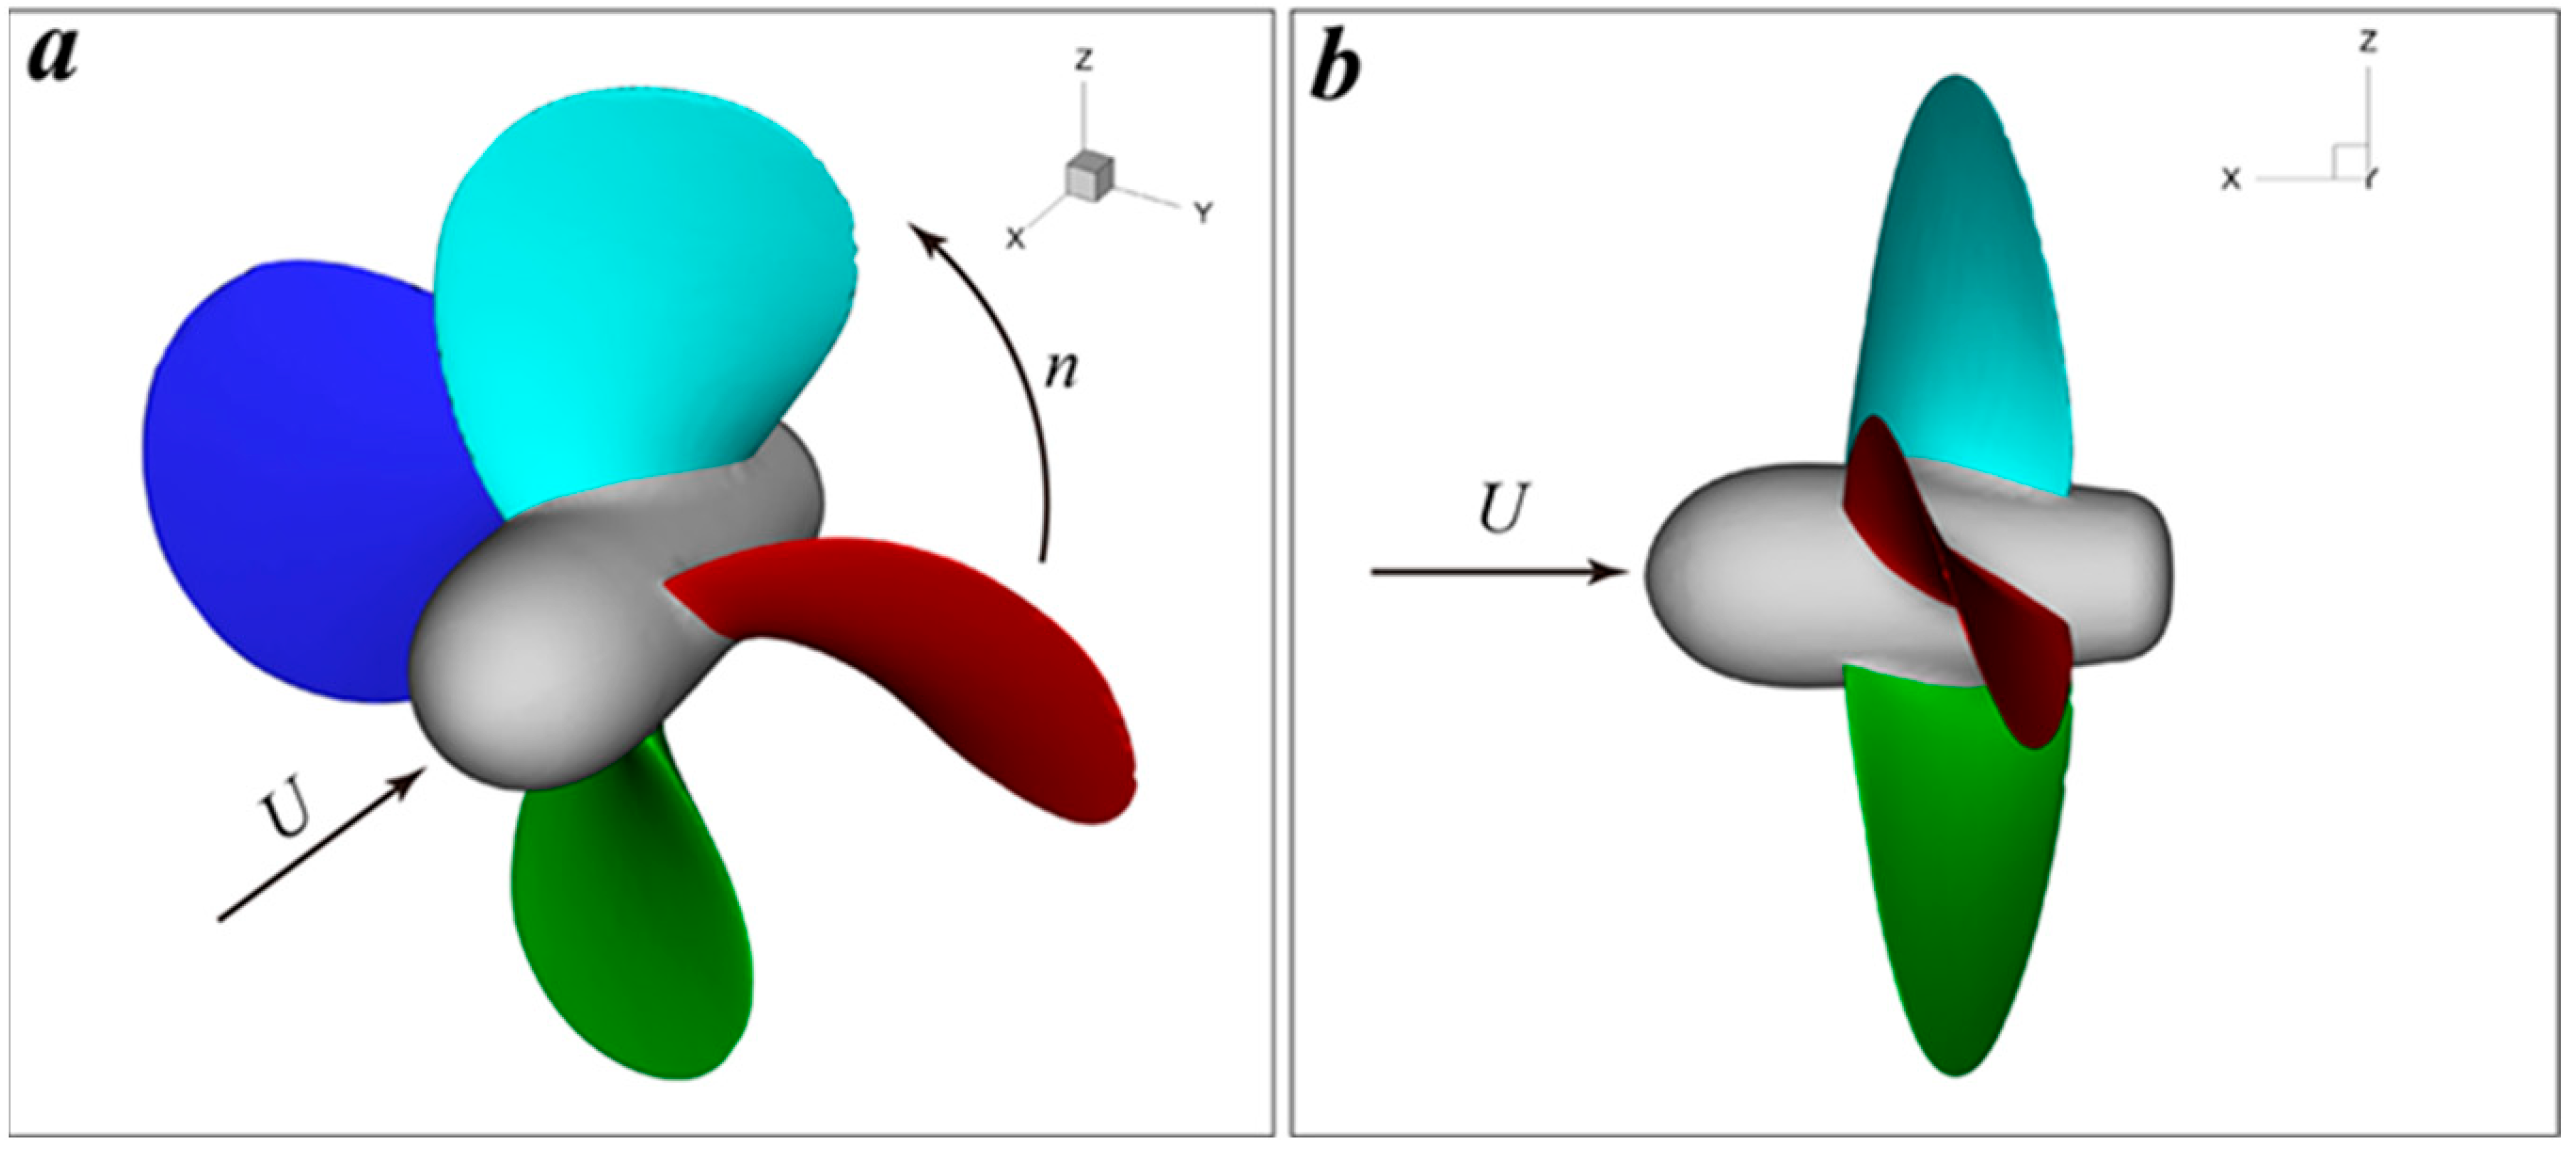
Figure 1. E779A propeller and the associated reference framework: (a) oblique view and (b) side view.
Jmse 11 01674 g001
Figure 2. Meshes in the oblique view, showing the wake refinements alongside the boundary layer refinement.
Jmse 11 01674 g002
Figure 3. Numerical validation against experiments: (a) thrust and torque coefficients and (b) axial velocity profile extracted at J = 0.88.
Jmse 11 01674 g003
Figure 4. Time series of axial velocity under the high loading condition (ac) and the low loading condition (df): the data were recorded at probes P1 (a,d), P3 (b,e) and P6 (c,f).
Jmse 11 01674 g004
Figure 5. Contours of instantaneous pressure on (a,c) pressure sides and (b,d) suction sides for J = 0.38 (a,b) and J = 0.65 (c,d). Pressure is non-dimensionalized using ρU2.
Jmse 11 01674 g005
Figure 6. Time-averaged vortices for (a) J = 0.38 and (b) J = 0.65. The vortex systems are represented by Q = 10,000.
Jmse 11 01674 g006
Figure 7. Instantaneous vortices for (a) J = 0.38 and (b) J = 0.65.
Jmse 11 01674 g007
Figure 8. Instantaneous contours of (a,b) pressure and (c,d) turbulent kinetic energy for J = 0.38 (a,c) and J = 0.65 (b,d). The pressure and TKE are non-dimensionalized using ρU2 and U2, respectively.
Jmse 11 01674 g008
Figure 9. Instantaneous contours of the magnitude of the Lamb vector on the section at (a,e) x/D = 0.4, (b,f) x/D = 0.8, (c,g) x/D = 1.6 and (d,h) x/D = 2.2. The first row shows the results of J = 0.38 and the second row indicates the results of J = 0.65.
Jmse 11 01674 g009
Figure 10. Pressure signals of different probes in box plots: (a) J = 0.38 and (b) J = 0.65.
Jmse 11 01674 g010
Figure 11. PSDs of pressure signals at various probes: (a,b) J = 0.38 and (c,d) J = 0.65.
Jmse 11 01674 g011
Figure 12. Joint PDFs of the axial and vertical velocity fluctuations for (a,b) J = 0.38 and (c,d) J = 0.65.
Jmse 11 01674 g012
Figure 13. The propeller wake vortex system presented by Q-criterion under J = 0.88.
Jmse 11 01674 g013
Figure 14. Instantaneous contours of (a) out-of-plane vorticity, (b) streamwise velocity and (c) pressure.
Jmse 11 01674 g014
Figure 15. Instantaneous axial, azimuthal, and radial velocity contours (first, second, and third columns, respectively) on the cross-sections at x/D = 1.0 (a,e,i), 3.0 (b,f,j), 5.0 (c,g,k), and 7.0 (d,h,l).
Jmse 11 01674 g015
Figure 16. Vorticity magnitude emanating near the blade surface for (a) J = 0.38 and (b) J = 0.65.
Jmse 11 01674 g016
Table 1. Geometry details of the E779A propeller.
QuantityUnitsValue
Propeller diametermm227.27
Number of blades-4
Pitch ratio-1.11
Hub diametermm45.53
Hub ratio-0.2
Rake (forward)-4°35′
Expanded area ratio-0.689
Designed rotating speedrps25
Designed advance coefficient-0.71
Chord at 0.7Rmm86
Table 2. Results from the grid convergence analysis.
Conditionf2f1EExtr.UN (%)
J = 0.380.40160.39780.00380.39410.94
J = 0.650.27260.2768−0.00420.28101.49
Disclaimer/Publisher’s Note: The statements, opinions and data contained in all publications are solely those of the individual author(s) and contributor(s) and not of MDPI and/or the editor(s). MDPI and/or the editor(s) disclaim responsibility for any injury to people or property resulting from any ideas, methods, instructions or products referred to in the content.