Abstract
The lumping block equivalent method (LBEM) is widely used to reduce the computational effort in the fatigue damage assessment of offshore structures, and the wave parameters of the representative sea states (RSSs) resulting from LBEM are of vital importance for the accurate prediction of offshore structures’ fatigue damage. In this study, a novel wave energy equivalence (WEE)-based LBEM is proposed to determine the wave parameters of the RSS accurately. The novelty of the proposed method is that a compact relationship between the input wave energy component and mooring lines’ fatigue damage is derived, and the modified statistical relationships between the wave parameters and spectral moments are provided by incorporating the effects of the peak enhancement factor of the input wave spectrum, the number of original sea states (OSSs) and the equivalence bandwidth of the OSSs. Based on the compact relationship, the wave energy component of the RSS can be determined from the wave energy component of the OSSs for each wave frequency from the viewpoint of the fatigue damage equivalence criterion. The wave energy distribution of the RSS can be accurately characterized with the wave energy distribution of the OSSs, and the spectral moments of the RSS can be calculated by its energy distribution directly, without any approximation. Moreover, the wave parameters of the RSS can be determined from the modified statistical relationships easily. The effectiveness of the proposed WEE LBEM is numerically investigated with a moored semi-submersible platform. Results show that the proposed WEE LBEM is robust, efficient and accurate within engineering expectations, and it outperforms the conventional LBEMs both in accuracy and robustness.
1. Introduction
A floating offshore structure generally composed of large-scaled floaters and slender mooring lines is the infrastructure used for the exploitation of natural resources in deep and ultra-deep water [1,2]. When the floating offshore structure is in operational conditions, the stochastic wave acting on the structure can be considered as the cyclic hydrodynamic load, which can lead the mooring lines to experience fatigue failure, even if the mooring line’s tension is much smaller than its minimum breaking load [3,4]. Therefore, the mooring line’s fatigue damage is one of governing factors for the design of floating offshore structures [5,6,7].
Generally, through an integration account of efficiency and safety requirements, the classical frequency- and time-domain fatigue assessment methods are the most commonly used methods in the design stage of floating offshore structures [8,9]. However, due to the nonlinearities inherent in the system, the dynamic responses of the floating offshore structure are non-Gaussian processes, and the classical frequency-domain fatigue assessment method, which is based on the Rayleigh distribution, therefore becomes inapplicable [3,10]. The time-domain fatigue assessment method can consider the nonlinearities of the system and the hydrodynamic loads accurately via a coupled dynamic analysis model, and the dynamic response can be converted into a series of response ranges and cycle numbers with the aid of the rain-flow counting algorithm [11]. As a result, it can be used as the benchmark for other methods [12,13]. However, the time-domain method has a remarkable computational cost. On the one hand, the short-term variability contributed by the stochastic wave necessitates multiple realizations to acquire statistical convergence. On the other hand, the simulation duration should be long enough to obtain sufficient low-frequency cycles to accurately estimate the mooring line’s fatigue damage [14,15,16].
To reduce the computational cost, the lumping block equivalent method (LBEM), utilizing one representative sea state (RSS) to replace a group of original sea states (OSSs) to estimate the offshore structure’s fatigue damage, is widely adopted in engineering practice [5,17]. The main challenge of LBEM is to select an RSS for each lumping block that can predict the fatigue damage resulting from the OSSs accurately [18]. The methodologies available to determine the wave parameters of the RSS broadly fall into three categories. The DNV and Sheehan LBEMs are the representative methods of the first category, where the wave parameters of the RSS can be determined from the wave parameters of the OSSs directly [19,20]. Referring to DNV LBEM, the summation of the interval and the largest wave height of the OSSs in the block are set to the wave height of the RSS, and the summation of the half interval and averaging wave period of the OSSs in the block are set to the wave period of the RSS [19]. In Sheehan LBEM, the largest wave height of the OSSs in the block is selected as the wave height of the RSS, and the probabilistic average of the wave period of the OSSs in the block is set to the wave period of the RSS [20]. The fatigue damage of offshore structures therefore will be overestimated significantly as the wave height of the RSS is much larger than the needed one.
In the second category, the OSSs with the same wave height/period are lumped into a block, and the wave period/height of the RSS can be calculated from the correlation of the wave period/height, the sea state’s occurrence probability and a fatigue parameter, such as in the Mittendorf and Burton LBEMs [21,22]. In the Mittendorf LBEM, the OSSs with the same wave height are lumped into a block, and the probabilistic average of the wave period of the OSSs in the block is set to the wave period of the RSS [21]. In the Burton LBEM, the OSSs with the same wave period are lumped into a block, and the wave height of the RSS can be determined from the correlation of the wave height, the sea state’s occurrence probability and the exponent of the S-N curve [22]. Obviously, the wave parameters of the RSS can be easily calculated for a specific lumping block case, but the accuracy of these LBEMs becomes very poor if the OSSs comprise several wave height/period intervals. Different from the Mittendorf and Burton LBEMs, the OSSs with different wave heights and periods are lumped into a block in the Jia LBEM [23]. The correlation utilized in the Burton LBEM is employed to calculate the wave height of the RSS, and the probabilistic average period principle used in the Mittendorf LBEM is adopted to determine the wave period of the RSS [23]. It has been proven that the offshore structure’s fatigue damage resulting from the RSS related to the Jia LBEM method is smaller than that resulting from the OSSs.
In the third type of method, the wave parameters of the RSS are determined from the wave power spectral density (PSD) of the OSSs from the viewpoint of a fatigue damage equivalence criterion, such as in the Seidel and Song LBEMs [17,24]. In the Seidel LBEM, a compact equation between the input wave energy and fatigue damage equivalent loads on the large-diameter monopile wind turbine is derived and the relationship between the wave energy of the RSS and the OSSs can be established based on the compact equation from the viewpoint of the fatigue damage equivalence criterion. The wave height and period of the RSS can be obtained based on the equivalent wave energy and quasi-static considerations. It has been proven that the Seidel LBEM can give excellent fatigue prediction results for the structure components at the bottom of large-diameter monopile wind turbines. However, its accuracy becomes poor if the resonance part of the response is governing or the quasi-static response is of higher importance [24]. In the Song LBEM, the relationship between the sea state’s energy and the structure’s fatigue damage is provided by considering the influence of the structural fatigue parameter. From the viewpoint of the fatigue damage equivalence criterion, the spectral moments of the RSS can be determined from the spectral moments of the OSSs. The wave height and period of the RSS can be obtained from the statistical relationships between the spectral moments and wave parameters in a straightforward manner [17]. The effectiveness of the Song LBEM has been proven by many researchers. However, the second spectral moment of the RSS is obtained by an analogy method rather than the fatigue damage equivalence criterion, which has an influence on the wave period of the RSS and causes this method to slightly underestimate the structure’s fatigue damage in some cases [25].
The purpose of this study is to propose a wave energy equivalence-based lumping block method to efficiently and accurately predict mooring lines’ fatigue damage induced by stochastic wave loads. In the proposed method, a relationship between the input wave energy and the mooring line’s fatigue damage is first established by considering the effect of the mooring line’s nonlinearities and the fatigue parameter, and the relationship between the wave energy distribution of the RSS and the OSSs is further derived from the fatigue damage equivalence viewpoint. Two modified statistical relationships between the spectral moments and wave parameters are provided by incorporating the effect of the spectrum’s peak enhancement factor, the sea state’s number in the block and the sea state’s equivalence bandwidth. The spectral moments of the RSS can be determined from its wave energy distribution in a straightforward manner, and the proposed method has direct physical significance compared to the conventional LBEMs. To present the theories of the LBEMs and the results of the investigation, the manuscript is structured as follows. The details of the conventional and proposed LBEMs are introduced in Section 2 and Section 3. In Section 4, the environmental conditions and the numerical model are provided. The effectiveness of the proposed method is validated with a series of case studies as presented in Section 5. Finally, the conclusions are summarized in Section 6.
2. Conventional LBEMs
To clearly illustrate the theories of the LBEMs, it is assumed that the wave scatter diagram consists of OSSs, they are lumped into blocks and there are OSSs in the th block. The significant wave height and mean up-crossing period, as well as the occurrence probability of the RSS related to the th block, are characterized by , and , respectively.
For different LBEMs, the equivalent occurrence probability of the RSS can be calculated with the same principle, which is identical to the sum of the occurrence probability of the OSSs in the block, as shown in Equation (1).
where is the occurrence probability of the th OSS in the th block.
2.1. DNV LBEM
In DNV LBEM, the and of the RSS can be calculated based on the following expressions [20]:
where represents the maximum value in the set; and are the interval of the wave height and period in the block; is the parameter related to the number of encompassed by the th block, and it can be given as
where is the number of with the same in the block; is the number of encompassed by the block.
2.2. Sheehan LBEM
Referring to the Sheehan LBEM, the of the RSS is identical to the largest of the OSSs in the block. The of the RSS is identical to the probabilistic average of the OSS’s in the block, and it yields [21]
2.3. Jia LBEM
According to the theory of the Jia LBEM, the of the RSS can be calculated based on the relation of the fatigue parameter , and of the OSSs, while the of the RSS can be calculated by the probabilistic average period of the OSSs and yields [16]
where is the exponent of the fatigue curve.
2.4. Spectral Moment Equivalence (SME)-Based LBEM
In the SME LBEM, the relation of the input spectral moment and structural fatigue damage is provided, and it can be given as [18]
where is the cumulative fatigue damage contributed by the th OSS; is the zeroth spectral moment of the th OSS; is the exponent of the fatigue curve; is the exponent of the zeroth spectral moment obtained via the regression algorithm, and ; is the coefficient related to the zeroth spectral moment of the input sea state and the fatigue damage of the offshore structure.
Based on the relation, the cumulative fatigue damage caused by the RSS and OSSs related to the th block can be given as
where and are the cumulative fatigue damage resulting from the RSS and OSSs related to the th block; is the zeroth spectral moment of the RSS related to the th block; is the zeroth spectral moment of the th OSS in the th block.
The relation of the zeroth spectral moments of the RSS and OSSs can be set up according to the fatigue equivalence criterion and yields
The second spectral moment of the RSS can be determined from the second spectral moments of the OSSs by analogy with Equation (12), and it can be given as
where represents the second spectral moment of the RSS related to the th block, and represents the second spectral moment of the th OSS in the th block.
The and of the RSS can be determined from its spectral moments directly based on the following formula:
where is a correction factor adopted to consider the effect of the OSS’s number in the th block, and it has the following expression:
where is the number of OSSs in the block, and is the exponent of the fatigue curve.
3. The Novel Wave Energy Equivalence (WEE)-Based LBEM
The SME LBEM simply depends on the zeroth and second spectral moments and the occurrence probability of the OSSs, and it is therefore very easy to achieve for practicing engineers. However, the formula adopted to calculate the second spectral moment of the RSS is derived by the analogy method rather than the fatigue equivalence criterion, which makes the SME LBEM slightly non-conservative for some lumping block cases.
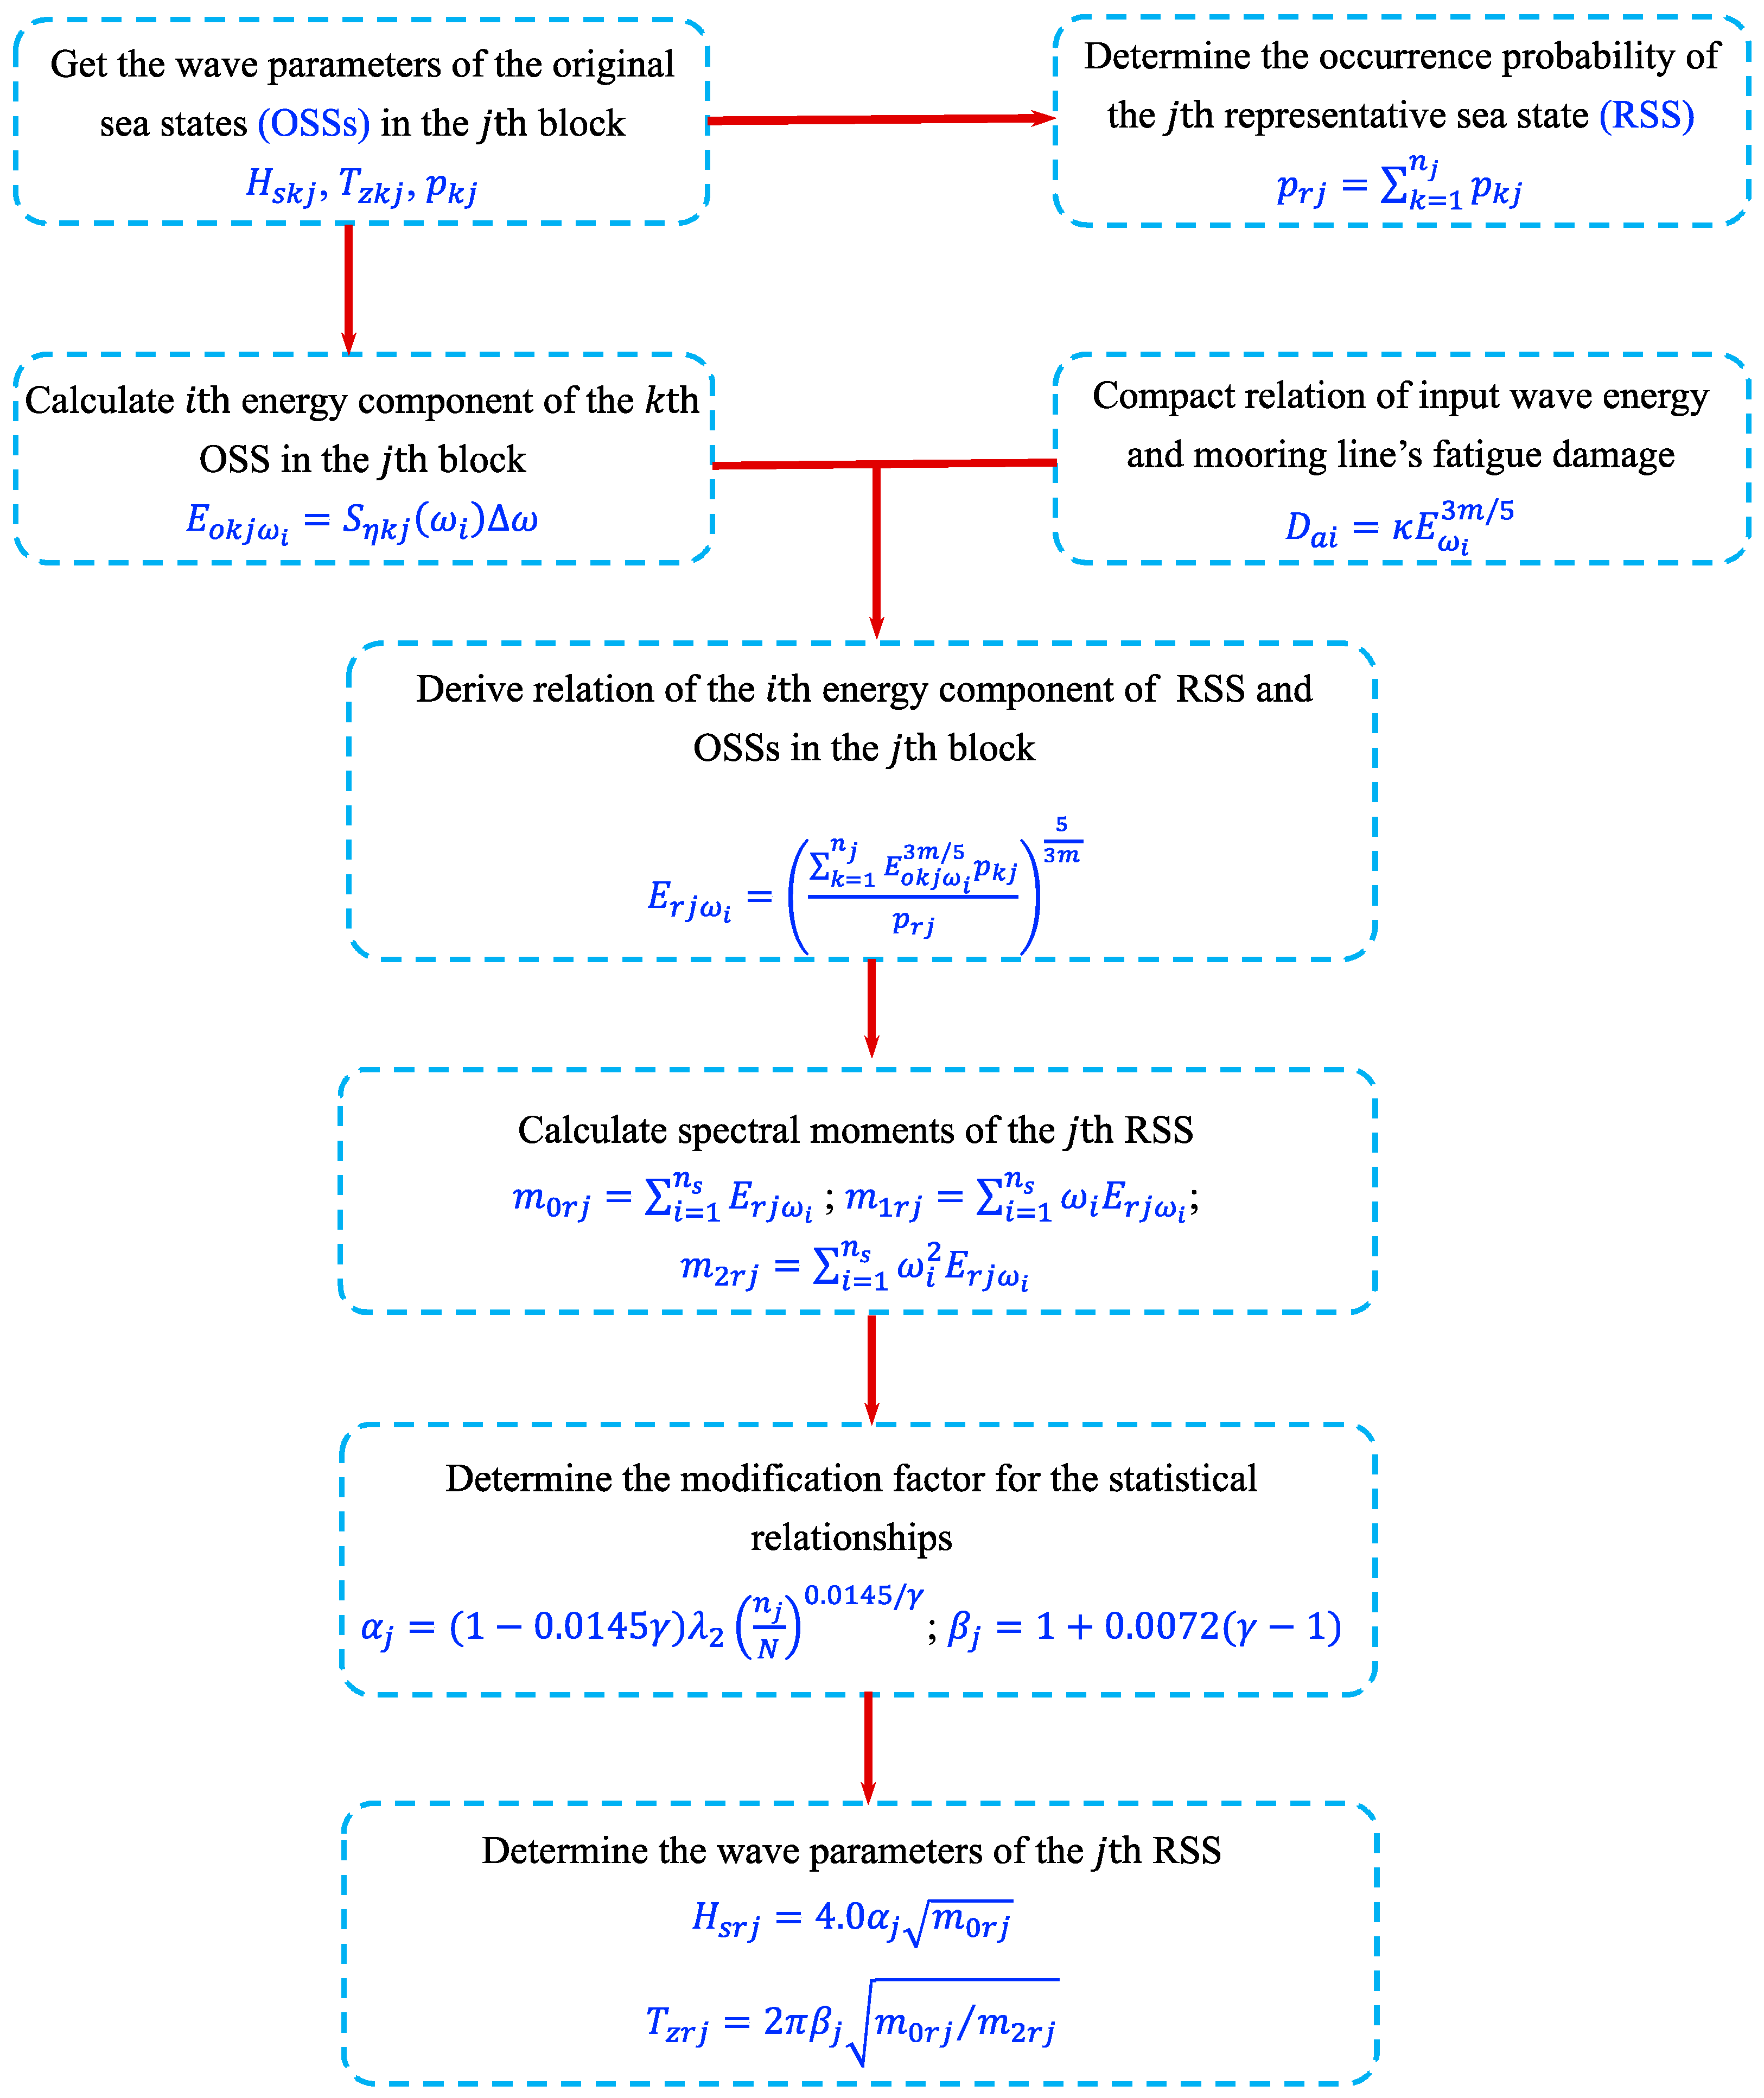
In this study, a novel wave energy equivalence (WEE)-based LBEM is proposed to improve the applicability of the SME LBEM. In the proposed WEE LBEM, a compact relationship between the input wave energy and the mooring lines’ fatigue damage is established with the aid of a regression algorithm, and the relationship between the wave energy distribution of the RSS and OSSs is further derived from the viewpoint of the fatigue equivalence criterion. The spectral moments, including the zeroth, first and second spectral moments, of the RSS are then calculated from its wave energy distribution directly, and the wave parameters of the RSS are finally determined from the modified statistical relationships between the spectral moments and wave parameters. The flow-chart of the proposed WEE LBEM is illustrated in Figure 1.
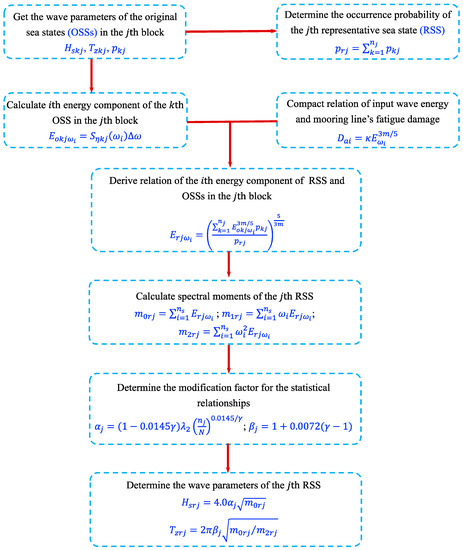
Figure 1.
Flow-chart of the proposed WEE LBEM.
3.1. The Relationship between Input Wave Energy and Mooring Lines’ Fatigue Damage
Based on the Longuet-Higgins wave model, the stochastic wave can be converted into a series of regular waves with different amplitudes, frequencies and phases. This means that the wave power spectral density (PSD) of the input sea state can be discretized into a series of energy components, and each energy component can be used to construct the regular wave with different frequencies. Therefore, the relationship between the input wave energy component and the mooring lines’ fatigue damage can be established for a specific wave frequency. The flow-chart of the wave PSD discretization and regular wave construction is illustrated in Figure 2. As the dynamic responses of the mooring system are very sensitive to both the and of the input sea state, the sea states with non-zero occurrence probability in the wave scatter diagram are selected. Furthermore, to ensure that the discrete wave frequency intervals of the wave PSD are the same for different sea states, the lower and upper limits of the wave frequency and the number of discrete wave energy components should be identical to each other. The lower and upper limits of the wave frequency can be determined based on the wave parameters of the selected sea states, and they yield
where and represent the minimum and maximum values in the set, respectively.
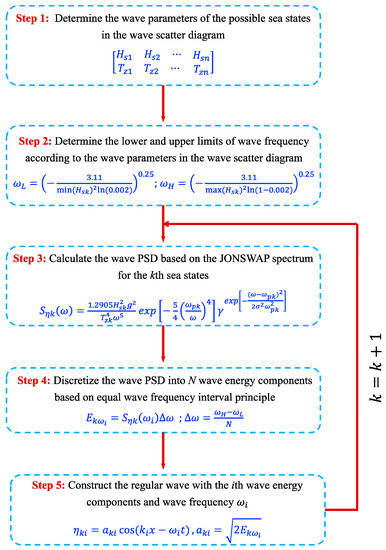
Figure 2.
Flow-chart of the wave PSD discretization and regular wave construction.
In this paper, the JONSWAP spectrum is adopted to depict the wave energy distribution of the selected sea state, and the wave PSD of the sea state can be given as
The wave PSD of the sea state is further discretized into wave energy components according to the equal wave frequency interval principle, and the wave energy for the th wave frequency can be given as
where is the number of discretized wave energy components, and it is 50 in this paper.
The regular wave elevation associated with the wave energy component of the sea state can be given as
where is the amplitude of the regular wave and ; is the wave number, which can be calculated based on the dispersion relation.
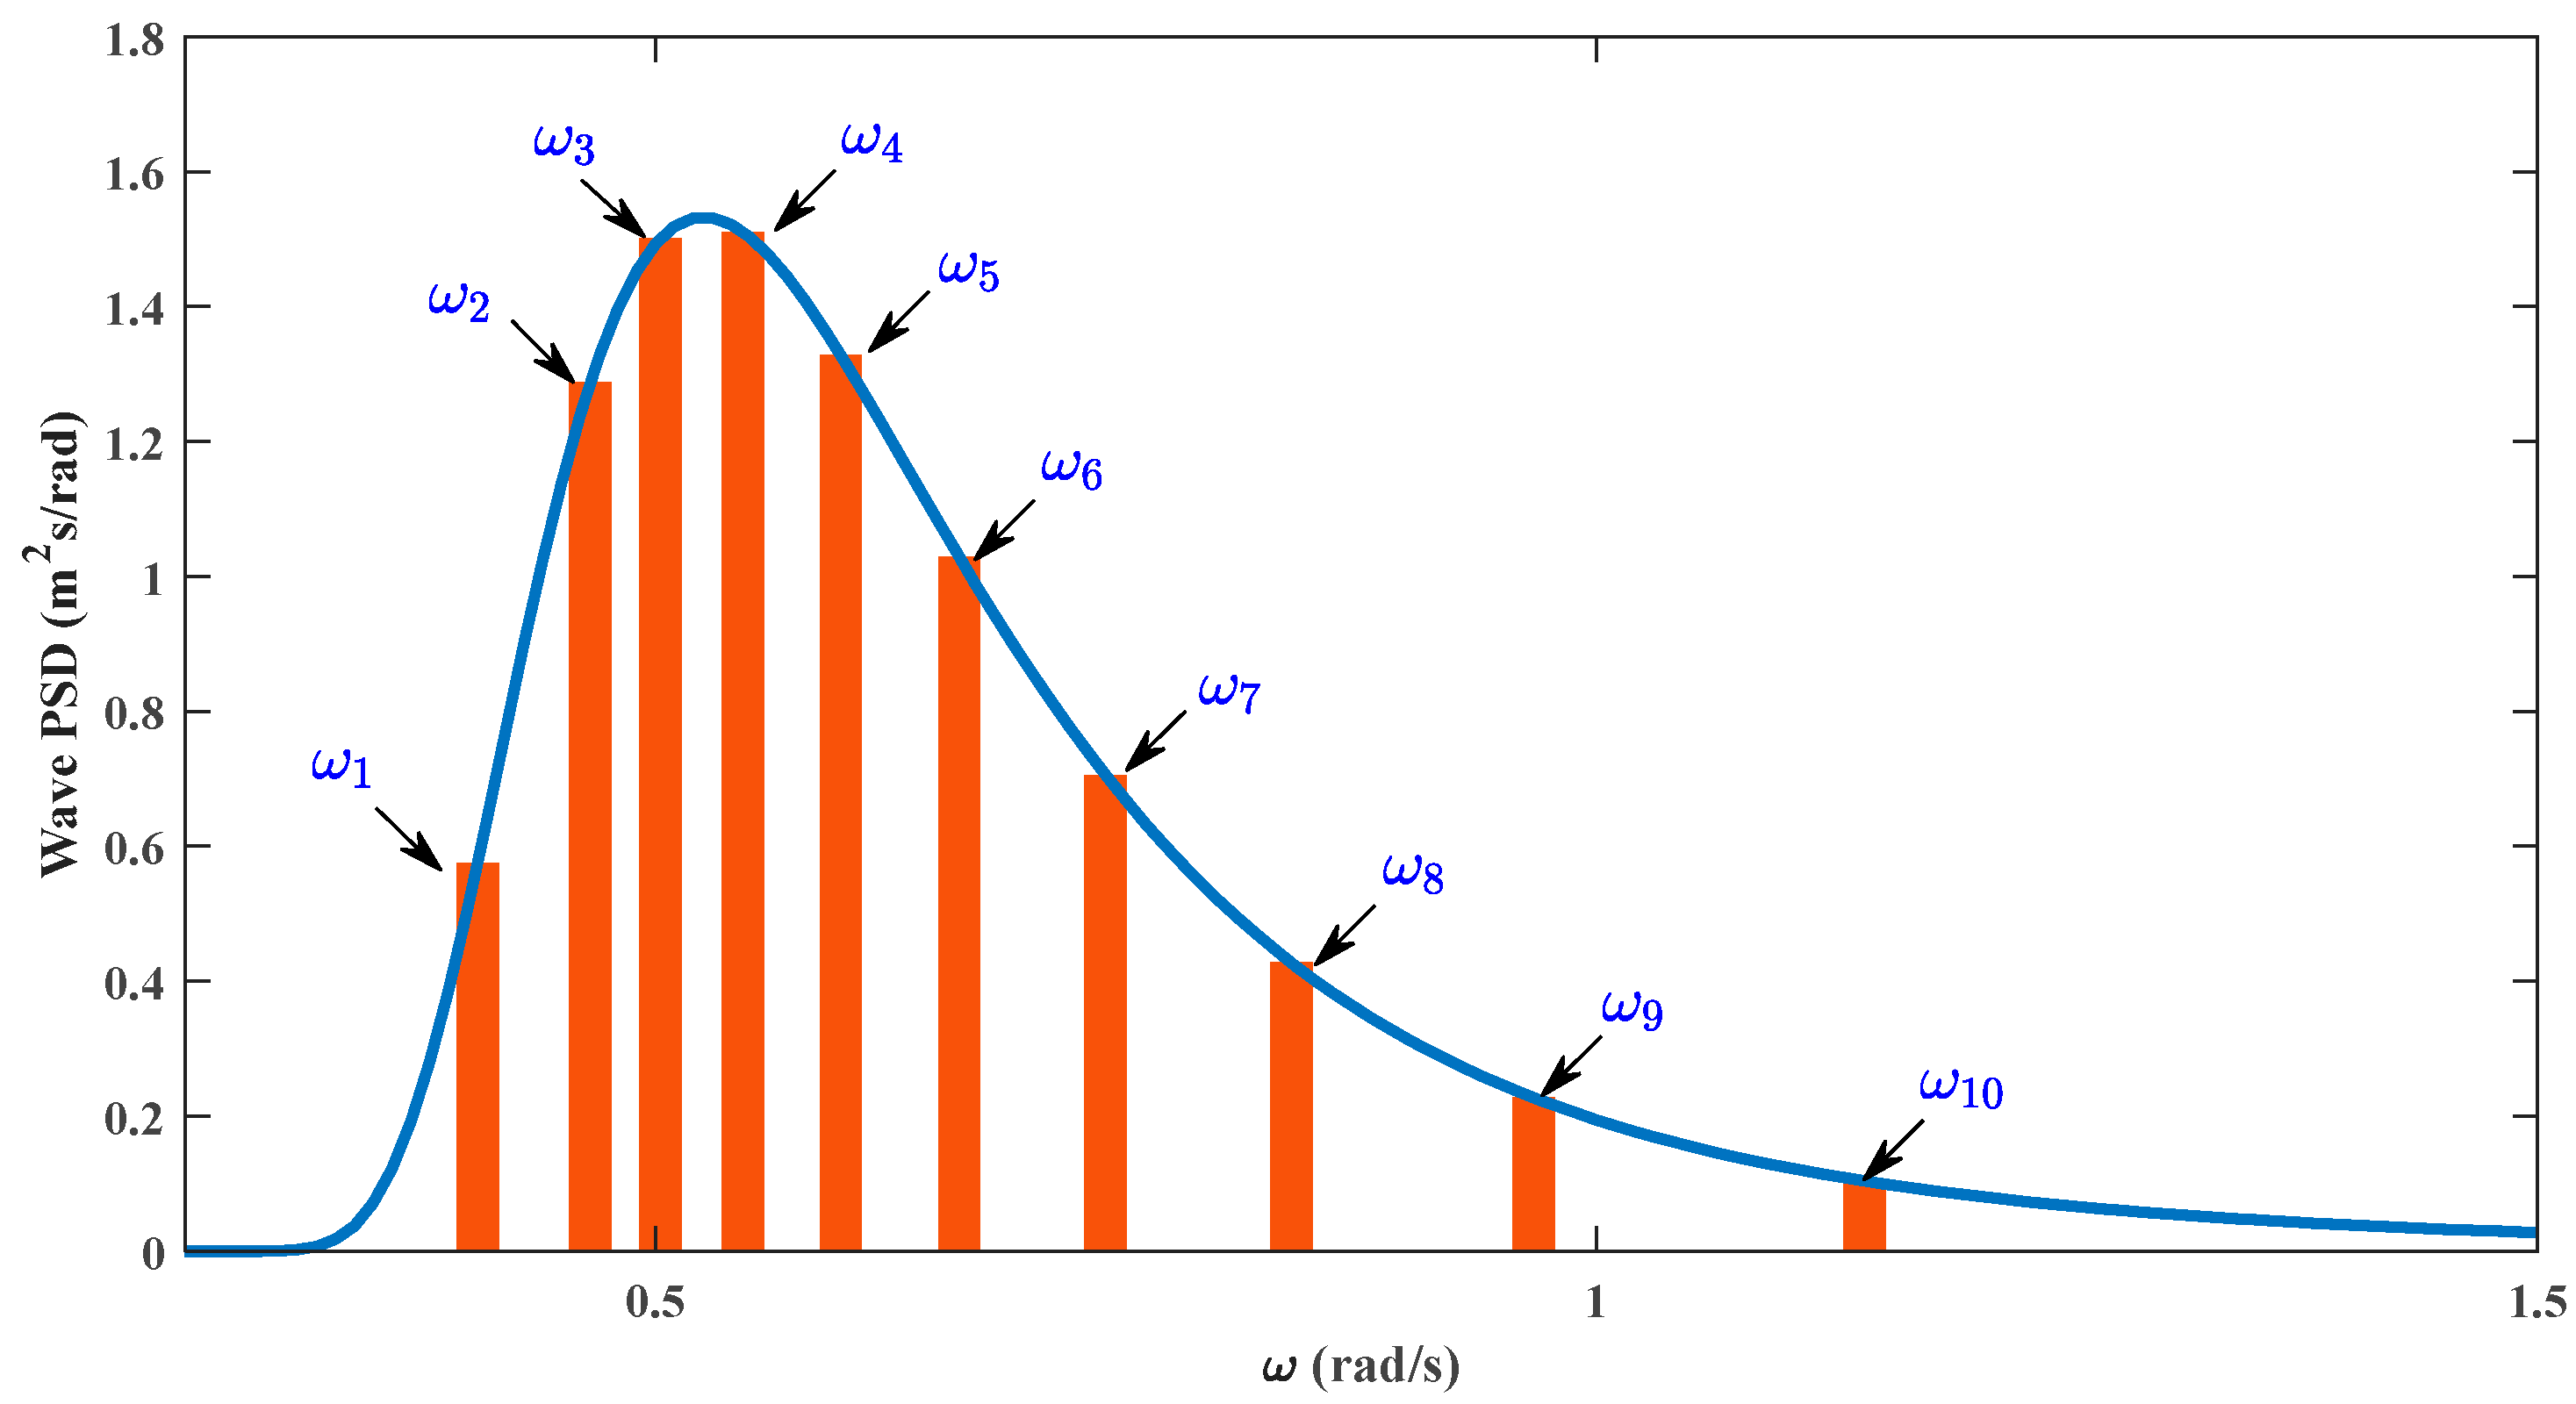
Repeating steps 3–5, all of the regular waves related to the selected sea states can be constructed. It should be mentioned that the mooring lines’ fatigue damage under all of the constructed regular waves are estimated, but, due to space limitations, this paper presents results for only ten wave frequencies, covering almost all of the wave frequencies that may be encountered by mooring lines, as illustrated in Figure 3 and Figure 4.

Figure 3.
Illustration of wave PSD discretization.
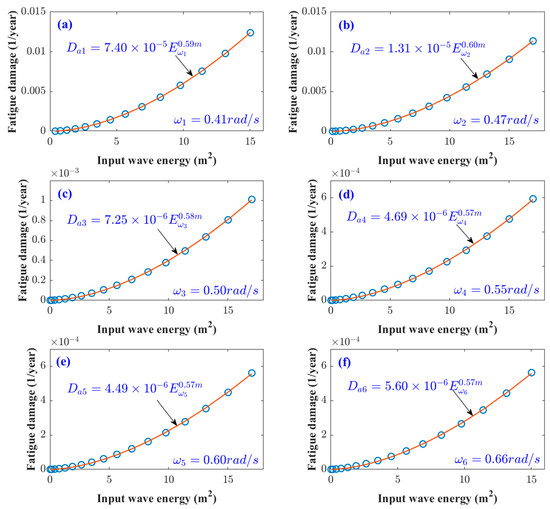
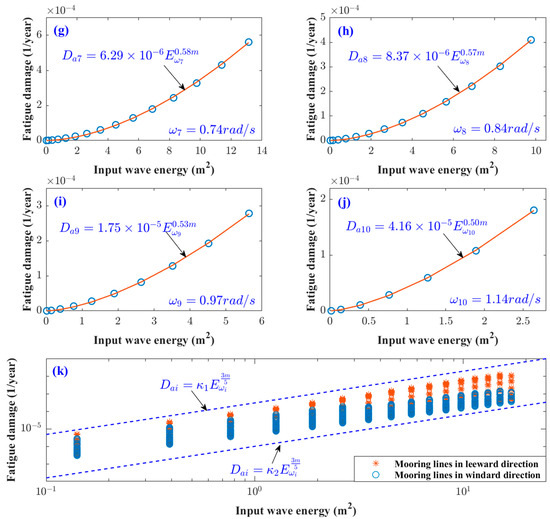
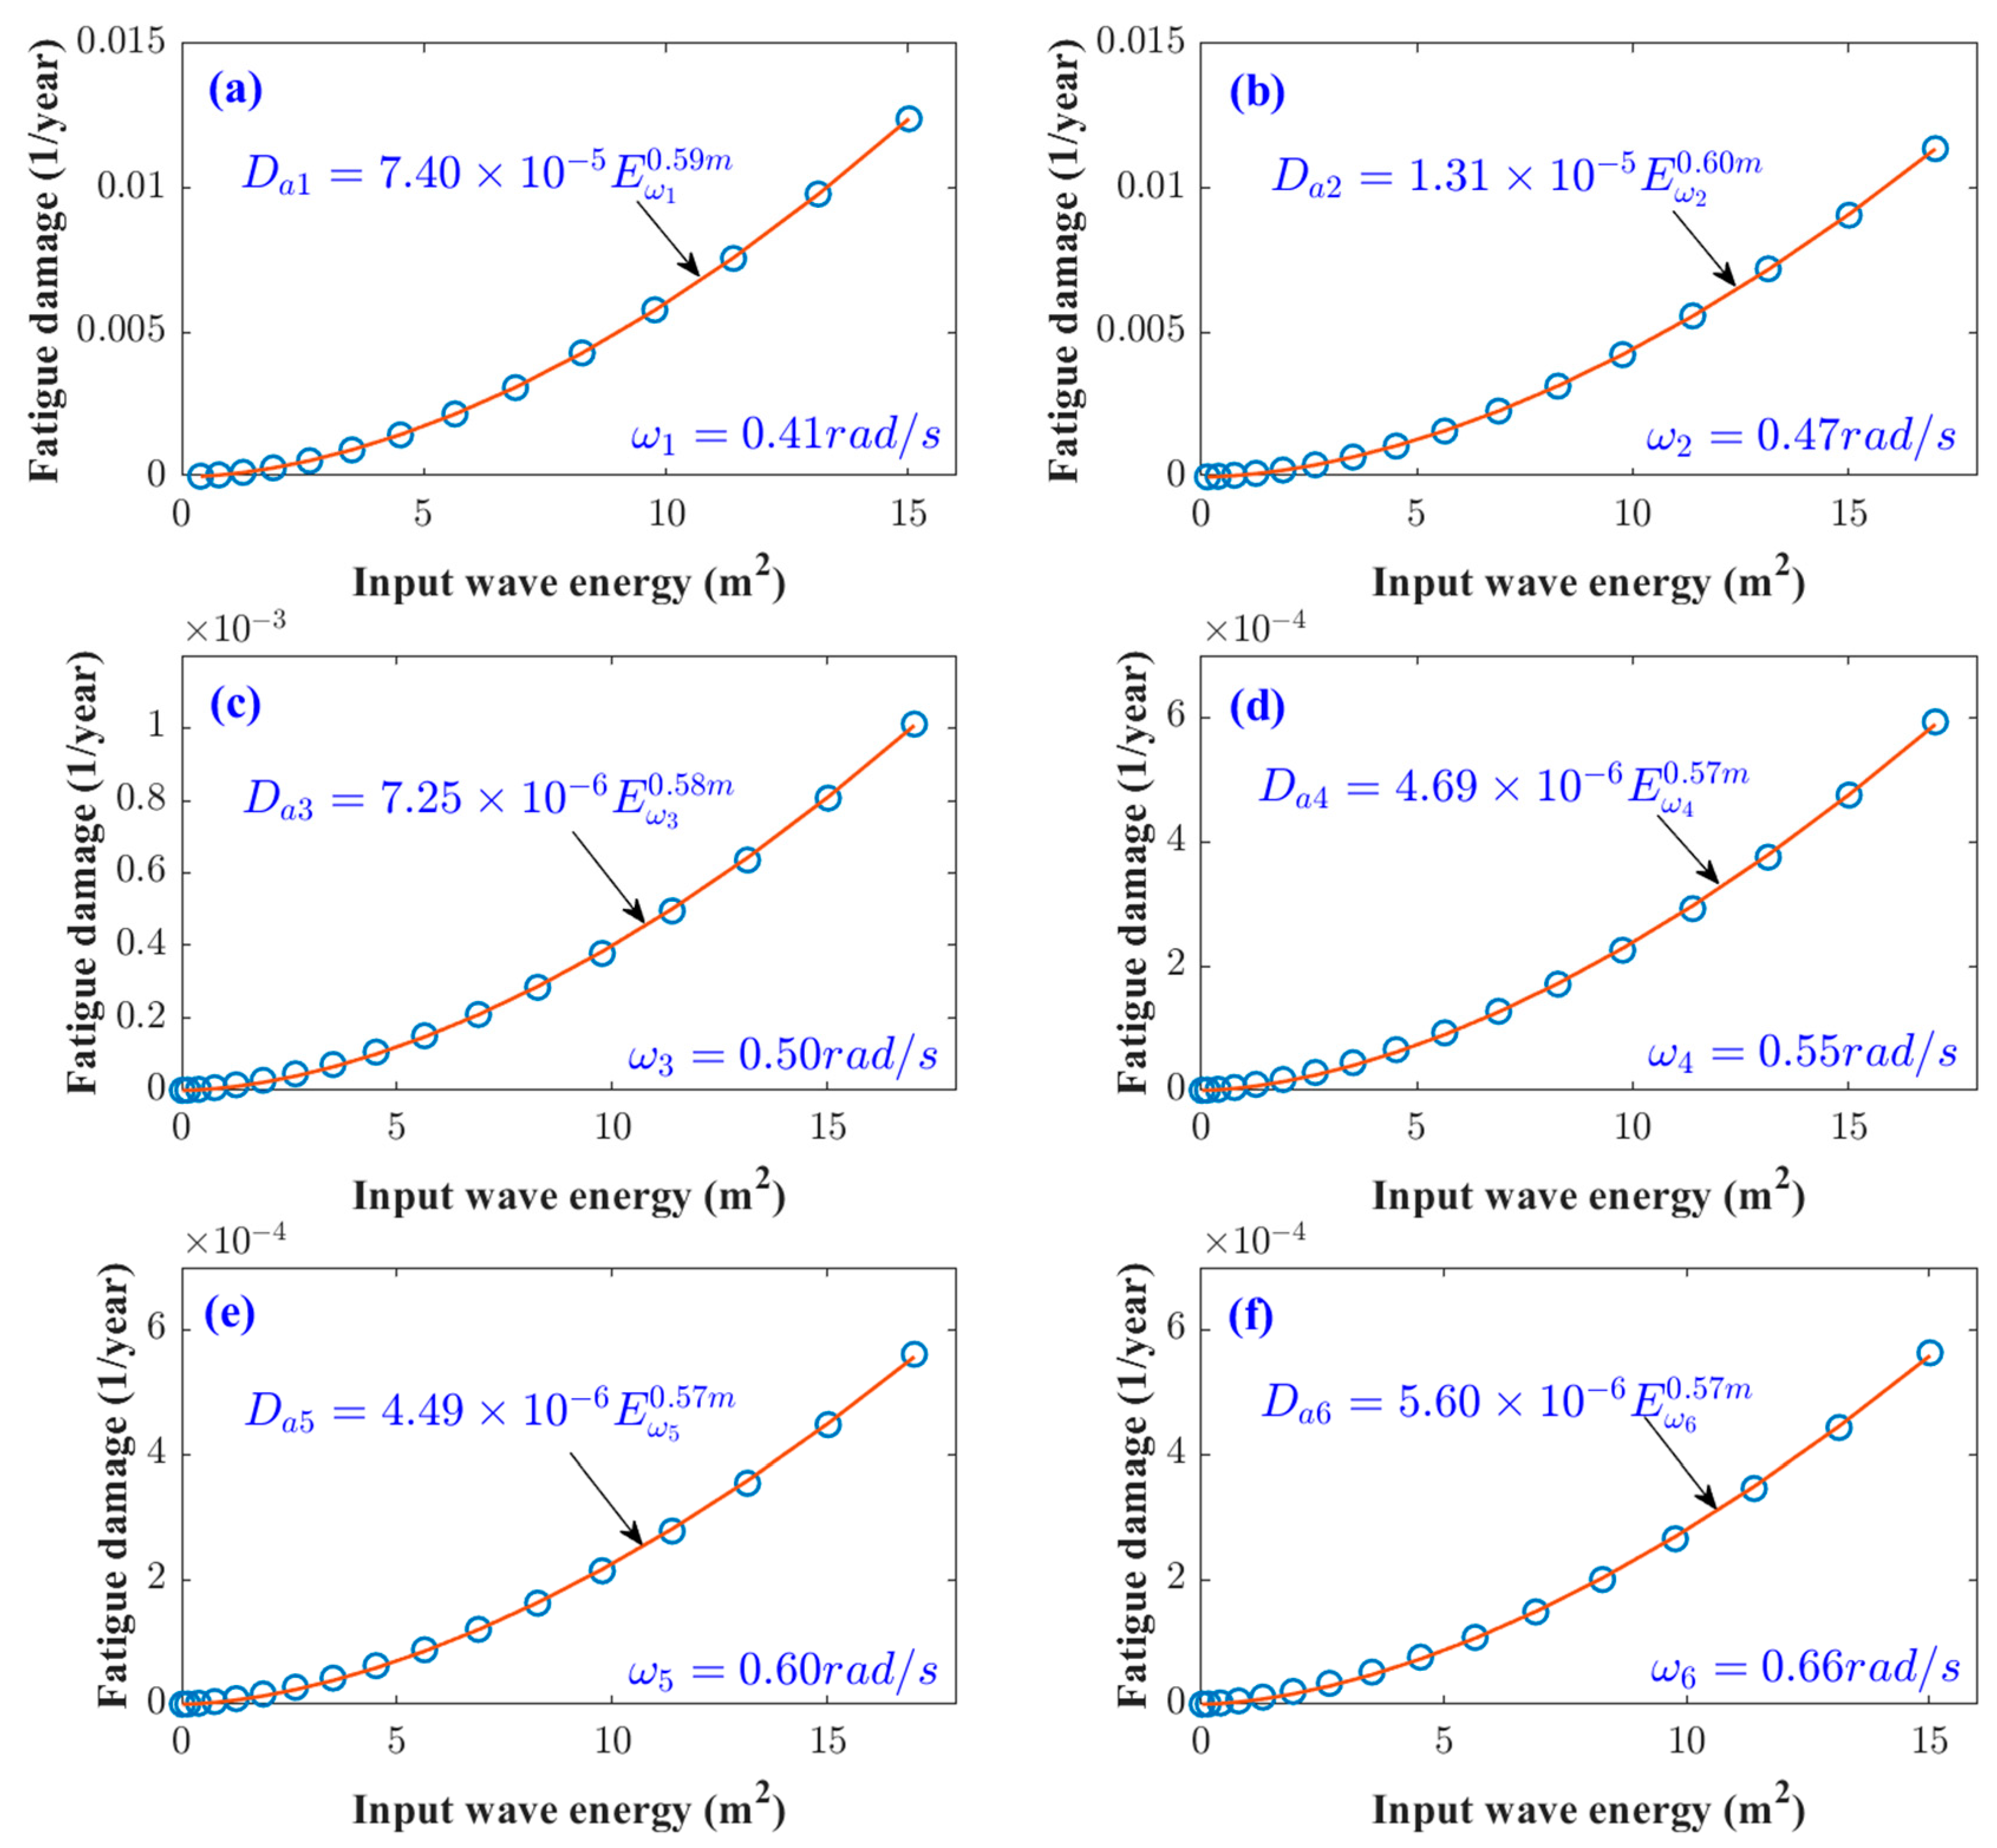
Figure 4.
The relationships between the input wave energy and mooring lines’ fatigue damage.
Mooring lines’ tension resulting from a series of regular waves with different amplitudes and frequencies is first estimated with the fully coupled analysis model, and the mooring lines’ fatigue damage is then estimated with the time-domain fatigue assessment method to fully consider the effect of the mooring line’s nonlinearities. The relationships between the input wave energy and the mooring lines’ fatigue damage are set up for different input sea states with the aid of a regression algorithm, and the corresponding results are presented in Figure 4a–j. In the figure, the circles represent the mooring lines’ fatigue damage contributed by the regular waves related to different input sea states, while the line denotes the fitted results with the regression algorithm.
From the figure, one can find that the mooring lines’ fatigue damage is proportional to the th of the input wave energy for different wave frequencies, and the parameter is the exponent of the fatigue curve. It is notable that the exponent decreases slightly as the wave frequency increases, and the maximum value of the exponent is not larger than 3/5, as illustrated in Figure 4k. Therefore, the relationship between the input wave energy and mooring lines’ fatigue damage can be characterized by a formula with a constant exponent, and the exponent can be set to its maximum value (i.e., 3/5) for conservative considerations.
The compact formula adopted to depict the relationship between the input wave energy and the mooring lines’ fatigue damage for a specific wave frequency can be given as
where is the mooring lines’ fatigue damage resulting from the th wave energy component related to wave frequency ; is the coefficient related to wave frequency ; is the exponent of the T-N curve, which is 3 for mooring lines.
3.2. The Relationship between the Wave Energy of RSS and OSSs
The fatigue damage caused by the th wave energy component related to frequency in the RSS should be identical to the sum of the fatigue damage caused by the th energy component with the same frequency in all of the OSSs in the block. Therefore, the th wave energy component of the RSS can be obtained from the th wave energy component of the OSSs in the block.
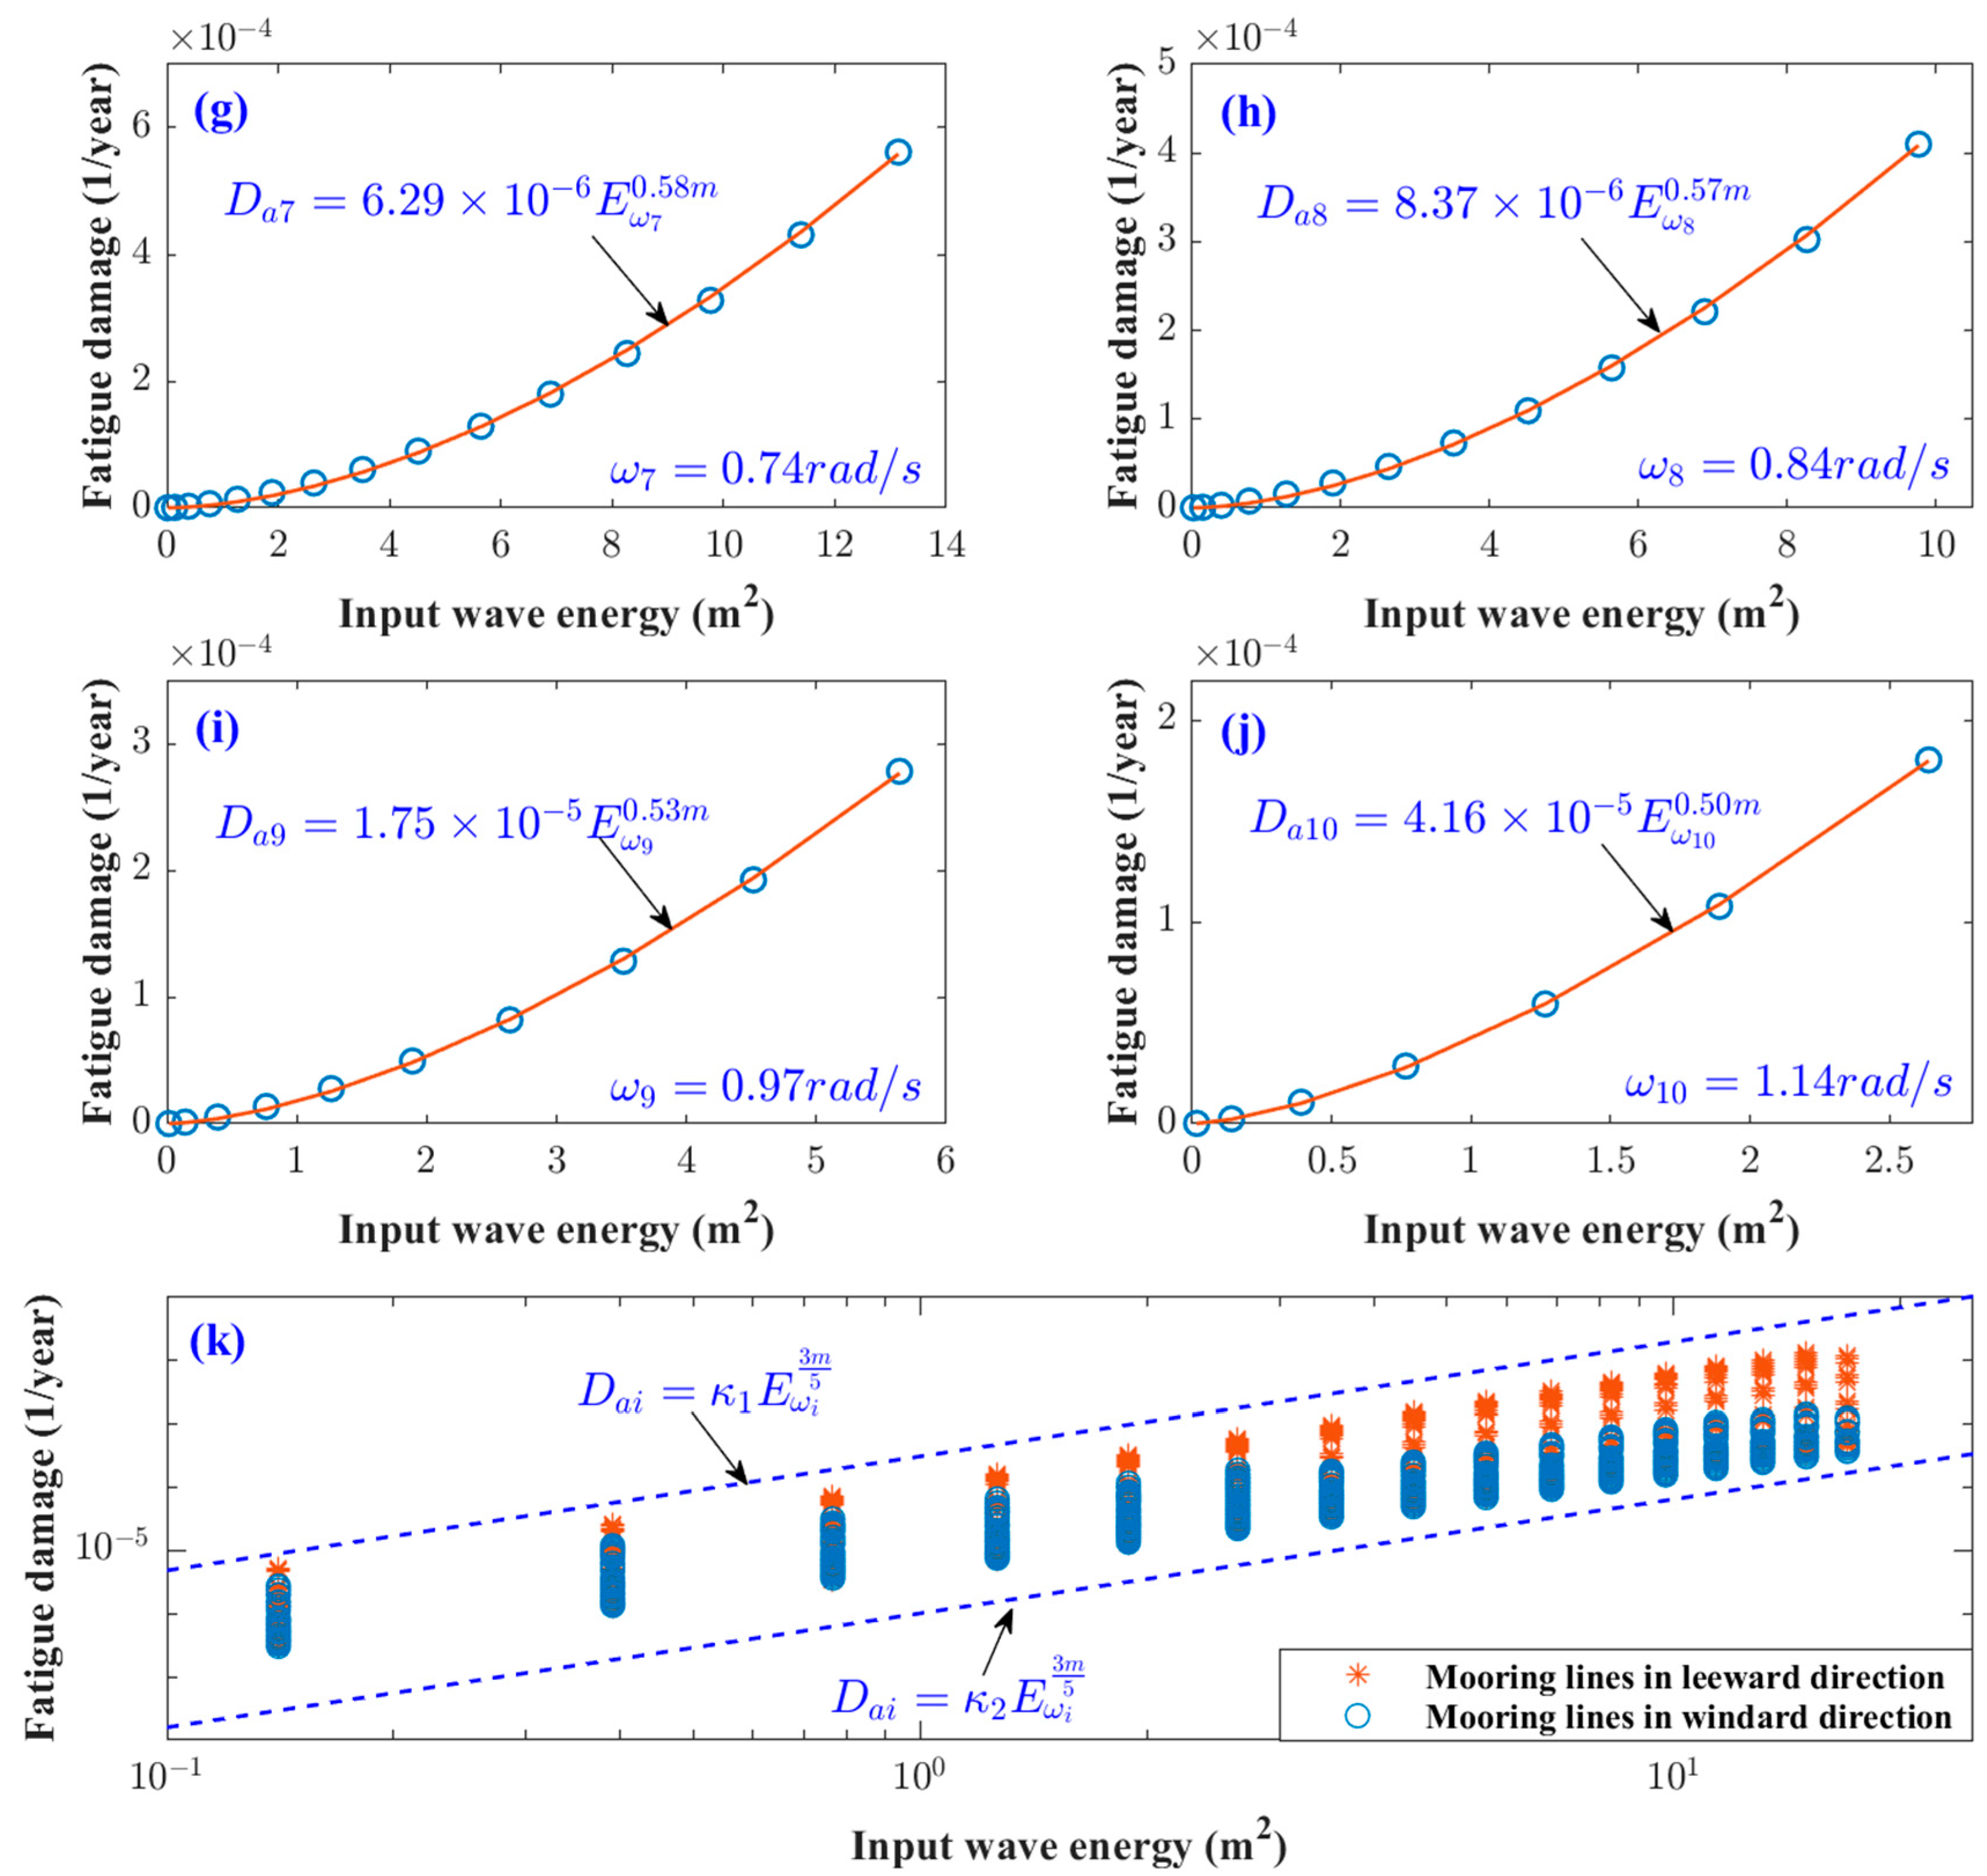
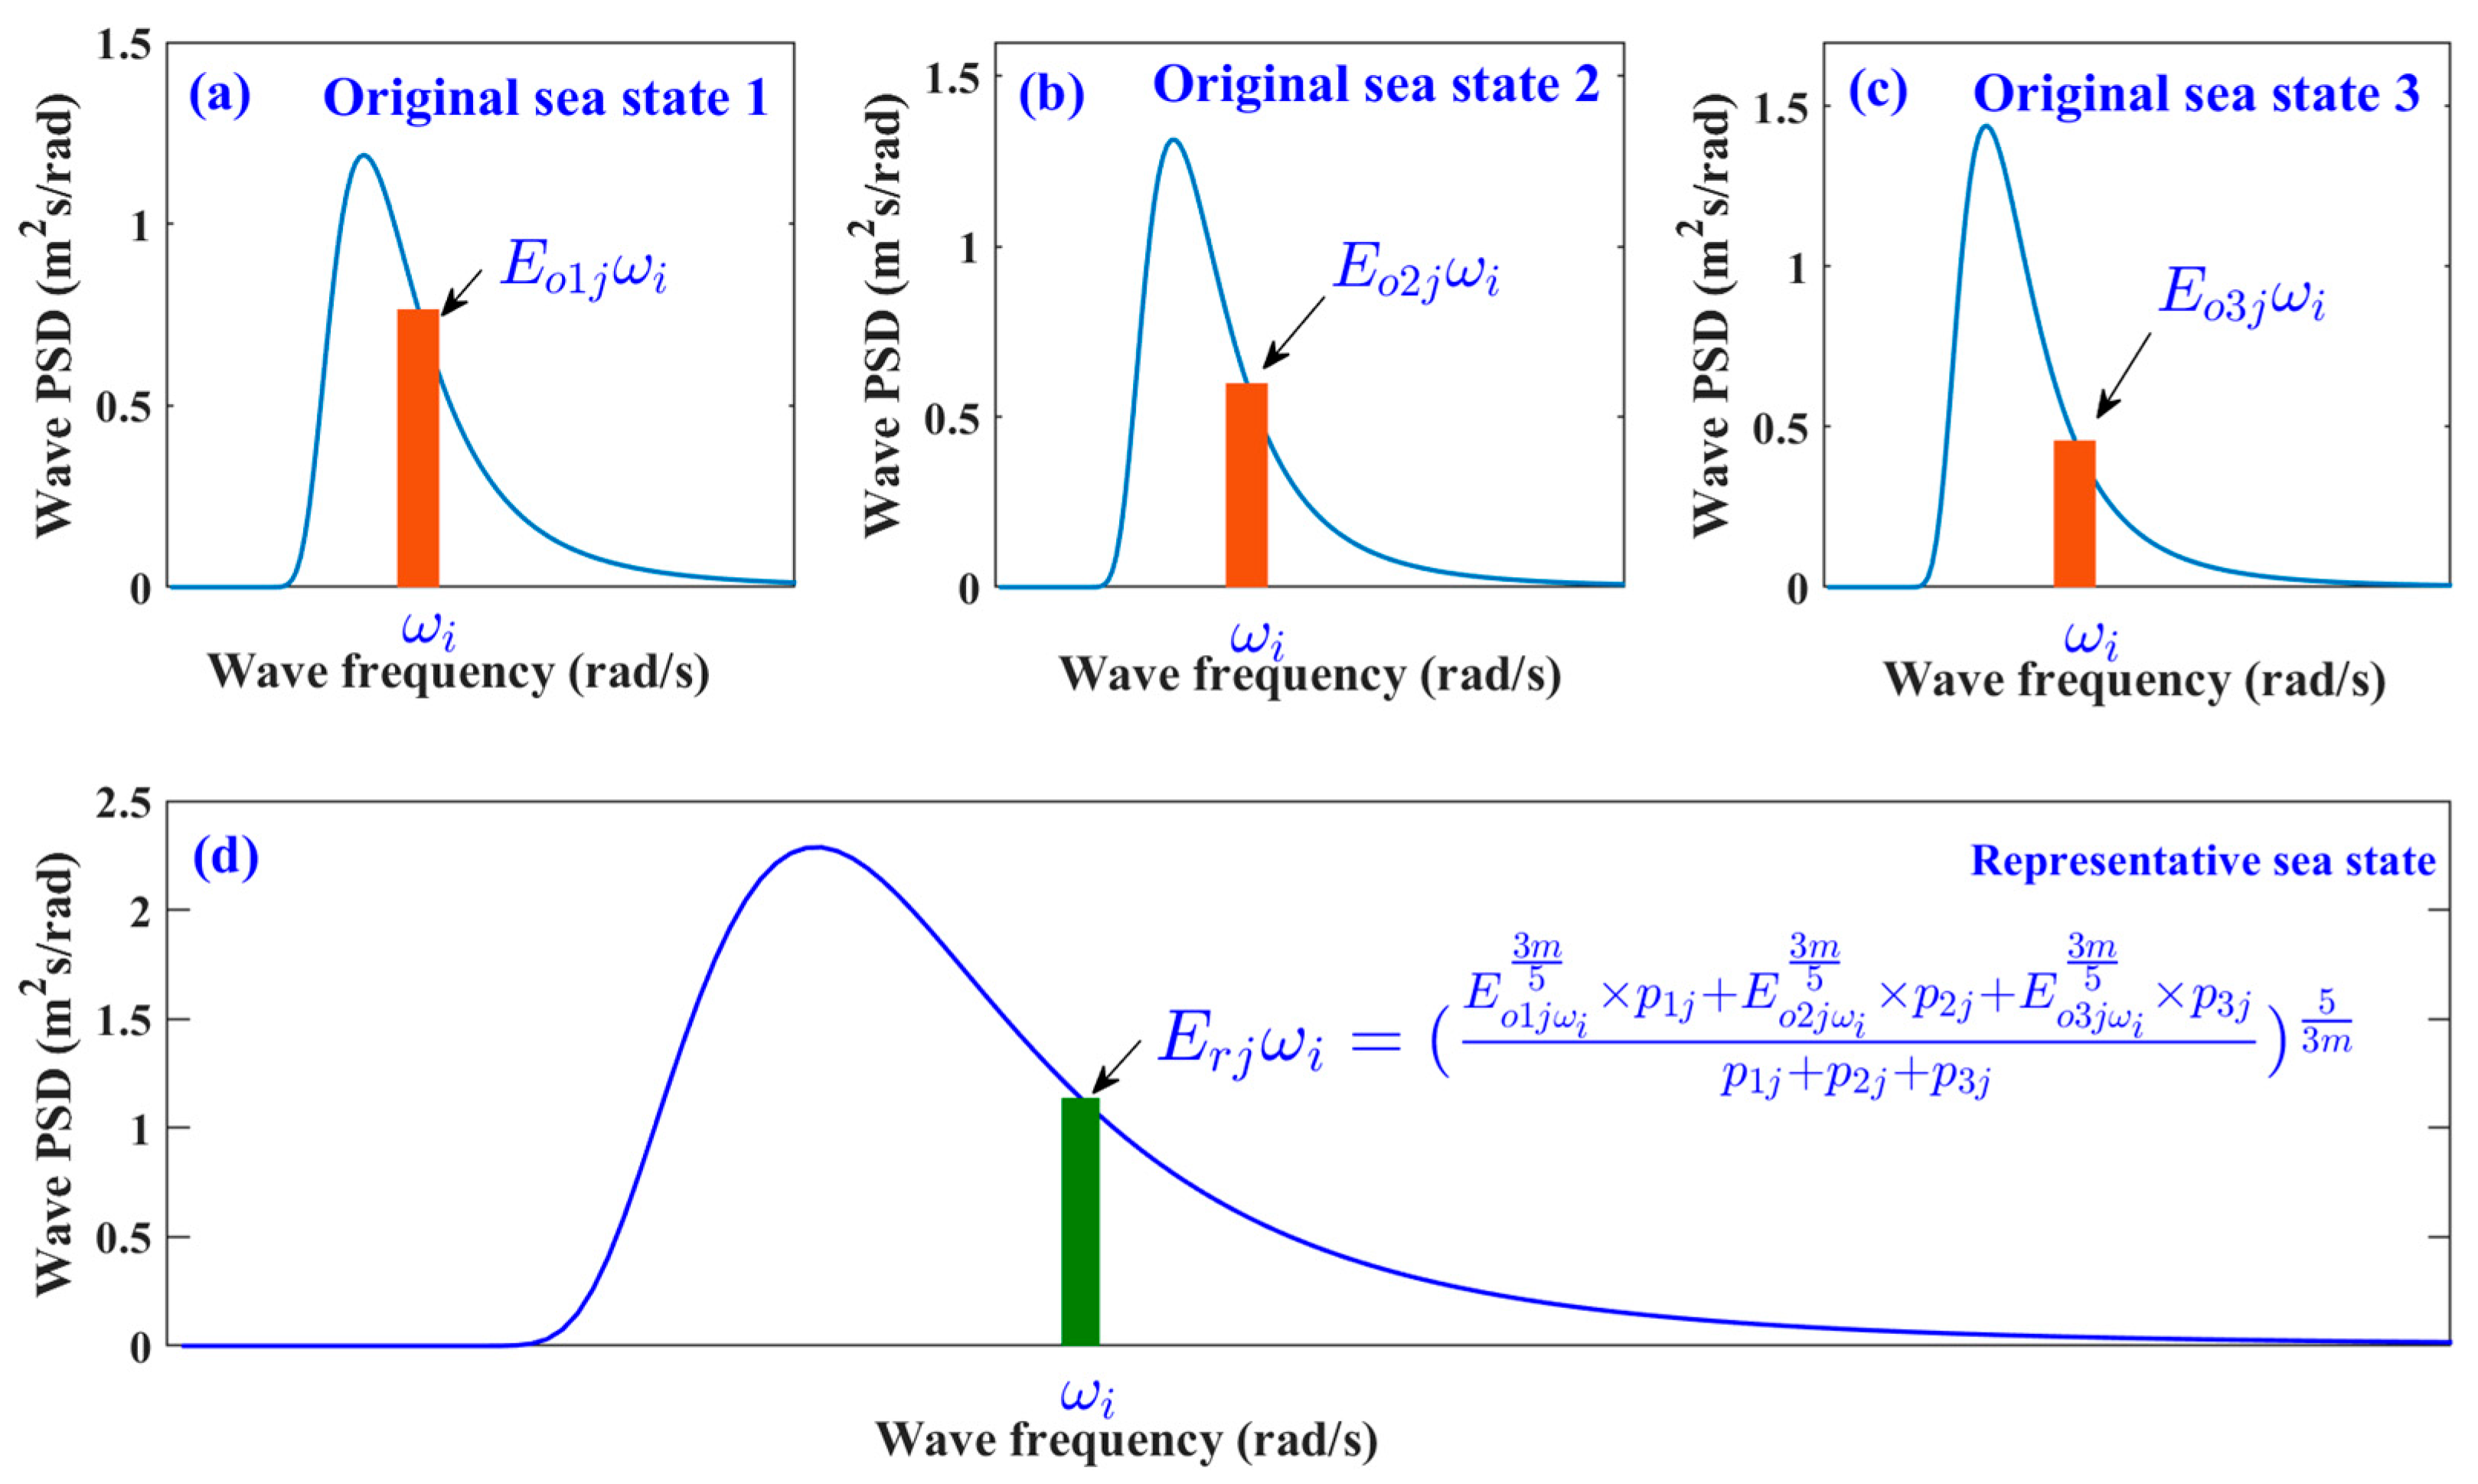
As illustrated in Figure 5, for a three-OSS block case, the relationship between the th wave energy component of the RSS and the OSSs for wave frequency can be given as
where is the th wave energy component related to wave frequency of the RSS; is the th wave energy component related to wave frequency of the OSS in the block, and , where is the wave PSD of the th OSS in the th block and is the wave frequency discretization interval of the wave PSD; is the occurrence probability of the th OSS in the block; is the number of OSSs in the block; is the occurrence probability of the th RSS (see Equation (1)).
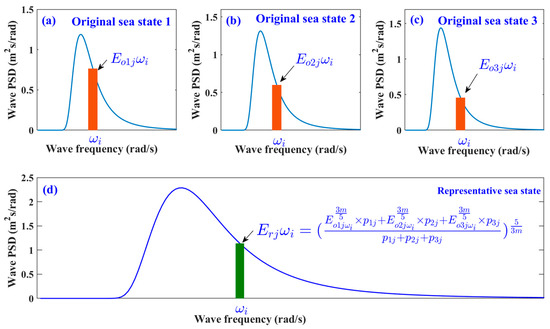
Figure 5.
Illustration of the relationship between wave energy of the RSS and OSSs related to wave frequency . (a) Wave PSD for original sea state 1, (b) Wave PSD for original sea state 2, (c) Wave PSD for original sea state 3, (d) Wave PSD for representative sea state.
The wave energy distribution of the RSS can be obtained by applying Equation (18) to all of the wave frequencies of the OSS in the block. Then, the spectral moments of the th RSS, including the zeroth, first and second spectral moments, can be calculated based on its wave energy distribution directly, yielding
where , and are the zeroth, first and second spectral moments of the RSS, and is the number of discretization intervals of the RSS’s wave PSD.
3.3. The Modified Statistical Relationships between Spectral Moments and Wave Parameters
The wave parameters of the RSS, including the and , can be calculated based on the statistical relationships between the spectral moments and wave parameters. However, many researchers have shown that the fatigue damage contributed by the RSS is closely related to the number of OSSs in the block and the bandwidth of the RSS [17,25]. According to the commonly utilized statistical relationship, the significant wave height is only related to the zeroth spectral moment, which can be determined from the energy distribution. Therefore, the parameters that have an influence on the energy distribution of the RSS should be introduced to construct the correction factor for the significant wave height. Firstly, the wave energy distribution of the OSS is closely related to the wave spectrum and the spectrum’s enhancement factor, and the spectrum’s enhancement factor has a significant influence on the energy distribution of the RSS in turn. Therefore, the effect of the spectrum’s peak enhancement factor should be taken into consideration.
Secondly, the lumping block usually contains several OSSs, and the energy distribution is different for OSSs with different significant wave heights and up-crossing periods. The energy distribution of the RSS determined from the energy distribution of the OSS is usually a broadband spectrum, which cannot be depicted by the standard wave spectrum. The difference between the calculated wave energy distribution and the theoretical wave energy distribution depicted by a standard wave spectrum can be characterized by the equivalent bandwidth. Therefore, the effect of the equivalent bandwidth of the RSS should be considered.
Thirdly, the significant wave heights and up-crossing periods encompassed by the block increase as the number of OSSs in the block increases, and the fatigue damage contributed by the low-frequency cycles associated with the OSS with very long periods, and the high-frequency cycles associated with the OSSs with very small periods, will be suppressed by the representative sea state. Therefore, a factor related to the number of original sea states in the block should be introduced to amplify the wave energy distribution to obtain conservative results.
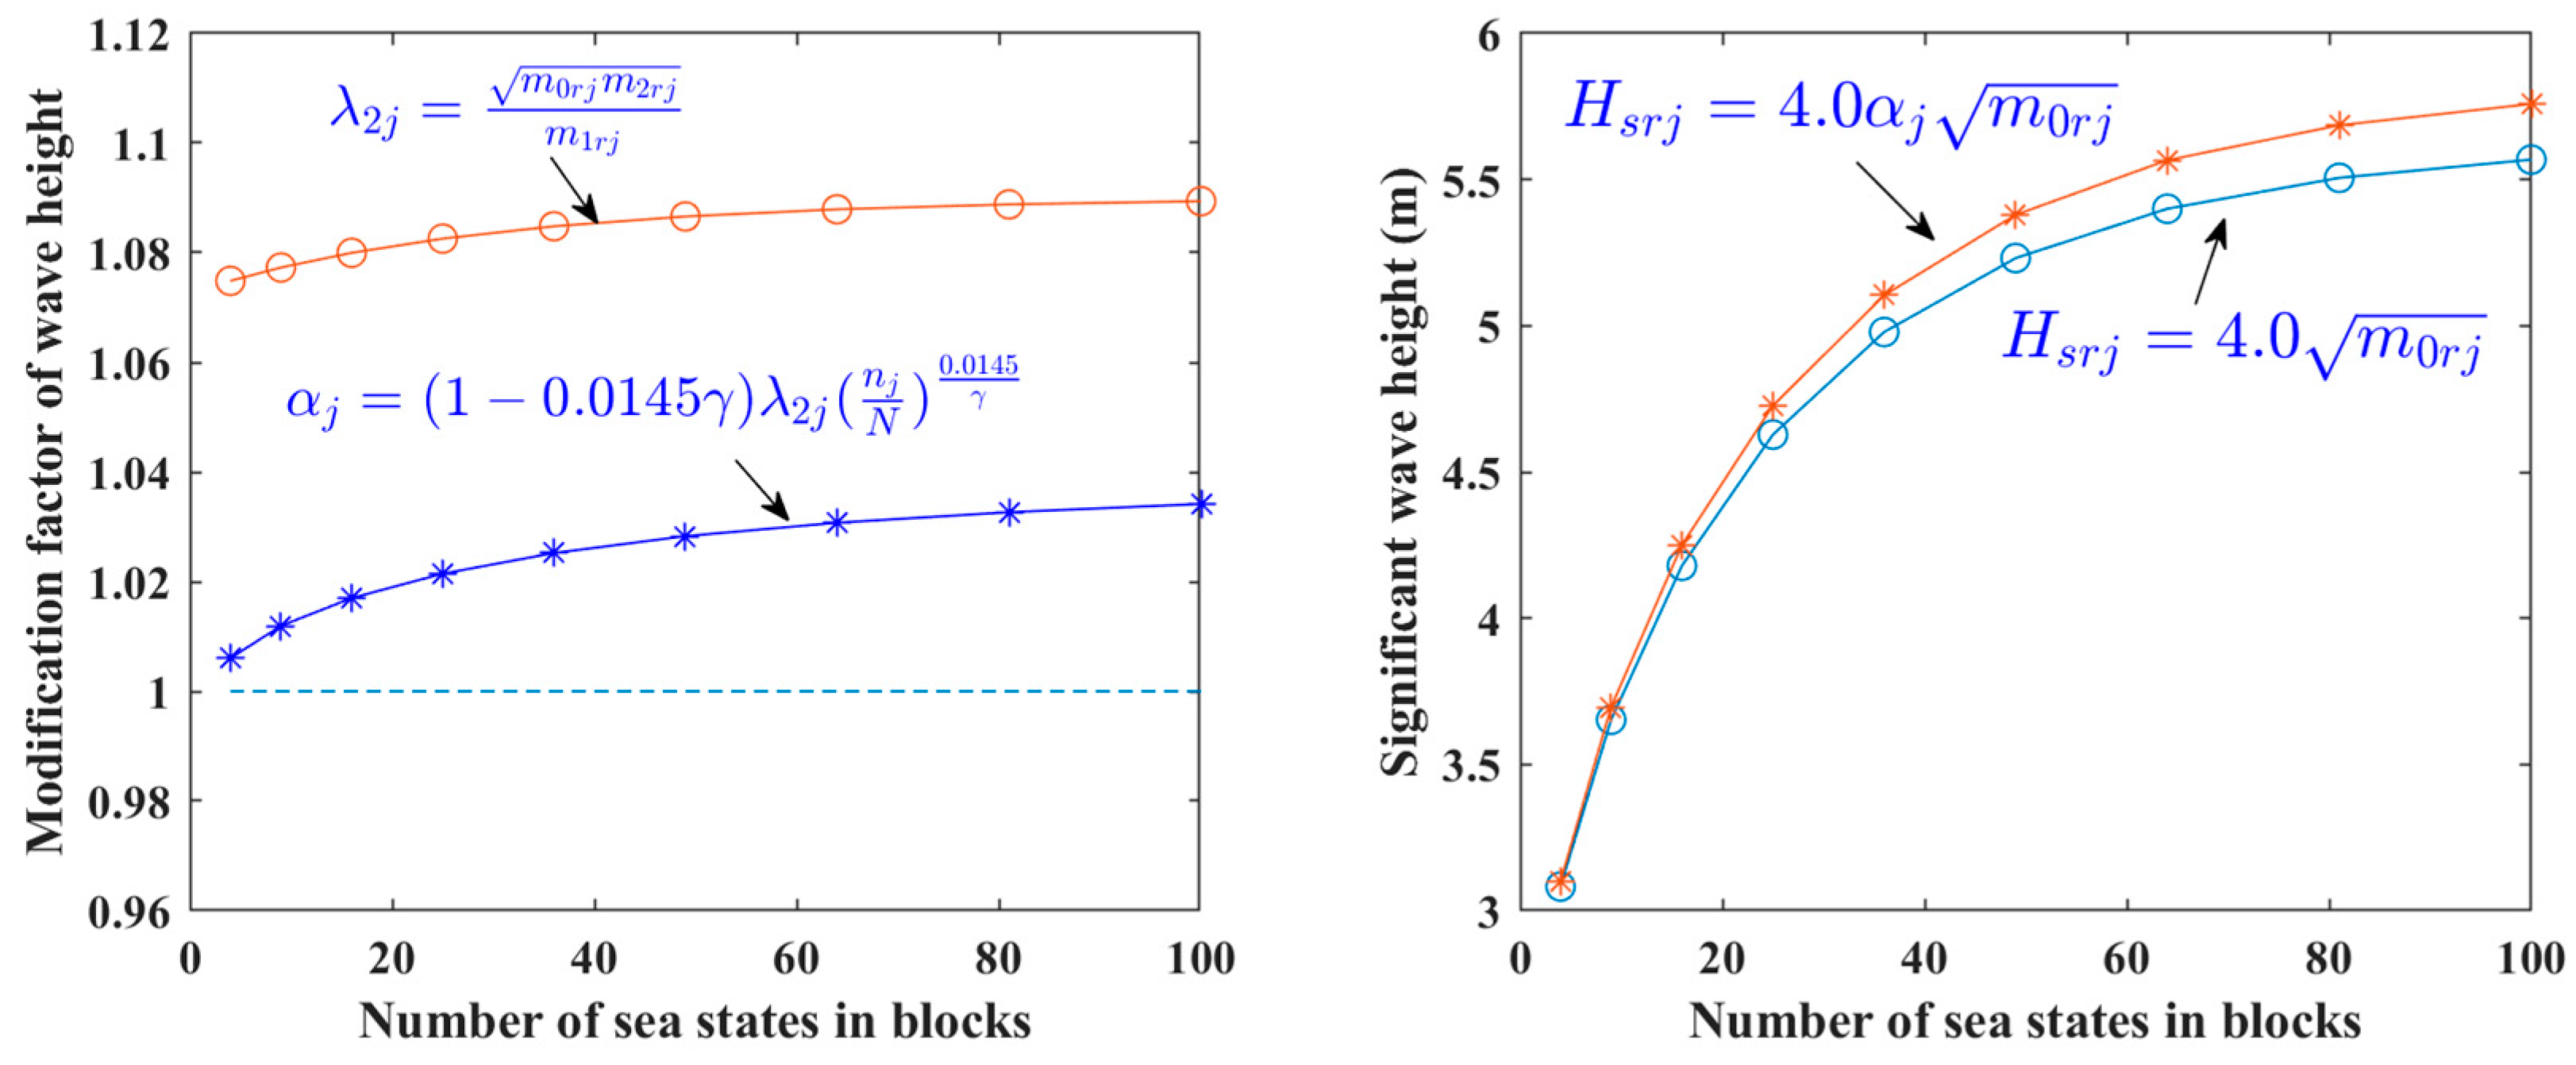
Since it is a modification of the commonly utilized statistical relationship, the correction factor should vary slightly with the input parameters. In this paper, the correction factor related to the spectrum’s peak enhancement factor , the number of OSSs and the bandwidth of the RSS are introduced for the of the RSS in exponent form, and it can be given as
where N is the number of OSSs in the wave scatter diagram; is the equivalent bandwidth of the th RSS and ; the coefficient “0.0145” is obtained from the simulation data via the regression algorithm.
As illustrated in Figure 6, the correction factor increases slightly as the number of OSSs in the th block increases. In addition, the of the RSS calculated based on the modified statistical relationship is slightly larger than those calculated based on the commonly utilized statistical relationship (i.e., ), and the discrepancies between them increase as the number of OSSs increases. It should be mentioned that the correction factor will approach 1.0 as the number of OSSs decreases to 1, and the of the RSS will approach the of the OSS.
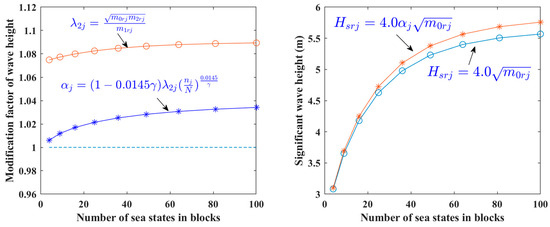
Figure 6.
Relation of the correction factor and the number of OSSs in the block.
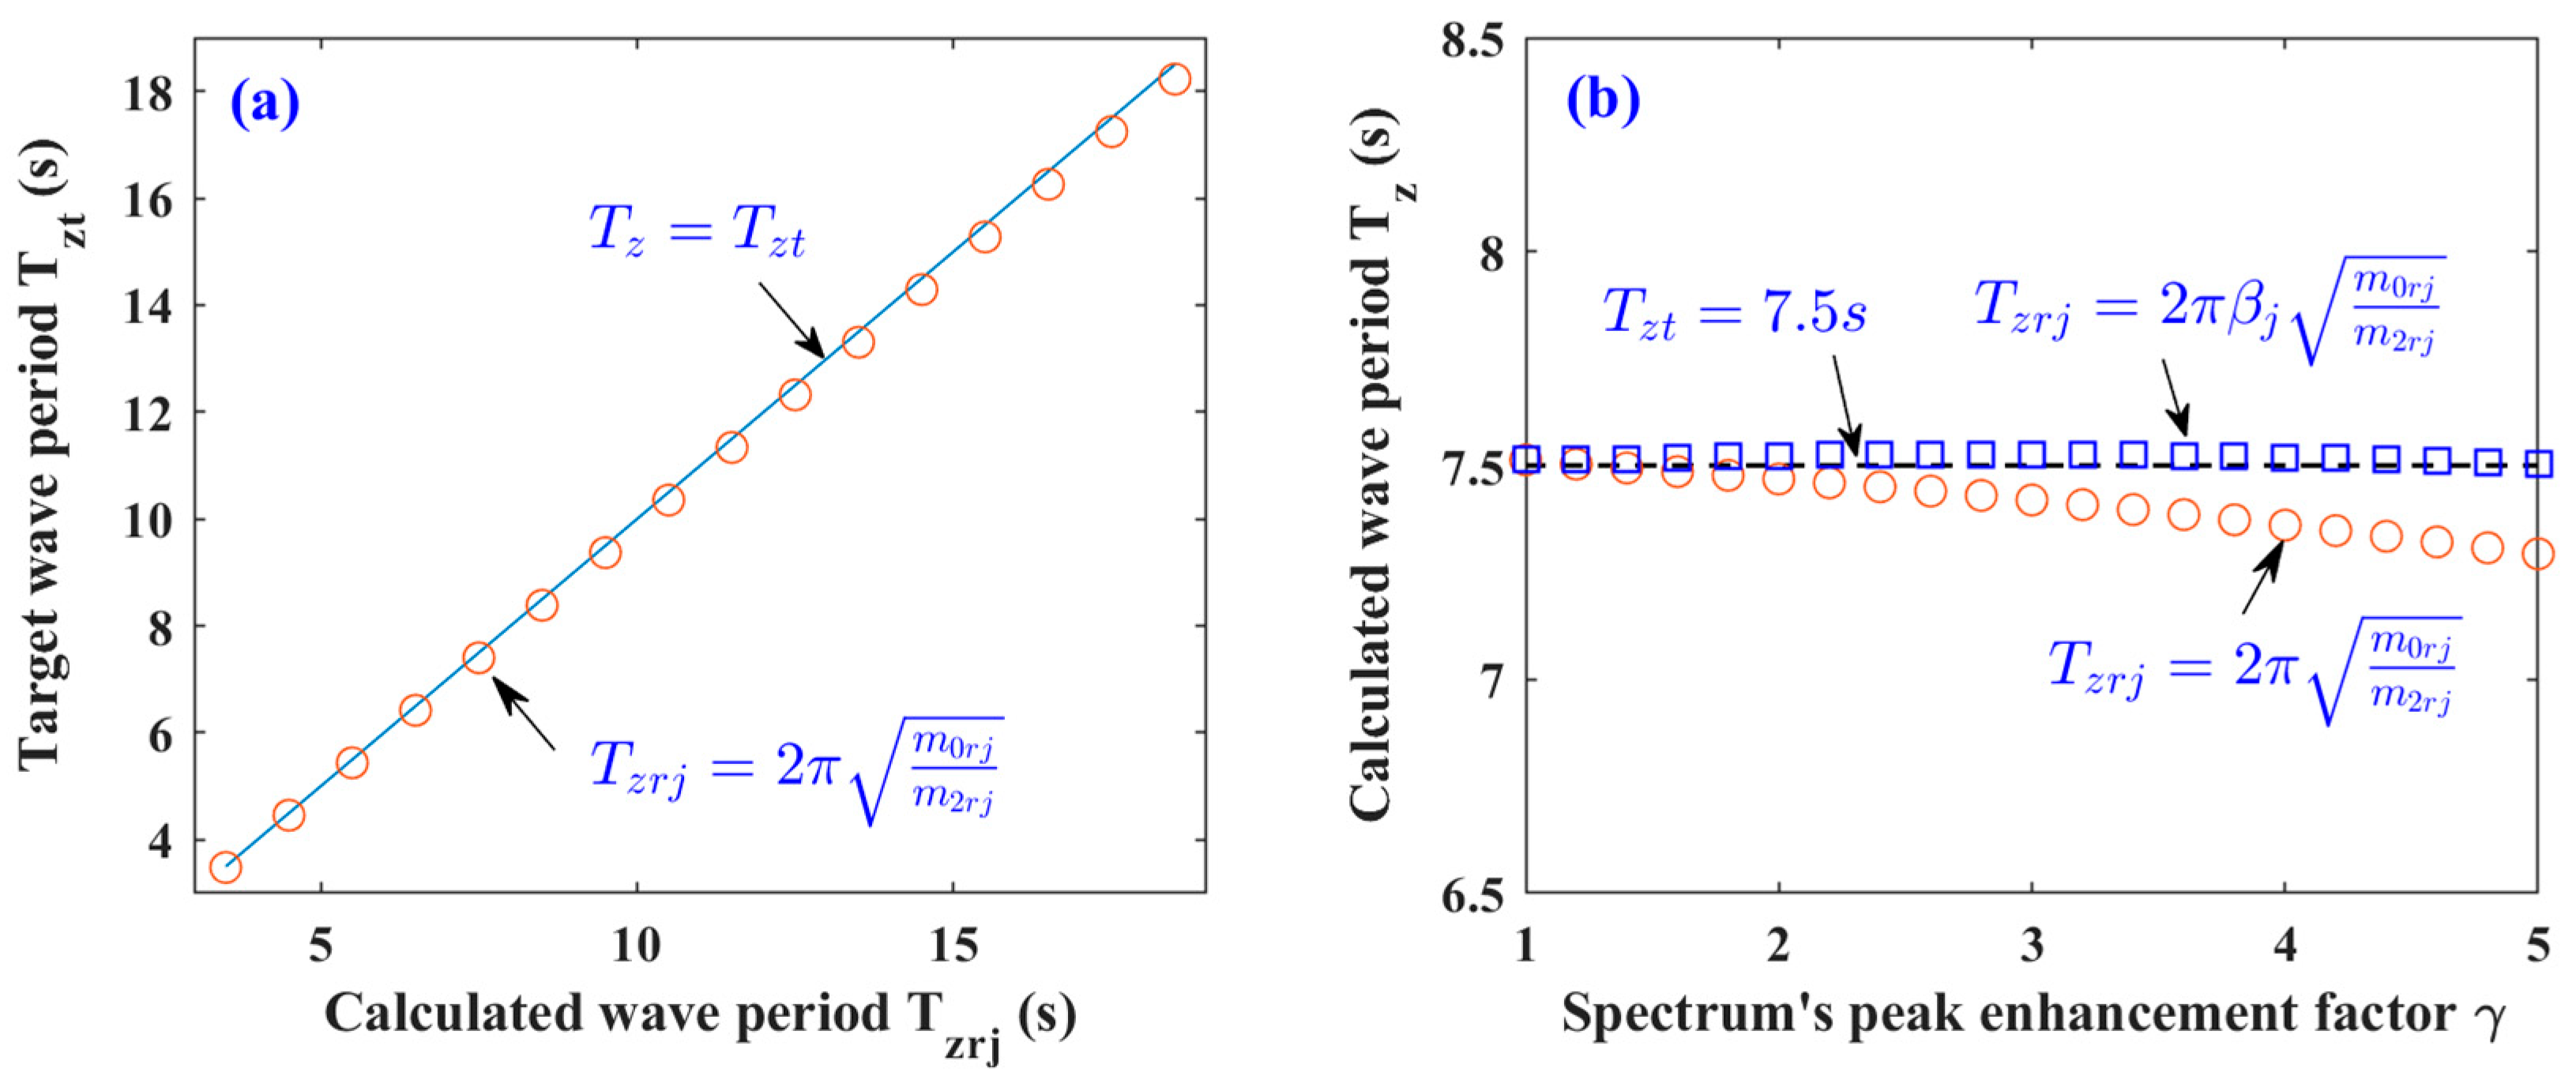
The of the RSS calculated based on the commonly utilized statistical relationship (i.e., ) is close to the target ones when the spectrum’s enhancement factor is identical to 1.0, as presented in Figure 7a. However, the of the RSS determined from the commonly utilized statistical relationship is smaller than the target ones when the spectrum’s enhancement factor is larger than 1.0, and the discrepancies between them increase as the parameter increases, as illustrated in Figure 7b. As the up-crossing period is very close to the cycle number of the response, which is very important for fatigue damage, the spectrum’s peak enhancement factor should be incorporated into the correction factor to allow the calculated up-crossing period to match the target ones.
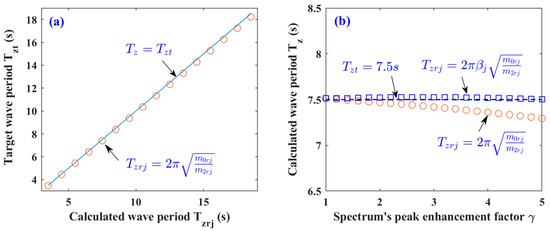
Figure 7.
The relation of correction factor and spectrum’s peak enhancement factor. (a) Wave period calculated by the commonly utilized statistical relationship with γ of 1.0, (b) Wave period calculated by the commonly utilized and modified statistical relationships with different γ value.
In this study, a correction factor related to the spectrum’s peak enhancement factor is introduced for the of the RSS, and it can be given as
where coefficient “0.0072” is obtained from the simulation data via the regression algorithm.
As illustrated in Figure 7b, after considering the effect of the spectrum’s peak enhancement factor , the of the RSS determined from the modified statistical relationship are in perfect agreement with the target ones, and the correction factor will approach 1.0 as the spectrum’s enhancement factor decreases to 1.0.
3.4. Wave Parameters of the RSS
The and of the RSS can be determined from the following formulae:
The WEE LBEM simply depends on the wave energy and occurrence probability of the OSSs in the block, which is very easy achieve for practicing engineers. In addition, the spectral moments adopted to calculate the wave parameters of the RSS can be obtained from its wave energy distribution directly, which gives the proposed LBEM more physical significance compared to the conventional LBEMs.
4. Numerical Model and Environmental Conditions
4.1. Numerical Model
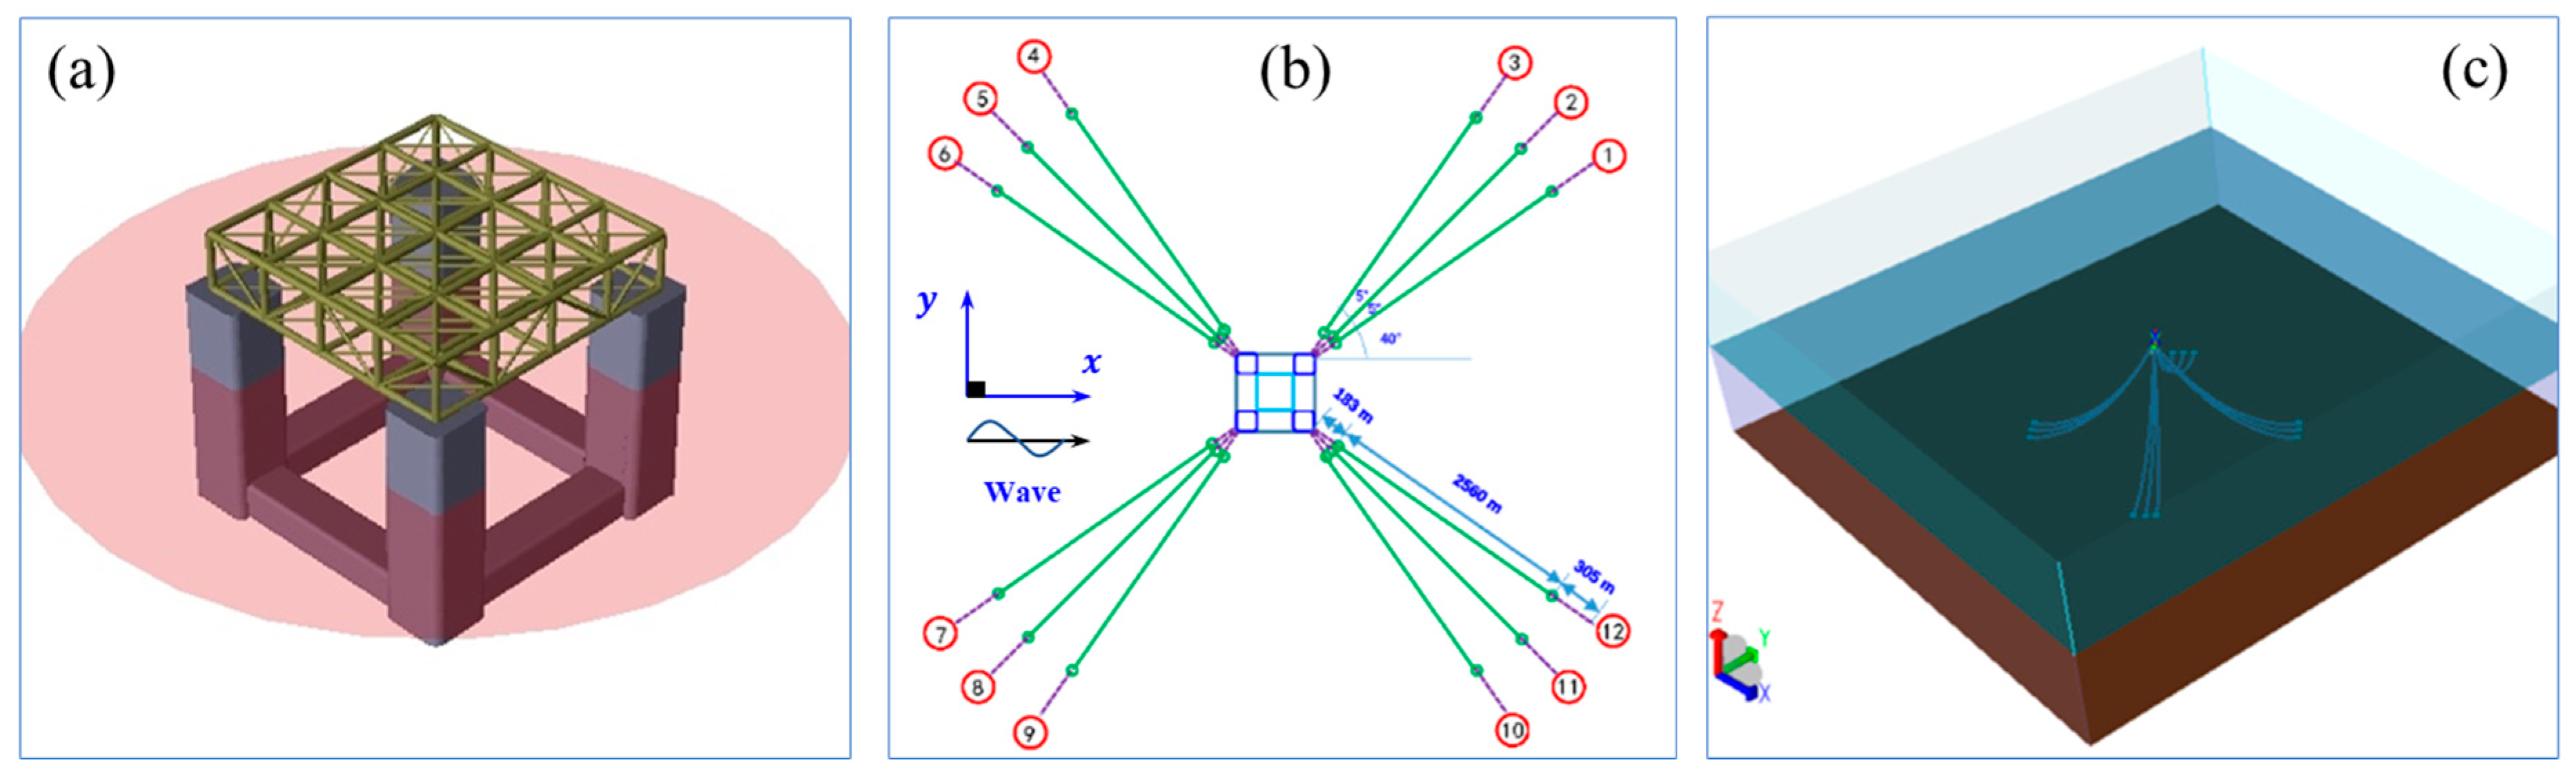
The semi-submersible (SEMI) platform adopted in Song and Wang’s research is adopted in this study to investigate the effectiveness of the proposed WEE LBEM [11,18]. As shown in Figure 8a, the SEMI is a deep-draft platform where four large columns are connected together with a ring pontoon. The SEMI operates at a water depth of 1828.8 m and is positioned with 12 mooring lines. These mooring lines are composed of three different components and grouped into four bundles that connect to the SEMI with the fairleads at each corner, as illustrated in Figure 8b. The main specifications of the SEMI and the mooring lines are summarized in Table 1 and Table 2, respectively.

Figure 8.
Illustration of the SEMI: (a) semi-submersible platform; (b) layout of mooring system; (c) dynamic analysis model.

Table 1.
Main specifications of the SEMI.
Table 2.
Main specifications of mooring lines.
The numerical simulations are conducted in the DNV-SESAM software with the coupled dynamic analysis model, as illustrated in Figure 8c. In the numerical simulation, the head wave is defined as propagating along the -axis, and the simulation duration is set to 10,800 s (i.e., 3 h) with a time step of 0.1 s for each study case.
4.2. Environmental Conditions
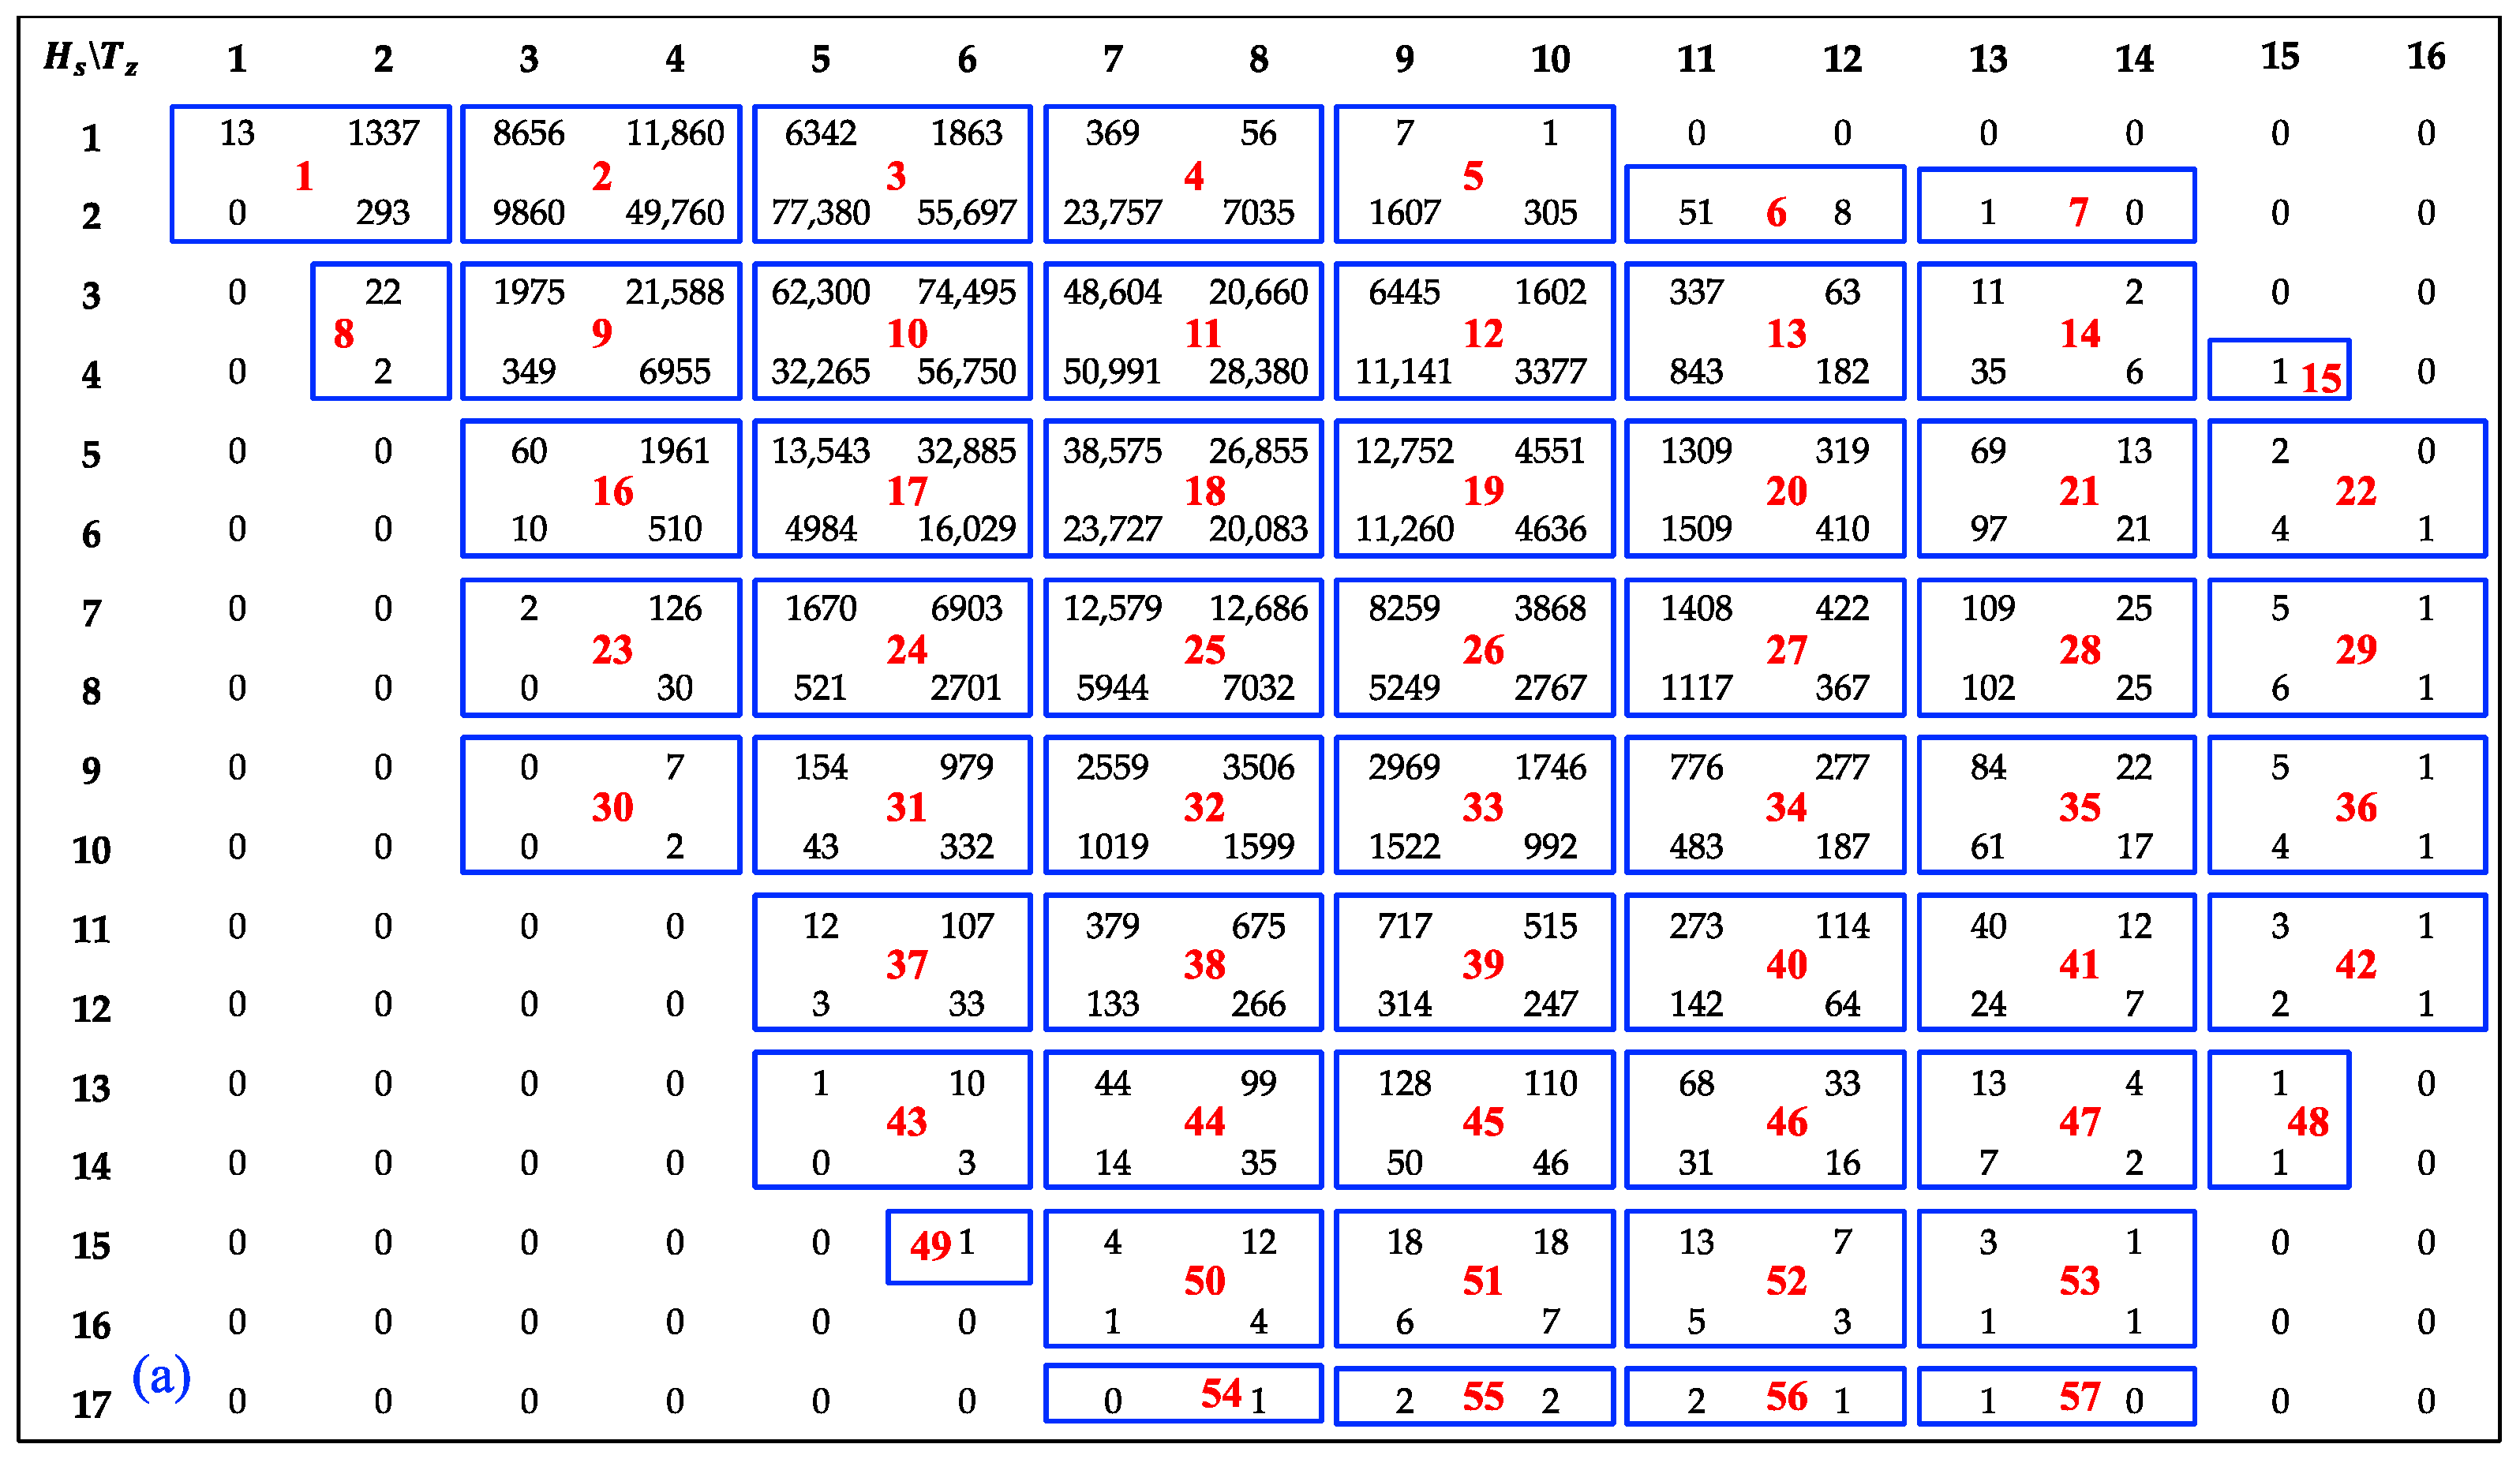
In engineering practice, the wind and current loads on SEMI are usually simplified as a constant load, which generally causes the mean offset of the SEMI, and they have little contribution to the structure’s fatigue damage [4]. Therefore, only the wave hydrodynamic loads on the SEMI are of concern in this study. To estimate the cumulative fatigue damage of the mooring lines occurring at the fairleads of SEMI, the long-term wave condition should be considered, which is usually discretized into a series of short-term sea states represented by the wave scatter diagram in engineering practice. A typical wave scatter diagram in the North Sea, which includes 197 short-term sea states, is illustrated in Table 3.
Table 3.
A typical wave scatter diagram in the North Sea.
4.3. Wave Scatter Diagram Discretization
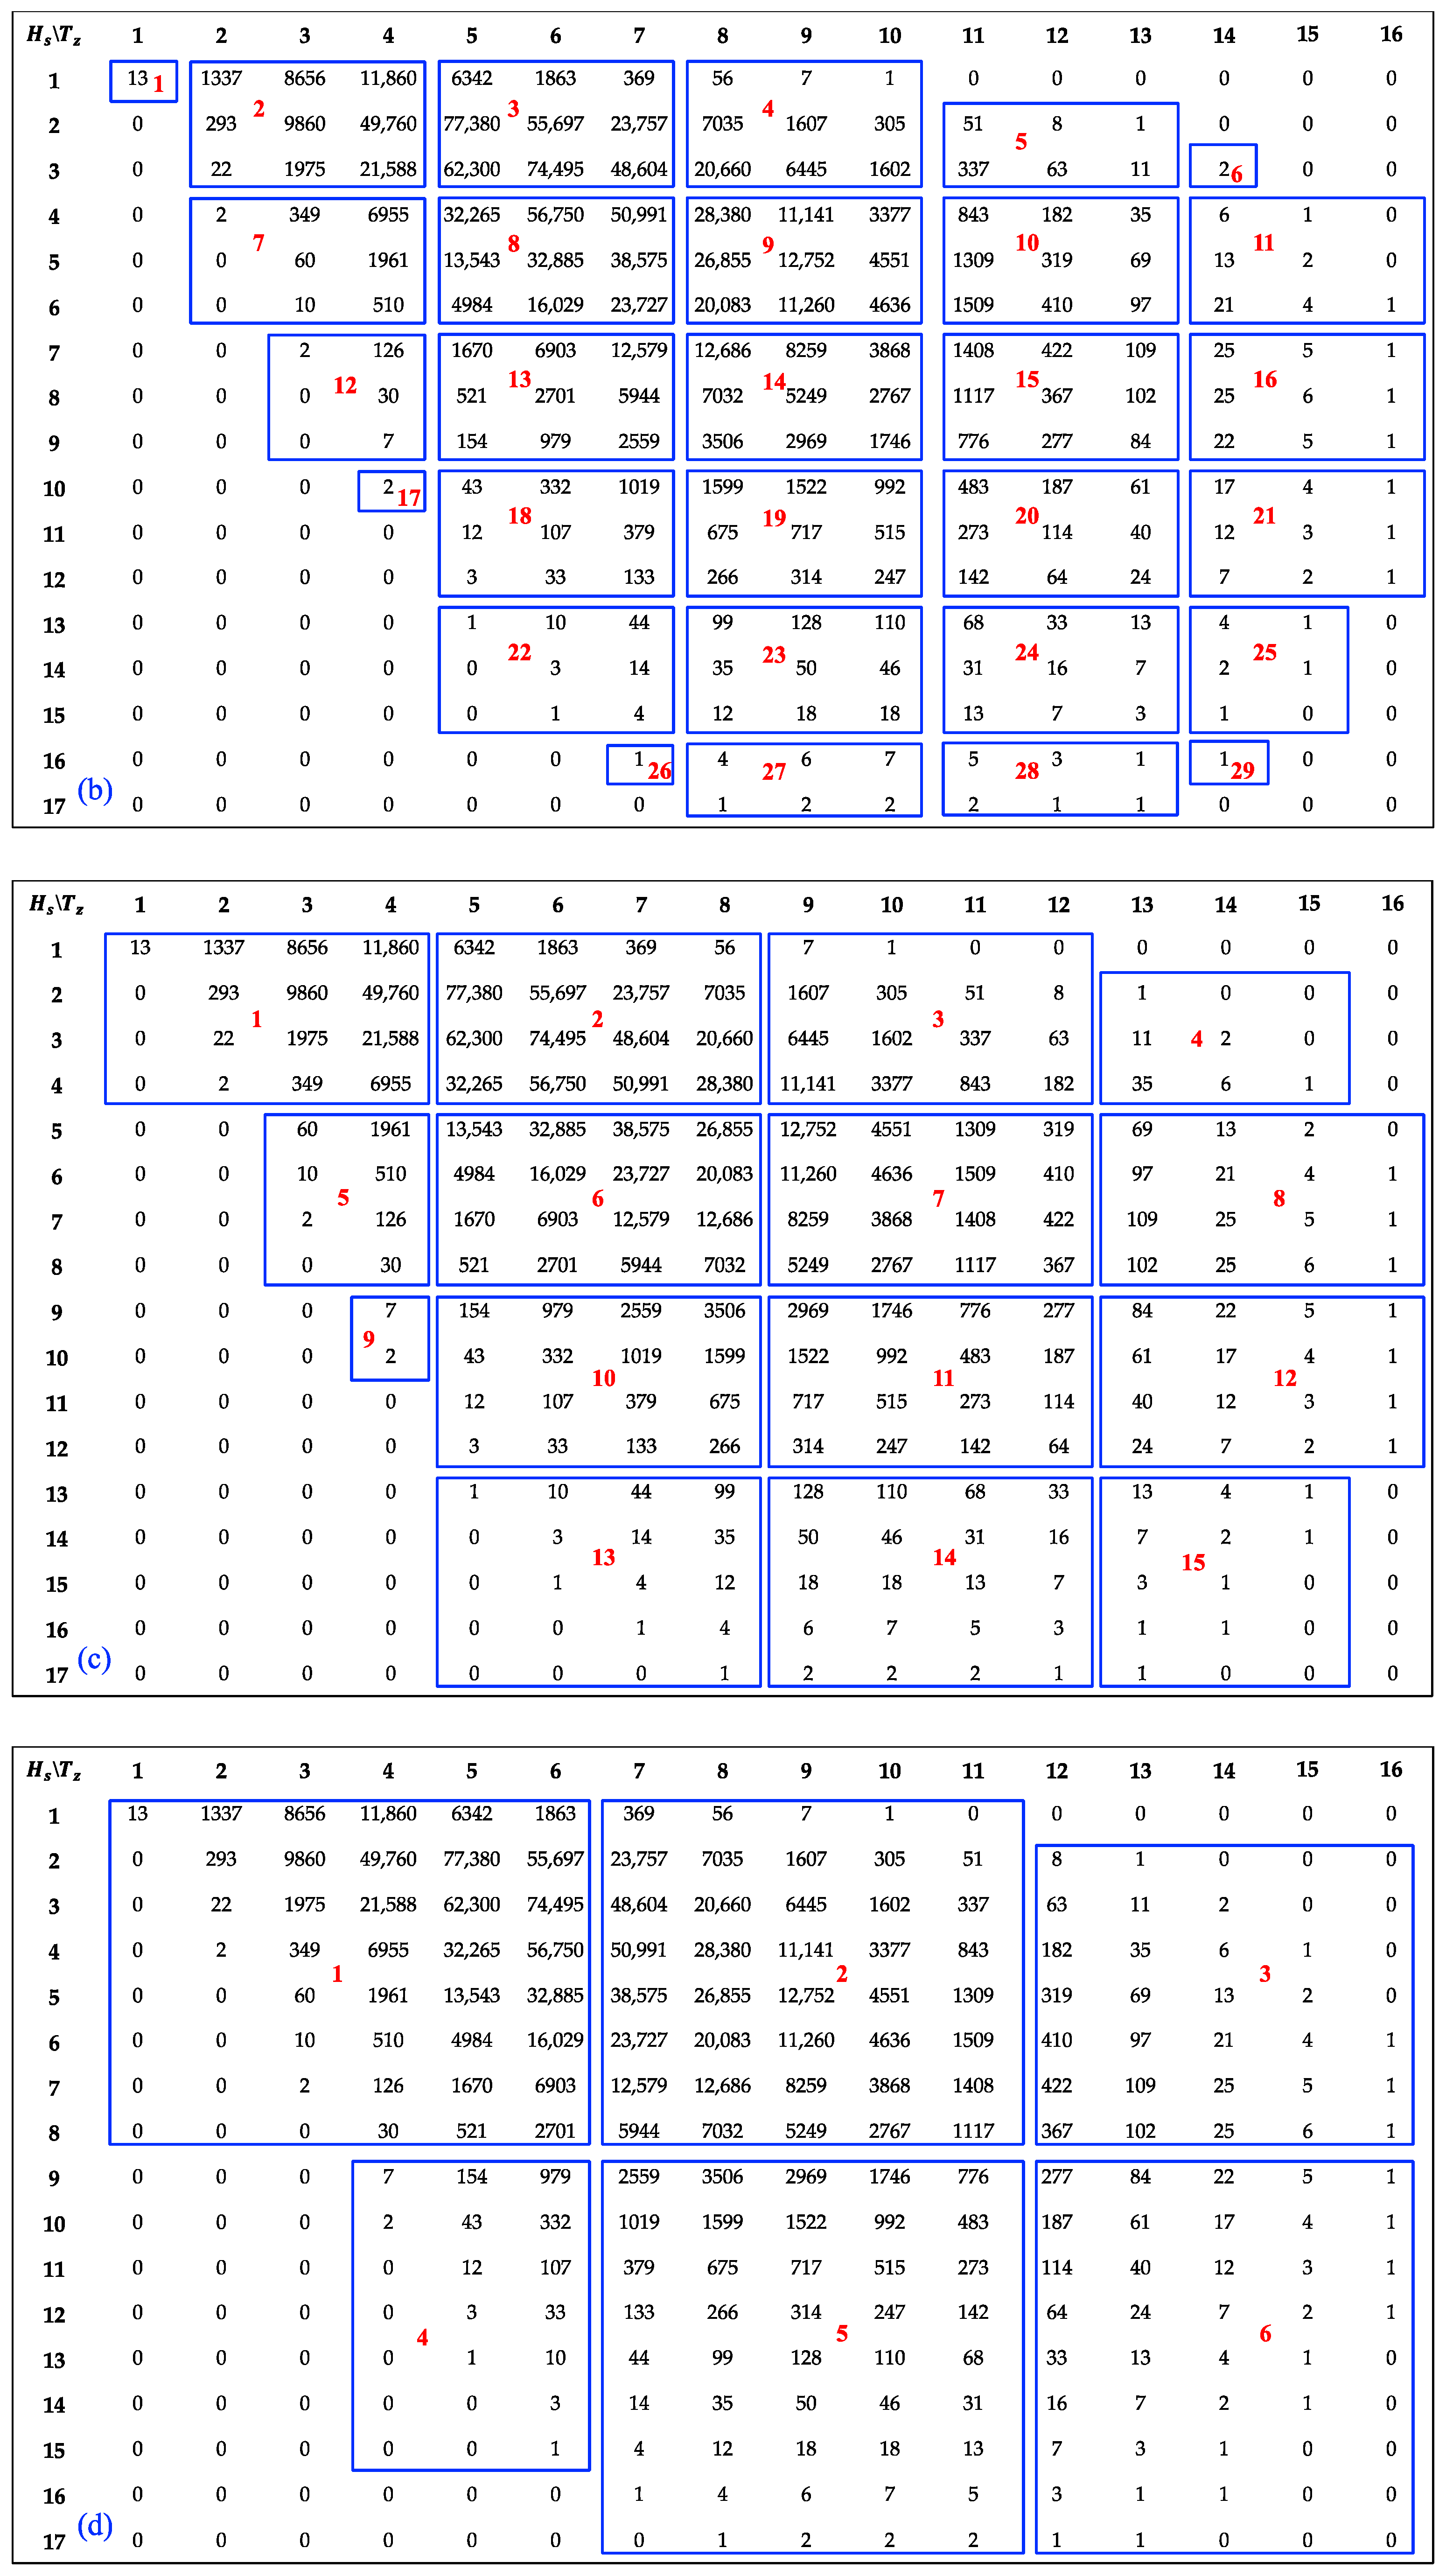
To examine the applicability of the proposed WEE LBEM to different lumping block partition cases, the OSSs in the wave scatter diagram illustrated in Table 3 are lumped into 57, 29, 15 and 6 blocks according to a specific rule, respectively. Taking the 57-block case, for example, OSSs in adjacent rows and columns are lumped into a block, as illustrated in Figure 9a. Similarly, OSSs in adjacent 3 rows and 3 columns, 4 rows and 4 columns, 6 rows and 8 columns are lumped into a block for 29, 15 and 6 block cases, as illustrated in Figure 9b–d, respectively. Compared with the full wave scatter diagram, the computational effort of the fatigue damage assessment can be reduced by 3.46, 6.79, 13.13 and 32.83 times when the OSSs in the wave scatter diagram are lumped into 57, 29, 15 and 6 blocks, respectively.
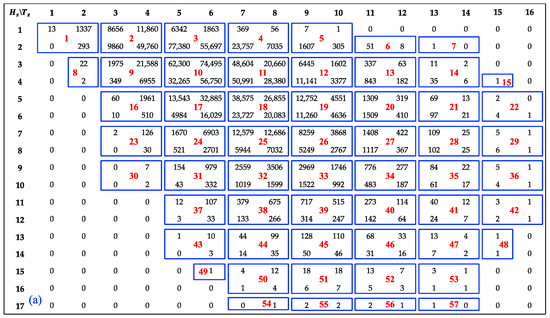
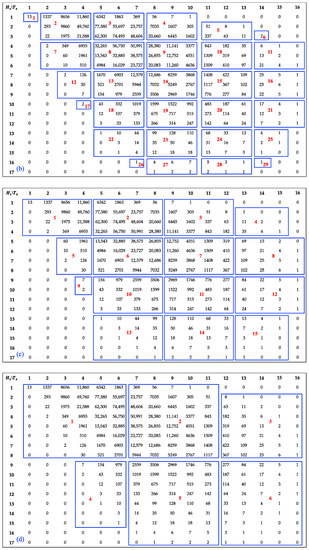
Figure 9.
Wave scatter diagram discretization: (a) 57-block case; (b) 29-block case; (c) 15-block case; (d) 6-block case.
5. Results and Discussion
To examine the effectiveness of the proposed WEE LBEM, two different scenarios are analyzed. The first scenario is that the JONSWAP spectrum is adopted to depict the wave energy distribution of the input sea state, where the spectrum’s peak enhancement factor is set to 3.3, and the performance of the conventional and proposed LBEMs are evaluated. The second scenario is that the Pierson–Moskowitz (P-M) spectrum is adopted to depict the wave energy distribution of the input sea state, where the spectrum’s peak enhancement factor is set to 1.0, and the applicability of the proposed WEE LBEM to various spectra is investigated.
5.1. Wave Parameters of the RSS
The wave parameters of the RSS are first calculated based on these five LBEMs, and the six-block case is selected to demonstrate the discrepancies in the wave parameters determined from different LBEMs. The comparison results related to the JONSWAP spectrum with of 3.3 are listed in Table 4 and Table 5, respectively.
Table 4.
of the RSS resulting from different LBEMs.
Table 5.
of the RSS resulting from different LBEMs.
As can be seen from Table 4, the discrepancies in the significant wave heights resulting from the different LBEMs are remarkable for a specific block. Taking block 1, for example, the significant wave heights determined from the DNV, Sheehan, Jia, SME and WEE methods are 8.500 m, 7.500 m, 3.237 m, 3.561 m and 3.584 m, respectively. The significant wave height determined from the DNV LBEM is slightly larger than that resulting from the Sheehan LBEM, but both of them are much larger than those calculated by the other three LBEMs. While the significant wave height determined from the Jia LBEM is slightly smaller than that calculated by the SME LBEM, both of them are slightly smaller than that resulting from the WEE LBEM. Similar variation trends can be found for the other five blocks.
From Table 5, one can find that the up-crossing periods determined from the DNV LBEM are smaller than those determined from the Sheehan LBEM for the block 1 and 4 cases, but larger than those resulting from the Sheehan LBEM for the block 2, 3, 5 and 6 cases. The up-crossing periods calculated by the Sheehan LBEM are identical to those calculated by the Jia LBEM for the same theories used to calculate the up-crossing periods. The up-crossing period calculated by the Sheehan and Jia LBEMs is slightly smaller than that calculated by the SME LBEM for the block 1 case, but larger than those calculated by the SME LBEM for the block 2–6 cases. It is notable that the up-crossing periods resulting from the WEE LBEM are slightly larger than those resulting from the Sheehan, Jia and SME LBEMs.
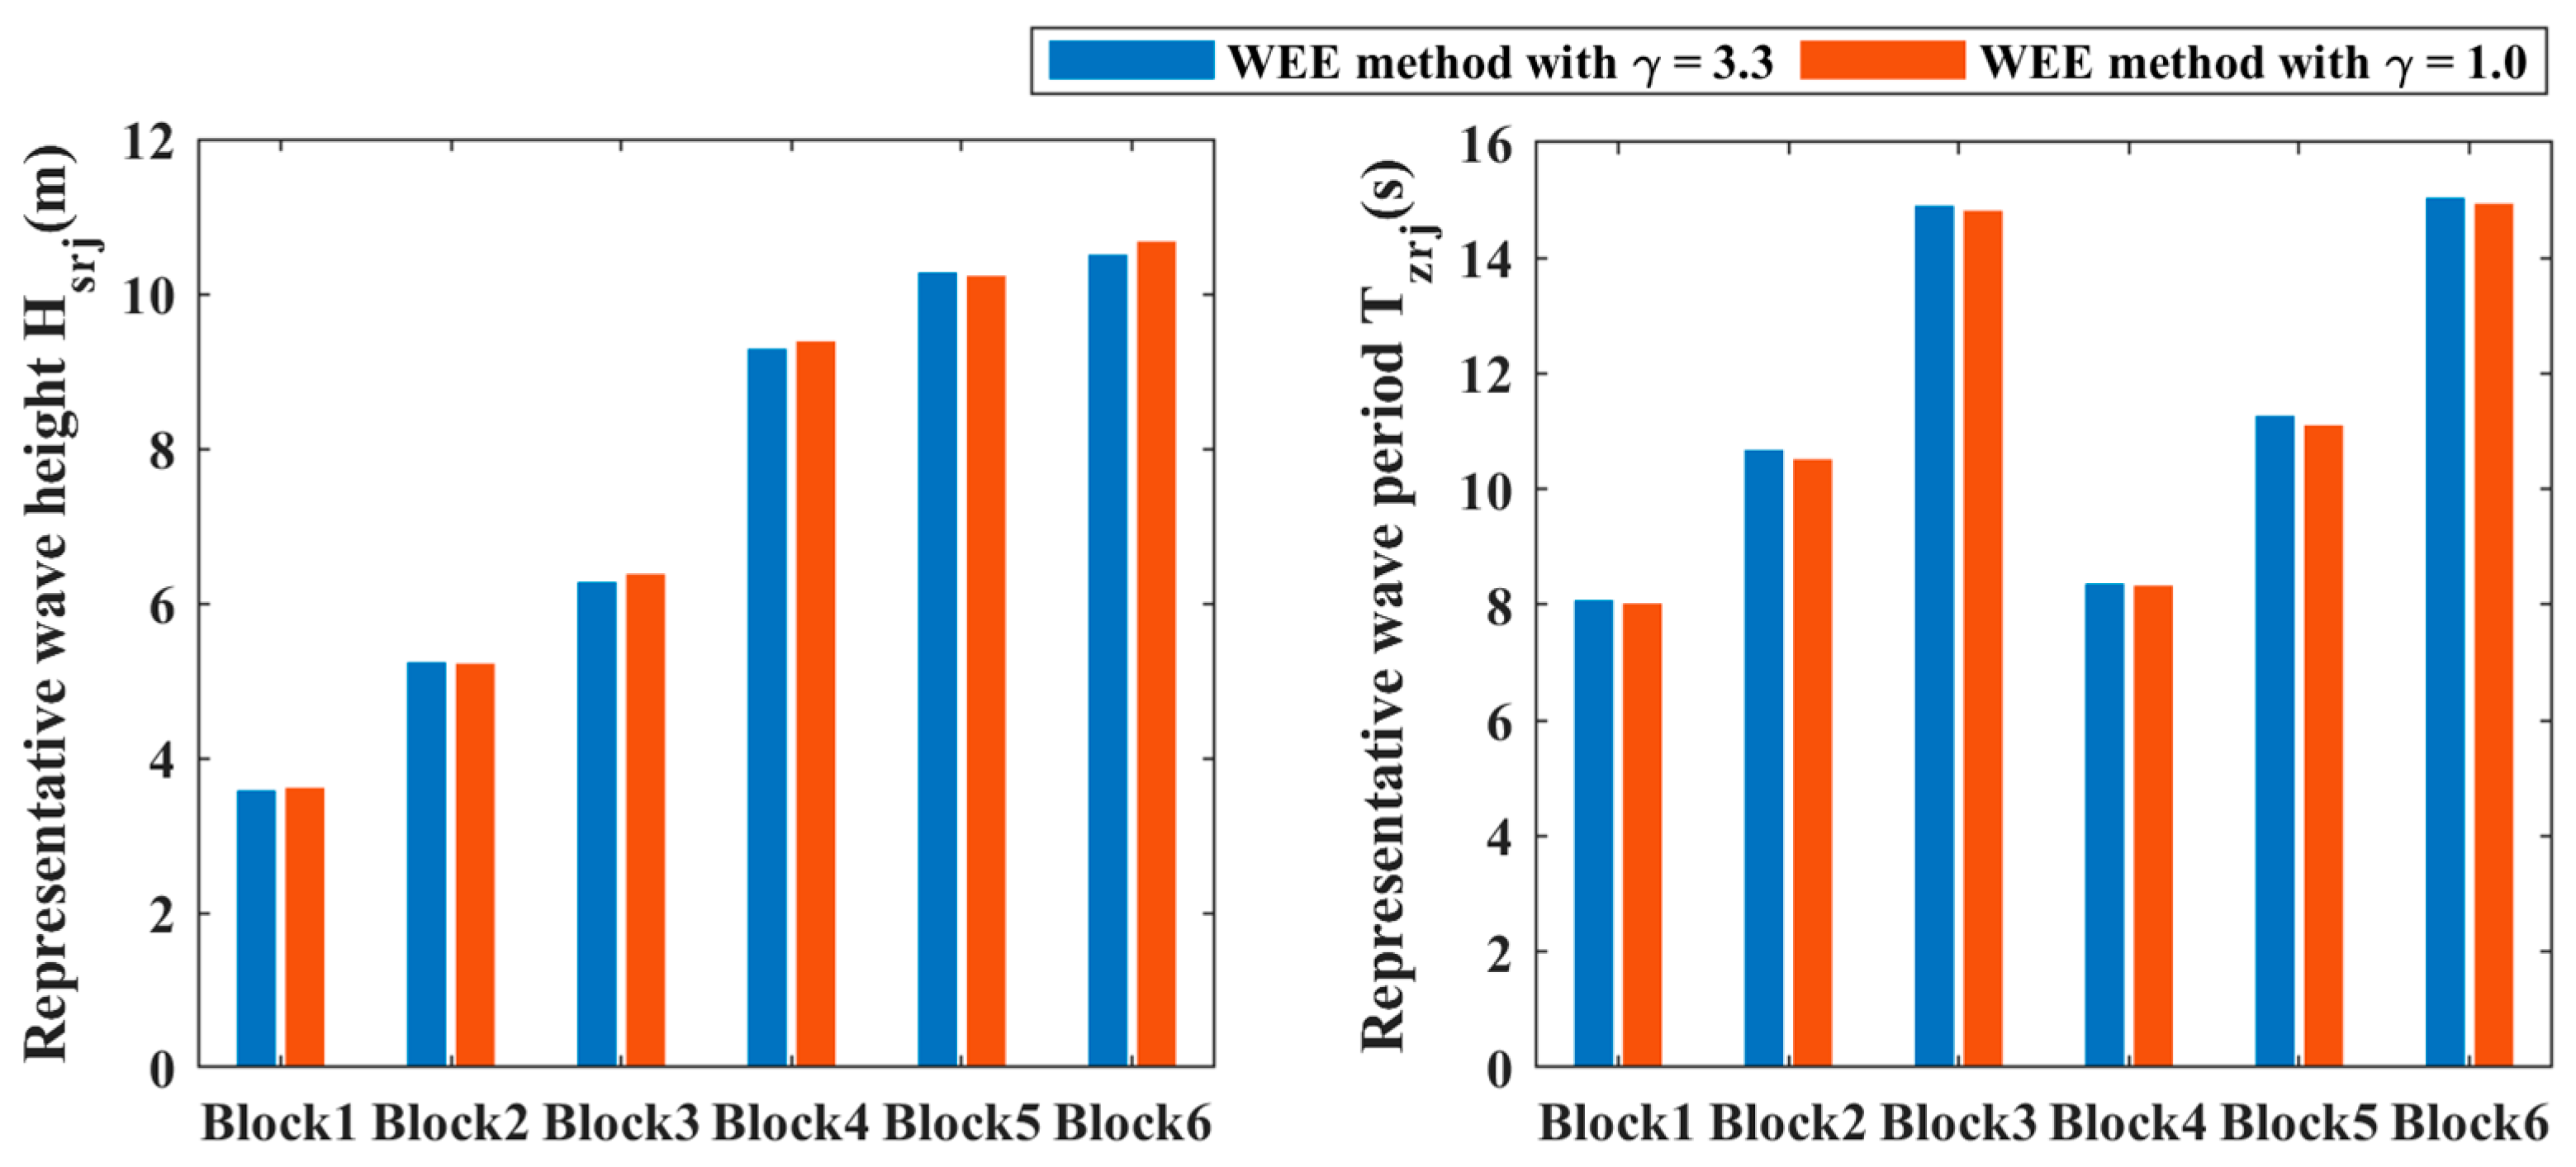
To examine the applicability of the proposed WEE LBEM to various wave spectra, the wave parameters of the RSS related to the JONSWAP and P-M spectra are calculated, and the results are presented in Figure 10. From the figure, one can find that the spectrum’s peak enhancement factor has a slight influence on the wave parameters of the RSS. The of the RSS calculated by the proposed WEE LBEM with is slightly larger than that calculated by the proposed WEE LBEM with . Nevertheless, the of the RSS calculated by the proposed WEE LBEM with is slightly smaller than that calculated by the proposed WEE LBEM with . Similar variation trends are found for the RSSs for the 57-, 29- and 15-block cases, but the results are not shown here due to space limitations.
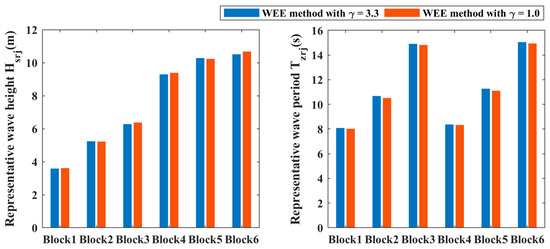
Figure 10.
Wave parameters of the RSSs calculated by the proposed WEE LBEM related to different wave spectra.
5.2. Fatigue Damage of Mooring Lines Related to the JONSWAP Spectrum
The fatigue damage of mooring lines accumulated at the fairleads of SEMI under the RSSs and OSSs is estimated via the time-domain fatigue assessment method. To clearly illustrate the performance of the LBEMs, the mooring lines’ fatigue damage contributed by the RSSs is normalized to the fatigue damage contributed by all the OSSs in the wave scatter diagram. The normalized fatigue damage of mooring lines 4 and 6 related to the JONSWAP spectrum is summarized in Table 6 and Table 7, respectively.
Table 6.
Normalized fatigue damage of mooring line 4 resulting from different LBEMs related to JONSWAP spectrum.
Table 7.
Normalized fatigue damage of mooring line 6 resulting from different LBEMs related to JONSWAP spectrum.
Due to the normalization, the analysis indicates that the LBEM underestimates the mooring line’s fatigue damage if the normalized fatigue damage is smaller than one. Otherwise, this means that the LBEM overestimates the mooring line’s fatigue damage. It is worth noting that the fatigue damage estimated by the T-N curve may be smaller than the actual fatigue damage. If the fatigue damage is further underestimated by the lumping block equivalent method, the offshore structure will be in a dangerous condition. The underestimation of fatigue damage is undesirable in engineering practice.
It can be seen from the tables that the fatigue damage of the mooring lines resulting from these five LBEMs shows similar characteristics for various mooring lines. The mooring lines’ fatigue damage resulting from the DNV LBEM is much larger than the benchmark value. Taking mooring line 4, for example, the overestimation level of the DNV LBEM is approximately 147.76% for the 57-block case, and it reaches approximately 1311.94% for the six-block case. As a result, the DNV LBEM overestimates the mooring lines’ fatigue damage significantly. In addition, the mooring lines’ fatigue damage resulting from the Sheehan LBEM is much larger than the benchmark value, and the overestimation level increases from 29.33% to 512.59% as the number of partitioned blocks in the wave scatter diagram decreases from 57 to 6. Although the Sheehan LBEM overestimates the mooring lines’ fatigue damage remarkably as well, its overestimation level is much smaller than that of the DNV LBEM. The reason for this phenomenon is that the effect of the sea state’s occurrence probability is taken into consideration in the process of determining the wave parameters of the RSS and a smaller is selected.
Different from the DNV and Sheehan LBEMs, the mooring lines’ fatigue damage resulting from the Jia LBEM is consistently smaller than the benchmark value. This means that the Jia LBEM always underestimates the mooring lines’ fatigue damage. When the number of OSSs in the block increases, the underestimation level of the Jia LBEM increases significantly, and the largest underestimation level can reach 13.89%. In contrast to the Jia LBEM, the mooring line fatigue damage related to the SME LBEM is slightly larger than the benchmark value for the 57-block case, but it is slightly smaller than the benchmark value for the 29-, 15- and 6-block cases. Taking mooring line 4, for example, the overestimation and underestimation levels of the SME LBEM are 4.07%, 1.98%, 0.91% and 1.88% for the 57-, 29-, 15- and 6-block cases, respectively. The underestimation level of the SME LBEM is much smaller than that of the Jia LBEM. This means that the SME LBEM gives more accurate fatigue damage predictions than the Jia LBEM.
A noteworthy observation is that the mooring lines’ fatigue damage contributed by the proposed WEE LBEM is close to and always larger than the benchmark values. Different from the DNV and Sheehan LBEMs, the overestimation level of the proposed WEE LBEM increases slightly as the number of OSSs in the block increases, and the largest overestimation level is approximately 10%. In contrast to the Jia and SME LBEMs, the mooring lines’ fatigue damage related to the proposed WEE LBEM is consistently larger than the benchmark value, and it can maintain its accuracy for different lumping block cases. These characteristics show that the proposed WEE LBEM yields the most accurate fatigue damage prediction, and it has robustness to different lumping block partitions.
5.3. Fatigue Damage of Mooring Lines Related to the P-M Spectrum
To fully investigate the applicability of the proposed WEE LBEM, the mooring lines’ fatigue damage related to the P-M spectrum is further estimated with the time-domain fatigue assessment method. Similar to the results related to the JONSWAP spectrum, the fatigue damage of mooring lines resulting from the RSSs is normalized to the fatigue damage contributed by all of the OSSs in the wave scatter diagram, and the normalized fatigue damage for mooring lines 4 and 6 is listed in Table 8 and Table 9, respectively.
Table 8.
Normalized fatigue damage of mooring line 4 resulting from different LBEMs related to P-M spectrum.
Table 9.
Normalized fatigue damage of mooring line 6 resulting from different LBEMs related to P-M spectrum.
There are five features worthy of attention in Table 8 and Table 9. First, the mooring lines’ fatigue damage contributed by the five LBEMs shows similar variation trends for different mooring lines. Second, the DNV and Sheehan LBEMs still overestimate the mooring lines’ fatigue damage remarkably. When the number of OSSs in the block increases, the overestimation level increases dramatically, showing similar characteristics to the results under the JONSWAP spectrum.
Third, the Jia LBEM still underestimates the mooring lines’ fatigue damage. When the number of OSSs in the block increases, the underestimation level increases significantly, and the largest underestimation level is approximately 25.31%, which is much larger than that related to the JONSWAP spectrum. Fourth, the SME LBEM overestimates the mooring lines’ fatigue damage for the 57-block case, but it underestimates the mooring line fatigue damage for the 29-, 15- and 6-block cases. When the number of OSSs in the block increases, the underestimation level increases, and the largest underestimation level is approximately 17.38%, which is much smaller than the results related to the JONSWAP spectrum.
The most important feature is that the proposed WEE LBEM yields the most accurate and smallest conservative fatigue damage prediction for the mooring lines among these five LBEMs. When the number of OSSs in the block increases, the overestimation level of the proposed WEE LBEM increases slightly. Taking mooring line 6 as an example, the overestimation levels of the proposed WEE LBEM are 2.22%, 3.94%, 6.40% and 1.37% for the 57-, 29-, 15- and 6-block cases, respectively.
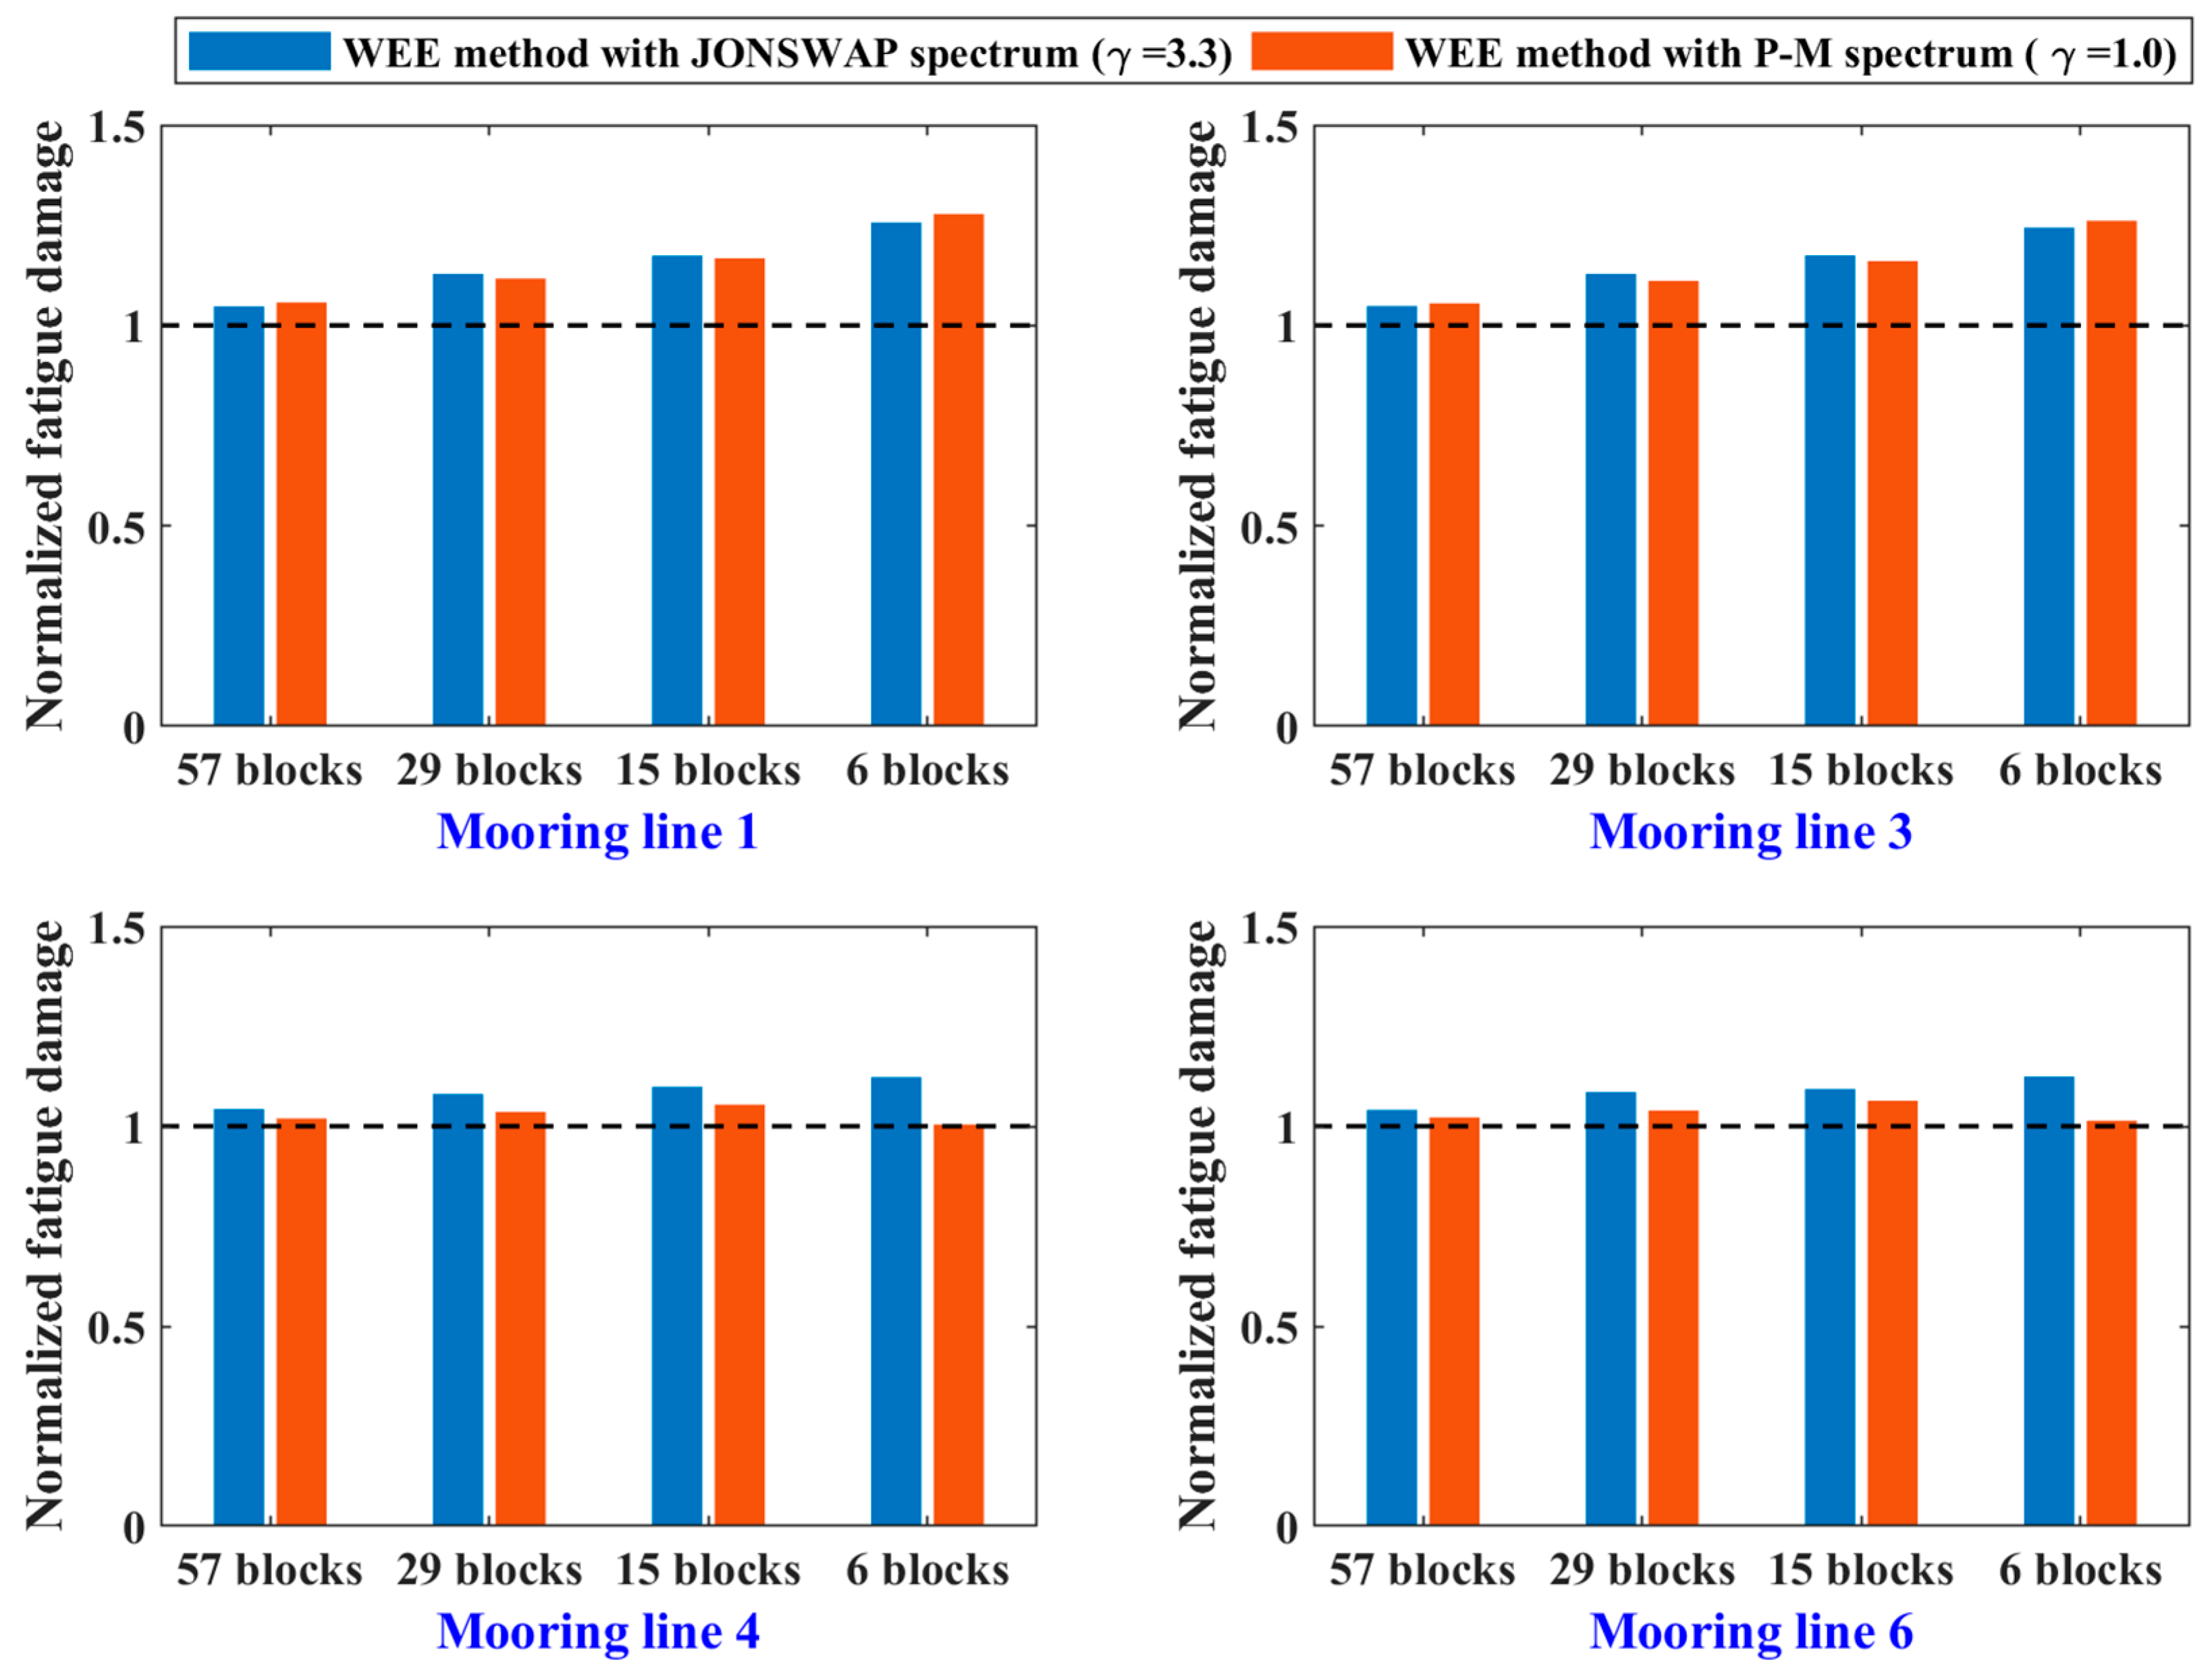
To further examine the applicability of the proposed WEE LBEM to various wave spectra, the normalized fatigue damage of mooring lines related to the JONSWAP and P-M spectra are compared, and the results are presented in Figure 11.
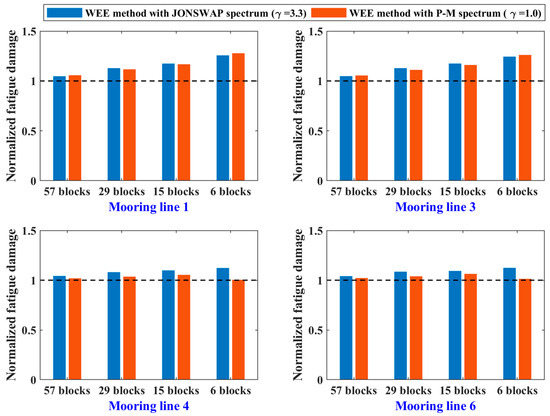
Figure 11.
Normalized fatigue damage of mooring lines contributed by the proposed WEE LBEM related to the JONSWAP and P-M spectra.
It can be seen from the figure that the fatigue damage of the leeward mooring lines (e.g., mooring lines 1 and 3) related to the P-M spectrum is slightly larger than that related to the JONSWAP spectrum for the 57- and 6-block cases, while the fatigue damage of the leeward mooring lines related to the P-M spectrum is slightly smaller than that related to the JONSWAP spectrum for the 29- and 15-block cases. However, the discrepancies in the mooring lines’ fatigue damage related to the JONSWAP and P-M spectra are negligible.
One can also find that the fatigue damage of the windward mooring lines (e.g., mooring lines 4 and 6) related to the P-M spectrum is slightly smaller than the results related to the JONSWAP spectrum for all the lumping block cases. When the number of OSSs in the block increases, the discrepancies in the fatigue damage related to the P-M and JONSWAP spectra increase slightly. This indicates that the correction factor related to the spectrum’s peak enhancement factor adopted in the proposed WEE LBEM makes it applicable to different spectra, and these qualities make the proposed WEE LBEM a useful tool for the fatigue damage assessment of the mooring system in its preliminary design stage.
6. Conclusions
This paper presents a novel LBEM from the viewpoint of wave energy equivalence to efficiently and accurately estimate a mooring line’s fatigue damage at the preliminary design stage. In the proposed method, a compact relationship between the input wave energy and the mooring line’s fatigue damage and a modified statistical relationship between the wave parameters and spectral moments are provided via the regression algorithm. The wave energy distribution of the RSS can be obtained from the wave energy distribution of the OSS based on the compact relationship, the spectral moment of the RSS can be calculated from its wave energy distribution directly, and the wave parameters of the RSS can be determined from the modified statistical relationships easily. The effectiveness of the proposed WEE LBEM has been numerically investigated with the moored SEMI. According to this study, several conclusions can be drawn as follows.
(1) The DNV and Sheehan LBEMs consistently overestimate mooring lines’ fatigue damage significantly, and the overestimation level increases dramatically as the number of OSSs in the block increases. The overestimation level of the DNV LBEM is much larger than that of the Sheehan LBEM, and the largest overestimation level of the DNV LBEM can reach 1311.94%.
(2) The Jia LBEM consistently underestimates mooring lines’ fatigue damage, while the SME LBEM underestimates mooring lines’ fatigue damage for some cases. The underestimation level of these two methods increases as the number of OSSs in the block increases, but the underestimation level of the SME LBEM is much smaller than that of the Jia LEMB for the same lumping block case. The largest underestimation level of the Jia LBEM can reach 13.89%.
(3) The proposed WEE LBEM can yield the most accurate but slightly conservative fatigue damage predictions, and the largest overestimation level is approximately 10% for all the cited scenarios. It has excellent performance for different input wave spectra and is applicable to different lumping block cases, and it outperforms the conventional LBEM both in accuracy and robustness.
The proposed WEE LBEM will be a powerful tool for mooring line fatigue damage assessment in the preliminary stage of design, where a parameter study may be required and the costs of a time-domain fatigue assessment for a full wave scatter diagram are prohibitive.
Author Contributions
Conceptualization, Y.G. and X.S.; methodology, Y.G.; software, Y.G. and X.S.; validation, S.W. and H.G.; formal analysis, Y.G. and X.S.; writing—original draft preparation, Y.G. and X.S.; writing—review and editing, S.W. and H.G.; supervision, S.W.; project administration, S.W. and X.S.; funding acquisition, S.W. and X.S. All authors have read and agreed to the published version of the manuscript.
Funding
This research was funded by the National Natural Science Foundation of China (52088102), the Natural Science Foundation of Shandong Province (ZR2021QE101) and the Major Research Development Program of Shandong Province (2021CXGC010701).
Institutional Review Board Statement
Not applicable.
Informed Consent Statement
Not applicable.
Data Availability Statement
The data presented in this study are all included in this article.
Conflicts of Interest
The authors declare no conflict of interest.
References
- Gemilang, G.M.; Reed, P.A.S.; Sobey, A.J. Low-cycle fatigue assessment of offshore mooring chains under service loading. Mar. Struct. 2021, 76, 102892. [Google Scholar] [CrossRef]
- Zhao, Y.; Dong, S. Comparison of environmental contour and response-based approaches for system reliability analysis of floating structures. Struct. Saf. 2022, 94, 102150. [Google Scholar] [CrossRef]
- Yue, J.; Yang, K.; Peng, L.; Guo, Y. A frequency-time domain method for ship fatigue damage assessment. Ocean Eng. 2021, 220, 108154. [Google Scholar] [CrossRef]
- Guellec, C.; Doudard, C.; Levieil, B.; Jian, L.; Ezanno, A.; Calloch, S. Parametric method for the assessment of fatigue damage for marine shaft lines. Mar. Struct. 2023, 87, 103325. [Google Scholar] [CrossRef]
- Katsikogiannis, G.; Sørum, S.H.; Bachynski, E.E.; Amdahl, J. Environmental lumping for efficient fatigue assessment of large-diameter monopile wind turbines. Mar. Struct. 2021, 77, 102939. [Google Scholar] [CrossRef]
- Zhang, X.; Ni, W.; Sun, L. Fatigue analysis of the oil offloading lines in FPSO System under wave and current loads. J. Mar. Sci. Eng. 2022, 10, 225. [Google Scholar] [CrossRef]
- Takeuchi, T.; Osawa, N.; Tatsumi, A.; Inoue, T.; Hirakawa, S.; Seki, N.; Yoshida, T.; Miratsu, R.; Ikeda, S. Fatigue assessment of ship structures based on equivalent wave probability (EWP) concept (1st report): Proposal of EWP concept and its verification by 8600TEU container ship’s onboard hull monitoring. Mar. Struct. 2023, 91, 103476. [Google Scholar] [CrossRef]
- Chang, A.; Li, H.; Wang, S.; Du, J. Probabilistic analysis and fatigue damage assessment of offshore mooring system due to non-Gaussian bimodal tension processes. J. Ocean Univ. China 2017, 16, 585–601. [Google Scholar] [CrossRef]
- Zheng, T.S.; Chen, N.Z. Time-domain fatigue assessment for blade root bolts of floating offshore wind turbine (FOWT). Ocean Eng. 2022, 262, 112201. [Google Scholar] [CrossRef]
- Song, X.; Wang, S.; Hu, Z.; Li, H. A hybrid Rayleigh and Weibull distribution model for the short-term motion response prediction of moored floating structures. Ocean Eng. 2019, 182, 126–136. [Google Scholar] [CrossRef]
- Pham, Q.H.; Gagnon, M.; Antoni, J.; Tahan, A.; Monette, C. Rainflow-counting matrix interpolation over different operating conditions for hydroelectric turbine fatigue assessment. Renew. Energ 2021, 172, 465–476. [Google Scholar] [CrossRef]
- Katsikogiannis, G.; Hegseth, J.M.; Bachynski-Polić, E.E. Application of a lumping method for fatigue design of monopile-based wind turbines using fully coupled and simplified models. Appl. Ocean Res. 2022, 120, 102998. [Google Scholar] [CrossRef]
- Yuan, K.; Jin, H.; Chai, W. Development of a new spectral method for fatigue damage assessment in bimodal and trimodal Gaussian random processes. Ocean Eng. 2023, 267, 113273. [Google Scholar] [CrossRef]
- He, W.T.; Xie, L.J.; Wang, S.Q.; Hu, Z.Q.; Xie, D.; Wang, C.Z. Preliminary assessment of the mooring fatigue performance of a semi-submersible platform in time-domain utilizing fracture mechanics-based approach. Appl. Ocean Res. 2022, 129, 103407. [Google Scholar] [CrossRef]
- Han, C.S.; Mo, C.G.; Tao, L.B.; Ma, Y.L.; Bai, X. An efficient fatigue assessment model of offshore wind turbine using a half coupling analysis. Ocean Eng. 2022, 263, 112318. [Google Scholar] [CrossRef]
- Low, Y.M.; Huang, X. Long-term extreme response analysis of offshore structures by combining importance sampling with subset simulation. Struct. Saf. 2017, 69, 79–95. [Google Scholar] [CrossRef]
- Song, X.; Wang, S. A novel spectral moments equivalence based lumping block method for efficient estimation of offshore structural fatigue damage. Int. J. Fatigue 2019, 118, 162–175. [Google Scholar] [CrossRef]
- Haselibozchaloee, D.; Correia, J.; Mendes, P.; Jesus, A.D.; Berto, F. A review of fatigue damage assessment in offshore wind turbine support structure. Int. J. Fatigue 2022, 164, 107145. [Google Scholar] [CrossRef]
- DNV. SESAM User’s Manual—Deep Water Coupled Floater Motion Analysis; DNV: Oslo, Norway, 2010. [Google Scholar]
- Sheehan, J.M.; Grealish, F.W.; Harte, A.M.; Smith, R.J. Characterizing the wave environment in the fatigue analysis of flexible risers. J. Offshore Mech. Arct. Eng. 2006, 128, 108–118. [Google Scholar] [CrossRef]
- Mittendorf, K.E. Joint description methods of wind and waves for the design of offshore wind turbines. Mar. Technol. Soc. J. 2009, 43, 23–33. [Google Scholar] [CrossRef]
- Burton, T.; Jenkins, N.; Sharpe, D.; Bossanyi, E. Wind Energy Handbook; John Wiley & Sons: Hoboken, NJ, USA, 2011. [Google Scholar]
- Jia, J. An efficient nonlinear dynamic approach for calculating wave induced fatigue damage of offshore structures and its industrial applications for lifetime extension. Appl. Ocean Res. 2008, 30, 189–198. [Google Scholar] [CrossRef]
- Seidel, M. Wave induced fatigue loads: Insights from frequency domain calculations. Stahlbau 2014, 83, 535–541. [Google Scholar] [CrossRef]
- Hou, H.M.; Dong, G.H.; Xu, T.J. An improved lumping block equivalent method for predicting fatigue damage of mooring system for fish cage. Ocean Eng. 2019, 193, 106567. [Google Scholar] [CrossRef]

Disclaimer/Publisher’s Note: The statements, opinions and data contained in all publications are solely those of the individual author(s) and contributor(s) and not of MDPI and/or the editor(s). MDPI and/or the editor(s) disclaim responsibility for any injury to people or property resulting from any ideas, methods, instructions or products referred to in the content. |
© 2023 by the authors. Licensee MDPI, Basel, Switzerland. This article is an open access article distributed under the terms and conditions of the Creative Commons Attribution (CC BY) license (https://creativecommons.org/licenses/by/4.0/).