Abstract
The paper provides a novel alternative solution for the old generation turbine LNG carriers (LNG/Cs) in order to extend their life cycle, thus avoiding their demolition. Nowadays, the use of liquefied natural gas (LNG) as fuel for the production of electricity is predominant against other fossil fuels. LNG has been widely recognized as the most promising alternative fuel, combining both high efficiency and environmental friendliness. The old generation of steam turbine LNG/Cs with the distinct disadvantage of a low thermal efficiency ratio, leading to higher fuel costs, are coming to a crossroad, which is either to keep the vessel on duty until the end of their life cycle, earning low fares as those are not preferred from the charterers, or to change the use of the vessel, converting them either to a FSRU (floating storage regasification unit) or to a FPGP (floating power generating plant). In this paper, the last alternative is proposed via a holistic examination of the techno-economical (the CBA performed calculates all related metrics) but also in terms of the electric energy market by utilizing power purchase agreements (PPAs) and the contracts for difference (CfDs). This conversion into an FPGO is a novel approach providing a ‘win–win’ solution scheme, on the one hand, to areas with the non-economical bunkering chain of LNG along with non-expensive electricity production, while on the other hand, it provides an extension of the profitable life cycle of the LNG/Cs under study, which would otherwise have been considered of obsolete technology. The proposition is supported by figurative numerical case studies that help extract tangible conclusions regarding the degree of the investment viability.
1. Introduction
Liquefied natural gas (LNG) had been widely recognized as an advantageous fossil fuel combining both high efficiency and environmental friendliness. Nowadays, it is considered as an appealing interim fuel toward complete sustainable decarbonization via alternative maritime fuels [1], which is, for many reasons aimed to take place by 2050 [2] with a major milestone being 2030 or even earlier [3]. Within this context, big vessels carrying LNG (LNG carriers or LNG/Cs) have been being built since the beginning of the millennium, enabling the gradual cease of use of fuel oil (heavy fuel oil or diesel) in all sectors of human activity [4]. Moreover, in the sector of electricity generation, thermal power plants have been using LNG as a fuel in modern units (e.g., co-generation ones [5]), while, of course, it is imperative that electricity production is eventually based upon the use of renewable energy sources. In order to facilitate the energy transition, in [4], the authors proposed that LNG/Cs can act as either floating storage units of LNG located near-shore or even be used to produce electricity, acting as floating power plants. A similar proposition was made in [6], according to which, floating power plants (i.e., vessels powered from LNG) that are moored nearby the shore can be used to supply electricity to the shore grid in case the inland power supply cannot be provided to a sufficient extent due to emergency situations, catastrophes, earthquakes, etc. It was noted though that the solution in [4] or [6] must be designed on purpose to this end from the very beginning and constructed to serve such cases. This was confirmed in [7], where an LNG powered barge was constructed to serve as an alternative to shore power supply (i.e., providing electricity to ships at berth). The electric energy of the barge discussed in [7] due to the LNG was more environmentally friendly than the one produced onboard by diesel generator sets. The barge could supply electric energy to cruise ships or mega yachts of up to 7.5 MW. The technology of this more environmental friendly electricity provision to ships is based on the IEC/ISO/IEEE series of standards, covering high-voltage applications [8], communication systems [9], and low-voltage systems [10], respectively. Still, the common denominator is that building such customized floating power plants of rather small power capacity is fairly expensive. Thus, in [11,12], it was stressed that LNG carrying vessels should always be built in big sizes, as this was proven to be economically beneficial in all cost–benefit analyses. This was also verified in [13], where a special case study was presented, consisting of small LNG carriers making round trips to supply a small number of islands in the archipelagos of Indonesia with LNG where the berthing depth is small. Since the initial building cost is a major issue, a methodology was developed to investigate the optimum capacity of LNG carriers that fit in that particular case.
On the other hand, the evolution in LNG treating and storing technology is being improved so rapidly that the corresponding vessels, the building of which is very costly, need to be replaced by others more efficient in very short time intervals (e.g., less than a decade) [14]. The latter means that that LNG/Cs are not fully exploited as originally planned, their investment is not paid back, and hence, some solutions must be developed so that their depreciation period can somehow be extended [15]. Therefore, alternative solutions of exploiting the LNG/Cs of less modern but still non-obsolete technology have to be investigated [15]. Regarding retrofitting existing vessels in an attempt to increase their performance, the only solution proposed up-to-date has been the installation of a re-liquefaction plant that decreases the leakages due to the boil-off-gas (BOG) [16].
Furthering the concept initially introduced in [15], the authors in [17] proposed that it is worthwhile to retrofit LNG/Cs into floating power plants or more officially named as floating power generating plants (FPGPs). The case studies were similar to those studied in [18], which investigated from technical and economical point of view, the option to have an FPGP installed close to the port of a non-interconnected island. Electricity in non-interconnected islands is produced via thermal power plants operating with pollutant heavy fuel oil (HFO) or diesel fuel oil (DFO). Therefore, considering that the electricity produced onboard a retrofitted LNG/C seems to be less expensive than that of inland production based on HFO or DFO, in [17,18], the LNG/C into FPGP conversion was proven to be an appealing solution both from the environmental but also economical point of view. The technical part of this solution was based on the shore side electrical supply (SSES) as discussed in [19,20], while it contributed to the resilience of the entire grid under consideration in normal but also in emergency operating conditions.
On the other hand, significant efforts have been made in the maritime sector to reach complete decarbonization, once again via alternative fuels including electricity. In particular, the shore to ship electrical supply (SSES) (i.e., the electrical interconnection of any berthed vessel with the shore grid in order to stop operating its auxiliary engines), which stops polluting the wider area of any port with air emissions, seems to be the most readily available decarbonization technology [1]. However, in most cases, the capacity of the grid in the vicinity of the port is not sufficient and must be reinforced so that the estimated total power demands are met, as stated explicitly in [19]. Despite the mid-term measures or the long-term measures required as described in [20], so that the power demands are well-predicted and covered, meeting the power demands of all ships at berth is not always feasible in the short-term within which SSES must be deployed, at least in European Union ports, as stipulated by the Fit-for-55 package of Directives and Regulations like the Fuel EU Maritime and Alternative Fuel Infrastructure (see indicatively [1,2,21]).
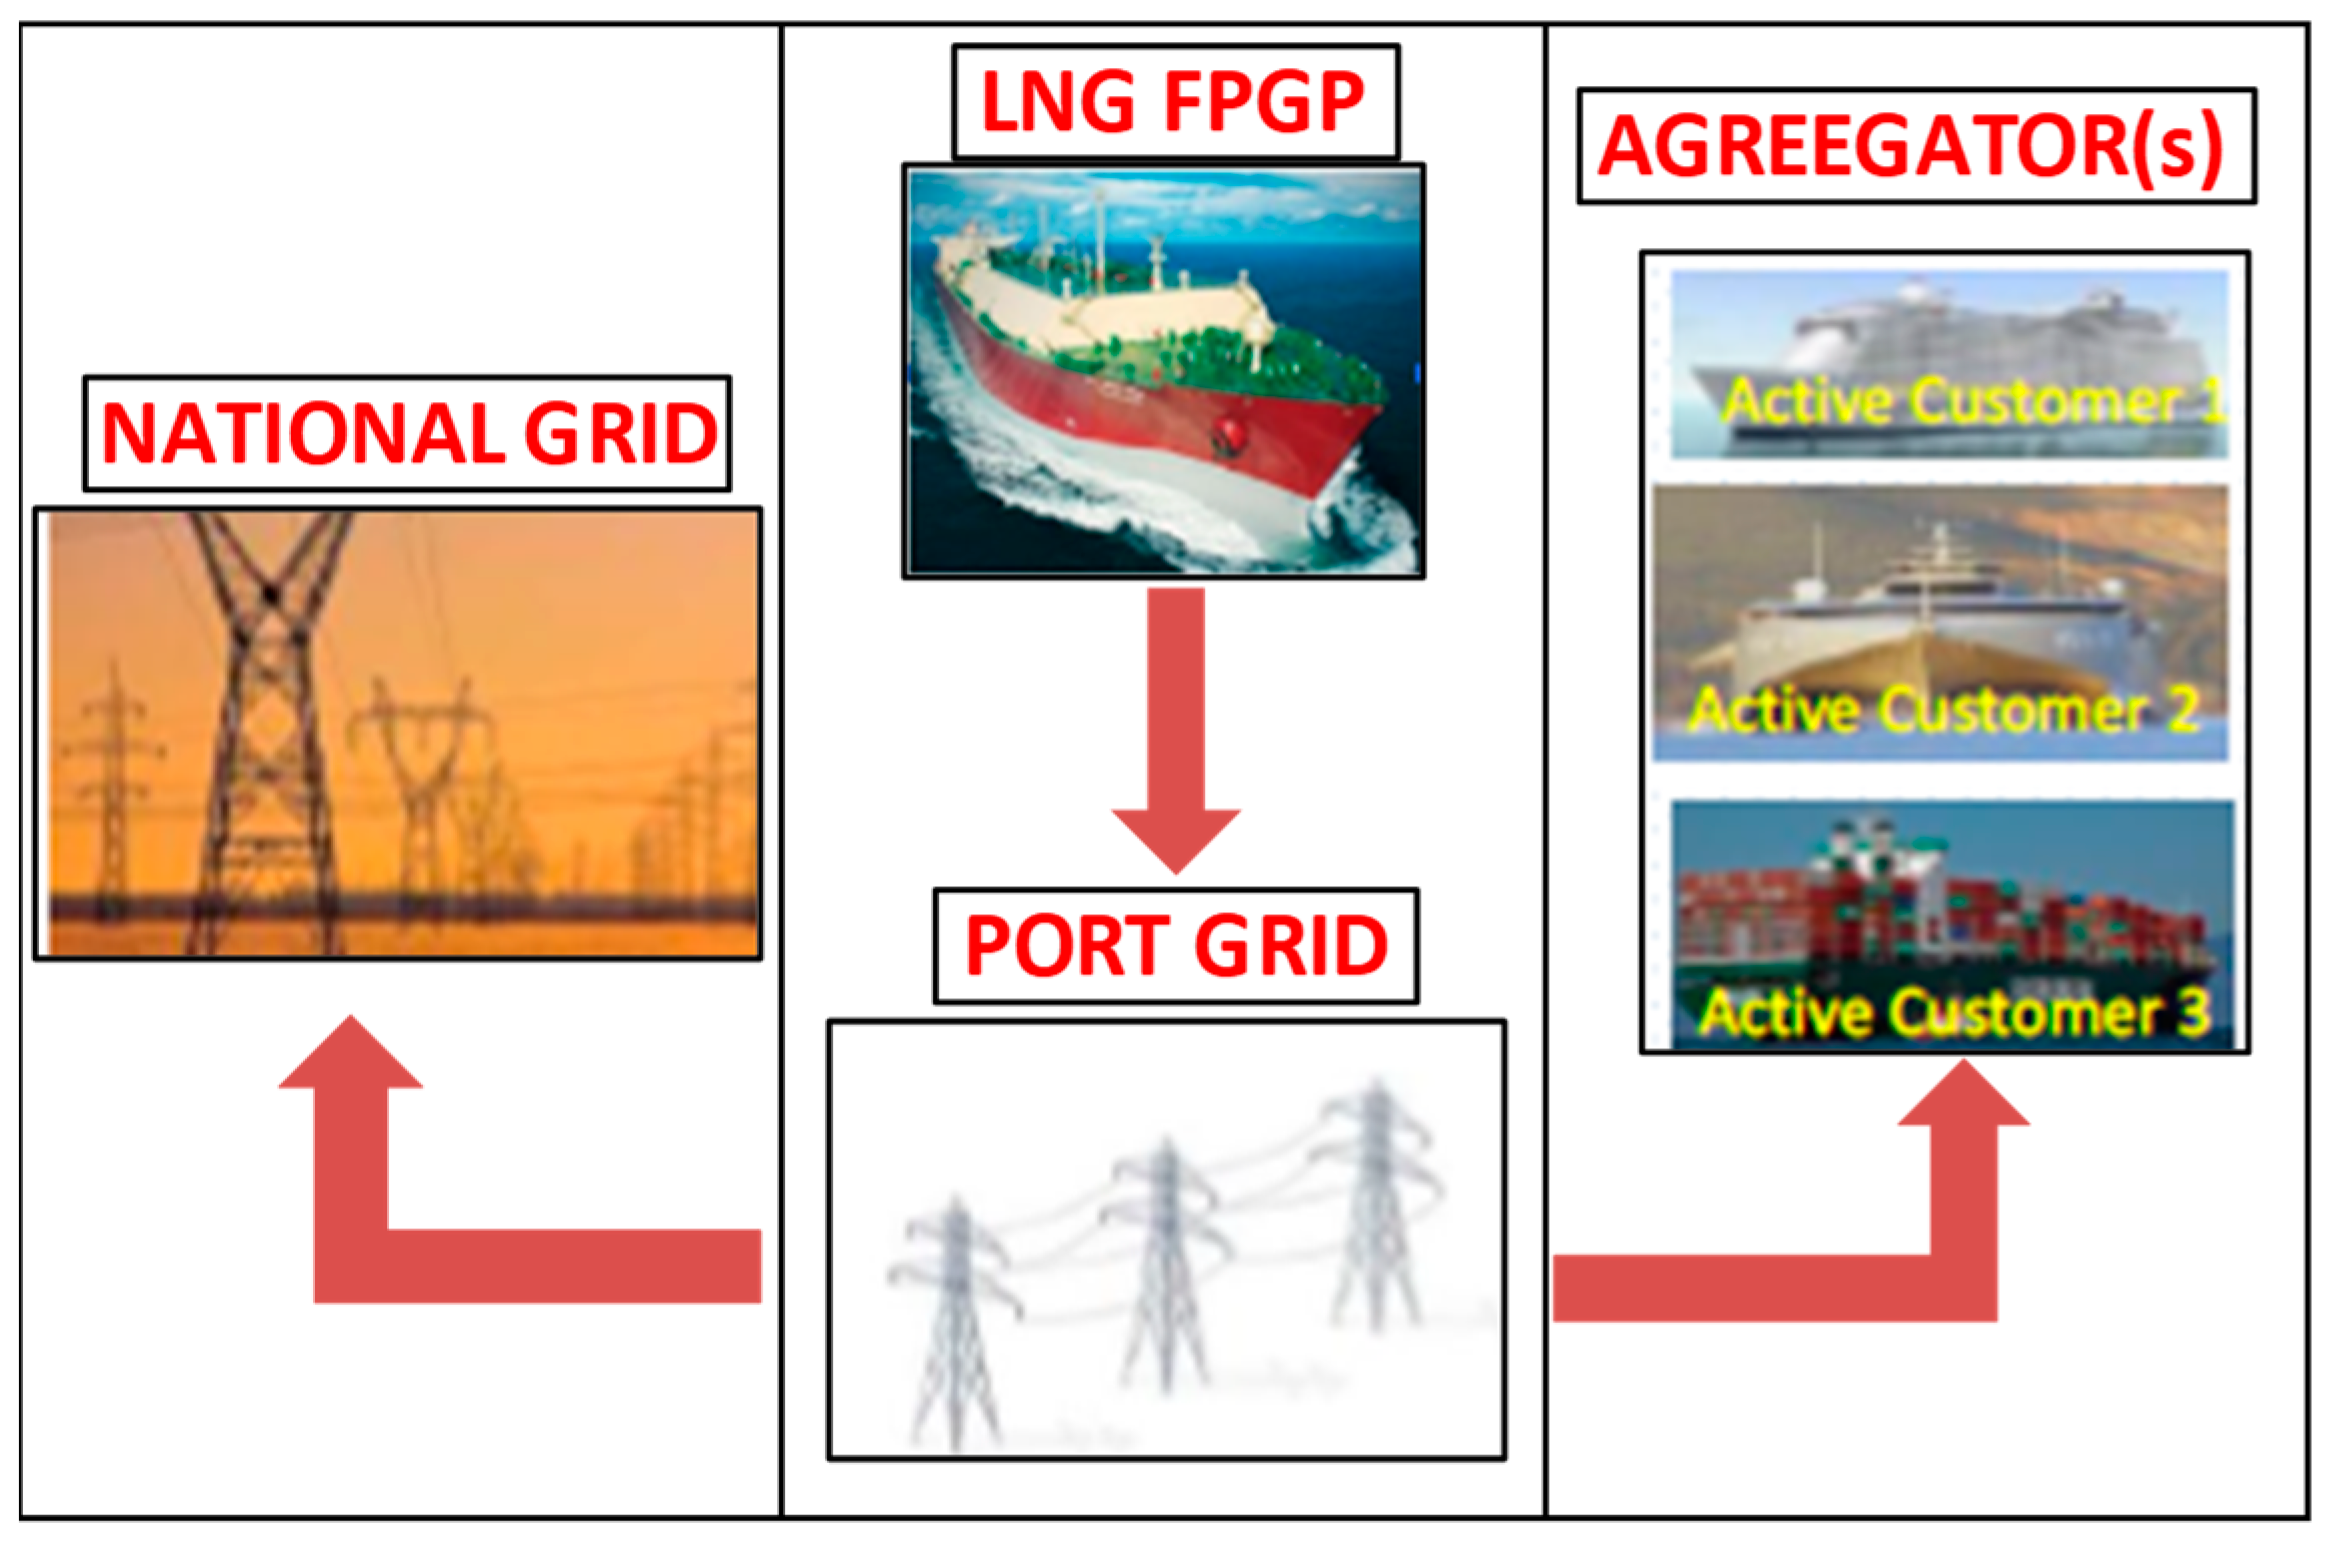
Within this framework, and furthering the concept of having a floating power plant based on LNG, this paper proposes the conversion of a steam turbine LNG carrier into a floating power generating plant (FPGP) in order to produce non-expensive electricity to supply the grid of the port, with the latter acting as an energy hub. The port, in turn, can provide the energy either to berthed vessels or even to inland national grids, as shown in Figure 1.
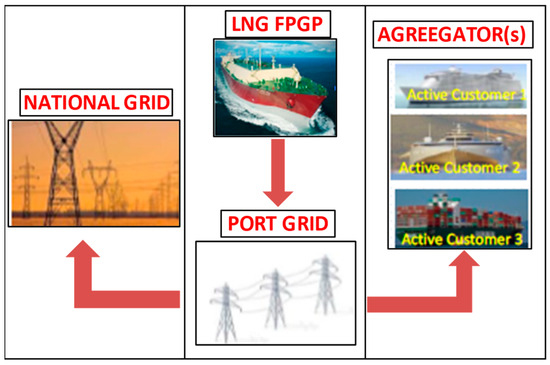
Figure 1.
Operation of an LNG carrier as a FPGP.
Considering the novelties of this paper, they consist of furthering ideas like those presented in [7] for specially designed FPGPs, according to which the proposed electric energy production based on LNG is more environmentally friendly, and hence can be an interim solution until the complete implementation of SSES technology based on the grid capacity to supply 100% green energy. Thus, via the novel approach proposed in the paper, no dedicated special design for a small-scale LNG/C including the risk of the non-viability as in [13] is required. More specifically, the proposition discussed consists in retrofitting an existing LNG/C, which is forced to be considered as obsolete technology, and hence must be withdrawn from faring business. Moreover, the FPGP proposition can be seen as a mutually beneficial (i.e., “win–win” solution) as in the transition period:
- ➢
- On the one hand, the port is partially relieved by the heavily polluting electricity generation onboard the ships;
- ➢
- On the other hand, the LNG/Cs acquire a sufficient extension of their exploitation period, attaining their payback.
Furthermore, the proposed solution was validated by studying the feasibility of retrofitting an actual LNG/C into an FPGP. An extra novelty is that the cost–benefit analysis (CBA) was performed not only exploiting by standardized metrics, but also through modern electric market tools. The former comprised indices like the net present value (NPV), the internal rate of return (IRR), the depreciation payback period (DPB), and the present worth cost (PWC). On the other hand, regarding the exploitation of modern electric market rule tools, case studies were also validated by running exemplary calculations of combinations of power purchase agreements (PPAs) and contract for differences (CfDs), which have recently been discussed in [22] and analyzed in depth in [23] regarding the regulatory framework of the maritime electricity transactions, which must comply with the open electricity market rules outlined in [24].
2. Steam Turbine LNG Carriers
An LNG/C with a steam turbine propulsion system usually has two boilers installed on board capable to burn the boil-off gas (BOG) and produce superheated steam (60 bar, >525 °C). This steam is then fed into two-grade steam turbines, one of high (HP) and another of low pressure (LP), which drive the propeller shaft through a reduction gear, as shown in Figure 2 [18,25]. Another stream of superheated steam is also fed to the steam turbine generators, which produce the power required by the vessel electric loads [5].
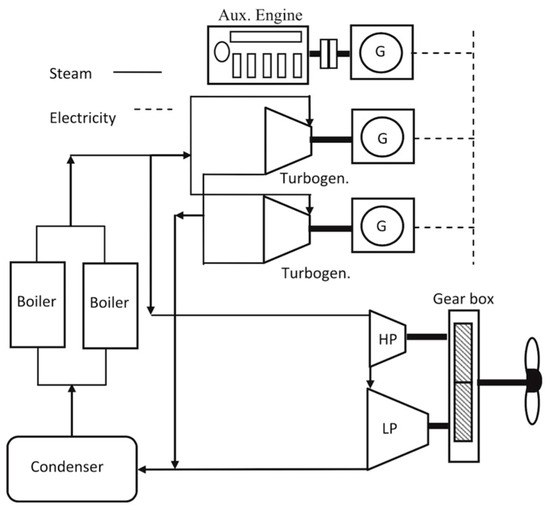
Figure 2.
Typical steam turbine propulsion arrangement [12].
Up to 2003, the use of steam turbines was the only alternative for the propulsion of modern LNG carriers due to the capability of the boilers to operate in GAS, HFO/MDO, or in DUAL mode (both GAS and HFO). The reliability and low maintenance cost were included in the advantages of such propulsion systems. On the other hand, the extreme low thermal efficiency ratio, which leads to high fuel consumption, and the lack of skilled engine crew specialized in steam arrangements, displaced this system up to a point that only 10% of the orders was steam turbine propelled, as depicted in Figure 3 [11].
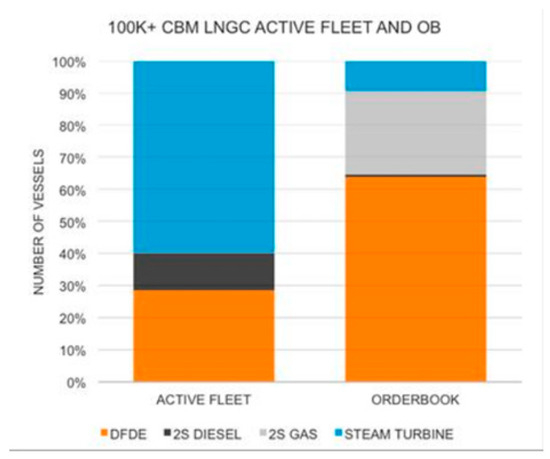
Figure 3.
Global fleet of LNG carriers by type of propulsion plant [11].
An extension of the lifespan of steam turbine LNG/Cs has been given through the use of the so-called ultra-steam turbine (UST), as shown in Figure 4 [11]. The use of an intermediate pressure turbine between the high and low pressure in cooperation with a separate steam reheater increased the thermal efficiency up to 42%.
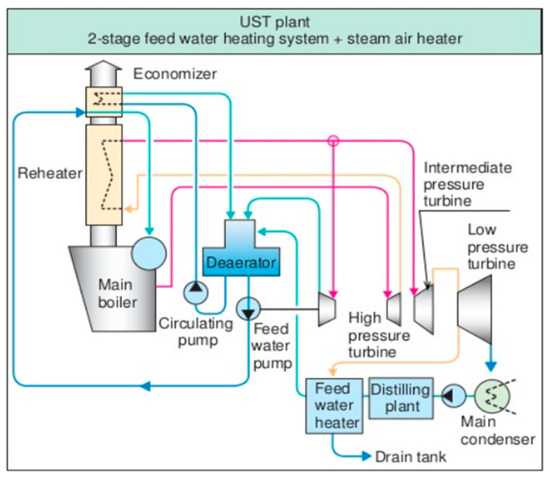
Figure 4.
Ultra-steam turbine arrangement [11].
Older LNG/Cs may seek alternative options for commercial exploitation, offering unattractive chartering options. The conversion into an FSRU is an established choice in a growing niche market as it provides a quick to build, short-term option for natural gas import. Another alternative concept is the integration of the LNG carrier with a gas-to-power system, either as an FSRU feeding an onshore power plant or as a FPGP (floating power generating plant) [18]. As discussed, the solution of converting a steam turbine LNG carrier to FPGP is analyzed hereinafter from the point of view of the profitability of the investment and the energy market.
3. Techno-Economic Scenarios
In this section, a techno-economic scenario based on an existing steam turbine LNG carrier is presented. The investment that was evaluated consisted in the conversion of this ship into an FPGP using assumptions similar to those met in [5,15,18,26], and the LNG prices were taken from [27].
- ➢
- The total investment cost was assumed to be the cost for the retrofit of one or two more turbo generators with the relevant cabling, switchboards, converters, etc., depending on the power of the plant, which includes the acquisition cost as well as the steel, piping, and electrical works onboard. This cost was divided into two categories. The first category was the cost, which was covered with own funds and assumed to be EUR 5,000,000 for scenarios 1 and 2, while scenario 3 regarded the respective amount of EUR 1,500,000. The second category was the rest amount of the total investment cost, which will be covered exclusively by a loan of 10 years duration.
- ➢
- The initial annual incomes were derived from the produced electricity assuming 300 days of trading per year. The remaining (65) days of the year were considered to be dedicated to the service and repair works of the vessel.
- ➢
- The years of trading of the vessel as a floating power generating plant (FPGP) were assumed to be equal with the loan duration (i.e., 10 years).
- ➢
- The operating cost was assumed to be the cost of the gas consumed for the production of electricity, CFUEL, plus the cost of the steam plant maintenance and provisions, CMAIN, plus the crew pay roll, CCREW. Therefore, the initial annual net income (ft) is the initial annual income (Ain) subtracting the initial annual costs as described above.
Hence:
For any other year of the period of the techno-economic analysis, the annual income at year t, (Ain,t) is calculated from the initial annual income, (Nin), considering a net price inflation rate (NPIR) that is equal to 0.04:
and deducting the annual costs, also considering the relative inflation rates.
More specifically, the annual fuel cost at year t, (AFuelCost,t) is calculated considering the initial fuel cost (NFuelCost) and the corresponding fuel cost inflation rate (FCIR):
Similarly, the annual maintenance cost at year t, (AMaintCost,t) is calculated considering the initial maintenance cost (NMaintCost) and the corresponding maintenance cost inflation rate (MCIR):
Moreover, the annual crew cost at year t, (ACrewCost,t) is calculated considering the initial crew cost (NCrewCost) and the corresponding crew cost inflation rate (CCIR):
- ➢
- The annual accounting relief (At) considering linear deduction is obtained by the investment cost, (IC), divided by the tax deduction period, (TDP):
- ➢
- The annual debit relief considered with equal annuity through the years is:
Whereas the CRF is:
where iL is the loan interest rate and NL is the loan payback period
- ➢
- The loan interest through the year t is:
- ➢
- The loan balance at the beginning of the year t (Lt) is:
- ➢
- The reduction in the loan at year t is:
- ➢
- The net cash flow at year t is:
On the other hand, the initial net cash flow F0 is:
where iM is the market loan rate.
4. Available Electric Energy of the Vessel for Commercial Use
The examined scenarios from the point of view of the available electric energy that can be sold are as follows:
Scenario 1: Available electric energy to be sold is 19.4 MW, which can be achieved by adding one (1) turbo generator of 15 MW on board the vessel.
Scenario 2: Available electric energy to be sold is 34.4 MW, which can be achieved by adding two (2) turbo generators of 15 MW each on board the vessel.
Scenario 3: Available electric energy to be sold is 4.4 MW, which can be achieved by utilizing the spare electric energy produced from the existing turbo generators.
In all aforementioned scenarios, the vessel will be alongside during power supply to the shore so there is no need for special mooring arrangements to be fitted, and hence no subsequent related cost.
All of the above are summarized in Table 1.

Table 1.
Power data for the vessel under study.
5. Operating, Maintenance and Crew Costs Analysis—Assumptions
In this section, all of the cost parameters considered in the analysis as well as the assumptions made are presented and discussed.
The operating cost of the LNG carrier was assumed to be the cost of the LNG fuel burnt for the steam production needed for the electricity for commercial use. The cost of the LNG fuel that is needed for the steam production to meet all the load demands of the vessel is considered quite low as the vessel is berthed, and hence there are no high load demands.
The specific consumption in kg/h of the LNG for the steam production was derived with linear interpolation from the pairs of values shown in Table 2 [11]. The assumptions made and the related calculations of all of costs, namely fuel cost, maintenance costs and crew costs are summarized in Table 3, Table 4 and Table 5.
Table 2.
Specific fuel gas consumption.
Table 3.
Annual fuel LNG cost for all three scenarios considered.
Table 4.
Annual maintenance costs for all scenarios.
Table 5.
Monthly crew payroll.
It is worth mentioning that among the three scenarios, only in the case of scenario 2 (i.e., where the plant power is 34.4 MW) did the vessel need to be reloaded once per year as the capacity of the LNG in the tanks was not sufficient for 300 days of operation in a year at full power mode.
Regarding the maintenance cost, a constant specific cost of 2.5 €/MWh [6] was assumed, showing one of the distinct advantages of steam turbine vessels (i.e., the low maintenance cost) [9,10]. As shown in Table 4, the maintenance cost for the three scenarios considered was equal to EUR 349,000 (with one turbo generator producing 19.4 MW), EUR 619,200 (with two turbo generator producing 34.4 MW), and EUR 79,200 (production of 4.4 MW with no additional generator), respectively.
In order to analyze the crew payroll, a typical crew synthesis of such vessels was assumed (see Table 5 [15,17]). Taking into account that the ship would be berthed on an almost constant basis, a rather more limited number of crew compared with that during sailing was considered. In all scenarios, the same crew was considered, hence, the initial monthly pay roll was summed up to EUR 52,000 in all cases (see Table 5). Moreover, as explained in Section 7, in the following years, an increment due to the inflation rate was taken into account. Furthermore, a constant additional cost for the crew provisions was also considered.
6. Acquisition Cost—Assumptions
In this section, the acquisition cost for the retrofitting under consideration is discussed, accompanied by the assumptions made.
More specifically, in Table 6, Table 7 and Table 8, the cost of the retrofit for the conversion of the LNG carrier into FPGP is analyzed with the basic electro-mechanical equipment that must be installed being included. The prices are indicative but quite close to the reality during this research. It is stressed that in scenario 3, the cost was fairly low compared to other two cases, as in this case no turbo generator was to be added.
Table 6.
Acquisition cost for scenario 1.
Table 7.
Acquisition cost for scenario 2.
Table 8.
Acquisition cost for scenario 3.
It is worth mentioning that the under-study vessel will be alongside during its shore connection for power supply. If the vessel is afloat when interconnected with the shore, then special mooring equipment needs to be installed, which has a very high cost (indicative cost MUSD 15), and the investment will be negative for the short-term period of 10 years under study.
7. Economic Calculations of the Scenarios under Study
In order to evaluate the investment, the financial metrics discussed below were calculated:
- (1)
- Net present value (NPV), showing if the investment will be profitable in the long run; NPV must pass from negative values to positive values.
- (2)
- Internal rate of return (IRR), estimating the profitability of the investment.
- (3)
- Discounted payback period (DPB), evaluating whether the critical time instant that the profitability and feasibility of the given investment will be attained.
- (4)
- Present worth cost (PWC), which transforms all future costs and revenues to equivalent monetary units at present.
To assess all of the above financial metrics, the economic data of Table 9 were calculated by making certain additional assumptions, namely:
Table 9.
Economic data of the vessel under study.
- The investment period was considered equal to 10 years, which is a very plausible assumption for the life span extension of an LNG/C as well as the corresponding loan payback period.
- The inflation rate, increasing annually in all costs in all scenarios (LNG fuel, lub-oil, personnel and maintenance), was considered equal to 4%, a plausible assumption used in all cost–benefit analyses.
- As already mentioned, the selling period was 300 days per annum, with the remaining 65 days dedicated to the maintenance of the ship and its machinery.
Regarding the pricing of electricity (PoE) in euro per MWh, this was calculated considering the annual LNG cost (ALNG cost) in euro, the electric energy that is available to be sold (EE) in MWh, and the days of trading (DoT):
An amount of 15% surcharge was added to the above, representing the profit of the supplier. The benefits or loss of the supplier will be evaluated utilizing the PPAs and CfDs in the following sections.
8. NPV, IRR, DPP, and PWC Results
In this section, the calculation results of the techno-economic analysis are presented and analyzed. The time interval of the investment considered was equal to a decade in all three scenarios. More specifically, in Table 10, Table 11, Table 12, Table 13, Table 14 and Table 15, the detailed calculation results of the net present values (NPV), the internal rate of return (IRR), the discounted payback period (DPB), and the present worth cost (PWC) are presented for every year starting from year 1 up to year 11. Furthermore, in an attempt to facilitate the comparison among the three different scenarios under study, comparative graphs of the three scenarios are presented in Figure 5, Figure 6, Figure 7 and Figure 8.
Table 10.
NPV, IRR, and DPB results for scenario 1.
Table 11.
PWC results for scenario 1.
Table 12.
NPV, IRR, and DPB results for scenario 2.
Table 13.
PWC results for scenario 2.
Table 14.
NPV, IRR, and DPB results for scenario 3.
Table 15.
PWC results for scenario 3.
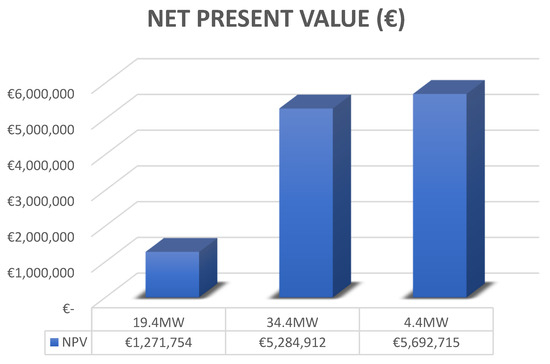
Figure 5.
Comparative graph of the NPV.

Figure 6.
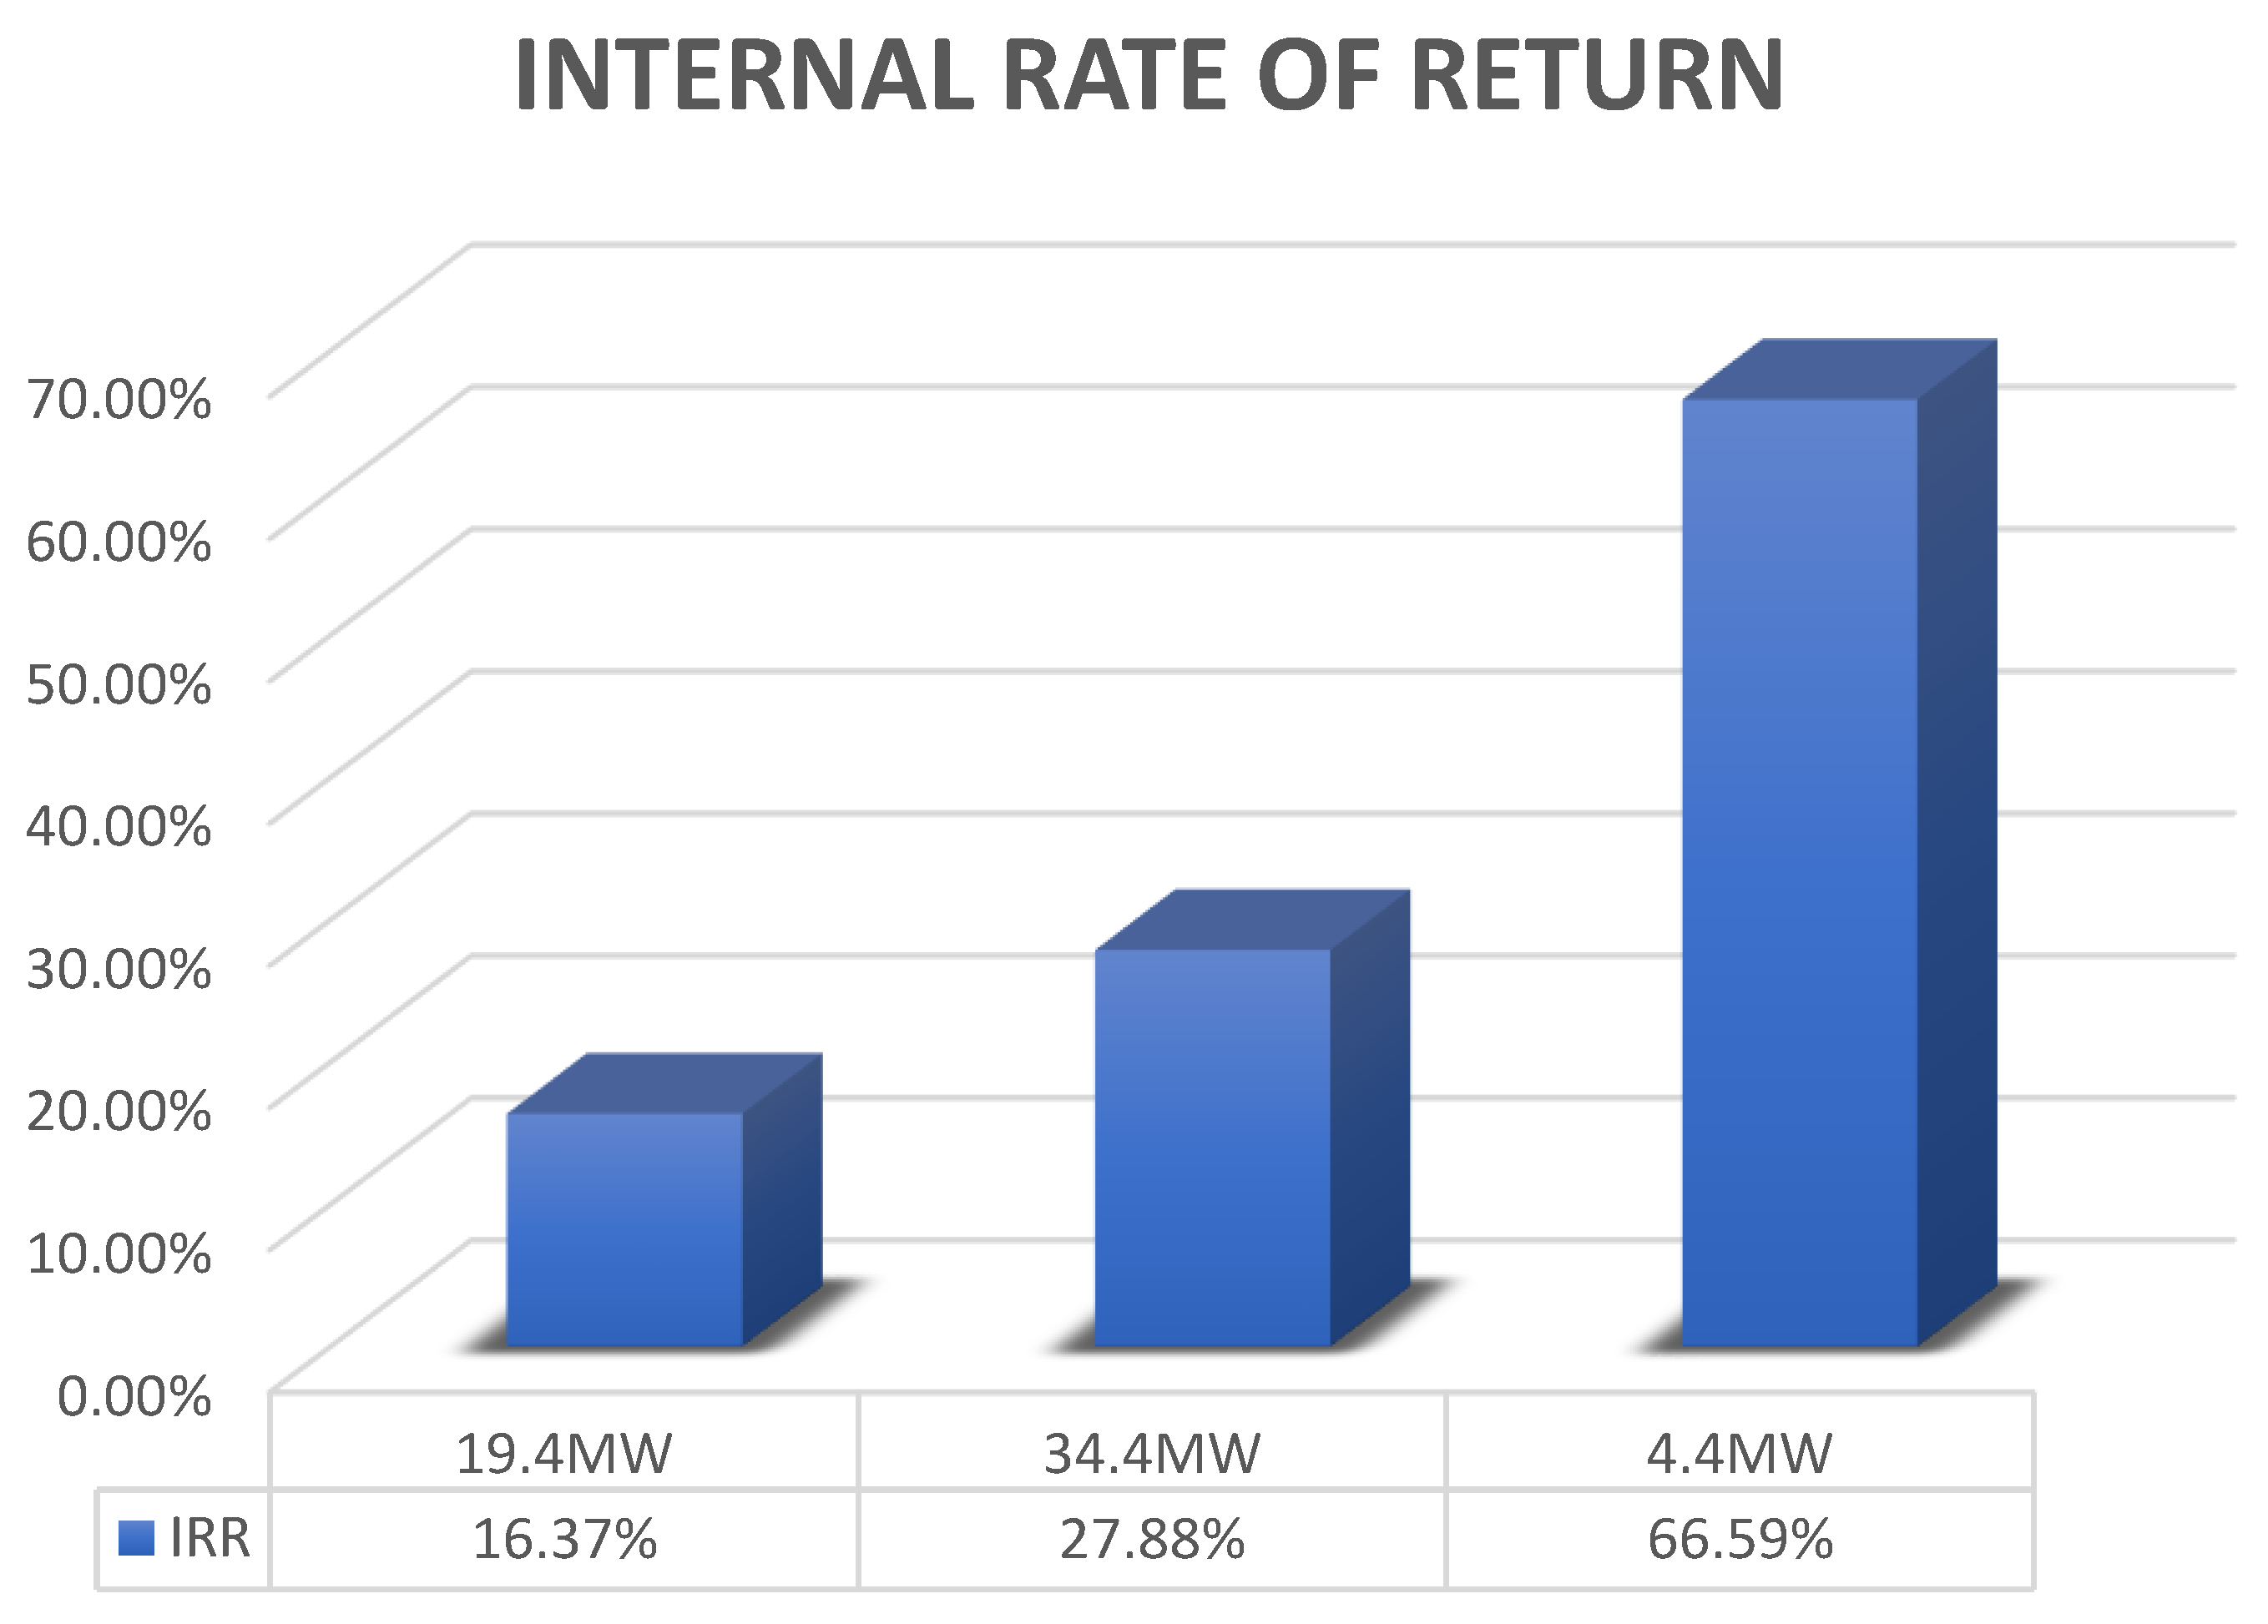
Comparative graph of the IRR.

Figure 7.
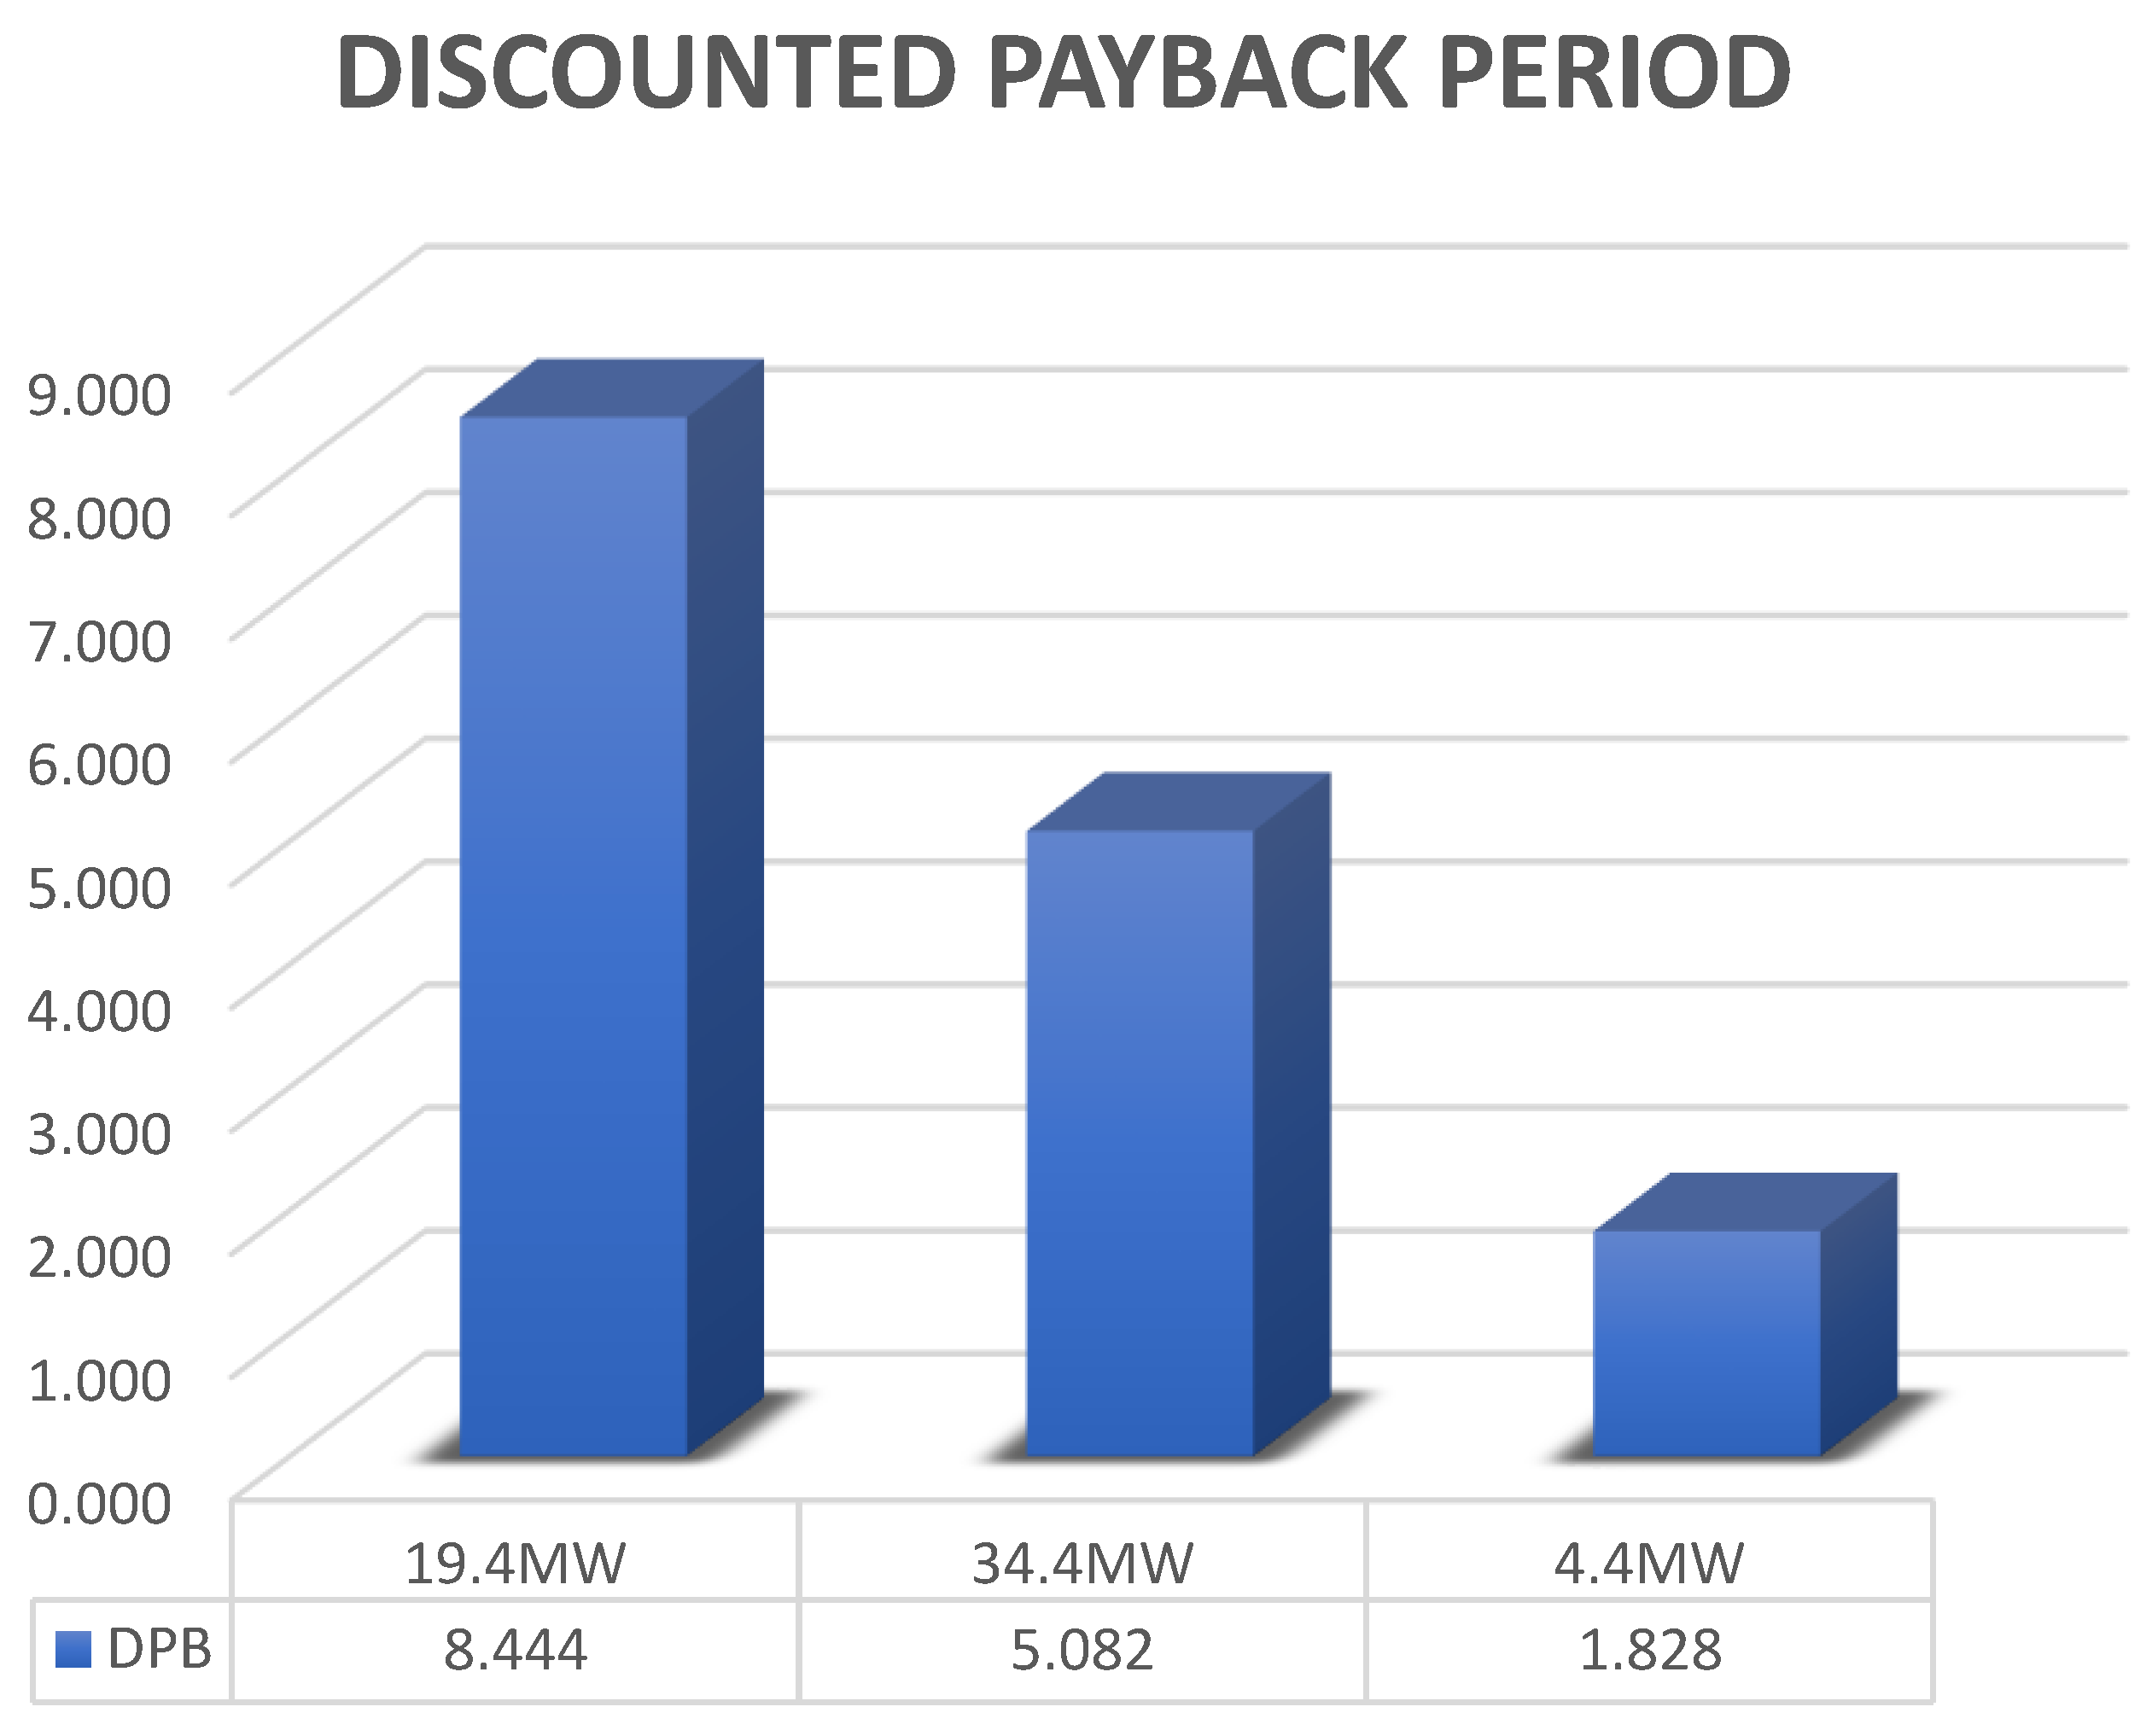
Comparative graph of the DPB.
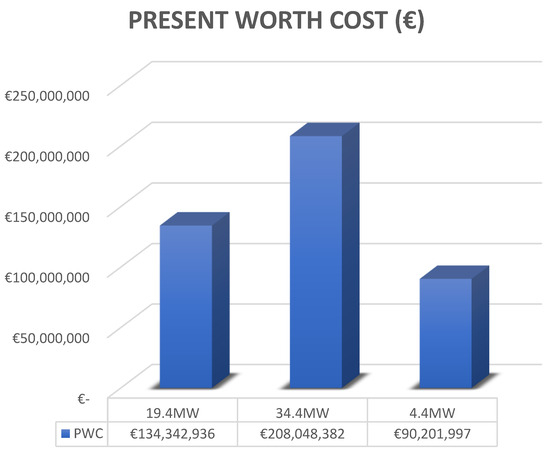
Figure 8.
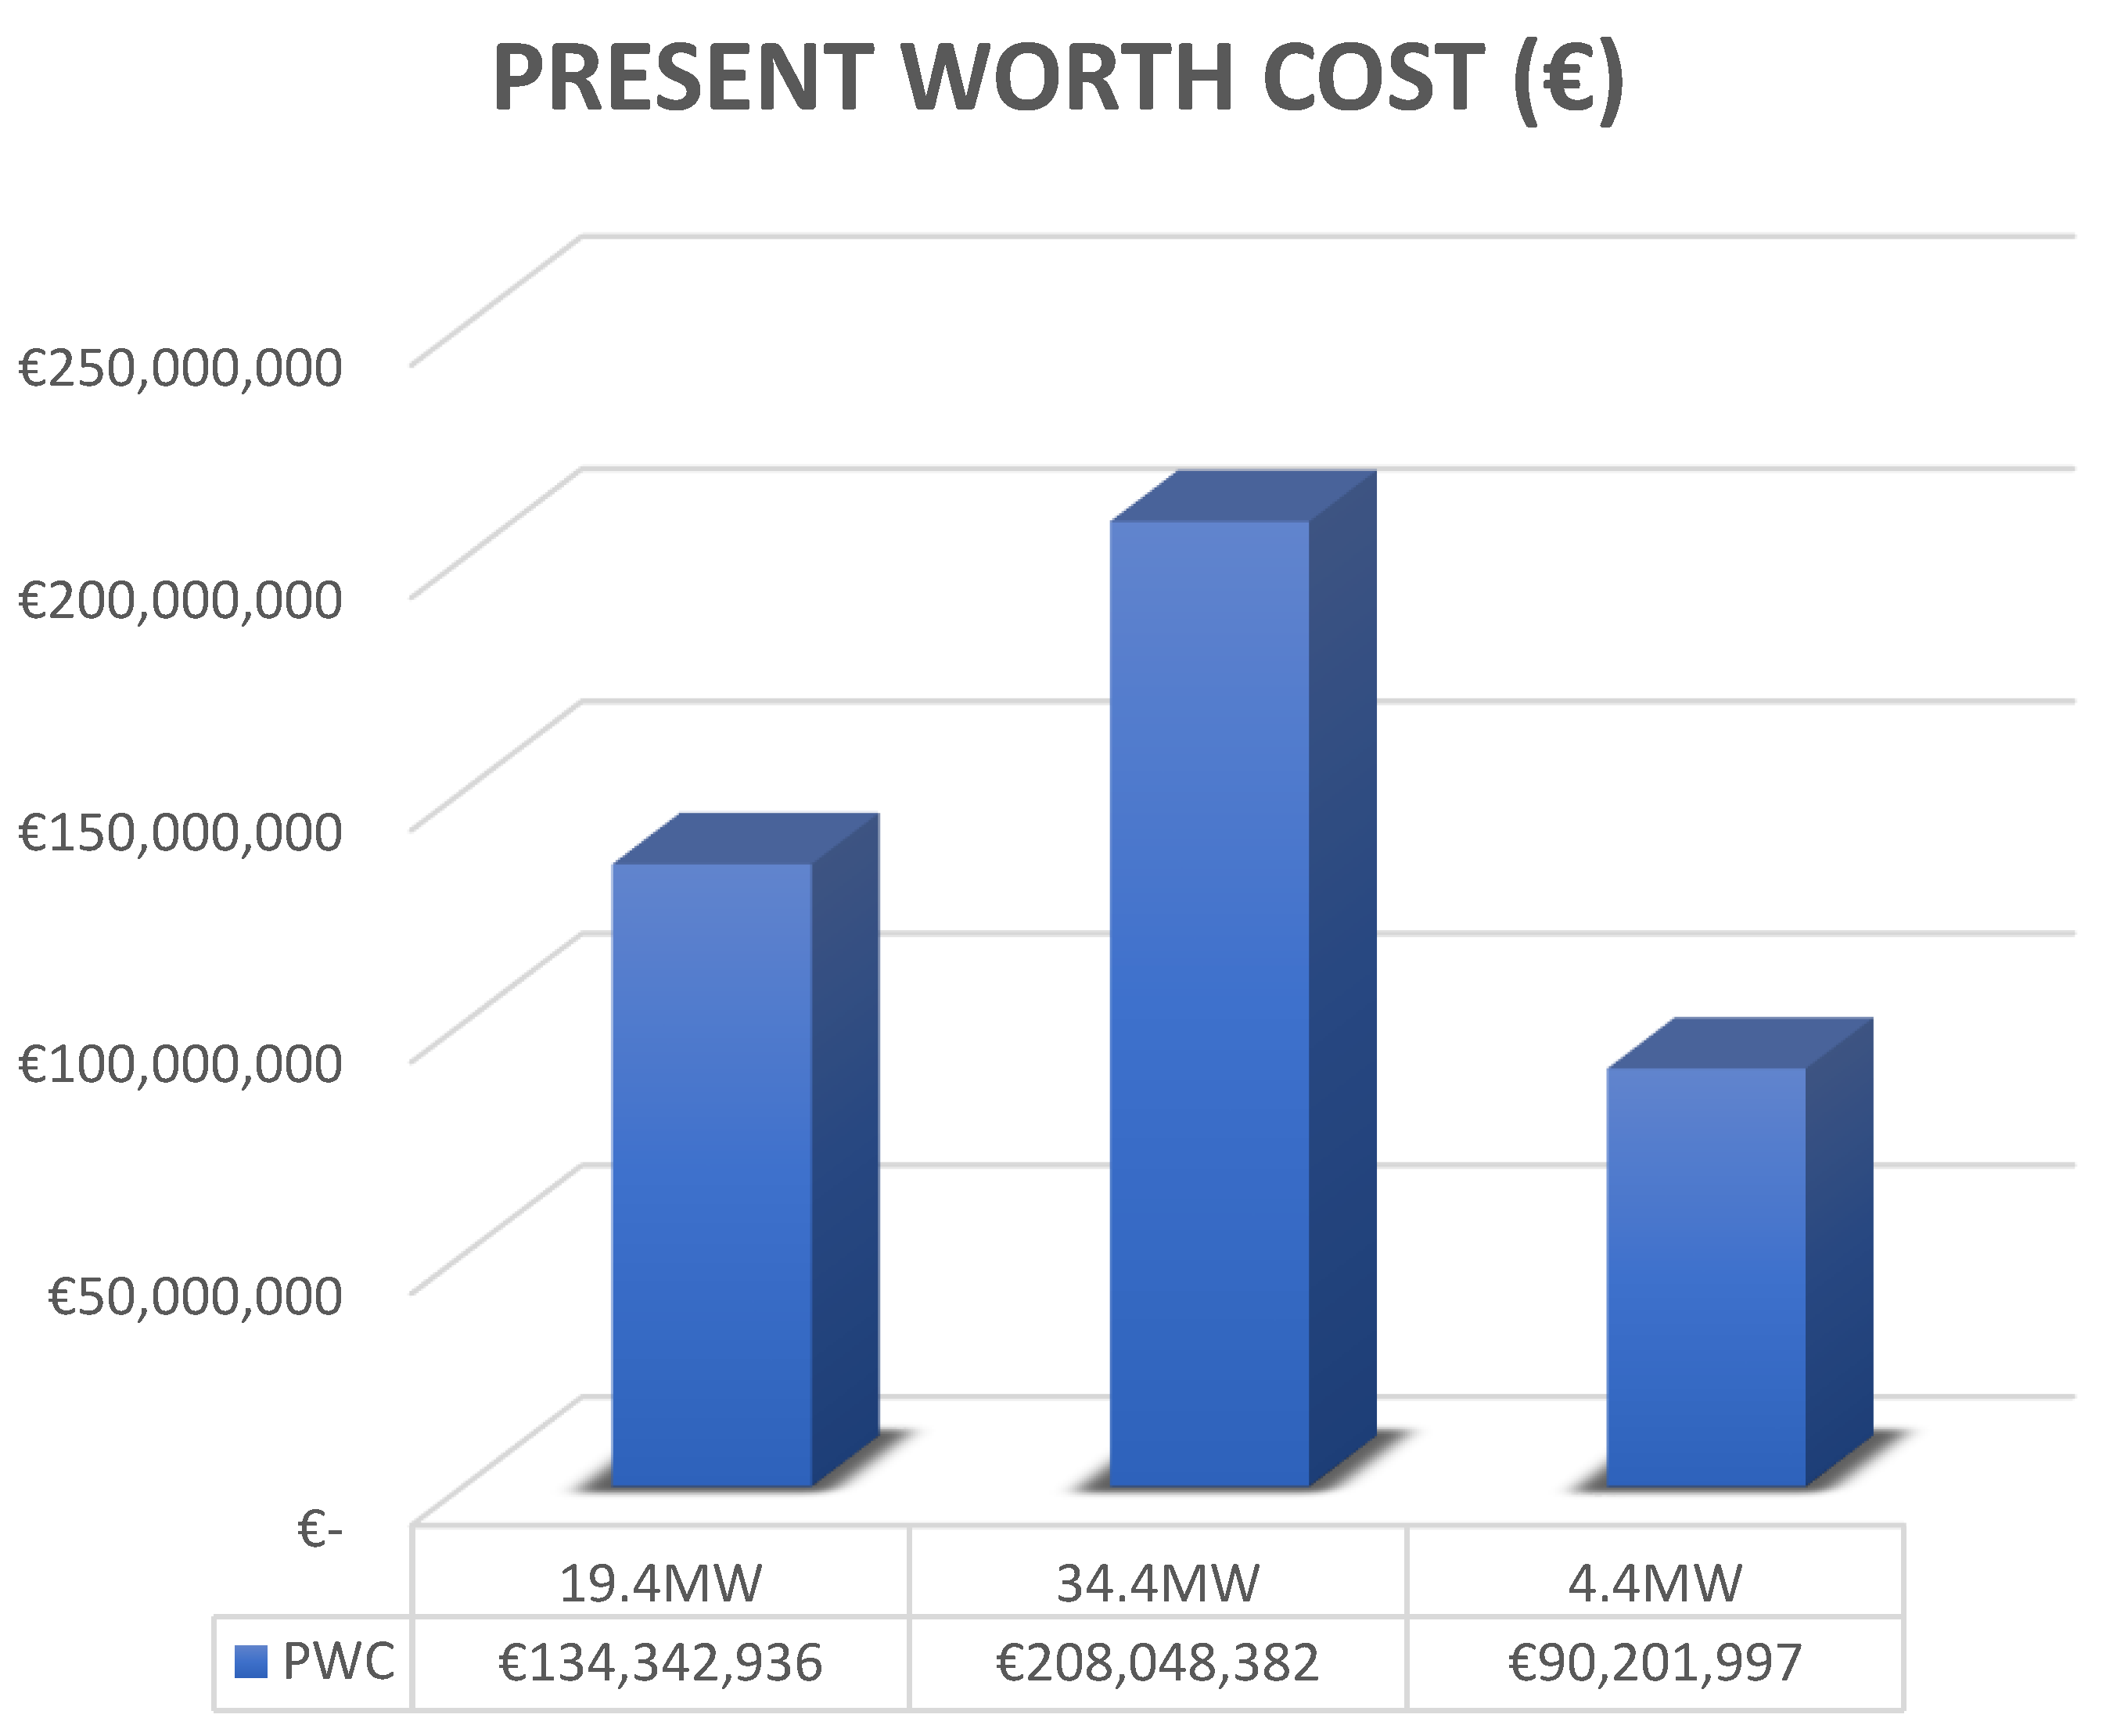
Comparative graph of the PWC.
By inspecting Table 10, Table 11, Table 12, Table 13, Table 14 and Table 15 and Figure 5, Figure 6, Figure 7 and Figure 8, the following conclusive remarks can be made:
- The net present value (NPV) in scenario 1 turned from negative to positive between the eighth to the ninth year of investment. This was confirmed by the DPB, which was equal to 8.44 (see Table 10), which was the maximum of the three scenarios (see Figure 7). Thus, although its PWC was between the other two scenarios, scenario 1 became profitable rather marginally from the loan payback period point of view compared to the other two (see Table 11 and Figure 8). This was also verified by the fact that among the three scenarios, scenario 1 had the minimum value of IRR (equal to 0.1638 vs. 0.2788 of scenario 2 and 0.6659 of scenario 3 (see Table 10, Table 12, Table 14 and Figure 6).
- On the other hand, scenario 2 had the maximum PWC (see Figure 8), as it engaged the biggest procurement (that of two turbo generators vs. one generator in scenario 1 and no generator in scenario 3). However, its NPV turned into positive values faster than scenario 1, namely between the fifth and sixth (see Table 10 and Figure 5). Actually, the exact DPB value was calculated to be equal to 5.082 (see Table 12 and Figure 6). The better performance of this investment (always in contrast to scenario 1 which had, however, a lower initial equipment procurement cost) was reflected by the IRR, which was equal to 0.2788 (see Table 12 and Figure 7). The reason as to why the second scenario was proven to be better than the first was attributed to the income due to the electricity sold. The considerably bigger amounts of energy sold (i.e., 34.4 MW for 300 days per year, which sums up to 247,680 MWh) counter-compensate for the initial high acquisition cost fairly quickly.
- Finally, the third scenario is a very conservative but well-guaranteed investment. Its NPV turned positive between the first and second year, with its calculated DPB being 1.828 years. This can be easily explained as the investment was the lowest possible with no additional generator to be acquired, and hence the lowest PWC value. Moreover, the IRR was the highest, equal to 0.6659 (i.e., about 2.4 times that of scenario 2 and four times that of scenario 1).
- In conclusion, the worst investment from all points of view seems to be scenario 1. On the other hand, the scenario with the minimum investment, payback period, but also total profit was scenario 3. Scenario 2 provides an optimum combination of big investment accompanied with high profit in short time periods. Between scenarios 2 and 3, the main difference is whether the initial capital cost is available (through loans or own-income) or not. Still, considering that the income obtained from selling electricity plays a predominant role on how beneficial each alternative scenario can be proven, a further analysis follows next.
9. Contractual Agreements for Selling Electricity
In the previous section, the cost–benefit analysis highlighted the importance of the income from selling electricity either to other ships (as an alternative to the “shore-to-ship electricity (SSE)” or the inland main grid. The conditions and contractual terms of this selling procedure are investigated in this section, taking into account that the product sold is very close to the concept of “maritime electricity” developed only recently in [22,23].
Within this context, following the global trends of huge amounts of electricity transactions, two types of agreements [15,16] were applied in order to evaluate the benefit or the loss of the investor of a FPGP as an electric energy provider:
- Power purchase agreements—PPAs are bilateral agreements to purchase electricity between an energy seller (who may or may not be a producer) and an energy buyer, which can be a business, an organization or even a group of businesses, and, under conditions, a set of households.
- Contracts for difference—CfDs enable traders to foresee and speculate on the future market movements of an underlying asset (e.g., foreign exchange rate, share prices, stock market index levels, commodities etc.) without actually owning or even taking part in any physical delivery of this underlying asset. CfDs enable the traders to speculate on the short-term movements. The gain or loss depends on the price of the underlying asset when the contract starts and ends.
All ships are, in general, subject to the cost of generating electricity onboard by their own generators. This cost comprises the procurement cost of conventional fuel plus the cost of the lubricants, the penalty to be paid once the ship generates electricity by conventional generator sets using pollutant fuel, and the annual maintenance cost of the generators.
In the case study considered, the cost of generating electricity on board a vessel as an active customer was assumed to be equal to 269 €/MWh [22], which included the cost of the marine diesel oil (MDO) consumed from the generation of electricity as well as the environmental fee for the CO2 emissions. The additional cost of NOx, SOx, PMs, maintenance costs, etc. can be added in the case a more accurate analysis is needed. Evidently, the cost of conventional fuel can fluctuate on an hourly or daily basis, however, we considered it constant for the simplicity of the calculations. This cost was used as the reference value and compared with the cost of the electricity produced by the LNG carrier operating as a FPGP.
The supplier’s selling price (SSP) in euro per MWh is equal to the pricing of electricity (PoE) as above-mentioned, thus is calculated considering the annual LNG cost (ALNG cost) in euro, the electric energy that is available to be sold (EE) in MWh, and the days of trading (DoT):
To calculate the port distribution usage fee, the following formulae were utilized, which comprise a fixed price and a fee proportional to the energy consumed [16]:
- Port distribution usage fee = 0.5 €/MWh + 1.5% of the monthly production cost if the supplier’s selling price is greater than 269 €/MWh.
- Port distribution usage fee = 1.725 €/MWh + 5% of the monthly production cost if the supplier’s selling price is less than 269 €/MWh.
Hence, the total supply cost of the electricity, named P in €/MWh, is the sum of the supplier’s selling price plus the distribution usage fee of the distribution network, which in most cases is that of the port where the ship is berthed. The supplier is the FPGP.
On the other hand, the total resultant cost for the ship partner of the PPA, summing all partial, fixed, and variant costs, will be named C in €/MWh. Based on the PPA, C will be the PPA agreed price of the shore side electricity, and referring to the aforementioned numerical example, C must be equal to 269 €/MWh. Following a procedure similar to the one described in [23]:
If P < C, then the power supplier has a benefit in excess of the PPA. A portion of the supplier’s earnings (i.e., a%(C-P)), feeds the CfD.
If P > C, then the power supplier has a loss. In this case, the amount (P-C) reflecting the loss of the trader is to be compensated at least partially by the CfD.
The calculated results obtained from implementing the aforementioned analysis in all three scenarios considered in this paper are presented in Table 16, Table 17 and Table 18, respectively. The analysis was conducted for a 10-month period that corresponded to the 300-day net operating period of the FPGP above-mentioned. At the end of this period, if the energy supplier (i.e., the FPGP) has a benefit, a portion of it supplies the CfD, whereas in the case of a resultant loss, this loss is compensated by the CfD. The calculated results referring to CfDs are figuratively summarized in Figure 9.
Table 16.
Calculated results of scenario 1.
Table 17.
Calculated results of scenario 2.
Table 18.
Calculated results of scenario 3.
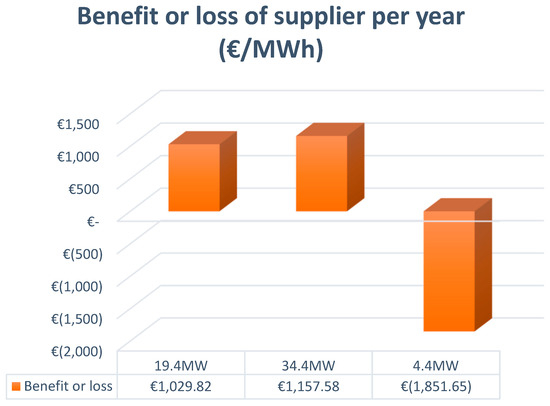
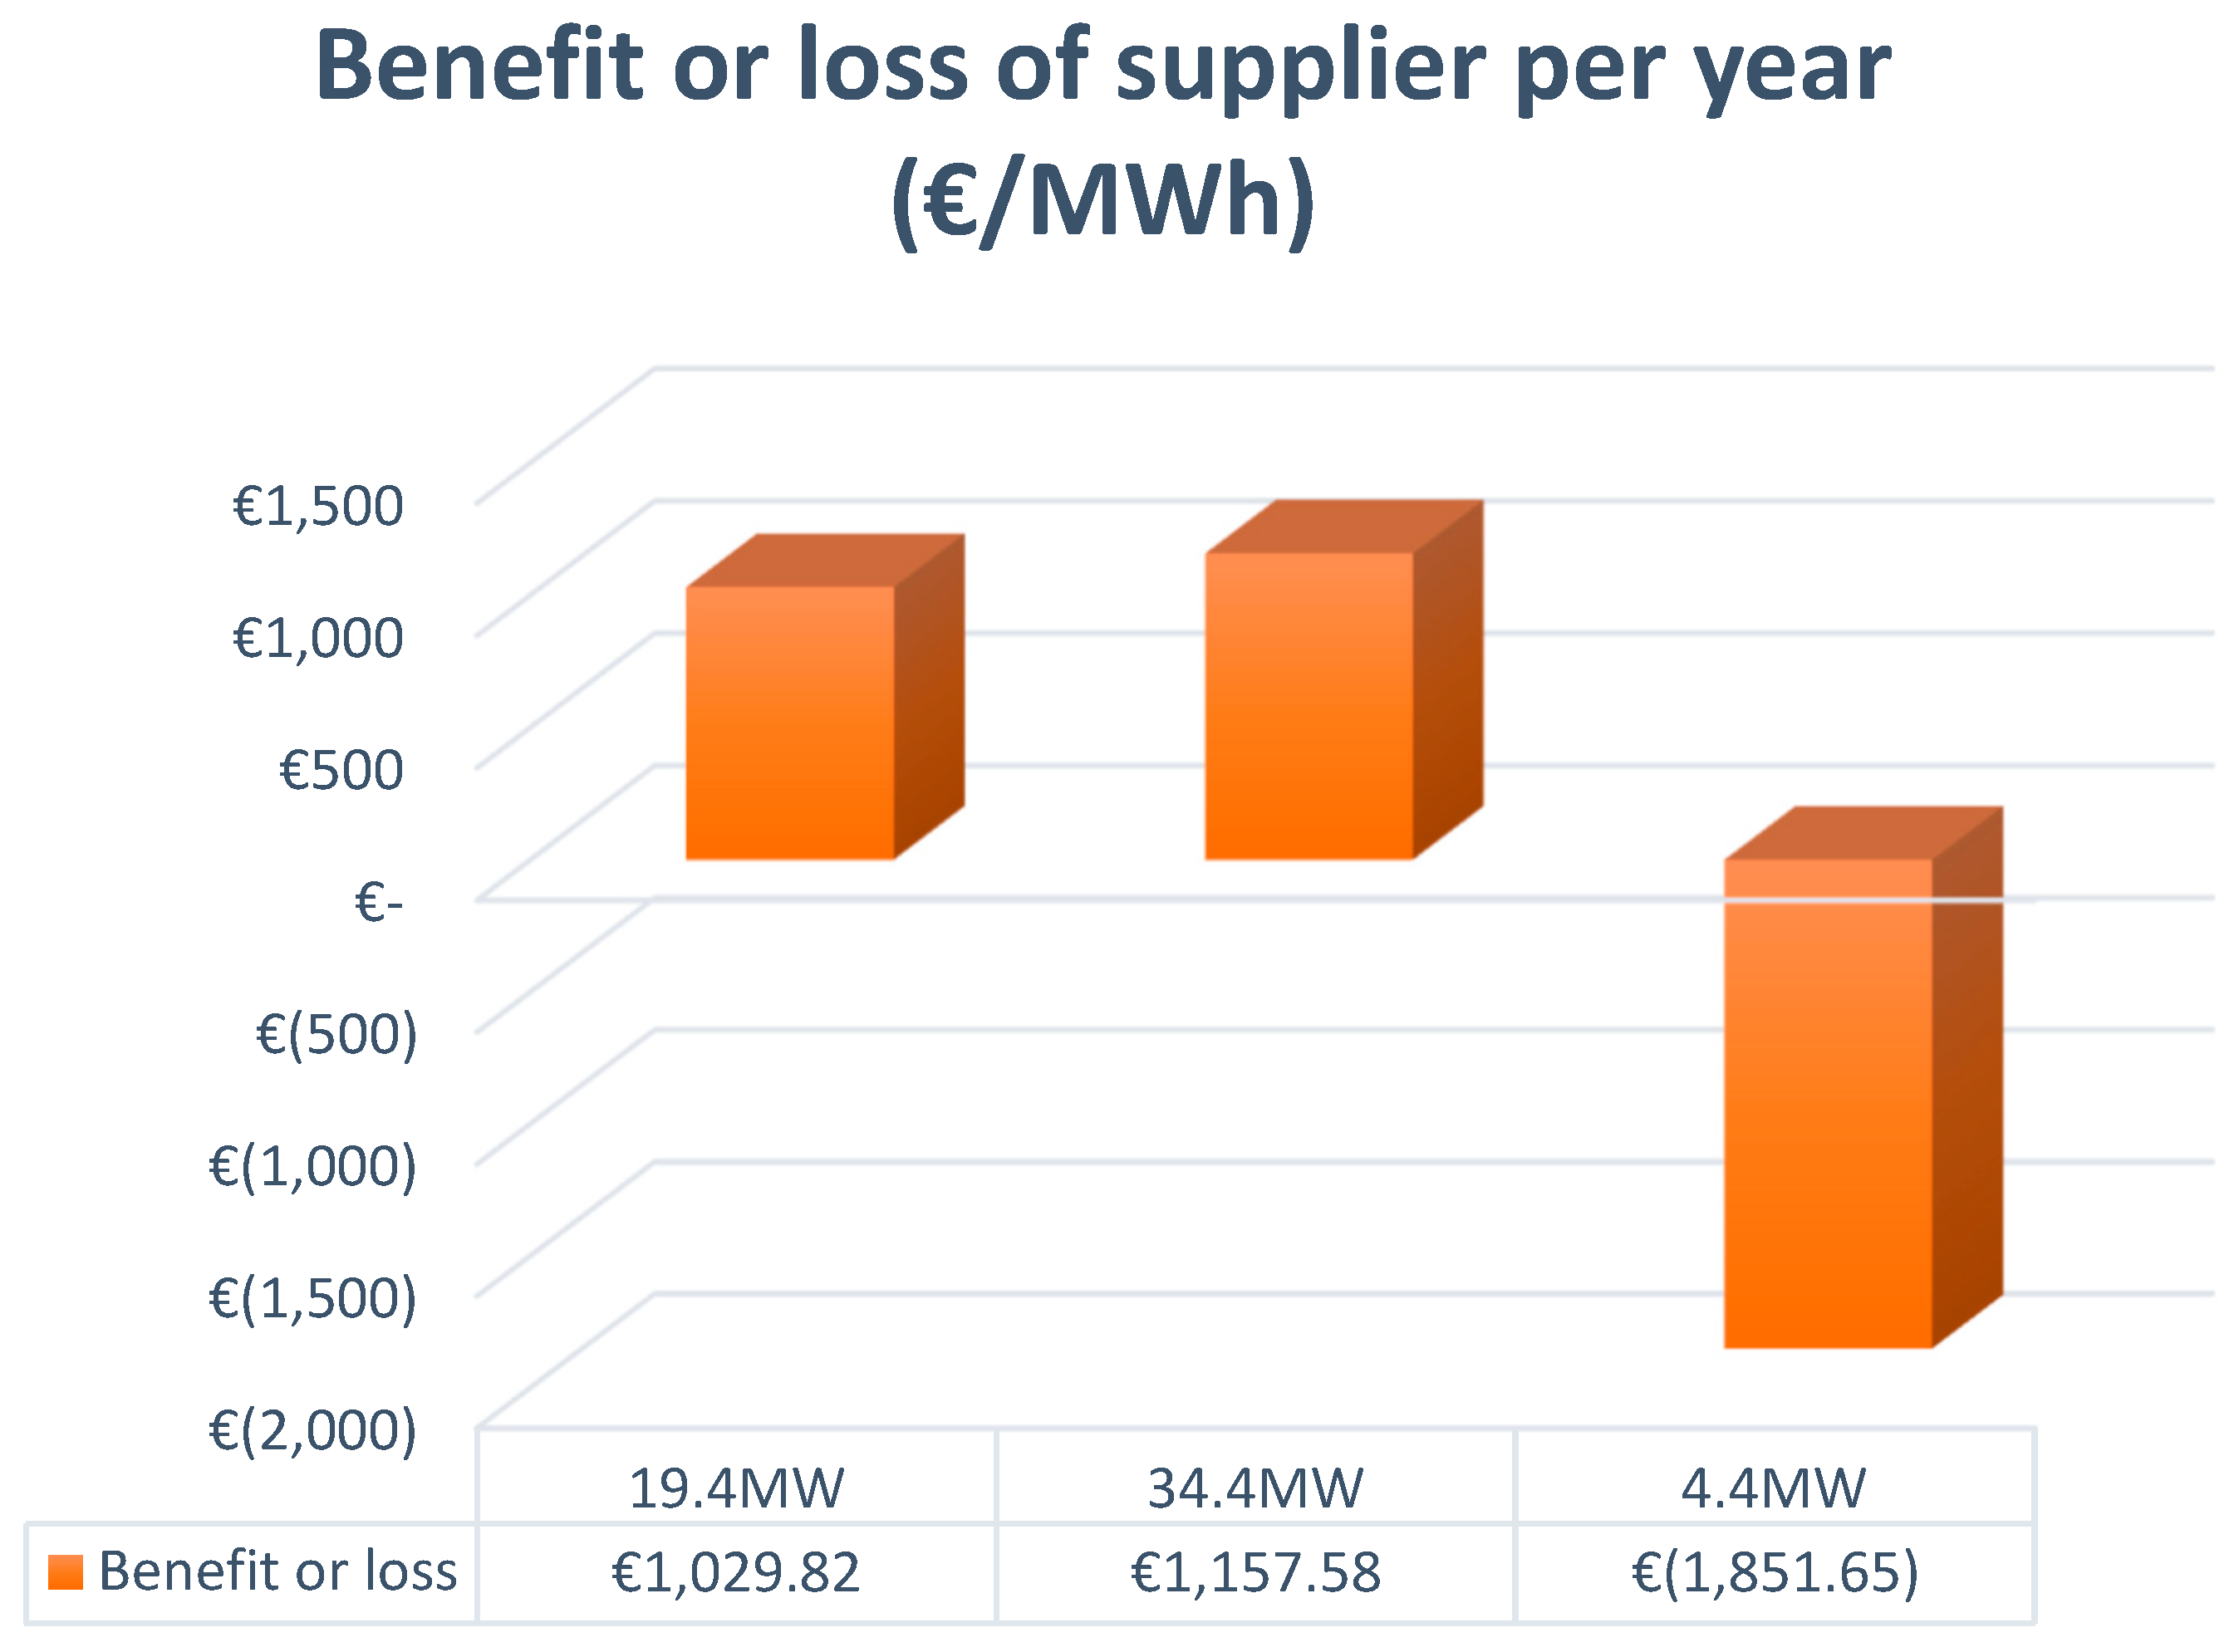
Figure 9.
Benefit or loss of FPGP as a supplier.
By inspecting the calculated results, the following remarks can be made:
- The second column in Table 16, Table 17 and Table 18 corresponds to the selling price of the supplier (i.e., the FPGP). The lowest selling price corresponds to scenario 2 where the amount of energy provided is the largest (34.4 MW for the period of 10 months considered). The price of the first scenario came second as it corresponded to a 19.4 MW capacity of the production unit. Finally, the third scenario ranked third as it only provided 4.4 MW for the production of electricity.
- Regarding the question of whether the PPA results are for the benefit of the supplier (i.e., the FPGP) or not, and hence how the CfD will be used, it can be seen that in the first two scenarios, there was a benefit on behalf of the supplier. Thus, a portion of the resultant total amount in the 10-month yearly period can be used to supply the CfD as its input. In contrast, in the third scenario, the selling price was fairly high as the installed electric power capacity was fairly low (on the order of 4.4 MW). Thus, in this last case (i.e., the third scenario), there were losses on the side of the supplier (see also Figure 9). The latter can be compensated for by the CfD, which in this case, was used to support the supplier.
- In conclusion, as can be easily seen in Figure 9, from this trade-wise approach, the third scenario is the least appealing for the 10-month yearly period considered as it is not beneficial without the supporting tool of CfD. In contrast, the second scenario was the most favorable, resulting in the greatest profit on the side of the supplier, while the first scenario was slightly less favorable.
10. Discussion of the Results
The work presented in this paper aimed to demonstrate a holistic examination of the investment for converting a steam turbine LNG carrier (LNG/C) into a floating power generating plant (FPGP). The examination included both the techno-economical and electricity market points of view.
In order to evaluate the investment from the more conventional CBA point of view, the financial metrics NPV, IRR, DPB, and PWC were used. As discussed, all three examined scenarios had positive financial metrics in the 10-year investment period considered, which proves their profitability in the long-term.
More specifically, the third scenario presented higher NPV and IRR than the other two scenarios and a lower DPB and PWC, which was because the total initial investment cost was lower as no turbo generators need to be added. In contrast, in scenarios 1 and 2, one or two generators need to be added, respectively.
Still, among the three scenarios, it was shown that scenario 2 (with two generators added) tended to have the optimum values of all four metrics calculated, providing fairly quick payback considering the initial investment cost. This is mainly due to the bigger amounts of energy sold and the corresponding income obtained from this.
On the other hand, from the energy market point of view, the last scenario seems to result in losses on the side of the supplier, and hence, the loss of the trader is to be compensated, at least partially, by the CfD. The other two scenarios presented extremely high benefits for the supplier during every year of trading, which was because the FPGP combines a low energy production cost and a high amount of produced energy.
It is worth noting that in order for the FPGP to be more competitive against other energy producers, the 15% surcharge, as described in Section 7, can be reduced to 10% or even down to 5%; the FPGP will continue to be beneficial for the investor. This portion is the input to the CfDs. The latter can be regarded as a guarantee that ascertains the viability of these types of investments. Taking into account the assumptions made for such studies regardless of how plausible and reasonable they are, there is always the latent uncertainty due to the numerous parameters affecting the final results. As it has been shown, CfDs can finally compensate and correct any contingencies that have occurred.
The conclusions drawn can be fairly appealing in the case where the grid supplied by the FPGP is that of a non-interconnected island, as originally hinted at in [15]. It is noted that in most of these islands, electricity is produced via thermal power plants based on costly but also pollutant oil, either heavy fuel oil or diesel oil [15]. Hence, the investment of retrofitting an LNG/C into an FPGP is not only economically profitable but also more environmentally friendly than that of conventional electricity production methods based on fossil fuels.
11. Conclusions
This paper provides an appealing alternative to extend, in a fairly profitable manner, the lifespan of old generation turbine LNG carriers (LNG/Cs). The solution consists of retrofitting the vessel into a floating power generating plant (FPGP) (i.e., a floating electric power plant providing electricity to shore grids or to other ships at berth). Considering that LNG is an interim but more environmentally friendly fuel than other fossil fuels, this scheme can also be applied to grids where electricity production is based on heavy fuel oil or diesel oil (e.g., in non-interconnecting islands). The paper presents a holistic investigation using both a techno-economical life cycle analysis of the retrofit investment but also by using modern tools of the transactions of the electric energy market, namely power purchase agreements (PPAs) and the contracts for difference (CfDs). The analyses of certain case study scenarios show that a careful investigation of all metrics included in a cost–benefit analysis (CBA), namely the NPV, IRR, DPB, and PWC can be used as a measure of how profitable this investment to retrofit can be in the limited time intervals that are of special interest. This profitability of the investment can be further evaluated based on the optimum combination of PPAs and CfDs that must be used for the electrical transactions engaged. The general conclusion is that this type of retrofit has been proven to be a mutually beneficial solution for all parties involved. Moreover, it has been shown that the scenario consisting of purchasing the biggest possible piece of machinery, which results in the biggest possible electricity production, is the most beneficial. On the other hand, if other less appealing solutions are selected, during implementation, the CfDs provide a guarantee for a finally beneficially result of the investment.
Author Contributions
Conceptualization, A.M.; Methodology, A.M. and J.P.; Validation, D.L. and J.P.; Formal analysis E.S. and A.M.; Investigation, A.M. and E.S.; Data curation, J.P.; Writing—original draft preparation, A.M.; Writing—review and editing, D.L. and J.P.; Visualization, A.M.; Supervision, D.L. and J.P. All authors have read and agreed to the published version of the manuscript.
Funding
This research received no external funding.
Institutional Review Board Statement
Not applicable.
Informed Consent Statement
Not applicable.
Data Availability Statement
Not applicable.
Conflicts of Interest
The authors declare no conflict of interest.
References
- Available online: https://www.consilium.europa.eu/en/press/press-releases/2023/07/25/fueleu-maritime-initiative-council-adopts-new-law-to-decarbonise-the-maritime-sector/ (accessed on 1 August 2023).
- Available online: https://ec.europa.eu/info/law/better-regulation/have-your-say/initiatives/12438-Sustainable-and-Smart-Mobility-Strategy_en (accessed on 1 August 2023).
- Available online: https://commission.europa.eu/strategy-and-policy/priorities-2019-2024/european-green-deal/repowereu-affordable-secure-and-sustainable-energy-europe_en (accessed on 1 August 2023).
- Hutchinson, K.W.; Dobson, D.C. Near-shore floating liquefied gas storage and processing. In RINA, Design, and Construction & Operation of LNG/LPG Ships, Proceedings of the H.I.M.T-RINA Conference on Design, and Construction & Operation of LNG/LPG Ships, Athens, Greece, 5 December 2018; Royal Institution of Naval Architects (RINA): London, UK, 2018; pp. 77–83. [Google Scholar]
- Frangopoulos, C. Cogeneration: Technologies, optimization and implementation; IET Publications: London, UK, 2017; p. 360. ISBN 978-1-78561-055-4. [Google Scholar]
- Available online: https://www.siemens-energy.com/global/en/offerings/power-generation/power-plants/seafloat.html (accessed on 27 August 2023).
- Available online: https://www.becker-marine-systems.com/products/product-detail/becker-lng-hybrid-barge.html (accessed on 27 August 2023).
- IEC/ISO/IEEE 80005-1:2019+A1:2022; Utility Connections in Port—Part 1: High Voltage Shore Connection (HVSC) Systems—General Requirements. IEC/ISO/IEEE: Geneva, Switzerland, 2019; pp. 1–76.
- IEC/ISO/IEEE 80005-1:2012; Utility Connections in Port—Part 2: High and Low Voltage Shore Connection Systems. Data Communication for Monitoring and Control. IEC/ISO/IEEE: Geneva, Switzerland, 2018; pp. 1–56.
- IEC/ISO/IEEE/PAS 80005-3:2014; Utility Connections in Port—Part 3: Low Voltage Shore Connection (LVSC) Systems—General Requirements. IEC/PAS: Geneva, Switzerland, 2014; pp. 1–56.
- Available online: https://www.wartsila.com/docs/default-source/oil-gas-documents/gastech/e4_6.pdf?sfvrsn=2 (accessed on 27 August 2023).
- Available online: https://www.wartsila.com/docs/default-source/oil-gas-documents/white-paper-o-ogi-2013-lng-power-production.pdf (accessed on 27 August 2023).
- Budiyanto, M.A.; Riadi, A.; Sumanta Buana, I.G.N.; Kurnia, G. Study on the LNG distribution to mobile power plants utilizing small-scale LNG carriers. Heliyon 2020, 6, e04358. [Google Scholar] [CrossRef] [PubMed]
- Available online: https://cdn.wartsila.com/docs/default-source/oil-gas-documents/brochure-lng-shipping-solutions.pdf (accessed on 27 August 2023).
- Lyridis, D.V.; Papaleonidas, C.; Prousalidis, J.; Sofras, E. A general methodology for examining the feasibility of LNG supply chains to insular regions for power generation purposes. In RINA, Design, and Construction & Operation of LNG/LPG Ships, Proceedings of the H.I.M.T-RINA Conference on Design, and Construction & Operation of LNG/LPG Ships, Athens, Greece, 5 December 2018; Royal Institution of Naval Architects (RINA): London, UK, 2018. [Google Scholar]
- Nilsson, D. Regasification Vessels with Power Generation Requirements and Recommendations for Gas Power Generation Vessels. Master’s Dissertation, Chalmers University of Technology, Gothenburg, Sweden, 2012. [Google Scholar]
- Lyridis, D.; Papaleonidas, C.; Stobkan, G.; Prousalidis, J.; Sofras, E.; Anaxagorou, P. Novel technical perspectives for alternative commercial use of old LNG carriers. In Proceedings of the MOSES 2019 Conference, 2nd International Conference on Modelling and Optimisation of Ship Energy Systems, Glasgow, UK, 8–10 May 2019. [Google Scholar]
- Stopkan, G. Investigating Alternative Utilisation Possibilities for LNG Carriers Producing Electricity; National Technical University of Athens: Athens, Greece, 2018. (In Greek) [Google Scholar]
- D’Agostino, F.; Kaza, D.; Schiapparelli, G.P.; Silvestro, F.; Bossi, C.L.; Colzi, F. Assessment of the Potential Shore to Ship Load Demand: The Italian Scenario. In Proceedings of the 2021 IEEE Power & Energy Society General Meeting (PESGM), Washington, DC, USA, 26–29 July 2021. [Google Scholar] [CrossRef]
- Shore-Side Electricity Guidance to Port Authorities and Administrations; European Maritime Safety Agency (EMSA): Lisbon, Portugal, 2022.
- ESPO. Position of the European Sea Ports Organisation on the Fuel EU Maritime Initiative; ESPO: Leicester, UK, 2020. [Google Scholar]
- Manos, A.; Lyridis, D.; Prousalidis, J. The Maritime Sector in the electric Energy Markets. In Proceedings of the ESARS-IEC 2023, Venice, Italy, 28–31 March 2023. [Google Scholar] [CrossRef]
- Manos, A.; Lyridis, D.; Prousalidis, J. Establishing a Framework of the Open Maritime Electric Energy Market. Energies 2023, 16, 5276. [Google Scholar] [CrossRef]
- Directive (EU) 2019/944 of the European Parliament and of the Council of 5 June 2019 on Common Rules for the Internal Market for Electricity and Amending Directive 2012/27/EU. Available online: https://eur-lex.europa.eu/legal-content/EN/TXT/PDF/?uri=CELEX:32019L0944 (accessed on 1 August 2023).
- Fernández, I.A.; Gómez, M.R.; Gómez, J.R.; Insua, Á.B. Review of propulsion systems on LNG carriers. Renew. Sustain. Energy Rev. 2017, 67, 1395–1411. [Google Scholar] [CrossRef]
- Frangopoulos, C.; von Spakovsky, M.; Sciubba, E. A Brief Revies of Methods for the Design and Synthesis Optimization of Energy Systems. Int. J. Appl. Thermodyn. 2002, 5, 151–160. [Google Scholar] [CrossRef]
- Historical Records of LNG Prices 1990–2022. Available online: https://tradingeconomics.com/commodity/natural-gas (accessed on 1 August 2023).


Disclaimer/Publisher’s Note: The statements, opinions and data contained in all publications are solely those of the individual author(s) and contributor(s) and not of MDPI and/or the editor(s). MDPI and/or the editor(s) disclaim responsibility for any injury to people or property resulting from any ideas, methods, instructions or products referred to in the content. |
© 2023 by the authors. Licensee MDPI, Basel, Switzerland. This article is an open access article distributed under the terms and conditions of the Creative Commons Attribution (CC BY) license (https://creativecommons.org/licenses/by/4.0/).