Article

The Experimental Study of Dynamic Response of Marine Riser under Coupling Effect of Multiparameter

1
School of Civil Engineering and Geomatics, Shandong University of Technology, Zibo 255000, China
2
Shandong Provincial Key Laboratory of Ocean Engineering, Qingdao 266100, China
3
College of Engineering, Ocean University of China, Qingdao 266100, China
*
Author to whom correspondence should be addressed.
J. Mar. Sci. Eng. 2023, 11(9), 1787; https://doi.org/10.3390/jmse11091787
Submission received: 29 June 2023 / Revised: 8 September 2023 / Accepted: 9 September 2023 / Published: 13 September 2023
(This article belongs to the Section Ocean Engineering)

Abstract

:
In order to investigate the dynamic response of a marine riser under the coupling effect of multiparameter, a model experiment of a marine riser was designed and carried out. The main parameters of the model test were divided into riser design parameters and flow field parameters. The riser parameters included the elastic modulus, boundary conditions, and top tension forces, and the flow field parameters were the velocities and wave parameters (wave height and period). The riser materials were aluminum (Al) and polymethyl methacrylate (PMMA), representing the metal riser and fiber-reinforced composite marine riser, respectively, which differ greatly in modulus. Two types of boundary conditions were considered, which were simple supports at both ends (S-S) and simple and fixed supports at each end (S-F). The top tension forces were chosen as 10 N and 30 N, respectively. In terms of the flow velocities, 0.3 m/s and 0.7 m/s were used. For the wave types, the small wave had a period of 1.0 s and a wave height of 5 cm while the large wave had a period of 2.0 s and a wave height of 15 cm. The dynamic response of the riser under 32 different working conditions was studied experimentally, and through the analysis of the experimental data, the effects of various parameters on the dynamic response of the risers were obtained. The results show that the amplitude of the riser was negatively correlated with the elastic modulus, the number of constraints, and the magnitude of the top tension, while it was positively correlated with the flow velocity and wave size. Moreover, the sequences of importance were b3 (flow velocity) > b6 (modulus) > b1 (number of constraints) > b2 (top tension force) > b5 (wave height) > b4 (wave period) for the vibration of the riser in the in-flow direction and b3 (flow velocity) > b1 (number of constraints) > b6 (modulus) > b2 (top tension force) > b5 (wave height) > b4 (wave period) for the vibration of the riser in the cross-flow direction, respectively, according to the multiple linear regression calculation.

1. Introduction

The world is facing an increasingly serious energy crisis, and this trend is even more severe in China. Compared with terrestrial oil and gas resources, global marine oil and gas resources are more abundant. It is reported that 90% of undeveloped offshore oil and gas reserves are under the seabed at a depth of more than 1000 m, and China has a vast deep-sea area and abundant offshore oil and gas resources [1]. Therefore, offshore exploration and production activities are an important way to solve China’s energy crisis [2].
The riser is an indispensable component of offshore oil and gas exploitation structures which transports oil and gas from the seabed to the offshore platform or guides the drilling equipment. Under operational conditions, risers are subjected to complex and changeable ocean environments. For example, under the action of ocean currents, vortexes separated from the riser would lead to vortex-induced vibration (VIV). Ferguson et al. [3] made a pioneering experimental study using acoustic pressure sensors and found that the surface and wake phenomena of cylindrical vortex excited oscillation. In order to prevent fatigue failure of the riser due to dynamic vibration, Liu et al. [4] proposed that establishing a prediction model of VIV for the riser was extremely important for VIV suppression, and further research should be carried out for risers with a large slenderness ratio. Moreover, Ma et al. [5] found that suppression methods for dynamic vibration should correspond to the specific combination of different environmental conditions. However, at present, most studies still stay on the influence of a single factor or a few factors, while the multi-factor coupling effect is rarely involved.
The main factors affecting the dynamic response of the riser include the material properties of the riser itself, the velocity of the current, the top tension force, the boundary conditions, the waves, etc. Previous studies have often only explored the effects of single factors. As for the influence of top tension on the dynamic vibration of the riser, Yang et al. [6] found that the instability of the top-tensioned riser (TTR) would be inhibited with the increase in top tension force under combined excitation, but the increase in the suppression effect was not proportional to the increase in the top tension force. Li et al. [7]. simplified the riser into a typical Euler–Bernoulli elastic beam model and, based on the transfer matrix theory, concluded that the natural frequency of the riser could be affected by the change in axial tension caused by the apparent gravity and the in-and-out pressure difference of the riser. Zhang et al. [8] also studied the influence of top tension on the dynamic vibration of a riser and, based on the experimental data, concluded that the natural frequency of the riser would increase with the increase in top tension. As for the direction of incoming flow, Liu et al. [9] concluded through experiments that, under the condition of uniform flow velocity, the vibration frequency of the riser in the flow direction is basically twice that in the cross-flow direction; therefore, the dynamic vibration of the riser in both directions should be considered simultaneously. Li et al. [10] studied the influence of boundary conditions on the vibration amplitude and found that under the same circumstances, the vibration amplitude of the riser with simple supports was much greater than that with fixed supports. Similarly, Gao et al. [11] found through numerical analysis that within a certain range, a smaller slenderness ratio (L/D) led to a more obvious impact on the vibration amplitude due to the different boundary conditions. Through summarizing previous dynamic experiments on risers, Yin et al. [12] proposed that we should pay more attention to the effect of waves on the riser’s dynamic response. In addition, Wu et al. [13] established a mathematical analysis model for the dynamic response of ocean risers under the combined action of random wave and eddy current excitation, and this model was used to explore the influence of random waves on the dynamic vibration of the riser. In terms of coupling effect, Wang et al. [14] conducted a multi-factor experiment to study the combined effects of riser material, flow velocity, top tension, and boundary conditions on the vortex-induced vibration of the riser, but that study did not consider the effect of waves. Also, Ge et al. [15] used ANSYS to conduct finite element analysis of vortex-induced vibration of marine risers under multi-factors. The experimental design in this paper draws on the experience of the studies from Cui et al. [16] and Lou et al. [17]. In this experiment, eight strain gauges were attached to one observation point of the riser so as to detect the strains in both the in-flow and cross-flow directions and obtain the data from the axial and hoop directions of a single testing point at the same time.
Compared to the previous studies, this experimental research considered the coupling effect of both the riser and environmental parameters, i.e., the modulus of the riser’s material, boundary conditions, top tension forces, flow velocities, wave heights, and wave periods. In addition, the least square method was applied to carry out multiple linear regression to explore the relative importance of the test parameters. From this study, the dynamic response of the riser with the coupling effect of riser–current–wave was observed, and the significance of different test parameters was found, which lay a theoretical and technical foundation for the riser’s design, utilization, and maintenance in practical engineering.

2. Riser Model and Test Equipment of the Experiment

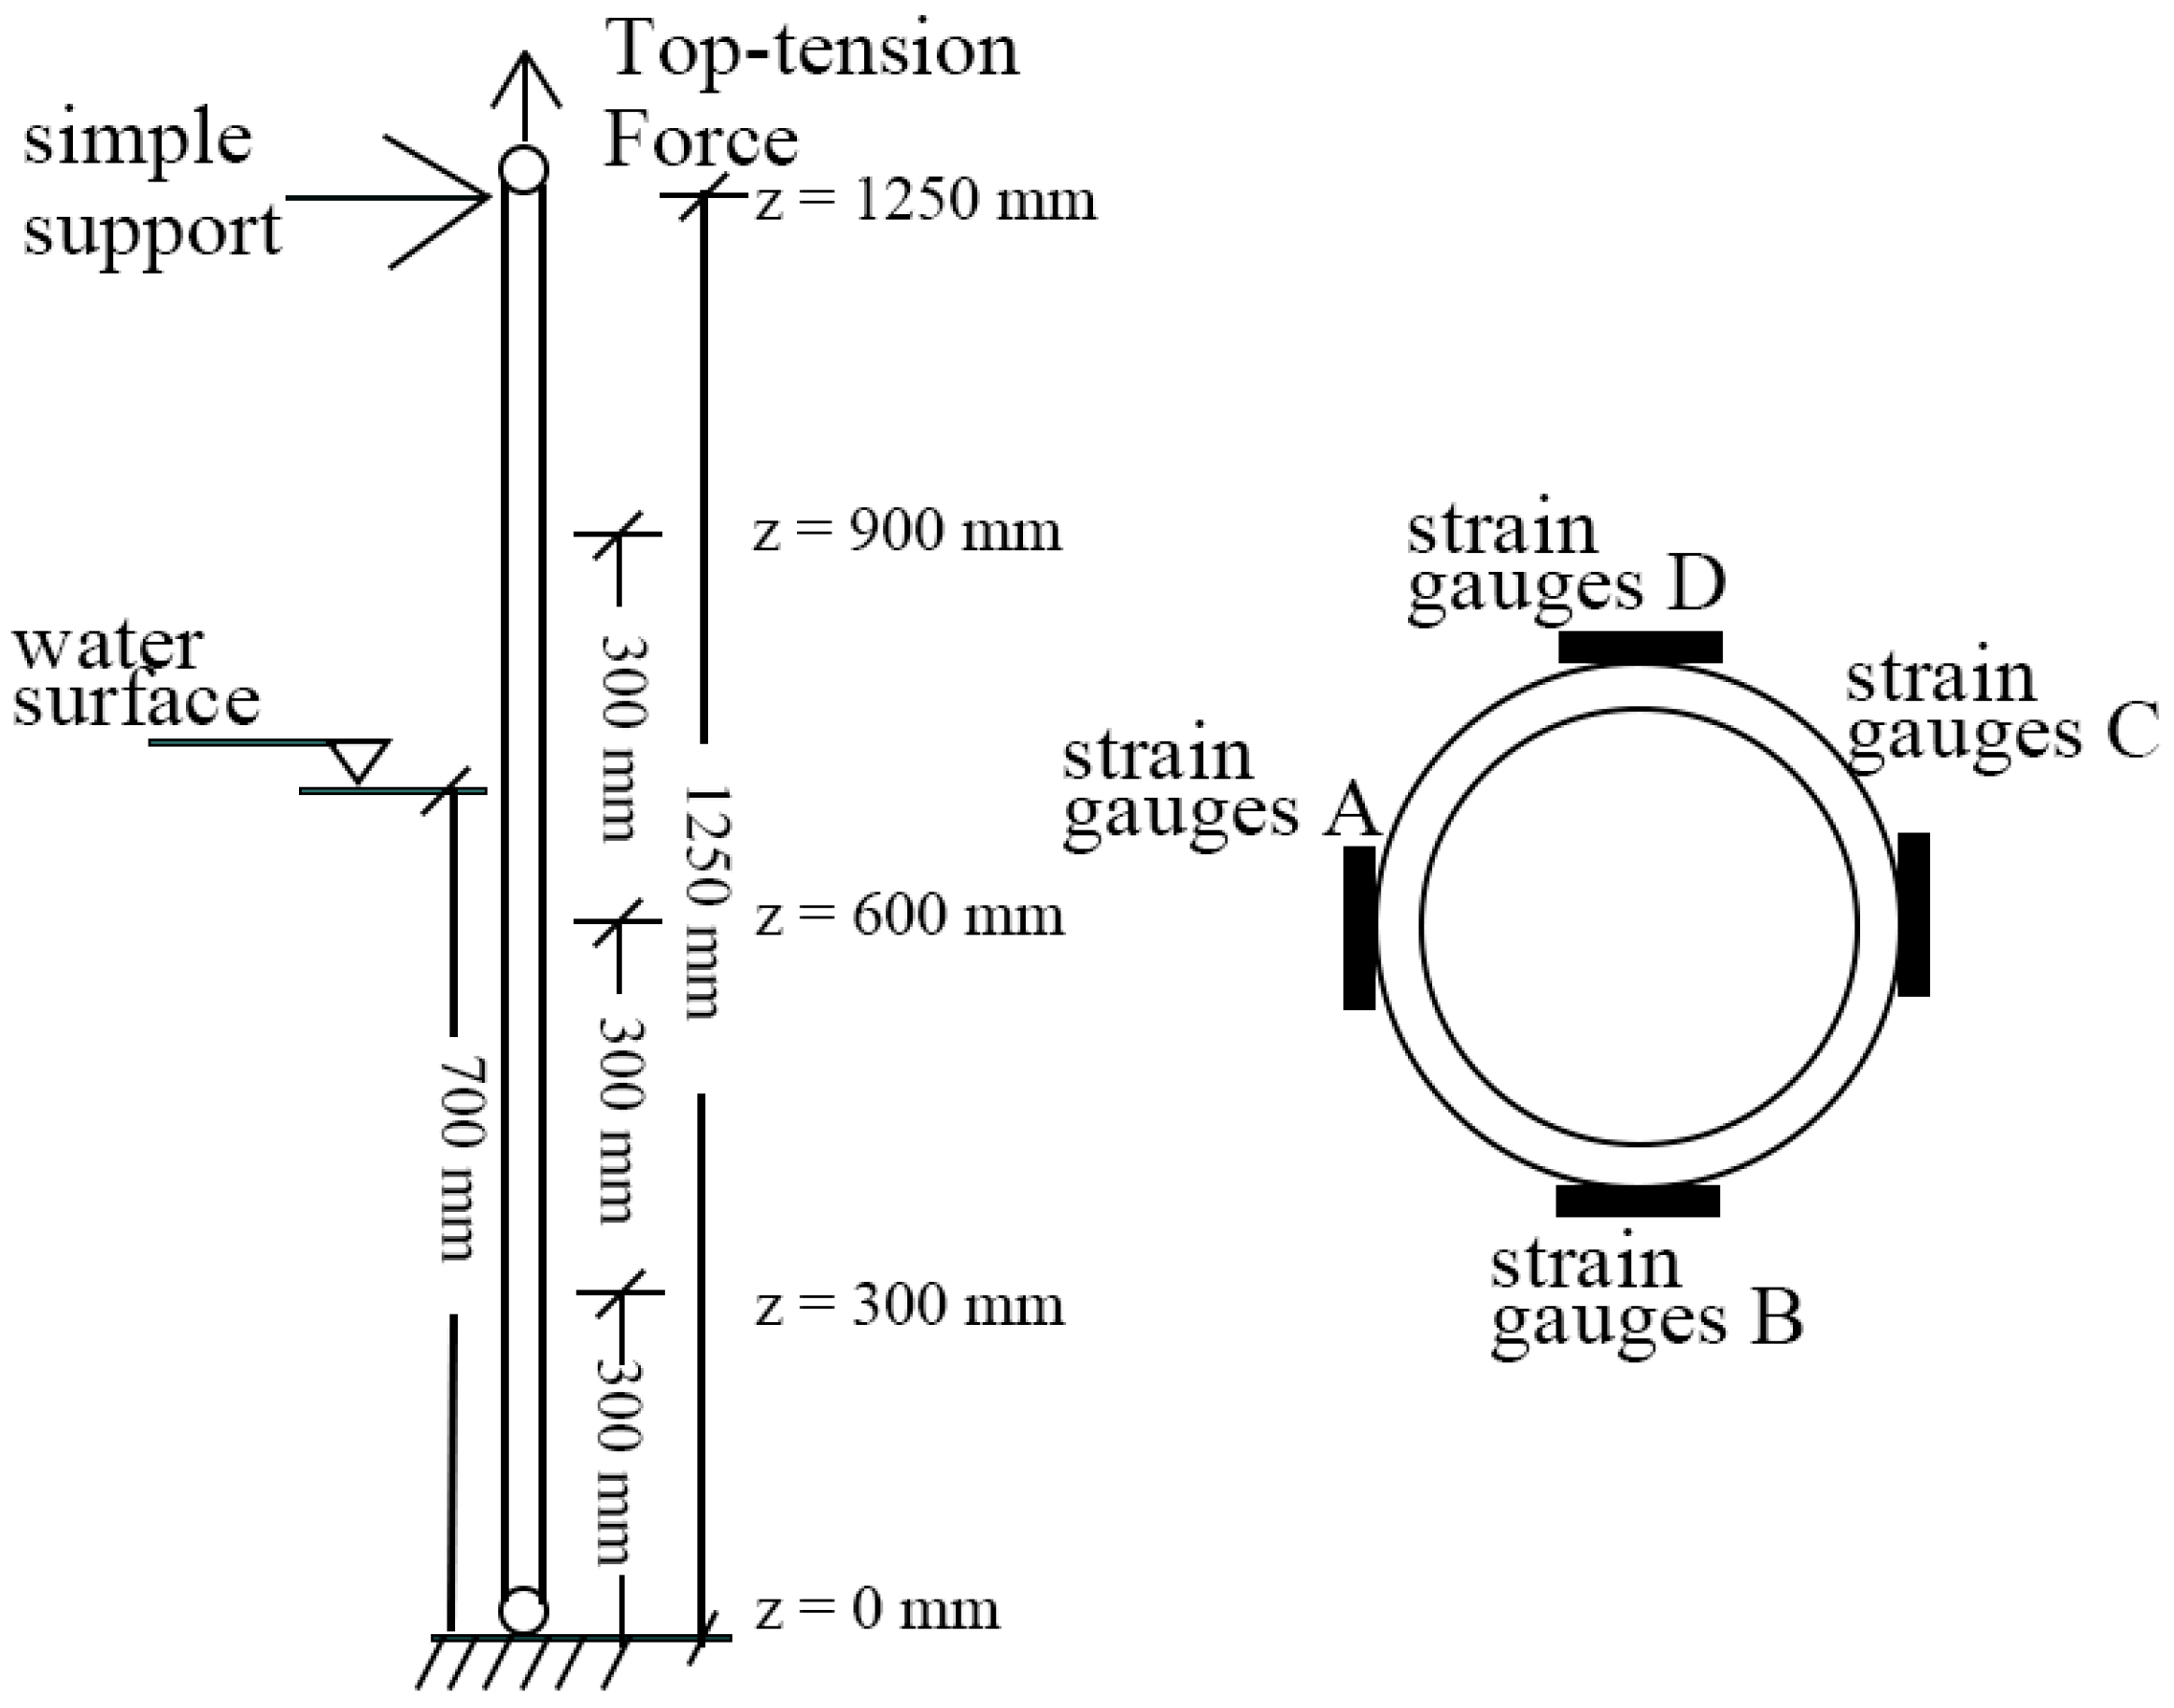
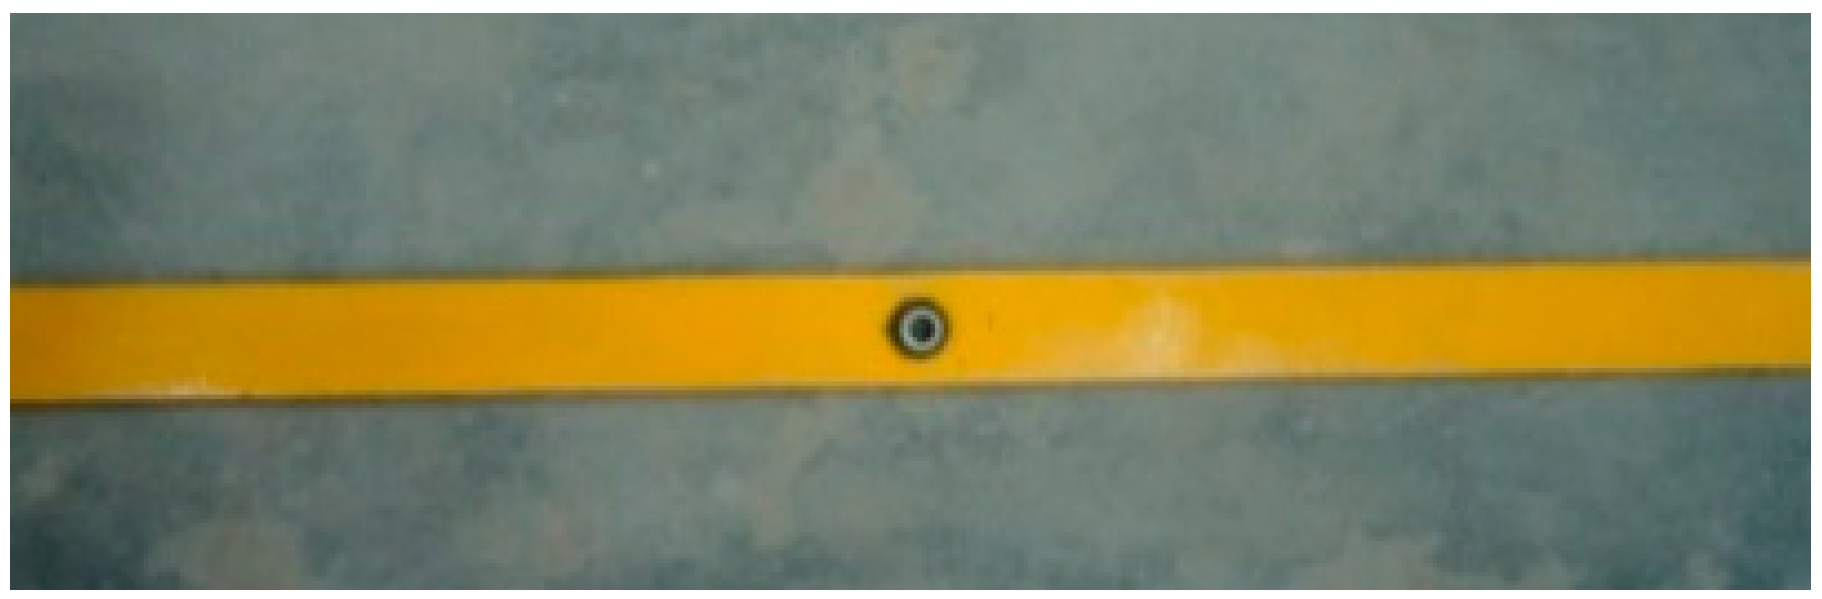
2.1. Experimental Model of Riser

Currently, the most commonly used risers are high-grade steel risers with an elastic modulus of 207 GPa and fiber-reinforced polymer (FRP) composite risers with the equivalent elastic modulus of about 30 GPa, and the moduli of the two types of marine riser are quite different [18]. In order to qualitatively analyze the influence of modulus for two types of marine riser with different materials, aluminum and Polymethyl Methacrylate (PMMA) with large gaps of the modulus were adopted in this paper to qualitatively represent steel and FRP composite risers [14]. Here we have to note that, although aluminum and PMMA are used in this laboratory experiment to qualitatively analyze the effect of different moduli, it does not mean that they are the choice in practical engineering. The geometry of the riser model was 20 mm for outside diameter, 2 mm for wall thickness, and 1250 mm for length, which drew on the experience of the previous study [14]. The specific size and attributes of the marine riser model are shown in Table 1.
In the elastic stage, the tensile modulus only has a small difference from the compressive modulus. Hence, in this paper, the compressive elastic modulus of materials (Figure 1) is used, and the final results are shown in Table 1.
The position of the strain gauge, as well as the sketch map of the model riser, are shown in Figure 2. More specifically, the depth of the water was 700 mm, and electric resistance strain gauges were placed at z = 300 mm and z = 600 mm and 900 mm (z = 0 is the bottom of riser), respectively. At each location, 4 groups of strain gauges were employed at the A, B, C, and D points (Figure 2) around the riser’s outer surface (24 groups of strain gauges in total for each riser model), where A and C were in the in-flow direction while B and D were in the cross-flow direction.

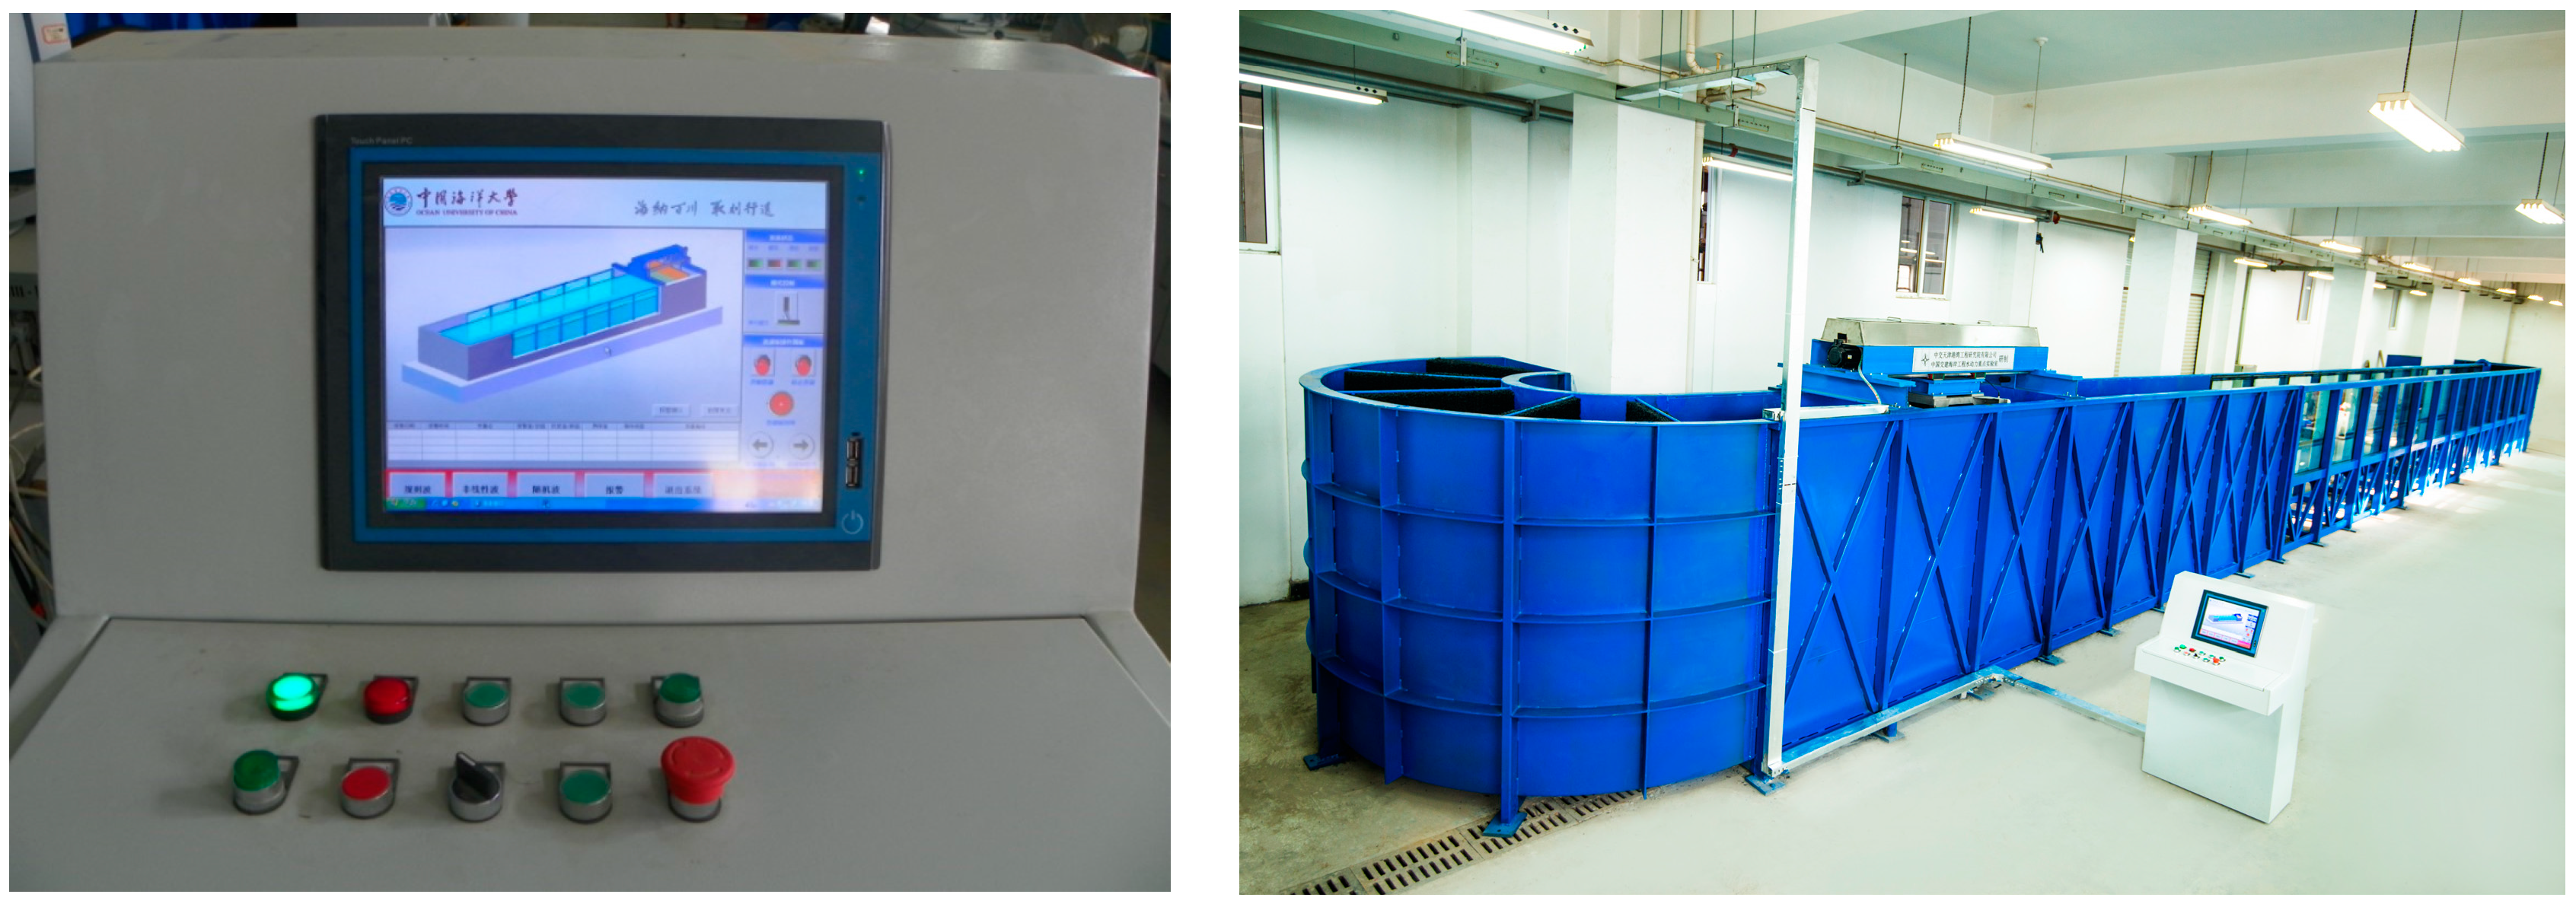
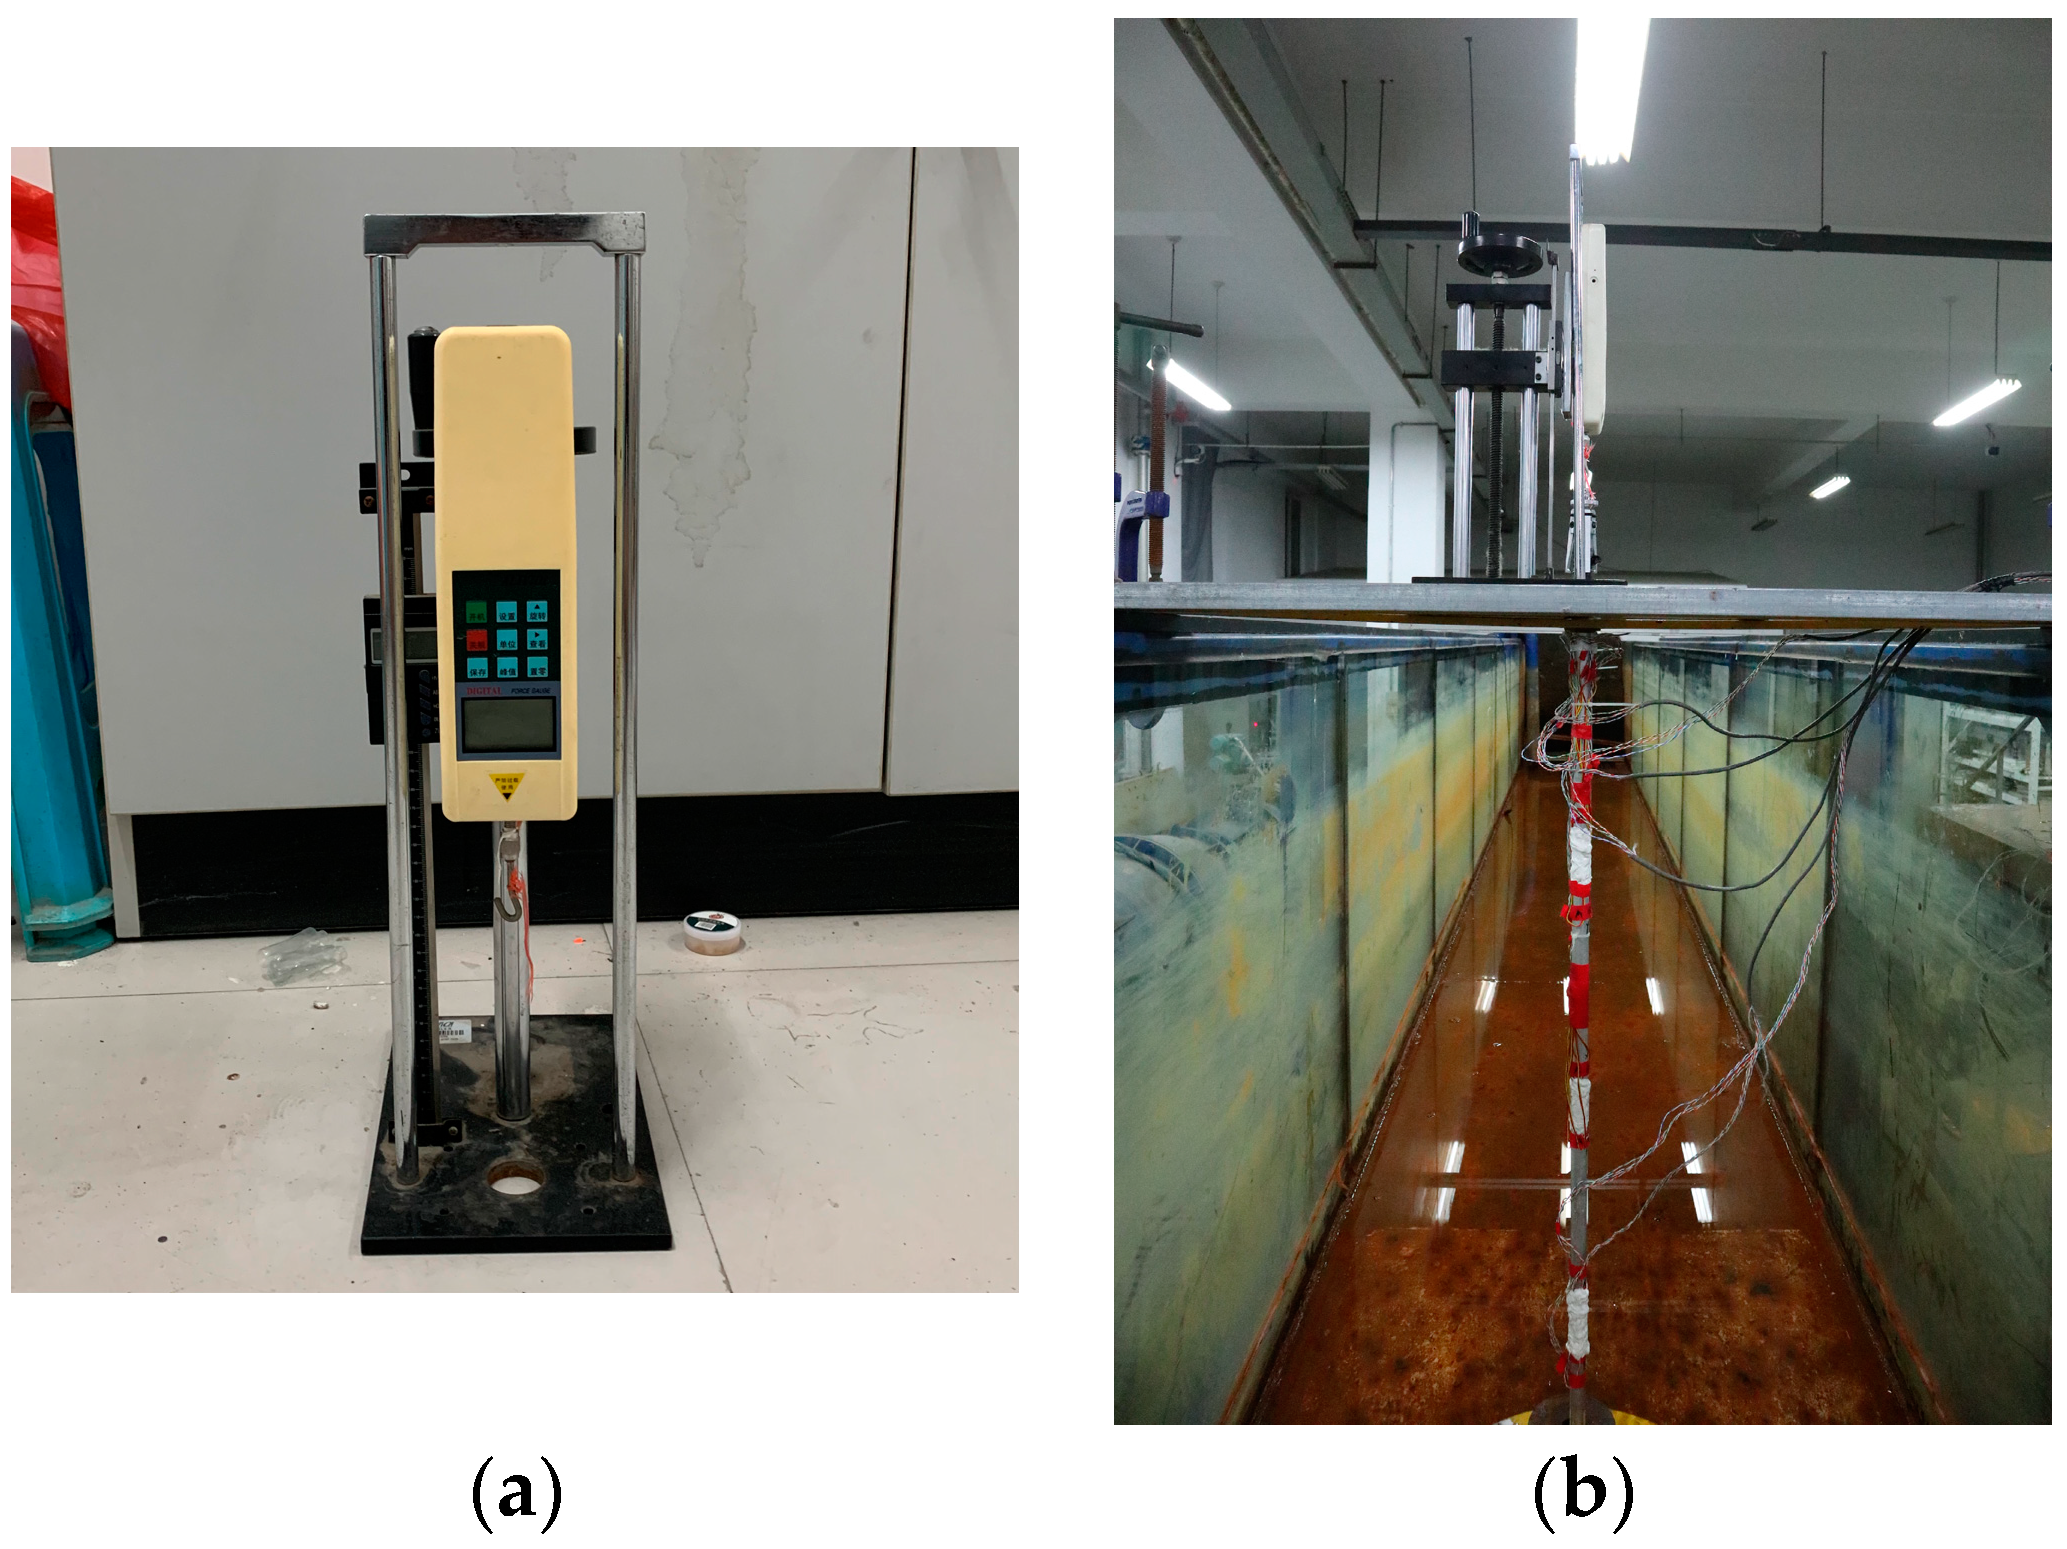
2.2. Wave–Current System

The experiment was carried out in the Shandong Provincial Key Laboratory of Ocean Engineering, Ocean University of China. The water channel had an inner diameter of 1 m, a height of 1.2 m, and a length of 50 m, which could produce uniform flow with different velocities and a wave with different wave elements, as shown in Figure 3.

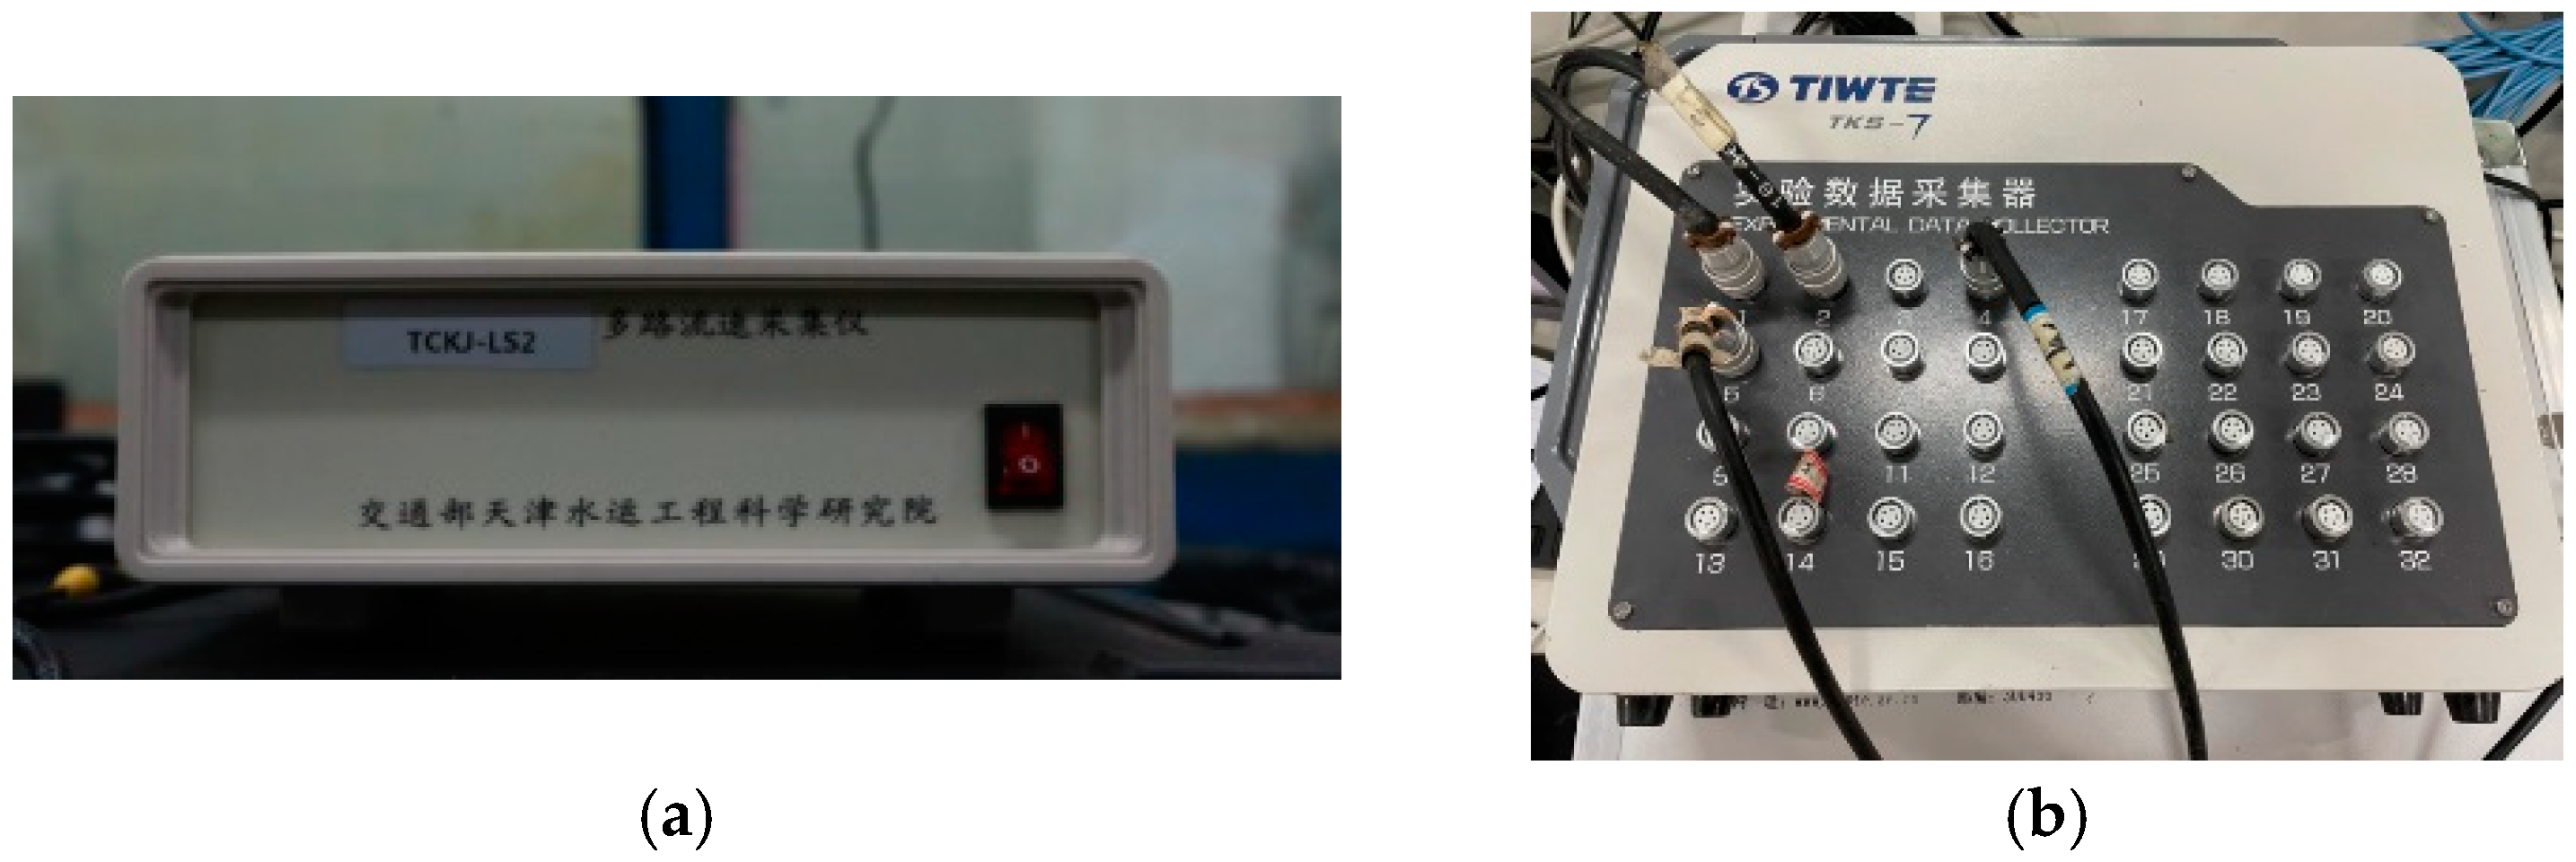
2.3. Wave–Current Monitoring System

The flow velocity and wave height for the test were measured using the multichannel flow meter (TCKJ-LS2, Tianjin Research Institute for Water Transport Engineering, Tianjin, China) and wave height meter (TKS-7, Tianjin Research Institute for Water Transport Engineering, Tianjin, China), respectively (Figure 4). In order to minimize the interference effect of the flow meter and wave height meter on the riser’s dynamic response and to effectively ensure the velocity and wave parameters in the location of the riser model met the designed requirements, the current meter and wave height meter were placed about 2 m in front of the riser model.

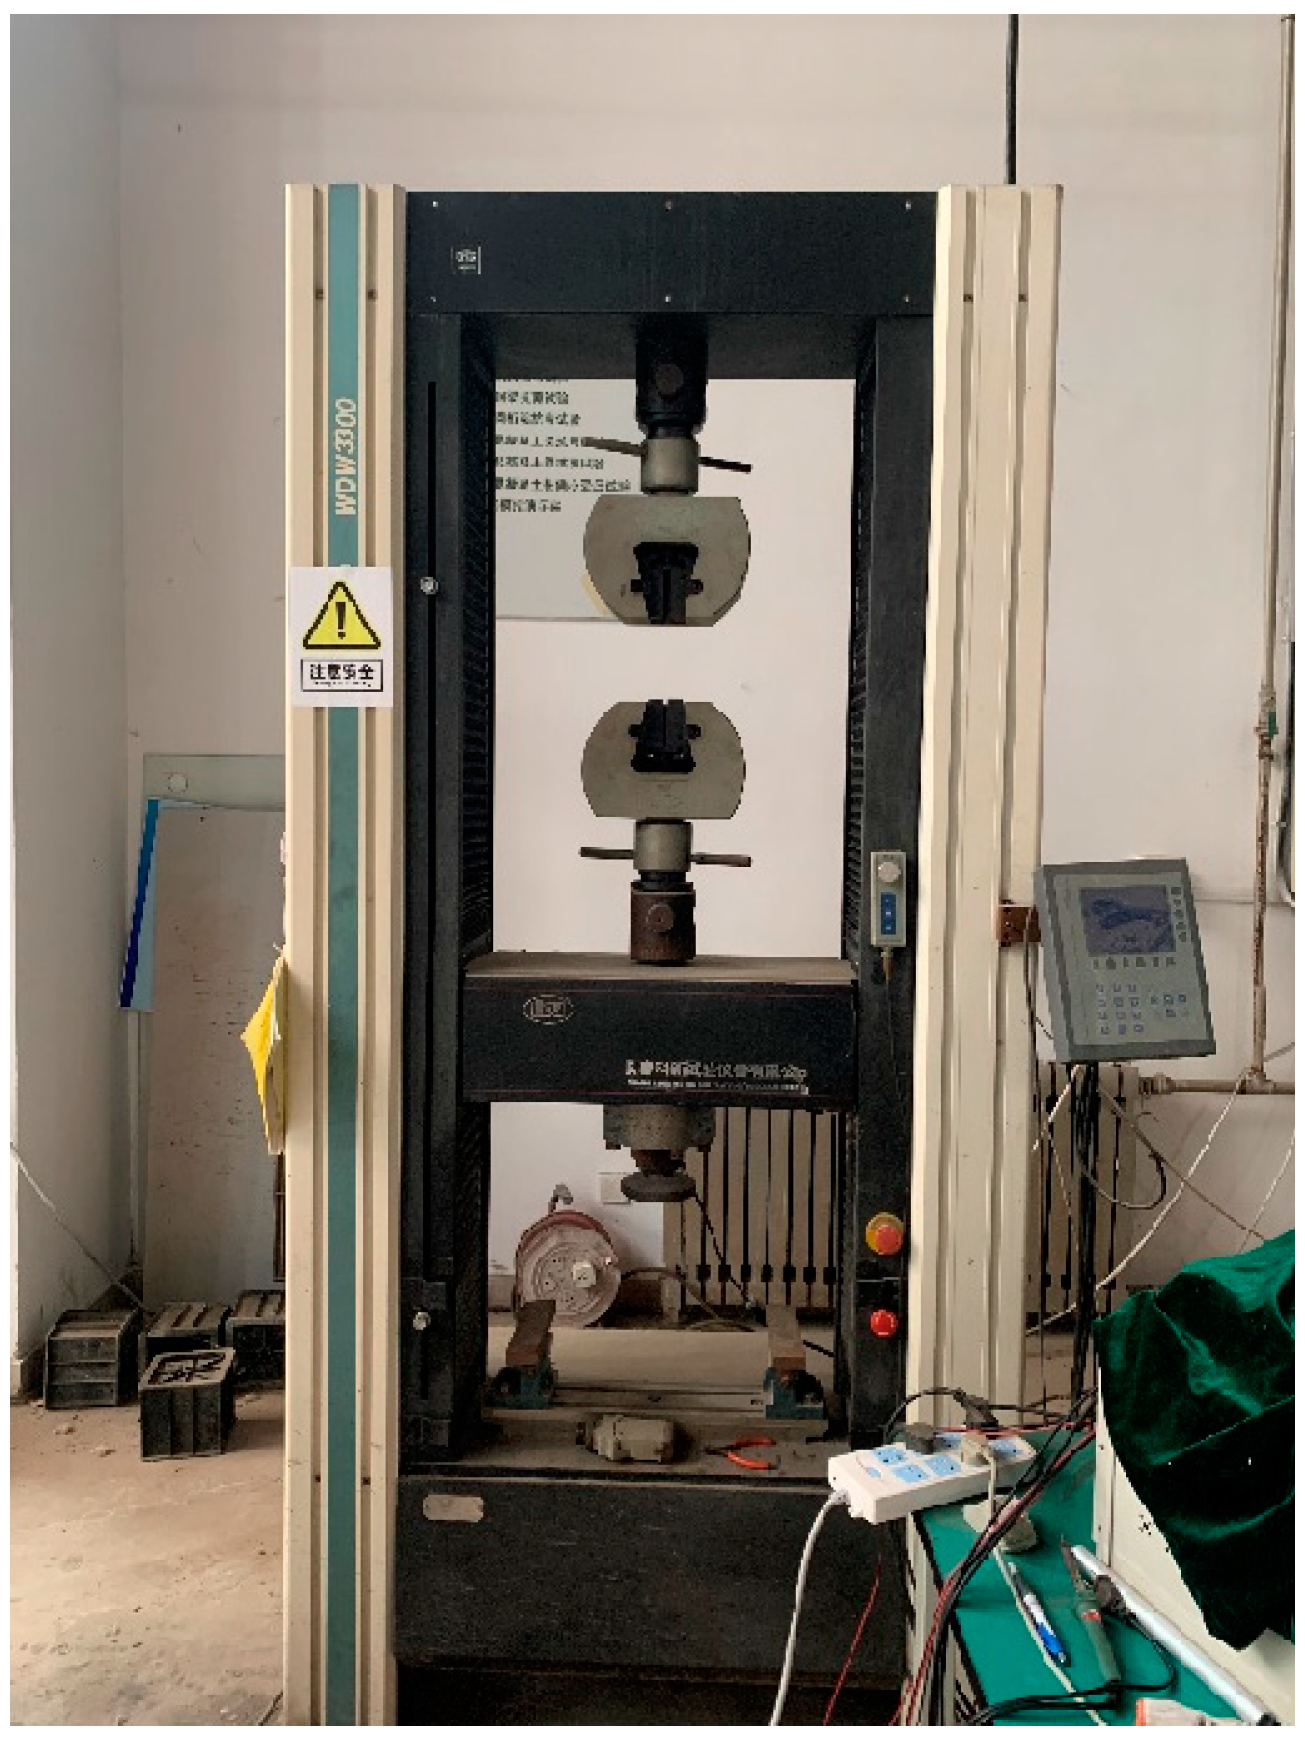
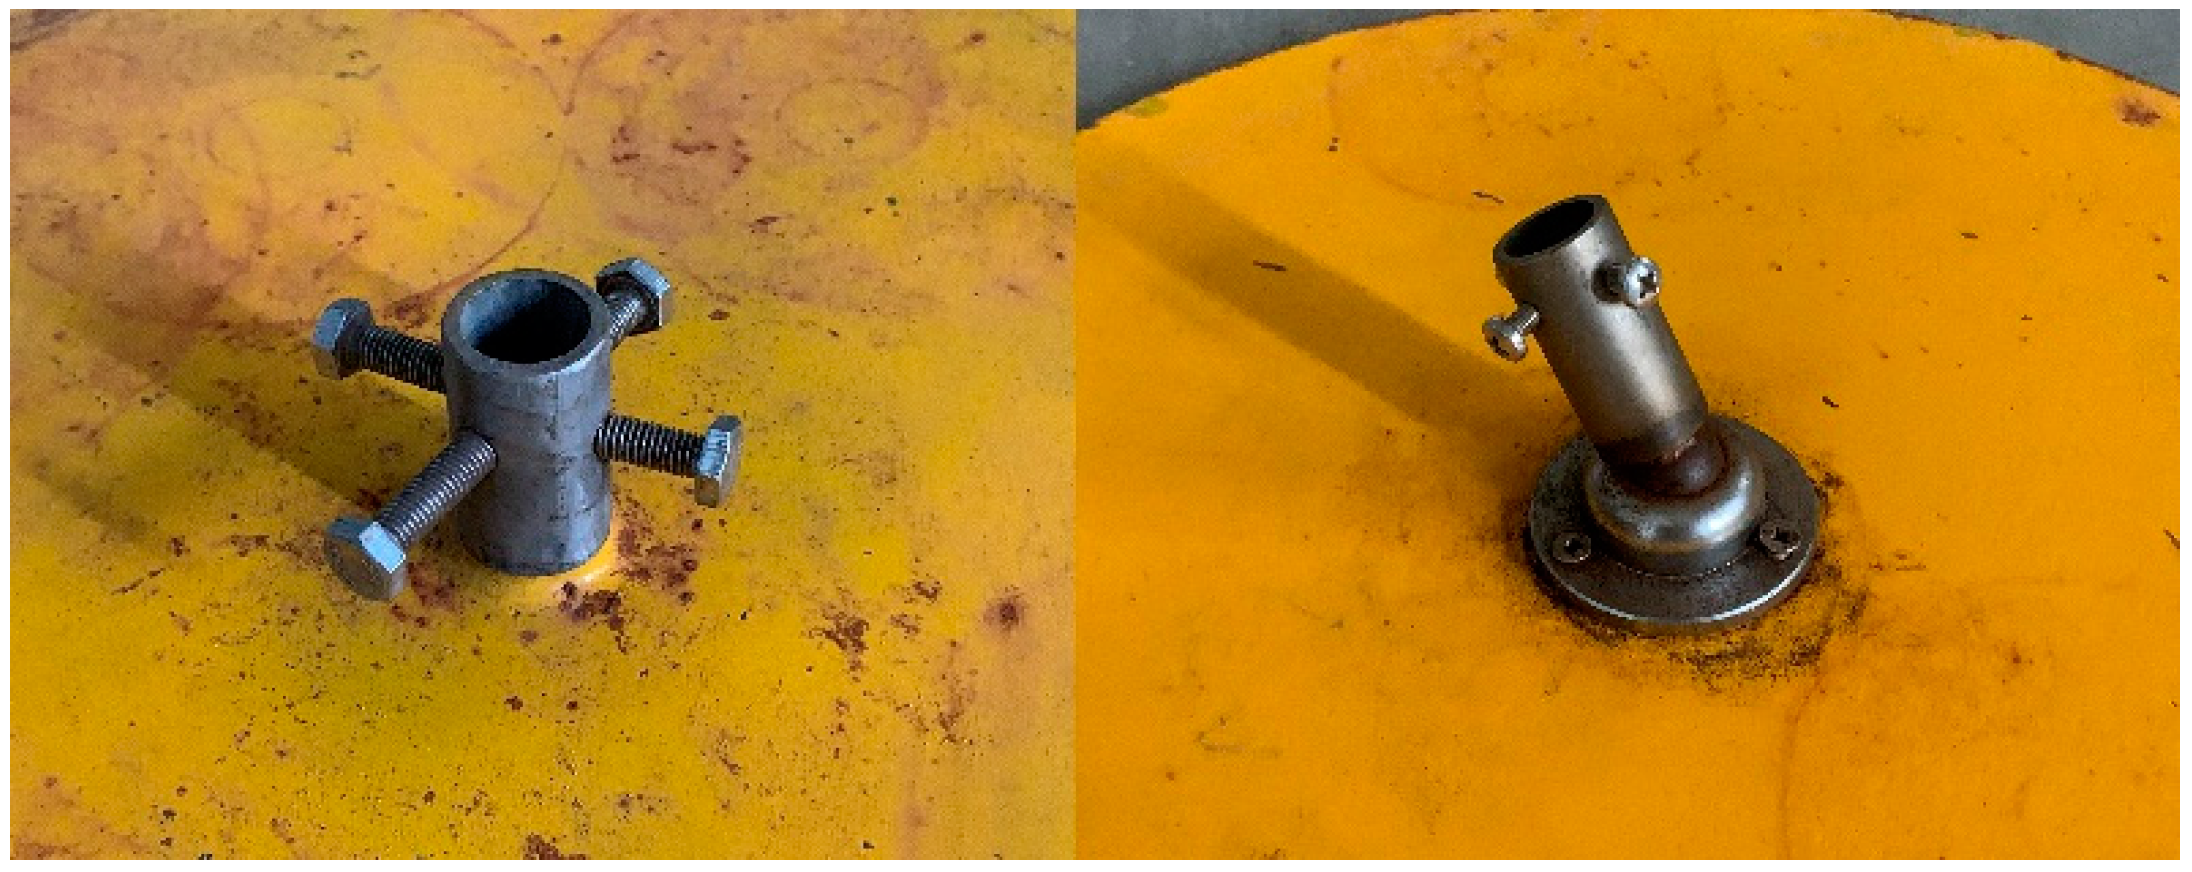
2.4. Boundary Condition Application System

The upper boundary of this experiment was a simple support which could also apply top tension. Figure 5 shows the diagram of the upper simple support with the bracket.
The top tension was applied by an HF digital tension meter (ALIYIOI, Wenzhou Yiding Instrument Manufacturing Co., Ltd., Wenzhou, China), and a three-claw clamp was used to connect the tension meter and the riser model, as shown in Figure 6. According to the requirements of the American Shipping Board (ABS) specification [19], it is recommended to take 1.0 and 2.25 times the effective mud-bearing weight as the tension force for the normal usage stage and the ultimate limit state. Based on the size of the riser model and the material properties, the calculated values of the maximum effective mud-bearing weights were about 10 N and 13.2 N, respectively, for the PMMA riser model and the aluminum riser model. Therefore, 10 N (1.0 × 10 N) and 30 N (2.25 × 13.2 N) were selected in this experiment to qualitatively simulate the tension force for the normal usage stage and ultimate limit state, respectively.
In order to study the influence of different boundary conditions on the dynamic vibration of the riser, two kinds of bases, i.e., fixed support and simple support, were designed to provide different boundary conditions (Figure 7 and Figure 8).

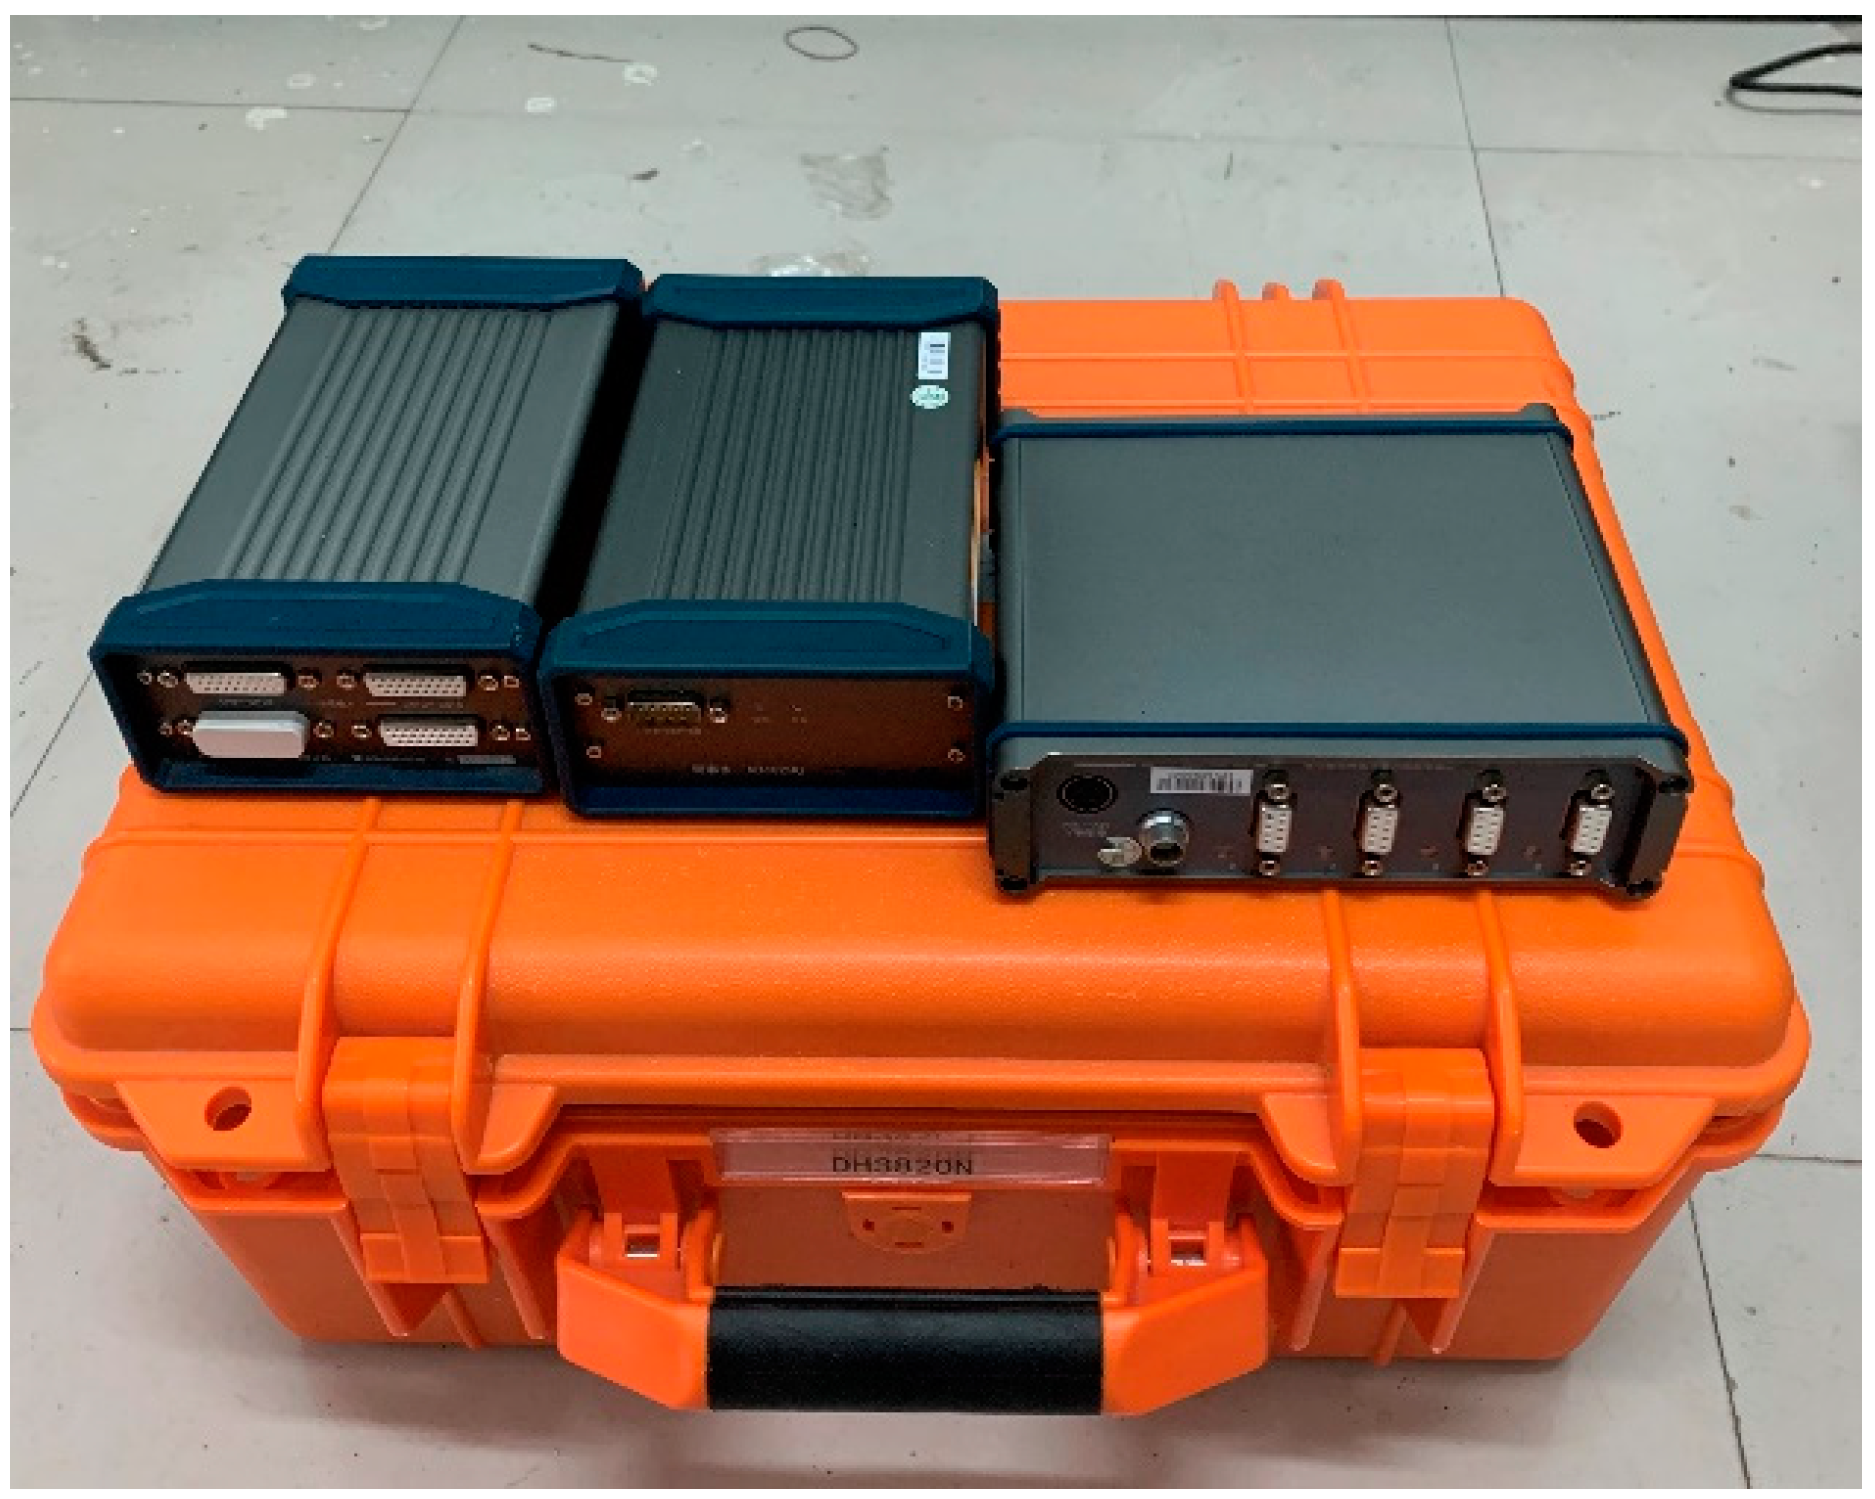
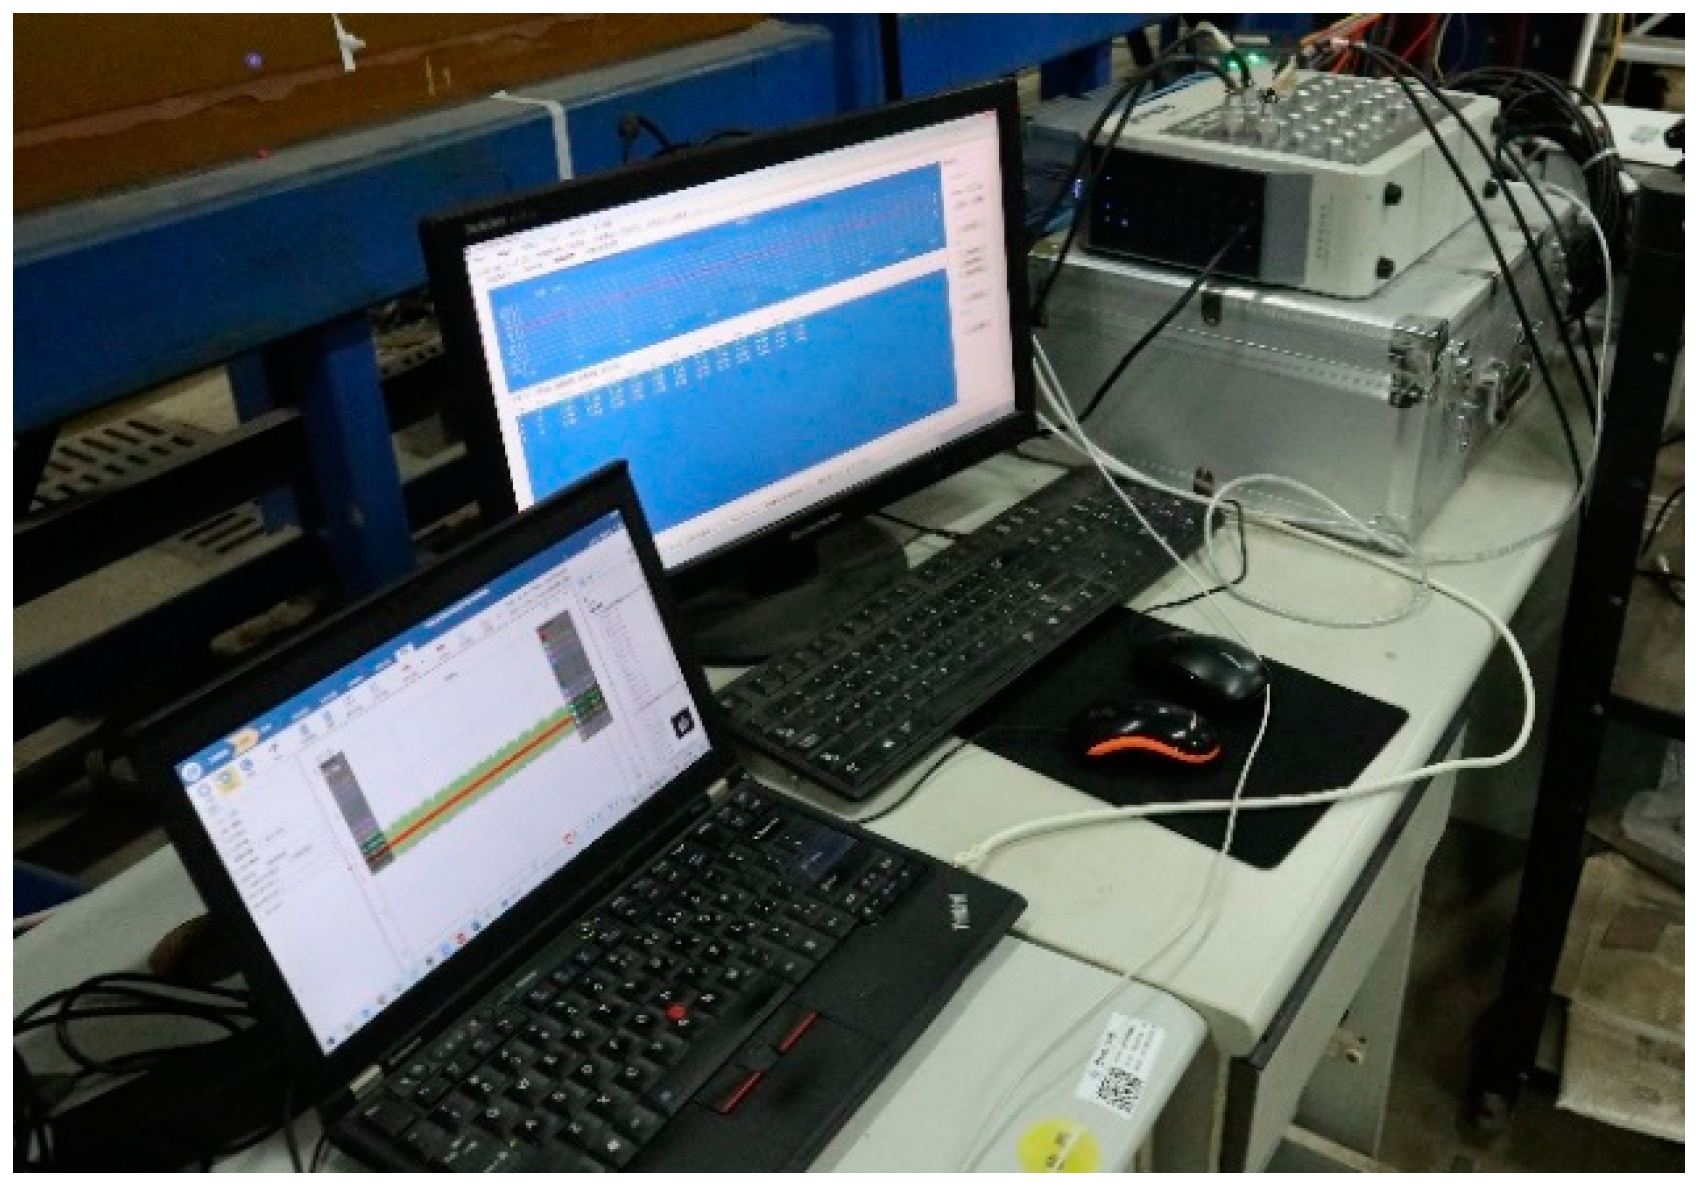
2.5. Data Collection System

The distributed testing and analysis system of stress and strain (DH3820 N, DongHua Testing Technology Co., Ltd., Taizhou, China) was used in this experiment for data collection, as shown in Figure 9. The overall connection between the system and the computer is shown in Figure 10. The strain gauge adopted was the BX120-3AA resistance strain gauge.

3. Experimental Method

Five experimental parameters (elastic modulus, boundary condition, top tension, flow velocity, and wave parameters) were used to study the dynamic response of the riser.
The elastic modulus depended on the material properties, i.e., aluminum (70 GPa) and PMMA (3.5 GPa).
The boundary conditions were simple-simple (S-S) support and simple-fixed (S-F) support, whose constraint numbers were 5 and 8, respectively.
Based on the calculation in Section 2.4, the top tension forces were 10 N and 30 N.
According to the study [20], it can be seen that the current velocity, wave height, and wave period under a 100-year hoop current were about 2 times, 0.2 times, and 0.5 times of those under a 100-year hurricane. Hence, in our qualitative experiment, 0.7 m/s and 0.3 m/s (2.3 times relationship) were used to qualitatively simulate the difference of current velocities for 100-year hoop current and 100-year hurricane conditions. Similarly, 5 cm (wave height) and 1 s (wave period) and 15 cm (wave height) and 2 s (wave period) were set to qualitatively simulate the difference of wave conditions for the 100-year hoop current and the 100-year hurricane. Here we have to note that this selection also considered the accurate performance of the wave–current system used in the test.
Based on the above experimental parameters, 32 groups of experimental conditions were sorted out. The specific parameter combinations are shown in Table 2. During the test, for the strain gauge under the water surface, a common temperature compensation strain gauge was used. The time-domain strain data for the vibration of the riser under these 32 groups of operating conditions were obtained through an electrical measurement method and analyzed to study the dynamic response of the riser.

4. Natural Vibration Frequency

In order to obtain the natural frequency of the risers in still water (0.6 m) with different tension forces, boundary conditions, and moduli, the time-domain strain signal was collected by tapping the riser at equal force and equal time intervals, and then the natural frequency of each riser model could be calculated using fast Fourier transform (FFT). The equation of Fourier transform using a discrete signal can be seen in Equation (1) [21].
X ( k ) = n = 0 N 1 x ( n ) e i 2 π k N n , k = 0 , 1 , 2 , , N 1
Using PMMA—(S-F)—10 N as an example, Figure 11a shows the time-domain strain signal for the riser model under tapping in still water, and Figure 11b illustrates the nature frequency of the riser through the FFT of the strain data. All the other natural frequencies of different tension forces, boundary conditions, and moduli are presented in Table 3.
It can be seen from Table 3 that under the same conditions, the natural vibration frequency of the aluminum riser is higher than that of the PMMA riser. Under the same boundary conditions, the natural vibration frequency of the riser model increased with the increase in the top tension. The natural vibration frequency of the riser with the S-S boundary condition was lower than that of the riser with the S-F boundary condition under the action of equal top tension. It is concluded that the elastic modulus of the riser material, the number of constraints of the boundary condition, and the top tension applied to the riser model are positively correlated with the natural vibration frequency of the riser.

5. Dynamic Vibration Response of Riser Model

In our experiment, the time history of strain for in-flow and cross-flow positions of the riser could be obtained. It is widely acknowledged that the strain of one location increases with the increase in the vibration amplitude of the same location. Therefore, in our paper, the strain data are used to represent the vibration amplitude of the riser.
In this section, με is used for the unit of strain, more specifically, the strain ε = ΔL/L and με = 10−6 × ε. “Ay” and “By” mean the axial direction of the riser model in the A and B positions (Figure 2), respectively.
Under steady flow, the reduced velocity (Ur) is an important piece of data for checking whether the VIV occurs, and in Table 4, the theoretical Ur (without the effect of the wave) are presented. Similarly, the theoretical St (Strouhal number), Re (Reynolds number), and fs (vortex shedding frequency) under steady flow velocity without the wave have been presented in Table 4 as well.
From the Ur in Table 4, under the steady flow velocity (without wave), the VIV might occur only when the velocity equals to 0.7 m/s with the S-S boundary condition (test case 11, 12, 15, 16 in Table 2).
However, during our experiment with the effect with the wave, some other cases also had the VIV phenomenon. Therefore, a group test (Table 5) with or without the wave was initially conducted to show the effect of waves as a benchmark. Based on the equation of Ur, with and without waves, the Ur will not change. But from Figure 12, it was found that the case with the wave had an obvious VIV phenomenon at the time point of the wave crest passing through. This indicates that the combination of flow and wave has a significant influence on the dynamic response of the riser.

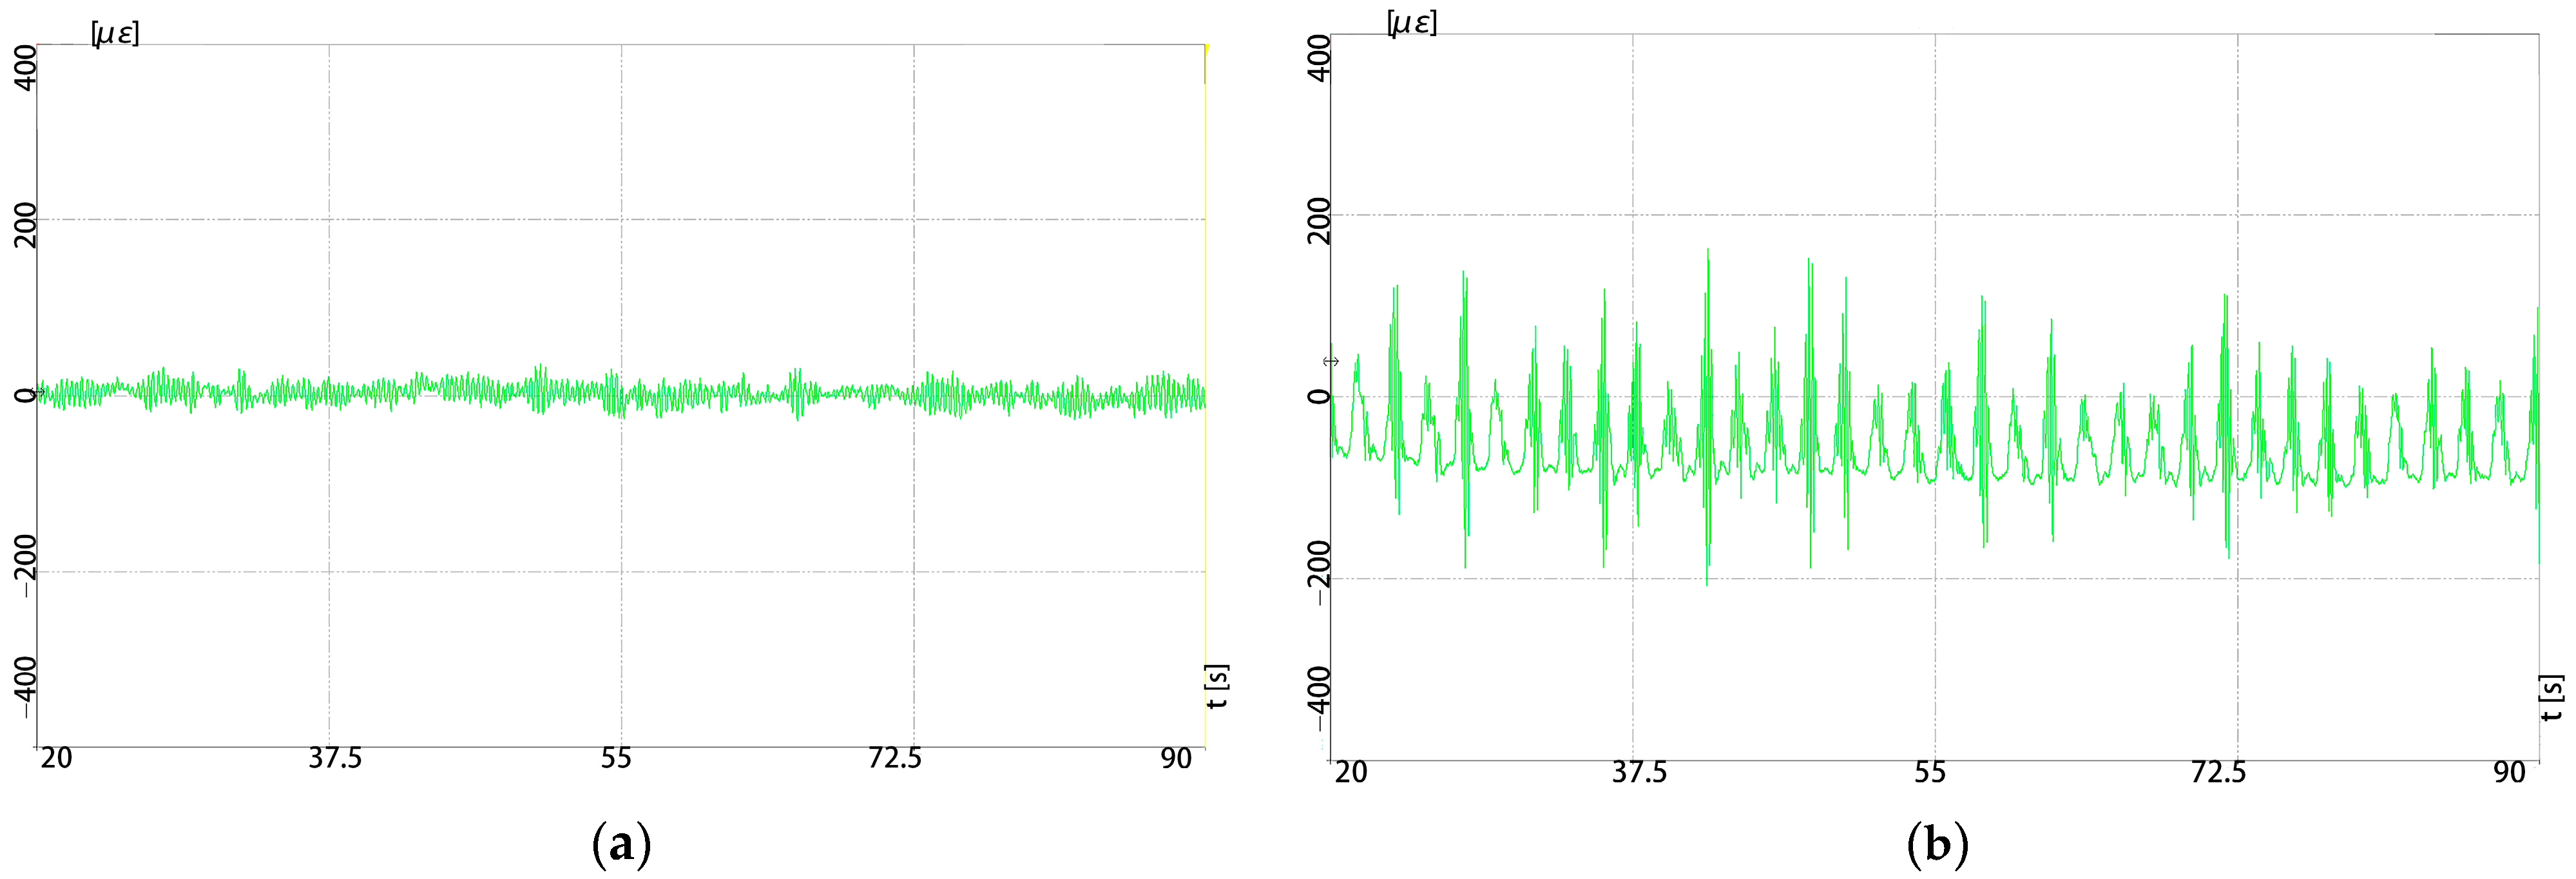
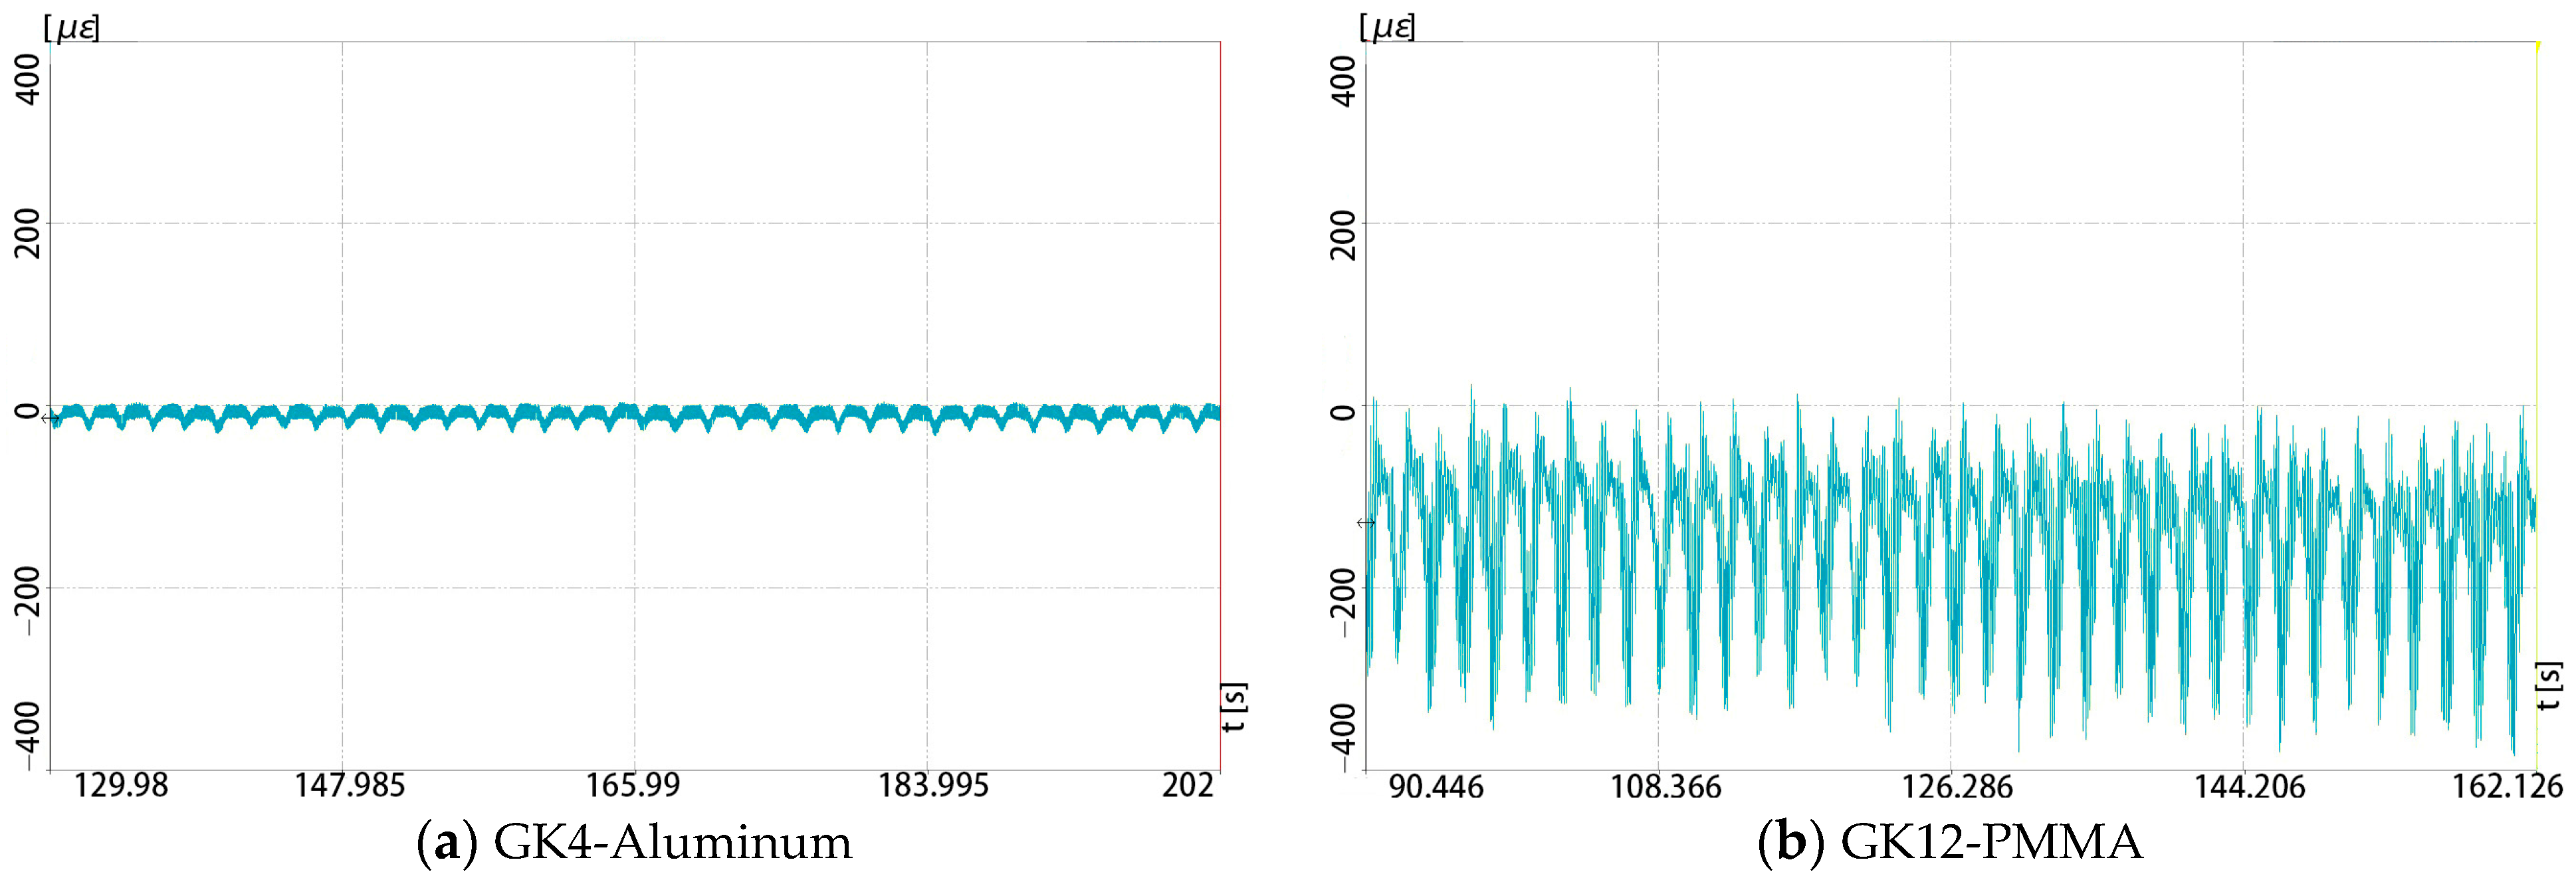
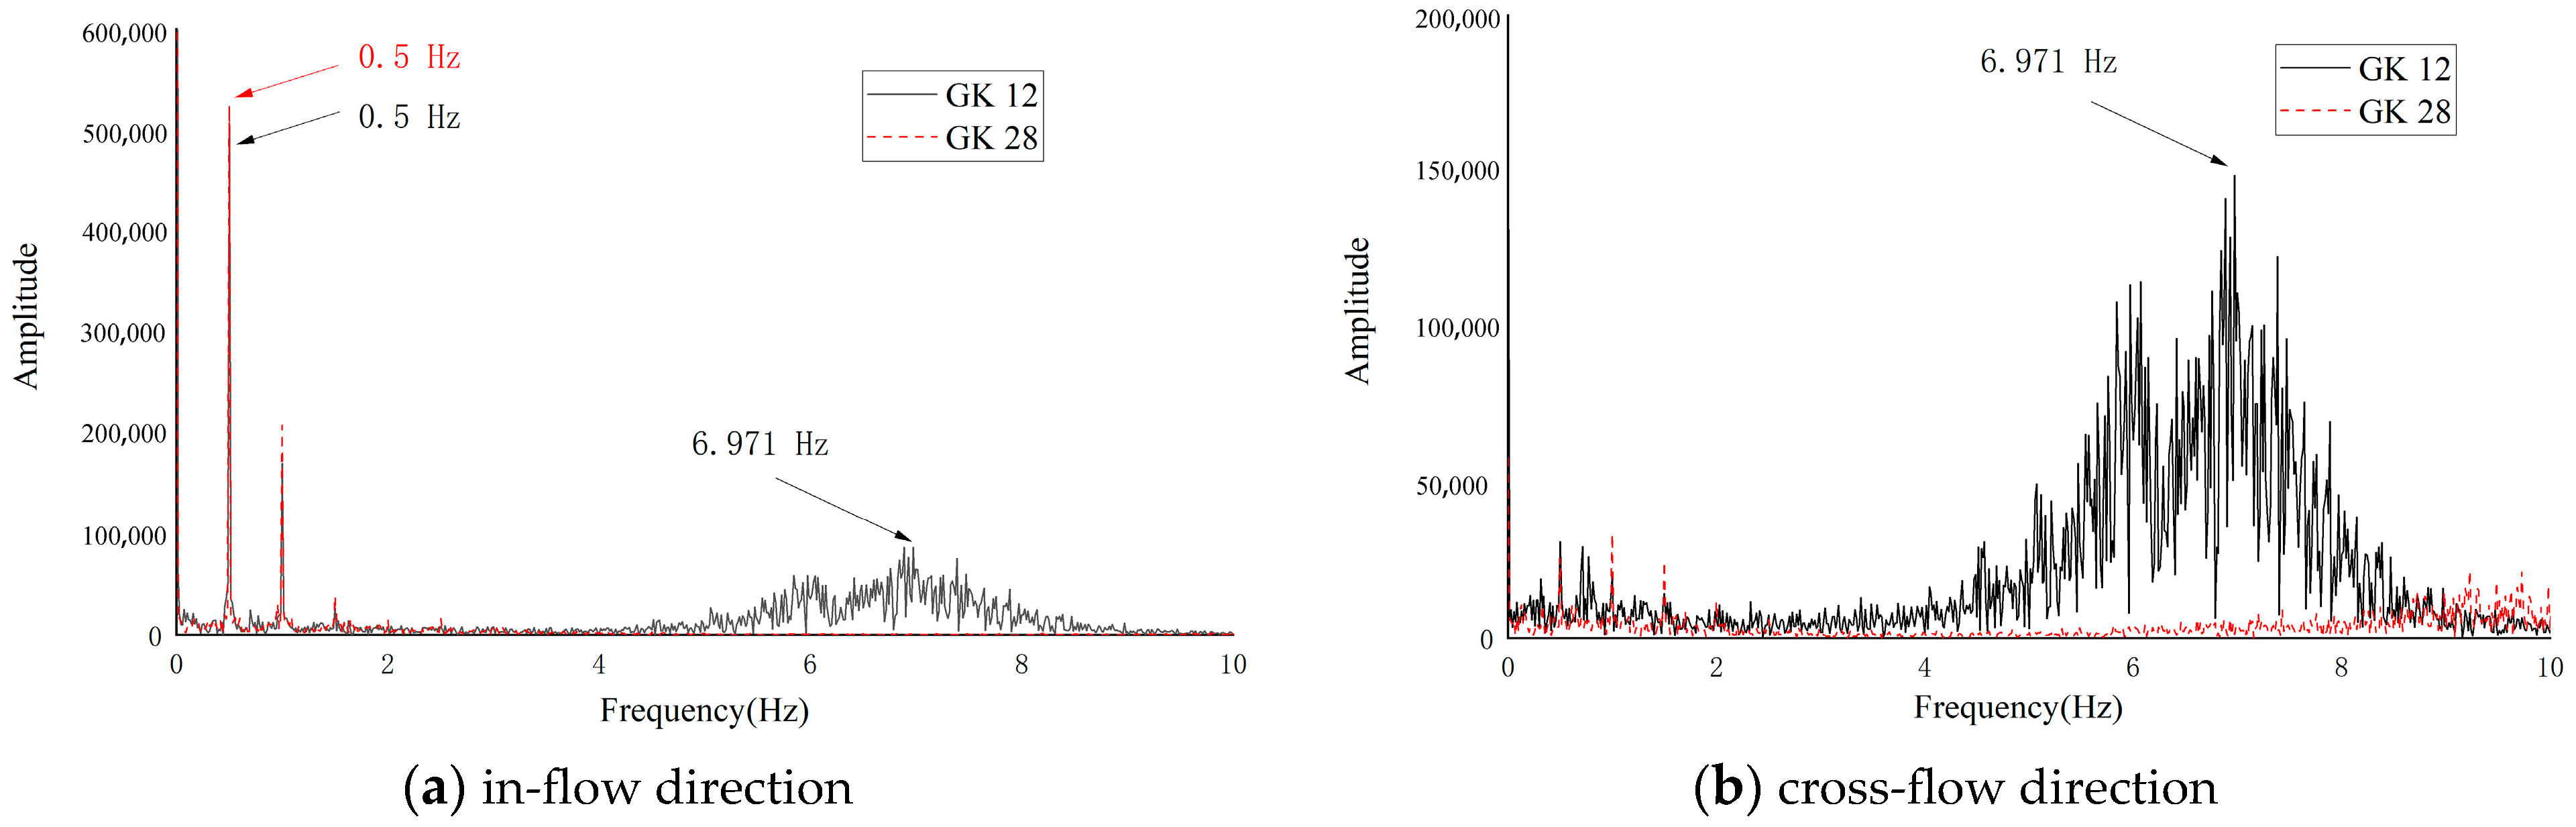
5.1. The Influence of the Elastic Modulus on the Vibration Amplitude and Involved Frequency of the Riser in the In-Flow and Cross-Flow Directions

The time-domain strain data of Ay (in-flow, z = 0.9 m, Figure 13) and By (cross-flow, z = 0.9 m, Figure 14) in test cases 4, 12 (different materials while the other parameters are the same, i.e., small top tension—10 N, large wave period—2 s, large flow velocity—0.7 m/s, large wave height—15 cm, and fewer constraints—S-S supports) were taken as the examples to illustrate the influence of different elastic moduli on the in-flow and cross-flow vibration of the riser.
It can be seen from Figure 13 that the in-flow vibration amplitudes of test cases 4 and 12 (GK 4 and GK 12) were about 36 με and 407 με, respectively; correspondingly, the cross-flow vibration amplitudes (Figure 14) were about 27 με and 553 με of GK 4 and GK 12, respectively.
From the results, we can find that when the other parameters are same, the vibration amplitude of the aluminum riser is smaller than that of the PMMA riser in both the in-flow and cross-flow directions. Therefore, it can be said that vibration is negatively correlated to the modulus of the riser.
In addition, it is also found from Figure 13 that the riser produced periodic vibrations in the in-flow direction, and this vibration period of the riser was close to the wave period (2 s).
The involved frequencies in the in-flow and cross-flow directions of the riser for GK4 and GK12 are presented in Figure 15.
From Figure 15a, it is obvious that the main involved frequencies in the in-flow direction for GK4 and GK12 are both 0.5 Hz, which is equal to the wave frequency, and for the GK12, the PMMA riser had significant in-flow vibration (see Figure 13b), with a second involved frequency of 6.971 Hz appearing. From Figure 15b, the involved frequency in the cross-flow direction for GK4 (aluminum riser) is still 0.5 Hz, while the involved frequency in the cross-flow direction for GK12 (PMMA riser) is 6.97 Hz.
Compared with the natural frequencies in water for the aluminum riser (19.302 Hz, Table 3) and the PMMA riser (6.612 Hz, Table 3), the involved frequency for GK12 (PMMA riser) was close to its natural frequency in water, indicating the occurrence of resonance. This is mutually authenticated by Figure 13b and Figure 14b.

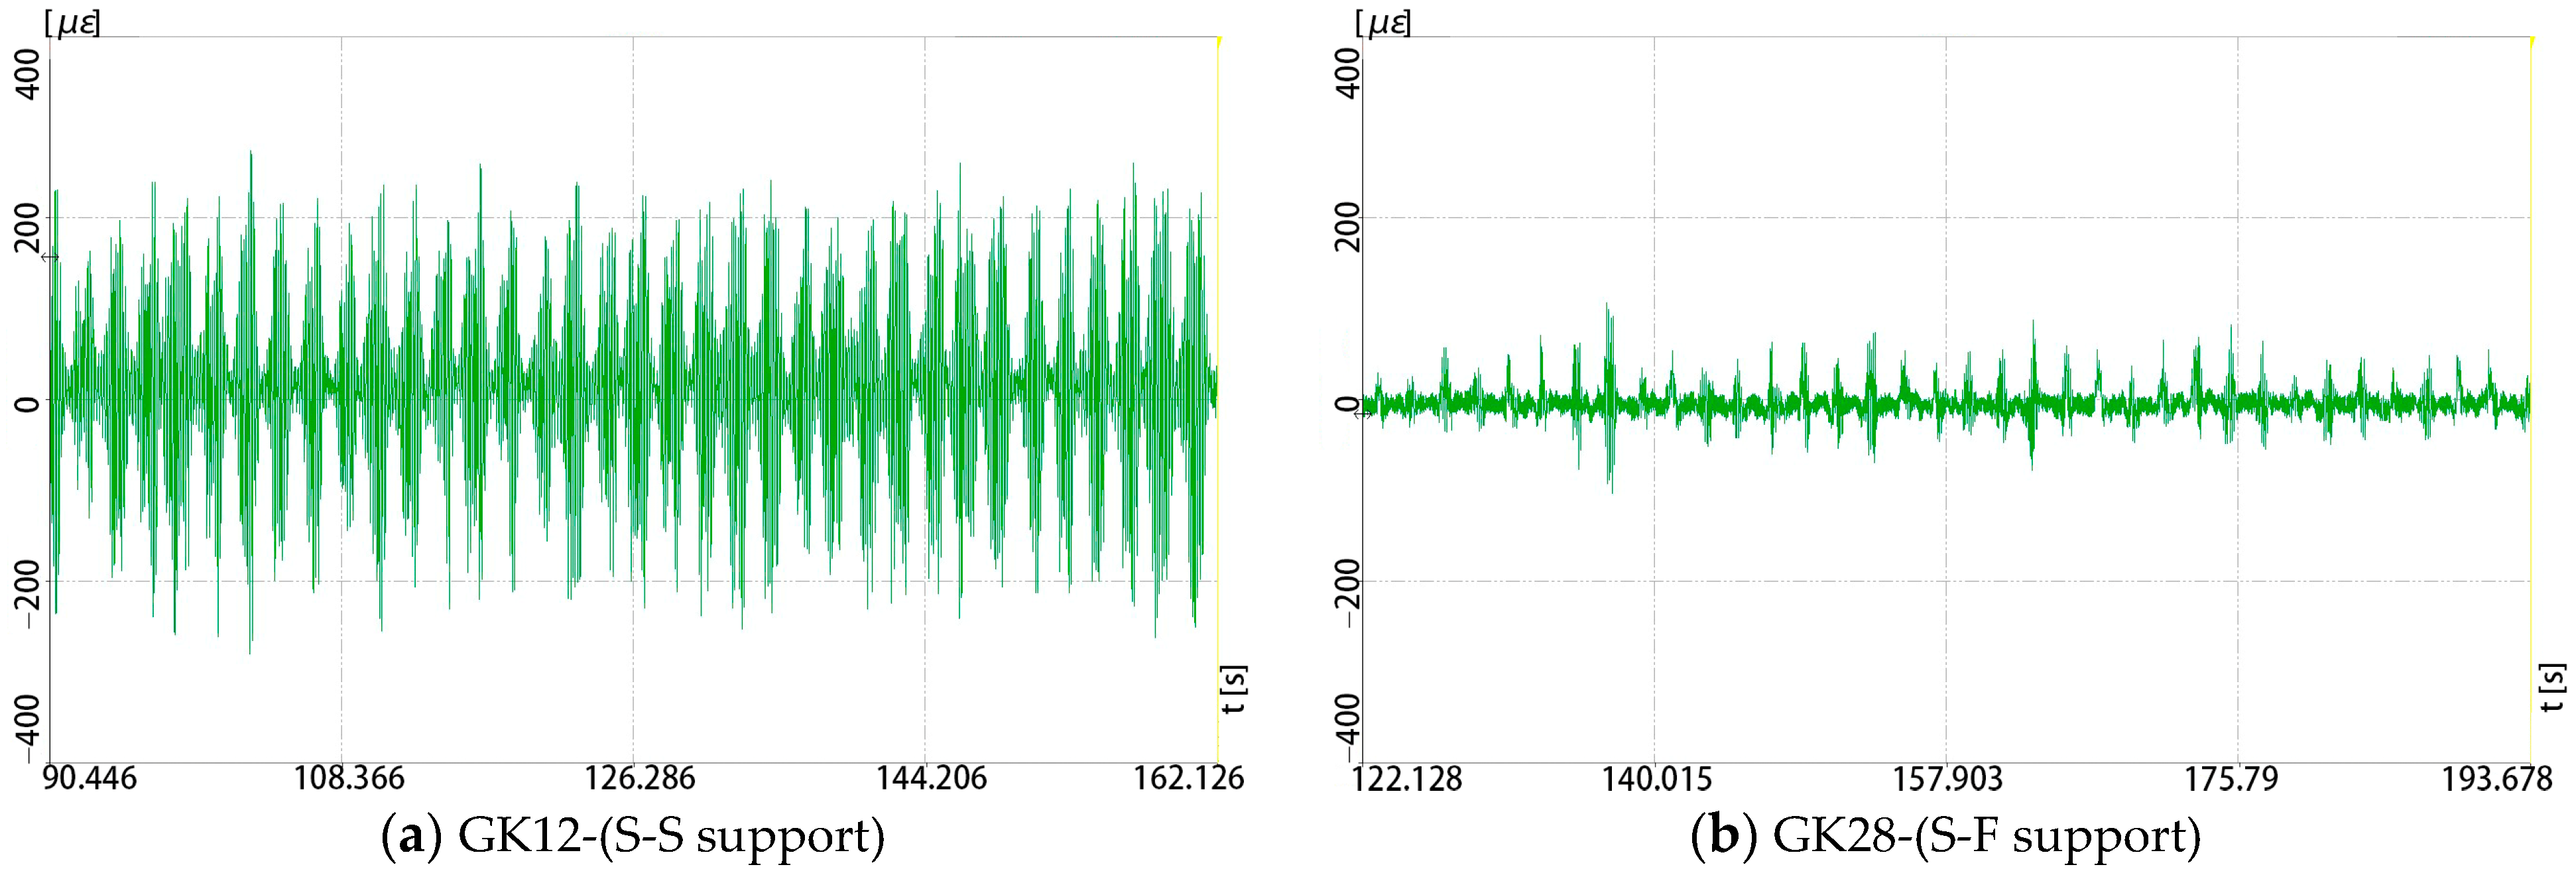
5.2. The Influence of the Boundary Conditions on the Vibration Amplitude and Involved Frequency of the Riser in the In-Flow and Cross-Flow Directions

The time-domain strain data of Ay (in-flow, z = 0.9 m, Figure 16) and By (cross-flow, z = 0.9 m, Figure 17) in test cases 12, 28 (different boundary conditions while the other parameters were the same, i.e., small top tension—10 N, large wave period—2 s, large flow velocity—0.7 m/s, large wave height—15 cm, and small modulus—3.5 GPa) were taken as examples to illustrate the influence of different boundary conditions on the in-flow and cross-flow vibration of the riser.
It can be seen from Figure 16 that the in-flow vibration amplitudes of test cases 12 and 28 (GK 12 and GK 28) are about 407 με and 205 με, respectively; correspondingly, the cross-flow vibration amplitudes (Figure 17) are about 553 με and 209 με of GK 12 and GK 28, respectively.
From the results we can find that when the other parameters are the same, the S-F support restricts the vibration of the riser in both directions more obviously compared to the S-S support. Therefore, it can be said that vibration is negatively correlated to the number of constraints. Especially in the cross-flow direction (Figure 17), the constraints number affects whether the VIV occurs at the same flow velocity.
The involved frequencies in the in-flow and cross-flow directions of the riser for GK12 and GK28 are presented in Figure 18.
From Figure 18a we can see that the main involved frequencies in the in-flow direction for GK12 and GK28 are both 0.5 Hz (wave frequency), although the PMMA riser with S-S support (GK12) has a secondary involved frequency of 6.97 Hz; on the contrary, the wave’s effect on the involved frequency in the cross-flow direction has decreased, especially for the riser with S-S support (Figure 18b).

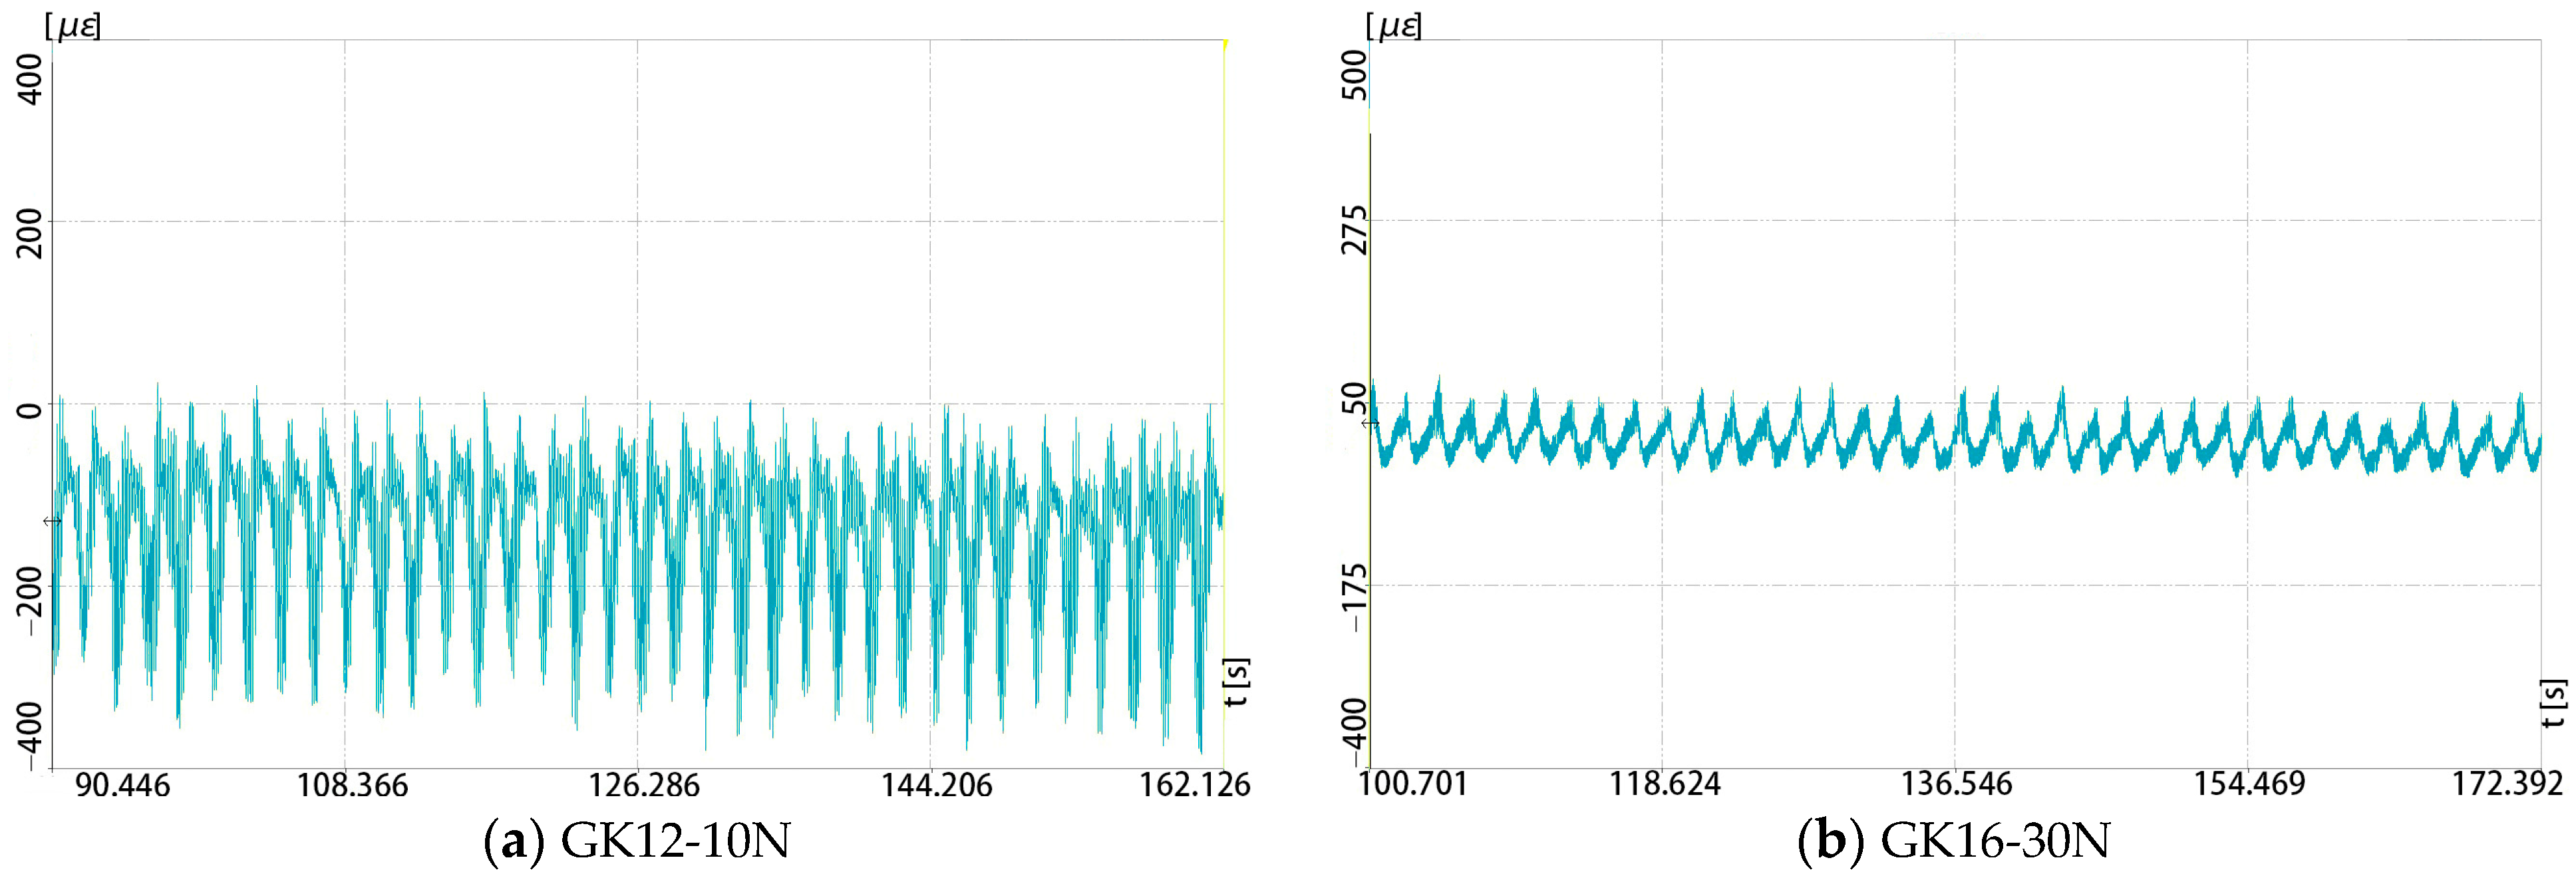
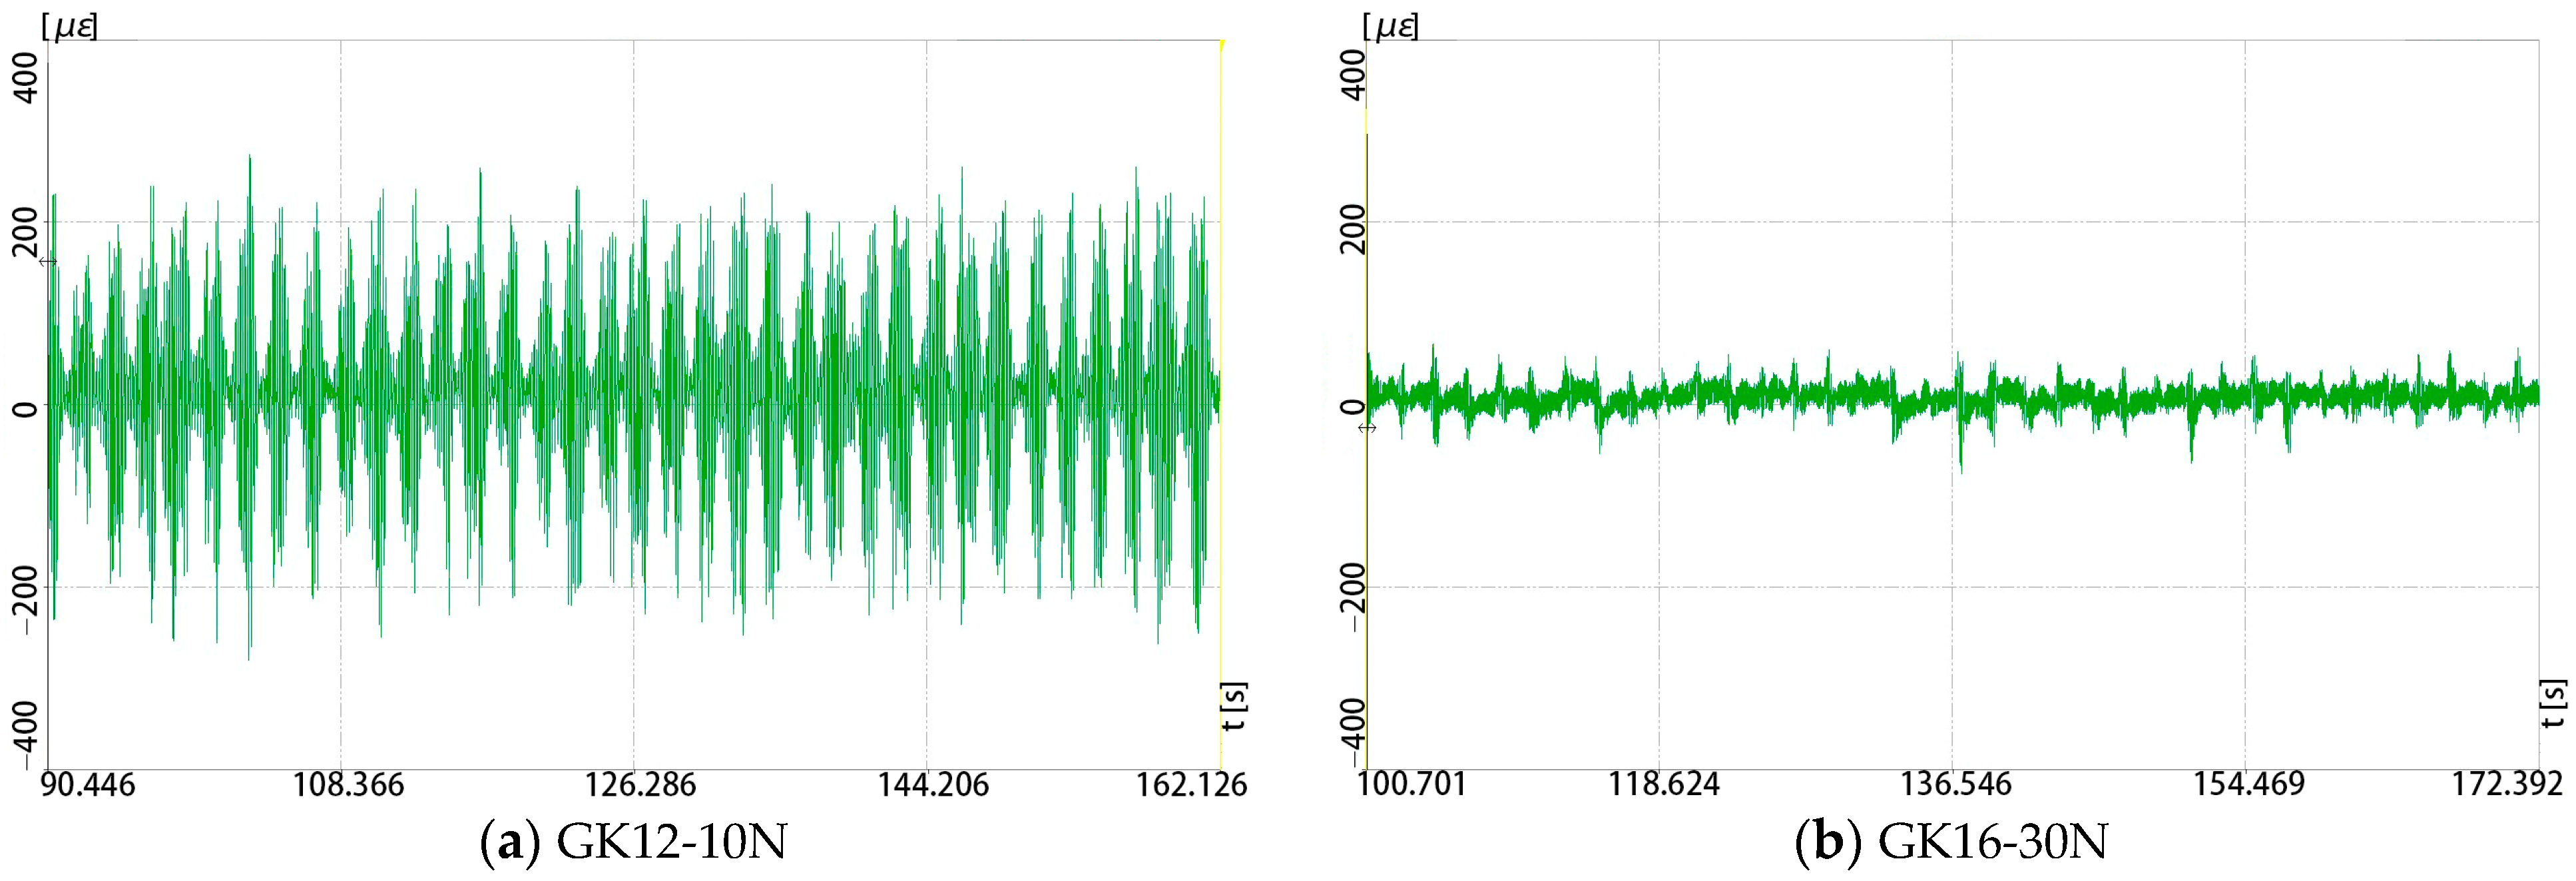
5.3. The Influence of Top Tensions on the Vibration Amplitude and Involved Frequency of the Riser in the In-Flow and Cross-Flow Directions

The time-domain strain data of Ay (in-flow, z = 0.9 m, Figure 19) and By (cross-flow, z = 0.9 m, Figure 20) in test cases 12, 16 (different top tensions while the other parameters are the same, i.e., large wave period—2 s, large flow velocity—0.7 m/s, large wave height—15 cm, small modulus—3.5 GPa, and fewer constraints—S-S supports) were taken as examples to illustrate the influence of different top tensions on the in-flow and cross-flow vibration of the riser.
It can be seen from Figure 19 that the in-flow vibration amplitudes of test cases 12 and 16 (GK 12 and GK 16) are about 407 με and 126 με, respectively; correspondingly, the cross-flow vibration amplitudes (Figure 20) are about 553 με and 141 με of GK 12 and GK 16, respectively.
From the results we can find that when the other parameters are same, the increase in the top tension obviously limits the vibration of the riser in both directions, especially in the cross-flow direction (Figure 20); the value of the top tension force affects whether the VIV occurs at the same flow velocity.
The involved frequencies in the in-flow and cross-flow directions of the riser for GK12 and GK16 are presented in Figure 21.
Similar as the previous sections, the main involved frequencies in the in-flow direction for GK12 and GK16 are the wave frequency 0.5 Hz, although when the tension force reduced, a secondary involved frequency of 6.97 Hz occurred (Figure 21a). In the cross-flow direction, when the tension force increased, the involved frequency increased to 10.53 Hz (Figure 21b—GK16).
Compared to the involved frequency of GK12, the involved frequency of GK16 has a comparatively larger gap between the natural frequencies in water for the PMMA riser (6.612 Hz, Table 3), indicating the unlikely occurrence of resonance. This can be mutually authenticated by Figure 20b.

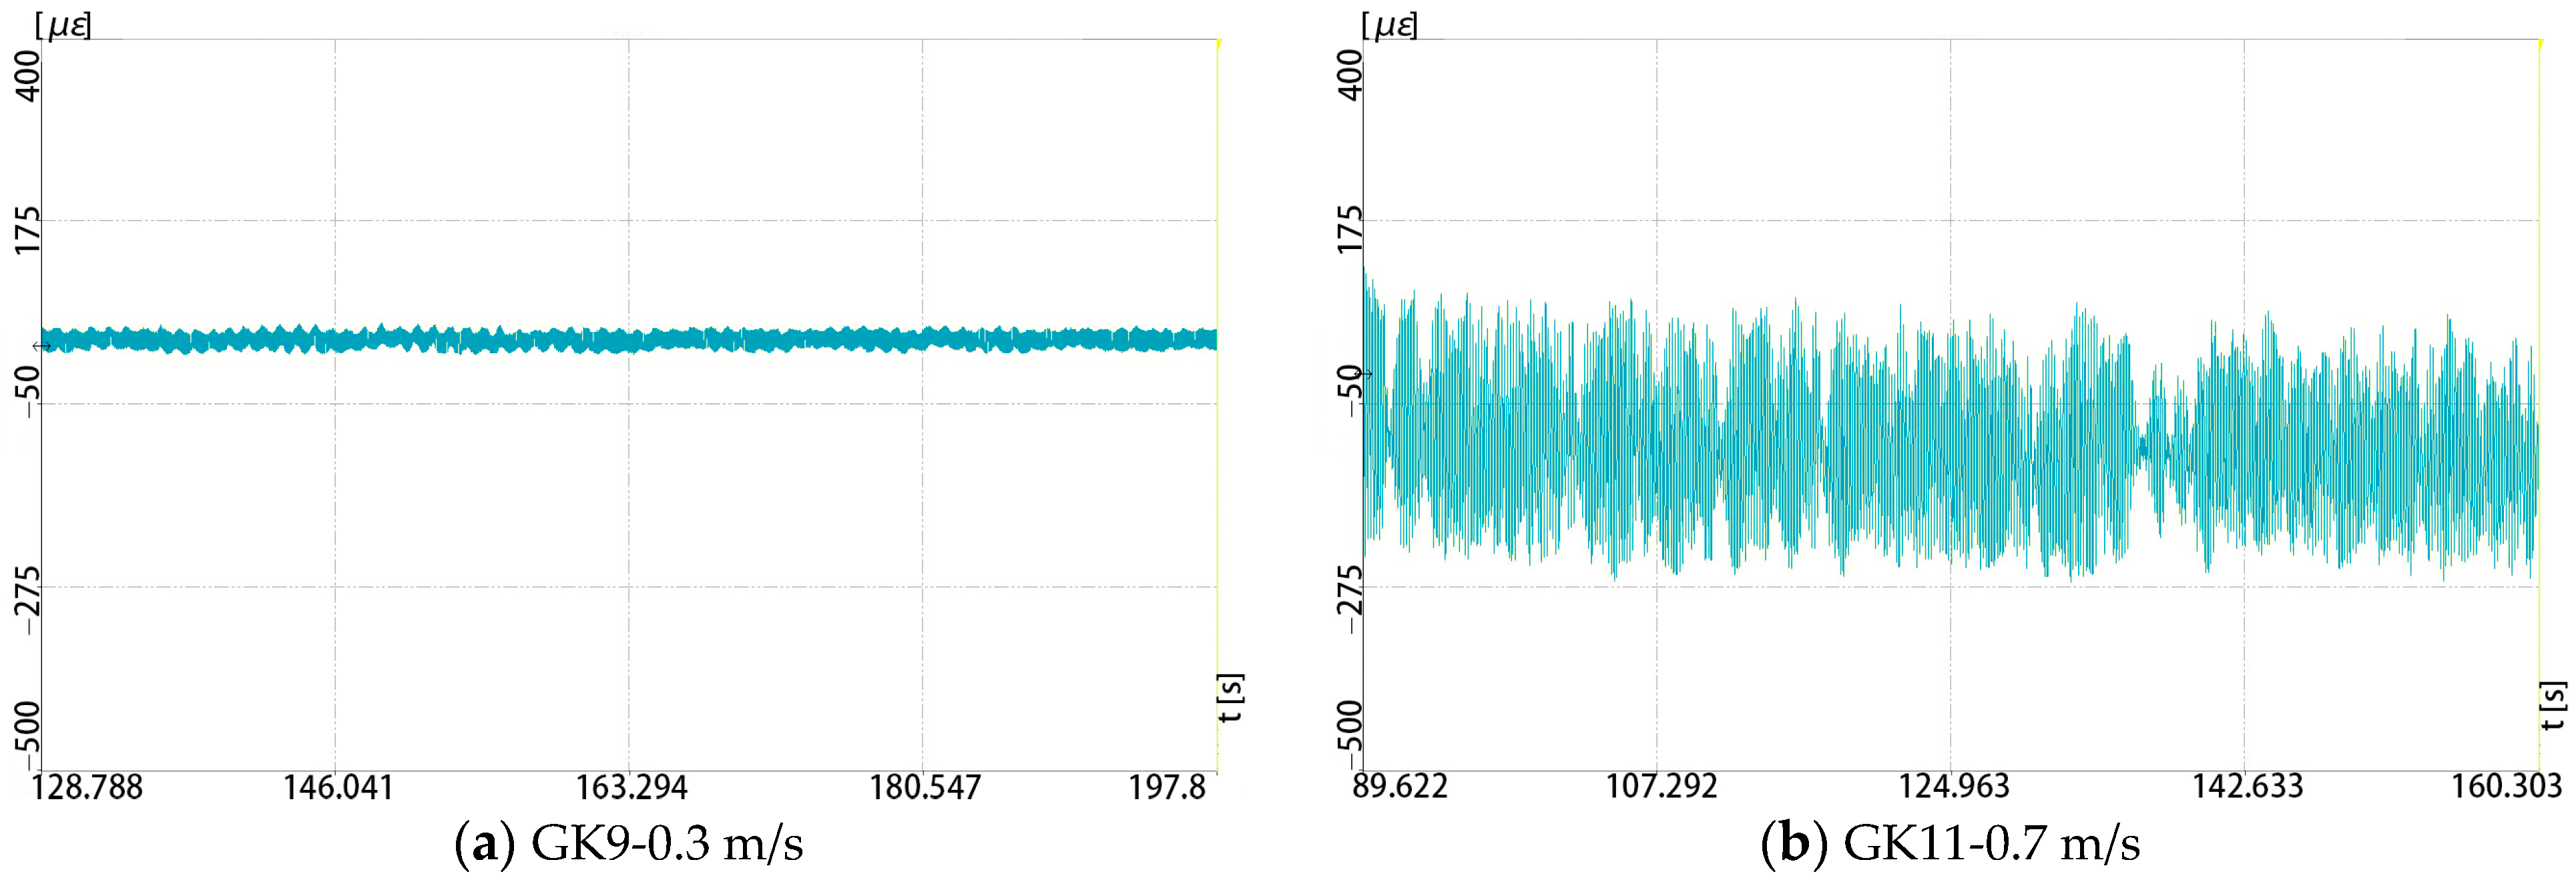
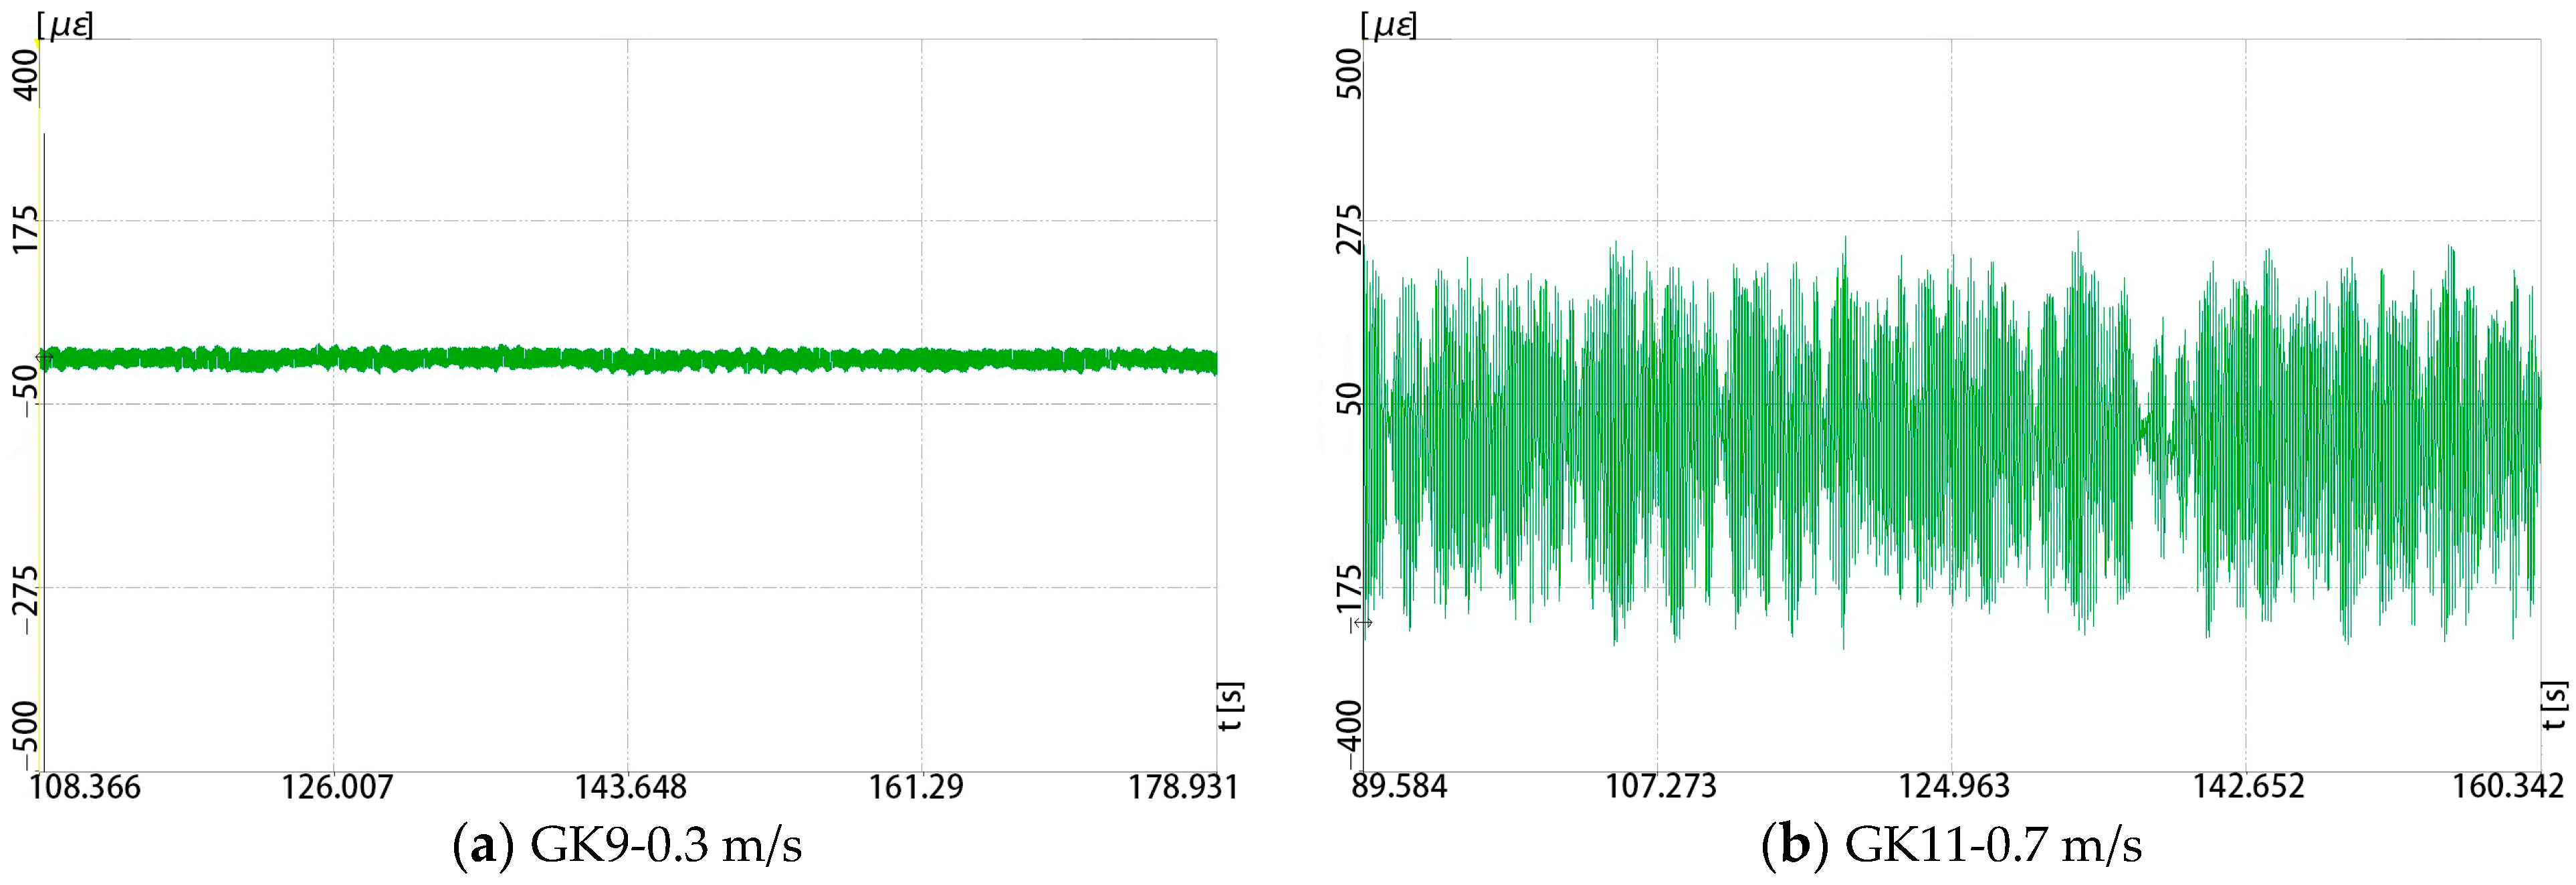
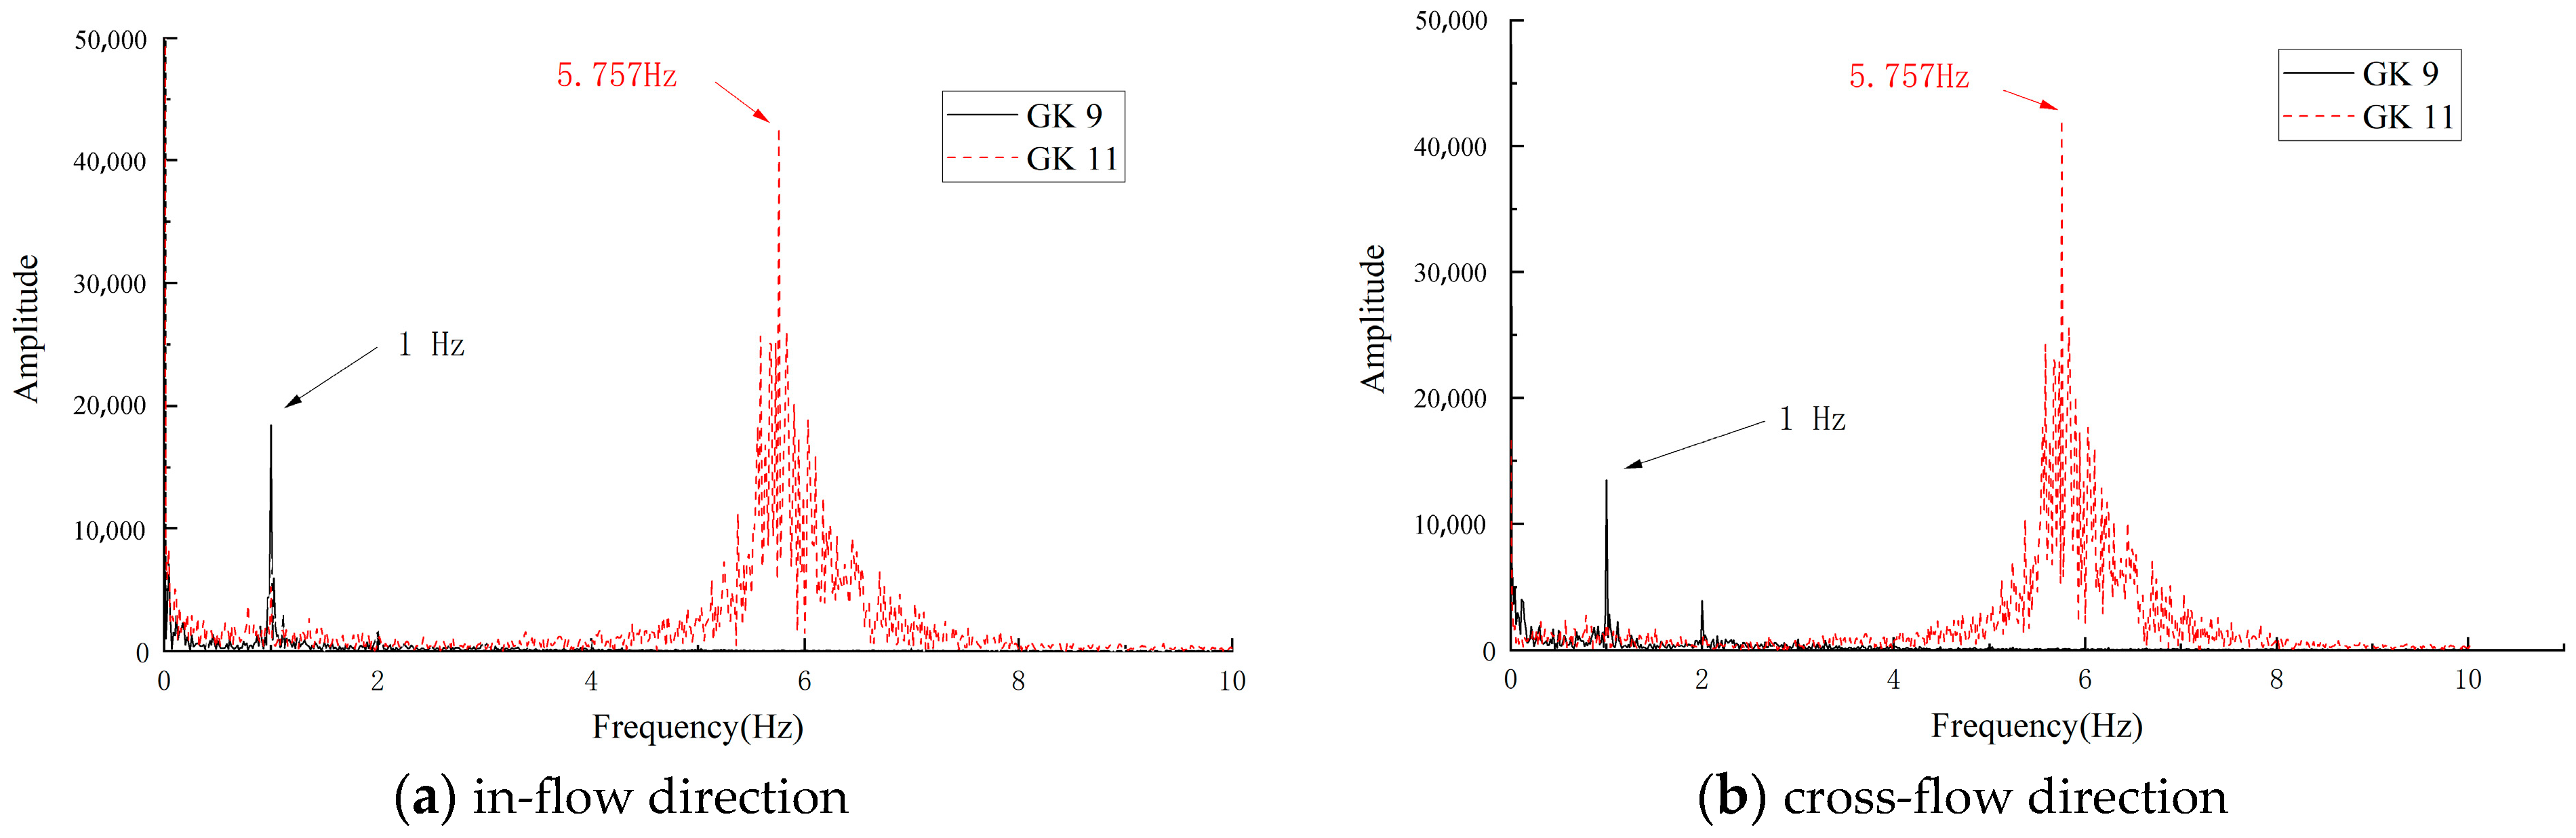
5.4. The Influence of Flow Velocities on the Vibration Amplitude and Involved Frequency of the Riser in the In-Flow and Cross-Flow Directions

The time-domain strain data of Ay (in-flow, z = 0.9 m, Figure 22) and By (cross-flow, z = 0.9 m, Figure 23) in test cases 9, 11 (different flow velocities while the other parameters are the same, i.e., small wave period—1 s, small top tension—10 N, small wave height—5 cm, fewer constraints—S-S supports, and small modulus—3.5 GPa) were taken as examples to illustrate the influence of different flow velocities on the in-flow and cross-flow vibration of the riser.
It can be seen from Figure 22 that the in-flow vibration amplitudes of test cases 9 and 11 (GK 9 and GK 11) are about 40 με and 387 με, respectively; correspondingly, the cross-flow vibration amplitudes (Figure 23) are about 40 με and 513 με of GK 9 and GK 11, respectively.
From the results, we can find that when the other parameters are same, the amplitude of vibration in both directions increases with the increase in flow velocity.
The involved frequencies in the in-flow and cross-flow directions of the riser for GK9 and GK11 are presented in Figure 24.
From Figure 24a,b, it is clear that under a small flow velocity (GK9), the involved frequencies of the PMMA riser in both the in-flow and cross-flow direction are 1.0 Hz, which is equal to the wave frequency.
When the flow velocity increases to 0.7 m/s, the effect of the small wave on the involved frequency of the riser becomes indistinct; more specifically, the involved frequencies in both directions are 5.76 Hz, close to the natural frequency in water of the riser (6.612 Hz, Table 3), indicating the occurrence of resonance. This is mutually authenticated by Figure 22b and Figure 23b.

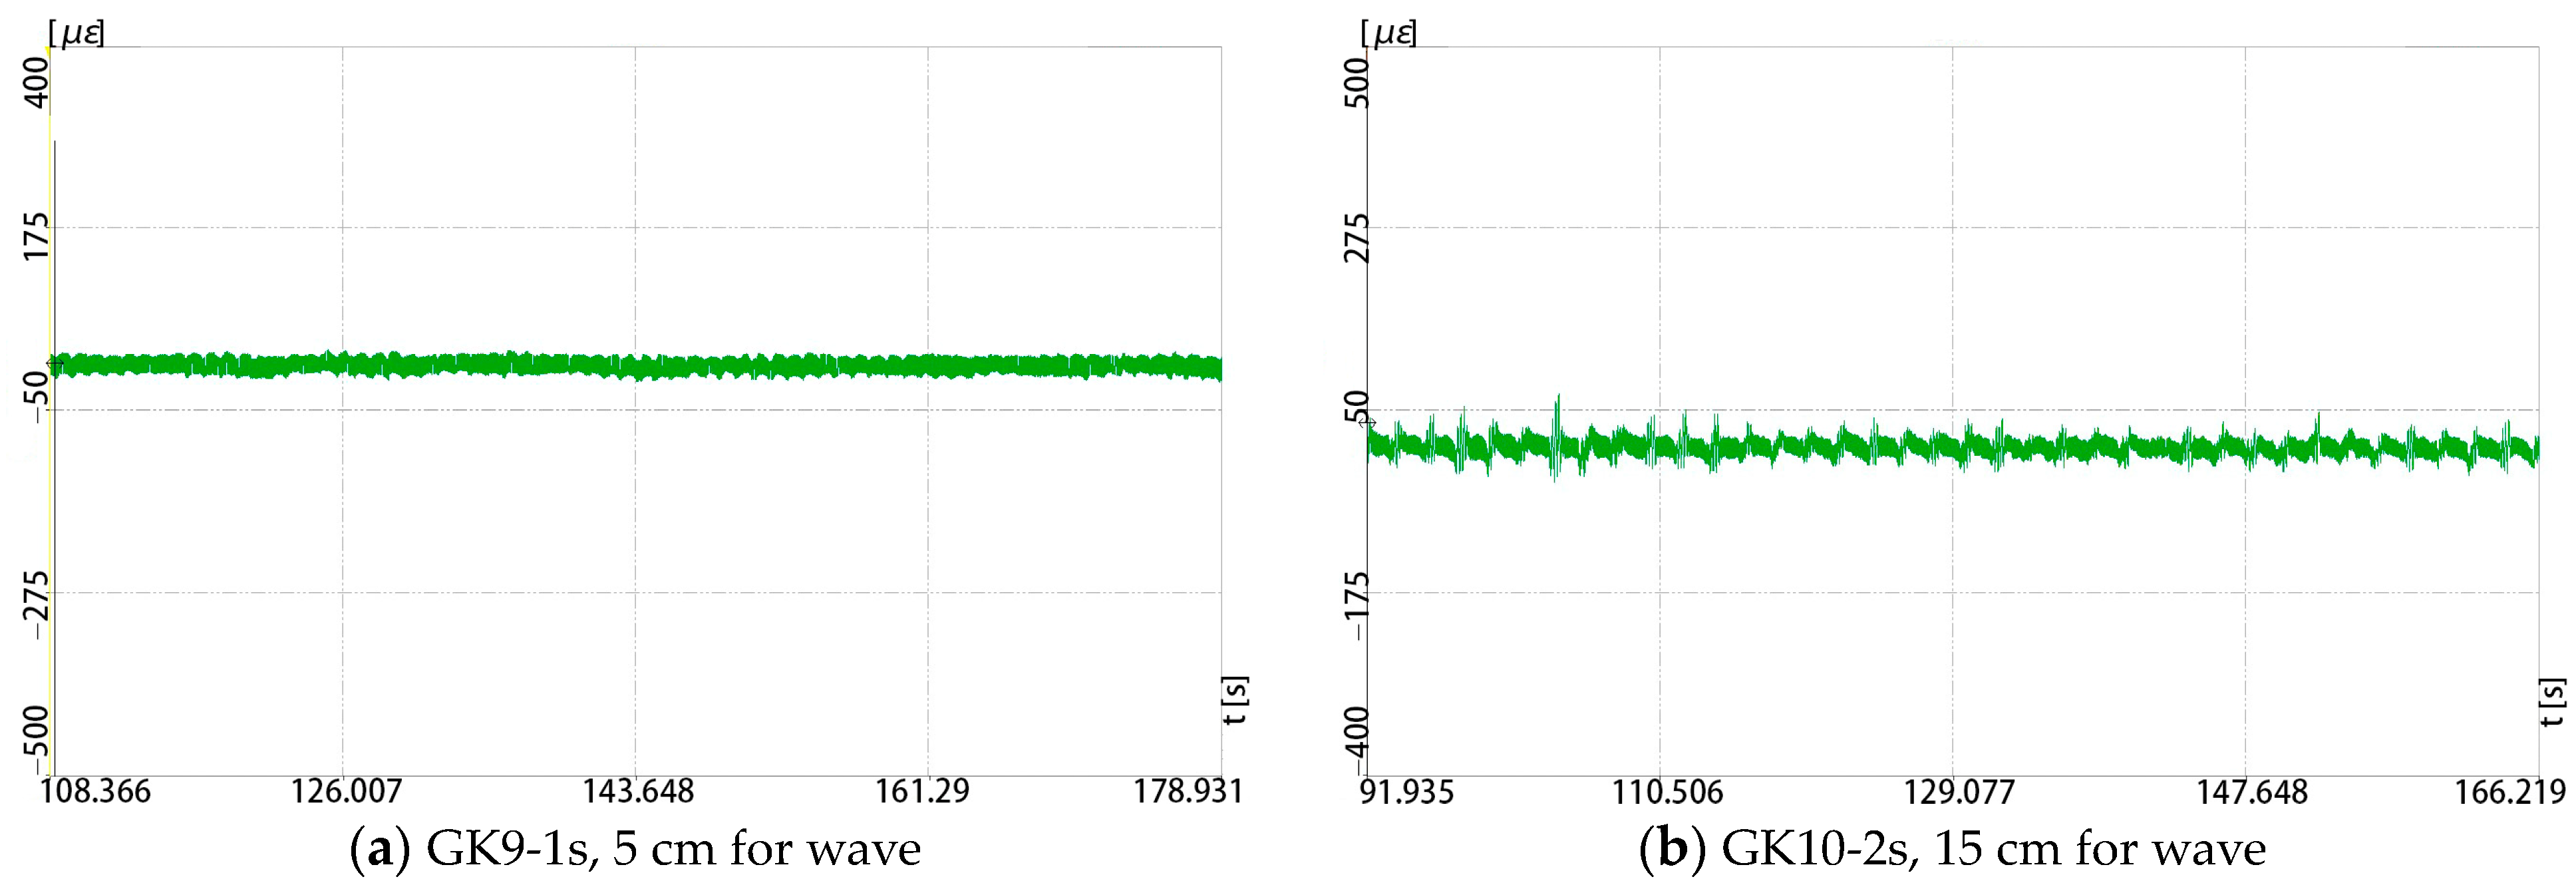
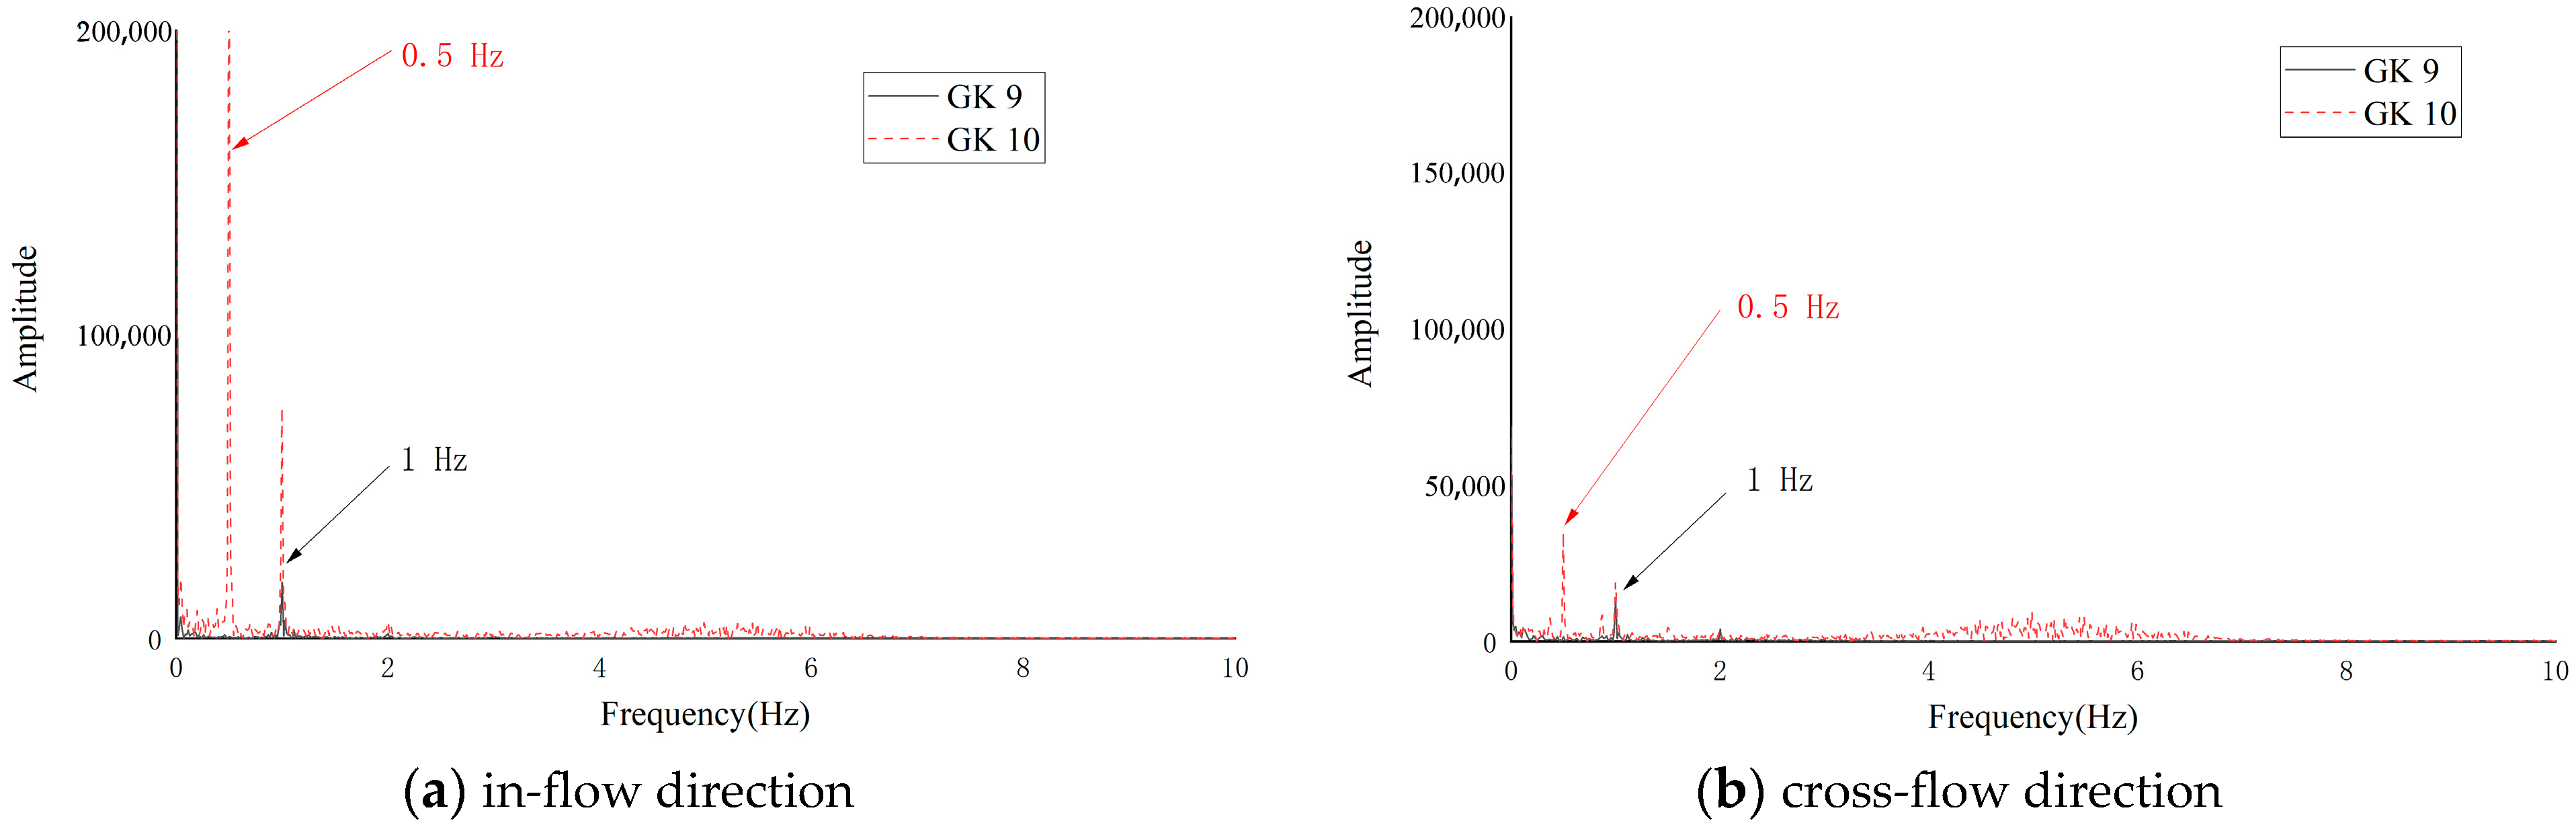
5.5. The Influence of Wave Parameters on the Vibration Amplitude and Involved Frequency of the Riser in the In-Flow and Cross-Flow Directions

The time-domain strain data of Ay (in-flow, z = 0.9 m, Figure 25) and By (cross-flow, z = 0.9 m, Figure 26) in test cases 9, 10 (different wave parameters while the other parameters are the same, i.e., small top tension—10 N, small flow velocity—0.3 m/s, fewer constraints—S-S supports, and small modulus—3.5 GPa) were taken as examples to illustrate the influence of different wave parameters on the in-flow and cross-flow vibration of the riser.
It can be seen from Figure 25 that the in-flow vibration amplitudes of test cases 9 and 10 (GK 9 and GK 10) are about 40 με and 134 με, respectively; correspondingly, the cross-flow vibration amplitudes (Figure 26) are about 40 με and 109 με of GK 9 and GK 10, respectively.
From the results we can find that when the other parameters are same, the amplitude of vibration in both directions increases with the increase in the intensity of the wave. In addition, it is also found from Figure 25b that the riser produced periodic vibrations in the in-flow direction, and this vibration period of the riser is close to the wave period (2 s).
The involved frequencies in the in-flow and cross-flow directions of the riser for GK9 and GK10 are presented in Figure 27.
From Figure 27, we can see that under a small flow velocity, the involved frequencies of the riser are equal to the frequencies of waves, and it is also found that under a small velocity, the wave itself would not lead to obvious vibration of the riser (see Figure 25 and Figure 26). Here we also have to note that the big wave (2 s, 15 cm) combined with the flow might lead to a secondary involved frequency (Figure 27b—GK10).

6. Importance Calculation and Analysis

In order to explore the sequence of importance for the dynamic vibration of the riser in the in-flow and cross-flow directions, multiple linear regression calculation using the least square method was conducted.
Multiple linear regression [22], as a scientific statistical method, is a widely used method to analyze the influence of interfering factors on the target result. The least square method [23], proposed by Legendre in the 19th century, was selected in this experiment to solve the multiple linear regression calculation.
More specifically, Equations (2)–(4) were utilized to determine the sequence of importance of the six parameters, which are boundary condition, top tension, outflow velocity, wave period, wave height, and elastic modulus of the material.
Y = Y 1 , Y 2 , , Y 32 X 1 = X 1 1 , X 1 2 , , X 1 32 X 2 = X 2 1 , X 2 2 , , X 2 32 X 3 = X 3 1 , X 3 2 , , X 3 32 X 4 = X 4 1 , X 4 2 , , X 4 32 X 5 = X 5 1 , X 5 2 , , X 5 32 X 6 = X 6 1 , X 6 2 , , X 6 32
where Y is target result (the in-flow vibration or cross-flow vibration); X 1 is the number of constraints; X 2 is the top tension force; X 3 is the flow velocity; X 4 is wave period; X 5 is wave height; and X 6 is the modulus of material. Here, note that for the constraints number X 1 , five are for S-S support (Ux, Uy, Uz at the bottom and Ux, Uy at the top of the riser) and eight are for S-F (Ux, Uy, Uz, θx, θy, θz at the bottom and Ux, Uy at the top of the riser).
The detailed values for Y (vibration in the in-flow direction) to X 6 are presented below:
Y = 15.0 ; 25.7 ; 19.6 ; 35.9 ; 21.0 ; 24.4 ; 22.2 ; 33.6 ; 41.8 ; 135.5 ; 371.2 ; 404.0 ; 38.1 ; 50.3 ; 305.1 ; 126.1 ; 30.1 ; 31.8 ; 31.1 ; 45.7 ; 26.4 ; 30.6 ; 27.7 ; 44.2 ; 29.5 ; 129.7 ; 130.4 ; 243.8 ; 36.7 ; 121.0 ; 136.6 ; 161.2 X 1 = 5 ; 5 ; 5 ; 5 ; 5 ; 5 ; 5 ; 5 ; 5 ; 5 ; 5 ; 5 ; 5 ; 5 ; 5 ; 5 ; 8 ; 8 ; 8 ; 8 ; 8 ; 8 ; 8 ; 8 ; 8 ; 8 ; 8 ; 8 ; 8 ; 8 ; 8 ; 8 X 2 = 10 ; 10 ; 10 ; 10 ; 30 ; 30 ; 30 ; 30 ; 10 ; 10 ; 10 ; 10 ; 30 ; 30 ; 30 ; 30 ; 10 ; 10 ; 10 ; 10 ; 30 ; 30 ; 30 ; 30 ; 10 ; 10 ; 10 ; 10 ; 30 ; 30 ; 30 ; 30 X 3 = 0.3 ; 0.3 ; 0.7 ; 0.7 ; 0.3 ; 0.3 ; 0.7 ; 0.7 ; 0.3 ; 0.3 ; 0.7 ; 0.7 ; 0.3 ; 0.3 ; 0.7 ; 0.7 ; 0.3 ; 0.3 ; 0.7 ; 0.7 ; 0.3 ; 0.3 ; 0.7 ; 0.7 ; 0.3 ; 0.3 ; 0.7 ; 0.7 ; 0.3 ; 0.3 ; 0.7 ; 0.7 X 4 = 1 ; 2 ; 1 ; 2 ; 1 ; 2 ; 1 ; 2 ; 1 ; 2 ; 1 ; 2 ; 1 ; 2 ; 1 ; 2 ; 1 ; 2 ; 1 ; 2 ; 1 ; 2 ; 1 ; 2 ; 1 ; 2 ; 1 ; 2 ; 1 ; 2 ; 1 ; 2 X 5 = 5 ; 15 ; 5 ; 15 ; 5 ; 15 ; 5 ; 15 ; 5 ; 15 ; 5 ; 15 ; 5 ; 15 ; 5 ; 15 ; 5 ; 15 ; 5 ; 15 ; 5 ; 15 ; 5 ; 15 ; 5 ; 15 ; 5 ; 15 ; 5 ; 15 ; 5 ; 15 X 6 = 70 ; 70 ; 70 ; 70 ; 70 ; 70 ; 70 ; 70 ; 3.5 ; 3.5 ; 3.5 ; 3.5 ; 3.5 ; 3.5 ; 3.5 ; 3.5 ; 70 ; 70 ; 70 ; 70 ; 70 ; 70 ; 70 ; 70 ; 3.5 ; 3.5 ; 3.5 ; 3.5 ; 3.5 ; 3.5 ; 3.5 ; 3.5
Here we have to note that for Y to X 6 , their measured units are different and their values have a very large range, which might cause inaccurate results in the analysis. Therefore, these sequences are normalized to comparability sequences using a process called normalization. More specifically, we normalized the data from Equation (2) using Y = Y n n = 1 32 Y n ¯ and X i = X i n n = 1 32 X i n ¯ to gain Equation (3).
Y = Y 1 n = 1 32 Y ( n ) ¯ , Y 2 n = 1 32 Y ( n ) ¯ , , Y 32 n = 1 32 Y ( n ) ¯ X 1 = X 1 1 n = 1 32 X 1 n ¯ , X 1 2 n = 1 32 X 1 n ¯ , , X 1 32 n = 1 32 X 1 n ¯ X 2 = X 2 1 n = 1 32 X 2 n ¯ , X 2 2 n = 1 32 X 2 n ¯ , , X 2 32 n = 1 32 X 2 n ¯ X 3 = X 3 1 n = 1 32 X 3 n ¯ , X 3 2 n = 1 32 X 3 n ¯ , , X 3 32 n = 1 32 X 3 n ¯ X 4 = X 4 1 n = 1 32 X 4 n ¯ , X 4 2 n = 1 32 X 4 n ¯ , , X 4 32 n = 1 32 X 4 n ¯ X 5 = X 5 1 n = 1 32 X 5 n ¯ , X 5 2 n = 1 32 X 5 n ¯ , , X 5 32 n = 1 32 X 5 n ¯ X 6 = X 6 1 n = 1 32 X 6 n ¯ , X 6 2 n = 1 32 X 6 n ¯ , , X 6 32 n = 1 32 X 6 n ¯
From Equation (3), the detailed results for Y (vibration in the in-flow direction) to X 6 are:
Y = 0.2 ; 0.3 ; 0.2 ; 0.4 ; 0.2 ; 0.3 ; 0.2 ; 0.4 ; 0.5 ; 1.5 ; 4.1 ; 4.4 ; 0.4 ; 0.5 ; 3.3 ; 1.4 ; 0.3 ; 0.3 ; 0.3 ; 0.5 ; 0.3 ; 0.3 ; 0.3 ; 0.5 ; 0.3 ; 1.4 ; 1.4 ; 2.7 ; 0.4 ; 1.3 ; 1.5 ; 1.8 X 1 = 0.8 ; 0.8 ; 0.8 ; 0.8 ; 0.8 ; 0.8 ; 0.8 ; 0.8 ; 0.8 ; 0.8 ; 0.8 ; 0.8 ; 0.8 ; 0.8 ; 0.8 ; 0.8 ; 1.2 ; 1.2 ; 1.2 ; 1.2 ; 1.2 ; 1.2 ; 1.2 ; 1.2 ; 1.2 ; 1.2 ; 1.2 ; 1.2 ; 1.2 ; 1.2 ; 1.2 ; 1.2 X 2 = 0.5 ; 0.5 ; 0.5 ; 0.5 ; 1.5 ; 1.5 ; 1.5 ; 1.5 ; 0.5 ; 0.5 ; 0.5 ; 0.5 ; 1.5 ; 1.5 ; 1.5 ; 1.5 ; 0.5 ; 0.5 ; 0.5 ; 0.5 ; 1.5 ; 1.5 ; 1.5 ; 1.5 ; 0.5 ; 0.5 ; 0.5 ; 0.5 ; 1.5 ; 1.5 ; 1.5 ; 1.5 X 3 = 0.6 ; 0.6 ; 1.4 ; 1.4 ; 0.6 ; 0.6 ; 1.4 ; 1.4 ; 0.6 ; 0.6 ; 1.4 ; 1.4 ; 0.6 ; 0.6 ; 1.4 ; 1.4 ; 0.6 ; 0.6 ; 1.4 ; 1.4 ; 0.6 ; 0.6 ; 1.4 ; 1.4 ; 0.6 ; 0.6 ; 1.4 ; 1.4 ; 0.6 ; 0.6 ; 1.4 ; 1.4 X 4 = 0.7 ; 1.3 ; 0.7 ; 1.3 ; 0.7 ; 1.3 ; 0.7 ; 1.3 ; 0.7 ; 1.3 ; 0.7 ; 1.3 ; 0.7 ; 1.3 ; 0.7 ; 1.3 ; 0.7 ; 1.3 ; 0.7 ; 1.3 ; 0.7 ; 1.3 ; 0.7 ; 1.3 ; 0.7 ; 1.3 ; 0.7 ; 1.3 ; 0.7 ; 1.3 ; 0.7 ; 1.3 X 5 = 0.5 ; 1.5 ; 0.5 ; 1.5 ; 0.5 ; 1.5 ; 0.5 ; 1.5 ; 0.5 ; 1.5 ; 0.5 ; 1.5 ; 0.5 ; 1.5 ; 0.5 ; 1.5 ; 0.5 ; 1.5 ; 0.5 ; 1.5 ; 0.5 ; 1.5 ; 0.5 ; 1.5 ; 0.5 ; 1.5 ; 0.5 ; 1.5 ; 0.5 ; 1.5 ; 0.5 ; 1.5 X 6 = 1.9 ; 1.9 ; 1.9 ; 1.9 ; 1.9 ; 1.9 ; 1.9 ; 1.9 ; 0.1 ; 0.1 ; 0.1 ; 0.1 ; 0.1 ; 0.1 ; 0.1 ; 0.1 ; 1.9 ; 1.9 ; 1.9 ; 1.9 ; 1.9 ; 1.9 ; 1.9 ; 1.9 ; 0.1 ; 0.1 ; 0.1 ; 0.1 ; 0.1 ; 0.1 ; 0.1 ; 0.1
Then, we used a normal equation (Equation (4)) to obtain the importance coefficients of the six factors.
I 1 , 1 I 1 , n I n , 1 I n , n b 1 b n = I 1 , 0 I n , 0
where b1 to bn are the importance coefficients; I i , i = x i n = 1 n X i n ¯ 2 ;   I i , j = x i n = 1 n X i n ¯ x j n = 1 n X j n ¯ ;   and   I i , 0 = x i n = 1 n X i n ¯ Y n = 1 n Y n ¯ .
More specifically, of the importance coefficients in this paper, b1 is for the number of constraints, b2 is for the top tension force, b3 is for the flow velocity, b4 is for wave period, b5 is for wave height, and b6 is for the modulus of material.
The detailed results for Equation (4) through the experimental data (vibration in the in-flow direction) are presented as:
1.7 0 0 0 0 0 0 8 0 0 0 0 0 0 5.1 0 0 0 0 0 0 3.6 5.3 0 0 0 0 0 8 0 0 0 0 0 0 26.2 b 1 b 2 b 3 b 4 b 5 b 6 = 1.0 2.8 5.9 1.3 1.8 19.7
Therefore, the importance coefficients for the vibration in the in-flow direction can be calculated as:
b 1 b 2 b 3 b 4 b 5 b 6 = 0.61 0.35 1.15 0 0.25 0.75
In other words, the sequence of importance for the dynamic vibration of the riser in the in-flow direction is b3 (flow velocity) > b6 (modulus) > b1 (number of constraints) > b2 (top tension force) > b5 (wave height) > b4 (wave period).
Using the same calculation procedure, the sequence of importance for the dynamic vibration of the riser in the cross-flow direction is b3 (flow velocity) > b1 (number of constraints) > b6 (modulus) > b2 (top tension force) > b5 (wave height) > b4 (wave period).

7. Conclusions

This paper presents an experimental study of the dynamic response of a marine riser under coupling effect of multiparameter, i.e., modulus of riser, boundary condition, top tension force, flow velocity, wave height, and wave period. Based on the variables of each parameter, 34 test cases (including 2 benchmark tests) were carried out in total. The natural frequencies of each riser situation, the response vibration microstrain, and the involved frequency for all experiment cases for the risers were obtained. According to these results, the effect of each parameter was discussed, and the sequence of importance of these parameters on the amplitude of vibration (both in the in-flow and cross-flow directions) was calculated using multiple linear regression.
It was found in this paper that:
  • Vibration amplitudes in both the in-flow and cross-flow directions are negatively correlated to the modulus, top tension force, and the number of constraints of the riser, while the other parameters are contrary.
  • In-flow and cross-flow amplitudes are close to each other at low flow velocity, while the cross-flow amplitudes increase more significantly with the increase in flow velocity.
  • When the other conditions are the same, the constraint number and the value of top tension directly affect whether obvious cross-flow vibration occurs at the same flow velocity.
  • The vibration amplitude and frequency of the riser are affected by the wave factor. More specifically, the frequency of in-flow vibration is normally consistent with that of the wave, and the increase in the wave intensity will obviously lead to the increase in the vibration amplitude of the riser, especially for that of cross-flow vibration.
  • The increase in flow velocity is an important factor for vortex-induced vibration of the riser. With the increase in flow velocity, the amplitude of the riser in both directions increases significantly.
  • The sequences of importance for the vibration in the in-flow and cross-flow directions are b3 (flow velocity) > b6 (modulus) > b1 (number of constraints) > b2 (top tension force) > b5 (wave height) > b4 (wave period) and b3 (flow velocity) > b1 (number of constraints) > b6 (modulus) > b2 (top tension force) > b5 (wave height) > b4 (wave period), respectively.

Author Contributions

Conceptualization, R.Z., C.W. and W.H.; methodology, R.Z., C.W. and W.H.; validation, R.Z. and C.W.; formal analysis, R.Z. and C.W.; data curation, R.Z., Z.Z., K.M. and M.R.; investigation, R.Z. and C.W.; writing—original draft preparation, R.Z. and C.W.; writing—review and editing, C.W.; supervision, C.W. All authors have read and agreed to the published version of the manuscript.

Funding

This research was funded by Shandong Natural Science Foundation Project (ZR2020ME269); Open Fund Project of Shandong Key Laboratory of Ocean Engineering (KLOE202005); and Key Research and Development Program of Shandong Province (2019GHY112076).

Data Availability Statement

The data presented in this study are available on request from the corresponding author.

Conflicts of Interest

The authors declare no conflict of interest.

References

  1. Zhao, H.; Liu, X.; Bai, L. Development Status of Deepwater Offshore Oil Drilling Equipment. Oil Field Equip. 2010, 39, 68–74. [Google Scholar]
  2. Zhou, S.; Li, Q. Developing Marine Energy and Building a Marine Power. Sci. Technol. Rev. 2020, 38, 17–26. [Google Scholar]
  3. Ferguson, N.; Parkinson, G.V. Surface and wake flow phenomena of the vortex-excited oscillation of a circular cylinder. J. Eng. Ind. 1967, 89, 831–838. [Google Scholar] [CrossRef]
  4. Liu, G.; Li, H.; Qiu, Z.; Leng, D.; Li, Z.; Li, W. A mini review of recent progress on vortex induced vibrations of marine risers. Ocean. Eng. 2020, 195, 106704. [Google Scholar] [CrossRef]
  5. Ma, Y.; Xu, W.; Wu, H.; Wang, Q. Comparative Study on Vortex Induced Vibration Suppression Methods for Marine Risers. In Proceedings of the 31st National Hydrodynamics Symposium (Volume II); State Key Laboratory of Hydraulic Engineering Simulation and Safety: Tianjin, China, 2020; pp. 819–825. [Google Scholar]
  6. Yang, H.; Xiao, F. Instability analyses of a top-tensioned riser under combined vortex and multi-frequency parametric excitations. Ocean. Eng. 2014, 81, 12–28. [Google Scholar] [CrossRef]
  7. Li, W.; Zhou, X.; Sun, Y.; Duan, M. Application of variable tension transfer matrix method in modal analysis of marine riser. Shipbuild. China 2019, 60, 185–194. [Google Scholar]
  8. Zhang, Y.; Guo, H.; Meng, F.; Liu, X. Experimental study on vortex induced vibration law of top tension riser based on wavelet transform. J. Vib. Shock. 2011, 30, 149–154+185. [Google Scholar]
  9. Liu, J.; Guo, X.; Liu, Q.; Wang, G.; He, Y.; Li, J. Vortex induced vibration response characteristics of marine riser considering the coupling effect of forward and cross flow. Acta Pet. Sin. 2019, 40, 1270–1280. [Google Scholar]
  10. Li, Y.; Yang, X.; Guo, H.; Li, P. Research on design of offshore riser test support and its impact on vortex induced vibration. Ocean. Eng. 2013, 31, 31–37. [Google Scholar]
  11. Gao, Y.; Zhang, Z.; Zou, L.; Zong, Z.; Yang, B. Effect of boundary condition and aspect ratio on vortex-induced vibration response of a circular cylinder. Ocean. Eng. 2019, 188, 106244. [Google Scholar] [CrossRef]
  12. Yin, B.; Hu, Q.; Li, Y.; Wang, W.; Zhu, J.; Wang, D. Review on Vortex Induced Vibration Characteristics of Marine Risers. J. Ship Mech. 2022, 26, 1097–1109. [Google Scholar]
  13. Wu, Z.; Lu, Q.; Mei, G. Multi frequency parametric excitation vibration response of marine riser under combined action of random wave and eddy current. J. Ship Mech. 2020, 24, 599–610. [Google Scholar]
  14. Wang, C.; Cui, Y.; Ge, S.; Sun, M.; Jia, Z. Experimental Study on Vortex-induced Vibration of Risers Considering the Effects of Different Design Parameters. Appl. Sci. 2018, 8, 2411. [Google Scholar] [CrossRef]
  15. Ge, S.; Wang, C.; Sun, M.; Wang, Y. Three-dimensional computational fluid dynamics simulation of vortex induced vibration of fiber reinforced composite marine riser based on fluid structure interaction. J. Univ. Jinan (Sci. Technol.) 2020, 34, 1–9. [Google Scholar]
  16. Cui, Y.; Wang, C.; Chen, Z.; Sun, M. Experimental Study on Vortex Induced Vibration of Multi parameter Marine Risers Based on Grey Theory. Sci. Technol. Eng. 2018, 18, 207–213. [Google Scholar]
  17. Lou, M.; Qian, G. Experimental Design of Vortex Induced Vibration of Marine Risers. Res. Explor. Lab. 2020, 39, 59–62. [Google Scholar]
  18. Wang, C.; Shankar, K.; Morozov, E.V. Global design and analysis of deep sea FRP composite risers under combined environmental loads. Adv. Compos. Mater. 2017, 26, 79–98. [Google Scholar] [CrossRef]
  19. ABS (American Bureau of Shipping). Guide for Building and Classing Subsea Riser Systems: Design Requirements and Loads; American Bureau of Shipping: Houston, TX, USA, 2008. [Google Scholar]
  20. Wang, C.; Feng, Y. Optimal Design of Deepwater Fiber Composite Marine Risers; Geological Publishing House: Beijing, China, 2021. [Google Scholar]
  21. Cooley, J.W.; Tukey, J.W. An algorithm for the machine calculation of complex Fourier series. Math. Comput. 1965, 19, 297–301. [Google Scholar] [CrossRef]
  22. Aiken, L.S.; West, S.G.; Reno, R.R. Multiple Regression: Testing and Interpreting Interactions; Sage Publications: Newbury Park, CA, USA, 1991. [Google Scholar]
  23. Merriman, M. A Text-Book on the Method of Least Squares; John Wiley & Sons: New York, NY, USA, 1911. [Google Scholar]
Figure 1. The universal testing machine.
Jmse 11 01787 g001
Figure 2. Sketch map of the model riser.
Jmse 11 01787 g002
Figure 3. Combined current and wave channel.
Jmse 11 01787 g003
Figure 4. Velocity and wave parameter monitoring system. (a) Multichannel velocity acquisition instrument. (b) Wave data collector.
Jmse 11 01787 g004
Figure 5. Top simple support in the experiment.
Jmse 11 01787 g005
Figure 6. HF digital tension tester and integral connection. (a) tension meter. (b) integral connection.
Jmse 11 01787 g006
Figure 7. Overall picture of the bottom bases.
Jmse 11 01787 g007
Figure 8. Detail picture of the supports.
Jmse 11 01787 g008
Figure 9. DH3820N distributed stress and strain testing and analysis system.
Jmse 11 01787 g009
Figure 10. The connection of data collection system.
Jmse 11 01787 g010
Figure 11. Time history curve of strain response under beating and the frequency result using FFT. (a) Time history curve of strain response. (b) Frequency in still water using FFT.
Jmse 11 01787 g011
Figure 12. The microstrain time curve in the cross-flow direction. By point for the case of “PMMA, S-S support without tension, with or without wave”. (a) without wave, velocity = 0.4 m/s. (b) with wave, velocity = 0.4 m/s.
Jmse 11 01787 g012
Figure 13. The microstrain time curve for GK4 and GK12 (different materials) in the in-flow direction of Ay point.
Jmse 11 01787 g013
Figure 14. The microstrain time curve for GK4 and GK12 (different materials) in the cross-flow direction of By point.
Jmse 11 01787 g014
Figure 15. The involved frequencies in the in-flow and cross-flow directions of the riser for GK4 and GK12.
Jmse 11 01787 g015
Figure 16. The microstrain time curve for GK12 and GK28 (different boundary conditions) in the in-flow direction of Ay point.
Jmse 11 01787 g016
Figure 17. The microstrain time curve for GK12 and GK28 (different boundary conditions) in the cross-flow direction of By point.
Jmse 11 01787 g017
Figure 18. The involved frequencies in the in-flow and cross-flow directions of the riser for GK12 and GK28.
Jmse 11 01787 g018
Figure 19. The microstrain time curve for GK12 and GK16 (different top tensions) in the in-flow direction of Ay point.
Jmse 11 01787 g019
Figure 20. The microstrain time curve for GK12 and GK16 (different top tensions) in the cross-flow direction of By point.
Jmse 11 01787 g020
Figure 21. The involved frequencies in the in-flow and cross-flow directions of the riser for GK12 and GK16.
Jmse 11 01787 g021
Figure 22. The microstrain time curve for GK9 and GK11 (different flow velocities) in the in-flow direction of Ay point.
Jmse 11 01787 g022
Figure 23. The microstrain time curve for GK9 and GK11 (different flow velocities) in the cross-flow direction of By point.
Jmse 11 01787 g023
Figure 24. The involved frequencies in the in-flow and cross-flow directions of the riser for GK9 and GK11.
Jmse 11 01787 g024
Figure 25. The microstrain time curve for GK9 and GK10 (different wave parameters) in the in-flow direction of Ay point.
Jmse 11 01787 g025
Figure 26. The microstrain time curve for GK9 and GK10 (different wave parameters) in the cross-flow direction of By point.
Jmse 11 01787 g026
Figure 27. The involved frequencies in the in-flow and cross-flow directions of the riser for GK9 and GK10.
Jmse 11 01787 g027
Table 1. The size and the elastic modulus of the materials.
Materials Outer DiameterInside Dimension LengthDensityElasticity Modulus
(m)(m)(m)(kg/m3)(GPa)
Aluminum0.020.0161.25327970
PMMA0.020.0161.2511323.5
Table 2. Parameter combination of riser test conditions.
No.MaterialsBoundary ConditionsTop
Tension
(N)
Flow
Velocity
(m/s)
WaveNo.MaterialsBoundary ConditionsTop
Tension
(N)
Flow
Velocity
(m/s)
Wave
Period(s)Wave Height (cm)Period(s)Wave Height (cm)
GK1AlS-S100.315GK2AlS-S100.3215
GK3AlS-S100.715GK4AlS-S100.7215
GK5AlS-S300.315GK6AlS-S300.3215
GK7AlS-S300.715GK8AlS-S300.7215
GK9PMMAS-S100.315GK10PMMAS-S100.3215
GK11PMMAS-S100.715 GK12PMMAS-S100.7215
GK13PMMAS-S300.315 GK14PMMAS-S300.3215
GK15PMMAS-S300.715GK16PMMAS-S300.7215
GK17AlS-F100.315GK18AlS-F100.3215
GK19AlS-F100.715GK20AlS-F100.7215
GK21AlS-F300.315GK22AlS-F300.3215
GK23AlS-F300.715GK24AlS-F300.7215
GK25PMMAS-F100.315GK26PMMAS-F100.3215
GK27PMMAS-F100.715GK28PMMAS-F100.7215
GK29PMMAS-F300.315GK30PMMAS-F300.3215
GK31PMMAS-F300.715GK32PMMAS-F300.7215
Table 3. The natural frequency with different boundary conditions.
MaterialsNo WaterIn Water
S-S (Hz)S-F (Hz)S-S (Hz)S-F (Hz)
Al22.302
(T = 10 N)
30.769
(T = 10 N)
19.302
(T = 10 N)
24.626
(T = 10 N)
24.126
(T = 30 N)
31.818
(T = 30 N)
22.126
(T = 30 N)
28.572
(T = 30 N)
PMMA8.219
(T = 10 N)
14.085
(T = 10 N)
6.612
(T = 10 N)
10.322
(T = 10 N)
9.231
(T = 30 N)
15.000
(T = 30 N)
7.595
(T = 30 N)
10.989
(T = 30 N)
Table 4. Theoretical non-dimensional numbers of the experiment with only steady flow.
MaterialsTension Force (N)Boundary Conditionfriser
(Hz)
Flow Velocity
(m/s)
ReStfs
(Hz)
Ur
Al10S-S19.3020.35660.40.213.150.78
30S-S22.1260.35660.40.213.150.68
10S-F24.6260.35660.40.213.150.61
30S-F28.5720.35660.40.213.150.52
10S-S6.6120.35660.40.213.152.27
30S-S7.5950.35660.40.213.151.97
10S-F10.3220.35660.40.213.151.45
30S-F10.9890.35660.40.213.151.37
PMMA10S-S19.3020.713,207.50.217.351.81
30S-S22.1260.713,207.50.217.351.58
10S-F24.6260.713,207.50.217.351.42
30S-F28.5720.713,207.50.217.351.22
10S-S6.6120.713,207.50.217.355.29
30S-S7.5950.713,207.50.217.354.61
10S-F10.3220.713,207.50.217.353.39
30S-F10.9890.713,207.50.217.353.19
Table 5. Benchmark test.
No.MaterialsBoundary Conditionfriser (Hz)Flow Velocity(m/s)WaveUr
1PMMAS-S without tension6.20.4none3.22
2PMMAS-S without tension6.20.415 cm, 2 s3.22
Disclaimer/Publisher’s Note: The statements, opinions and data contained in all publications are solely those of the individual author(s) and contributor(s) and not of MDPI and/or the editor(s). MDPI and/or the editor(s) disclaim responsibility for any injury to people or property resulting from any ideas, methods, instructions or products referred to in the content.

