
Relative Sea-Level Fluctuations during Rhuddanian–Aeronian Transition and Its Implication for Shale Gas Sweet Spot Forming: A Case Study of Luzhou Area in the Southern Sichuan Basin, SW China


Abstract
:1. Introduction
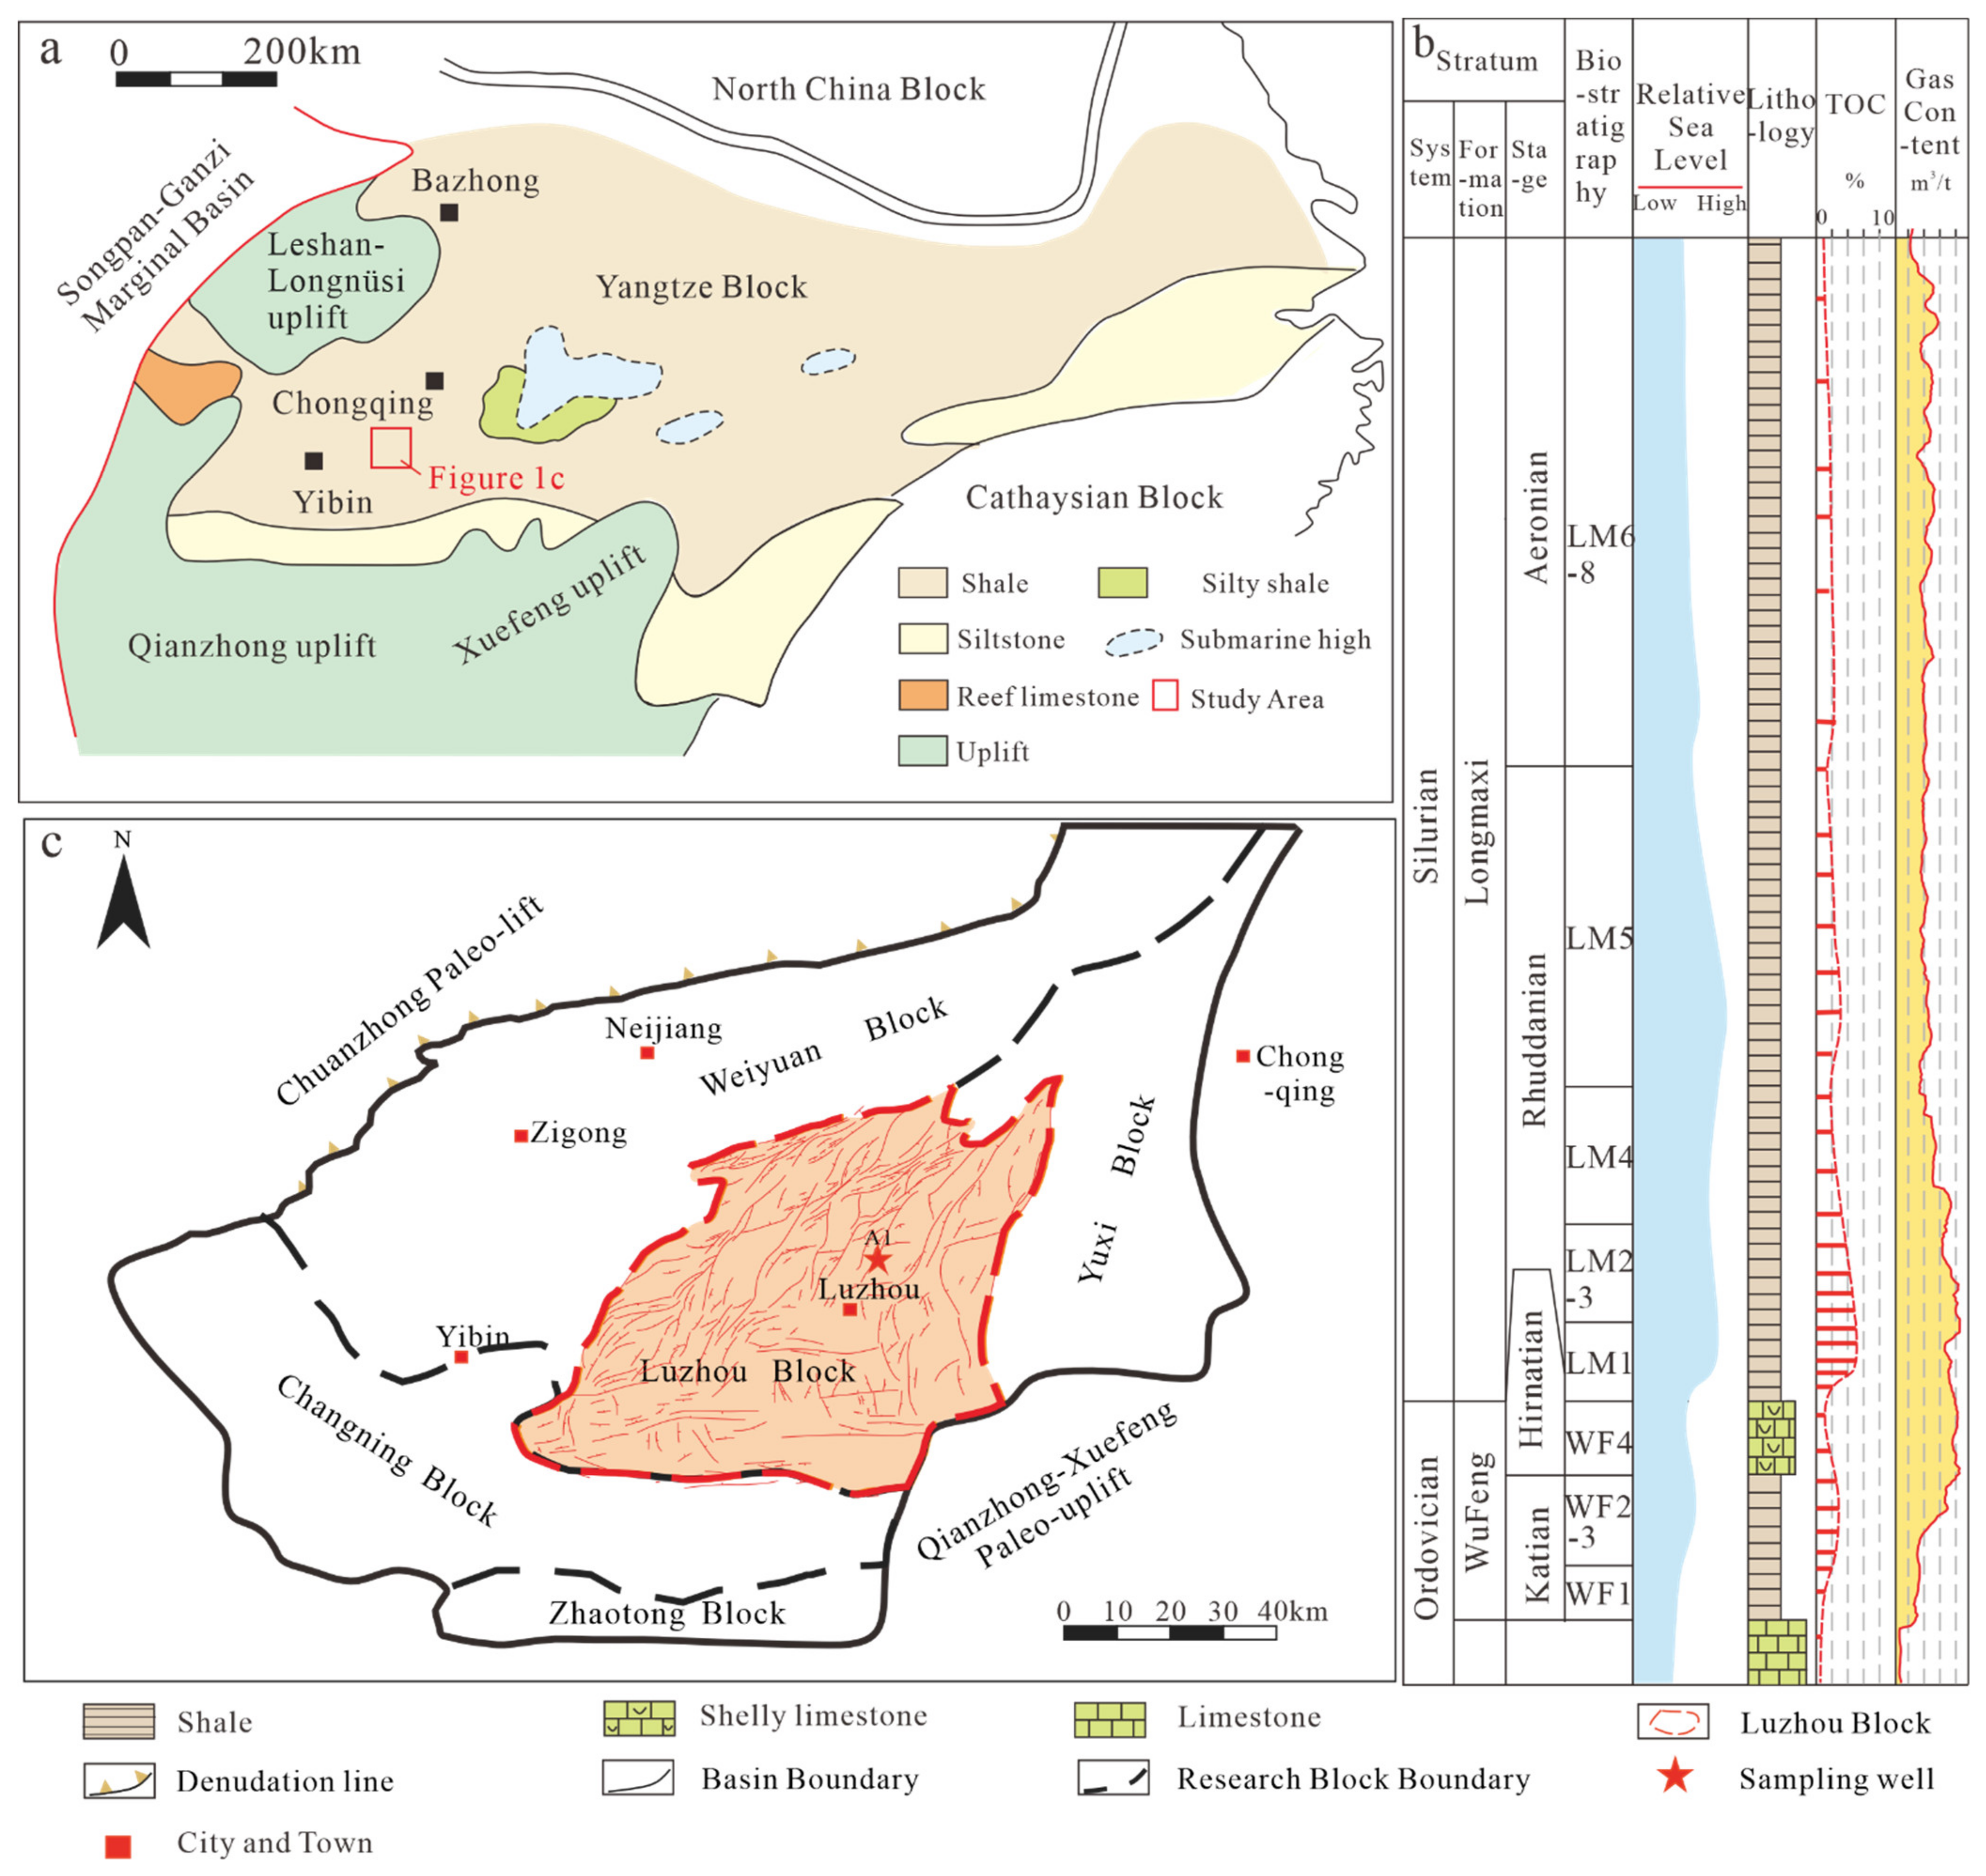
2. Geological Setting
3. Materials and Methods
3.1. Materials
3.2. Methods
3.2.1. Major Element Analysis
3.2.2. Trace Element Analysis
3.2.3. X-ray Diffraction Analysis
3.2.4. Total Organic Carbon Content Analysis
3.2.5. Geochemical Data Presentation
3.2.6. Sequence Boundary Discrimination
4. Results
4.1. X-ray Diffraction Analysis
4.2. Total Organic Carbon Content Analysis
4.3. Major Element Analysis
4.4. Trace Element Analysis
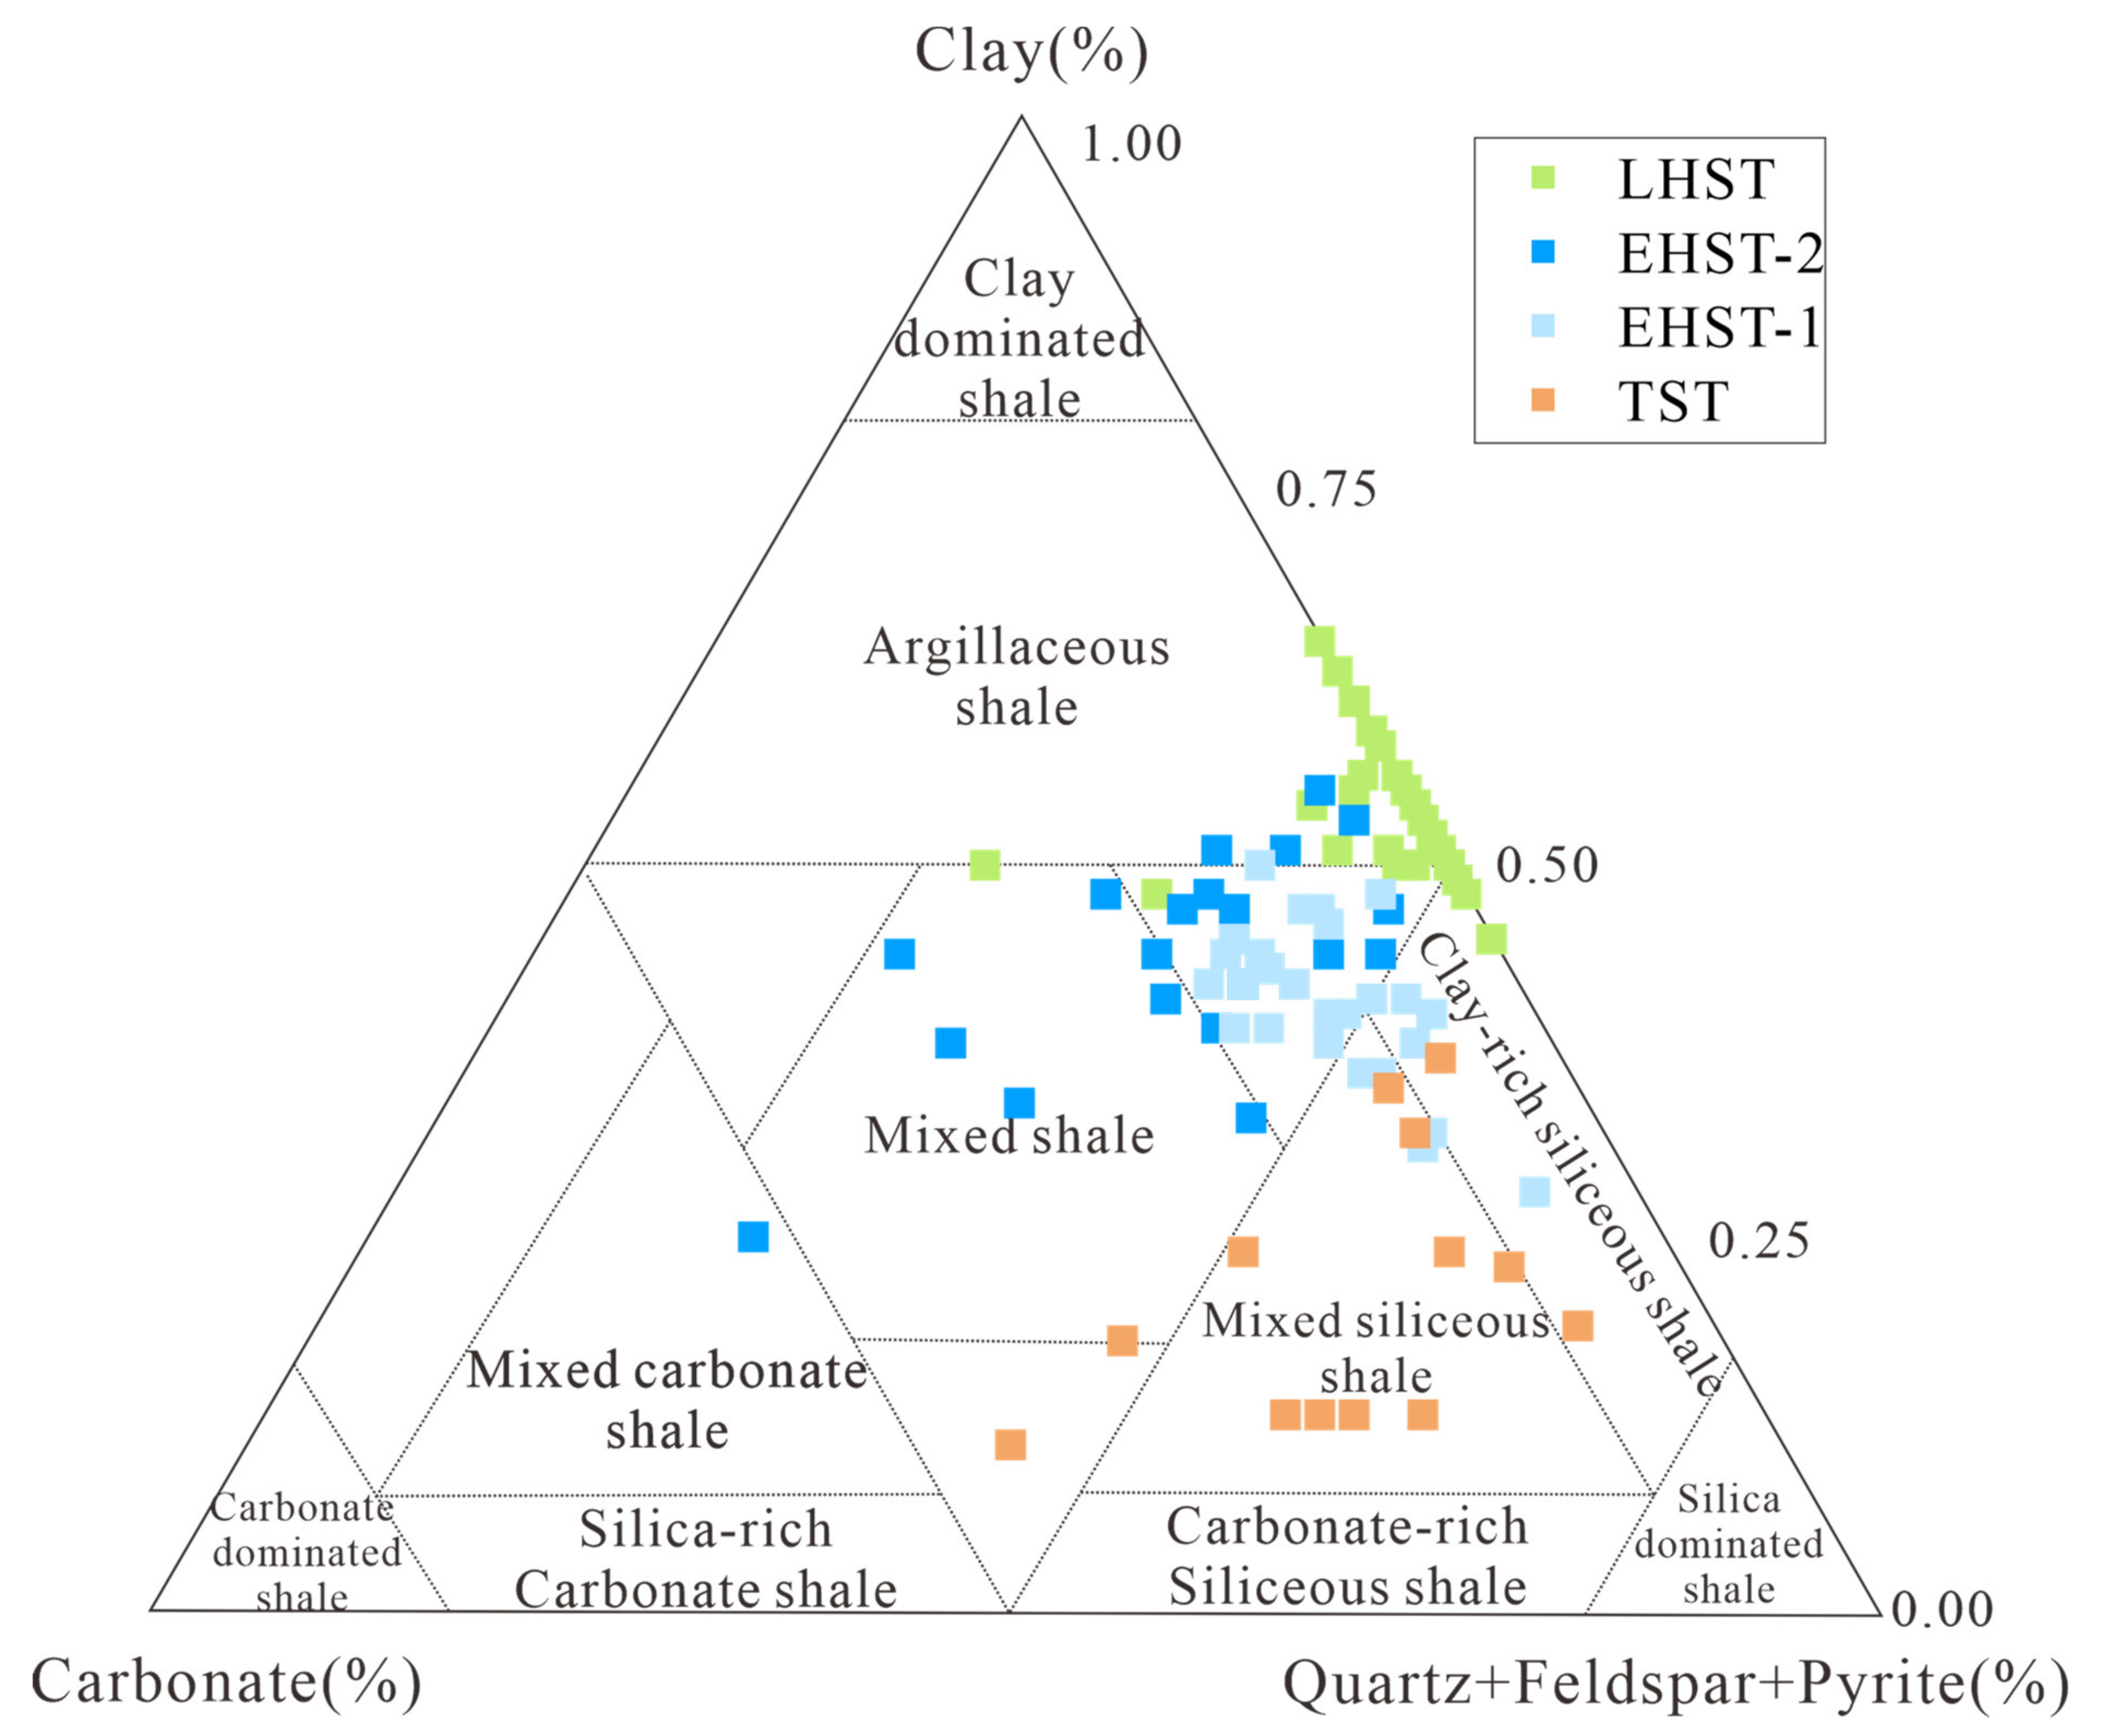
4.5. Lithofacies Classification
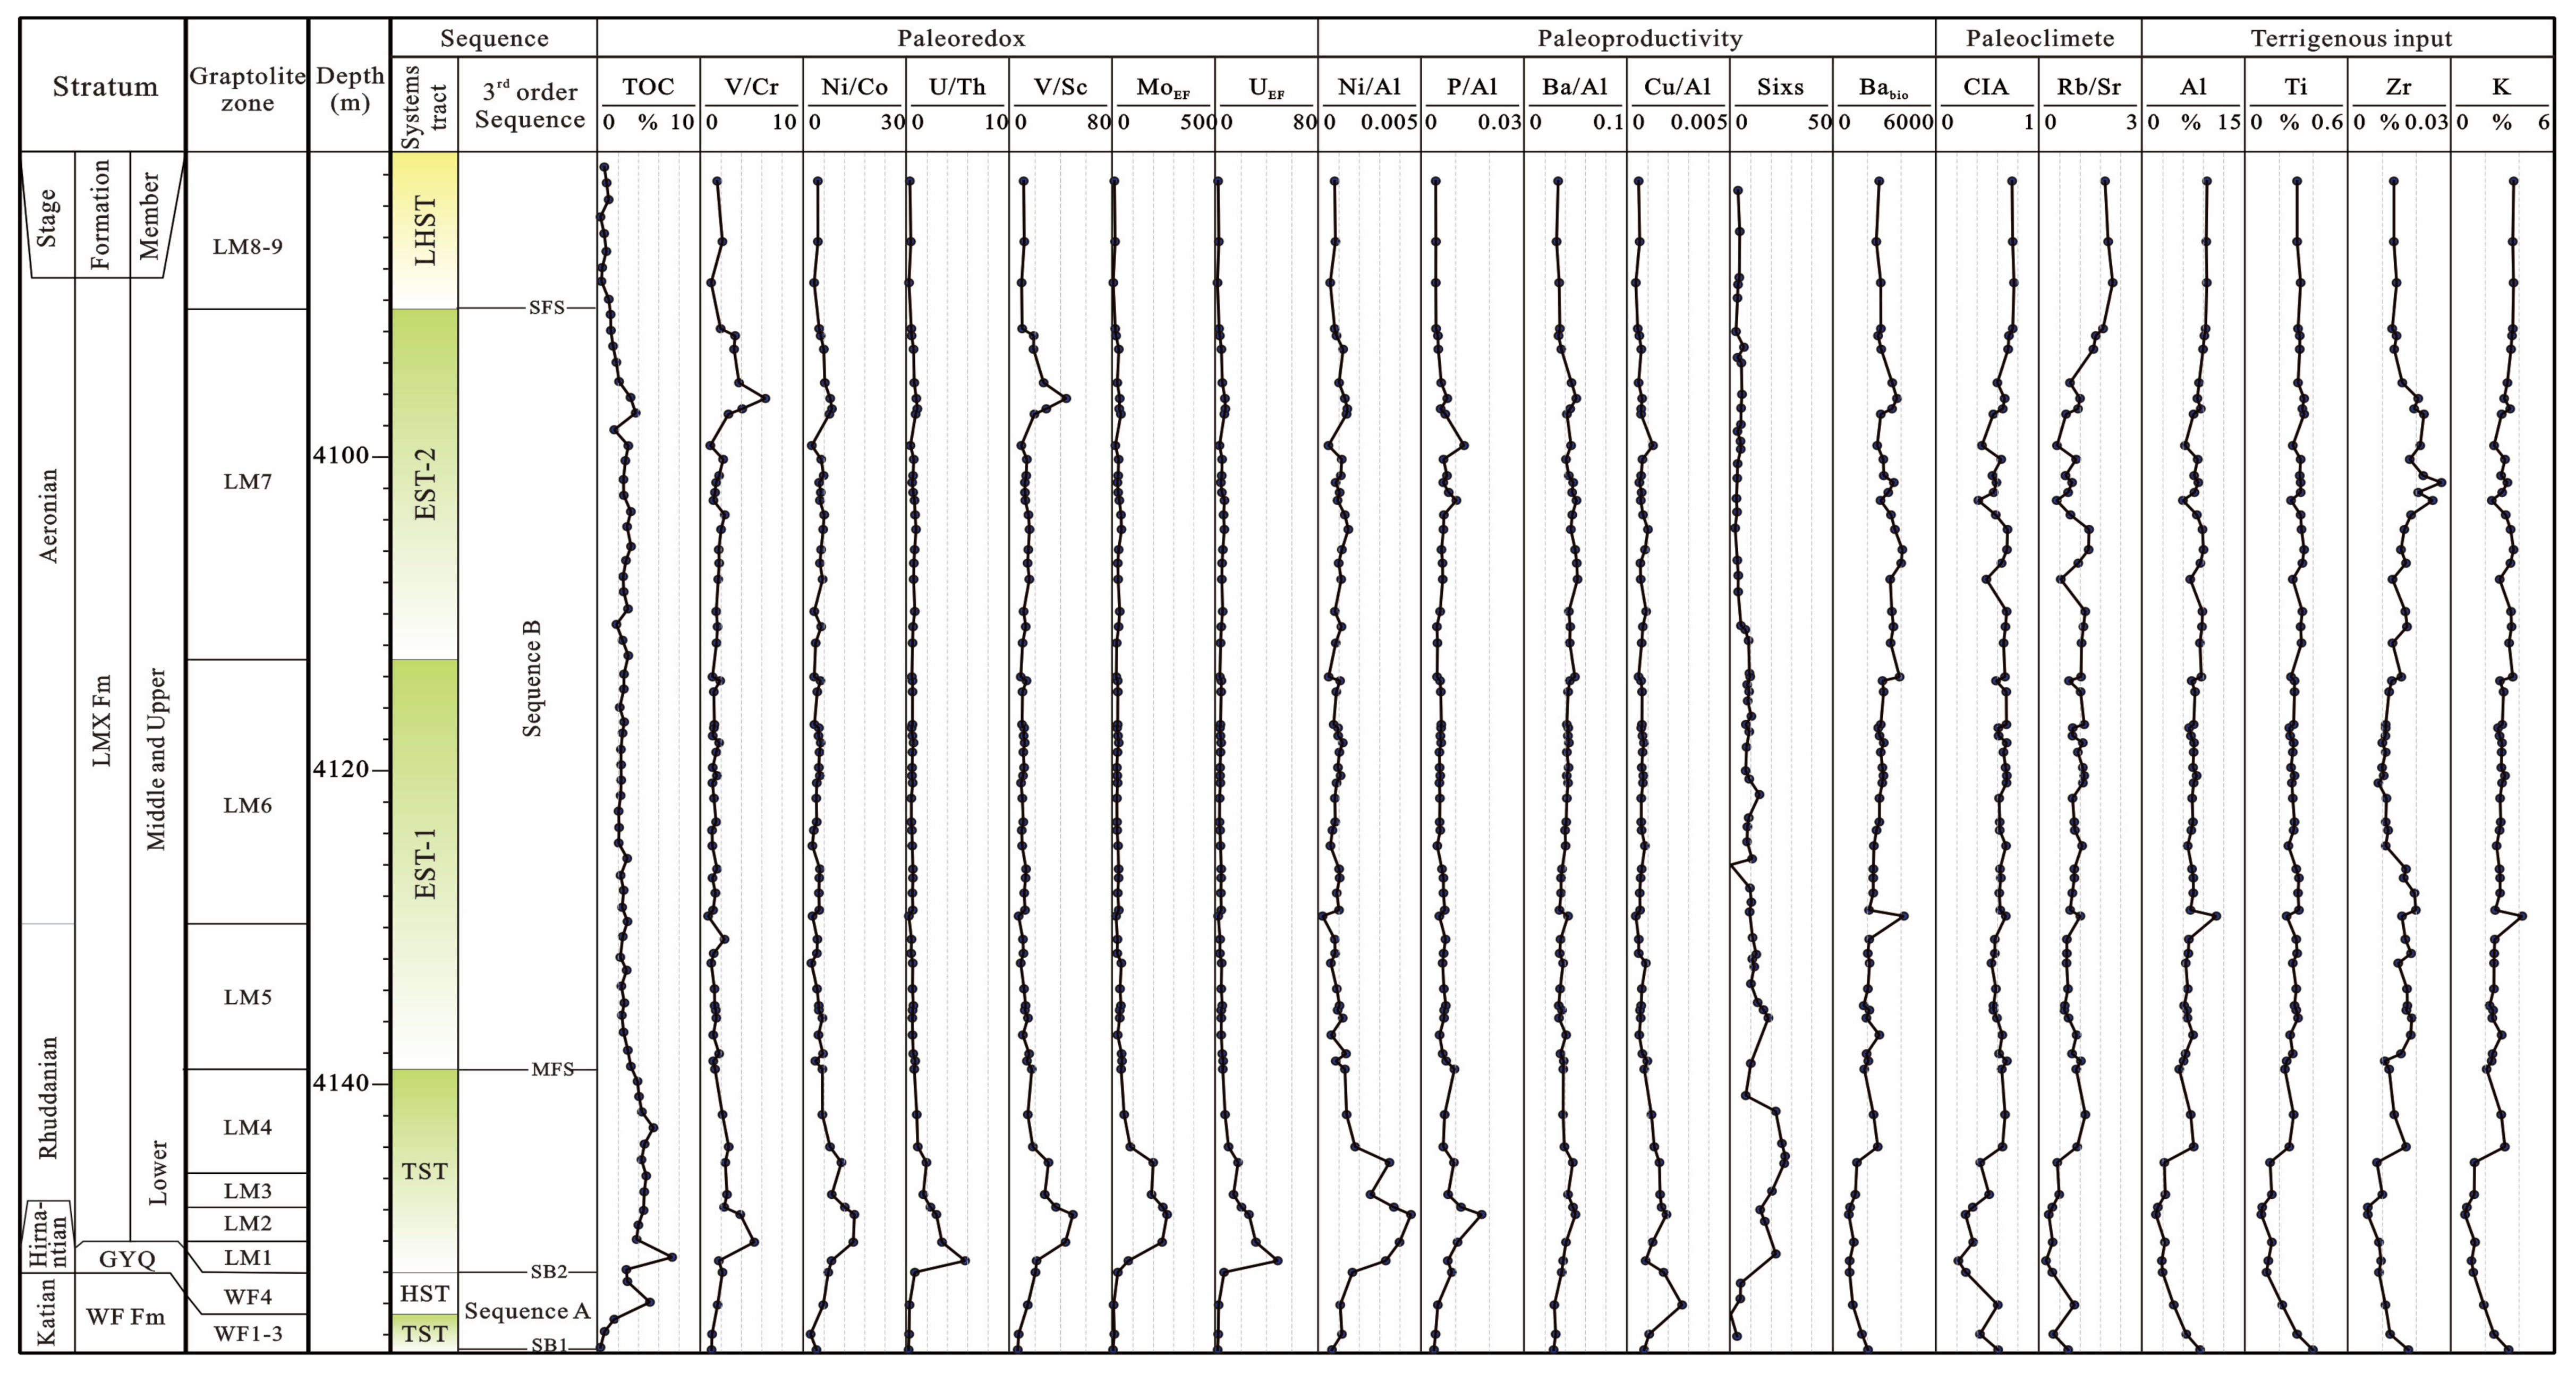
4.6. Stratigraphic Framework
5. Discussion
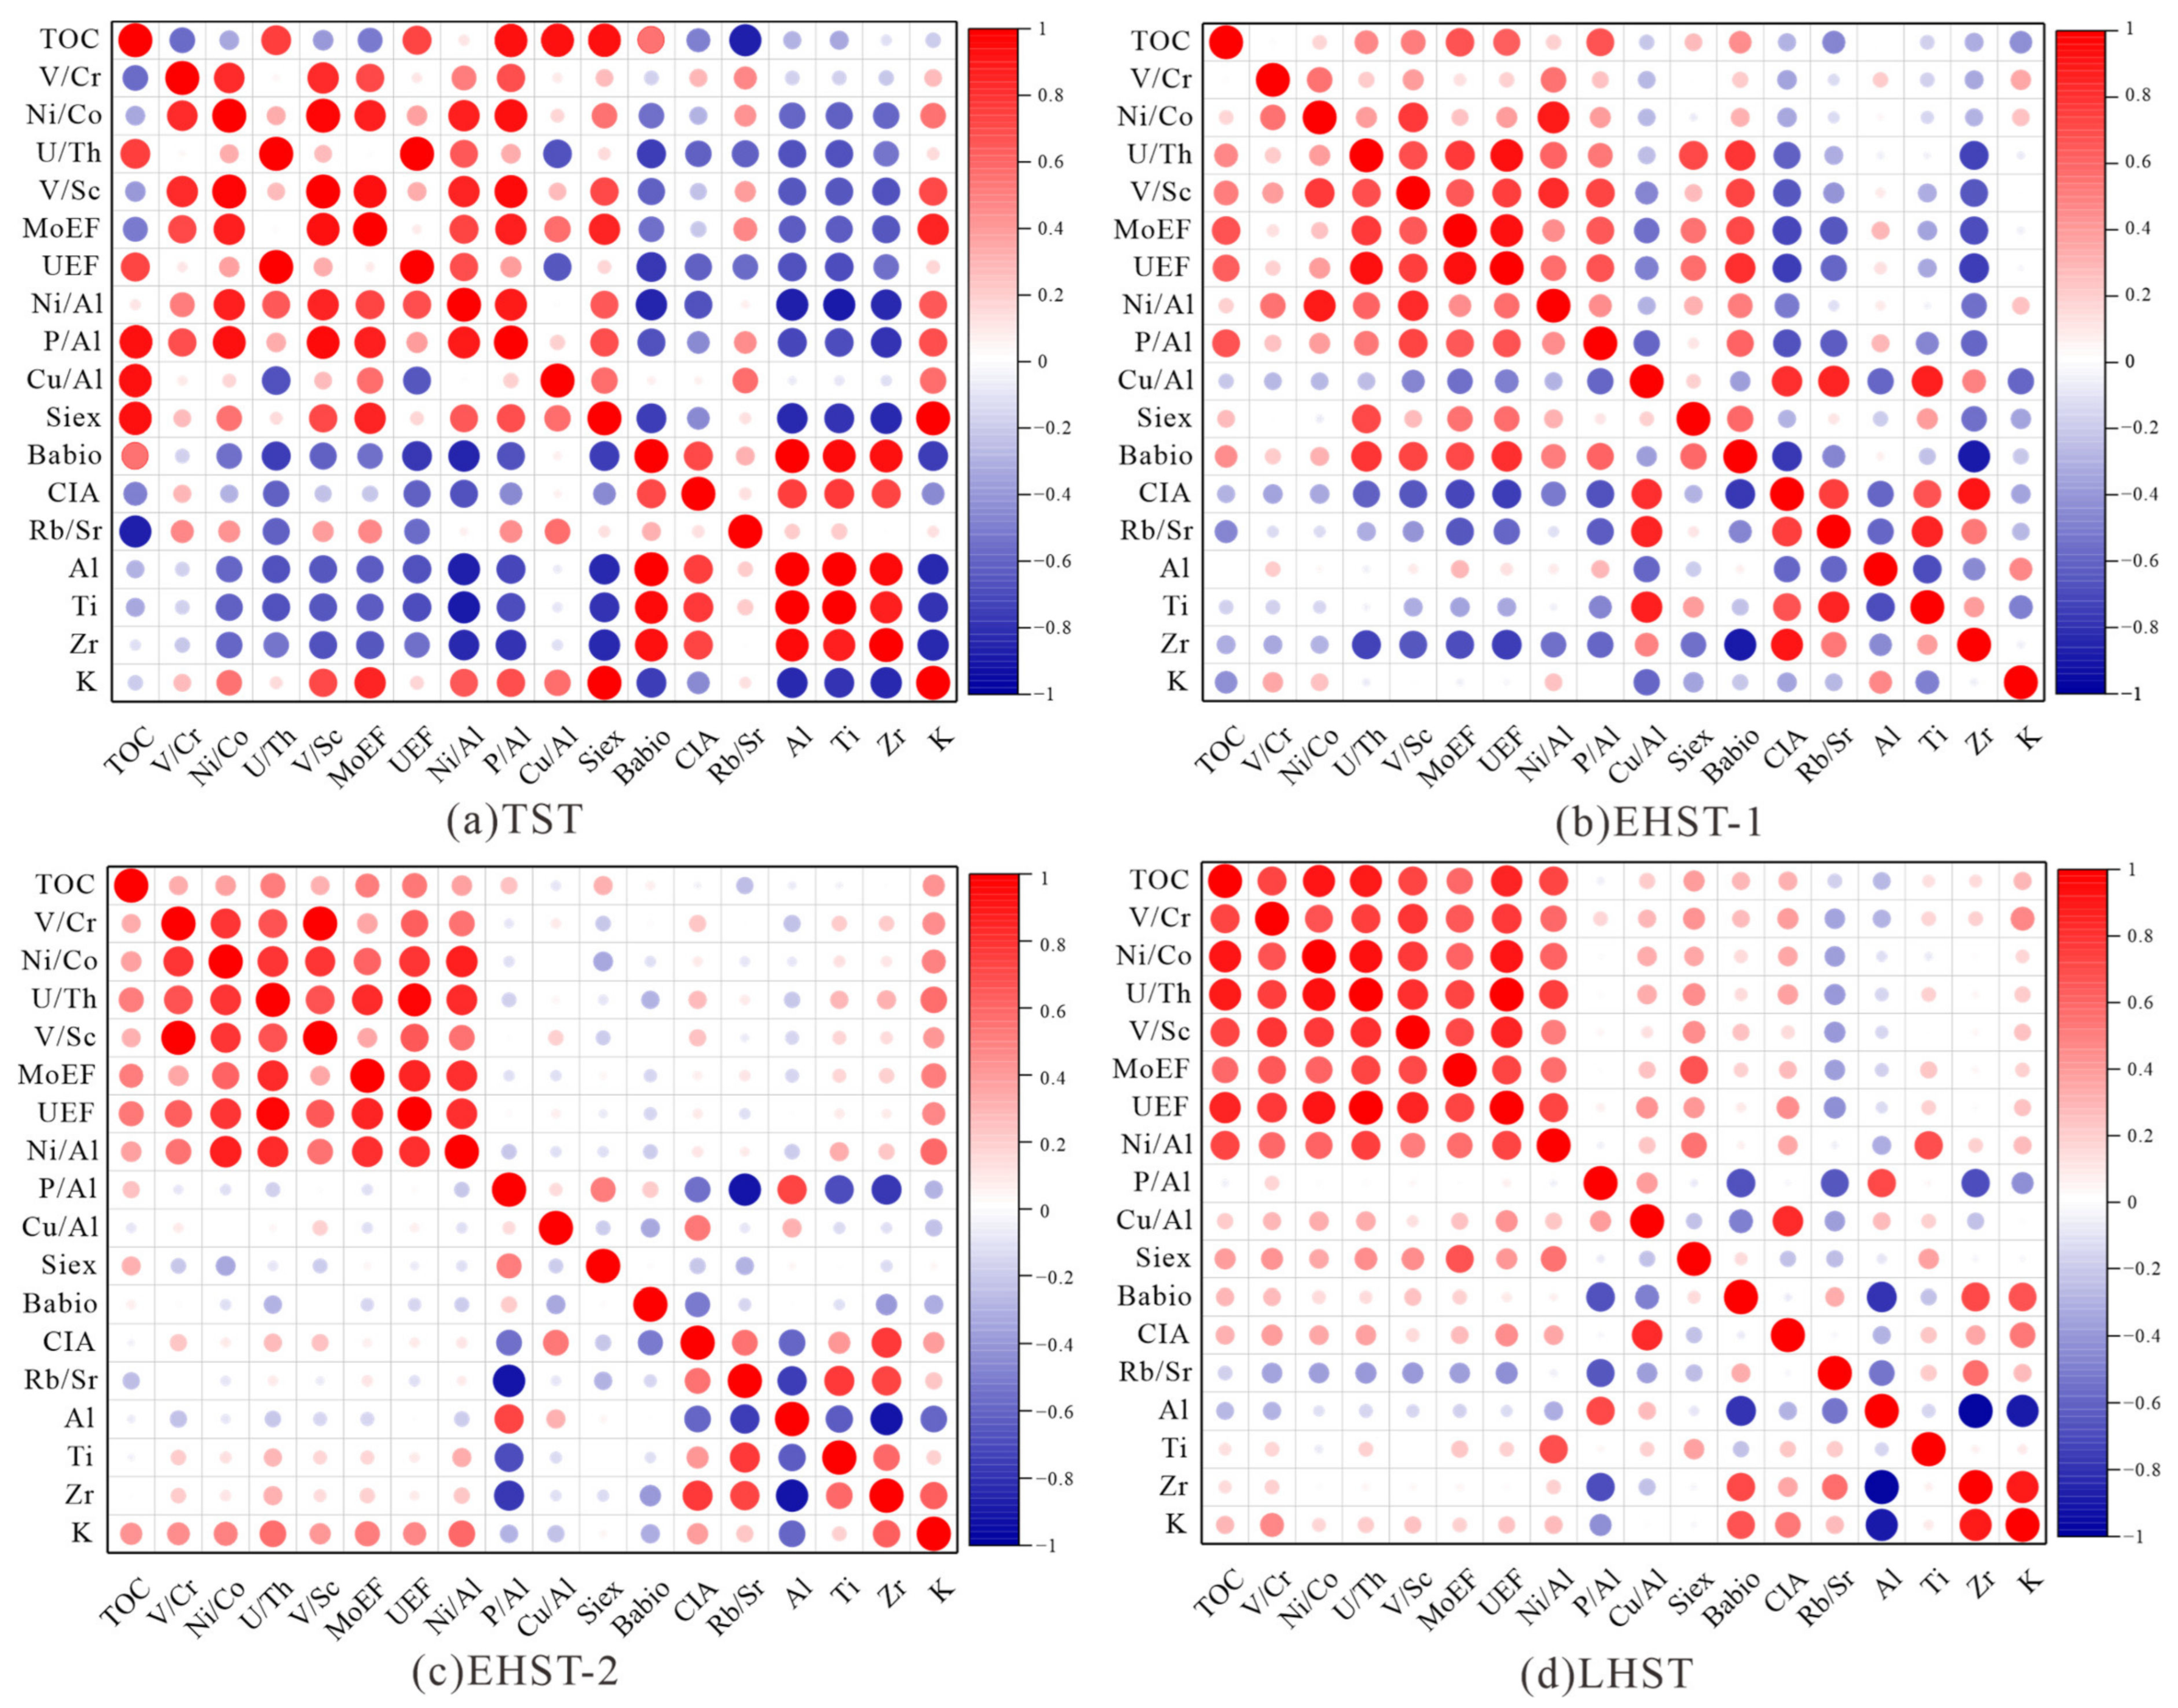
5.1. Environmental Significance of Geochemical Elements
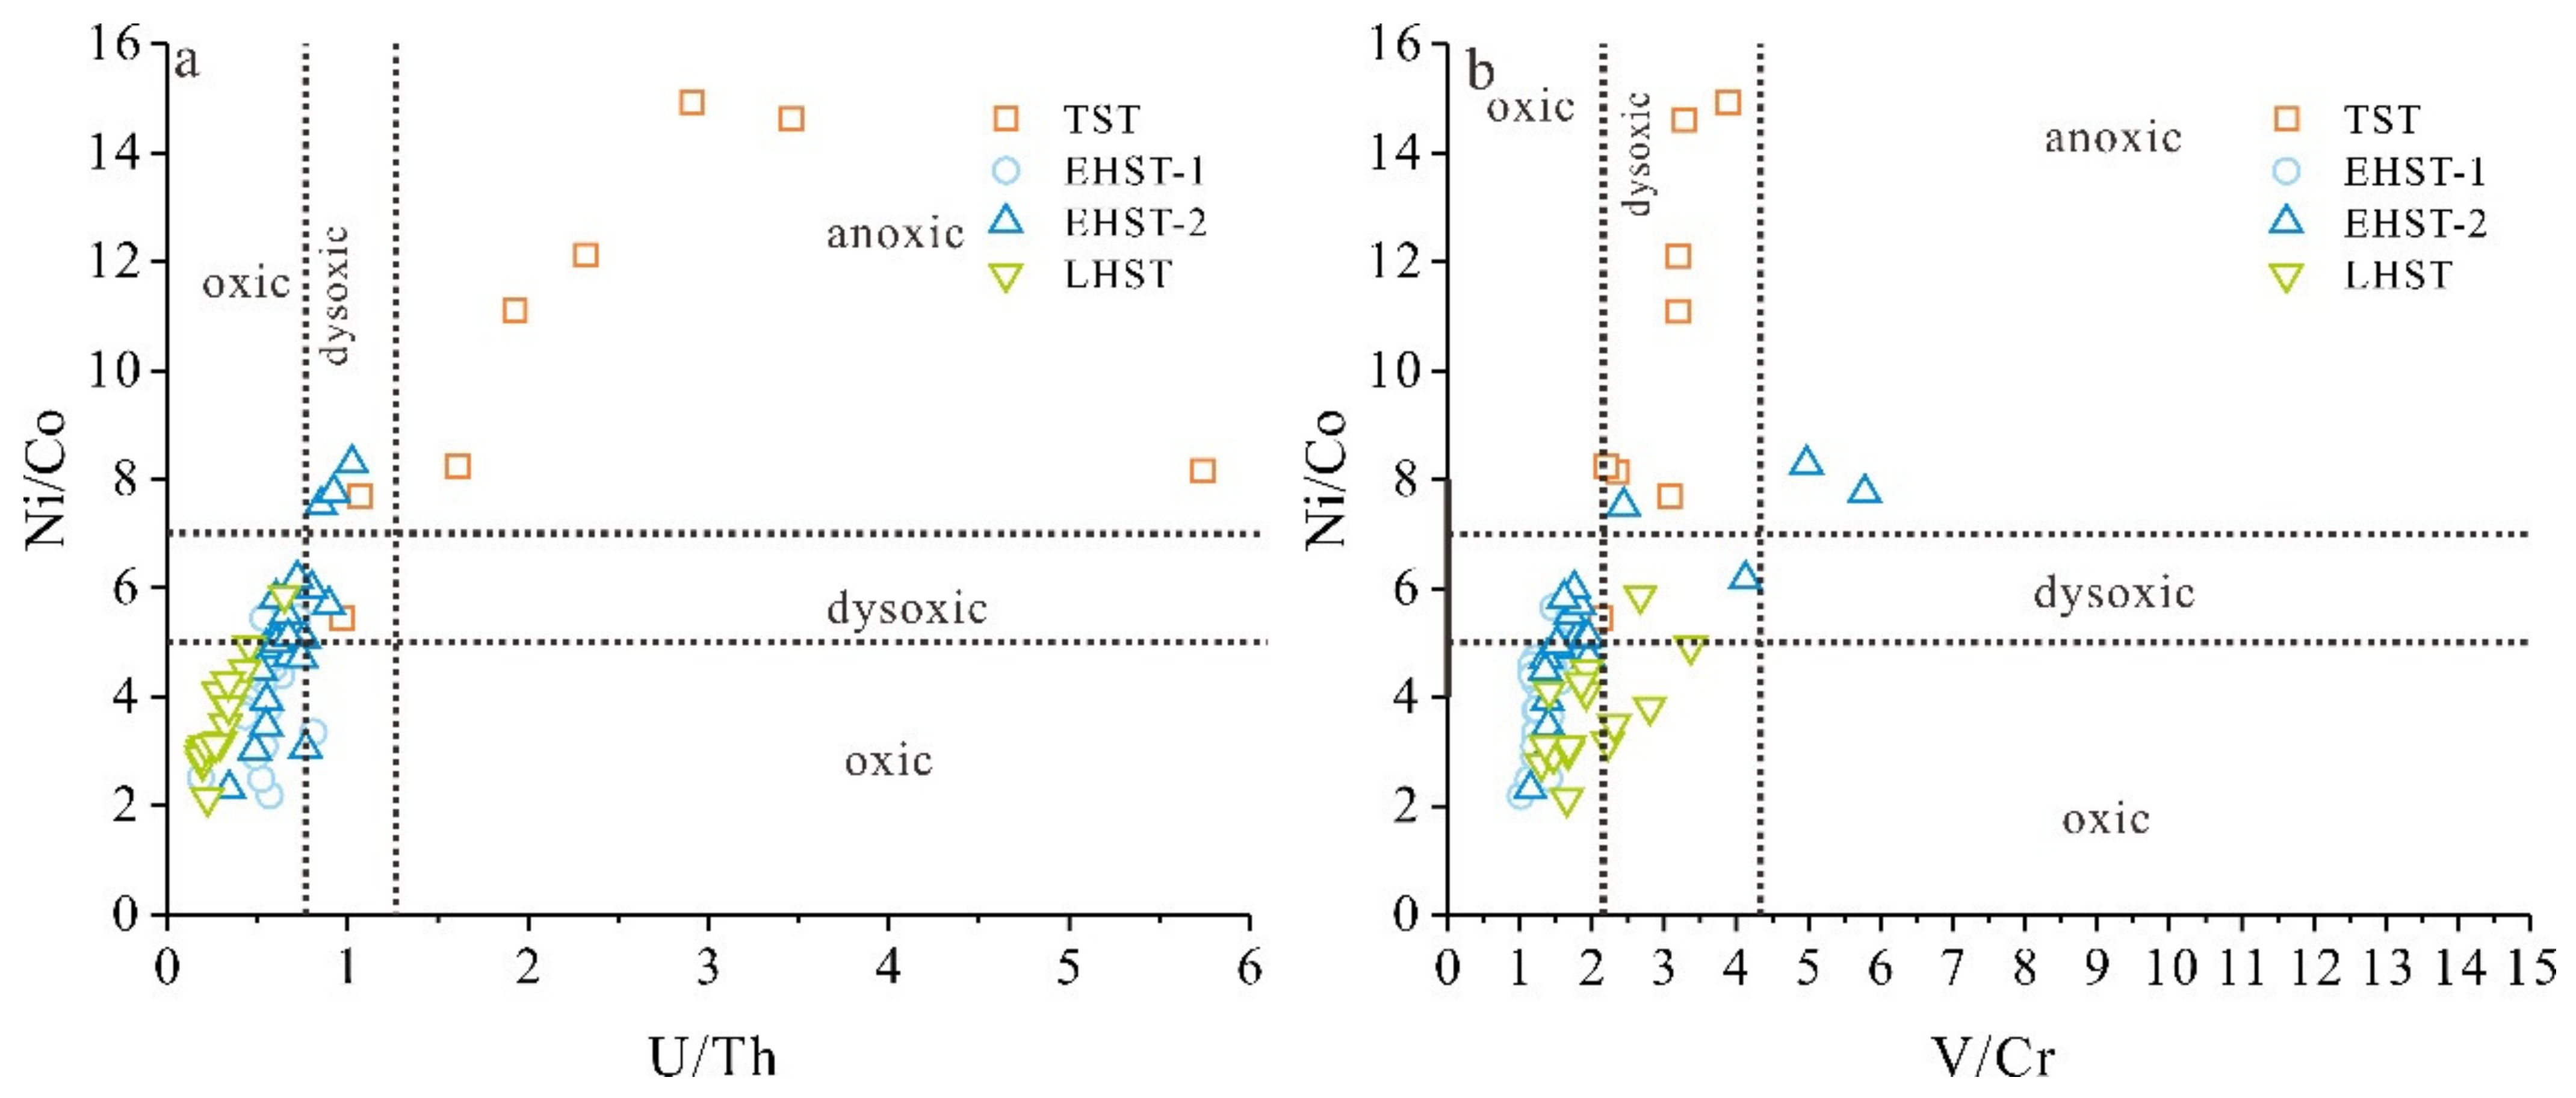
5.1.1. Paleoredox Condition
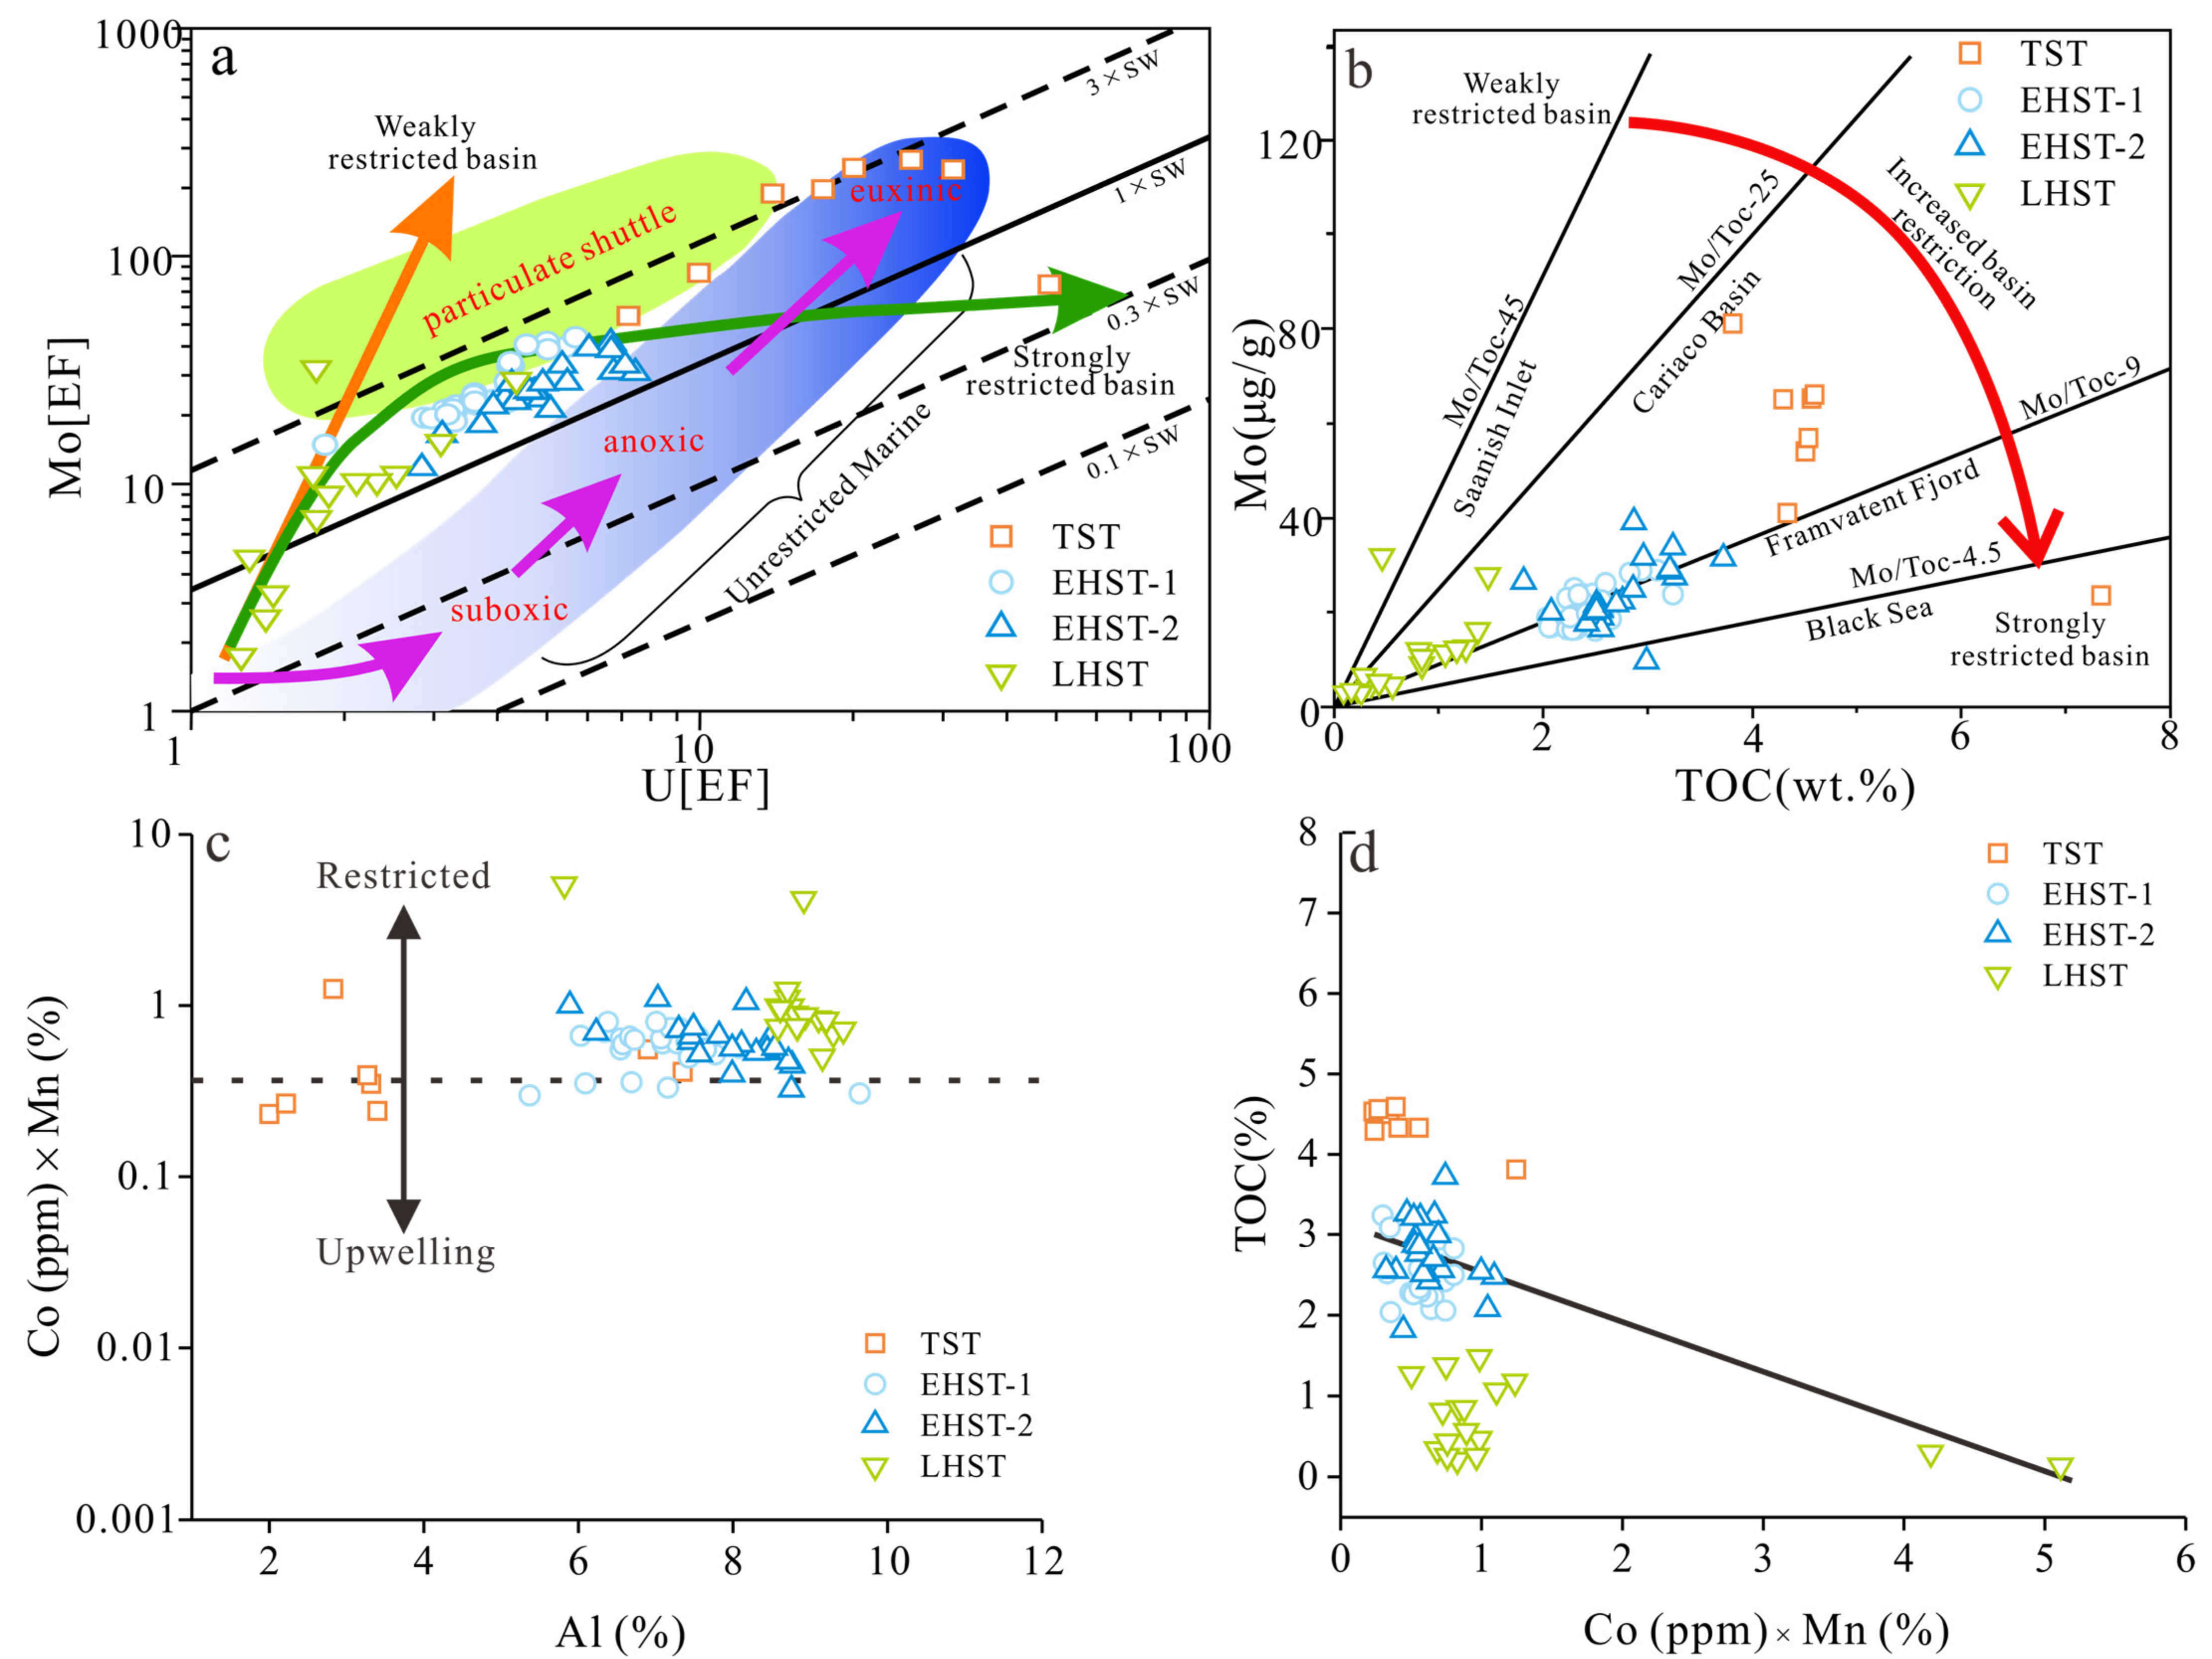
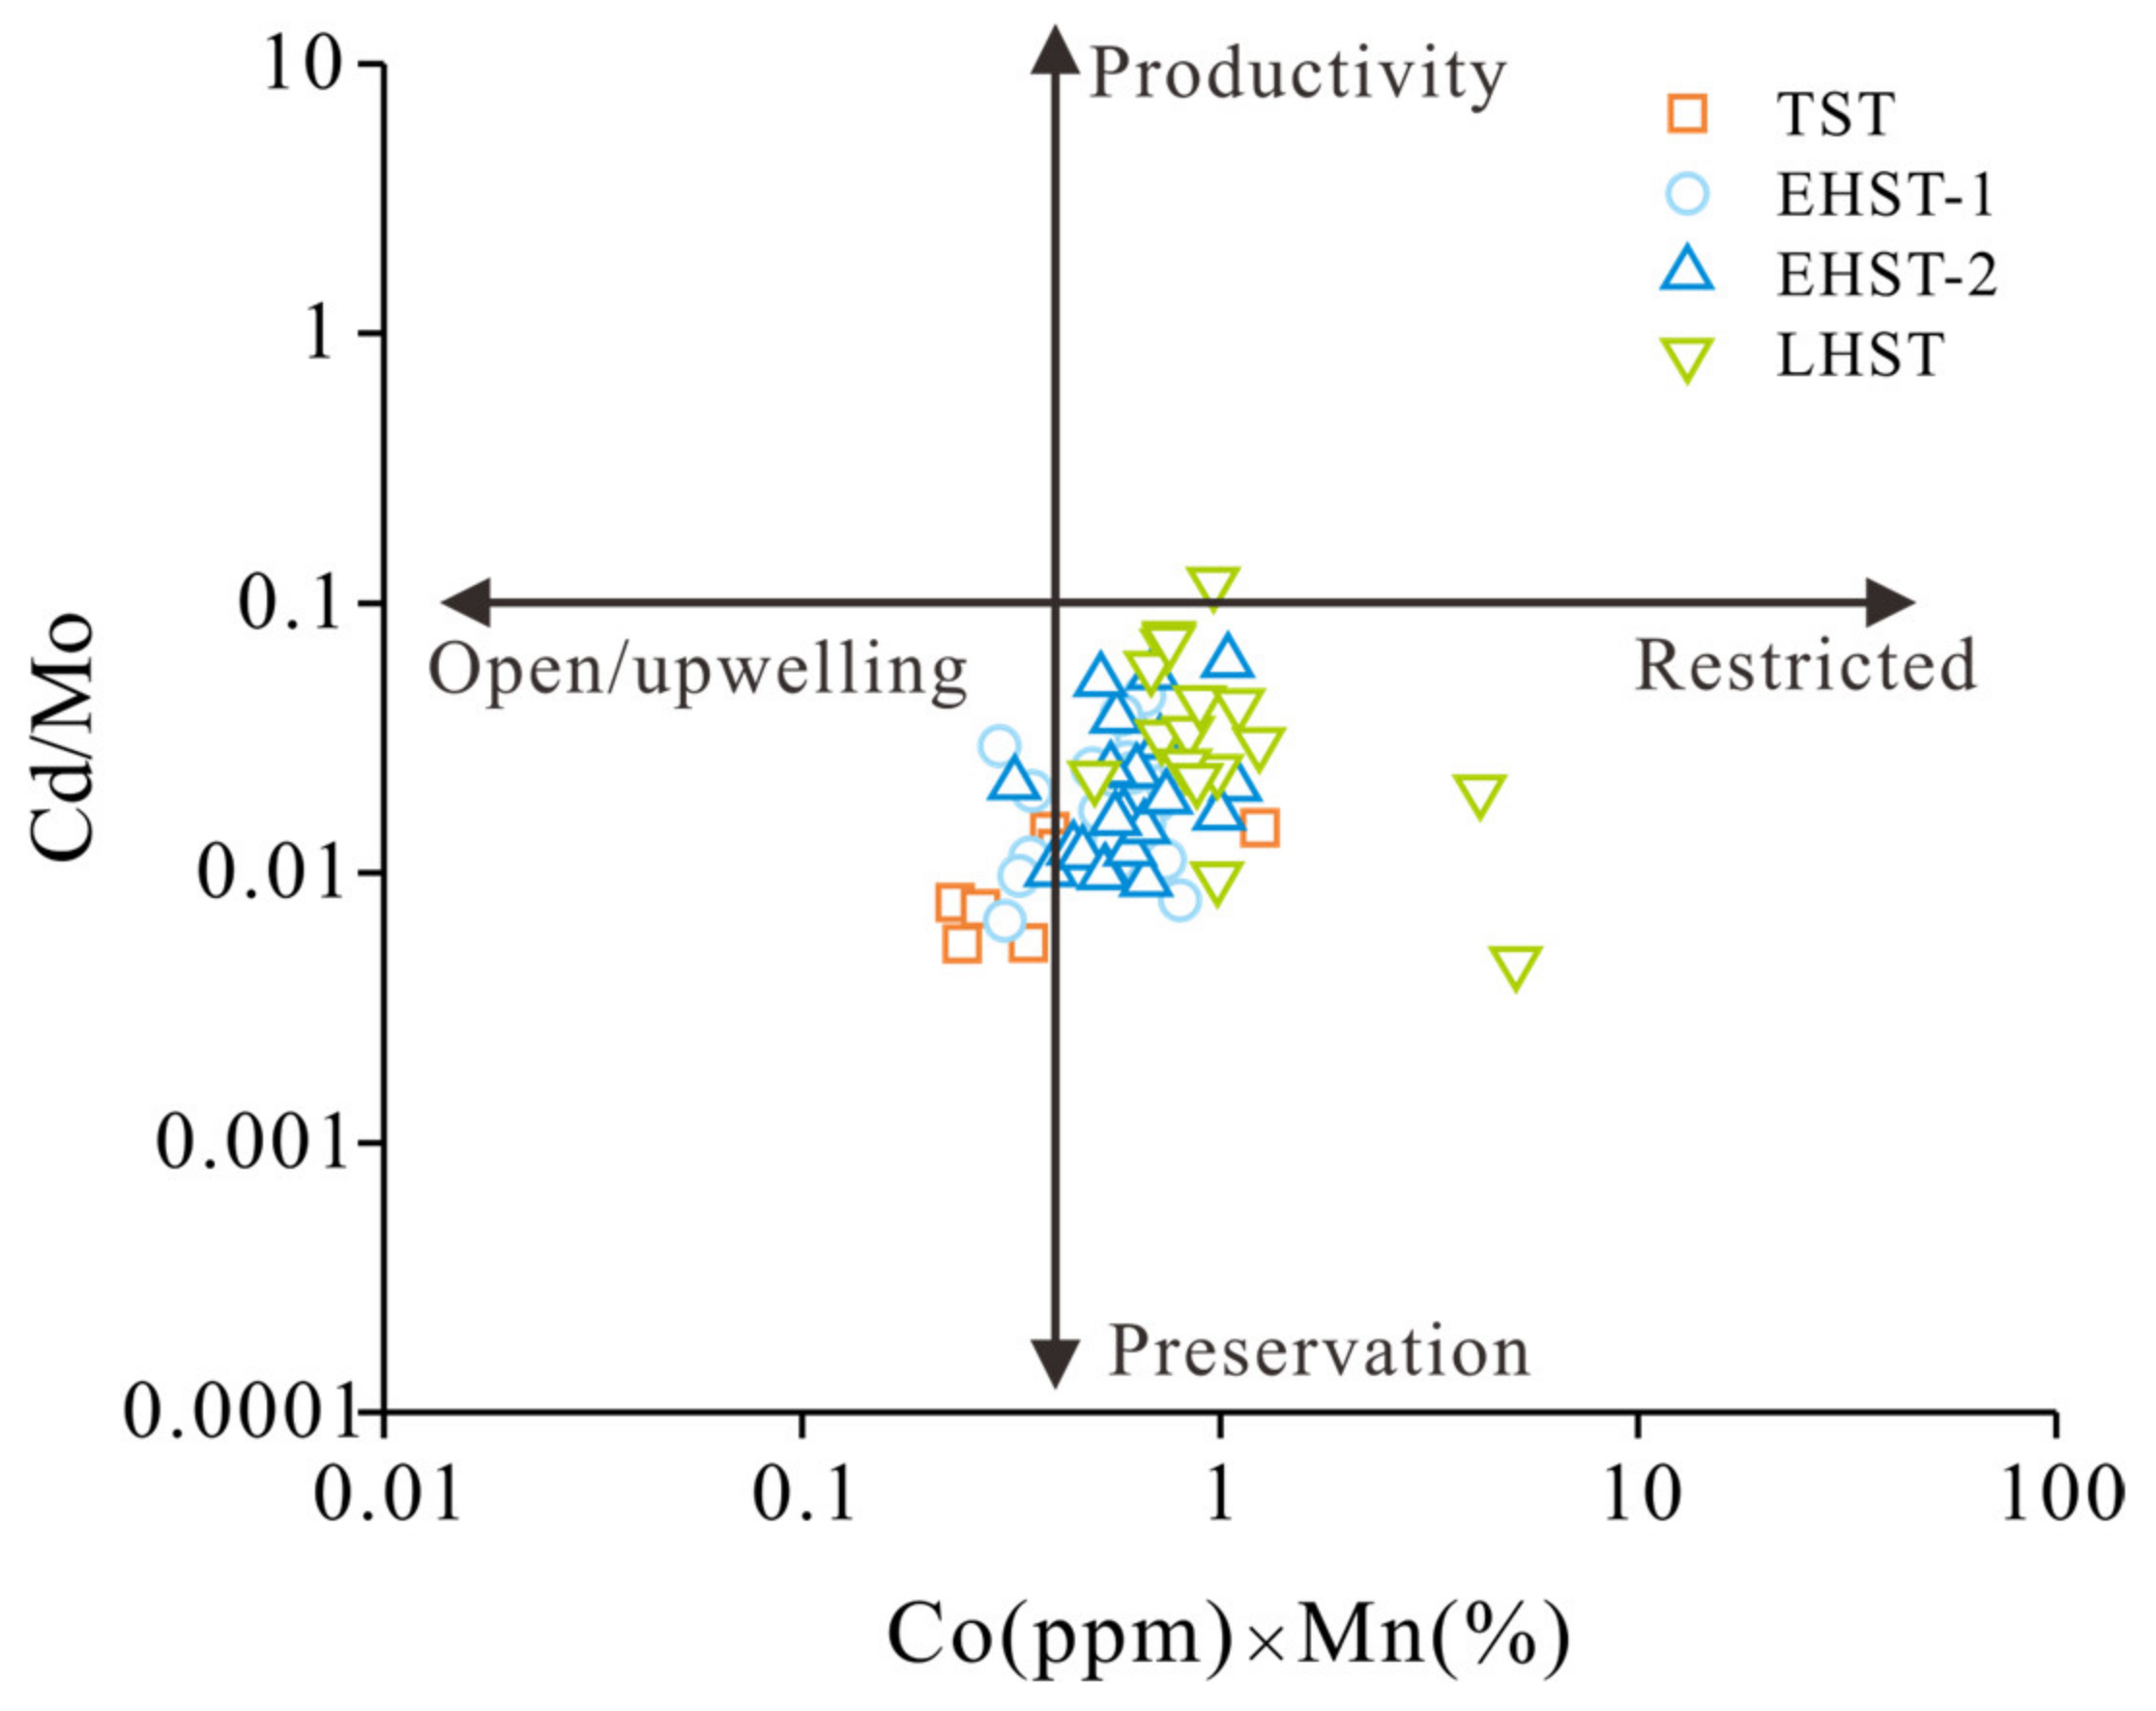
5.1.2. Degree of Water Restriction
5.1.3. Paleoproductivity
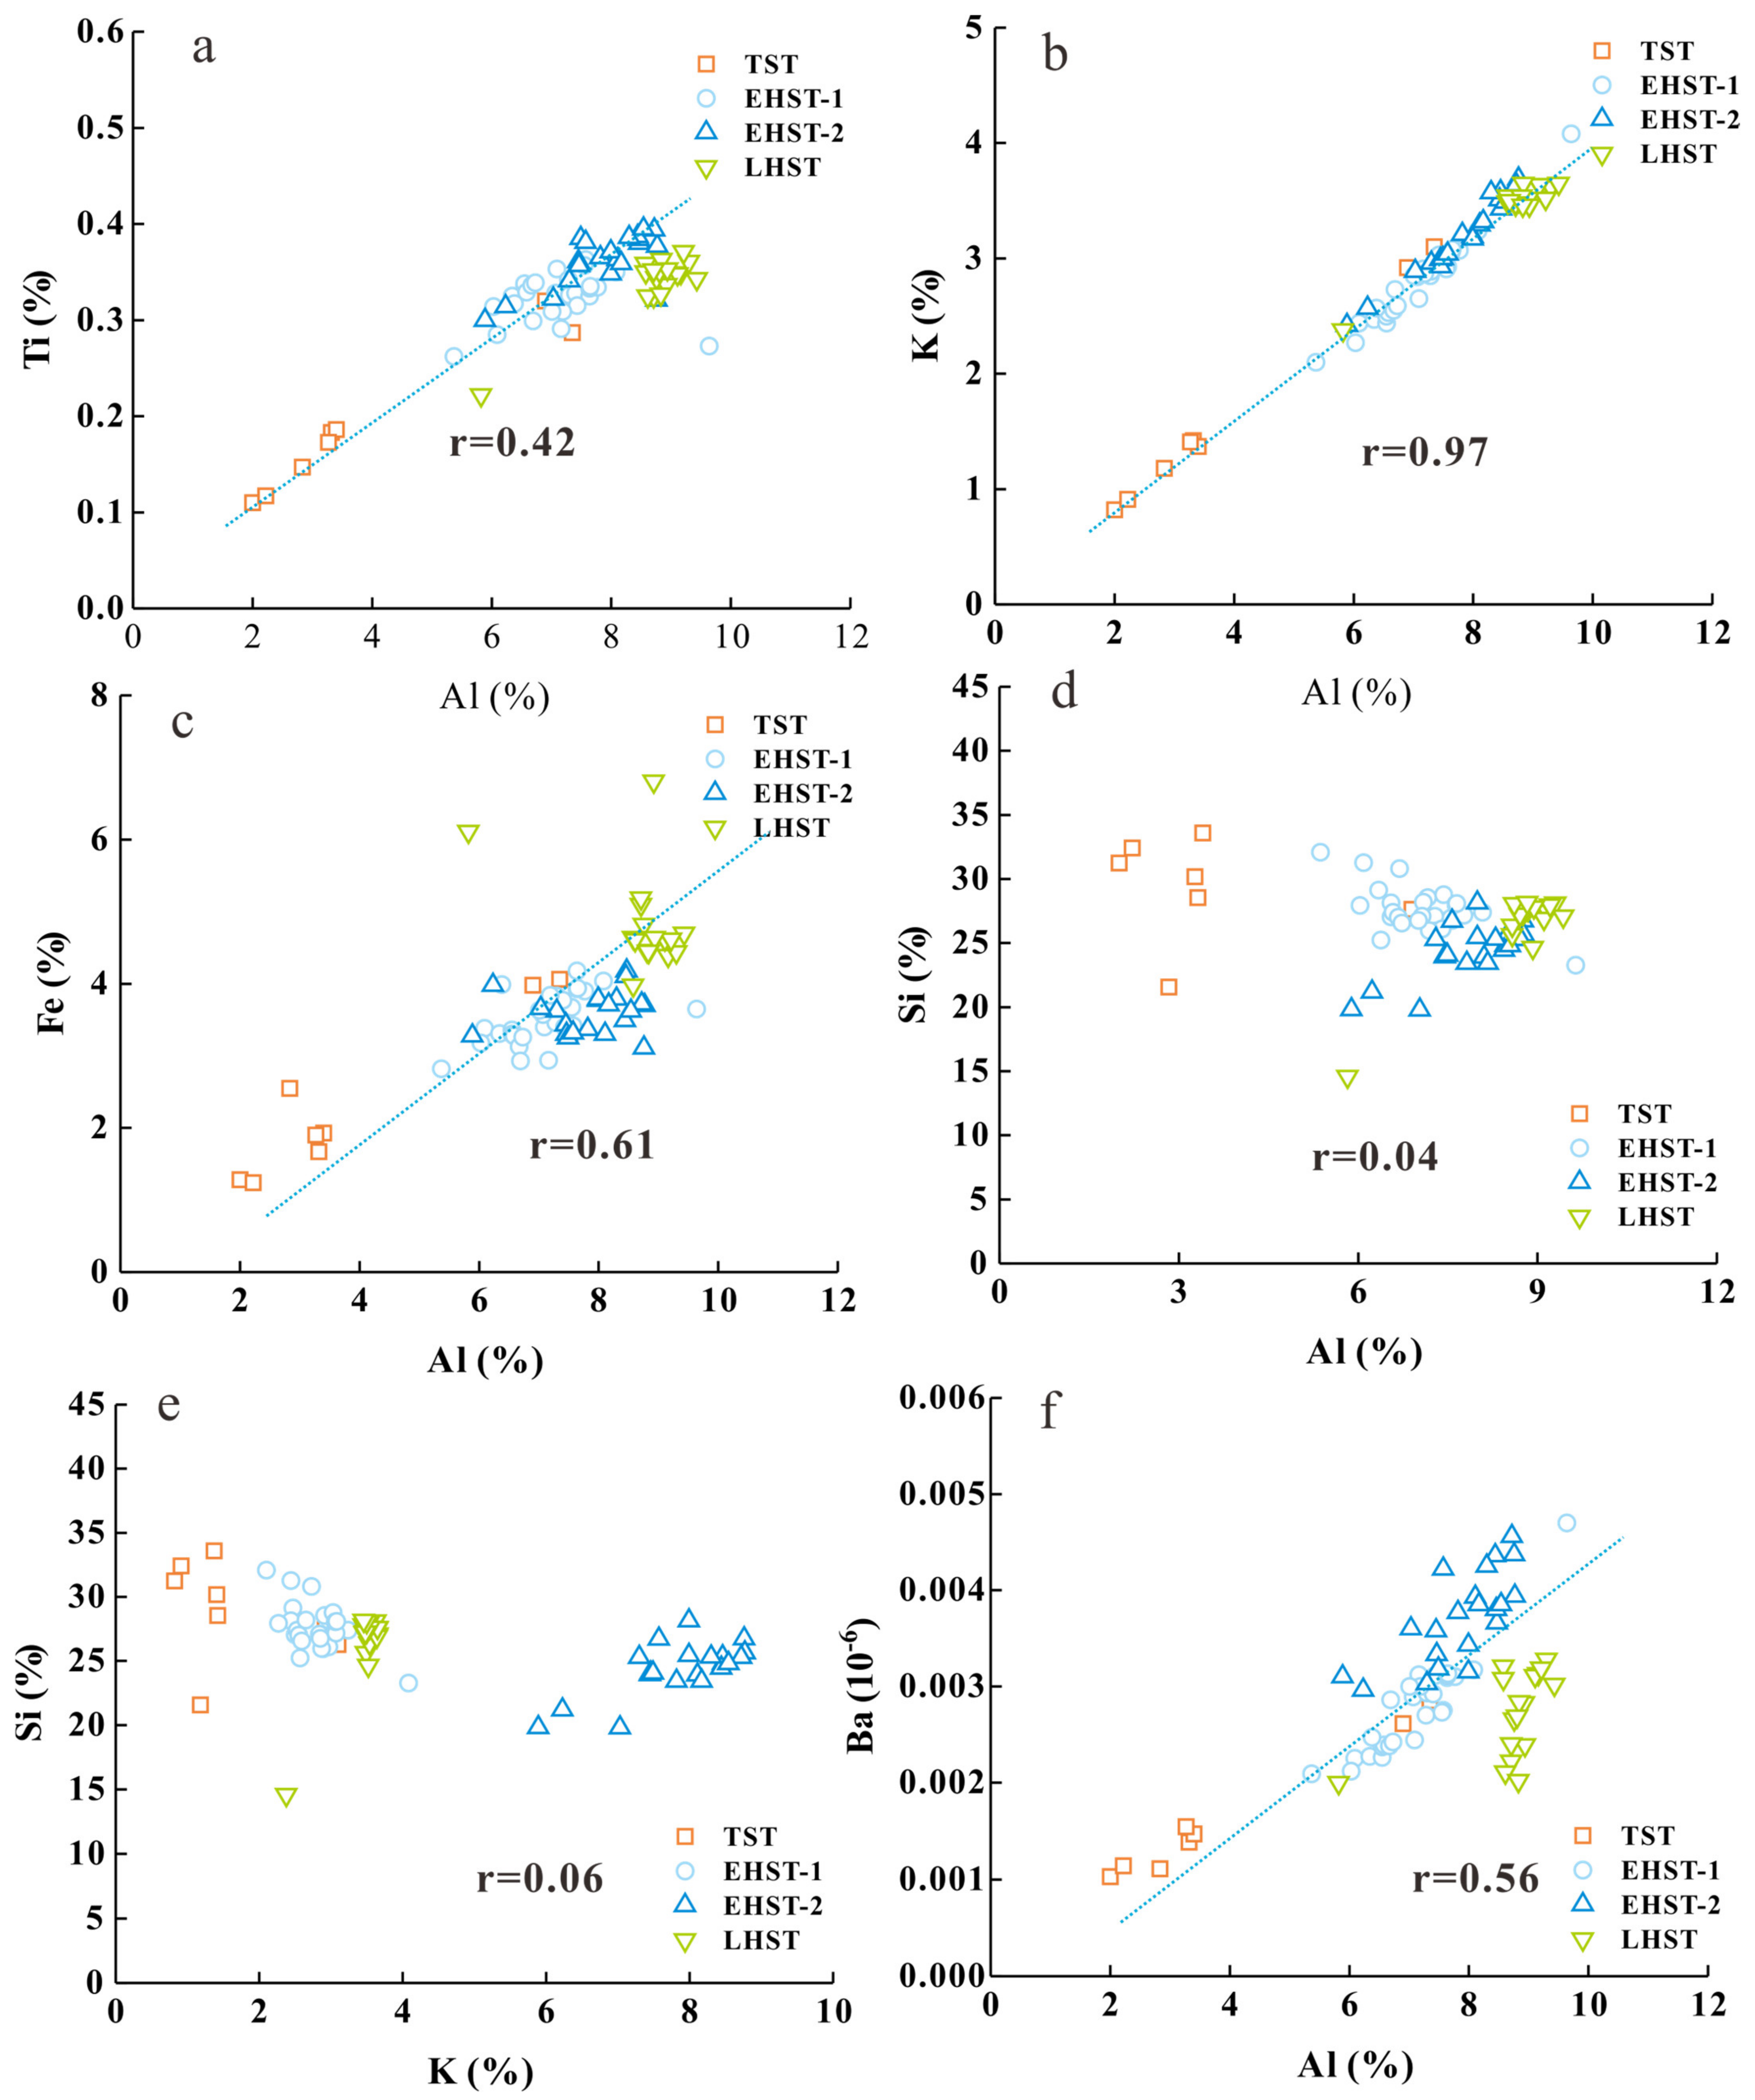
5.1.4. Terrigenous Detrital Inputs
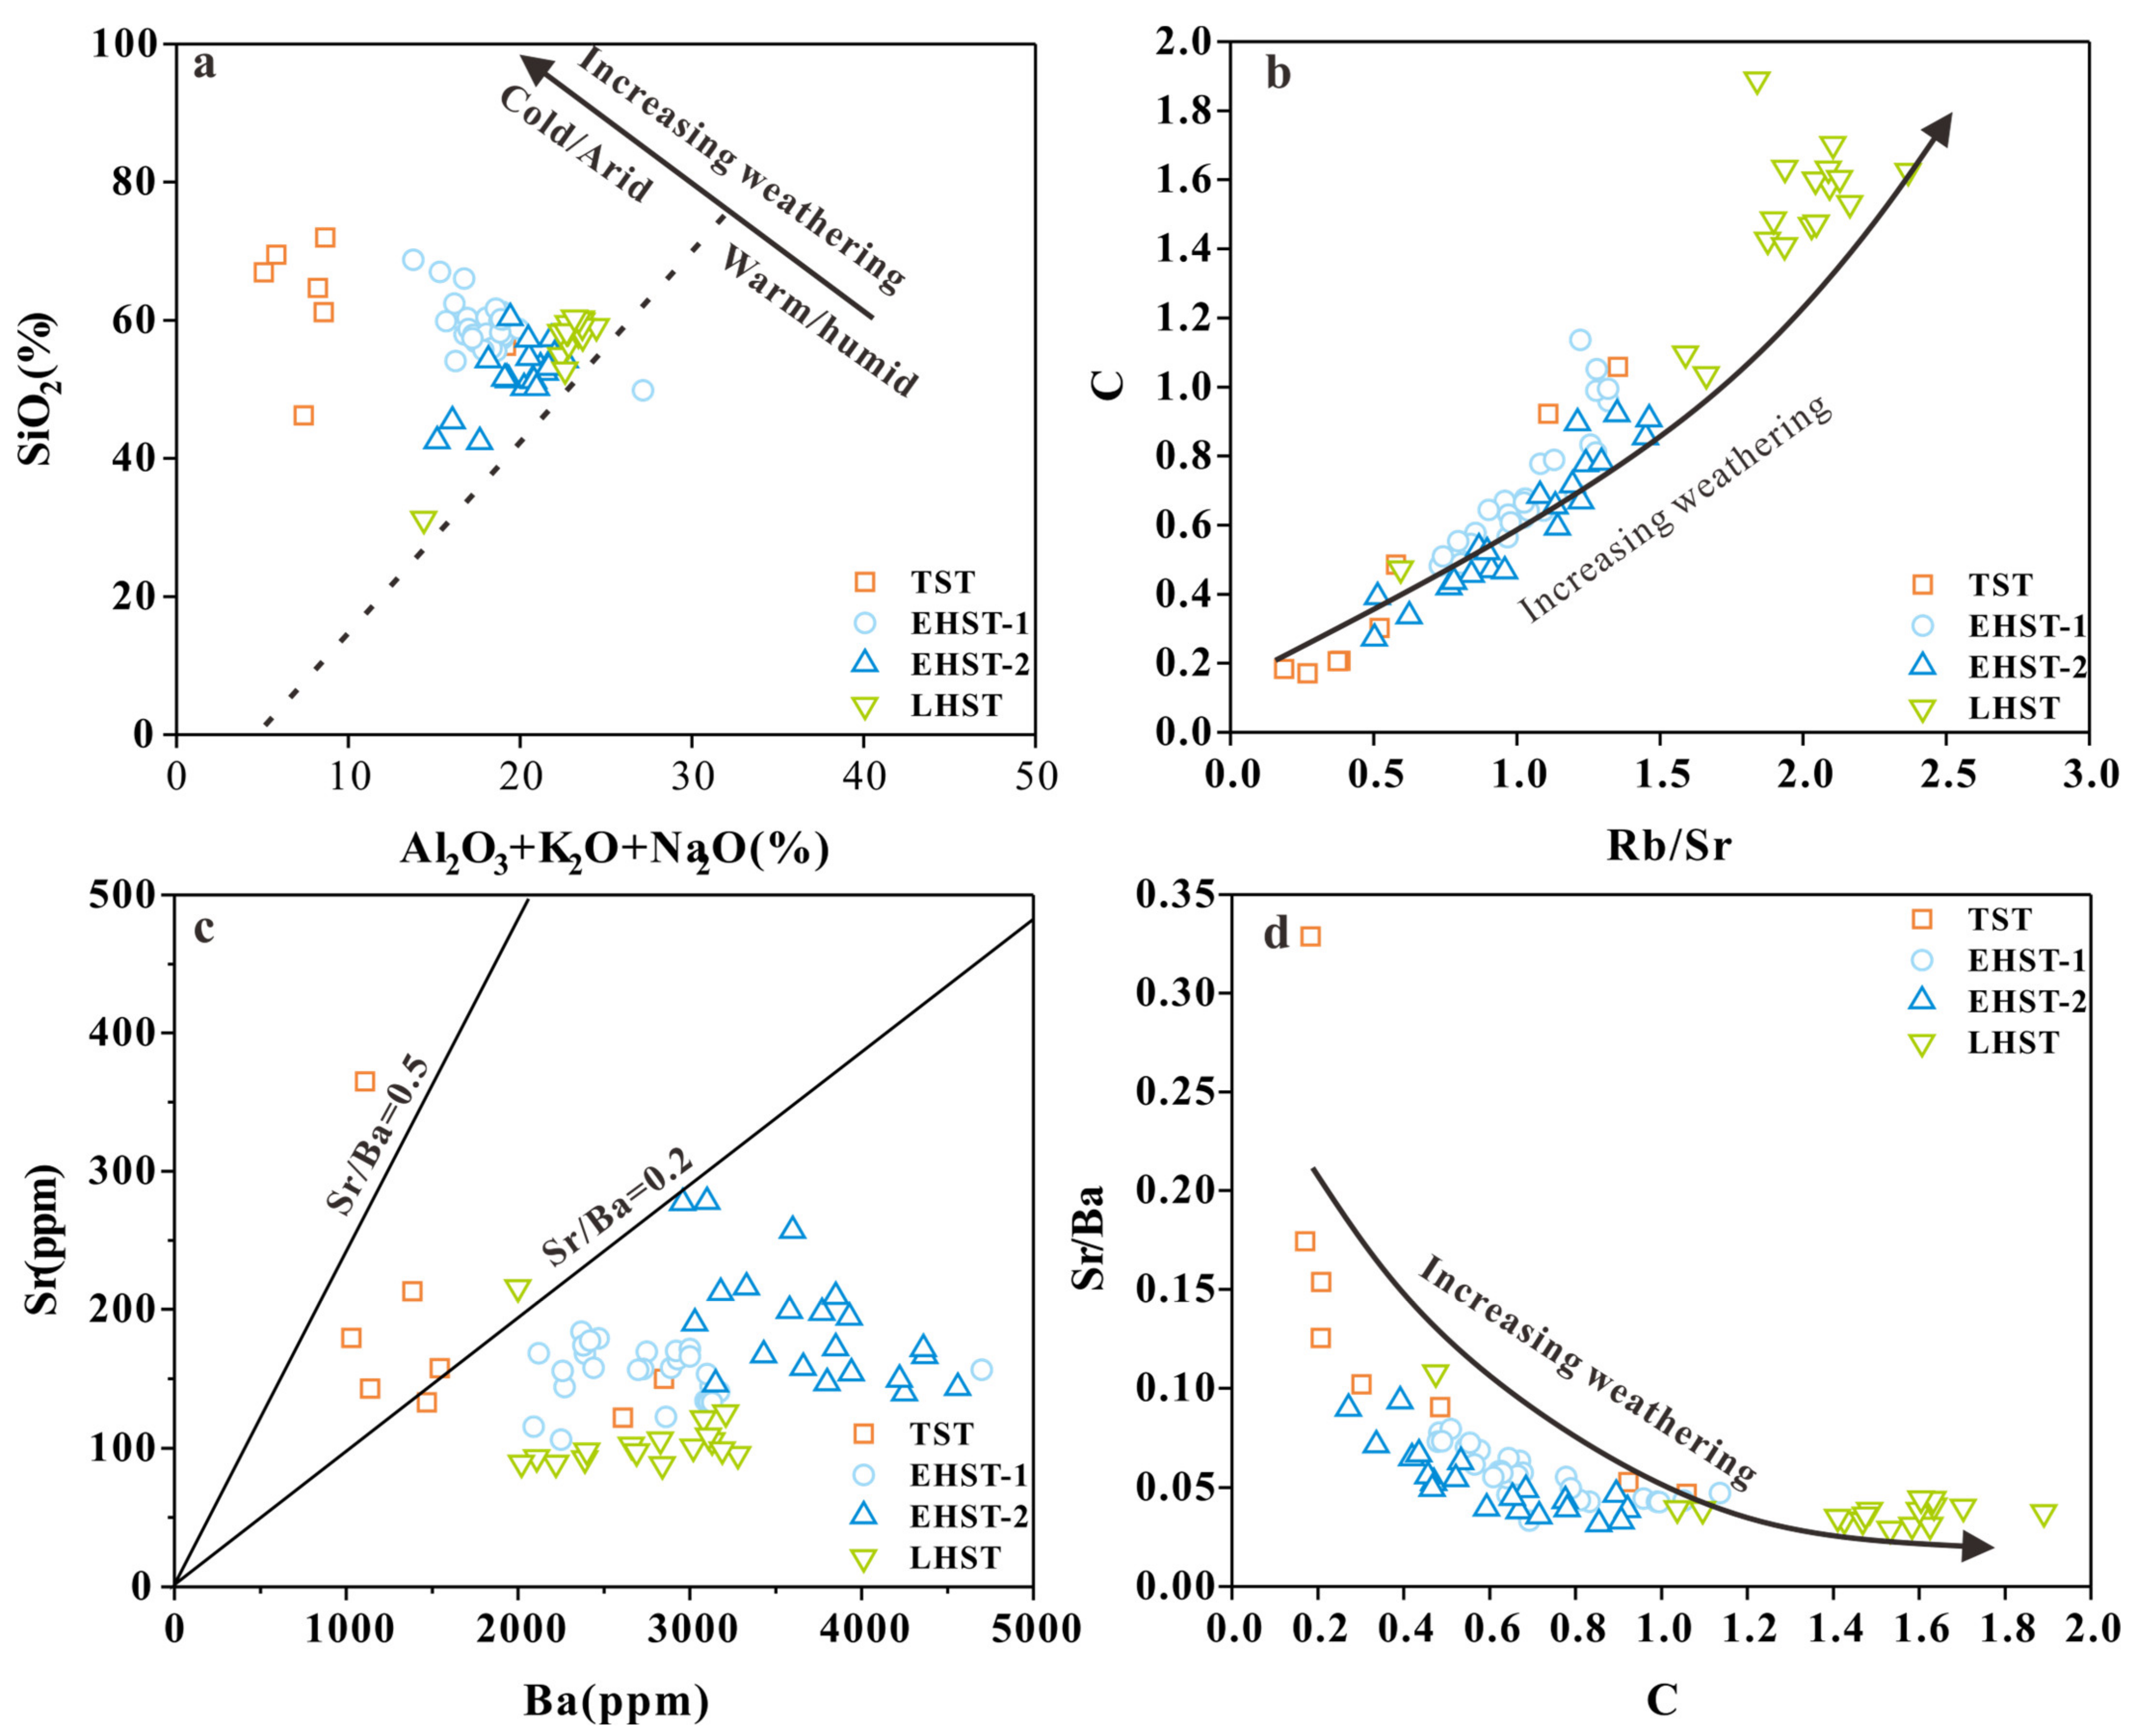
5.1.5. Paleoclimate
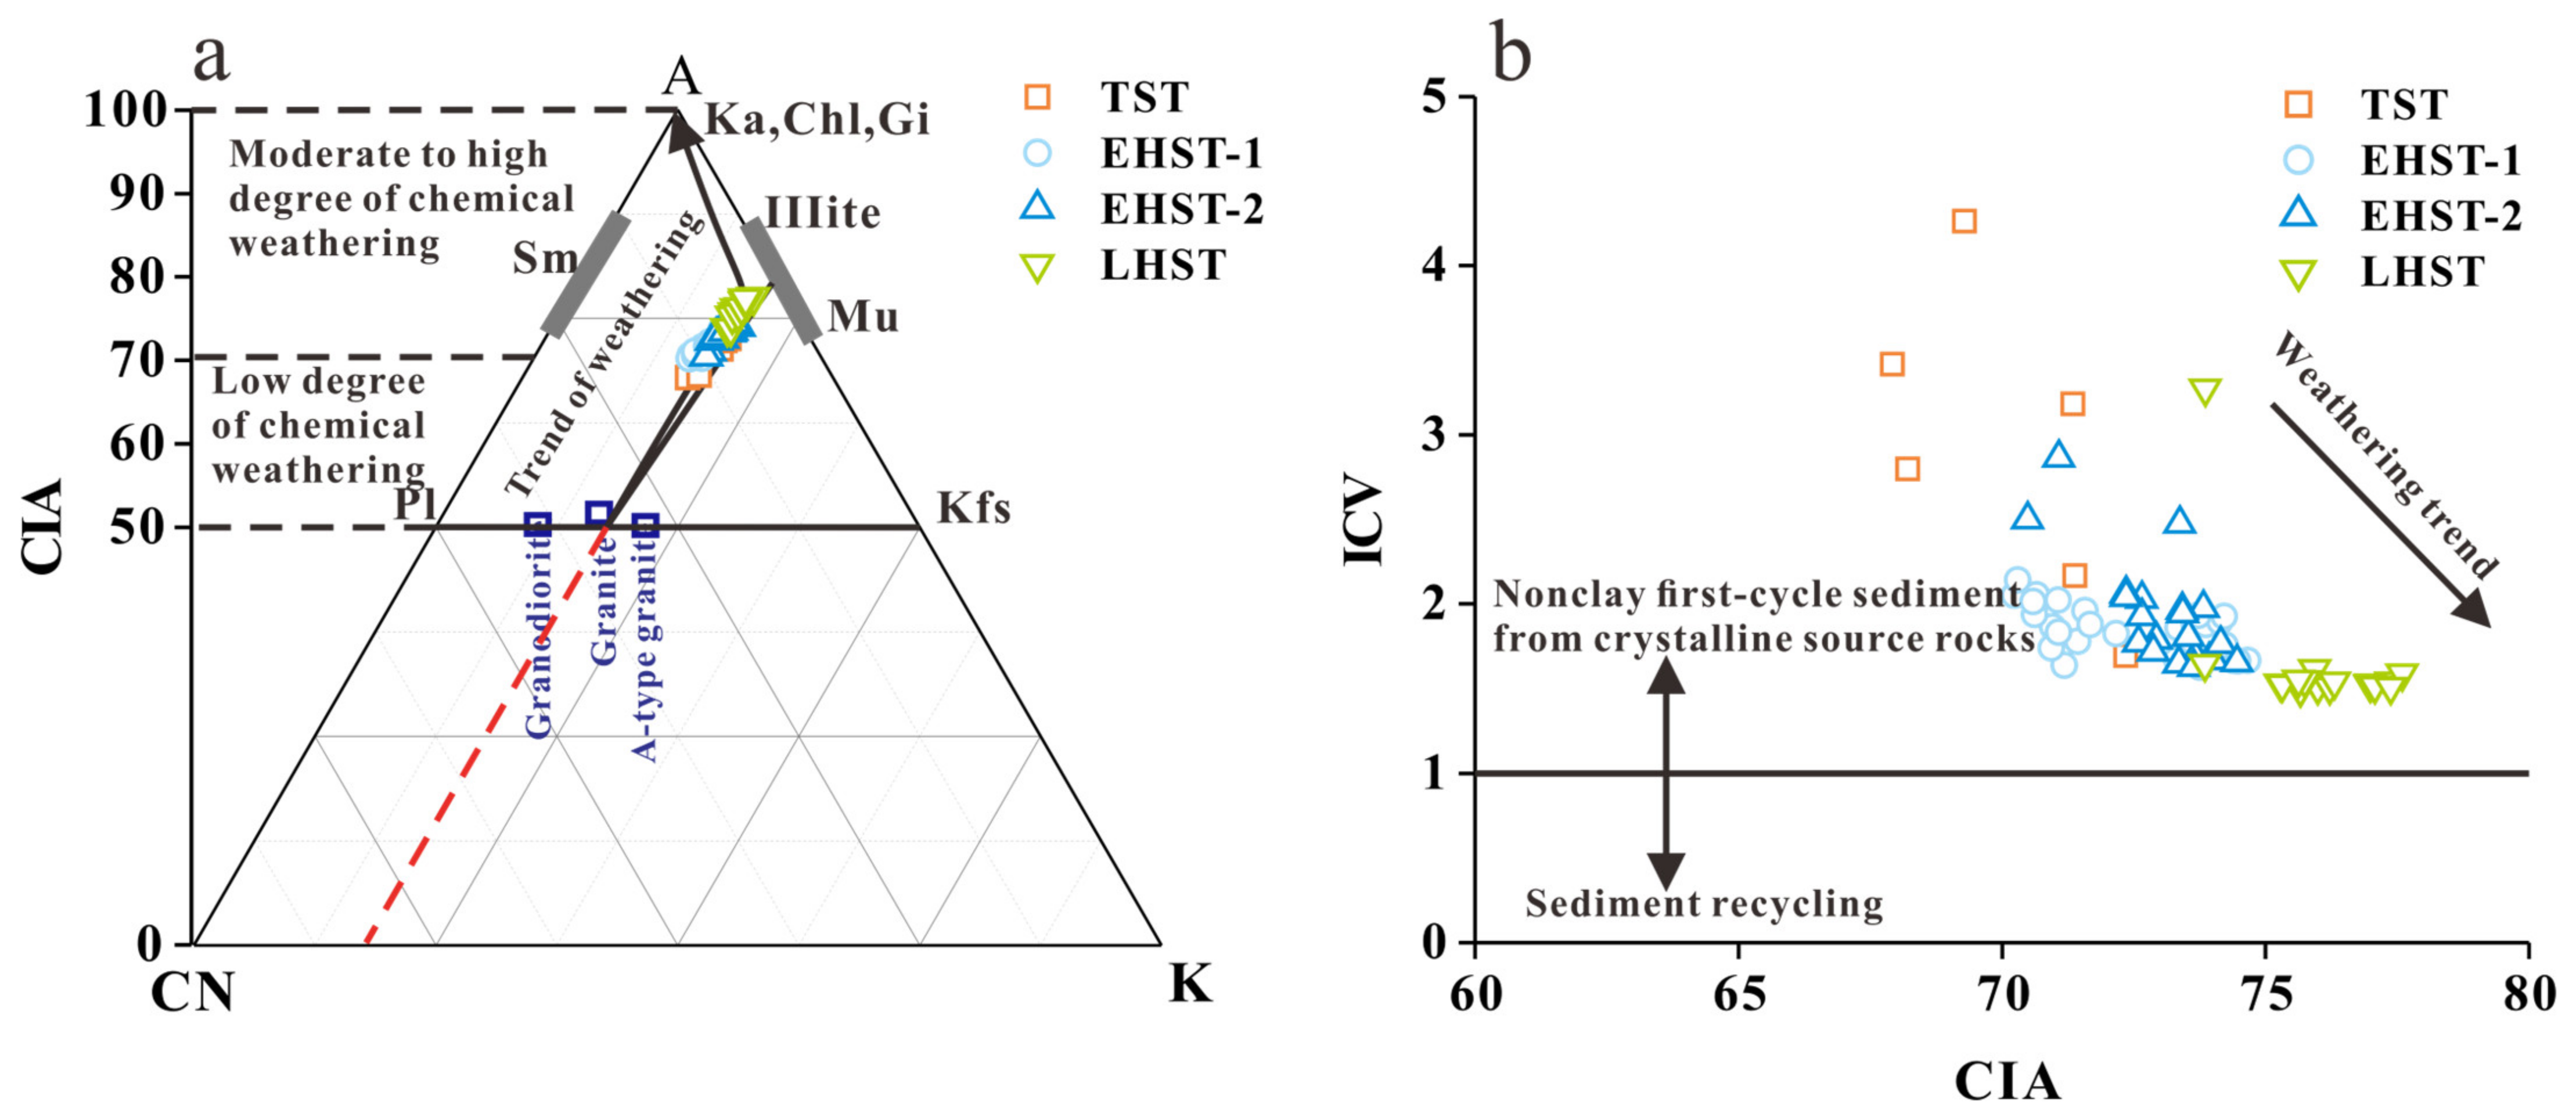
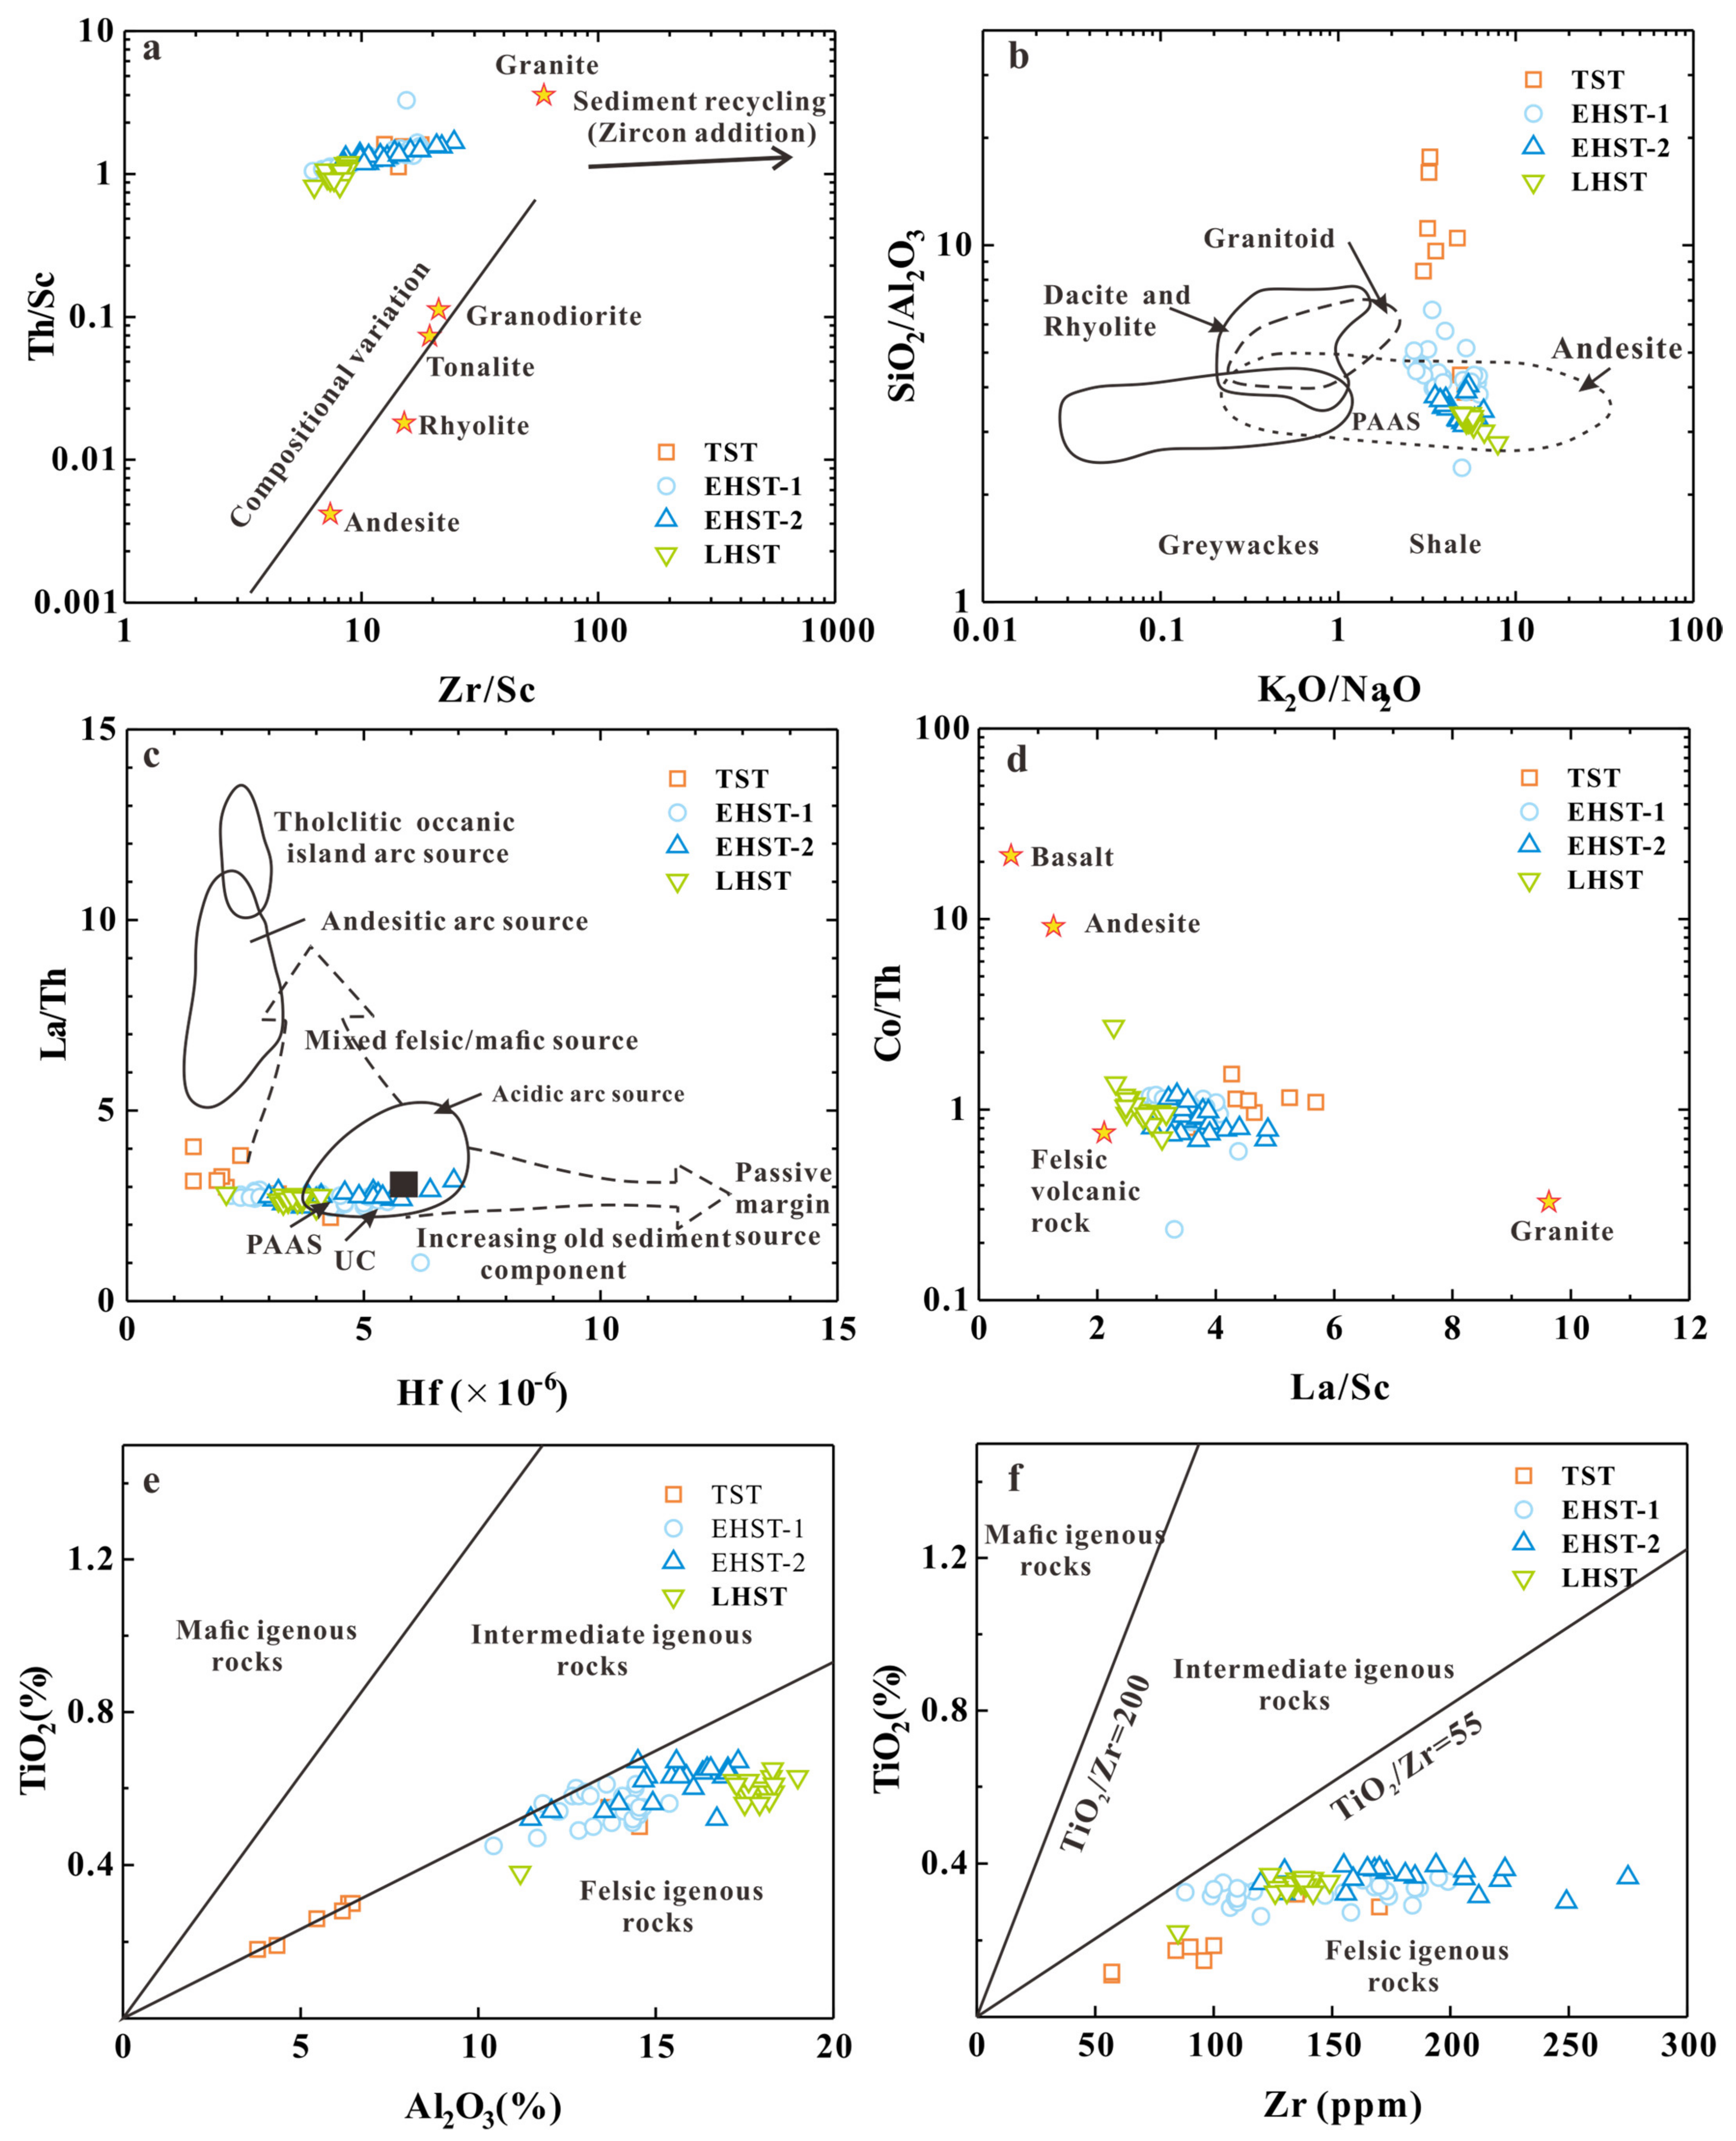
5.1.6. Provenances
5.2. Main Controlling Factors of Organic Matter Accumulation
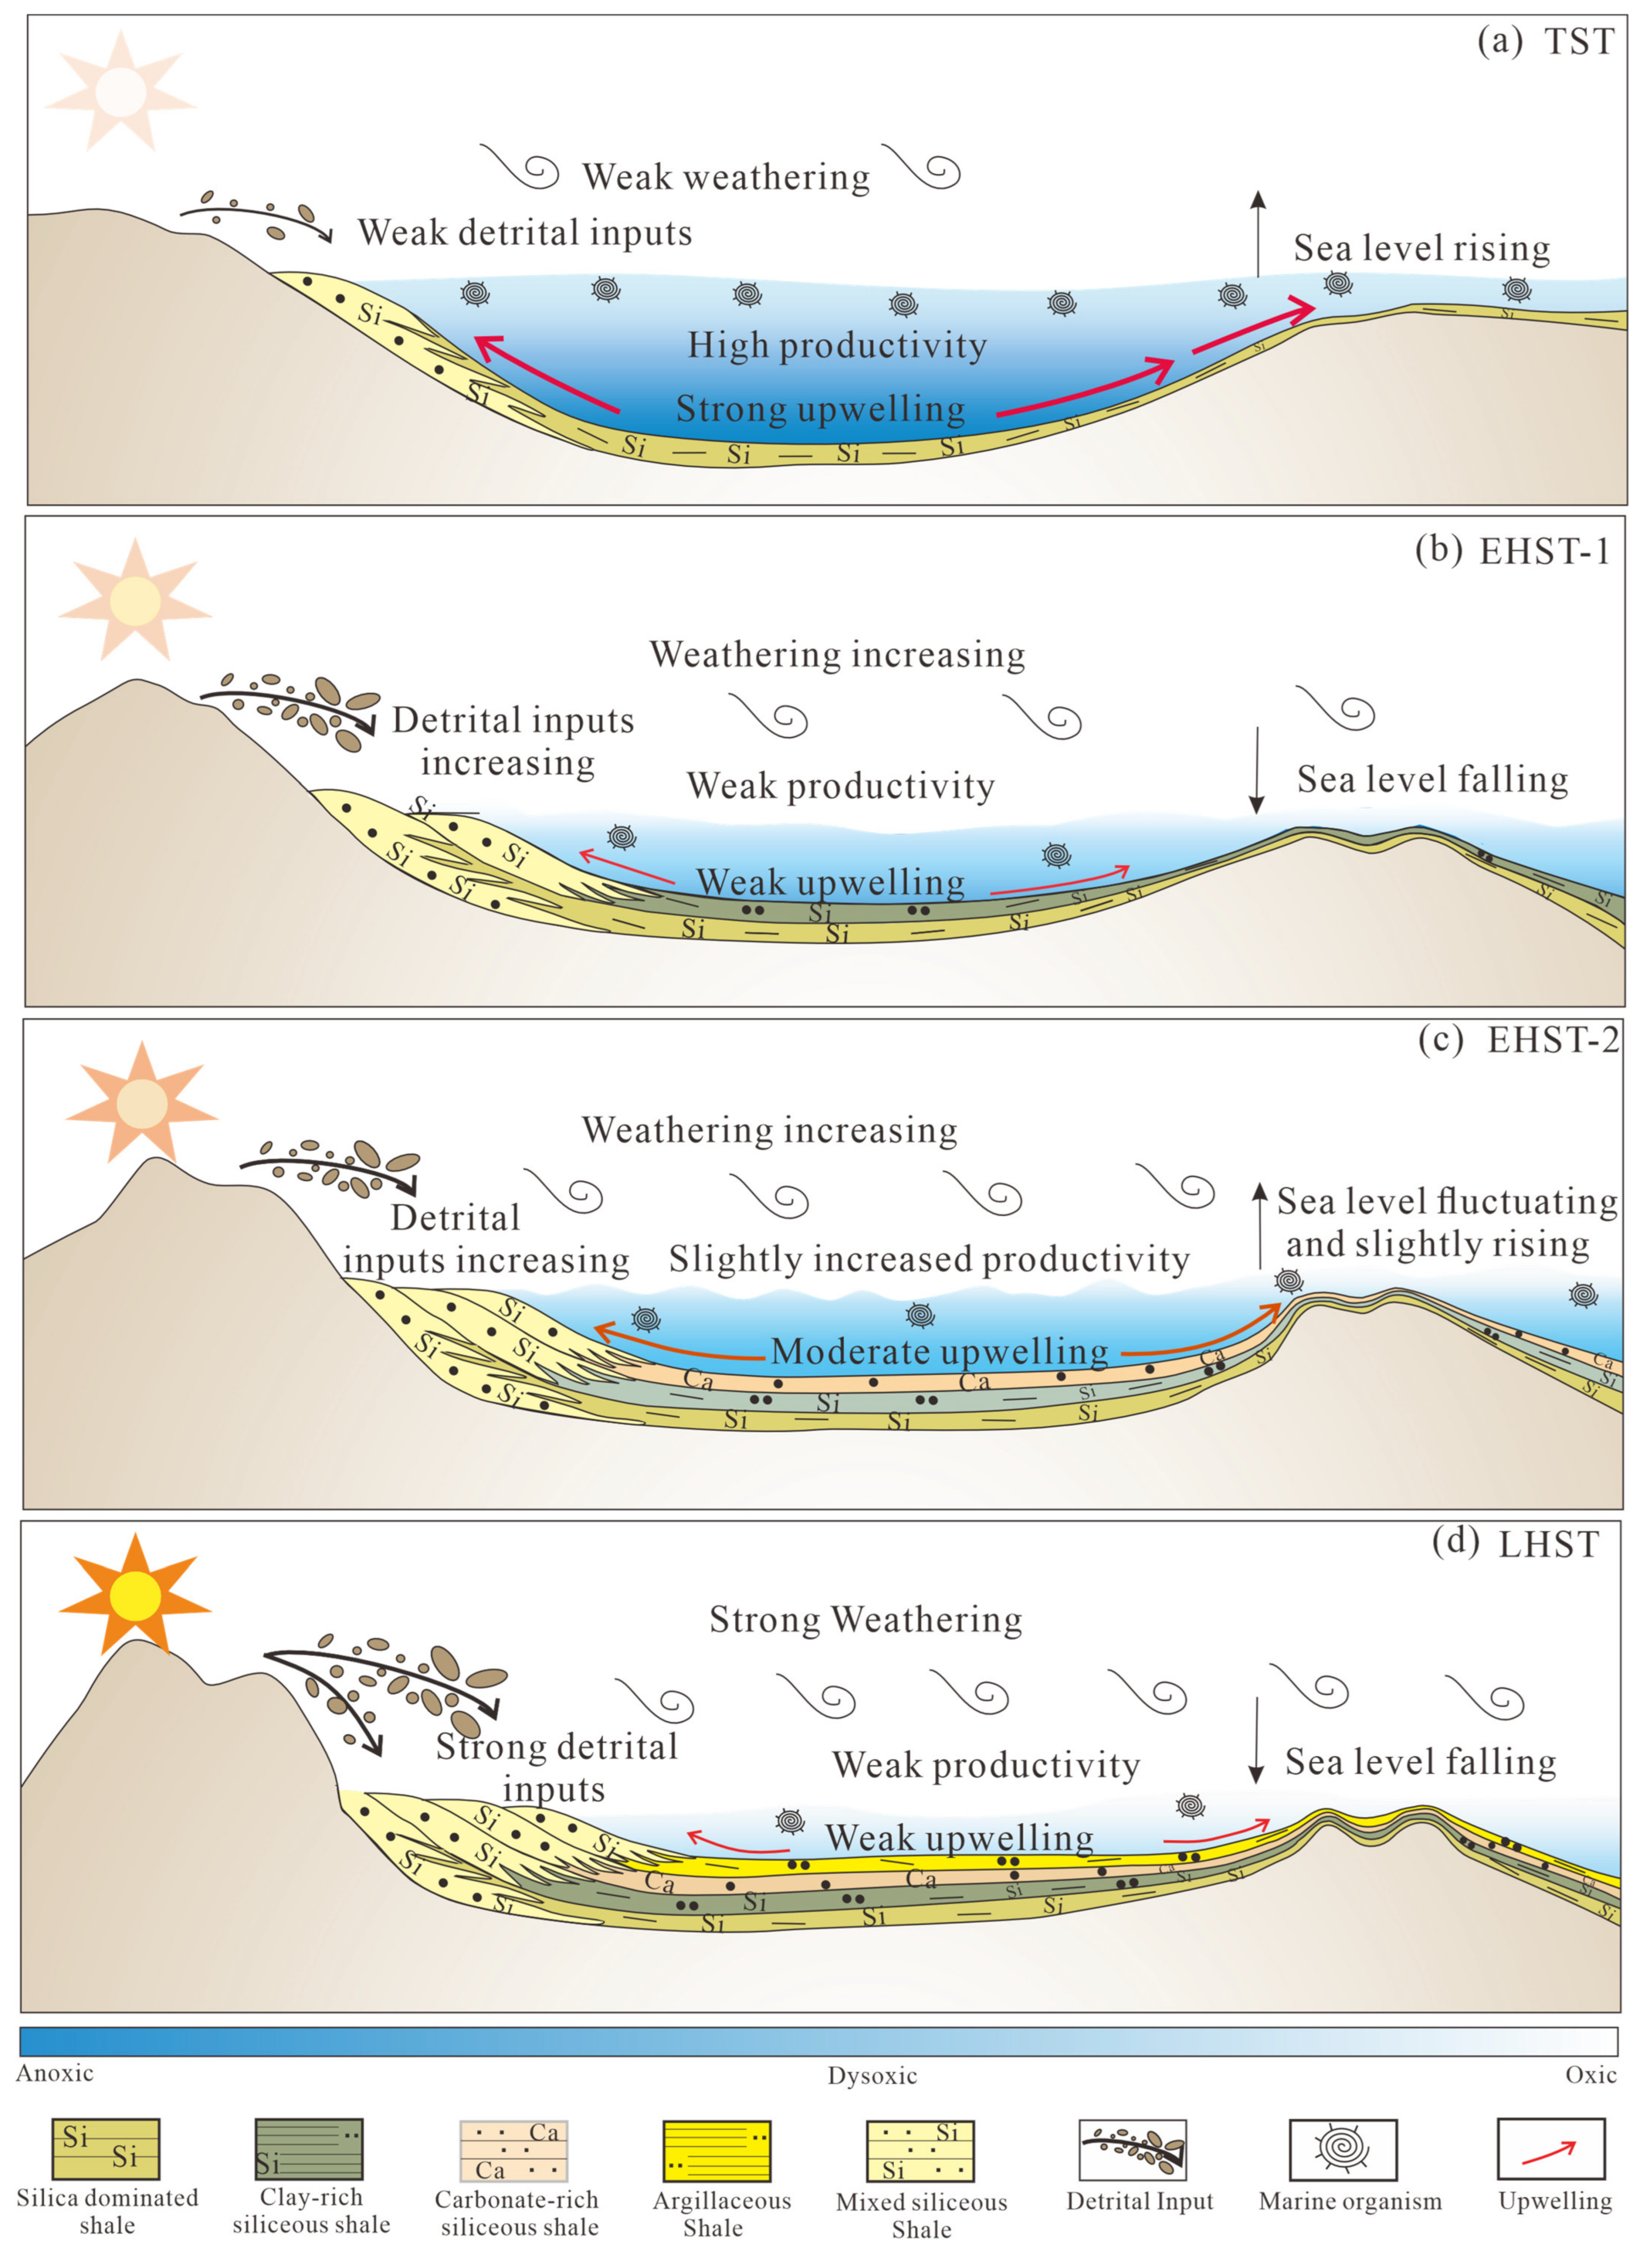
5.3. Paleoenvironmental Evolutionary Model
5.4. Impact of Sedimentary Process for Shale Gas Sweet Spot Formation
6. Conclusions
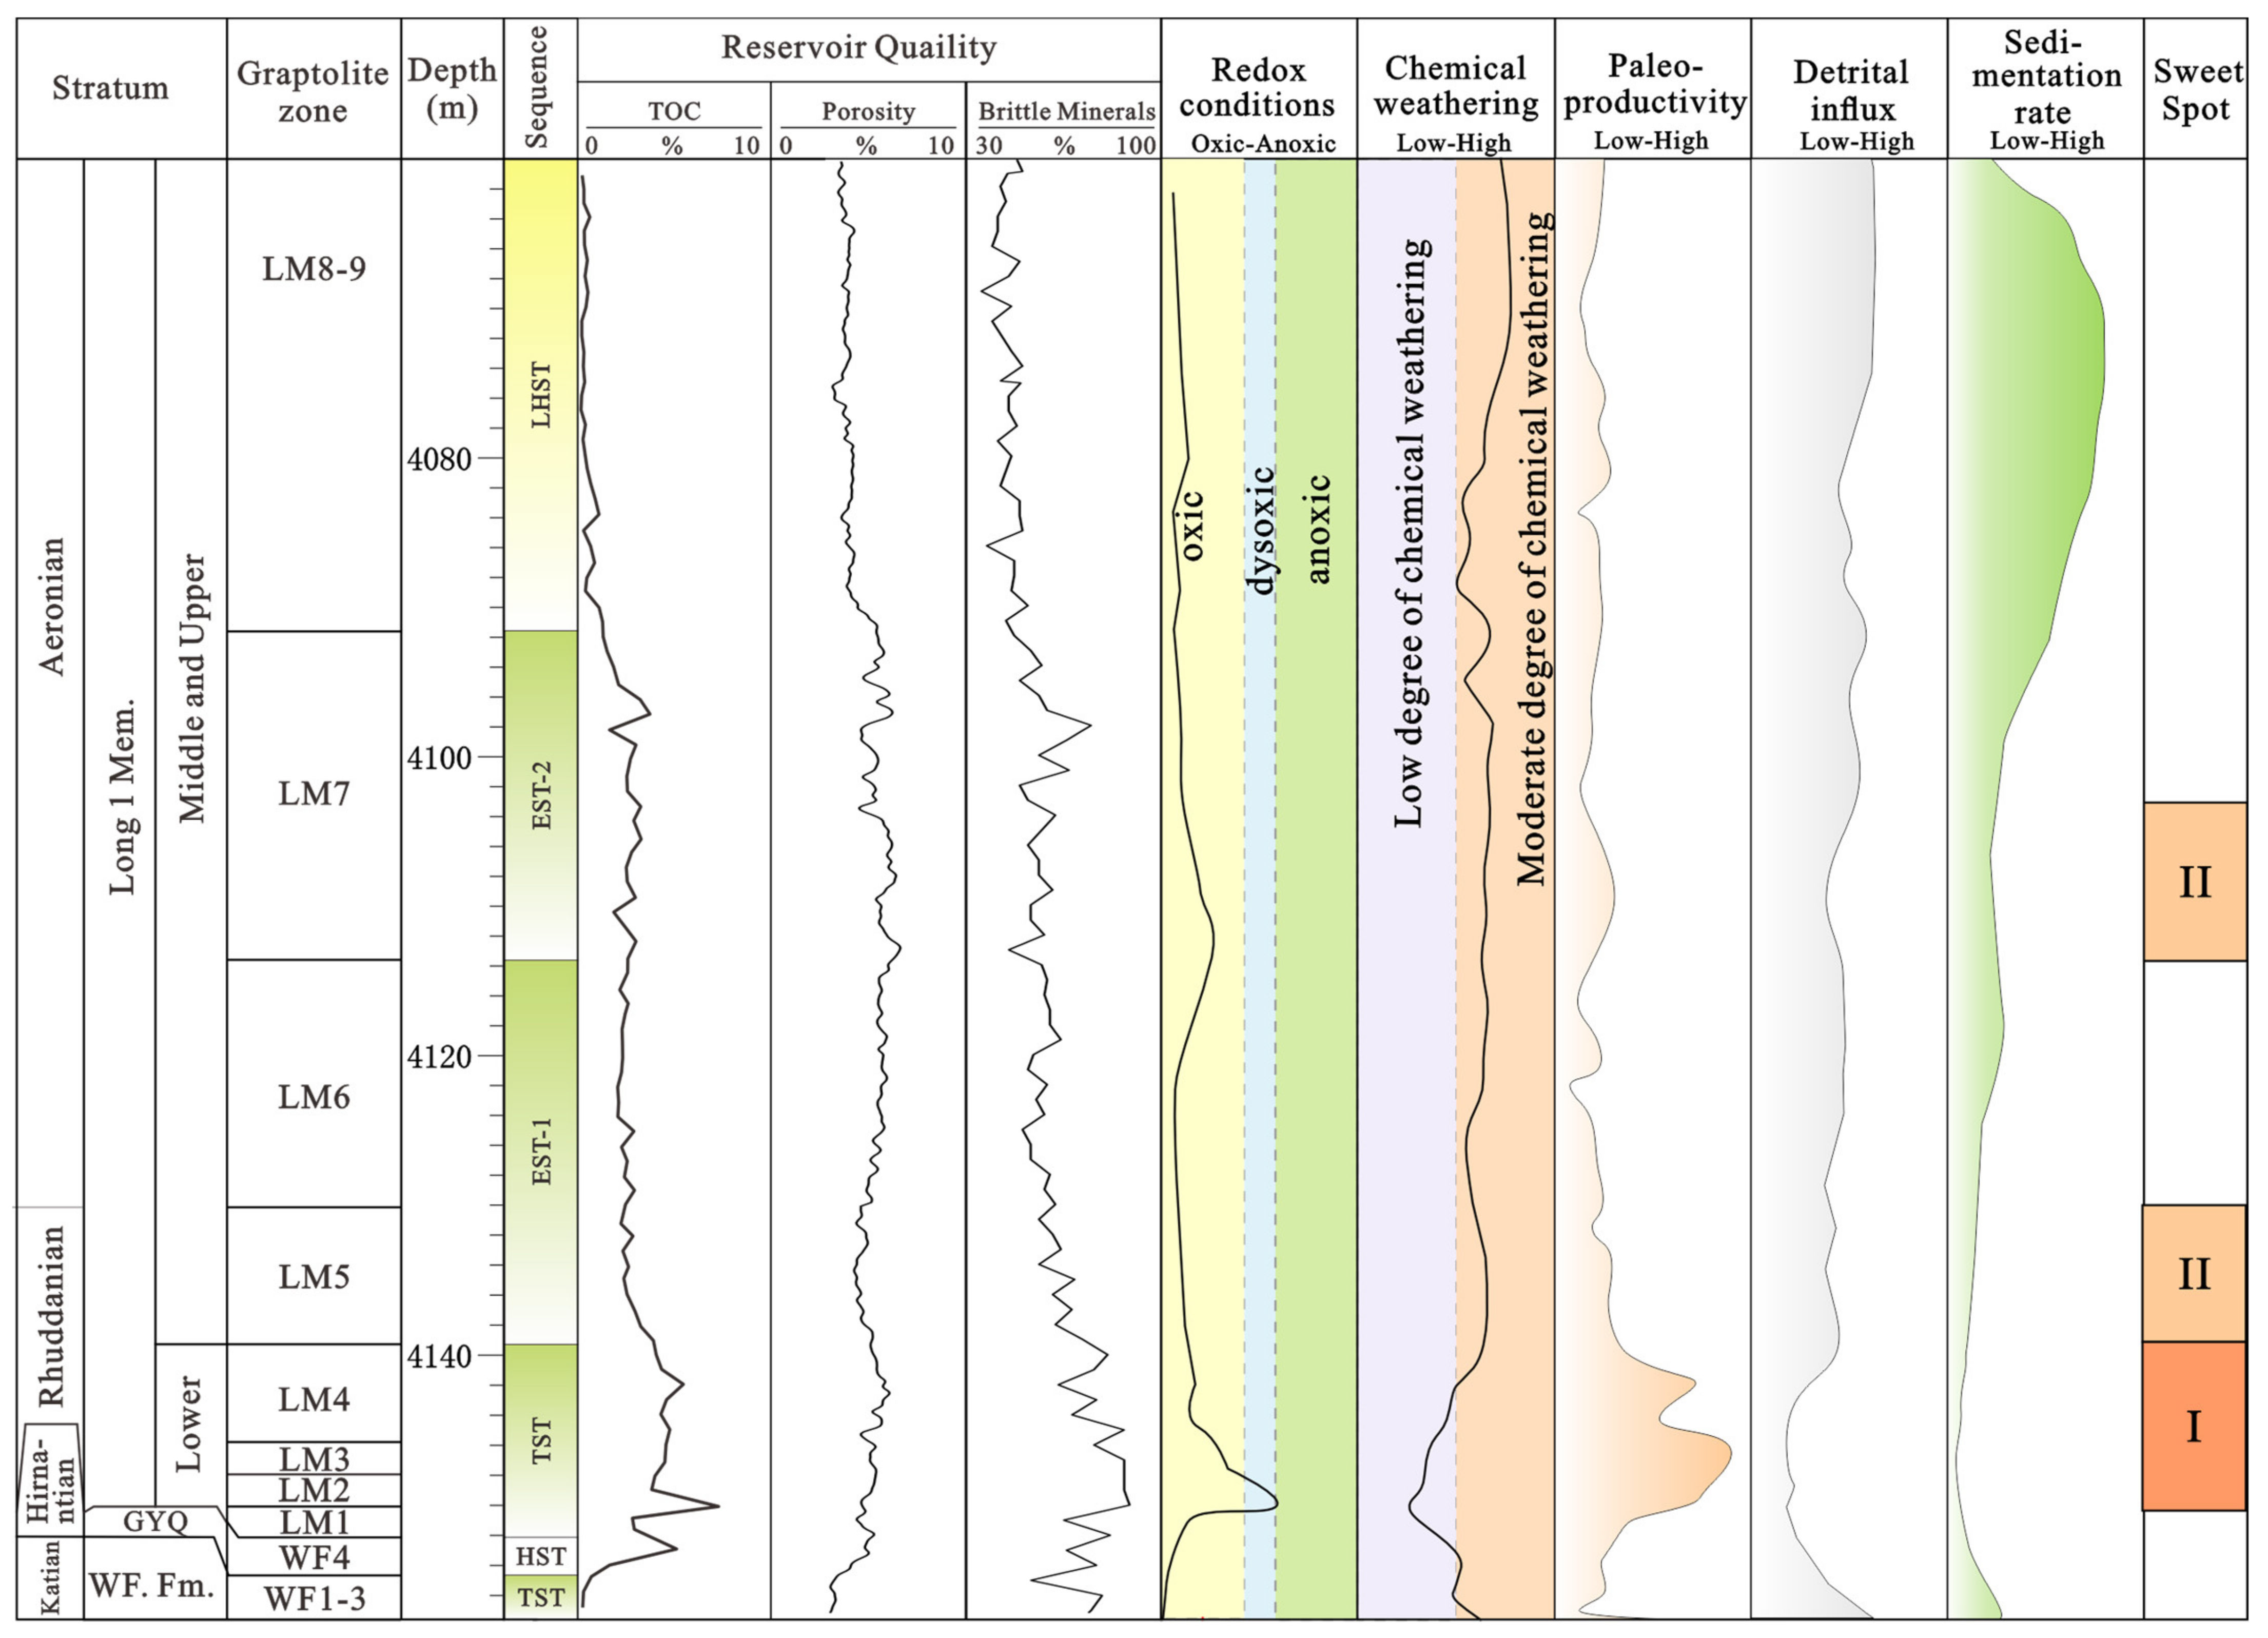
- Two third-order sequences (Sq A and Sq B) and four system tracts (TST, EHST-1, EHST-2, and LHST) developed during the Rhuddanian–Aeronian in the Luzhou area, southern Sichuan Basin. Paleoproductivity and redox conditions were primary controllers of organic matter enrichment in the TST stage, followed by terrestrial input. Redox conditions and terrestrial input were the primary controllers in the EHST-1, EHST-2, and LHST stages, with paleoproductivity being of secondary importance.
- During the Rhuddanian stage, melting Gondwanan glaciers caused a rapid marine transgression. This period was marked by rising sea levels, warm and humid climates, low terrigenous input, anoxic–dysoxic conditions, and increased paleoproductivity, promoting organic matter accumulation. By the late Rhuddanian, the Kwangsian Orogeny had led to gradual uplift in areas adjacent to Sichuan Basin, causing a regional drop in sea level. In the early EHST, the enhanced mixing of oxygen-rich and anoxic waters increased overall oxygenation. The Luzhou sag’s degree of water restriction grew, weakening upwelling currents, reducing paleoproductivity, and increasing terrigenous inputs. In the late EHST, the sea level fluctuated slightly upwards with increased weathering and a warmer, more humid climate. During the LHST, deposition began, influenced by the Kwangsian uplift. The Chengdu, Xuefeng, and Qianzhong uplifts further rose, leading to more weathering and the influx of terrigenous inputs. A decline in sea level enhanced bottom-water oxygenation. The degree of water restriction in the Luzhou sag intensified, alongside a sharp decline in paleoproductivity in an increasingly warm and humid environment.
- During the Rhuddanian–Aeronian period, two types of shale gas sweet spots emerged. Type I shale sweet spots were found within the TST stage, distinguished by their high TOC (4–7%), significant biogenic quartz content (>30%), and high porosity (4–7%). They were predominantly influenced by factors like low terrigenous detrital inputs, slower sedimentation rates, developed upwellings, anoxic conditions, and elevated paleoproductivity. The authigenic microcrystalline quartz enhanced the reservoir’s compressive strength, preserving the primary porosity, while the abundant organic matter gave rise to numerous organic pores and methane during the gas generation stage. Type II shale gas sweet spots originated during the late EHST stage. The reservoir qualities of type II shale gas sweet spots are second only to those of type I shale gas sweet spots, characterized by a TOC distribution of 5–6.5%, porosity ranging from 4 to 6%, and a notably high content of detrital quartz. They were principally controlled by minor, localized sea level fluctuations, causing increased anoxia in the bottom waters. The significant influx of terrigenous clastics strongly diluted the organic content, resulting in a lower degree of organic accumulation and a reduction in the shale reservoir’s compressive strength. The discovery of type II sweet spots from the late EHST can serve as backup exploration target, following type I.
Author Contributions
Funding
Data Availability Statement
Conflicts of Interest
References
- Delabroye, A.; Vecoli, M. The end-Ordovician glaciation and the Hirnantian Stage: A global review and questions about Late Ordovician event stratigraphy. Earth Sci. Rev. 2010, 98, 269–282. [Google Scholar] [CrossRef]
- Munnecke, A.; Calner, M.; Harper, D.A.T.; Servais, T. Ordovician and Silurian sea–water chemistry, sea level, and climate: A synopsis. Palaeogeogr. Palaeocl 2010, 296, 389–413. [Google Scholar] [CrossRef]
- Algeo, T.J.; Liu, J. A re-assessment of elemental proxies for paleoredox analysis. Chem. Geol. 2016, 540, 119549. [Google Scholar] [CrossRef]
- Zou, C.; Qiu, Z.; Poulton, S.W.; Dong, D.; Wang, H.; Chen, D.; Lu, B.; Shi, Z.; Tao, H. Ocean euxinia and climate change “double whammy” drove the Late Ordovician mass extinction. Geology 2018, 46, 535–538. [Google Scholar] [CrossRef]
- Xu, C.; Rong, J.-Y.; Li, Y.; Boucot, A.J. Facies patterns and geography of the Yangtze region, South China, through the Ordovician and Silurian transition. Palaeogeogr. Palaeocl. 2004, 204, 353–372. [Google Scholar] [CrossRef]
- Zou, C.; Zhu, R.; Chen, Z.; Ogg, J.G.; Yang, Z. Organic-matter-rich shales of China. Earth-Sci. Rev. 2019, 189, 51–78. [Google Scholar] [CrossRef]
- Vecoli, M.; Riboulleau, A.; Versteegh, G.J.M. Palynology, organic geochemistry and carbon isotope analysis of a latest Ordovician through Silurian clastic succession from borehole Tt1, Ghadamis Basin, southern Tunisia, North Africa: Palaeoenvironmental interpretation. Palaeogeogr. Palaeocl. 2009, 273, 378–394. [Google Scholar] [CrossRef]
- Berry, W.B.N. Black shales: An Ordovician perspective. Spec. Pap. Geol. Soc. Am. 2010, 466, 141–147. [Google Scholar]
- Melchin, M.J.; Mitchell, C.E.; Holmden, C.; Storch, P. Environmental changes in the Late Ordovician–early Silurian: Review and new insights from black shales and nitrogen isotopes. Bull. Geol. Soc. Am. 2013, 125, 1635–1670. [Google Scholar] [CrossRef]
- Lüning, S.; Craig, J.; Loydell, D.K.; Štorch, P.; Fitches, B. Lower Silurian ‘hot shales’ in North Africa and Arabia: Regional distribution and depositional model. Earth-Sci. Rev. 2000, 49, 121–200. [Google Scholar] [CrossRef]
- Wei, W.; Algeo, T.J. Elemental proxies for paleosalinity analysis of ancient shales and mudrocks. Geochim. Cosmochim. Acta 2020, 287, 341–366. [Google Scholar] [CrossRef]
- Guo, X.; Hu, D.; Li, Y.; Wei, Z.; Liu, Z. Geological factors controlling shale gas enrichment and high production in Fuling shale gas field. Pet. Explor. Dev. 2017, 44, 481–491. [Google Scholar] [CrossRef]
- Li, S.Z.; Zhou, Z.; Nie, H.K.; Zhang, L.F.; Song, T.; Liu, W.B.; Li, H.H.; Xu, Q.C.; Wei, S.Y.; Tao, S. Distribution characteristics, exploration and development, geological theories research progress and exploration directions of shale gas in China. China Geol. 2022, 5, 110–135. [Google Scholar] [CrossRef]
- Hao, F.; Zou, H.; Lu, Y. Mechanisms of shale gas storage: Implications for shale gas exploration in China. Aapg. Bull. 2013, 97, 1325–1346. [Google Scholar] [CrossRef]
- Zou, C.; Yang, Z.; Cui, J.; Zhu, R.; Hou, L.; Tao, S.; Yuan, X.; Wu, S.; Lin, S.; Wang, L. Formation mechanism, geological characteristics and development strategy of nonmarine shale oil in China. Pet. Explor. Dev. 2013, 40, 15–27. [Google Scholar] [CrossRef]
- Arthur, M.A.; Sageman, B.B. Marine black shales: Deposi tional mechanisms and environments of ancient deposits. Annu. Rev. Earth Pl. Sc. 1994, 22, 499–551. [Google Scholar] [CrossRef]
- Tyson, R.V. The \”productivity versus preservation\” controversy: Cause, flaws, and resolution. In Deposition of Organic Carbon. Rich Sediments Models Mechanisms & Consequences; Sepm Special Publication: Claremore, OK, USA, 2005; pp. 17–33. [Google Scholar]
- Crusius, J.; Calvert, S.; Pedersen, T.; Sage, D. Rhenium and molybdenum enrichments in sediments as indicators of oxic, suboxic and sulfidic conditions of deposition. Earth Planet. Sci. Lett. 1996, 145, 65–78. [Google Scholar] [CrossRef]
- Sageman, B.B.; Murphy, A.E.; Werne, J.P.; Straeten, C.A.V.; Lyons, T.W. A tale of shales: The relative roles of production, decomposition, and dilution in the accumulation of organic-rich strata, Middle–Upper Devonian, Appalachian basin. Chem. Geol. 2003, 195, 229–273. [Google Scholar] [CrossRef]
- Katz, B.J. Controlling Factors on Source Rock Development—A Review of Productivity, Preservation, and Sedimentation Rate. In Controlling Factors on Source Rock Development—A Review of Productivity, Preservation, and Sedimentation Rate; Sepm Special Publication: Claremore, OK, USA, 2005. [Google Scholar]
- Pszonka, J.; Wendorff, M.; Godlewski, P. Sensitivity of marginal basins in recording global icehouse and regional tectonic controls on sedimentation. Example of the Cergowa Basin, (Oligocene) Outer Carpathians. Sediment. Geol. 2023, 444, 106326. [Google Scholar] [CrossRef]
- Moore, G.J.D.T. Anoxic environments and oil source bed genesis. Org. Geochem. 1980, 2, 9–31. [Google Scholar]
- Johnson Ibach, L.E. Relationship between sedimentation rate and total organic carbon content in ancient marine sediments. Am. Assoc. Pet. Geol. 1980, 66, 170–188. [Google Scholar]
- Huang, H.; He, D.; Li, D.; Li, Y.; Chen, J. Geochemical characteristics of organic-rich shale, Upper Yangtze Basin: Implications for the Late Ordovician–Early Silurian orogeny in South China. Palaeogeogr. Palaeocl. 2020, 554, 109822. [Google Scholar] [CrossRef]
- Li, Y.; Shao, D.; Lv, H.; Zhang, Y.; Zhang, T. A relationship between elemental geochemical characteristics and organic matter enrichment in marine shale of Wufeng Formation-Longmaxi Formation, Sichuan Basin. Acta Pet. Sin. 2015, 36, 1470–1483. [Google Scholar]
- Cai, Q.; Hu, M.; Kane, O.I.; Li, M.; Zhang, B.; Hu, Z.; Deng, Q.; Xing, N. Cyclic variations in paleoenvironment and organic matter accumulation of the Upper Ordovician-Lower Silurian black shale in the Middle Yangtze Region, South China: Implications for tectonic setting, paleoclimate, and sea-level change. Mar. Petrol. Geol. 2022, 136, 105477. [Google Scholar] [CrossRef]
- Yan, C.; Jin, Z.; Zhao, J.; Du, W.; Liu, Q. Influence of sedimentary environment on organic matter enrichment in shale: A case study of the Wufeng and Longmaxi Formations of the Sichuan Basin, China. Mar. Petrol. Geol. 2018, 92, 880–894. [Google Scholar] [CrossRef]
- Yang, S.W.S.X. Constraints on the accumulation of organic matter in Upper Ordovician-lower Silurian black shales from the Lower Yangtze region, South China. Mar. Petrol. Geol. 2020, 120, 1045441. [Google Scholar] [CrossRef]
- Wei, C.; Dong, T.; He, Z.; He, S.; He, Q.; Yang, R.; Guo, X.; Hou, Y. Major, trace-elemental and sedimentological characterization of the upper Ordovician Wufeng-lower Silurian Longmaxi formations, Sichuan Basin, south China: Insights into the effect of relative sea-level fluctuations on organic matter accumulation in shales. Mar. Petrol. Geol. 2021, 126, 104905. [Google Scholar] [CrossRef]
- Chen, L.; Jiang, S.; Chen, P.; Chen, X.; Lu, Y. Relative sea-level changes and organic matter enrichment in the Upper Ordovician-Lower Silurian Wufeng-Longmaxi Formations in the Central Yangtze area, China. Mar. Petrol. Geol. 2020, 124, 104809. [Google Scholar] [CrossRef]
- Cocks, L.R.M.; Torsvik, T.H. The dynamic evolution of the Palaeozoic geography of eastern Asia. Earth-Sci. Rev. 2013, 117, 40–79. [Google Scholar] [CrossRef]
- Ma, Y.; Fan, M.; Lu, Y.; Guo, X.; Hu, H.; Chen, L.; Wang, C.; Liu, X. Geochemistry and sedimentology of the Lower Silurian Longmaxi mudstone in southwestern China: Implications for depositional controls on organic matter accumulation. Mar. Petrol. Geol. 2016, 75, 291–309. [Google Scholar] [CrossRef]
- Chen, C.; Mu, C.L.; Zhou, K.K.; Liang, W.; Ge, X.Y.; Wang, X.P.; Wang, Q.Y.; Zheng, B.S. The geochemical characteristics and factors controlling the organic matter accumulation of the Late Ordovician-Early Silurian black shale in the Upper Yangtze Basin, South China. Mar. Petrol. Geol. 2016, 76, 159–175. [Google Scholar] [CrossRef]
- Yang, R.; He, S.; Wang, X.; Hu, Q.; Hu, D.; Yi, J. Paleo-ocean redox environments of the Upper Ordovician Wufeng and the first member in lower Silurian Longmaxi formations in the Jiaoshiba area, Sichuan Basin. Can. J. Earth Sci. 2016, 53, 426–440. [Google Scholar] [CrossRef]
- Hongyan, W.; Zhensheng, S.; Shasha, S. Biostratigraphy and reservoir characteristics of the Ordovician Wufeng Formation-Silurian Longmaxi Formation shale in the Sichuan Basin and its surrounding areas, China. Pet. Explor. Dev. 2021, 48, 14. [Google Scholar]
- Ma, X.; Wang, H.; Zhou, T.; Zhao, Q.; Shi, Z.; Sun, S.; Cheng, F. Geological Controlling Factors of Low Resistivity Shale and Their Implications on Reservoir Quality: A Case Study in the Southern Sichuan Basin, China. Energies 2022, 15, 5801. [Google Scholar] [CrossRef]
- Gibling, O.C.A.P. Towards the standardization of sequence stratigraphy. Earth-Sci. Rev. 2008, 91, 1–33. [Google Scholar]
- Lu, Y.; Hao, F.; Lu, Y.; Yan, D.; Xu, S.; Shu, Z.; Wang, Y.; Wu, L. Lithofacies and depositional mechanisms of the Ordovician-Silurian Wufeng-Longmaxi organic-rich shales in the upper Yangtze area, southern China. Aapg. Bull. 2020, 104, 97–129. [Google Scholar] [CrossRef]
- Wu, L.; Lu, Y.; Jiang, S.; Liu, X.; Liu, Z.; Lu, Y. Relationship between the origin of organic-rich shale and geological events of the Upper Ordovician-Lower Silurian in the Upper Yangtze area. Mar. Petrol. Geol. 2018, 102, 74–85. [Google Scholar] [CrossRef]
- Mohialdeen, I.M.J.; Hakimi, M.H. Geochemical characterisation of Tithonian-Berriasian Chia Gara organic-rich rocks in northern Iraq with an emphasis on organic matter enrichment and the relationship to the bioproductivity and anoxia conditions. J. Asian Earth Sci. 2016, 116, 181–197. [Google Scholar] [CrossRef]
- Skomurski, F.N.; Ilton, E.S.; Engelhard, M.H.; Arey, B.W.; Rosso, K.M. Heterogeneous reduction of U6+ by structural Fe2+ from theory and experiment. Geochim. Cosmochim. Acta 2011, 75, 7277–7290. [Google Scholar] [CrossRef]
- Mclennan, S.M.; Hemming, S.R.; Mcdaniel, D.K.; Hanson, G.N. Geochemical approaches to sedimentation, provenance, and tectonics. In Processes Controlling the Composition of Clastic Sediments; Geological Society of America: New York, NY, USA, 1993. [Google Scholar]
- Wilford, J. A weathering intensity index for the Australian continent using airborne gamma-ray spectrometry and digital terrain analysis. Geoderma 2012, 183–184, 124–142. [Google Scholar] [CrossRef]
- Jones, B.; Manning, D.A. Comparison of geochemical indicesused for the interpretation of palaeoredox conditions in ancientmudstones. Chem. Geol. 1994, 111, 111–129. [Google Scholar] [CrossRef]
- Algeo, T.J.; Tribovillard, N. Environmental Analysis of Paleoceanographic Systems Based on Molybdenum–Uranium Covariation. Chem. Geol. 2009, 268, 211–225. [Google Scholar] [CrossRef]
- Vassileva, E.; Hadjiivanov, K.; Stoychev, T.; Daiev, C. Chromium speciation analysis by solid-phase extraction on a high surface area TiO2. Analyst 2000, 125, 693–698. [Google Scholar] [CrossRef]
- Tribovillard, N.; Bout-Roumazeilles, V.; Algeo, T.; Lyons, T.W.; Baudin, F. Paleodepositional conditions in the Orca Basin as inferred from organic matter and trace metal contents. Mar. Geol. 2012, 254, 62–72. [Google Scholar] [CrossRef]
- Rimmer, S.M. Geochemical paleoredox indicators in Devonian–Mississippian black shales, Central Appalachian Basin (USA). Chem. Geol. 2004, 206, 373–391. [Google Scholar] [CrossRef]
- Akinyemi, S.A.; Adebayo, O.F.; Ojo, O.A.; Fadipe, O.A.; Gitari, W.M. Mineralogy and Geochemical Appraisal of Paleo-Redox Indicators in Maastrichtian Outcrop Shales of Mamu Formation, Anambra Basin, Nigeria. J. Nat. Sci. Res. 2013, 3, 48–64. [Google Scholar]
- Zeng, S.; Wang, J.; Fu, X.; Chen, W.; Feng, X.; Wang, D.; Song, C.; Wang, Z. Geochemical characteristics, redox conditions, and organic matter accumulation of marine oil shale from the Changliang Mountain area, northern Tibet, China. Mar. Petrol. Geol. 2015, 64, 203–221. [Google Scholar] [CrossRef]
- Tribovillard, N.; Algeo, T.J.; Baudin, F.; Riboulleau, A. Analysis of marine environmental conditions based onmolybdenum–uranium covariation—Applications to Mesozoic paleoceanography. Chem. Geol. 2012, 324–325, 46–58. [Google Scholar] [CrossRef]
- Algeo, T.J.; Lyons, T.W. Mo-total organic carbon covariation in modern anoxic marine environments: Implications for analysis of paleoredox and paleohydrographic conditions. Paleoceanography 2006, 21, 124–133. [Google Scholar] [CrossRef]
- Schenau, S.J.; Reichart, G.J.; Lange, G.J.D. Phosphorus burial as a function of paleoproductivity and redox conditions in Arabian Sea sediments. Geochim. Cosmochim. Acta 2005, 69, 919–931. [Google Scholar] [CrossRef]
- Marenco, J.; Matthew, S.; Thomas, J. Co-evolution of oceans, climate, and the biosphere during the ‘Ordovician Revolution’: A review. Palaeogeogr. Palaeoclimatol. Palaeoecol. 2016, 458, 1–11. [Google Scholar]
- Scholz, F.; Hensen, C.; Noffke, A.; Rohde, A.; Liebetrau, V.; Wallmann, K. Early diagenesis of redox-sensitive trace metals in the Peru upwelling area—Response to ENSO-related oxygen fluctuations in the water column. Geochim. Cosmochim. Acta 2011, 75, 7257–7276. [Google Scholar] [CrossRef]
- Pedersen, T.F.; Calvert, S.E. Anoxia vs. productivity: What controls the formation of organic-carbon-rich sediments and sedimentary rocks? Aapg. Bull. 1990, 74, 454–466. [Google Scholar]
- Schoepfer, S.D.; Shen, J.; Wei, H.; Tyson, R.V.; Ingall, E.; Algeo, T.J. Total organic carbon, organic phosphorus, and biogenic barium fluxes as proxies for paleomarine productivity. Earth-Sci. Rev. 2015, 149, 23–52. [Google Scholar] [CrossRef]
- Dymond, J.; Suess, E.; Lyle, M. Barium in Deep-Sea Sediment: A Geochemical Proxy for Paleoproductivity. Paleoceanography 1992, 7, 163–181. [Google Scholar] [CrossRef]
- Walker, W.J.; Cronan, C.S.; Patterson, H.H. A kinetic study of aluminum adsorption by aluminosilicate clay minerals. Geochim. Cosmochim. Acta 1988, 52, 55–62. [Google Scholar] [CrossRef]
- Murphy, A.E.; Sageman, B.B.; Hollander, D.J.; Lyons, T.W.; Brett, C.E. Black shale deposition and faunal overturn in the Devonian Appalachian Basin: Clastic starvation, seasonal water-column mixing, and efficient biolimiting nutrient recycling. Paleoceanography 2000, 15, 280–291. [Google Scholar] [CrossRef]
- Tribovillard, N.; Algeo, T.J.; Lyons, T.; Riboulleau, A. Trace metals as paleoredox and paleoproductivity proxies: An update. Chem. Geol. 2006, 232, 12–32. [Google Scholar] [CrossRef]
- Gallego-Torres, D.; Martinez-Ruiz, F.; Lange, G.J.D.; Jimenez-Espejo, F.J.; Ortega-Huertas, M. Trace-elemental derived paleoceanographic and paleoclimatic conditions for Pleistocene Eastern Mediterranean sapropels. Palaeogeogr. Palaeoclimatol. Palaeoecol. 2010, 293, 76–89. [Google Scholar] [CrossRef]
- Xiong, S.; Ding, Z.; Zhu, Y.; Zhou, R.; Lu, H. A 6Ma chemical weathering history, the grain size dependence of chemical weathering intensity, and its implications for provenance change of the Chinese loess–red clay deposit. Quat. Sci. Rev. 2010, 29, 1911–1922. [Google Scholar] [CrossRef]
- Cullers, R.L.; Podkovyrov, V.N. The source and origin of terrigenous sedimentary rocks in the Mesoproterozoic Ui group, southeastern Russia. Precambrian Res. 2002, 117, 157–183. [Google Scholar] [CrossRef]
- Lash, G.G.; Blood, D.R. Organic matter accumulation, redox, and diagenetic history of the Marcellus Formation, southwestern Pennsylvania, Appalachian basin. Mar. Pet. Geol. 2014, 57, 244–263. [Google Scholar] [CrossRef]
- Wang, Y.; Xu, S.; Hao, F.; Lu, Y.; Shu, Z.; DetianYan; Lu, Y. Geochemical and petrographic characteristics of Wufeng-Longmaxi shales, Jiaoshiba area, southwest China: Implications for organic matter differential accumulation. Mar. Petrol. Geol. 2018, 102, 138–154. [Google Scholar] [CrossRef]
- Arthur, M.A.; Dean, W.E.; Laarkamp, K. Organic carbon accumulation and preservation in surface sediments on the Peru margin. Chem. Geol. 1998, 152, 273–286. [Google Scholar] [CrossRef]
- Hakimi, M.H.; Abdullah, W.H.; Alqudah, M.; Makeen, Y.M.; Mustapha, K.A. Organic geochemical and petrographic characteristics of the oil shales in the Lajjun area, Central Jordan: Origin of organic matter input and preservation conditions. Fuel 2016, 181, 34–45. [Google Scholar] [CrossRef]
- Li, S.; Meng, F.; Zhang, X.; Zhou, Z.; Zhang, S. Gas composition and carbon isotopic variation during shale gas desorption: Implication from the Ordovician Wufeng Formation—Silurian Longmaxi Formation in west Hubei, China. J. Nat. Gas Sci. Eng. 2020, 87, 103777. [Google Scholar] [CrossRef]
- Shao, J.; Yang, S.; Li, C. Chemical indices (CIA and WIP) as proxies for integrated chemical weathering in China: Inferences from analysis of fluvial sediments. Sediment. Geol. 2012, 265–266, 110–120. [Google Scholar] [CrossRef]
- Feng, Y.; Xiao, X.; Gao, P.; Wang, E.; Hu, D.; Liu, R.; Li, G.; Lu, C. Restoration of sedimentary environment and geochemical features of deep marine Longmaxi shale and its significance for shale gas: A case study of the Dingshan area in the Sichuan Basin, South China. Mar. Petrol. Geol. 2023, 151, 106186. [Google Scholar] [CrossRef]
- Li, S.; Zhou, Z.; Nie, H.; Liu, M.; Meng, F.; Shen, B.; Zhang, X.; Wei, S.; Xi, Z.; Zhang, S. Organic matter accumulation mechanisms in the Wufeng-Longmaxi shales in western Hubei Province, China and paleogeographic implications for the uplift of the Hunan-Hubei Submarine high. Int. J. Coal Geol. 2023, 270, 104223. [Google Scholar] [CrossRef]
- Guo, L.; Dengfa, H.; Baize, K. Tectonic subsidence characteristics of Sichuan Basin and its enlightenment to basin genesis. Chin. J. Geol. 2023, 58, 86–104. [Google Scholar]
- Zhang, L.; Xiao, D.; Lu, S.; Jiang, S.; Lu, S. Effect of sedimentary environment on the formation of organic-rich marine shale: Insights from major/trace elements and shale composition. Int. J. Coal Geol. 2019, 204, 34–50. [Google Scholar] [CrossRef]
- Chen, W.; Tian, J.; Lin, X.; Liang, Q.; Wang, X.; Yi, D.; Li, Y. Climate fluctuations during the Ordovician-Silurian transition period in South China: Implications for paleoenvironmental evolution and organic matter enrichment. Palaeogeogr. Palaeoclimatol. Palaeoecol. 2023, 613, 111411. [Google Scholar] [CrossRef]
- Peng, M.; Tian, J.; Zhang, X.; Liang, Q.; Li, J. Controls on organic matter accumulation on the Late-Ordovician shales in Awati Sag in northwestern Tarim Basin, NW China. Geoenergy Sci. Eng. 2023, 221, 111308. [Google Scholar] [CrossRef]
- Chen, K.; Yang, R.; Bao, H.; Dong, T.; Jia, A.; Hu, Q.; Guo, X.; He, S. Depositional-diagenetic process and their implications for pore development of Wufeng-Longmaxi shales in the Jiangdong block, Fuling shale gas field, SW China. Mar. Petrol. Geol. 2023, 151, 106177. [Google Scholar] [CrossRef]
- Liu, Y.; Li, Y.; Hou, M.; Shen, J.; Algeo, T.J.; Fan, J.; Zhou, X.; Chen, Q.; Sun, Z.; Li, C. Terrestrial rather than volcanic mercury inputs to the Yangtze Platform (South China) during the Ordovician-Silurian transition. Global Planet. Chang. 2023, 220, 104023. [Google Scholar] [CrossRef]
- Delle Piane, C.; Ansari, H.; Li, Z.; Mata, J.; Rickard, W.; Pini, R.; Dewhurst, D.N.; Sherwood, N. Influence of organic matter type on porosity development in the Wufeng-Longmaxi Shale: A combined microscopy, neutron scattering and physisorption approach. Int. J. Coal Geol. 2022, 249, 103880. [Google Scholar] [CrossRef]
- Dong, T.; Wang, C.; Liang, X.; Wang, G.; Jiang, S. Paleodepositional conditions and organic matter accumulation mechanisms in the Upper Ordovician-lower Silurian Wufeng-Longmaxi shales, Middle Yangtze region, South China. Mar. Petrol. Geol. 2022, 143, 105823. [Google Scholar] [CrossRef]
- Gao, Z.; Xiong, S.; Wei, L. The new multistage water adsorption model of Longmaxi Formation shale considering the spatial configuration relationship between organic matter and clay minerals. Petrol. Sci. 2022, 19, 1950–1963. [Google Scholar] [CrossRef]
- Xu, L.; Huang, S.; Wang, Y.; Zhou, X.; Liu, Z.; Wen, Y.; Zhang, Y.; Sun, M. Palaeoenvironment evolution and organic matter enrichment mechanisms of the Wufeng-Longmaxi shales of Yuanán block in western Hubei, middle Yangtze: Implications for shale gas accumulation potential. Mar. Petrol. Geol. 2023, 152, 106242. [Google Scholar] [CrossRef]
- Cai, Q.; Hu, M.; Kane, O.I.; Yang, Z.; Wen, Y.; Luo, Q.; Li, M.; Hu, Z.; Deng, Q. Petrological and geochemical characteristics of the Ordovician–Silurian black shale in eastern Sichuan and western Hubei, South China: Differential sedimentary responses to tectonism and glaciation. J. Palaeogeogr. 2023, 12, 129–152. [Google Scholar] [CrossRef]
- Qiu, Z.; Li, Y.; Xiong, W.; Fan, T.; Zhao, Q.; Zhang, Q.; Wang, Y.; Liu, W.; Liang, F.; Zhang, J.; et al. Revisiting paleoenvironmental changes on the Upper Yangtze Block during the Ordovician-Silurian transition: New insights from elemental geochemistry. Sediment. Geol. 2023, 450, 106377. [Google Scholar] [CrossRef]
- Song, L.; Chen, Q.; Li, H.; Deng, C. Roller-coaster atmospheric-terrestrial-oceanic-climatic system during Ordovician-Silurian transition: Consequences of large igneous provinces. Geosci. Front. 2023, 14, 101537. [Google Scholar] [CrossRef]
- Zhang, B.; Wen, H.; Qing, H.; Yang, K.; Luo, Y.; Yang, H.; Wang, P.; He, L.; Xiao, W. The influence of depositional and diagenetic processes on rock electrical properties: A case study of the Longmaxi shale in the Sichuan Basin. J. Petrol. Sci. Eng. 2022, 211, 110119. [Google Scholar] [CrossRef]
- Khan, N.; Weltje, G.J.; Jan, I.U.; Swennen, R. Depositional and diagenetic constraints on the quality of shale-gas reservoirs: A case study from the Late Palaeocene of the Potwar Basin (Pakistan, Eastern Tethys). Geol. J. 2022, 57, 2770–2787. [Google Scholar] [CrossRef]
- Wang, S.; Man, L.; Wang, S.; Wu, L.; Zhu, Y.; Li, Y.; He, Y. Lithofacies types, reservoir characteristics and silica origin of marine shales: A case study of the Wufeng formation–Longmaxi Formation in the Luzhou area, southern Sichuan Basin. Nat. Gas. Ind. B 2022, 9, 394–410. [Google Scholar] [CrossRef]
- Zhu, H.; Ju, Y.; Yang, M.; Huang, C.; Feng, H.; Qiao, P.; Ma, C.; Su, X.; Lu, Y.; Shi, E.; et al. Grain-scale petrographic evidence for distinguishing detrital and authigenic quartz in shale: How much of a role do they play for reservoir property and mechanical characteristic? Energy 2022, 239, 122176. [Google Scholar] [CrossRef]
- Ye, Y.; Tang, S.; Xi, Z.; Lin, D.; Shen, Y. Factors Controlling Brittleness of the Wufeng–Longmaxi Shale in the Yangtze Platform, South China: Insights from Geochemistry and Shale Composition. Energ. Fuel 2022, 36, 10945–10959. [Google Scholar] [CrossRef]
- Ge, X.; Mou, C.; Yu, Q.; Liu, W.; Men, X.; He, J. The geochemistry of the sedimentary rocks from the Huadi No. 1 well in the Wufeng-Longmaxi formations (Upper Ordovician-Lower Silurian), South China, with implications for paleoweathering, provenance, tectonic setting and paleoclimate. Mar. Pet. Geol. 2019, 103, 646–660. [Google Scholar] [CrossRef]
- Fu, X.; Wang, J.; Wen, H.; Wang, Z.; Nie, Y. Carbon-isotope record and paleoceanographic changes prior to the OAE 1a in the Eastern Tethys: Implication for the accumulation of organic-rich sediments. Mar. Petrol. Geol. 2019, 113, 104049. [Google Scholar] [CrossRef]
- Dong, T.S.M.Y. Quartz types and origins in the paleozoic Wufeng-Longmaxi Formations, Eastern Sichuan Basin, China: Implications for porosity preservation in shale reservoirs. Mar. Petrol. Geol. 2019, 106, 62–73. [Google Scholar] [CrossRef]

Disclaimer/Publisher’s Note: The statements, opinions and data contained in all publications are solely those of the individual author(s) and contributor(s) and not of MDPI and/or the editor(s). MDPI and/or the editor(s) disclaim responsibility for any injury to people or property resulting from any ideas, methods, instructions or products referred to in the content. |
© 2023 by the authors. Licensee MDPI, Basel, Switzerland. This article is an open access article distributed under the terms and conditions of the Creative Commons Attribution (CC BY) license (https://creativecommons.org/licenses/by/4.0/).
Share and Cite
Zhou, T.; Zhu, Q.; Zhu, H.; Zhao, Q.; Shi, Z.; Zhao, S.; Zhang, C.; Qi, L.; Sun, S.; Zhang, Z.; et al. Relative Sea-Level Fluctuations during Rhuddanian–Aeronian Transition and Its Implication for Shale Gas Sweet Spot Forming: A Case Study of Luzhou Area in the Southern Sichuan Basin, SW China. J. Mar. Sci. Eng. 2023, 11, 1788. https://doi.org/10.3390/jmse11091788
Zhou T, Zhu Q, Zhu H, Zhao Q, Shi Z, Zhao S, Zhang C, Qi L, Sun S, Zhang Z, et al. Relative Sea-Level Fluctuations during Rhuddanian–Aeronian Transition and Its Implication for Shale Gas Sweet Spot Forming: A Case Study of Luzhou Area in the Southern Sichuan Basin, SW China. Journal of Marine Science and Engineering. 2023; 11(9):1788. https://doi.org/10.3390/jmse11091788
Chicago/Turabian StyleZhou, Tianqi, Qingzhong Zhu, Hangyi Zhu, Qun Zhao, Zhensheng Shi, Shengxian Zhao, Chenglin Zhang, Ling Qi, Shasha Sun, Ziyu Zhang, and et al. 2023. "Relative Sea-Level Fluctuations during Rhuddanian–Aeronian Transition and Its Implication for Shale Gas Sweet Spot Forming: A Case Study of Luzhou Area in the Southern Sichuan Basin, SW China" Journal of Marine Science and Engineering 11, no. 9: 1788. https://doi.org/10.3390/jmse11091788
APA StyleZhou, T., Zhu, Q., Zhu, H., Zhao, Q., Shi, Z., Zhao, S., Zhang, C., Qi, L., Sun, S., Zhang, Z., & Zhu, L. (2023). Relative Sea-Level Fluctuations during Rhuddanian–Aeronian Transition and Its Implication for Shale Gas Sweet Spot Forming: A Case Study of Luzhou Area in the Southern Sichuan Basin, SW China. Journal of Marine Science and Engineering, 11(9), 1788. https://doi.org/10.3390/jmse11091788