Article

Effect of Parameters of Ditch Geometry on the Uniformity of Water Filling in Ship Lock Chambers

Nanjing Hydraulic Research Institute, Nanjing 210029, China
*
Authors to whom correspondence should be addressed.
J. Mar. Sci. Eng. 2024, 12(1), 86; https://doi.org/10.3390/jmse12010086
Submission received: 21 November 2023 / Revised: 22 December 2023 / Accepted: 25 December 2023 / Published: 1 January 2024
(This article belongs to the Section Ocean Engineering)

Abstract

:
The design of ditch structures in ship locks has an important influence on reducing water flow energy, improving the uniformity of water filling in lock chambers, and reducing the force acting on mooring ships. Existing studies on the mechanisms of flow fields and mooring conditions under the influence of geometric structural changes in ditches are insufficient, and research is limited by the complexity of the problem. Based on OpenFOAM v8, a numerical simulation of the flow structure in a lock chamber was carried out. Taking into account the ditch width, ditch depth, and sill height of the side wall as the research variables, the influence of structural changes in four single ditches on the uniformity of water filling in the lock chamber is systematically discussed. The results show that under a complex boundary constraint, the flow is diffuse in the ditch and the lock chamber, and the filling of the lock chamber is not uniform. The uniformity of water filling is closely related to the arrangement of the ditch geometry. Through the comprehensive analysis of multiple factors, some parameter thresholds were obtained to provide theoretical guidance for ditch design. It is hoped that through improved design, allowing an increase in the uniformity of water filling, the lock chamber will reach a relatively optimal state.

1. Introduction

Inland navigation plays an important role in trade and commerce in many countries because of its low cost and great efficiency [1,2,3]. Ship locks are one of the important forms of navigational architecture to overcome upstream and downstream water level differences in rivers. In addition, the construction of ship locks can often reflect the capacity for inland navigation, addressing the increasing demand for waterway transportation in China in recent decades [4,5]. A ship lock not only needs to be able to fill with water and empty out quickly within a specified time, but also needs to ensure the safety of the mooring ship and the lock itself [6]. In order to meet the ever-increasing demands of water heads and the large-scale planes of lock chambers, instantaneous discharge must gradually increase. Inadequate design may lead to poor mooring conditions in the lock chamber, increase mooring line force, and even cause accidents such as hawser breakage, unwanted displacement of the ship, and collisions of the ship with the lock structure [7]. Sometimes, it is necessary to extend the opening time of the water conveyance valve, adopt more complex filling and emptying system types and energy dissipators, sacrifice passing capacity, and increase the construction cost of the ship lock. Therefore, the design of the energy dissipator in a ship lock is vital to balance the safety and costs of ship lock construction.
The ditch is a typical type of energy dissipator in ship locks. Yang [8,9] studied the energy dissipation effect of the ditch through a partly physical model test and three-dimensional numerical simulations. The results showed that the water flow in the studied ditch is strongly mixed, the water surface fluctuation in the lock chamber is small, and the energy dissipation effect is good. Under the same conditions, the structure of the ditch can be simple, and its energy dissipation effect is better than that of a cover plate energy dissipator. The energy dissipation effects of single-ditch, two-ditch, and three-ditch structures were compared [10,11]; the three-ditch structure is the best, because multiple ditches have a large energy dissipation space, flexible layout, and provide more uniform water filling, which is superior in reducing the force on the ship caused by transverse flow in the lock chamber. Zhu [12] optimized the detailed layout of the two-ditch structure, such as the orifice size and the height of the energy dissipation beam, using a numerical simulation. Chen [13], Li [14], and Li [15] studied the energy dissipation effects of the layouts of vertical multi-layer side ports in the ditch, and some parameters such as the number of layers, vertical spacing, and port angle were quantitatively compared. Zhou [16] compared the energy dissipation effects of several different layered structures of a ditch and cover plate, such as single- or double-top port structures, a convex or concave layout of the cover plate, and a concave layout of the cover plate with an energy dissipation sill; of these structures, the latter has the best energy dissipation effect. Ma [17] established a comprehensive uniform-strength evaluation to judge mooring conditions. The results showed that this method effectively responded to the impacts of three energy dissipators, namely, a single ditch, ditch and grille, and ditch and cover plate; the mooring condition with the ditch and cover plate dissipator is the best. However, it is recommended that a ditch and grille dissipator be used for ultra-high-head locks, considering its efficiency and energy dissipation effects. There are many comparative studies on the energy dissipation characteristics of different energy dissipators with large geometric differences, and a variety of different types of energy dissipators have been developed. However, there have been few systematic studies based on a large number of cases evaluating detailed geometric changes made to the same energy dissipator. Therefore, the relative optimal layout and energy dissipation potential of a certain energy dissipator have not been examined. Some studies are based on the steady flow state, which may have some gaps due to the unsteady flow state in lock chambers.
A number of high-head ship locks have been built in China. For example, the Three Gorges dual-lane five-step ship lock [18,19] has a lock chamber with effective dimensions of 280 m × 34 m (length × width), a maximum water head of 113.0 m, and a maximum head of 45.2 m for the intermediate step. The Datengxia ship lock [20] has a lock chamber with effective dimensions of 280 m × 34 m (length × width) and a maximum water head of 40.25 m. The construction technology of ship locks is relatively mature, but the understanding of the flow fields and dissipation mechanisms lags behind engineering practice. There are many types of lock filling and emptying systems [21], the geometric structure is complex, and the shape is ever-changing. Physical model tests [22,23,24,25] and three-dimensional turbulence numerical simulation [26,27,28,29,30] are widely used in hydraulics research for ship locks. However, the research has focused on specific projects; therefore, it has engineering practicability but poor universality. A detailed structural adjustment of the energy dissipator could improve the mooring conditions of lock chambers. For example, in the physical model test of the filling and emptying system of the Guigang second-lane ship lock [31], by adjusting the orifice layout of the energy dissipation beam in a two-ditch system, the problem was effectively solved. The problem, in this scenario, was that the transverse distribution of water flow in the lock chamber of the original scheme was uneven and the transverse force of the ship did not meet the requirements. However, sometimes, in order to meet the mooring conditions of the lock chamber, researchers may need to modify the structure many times. If the flow structure of the lock chamber can be clarified, the mechanisms and variation laws of a large number of detailed structural changes to the mooring conditions can be obtained to guide the design of the energy dissipator. This will greatly reduce the cost of the preliminary demonstration. Due to the existence of a variety of complex flow field structures such as high-velocity jets, water flow mixing under the boundary constraints, water flow collision, vortex separation, strong turbulence, and free-surface fluctuation in the lock chamber, the influencing factors are particularly complex. Researchers have paid more attention to the force on the ship in the physical model test, which reflects the comprehensive response to various complex flows. However, the influencing factors of the mooring conditions are not very clear due to the complex flow field. The research on the mechanisms of flow field changes and the influence mechanisms of mooring conditions under the structural changes in energy dissipators is insufficient.
Using the in-chamber longitudinal culvert system [32], the ditch width, the ditch depth, and the sill height were taken as research variables in this study. Based on the OpenFOAM numerical simulation, the influences of the detailed geometric changes in the ditch on the water flow structure and the uniformity of water filling in the lock chamber were explored. The aim was to provide further theoretical guidance for ditch design.

2. Materials and Methods

2.1. Geometry and Simulated Cases

In this study, a part of the filling and emptying system of a high-head ship lock was used to establish a numerical model. This study focuses on the ditch structure. In order to avoid the influence of other factors, the culvert was ignored in the domain of numerical simulation, so the generalized model of ‘side ports + ditch + lock chamber’ was established. There are 5 side ports on each side (a total of 4 rows and 20 ports), four single ditches, and the lock chamber. The size of a side port is 0.43 m × 1.50 m (port width × port height), the center spacing of ports is 6.0 m, the length of the port is 1.5 m, the radius of the port round fillet is 0.3 m, the size of the sill is 0.5 m × 0.5 m, and the area of the lock chamber is 40 m × 34 m (length × width). The research structure and variables are shown in Figure 1. In order to explore the influence of the ditch width (B), ditch depth (L), and sill height (D), 36 cases were designed, as shown in Table 1.

2.2. Numerical Model

The water filling of the lock chamber has the characteristics of being incompressible, unsteady, and turbulent, and having a free surface. In this study, the realizable k-ε model and the VOF method were used for the simulation [33,34,35].
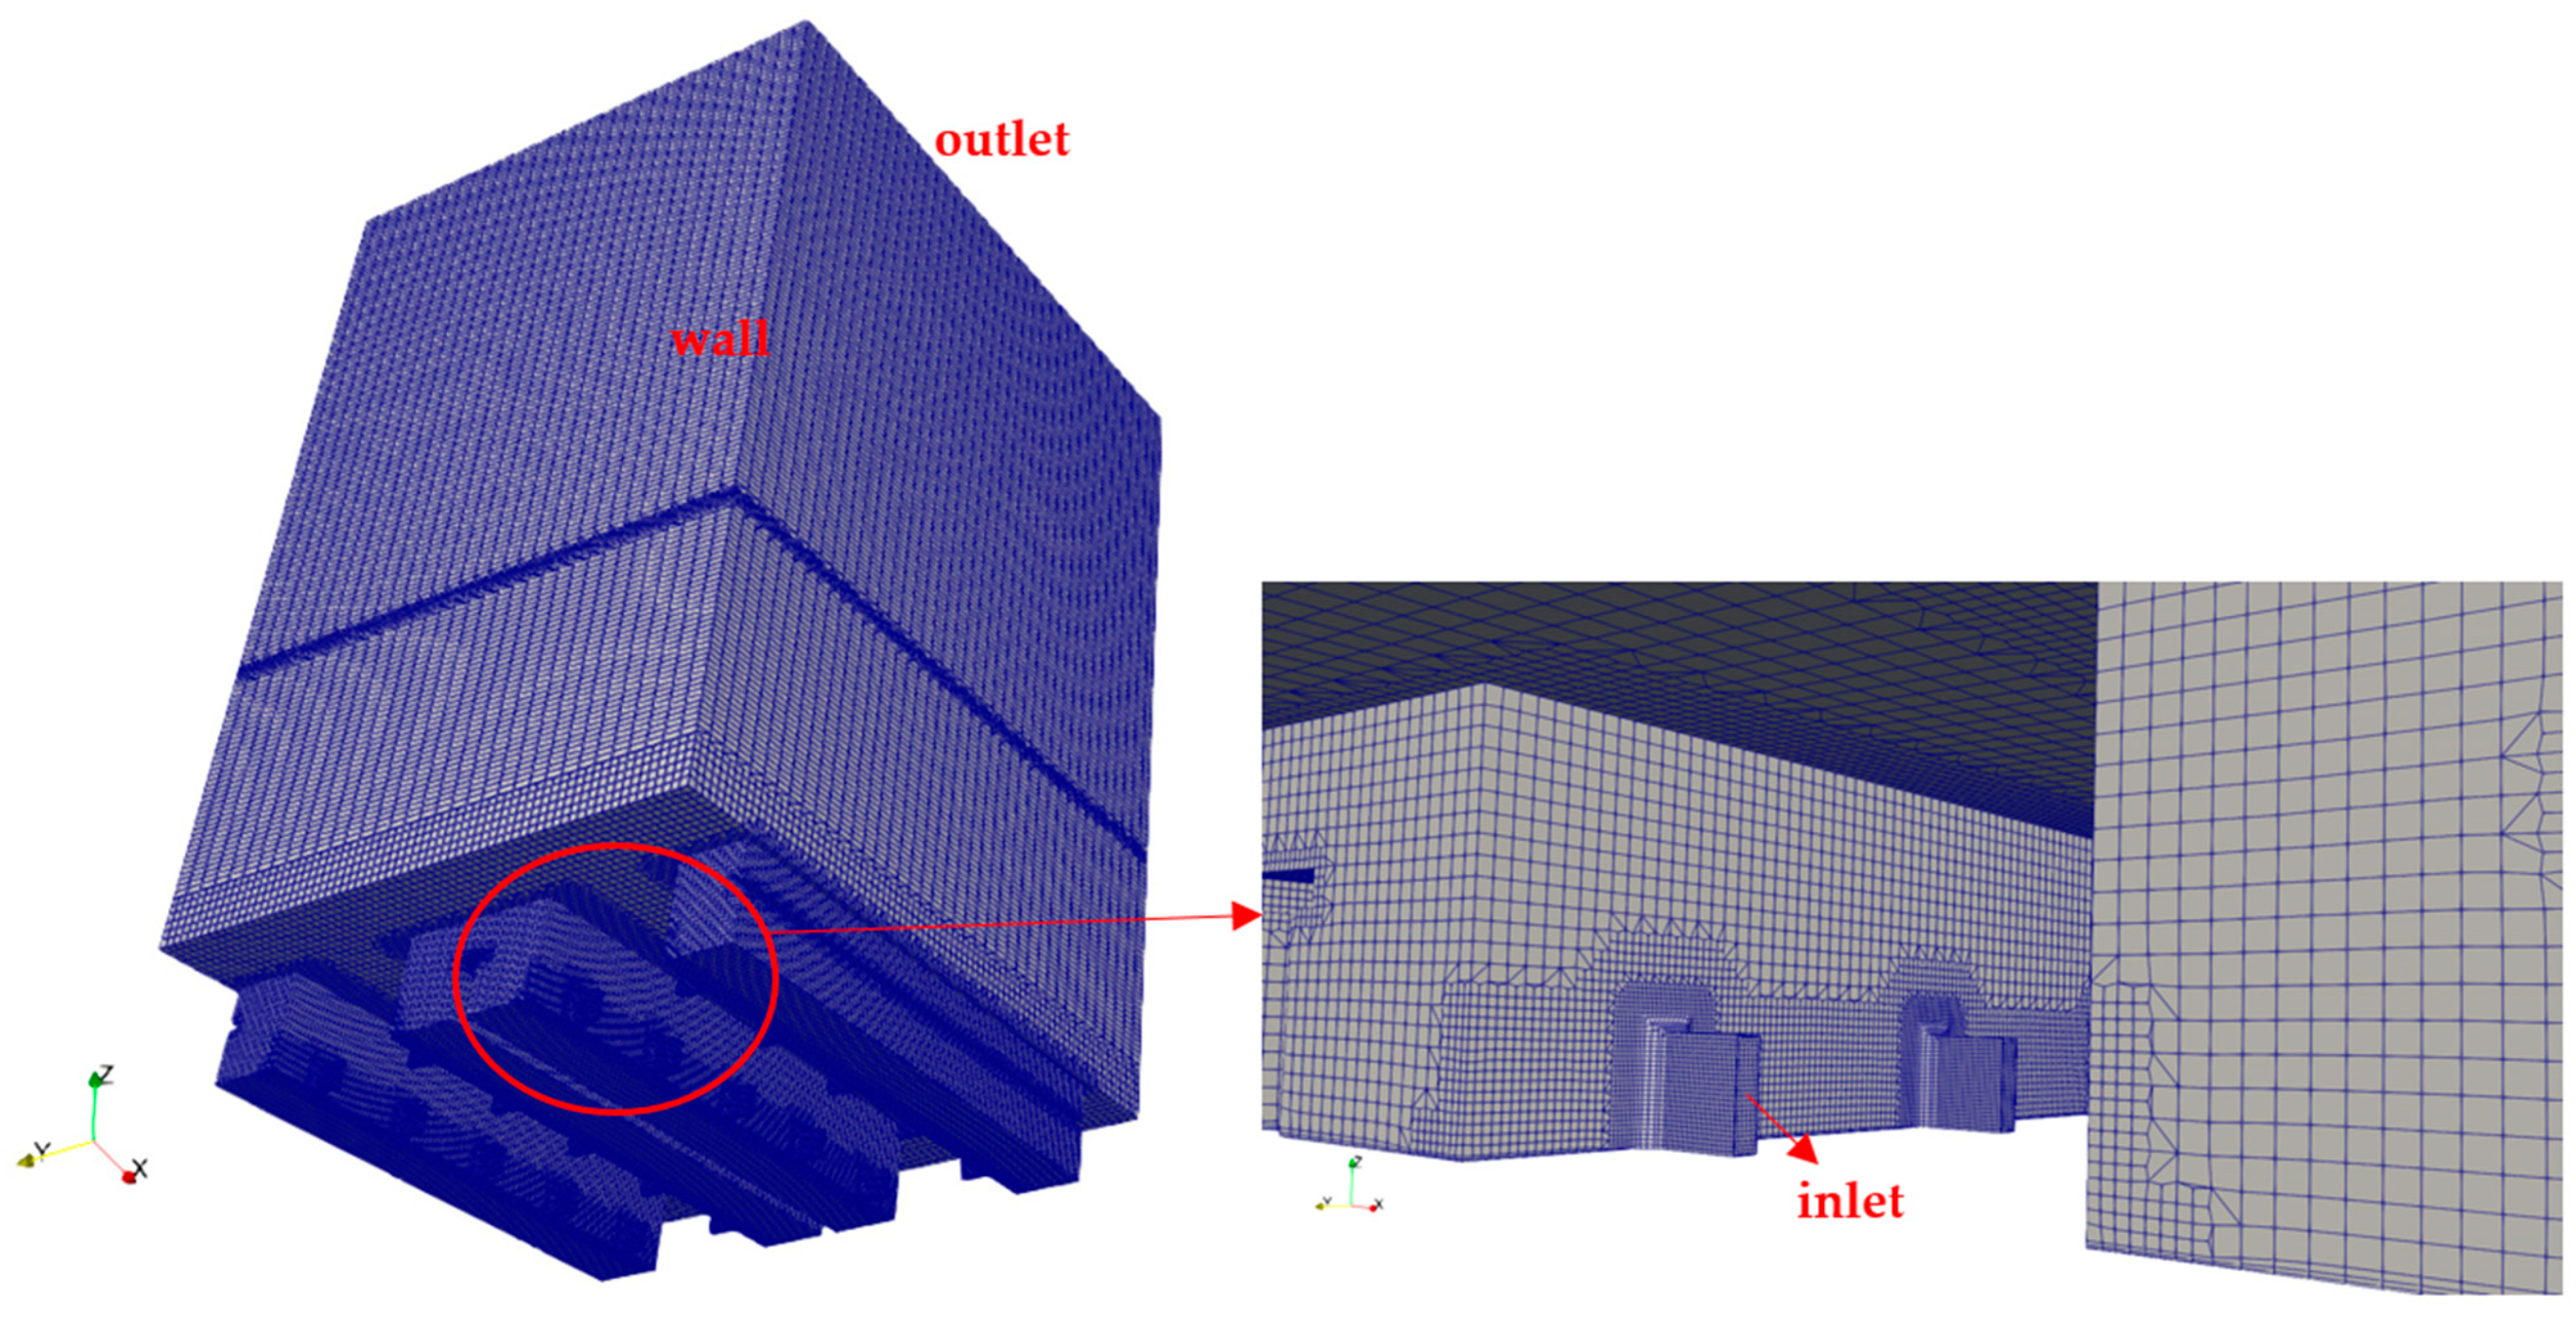
The blockMesh and snappyHexMesh utilities were used to generate the mesh, and the mesh quality was checked by checkMesh. In the process of meshing, the mesh refinement of the local surface and volume were carried out in the area of the small geometric size and complex flow field, such as the port and ditch. In addition, the boundary layer mesh was generated on the wall of the port area. The mesh is shown in Figure 2, and the sensitivity of the mesh size to the calculation results is given in Section 2.4.
The boundary conditions adopted in OpenFOAM v8 are shown in Table 2. The study assumes that all the ports have the same discharge with the consistent changing process, and the velocity of the port inlet is evenly distributed. The time-varying velocity boundary condition uniformFixedValue was used for the velocity of the port inlet. According to the physical model test, the measured discharge of the lock chamber was reduced in proportion to the chamber area of the mathematical model, and then converted into the velocity process according to the port area. The unsteady velocity of each port inlet is shown in Figure 3; the pressure boundary condition was fixedFluxPressure, and the fluid volume fraction was 1. The outlet boundary was set at the top of the lock chamber, the pressure was set to 0, and the velocity boundary condition was zeroGradient. The remaining boundary was the wall, the velocity boundary condition was noSlip, the pressure boundary condition was fixedFluxPressure, and the wall function was used to solve the flow near the wall. The working head of the lock chamber was 40.9 m, and the initial water depth was 6.8 m. In the calculation process, the mesh adaptive technology was used to dynamically refine the mesh of the rising water surface.
The model used the two-phase transient solver interFoam; the schemes of time and spatial discretization adopted in OpenFOAM v8 are shown in Table 3. The PIMPLE algorithm was used for pressure–velocity coupling. Since the velocity in the fluid domain was not uniform, the model allowed the time step to be automatically adjusted according to the set maximum Courant number. The maximum Courant number should not be greater than 6 [36]. Considering the computational efficiency and accuracy, the maximum Courant number was set to 5, and the maximum alpha Courant number was set to 1. The initial time step was 0.005 s, and the time step in the calculation process was approximately 0.003~0.02 s. The visualization of numerical results was performed in ParaView.

2.3. Index

The water enters the ditch through ports, and then enters the lock chamber. There are dramatic changes in the solid boundary. At the same time, the area of the flowing cross section often expands significantly, resulting in different water flow directions, and the vertical velocity distribution is always uneven. At the bottom of the lock chamber, the flow direction of each stream from the port is inconsistent, and there are various hydraulic phenomena such as collision and mixing. Water surface fluctuation, longitudinal and transverse velocity, and various local hydraulic phenomena will occur in the lock chamber. This will cause the pressure around the mooring ship to become unequal, resulting in force on the ship.
The uniformity of the vertical velocity in the lock chamber is a direct representation and the essential condition of the force exerted on the ship. This may be via dispersing the discharge into the lock chamber; directly improving the uniformity of water filling; or by setting the energy dissipator, causing the water flow to become mixed and dissipating the local energy and turbulence. If the water filling in the lock chamber is completely uniform, the water surface of the lock chamber rises completely and steadily. In addition, the ship is mainly subjected to a vertical upward force, and the longitudinal and transverse forces exerted on the ship will be very small.
Considering that the existence of reverse velocity in the chamber increases the non-uniformity of filling, this study considers the absolute value of the vertical velocity; the vertical velocity uniformity is established as the evaluation index. The formula is as follows:
V Z A = A V Z 2 d A A
where V Z A is the vertical velocity uniformity for a certain area, A is the calculated area, and V Z is the vertical velocity. The research area of the vertical velocity uniformity is 3.6 m below the water surface of the lock chamber (the draft depth of a 3000 t level ship). This is called the draft critical plane, and its index can characterize the energy dissipation effect and the mooring conditions of the lock chamber.

2.4. Mesh Sensitivity

Based on the A33 case, three different sizes of mesh were used for the test. The finer the mesh size of an area with a smaller geometric size such as the port, the coarser the mesh size of an area with a larger geometric size such as the lock chamber. In order to capture the rising water surface of the lock chamber more accurately, the ratio of the horizontal mesh size to the vertical mesh size of the lock chamber was set at 3:1. Moreover, the mesh of the rising water surface in the lock chamber was adaptively refined. The mesh information for coarse, medium, and fine mesh is shown in Table 4.
The plane was 1 m higher than the bottom plate of the chamber, and the plane at 3.6 m below the water surface was used as the research area to calculate the vertical velocity uniformity. The results are shown in Figure 4. It can be seen that the vertical velocity uniformity of different mesh sizes is basically the same at all times. The maximum vertical velocity uniformities of the coarse, medium, and fine meshes at the bottom of the chamber were 0.28 m/s, 0.27 m/s, and 0.29 m/s, respectively. The maximum vertical velocity uniformities of the coarse, medium, and fine meshes near the water surface of the chamber were 0.11 m/s, 0.10 m/s, and 0.11 m/s, respectively. Therefore, the medium mesh meets the requirements, and the medium mesh was selected for subsequent calculation.

2.5. Model Validation

The port jet at the bottom of the ditch is the classic wall jet. Based on the A31 case, the simulated data were compared with the physical model experimental data of the three-dimensional turbulent wall jet in a limited space [37]. For the wall jet, the coordinate origin O is located at the bottom central area of the port, the axial direction of the jet is the Y-axis, the transverse direction is the X-axis, the vertical direction is the Z-axis, the spanwise plane is XOY, and the vertical plane is YOZ.
The velocity distribution at 3.5 m from the middle port was extracted, and the dimensionless velocity distribution was verified, as shown in Figure 5 (VY is the axial velocity, VYm is the maximum axial velocity on the measured section, X and Z are coordinate values, Xm/2 is the velocity half-value width in the spanwise plane, and Zm/2 is the velocity half-value width in the vertical plane). The measured data in Figure 5 are cited from reference [38]. It can be seen that the simulated data are in good agreement with the measured data, so the numerical model can be used for practical engineering research.

3. Results and Discussion

3.1. Effect of Sill Height

3.1.1. Cross-Sectional Velocity Distribution

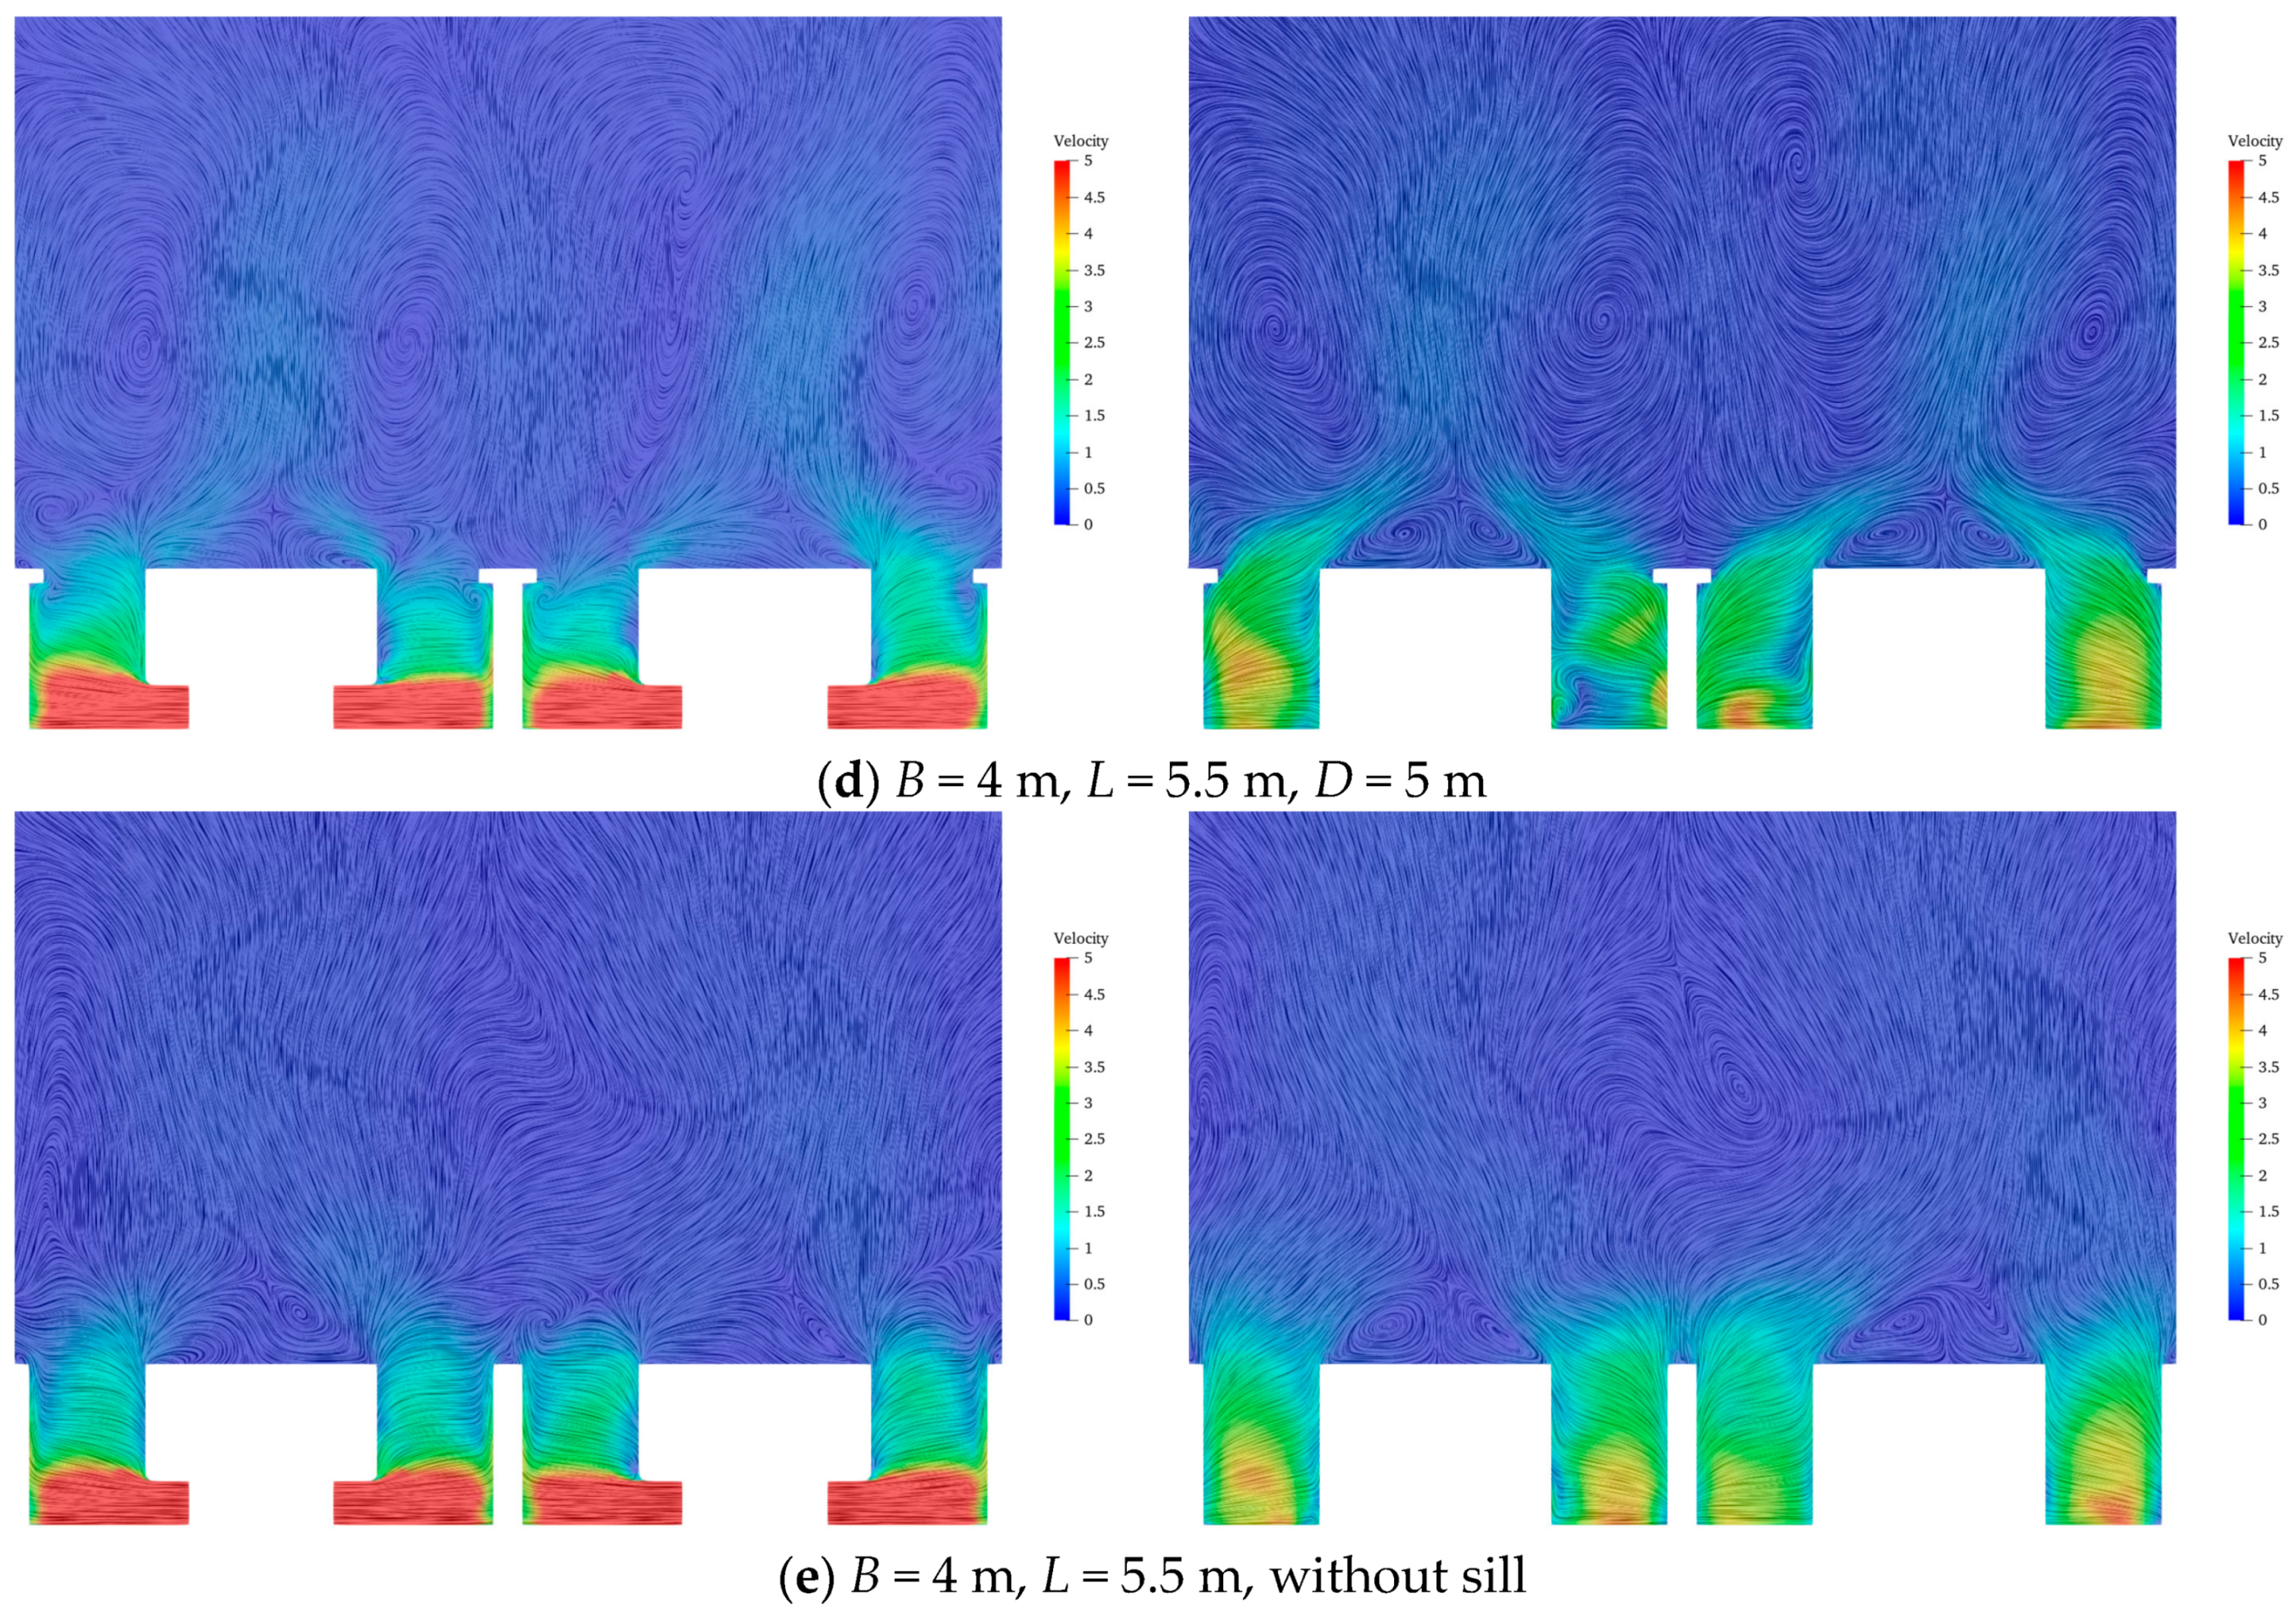
A32~A36 (B = 4 m, L = 5.5 m, D = 2~5 m, and without sill) were taken as typical cases. At the maximum discharge moment, the velocity distribution in the cross section of the lock chamber (represented by the middle plane of the middle port and the middle planes of the adjacent ports) is shown in Figure 6. It can be seen that the jet velocity from the port to the side wall of the ditch is relatively high. The main flow direction changes from a transverse to a vertical upward direction because of the limited flow area in the ditch. Furthermore, the velocity diffusion in the ditch obviously shows the energy dissipation effect. The port jet continuously drives the water body in the ditch to diffuse into the lock chamber. In general, there are two types of flow from the ditch to the lock chamber. One is the diffuse flow directly from the jet of the port to the lock chamber, and the stream line is shown as entering the lock chamber obliquely from the jet. The other is one wherein the water flow turns after the jet collides with the side wall, in the non-port outflow area. Consequently, it diffuses from the side wall of the ditch to the lock chamber, and the stream line is shown as entering the lock chamber obliquely from the side wall of the ditch. From the perspective of the velocity distribution in the ditch, the velocity near the side wall of the ditch is higher than the velocity on the port side due to the high flow velocity of the port jet. The jet directly rushes to the side wall, and it is forced to drive the water body of the ditch to spread obliquely to the lock chamber under the blocking effect of the side wall. In particular, when the retaining sill is not set, the flow climbs upward along the side wall. In order to further eliminate flow energy and adjust the transverse distribution of flow, it is meaningful to set up a retaining sill on the side wall of the ditch. However, the sill on the side wall reduces the water outlet area of the ditch, increasing the diffused velocity to some extent. Therefore, in theory, there is a contradiction between the influence of the sill on the mooring conditions, and the design parameters of the sill need to be studied.
When the height of the sill is 2 m, the sill is not much higher than the port, and the high velocity of the jet obliquely hits the sill directly. Although the jet impact can dissipate a large amount of flow energy, a part of the flow still directly crosses the sill to the lock chamber. The flow pattern in the ditch is complex, and the stream line above the sill is more distorted, accompanied by a shear vortex. The flow over the sill continues to climb up along the side wall and move upward along the wall of the lock chamber. When the height of the sill is 3 m, the sill is higher than the port for a certain distance, and the velocity from the port to the sill has a certain attenuation. Under the effect of the sill, the direction of the flow is adjusted and the flow energy is consumed. The velocity above the sill is reduced, the velocity in the lock chamber is fully diffused, the stream line is relatively smooth, and the overall flow pattern is good. When the height of the sill is 4 m, the distance between the sill and the port increases, and the flow velocity at the sill decreases further. Under the action of the sill, the flow deflects to the inside of the ditch, and the stream line near the sill is distorted. The degree of distortion is high, and a shear vortex is formed. This causes the flow to converge to the side of the port, superimposing the flow pattern of the non-port filling section. It increases the discharge on the side of the port at the bottom of the lock chamber. In addition, the local velocity increases and forms a ‘jet’ above the culvert in the lock chamber. When the height of the sill is 5 m, the distance between the sill and the port is further increased, the above phenomenon is more obvious, and a large range of vortex flows evolve on both sides of the ‘jet’ in the lock chamber. This is not conducive to uniform water filling in the lock chamber.

3.1.2. Filling Uniformity of the Lock Chamber

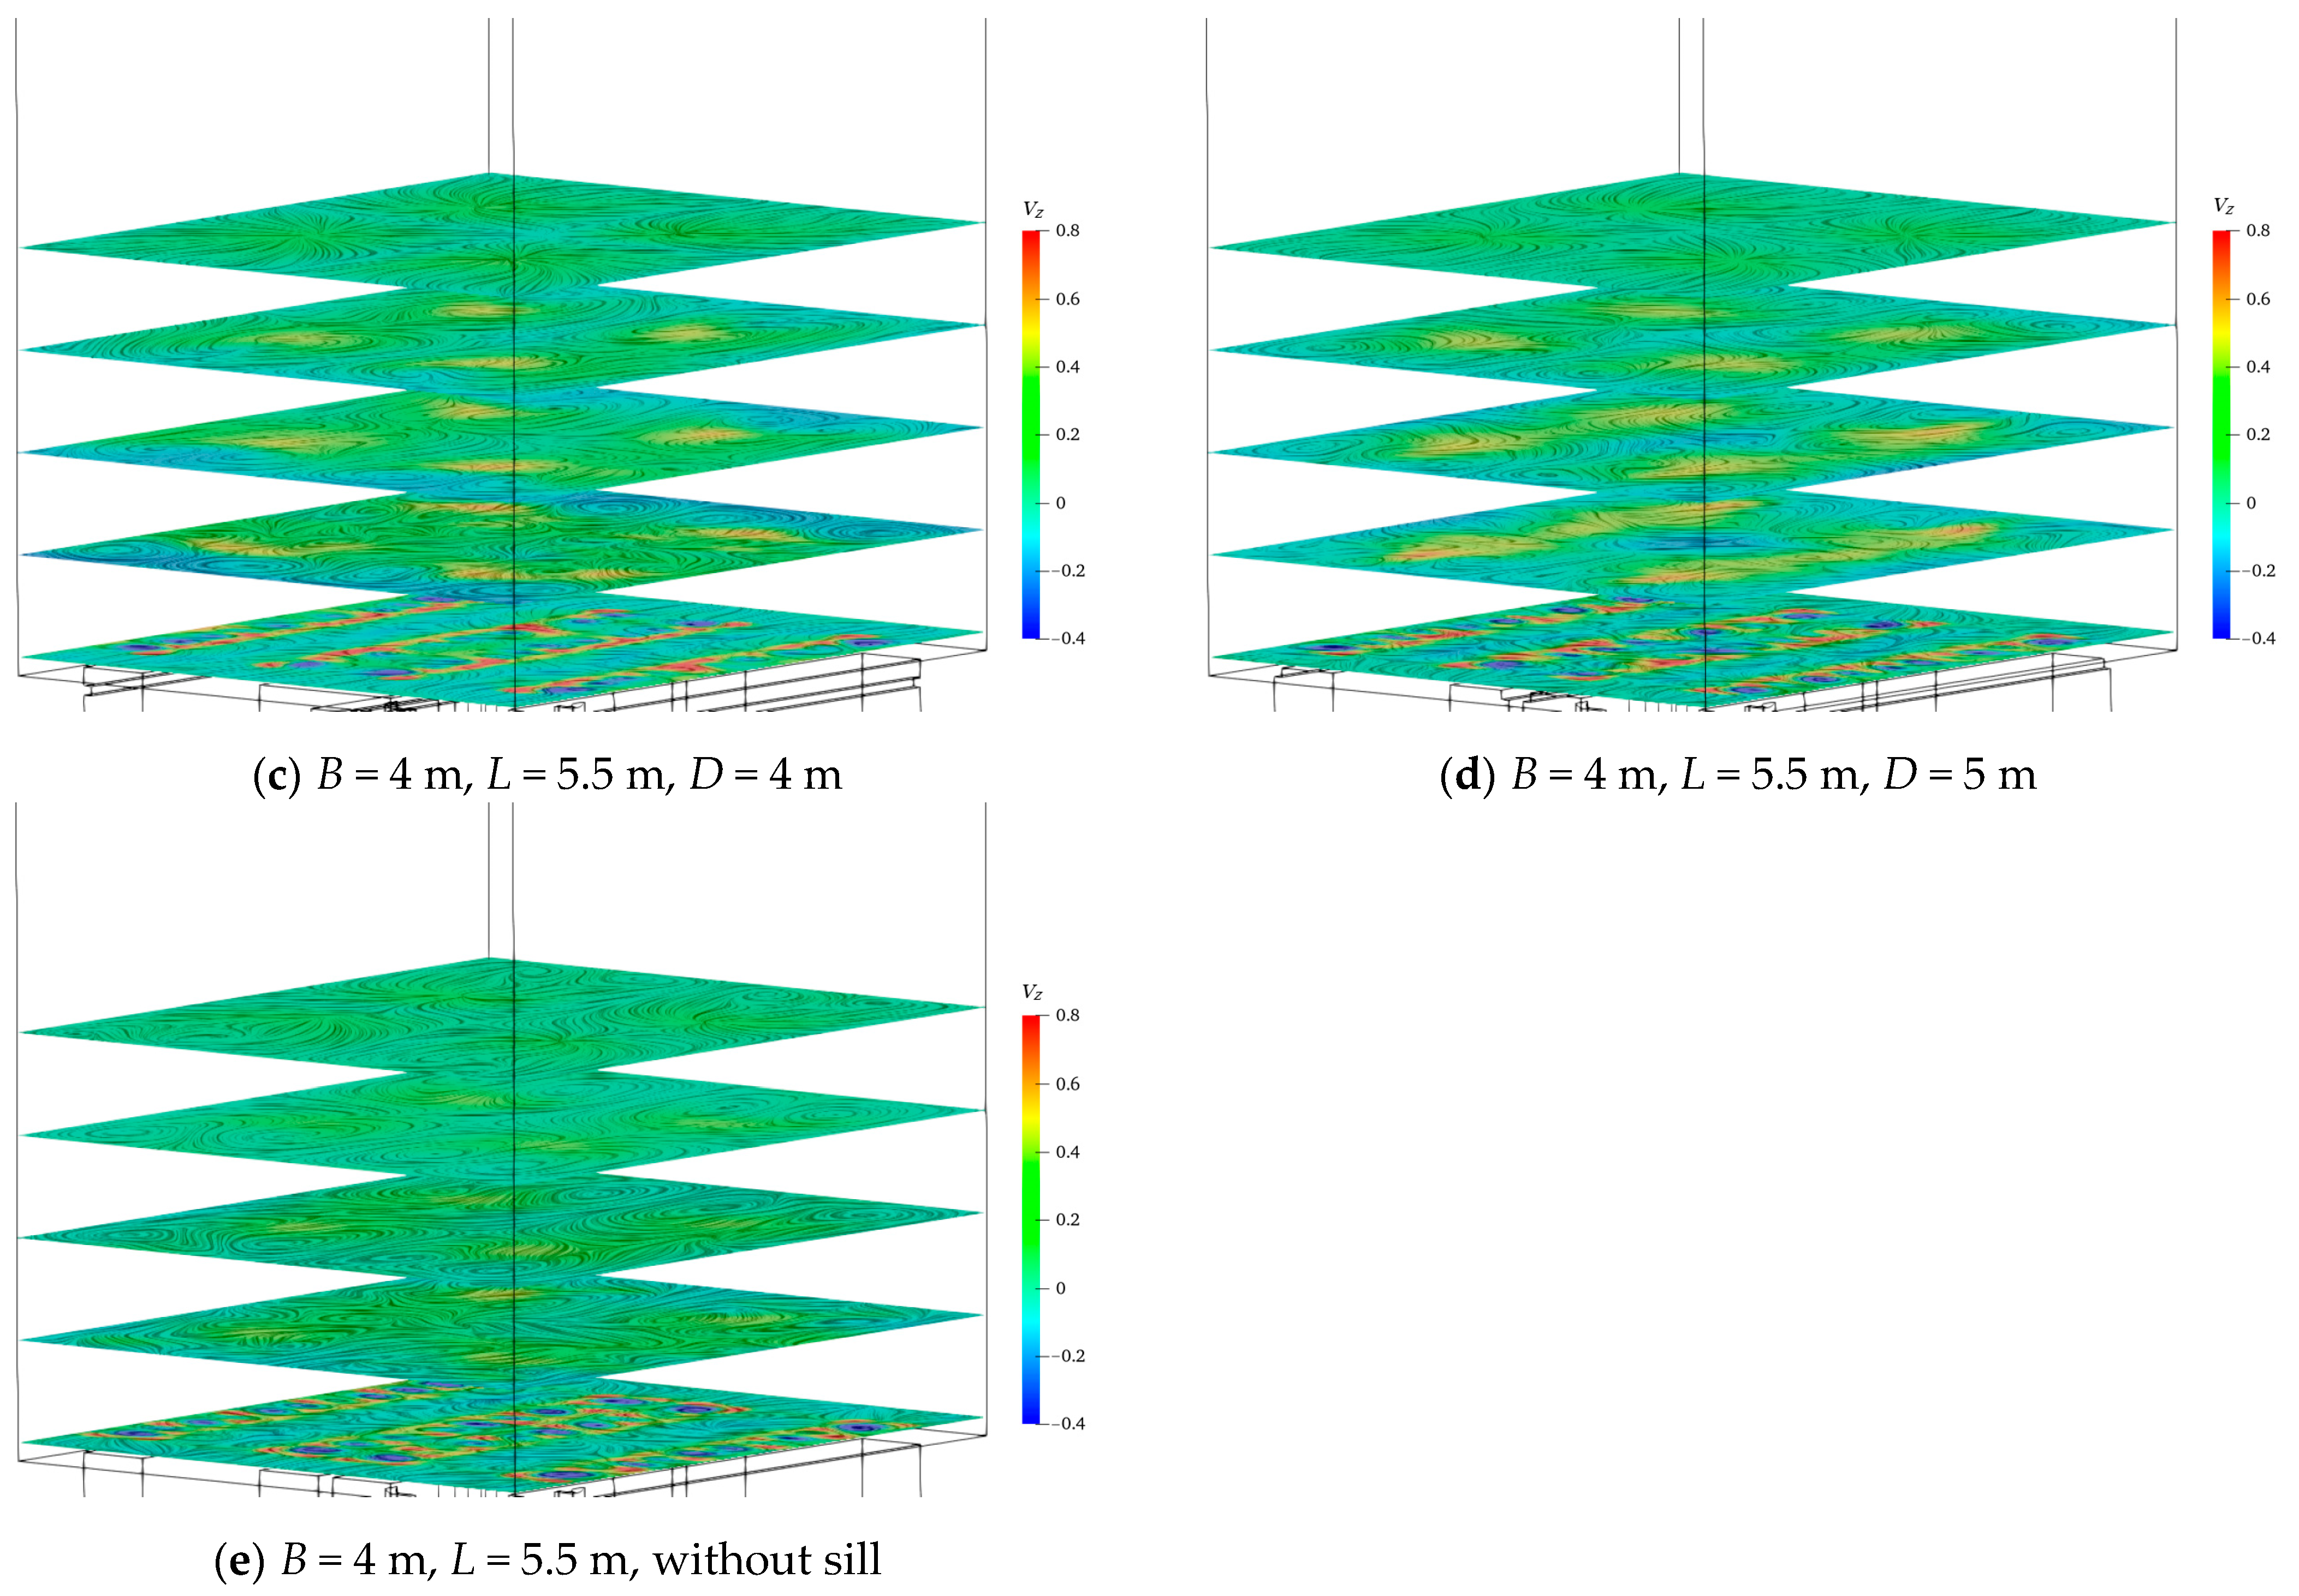
The vertical velocity distribution of the horizontal section of the lock chamber at the maximum discharge moment is shown in Figure 7. The vertical evolution of the velocity distribution of each case is similar. The bottom plane of the lock chamber is close to the ditch, so the local velocity is the greatest. In addition, the velocity direction is alternately positive and negative, indicating that the flow is disordered and the vortex and backflow are very complex. With the increase in the horizontal elevation of the lock chamber, the water flow further diffuses in the lock chamber, the local high velocity decreases, and the vertical velocity distribution tends to be uniform. In terms of the plane closest to the water surface of the lock chamber, the vertical velocity distribution has been basically uniform. In comparison, when the height of the sill is 3 m, the high-velocity value of the local part of the lock chamber is relatively low and the velocity distribution is relatively uniform. Consequently, the mooring condition of the lock chamber is improved.
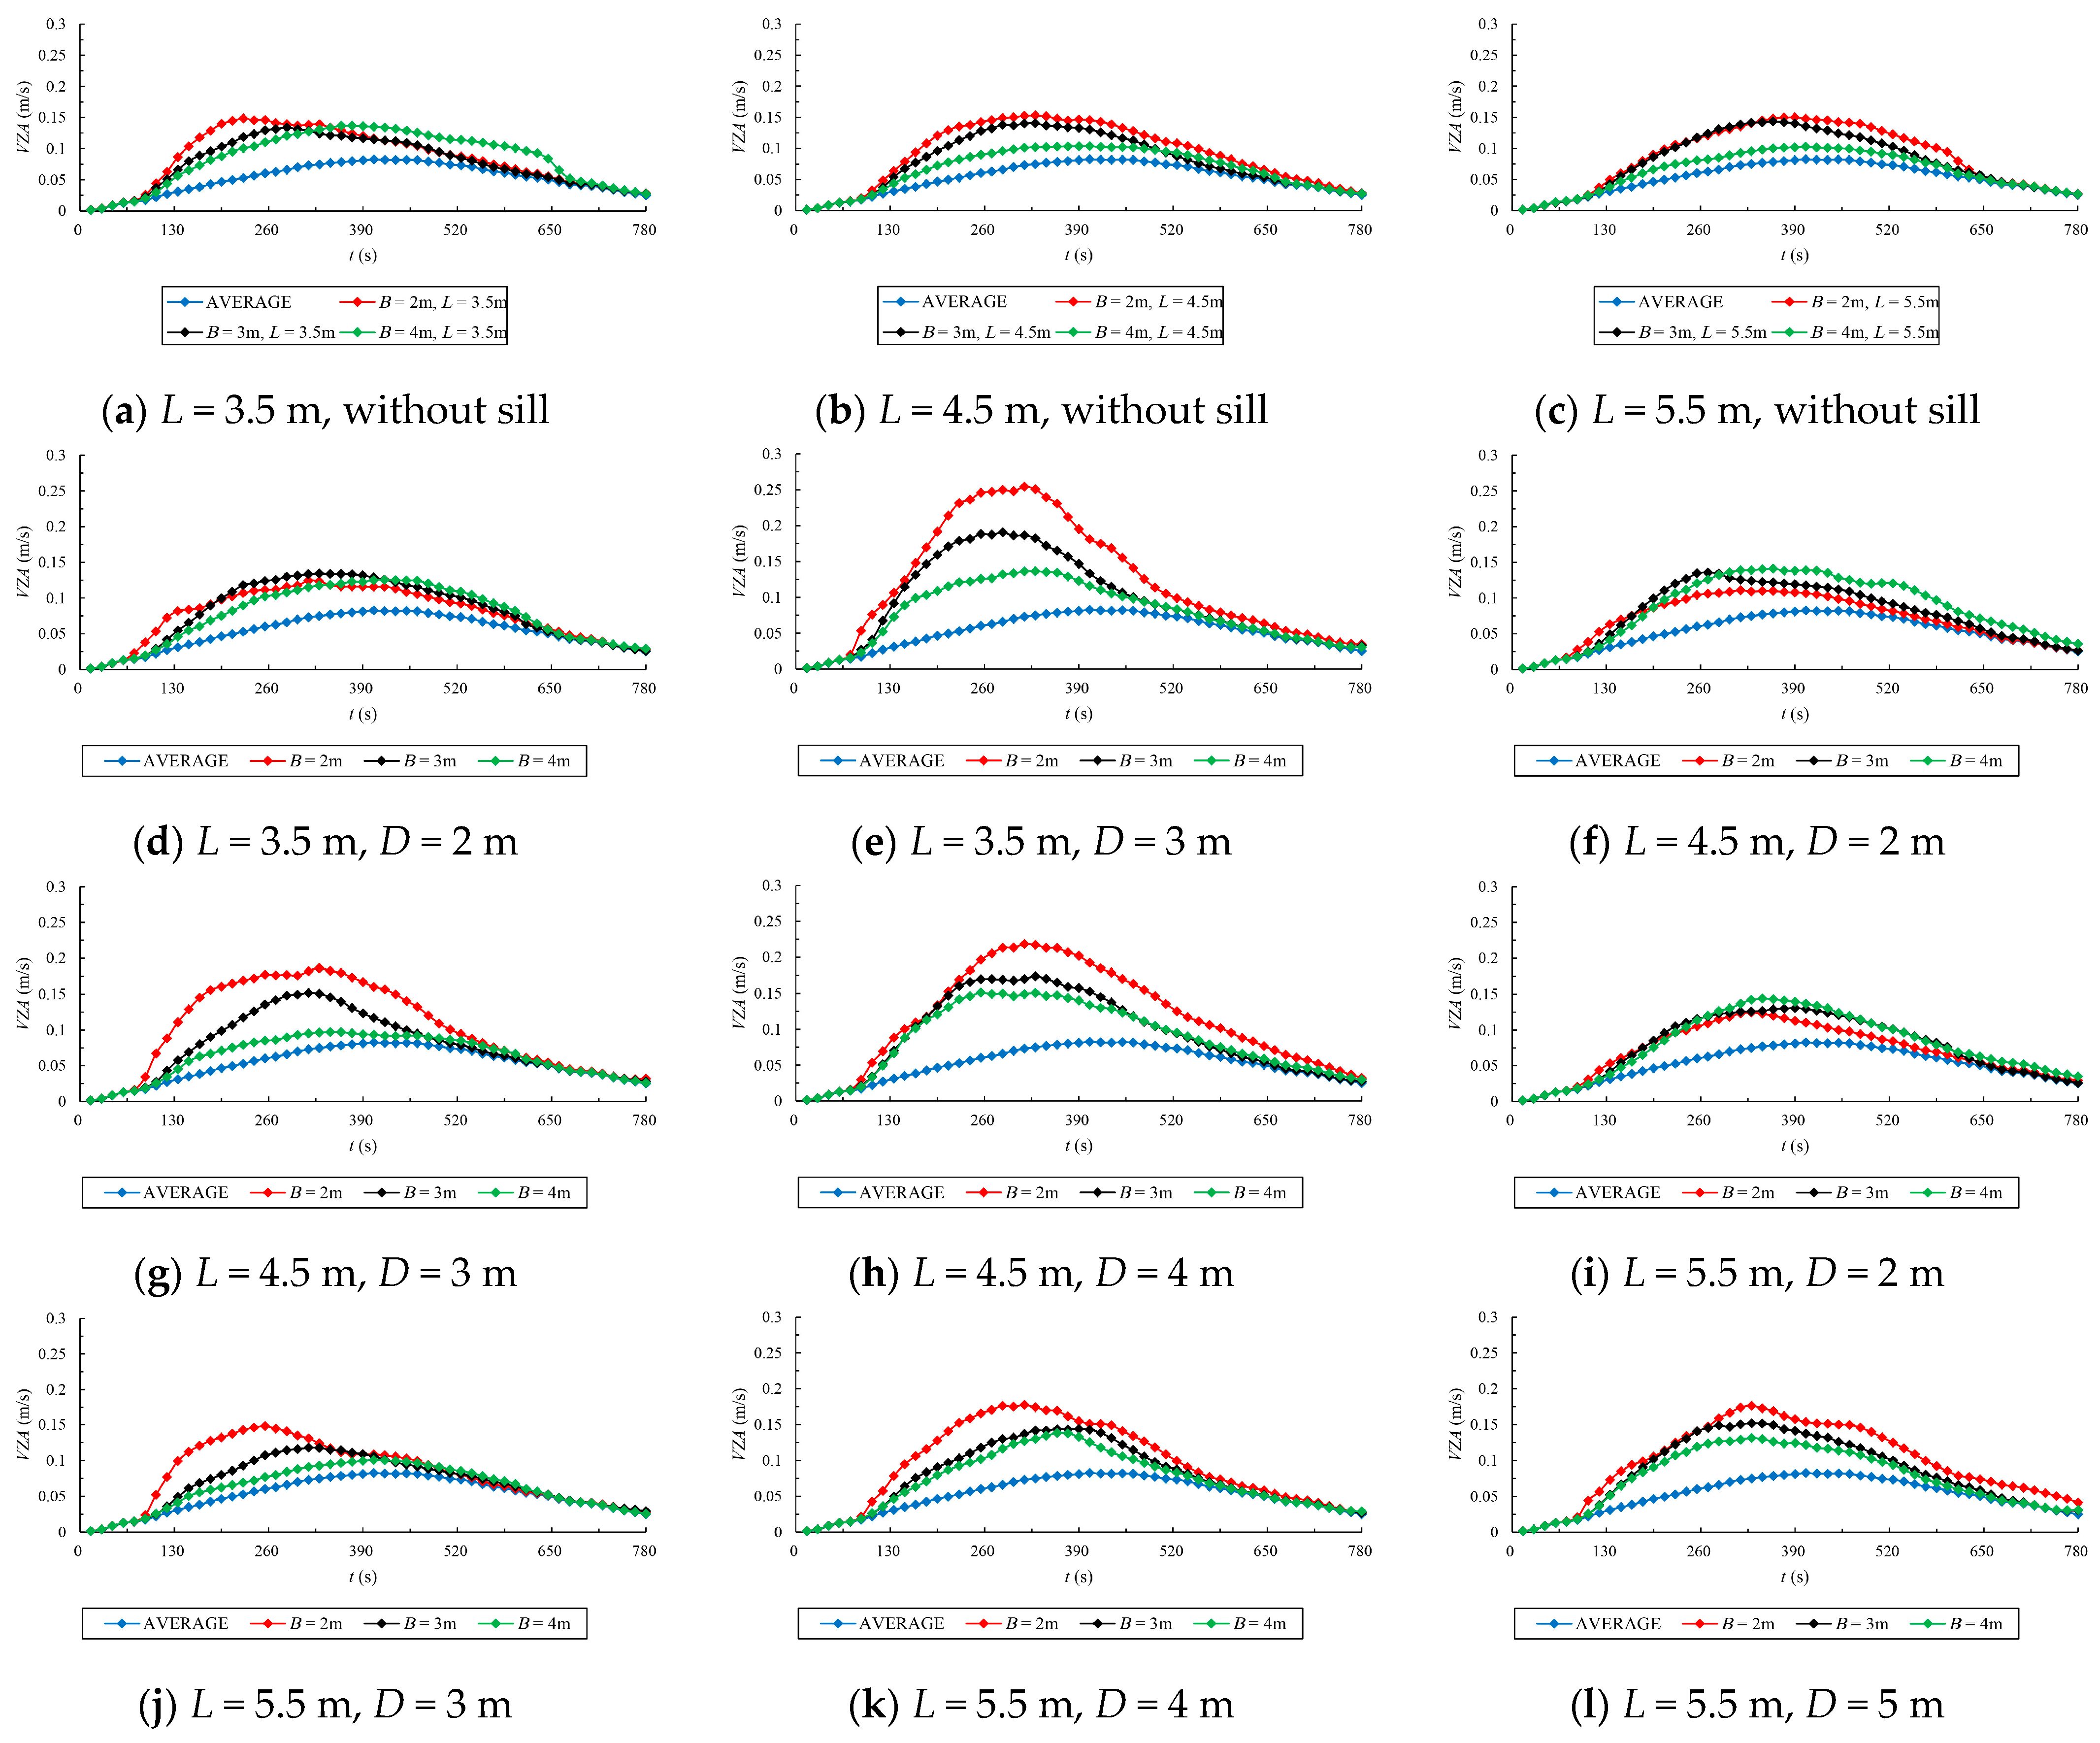
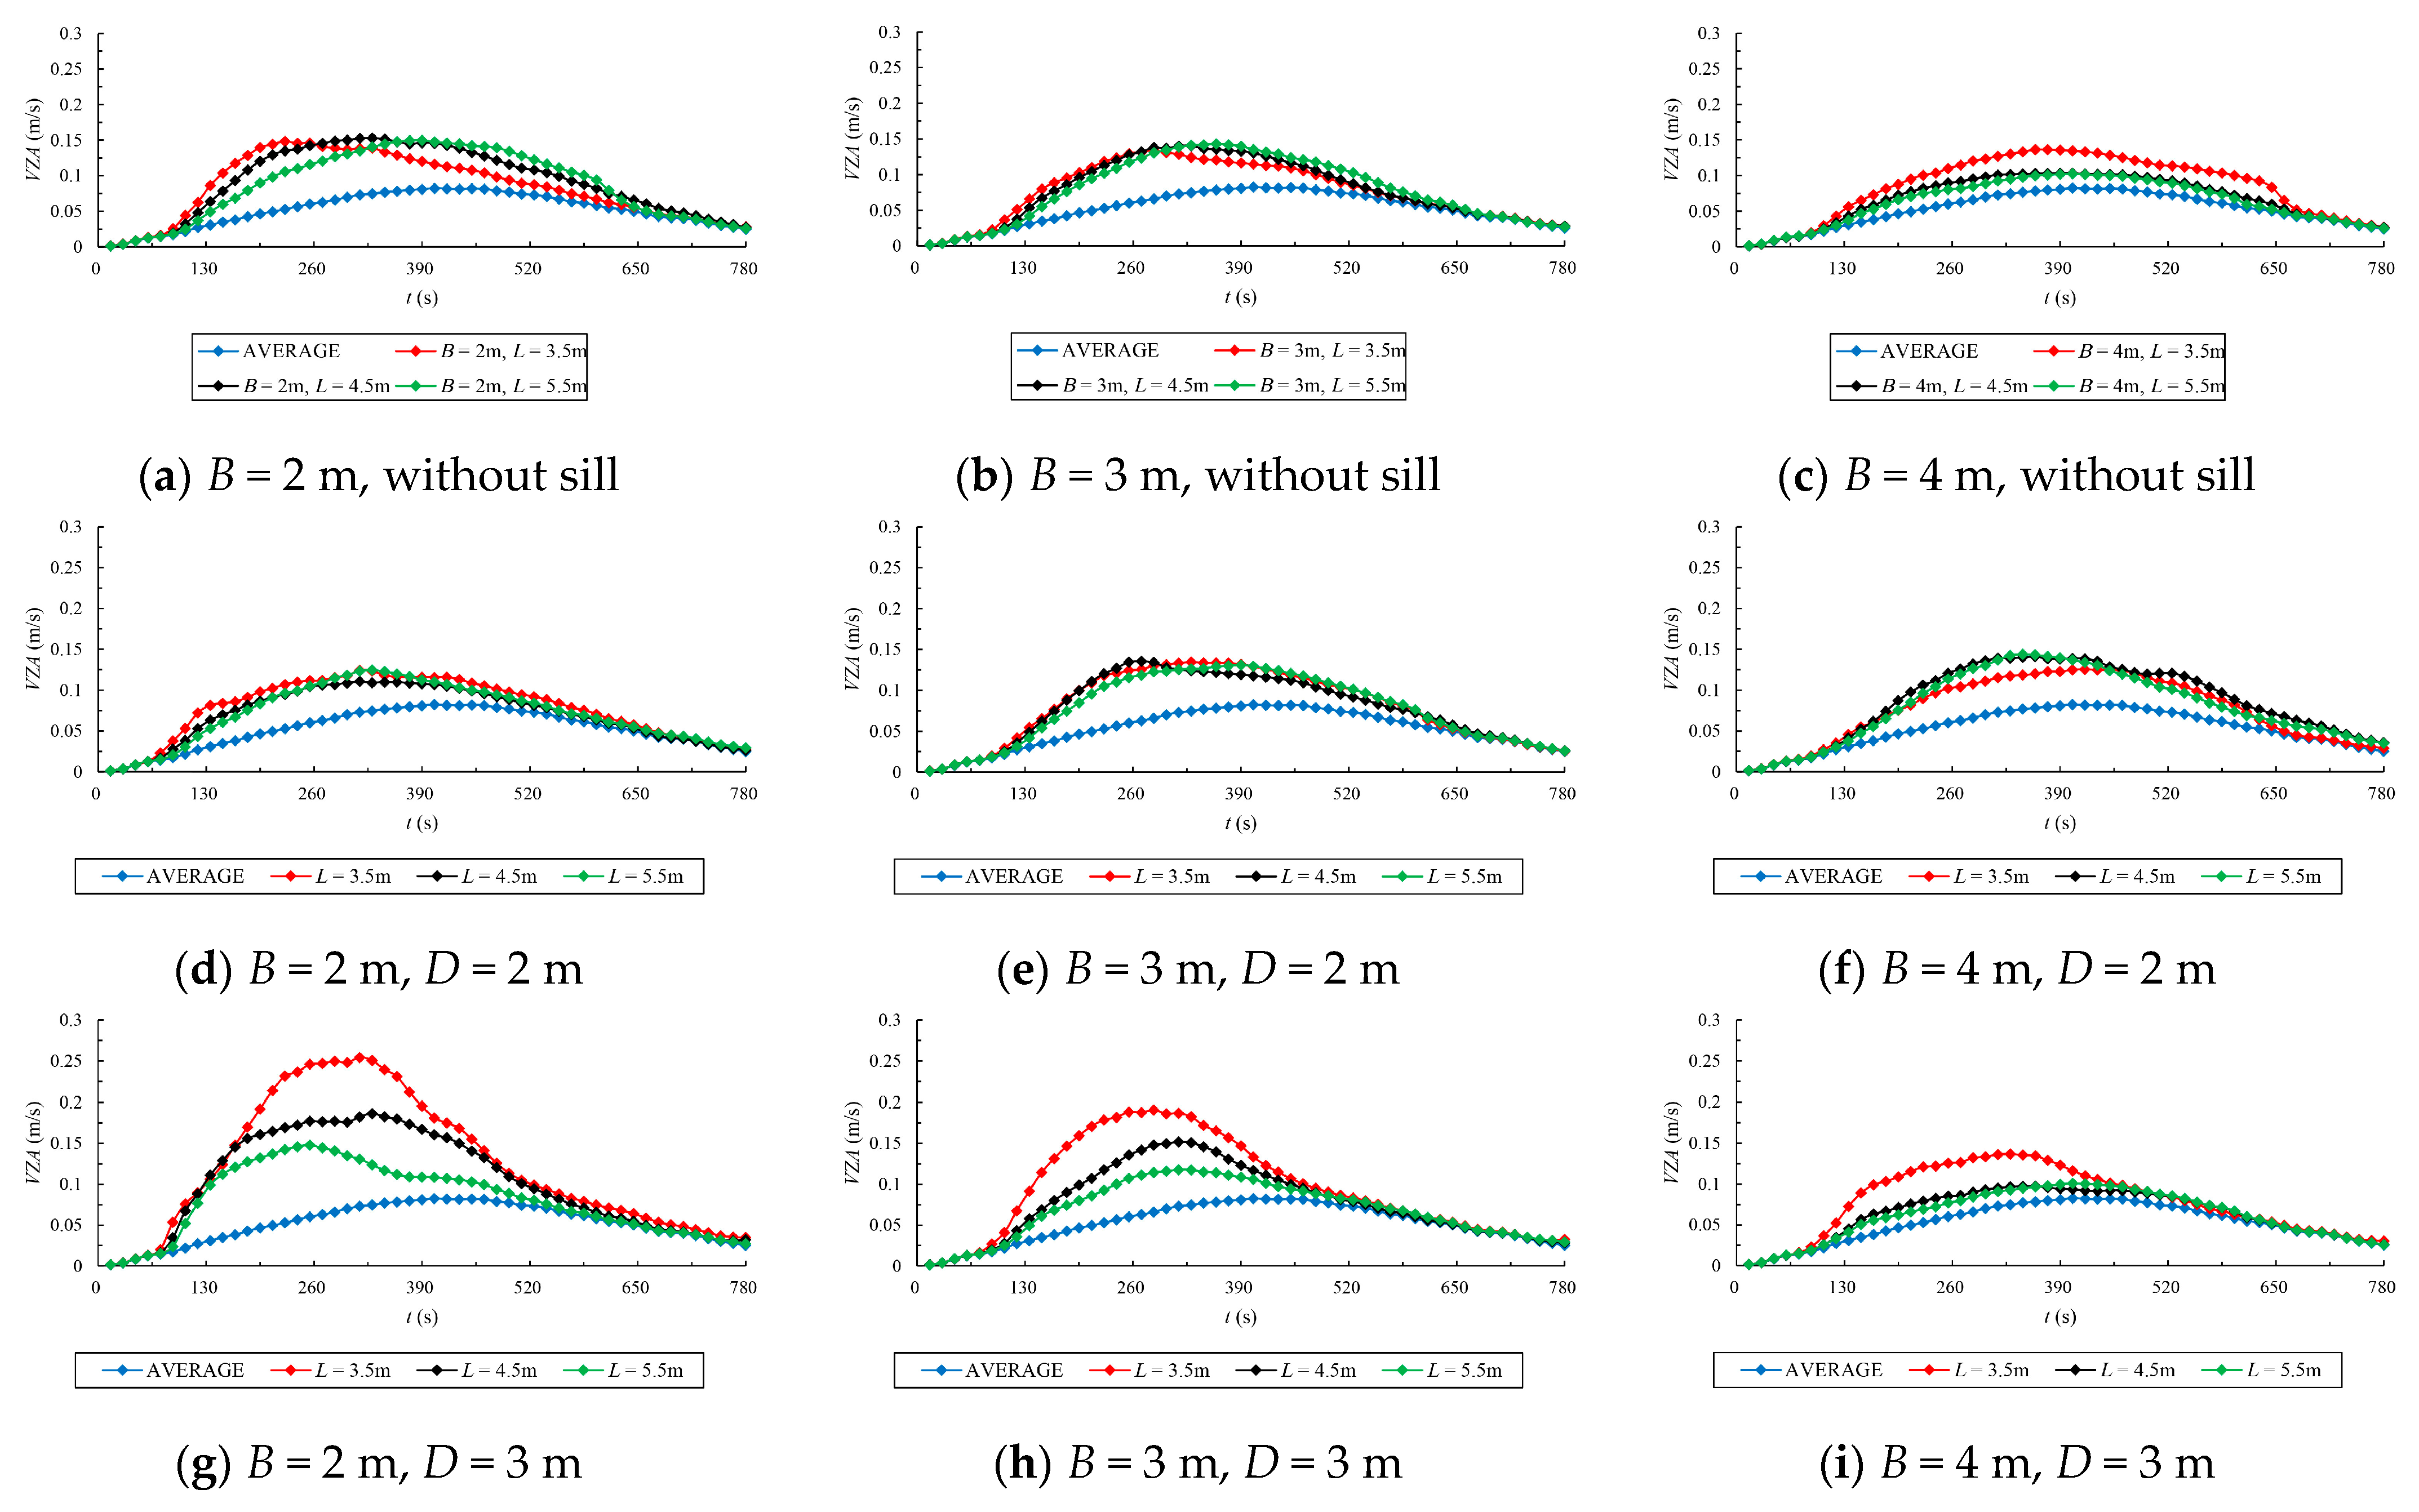
The vertical velocity uniformity of the draft critical plane (3.6 m below the water surface of the lock chamber) was intercepted, and the data on different sill heights were compared under the same width and depth of the ditch; the results are shown in Figure 8. In Figure 8a, the legend B = 2 m, L = 3.5 m represents the width and the depth of the ditch, respectively, with no sill. In the same figure, D = 2 m represents that the width of the ditch is 2 m, the depth of the ditch is 3.5 m, and the height of the sill is 2 m. The meanings of other legends in Figure 8 are similar. AVERAGE represents the ratio of the water filling discharge to the area of the lock chamber, which is the average velocity of the lock chamber. It can reflect the VZA when the water filling in the lock chamber is completely uniform. It can be seen from the figure that the vertical velocity uniformity, VZA, of each case is higher than the average velocity. This indicates that there is a phenomenon of uneven velocity in the lock chamber. In the initial stage of filling, the VZA is basically the same as the average velocity, but the duration is relatively short. This is because the filling discharge is in the process of continuously increasing; at this time, the water depth of the lock chamber is too shallow to fully diffuse the flow and eliminate the flow energy. The VZA of each case first increases and then decreases with time. This is consistent with the trend in discharge, indicating that the velocity distribution of the lock chamber gradually changes from uniform to uneven and then returns to uniform. In most cases, the VZA has begun to decrease before the maximum discharge of the lock chamber is reached. This is because although the incoming discharge of the lock chamber is still increasing, the water depth is also increasing. The greater the incoming discharge, the greater the rate of increase in the water depth of the lock chamber. Furthermore, the increased water depth of the lock chamber can eliminate most of the flow energy. In the later stage of filling, the VZA is basically consistent with the average velocity. At this time, the discharge continues to decrease while the depth of water in the lock chamber continues to rise, and the mooring conditions of the lock chamber tend to be safe. Under the same conditions of ditch width and depth, the curve without a sill is between the curves of different sill height conditions. This indicates that the uniformity of water filling in the chamber is linked to the sill height. If the height of the sill is designed properly, the uniformity of water filling is better than without a sill; otherwise, it will have a negative effect. The geometry without a sill is not completely bad. In some cases, the VZA without a sill is close to the VZA with a sill. From the perspective of qualitative and quantitative considerations, setting the sill is still a better choice, but it is necessary to pay attention to the height of the sill. When the ditch width is small, the VZA basically increases with the increase in sill height. When the ditch width is large, the VZA basically decreases first and then increases with the increase in the sill height. When the ditch width and depth are both small, the gap between the curves is obvious. This indicates that a well-designed sill height can significantly improve the velocity distribution. When the ditch width and depth are both large, the gap between the curves is small, and the sill height is limited in its ability to improve the uniformity of water filling, whether it is well designed or not.

3.2. Effect of Ditch Width

3.2.1. Cross-Sectional Velocity Distribution

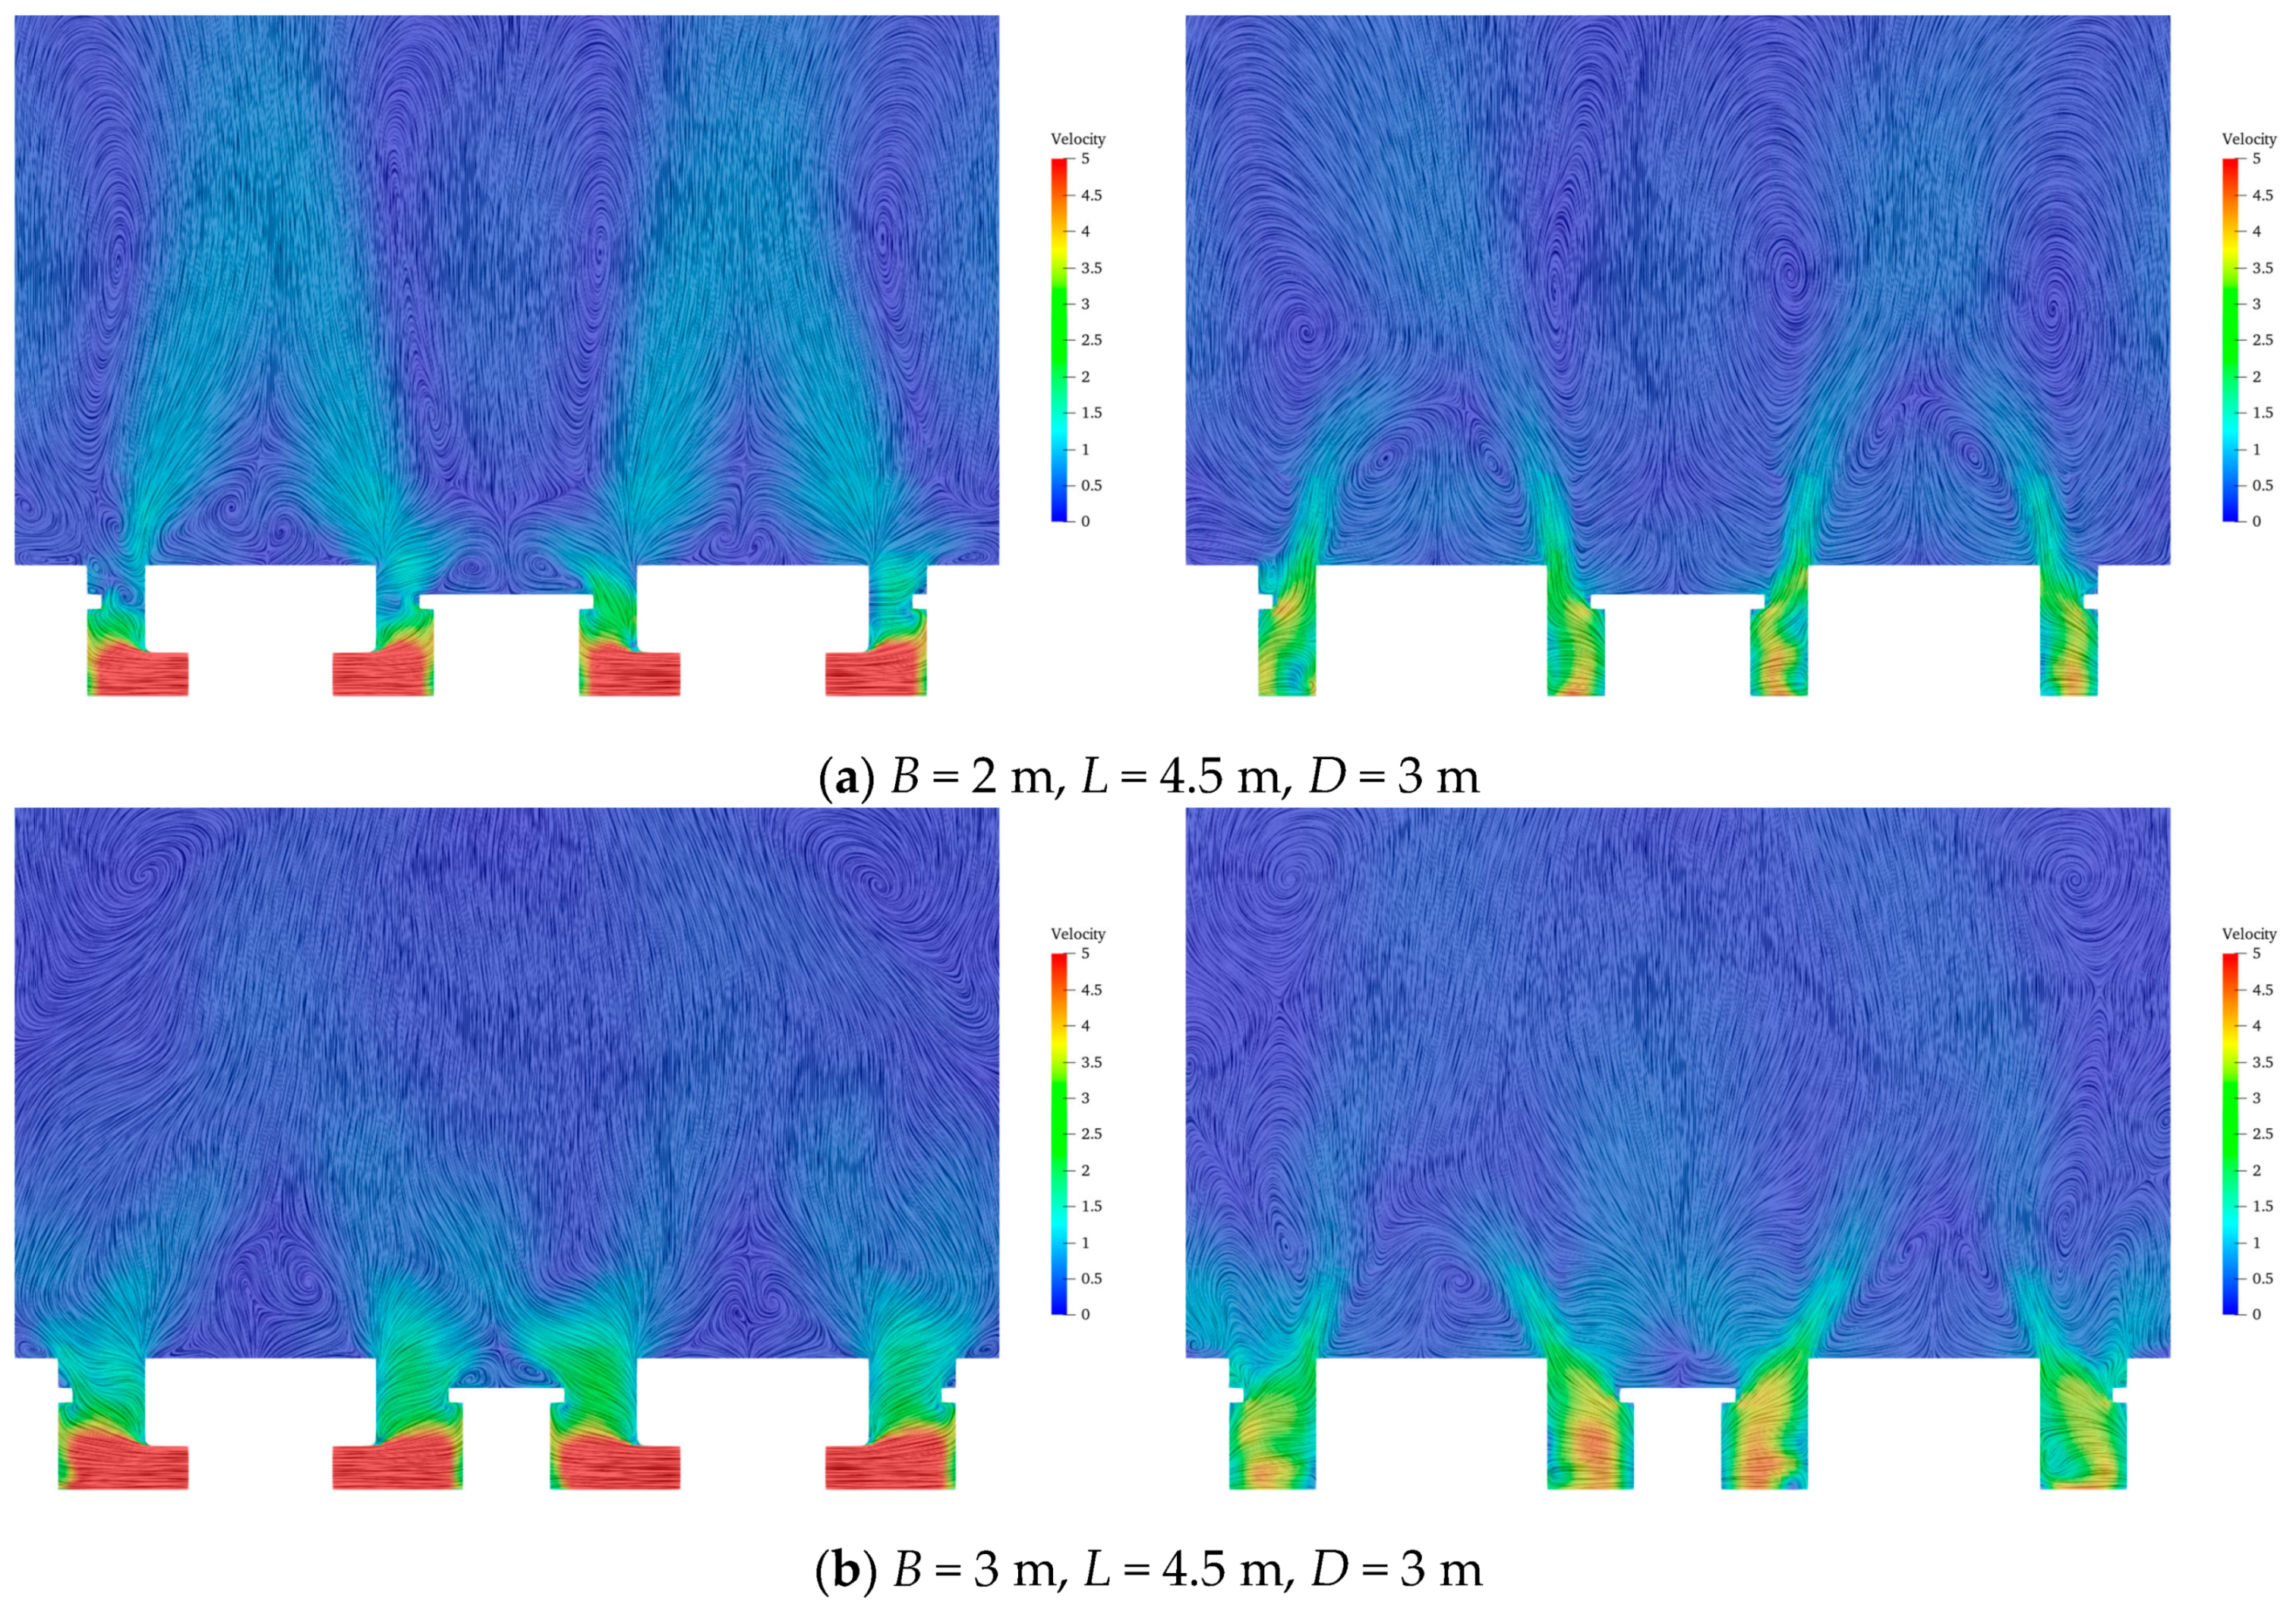
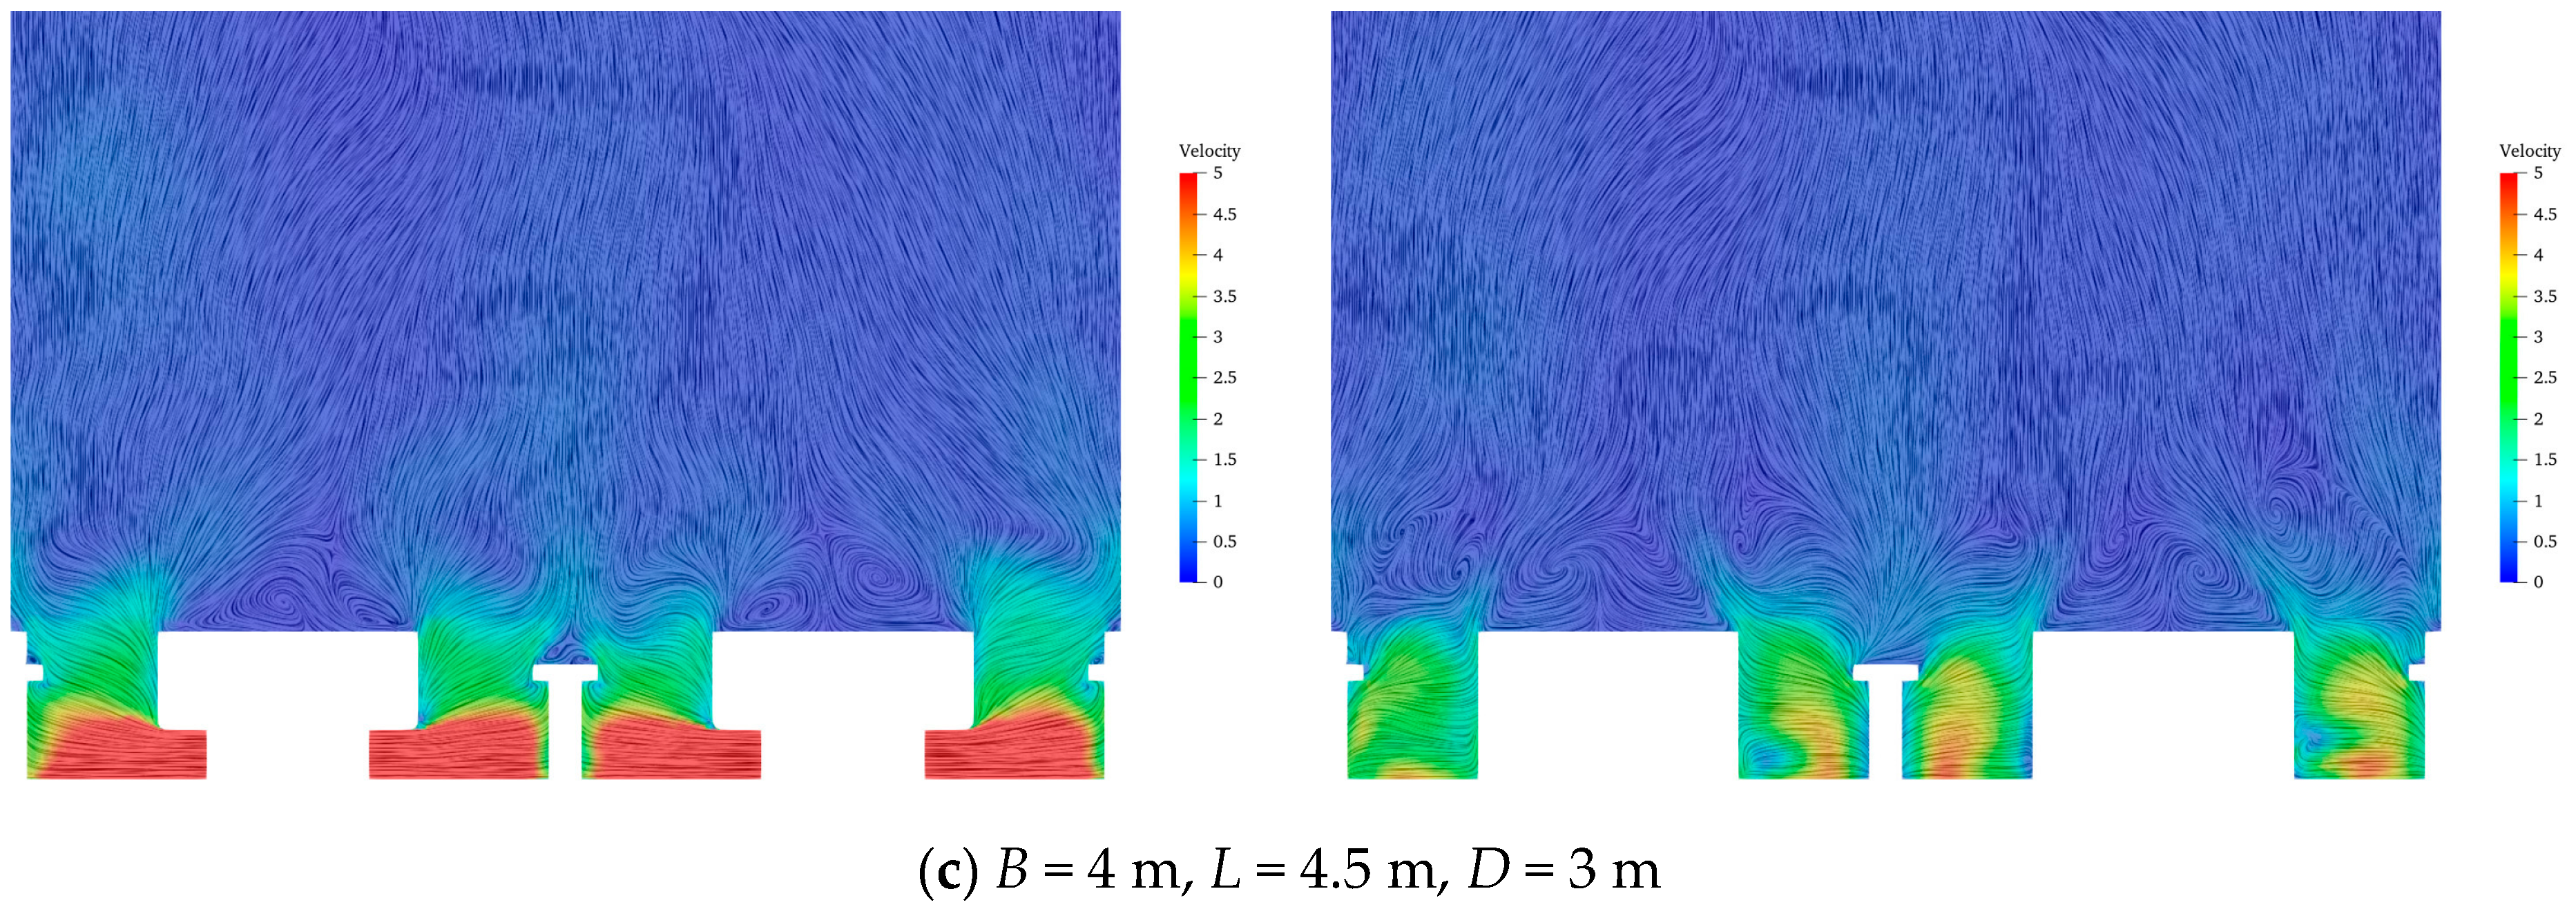
A5, A17, and A29 (L = 4.5 m, D = 3 m, B = 2~4 m) were selected as typical cases. The velocity distribution of the cross section at the maximum discharge moment is shown in Figure 9. In theory, there may be two factors affecting the ditch width effect. One is that the larger the ditch width, the larger the cross-sectional area of the ditch, and the more sufficient the flow diffusion. The other is that the larger the ditch width, the closer the center line of the ditch is on both sides to the lock wall; this may result in the filling being biased towards the lock wall, making the velocity uneven. These two factors may mean there is a certain contradiction in the determination of the ditch width. It can be seen from the flow pattern in the figure that when the width of the ditch is 2 m, the space in the ditch is limited. In addition, the cross-sectional area is the smallest, and the flow velocity is the highest. Under the constraints of the sill and the ditch wall, the stream line is bent and deformed. Moreover, a complex vortex structure is formed near the sill, and the flow pattern is more complicated than in other cases. Above the ditch, the flow enters the lock chamber in the form of a high-velocity ‘jet’, disturbing the low-velocity water body in the lock chamber. Consequently, a large vortex zone is formed on both sides of the jet. The two jets above the culvert intersect and mix at a certain elevation of the lock chamber, then continue to move towards the water surface. When the width of the ditch is expanded to 3 m, the cross-sectional area of the ditch increases, the flow diffuses more fully, and the stream line is smoother. In addition, the velocity entering the lock chamber decreases, the form of the jet flow pattern is alleviated, the range of the vortex zone in the lock chamber decreases, and the degree of flow diffusion increases. This is conducive to improving the mooring conditions of the lock chamber. When the width of the ditch is expanded to 4 m, the overall mixing and diffusion degree of the flow is higher, and the velocity entering the lock chamber is further reduced. There is no obvious jet flow pattern in the lock chamber, and its stream line is smooth, with the obvious vortex structure only being present at the bottom of the lock chamber. In terms of a qualitative judgment of the filling position, as the retaining sill has a certain guiding effect on the flow, even if the ditch is close to the lock wall, there is no obvious bias to the flow on both sides of the chamber wall.

3.2.2. Filling Uniformity of a Lock Chamber

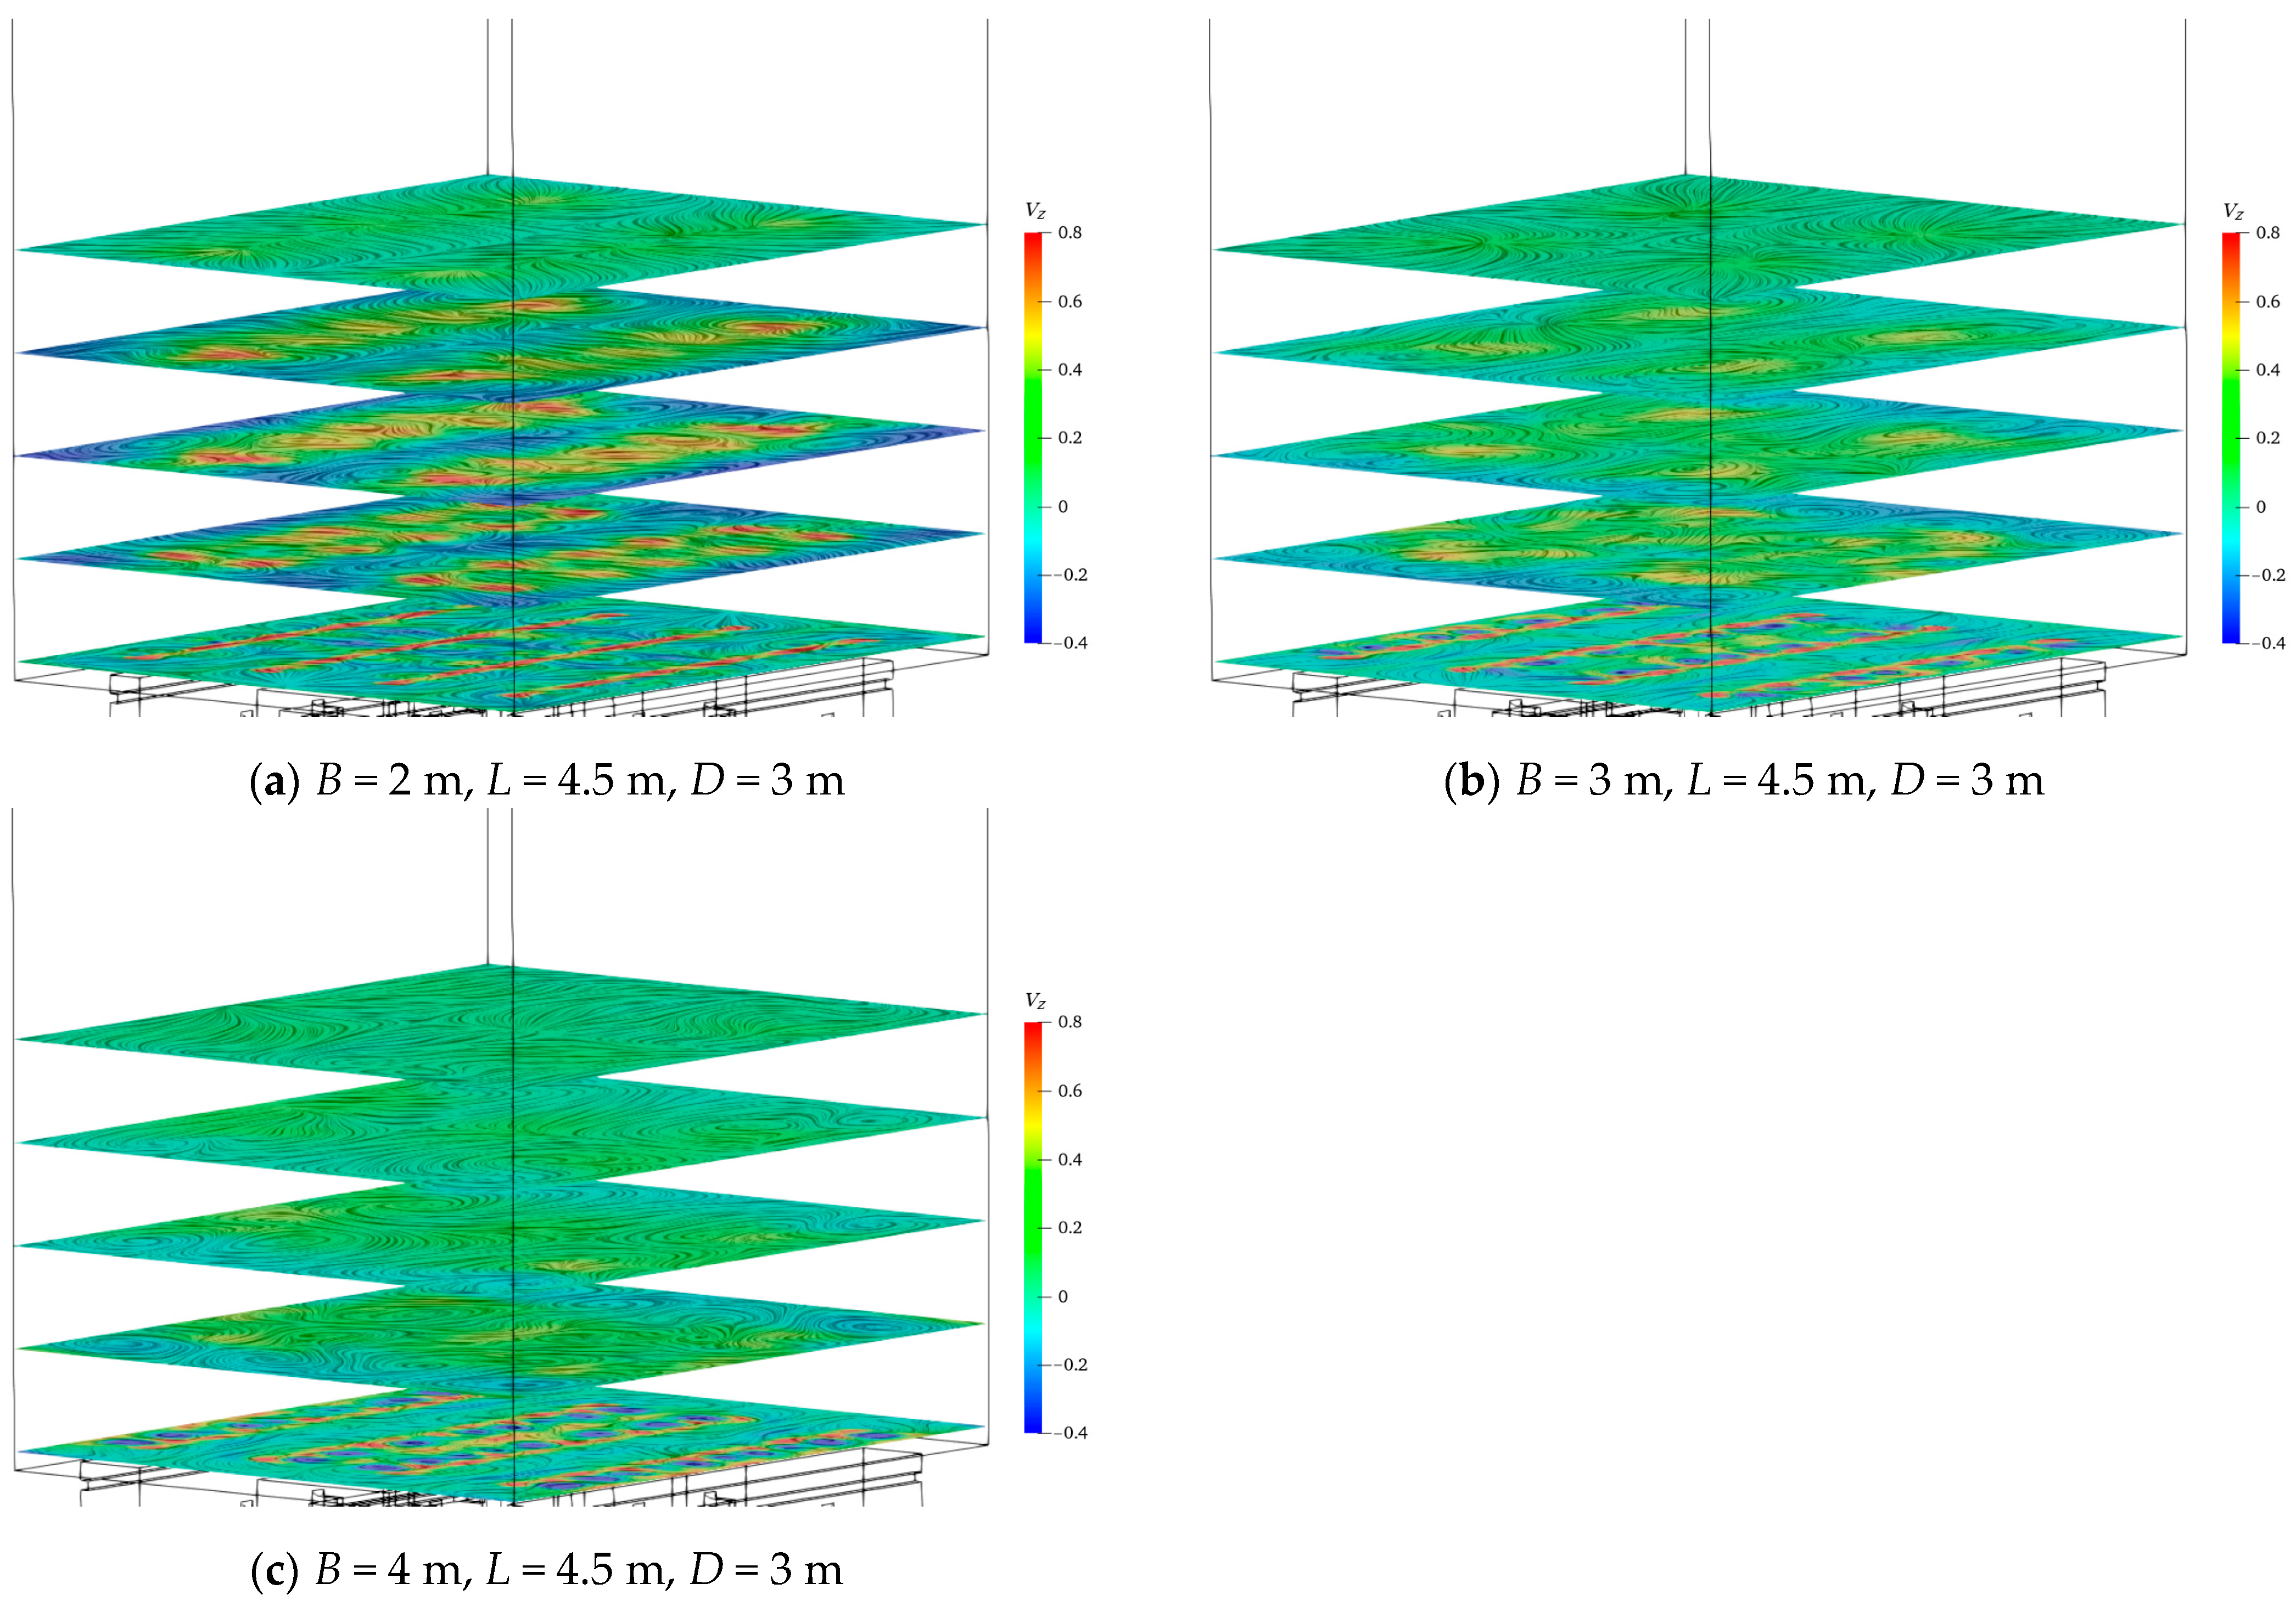
The vertical velocity distributions of the horizontal planes of typical cases are shown in Figure 10. According to the figure, when the ditch width is 2 m, there are alternating positive and negative flow velocities on multiple planes. The local velocity is the highest, the velocity distribution is the most uneven, and the flow pattern of the lock chamber is the most complex. When the ditch width is expanded to 4 m, the local velocity of the lock chamber is the lowest and the velocity distribution is relatively uniform. Therefore, the mooring condition of the lock chamber is the most optimal. When the ditch width is 3 m, the mooring condition of the lock chamber is considered to be in the mid-range.
Under the same conditions of ditch depth and sill height, the comparison of the VZAs in the draft critical planes under different ditch width conditions is shown in Figure 11. It can be seen that when there is no sill, the VZA basically decreases with the increase in the ditch width. This indicates that the larger the ditch width, the more uniform the velocity distribution in the lock chamber. However, when L = 3.5 m and B = 4 m, the VZA is relatively large in the middle and late stages of filling. This may be due to the insufficient energy dissipation caused by the small ditch depth. When the sill height is 3 m and above, the VZA basically decreases with the increase in the ditch width. When the sill height is 2 m, the relationship between VZA and the ditch width is uncertain; therefore, the sill height and the ditch width have mutual influence.

3.3. Effect of Ditch Depth

3.3.1. Cross-Sectional Velocity Distribution

A14, A17, and A21 (B = 3 m, D = 3 m, L = 3.5~5.5 m) were selected as typical cases. The velocity distributions of the cross section of the lock chamber at the maximum discharge moments are shown in Figure 12. The velocity distribution of case A17 is given in the previous section. When the ditch depth is 3.5 m, the velocity attenuation of the flow in the vertical range of the ditch is limited, and the flow still has a high velocity after leaving the ditch. The sill height is 3 m, which is arranged at the top of the ditch. Under the guidance of the sill, the flow has a certain bias when entering the lock chamber. Under various effects, the lock chamber presents a certain ‘jet’ flow pattern, the local velocity is high, and there are complex stream-line distortions and vortices at different positions. When the ditch depth increases to 4.5 m, the vertical attenuation of the flow increases. This reduces the flow velocity entering the lock chamber, and the flow pattern in the lock chamber develops in the direction that is conducive to the mooring conditions. When the ditch depth is further increased to 5.5 m, the flow pattern is generally similar to that of the previous cases, the vertical attenuation of the flow is further increased, and the flow diffusion in the lock chamber is more sufficient.

3.3.2. Filling Uniformity of the Lock Chamber

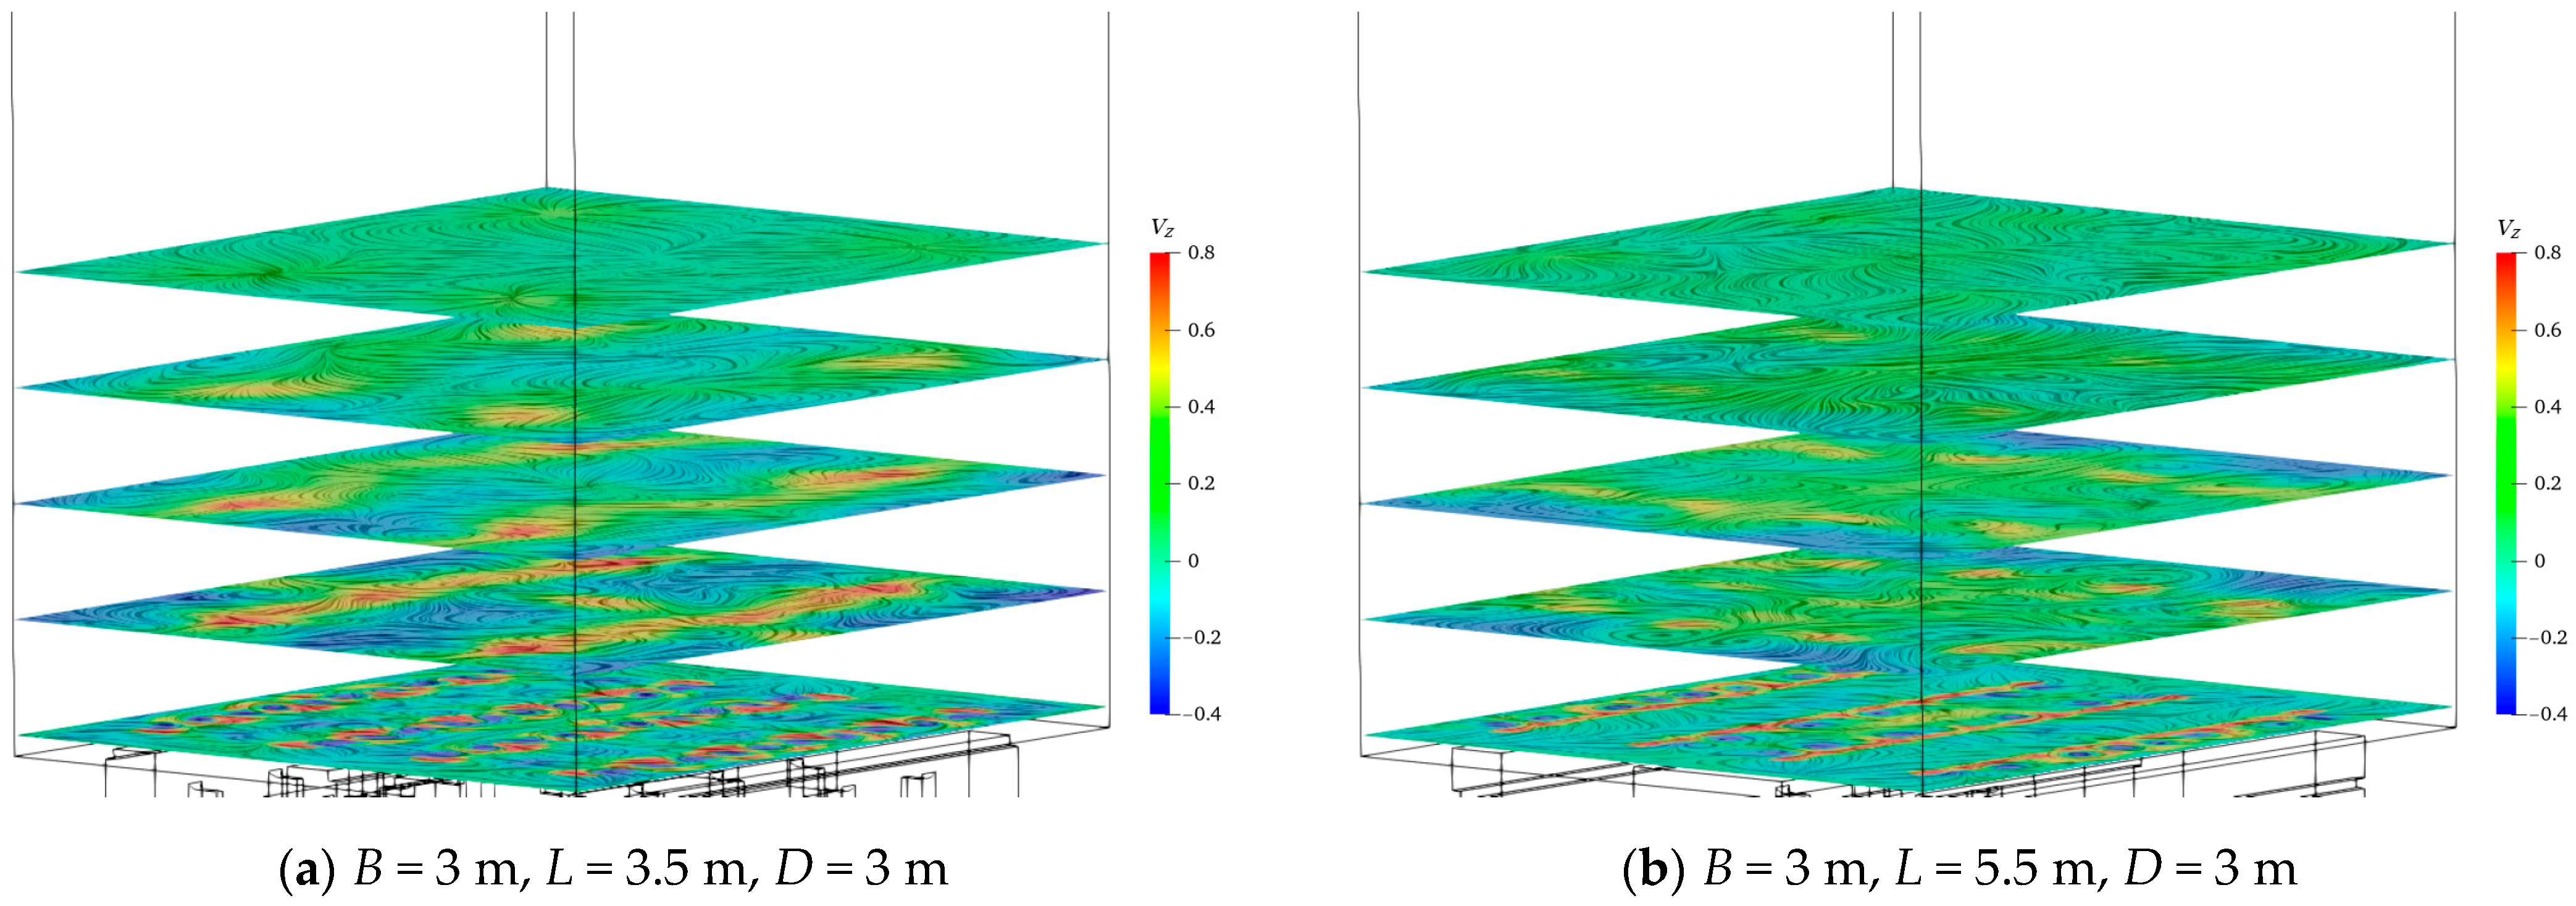
The vertical velocity distributions of different horizontal planes of the lock chamber at the maximum discharge moments of the typical cases are shown in Figure 13. The figure for case A17 can be found in the previous section. It can be seen from the figure that when the ditch depth is 3.5 m, the velocity distribution of the lock chamber is the most uneven, with a variety of local high velocities on a lot of planes. When the ditch depth increases to 5.5 m, the local velocity of the lock chamber is the lowest and the velocity distribution is relatively uniform; therefore, the mooring condition of the lock chamber is optimal. When the ditch depth is 4.5 m, the mooring condition of the lock chamber is in the mid-range.
Under the same conditions of ditch width and sill height, the comparison of the VZAs in the draft critical planes under different ditch depth conditions are shown in Figure 14. It can be seen that in most cases, the VZA basically decreases with the increase in the ditch depth. This indicates that the greater the ditch depth, the more uniform the velocity distribution in the lock chamber. In some cases, the overall gap is not very large, indicating that the influence of the ditch depth is limited.

3.4. Comprehensive Analysis of Multiple Factors

In this section, the design parameters are constructed for the ditch width B, the ditch depth L, and the sill height D. The vertical velocity uniformity VZA is used to represent the mooring conditions of the lock chamber, and the relationship between the multi-factor design parameters and the VZA is established in order to provide guidance for the design of the ditch.

3.4.1. Relationship between (mBL)/(Ka) and VZA

It can be seen from the above that the uniformity of water filling in the lock chamber basically increases with the increase in the ditch width and depth. However, the specific quantitative range is unknown. The dimensionless parameter (mBL)/(Ka) was constructed, where m is the number of ditches, K is the width of the lock chamber, and a is the square root of the area of single port; for this study, m = 4, K = 34 m, and a = 0.8 m.
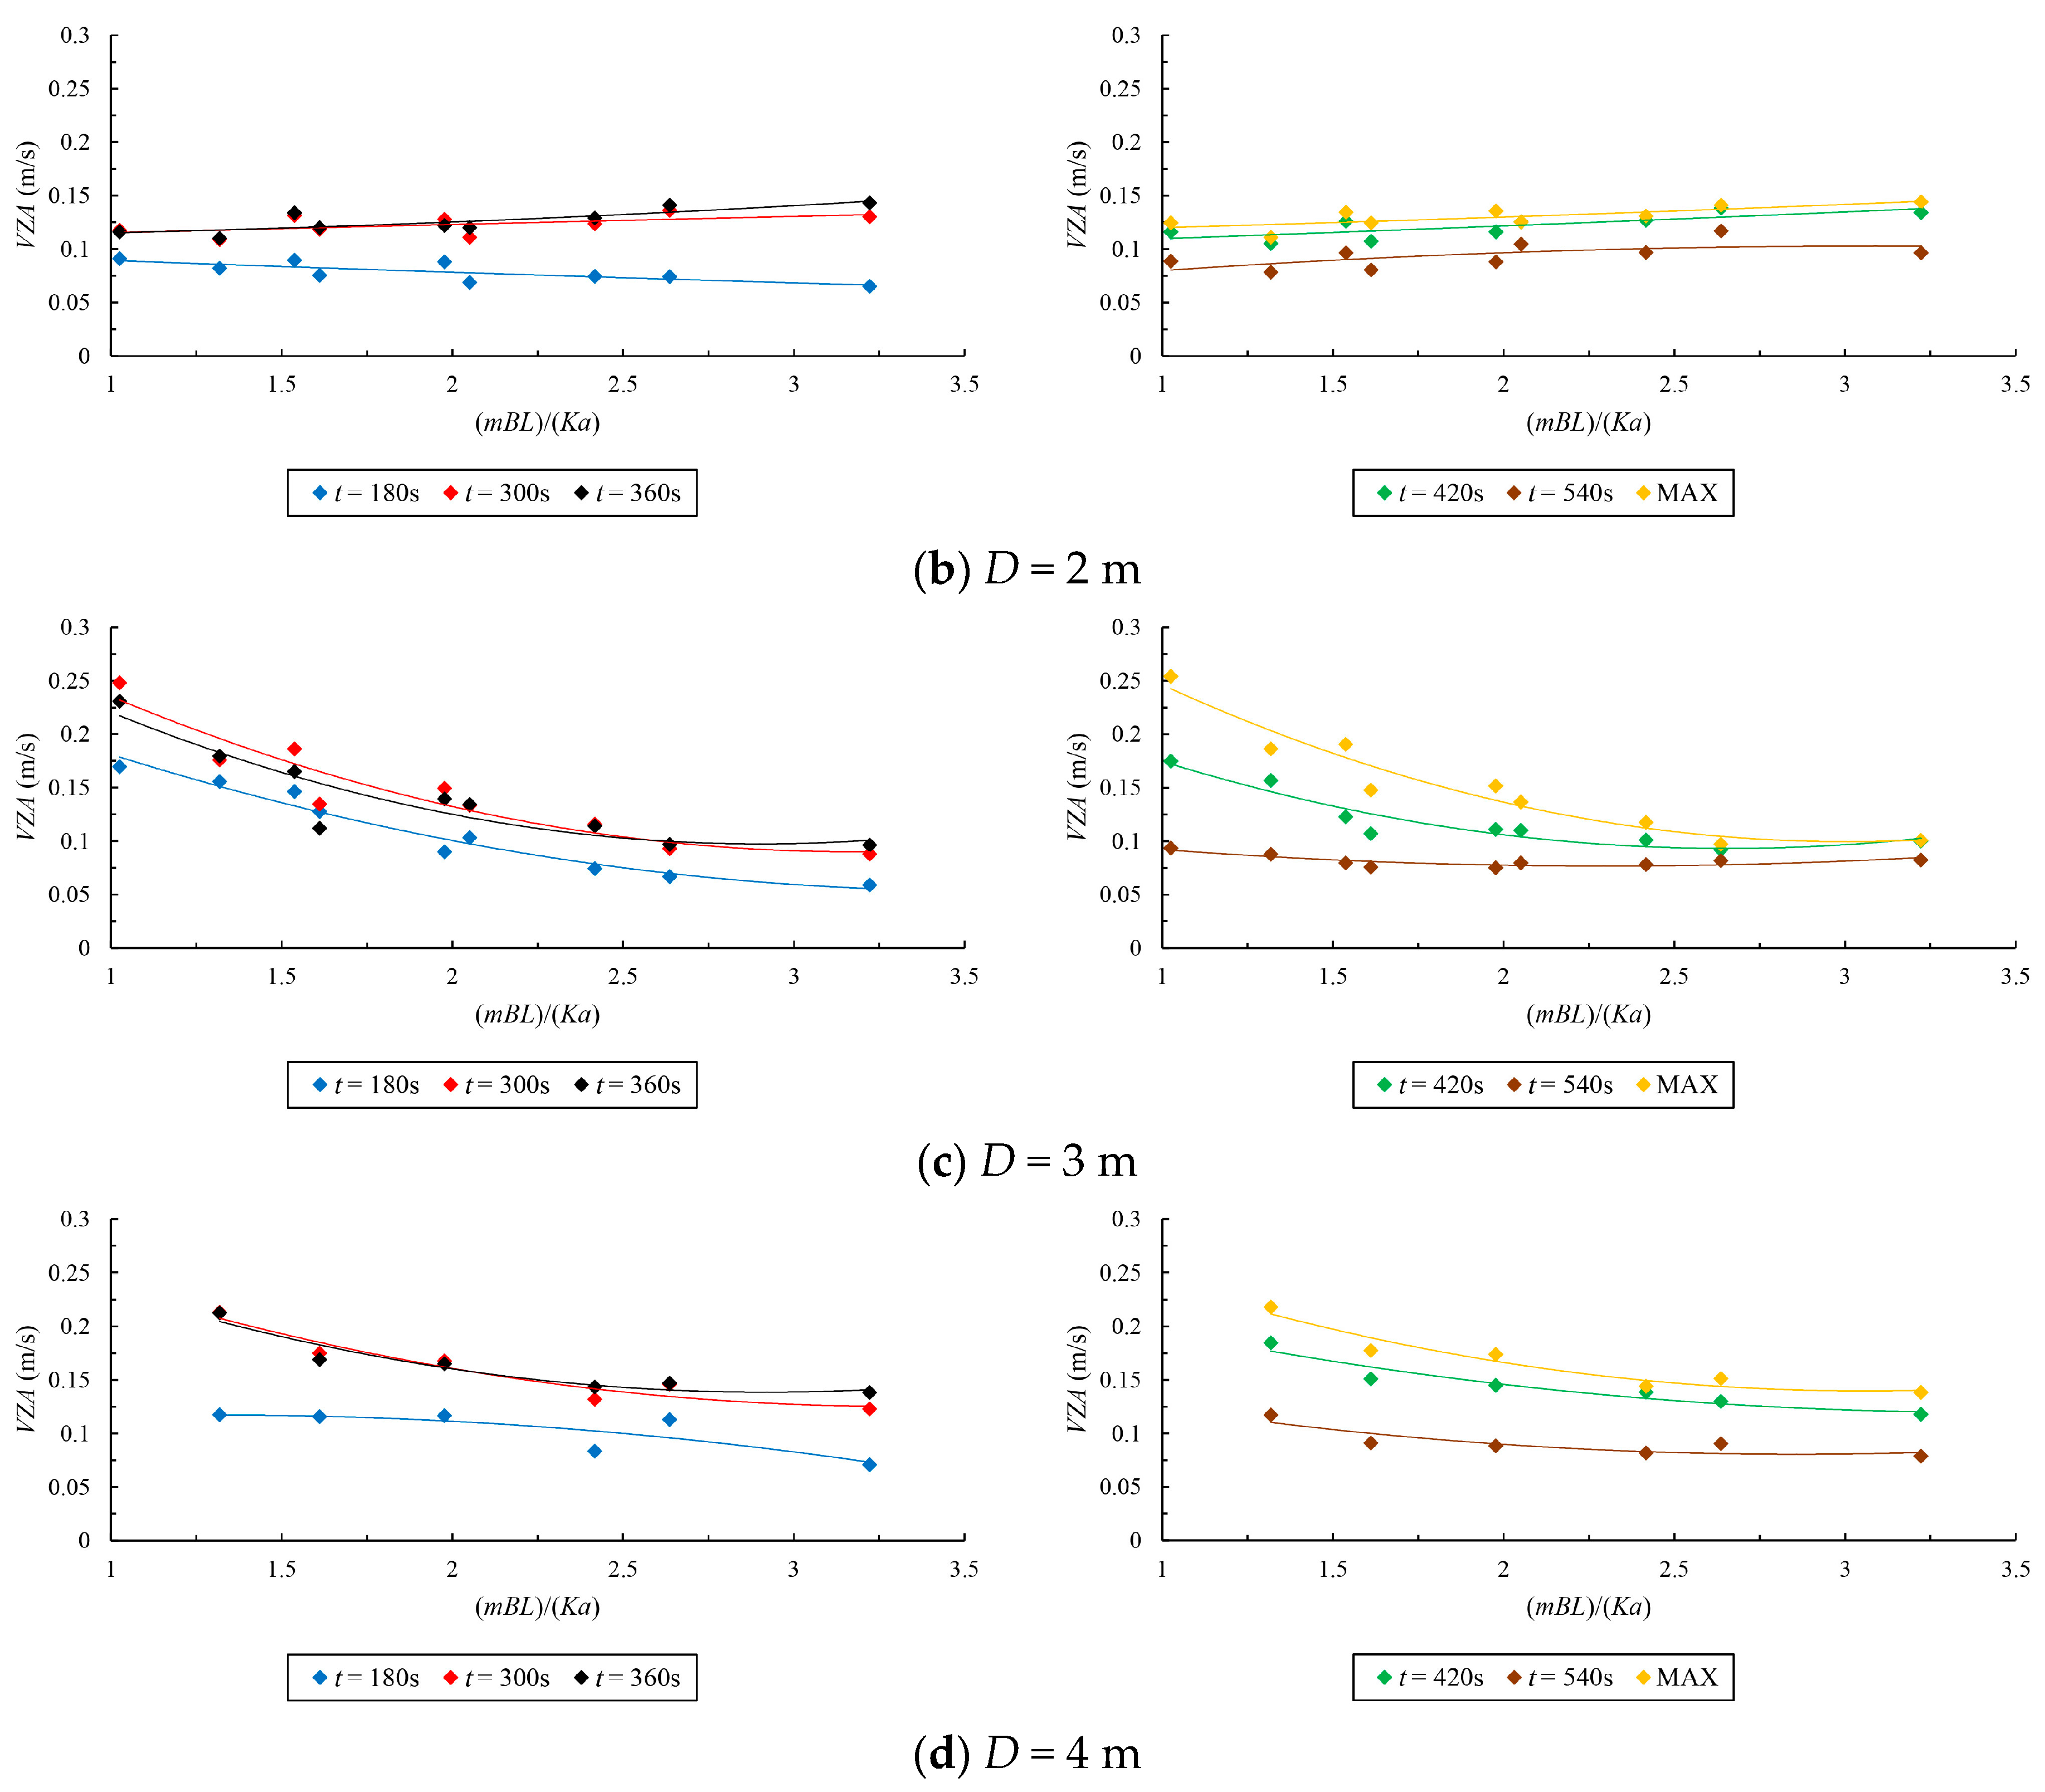
The relationship between the (mBL)/(Ka) and VZA at different time points is shown in Figure 15 (MAX is the maximum value of the data at each case from t = 15~780 s; the data interval is 15 s). When there is no sill, the VZA basically decreases with the increase in the (mBL)/(Ka), and the decreased degree decreases in the early stage of water filling. In the middle and late stages of water filling, the decreased degree increases. In the later stage of water filling, the VZA does not change much. In general, the change range is basically within 0.1~0.15 m/s. This shows that when there is no sill, the influence of the width and depth of the ditch on the uniformity of the water filling is not very obvious. However, within the simulation range, the larger the width and depth of the ditch, the more favorable the mooring conditions of the lock chamber.
When the sill height is 2 m, on the one hand, the influence of the (mBL)/(Ka) on the uniformity of the water filling is not obvious, and the VZA is maintained in a low range. This is because the sill height is not much higher than the height of the port, and the port jet directly hits the sill to eliminate most of the flow energy. The main difference between the cases is in the width and depth of the ditch above the sill. The velocity above the sill has been reduced, and the change in the width and depth of the ditch has little effect. On the other hand, most of the time, the VZA increases slightly with the increase in the (mBL)/(Ka). This indicates that when the BL is large, the height of the sill should not be too low.
When the sill height is 3 m or 4 m, the VZA basically decreases with the increase in the (mBL)/(Ka), and the decreased degree also increases. The study shows that when the (mBL)/(Ka) reaches approximately 2.2, the VZA remains basically unchanged with the increase in the (mBL)/(Ka). In the design, the (mBL)/(Ka) can be controlled at approximately 2.2, which takes into account the mooring conditions and construction costs of the ship lock. According to the design code in China [39] and engineering experience, the width of the ditch should be greater than five times the width of the port. The width and depth of the ditch can be determined by the above two criteria.

3.4.2. Relationship between (Dd)/B and VZA

Compared with the width and depth of the ditch, the sill height has an obvious influence on the calculation results. Referring to the design code [39] in China, the dimensionless parameter (Dd)/B was constructed, where d is the height of the port, which was 1.5 m in this study. The relationship between the (Dd)/B and VZA at different time points is shown in Figure 16. It can be seen that the VZA first decreases and then increases with the increase in the (Dd)/B; the design parameter (Dd)/B has a minimum value of about 0.375, which meets the code in China. However, the design code only stipulates that the lower limit of the (Dd)/B is 0.24, and there is no upper limit. From the calculation results, it can be seen that when the height arrangement of the sill is relatively high, the velocity near the sill is relatively low, and the energy dissipation effect is limited. The flow will be obviously guided, so that the flow may ‘shoot’ into the lock chamber at a large angle. Alternatively, this will cause the flow to converge too much to the middle and upper areas of the culvert in the chamber, which will also cause an uneven distribution of the velocity to a certain extent. Therefore, it is necessary to stipulate the upper limit of the (Dd)/B. This study considered that when the design parameter (Dd)/B is between 0.24 and 0.5, water filling is relatively uniform; therefore, the sill height in the design should meet the above requirement as much as possible.

3.4.3. Relationship between (Dd)/(BL) and VZA

Considering the ditch depth, the design parameter (Dd)/(BL) was constructed. The relationship between the (Dd)/(BL) and VZA at different time points is shown in Figure 17. It can be seen that the VZA basically decreases first, then increases, and finally, remains unchanged or slightly decreases with the increase in the (Dd)/(BL). The (Dd)/(BL) has a minimum value, and the minimum value is different at different time points, in the range of approximately 0.068~0.083. This study considers that when the (Dd)/(BL) is approximately 0.04~0.11, the uniformity of water filling in the lock chamber is improved.

4. Conclusions

In this study, a local generalized model of a water filling system with four single ditches was established. Based on OpenFOAM v8, the hydraulic characteristics of water filling in the lock chamber were simulated. Taking the ditch width, ditch depth, and sill height as the research variables, the influence of parameters of ditch geometry on the uniformity of water filling in the lock chamber was systematically discussed. The results show the following:
(1)
In the process of water filling in the lock chamber, under the constraint of limited space, the flow direction of the high-velocity port jet is adjusted from the horizontal direction to the oblique direction. Some of the water flows directly into the lock chamber from the port jet. Another proportion of the water flow comes from diversion and diffusion after the collision between the jet and the side wall of the ditch. The velocity decreases due to diffusion and mixing, and the flow pattern is complex. The uniformity of water filling is closely related to the arrangement of the ditch geometry.
(2)
The larger the ditch width and depth, the larger the energy dissipation and diffusion space of the flow, and the higher the uniformity of water filling in the lock chamber. Within the scope of the calculation, the VZA basically decreases with the increase in the (mBL)/(Ka). When the (mBL)/(Ka) is approximately 2.2, the VZA remains basically unchanged with the increase in the (mBL)/(Ka). The design should restrict the (mBL)/(Ka) to approximately 2.2 or above.
(3)
The retaining sill on the side wall of the ditch can block the climbing flow state on the side wall. This has a guiding effect on the flow and is conducive to adjusting its transverse distribution. Within the scope of the calculation, the VZA basically first decreases and then increases with the increase in the (Dd)/B and (Dd)/(BL). When the (Dd)/B is approximately 0.24~0.5 or the (Dd)/(BL) is approximately 0.04~0.11, the uniformity of water filling in the lock chamber is improved.
The analysis methods and conclusions of this study can provide theoretical guidance for similar projects.

Author Contributions

Conceptualization, Q.H. and Y.L.; methodology, Q.H. and L.Z.; software, Q.H.; validation, Q.H., Y.L. and L.Z.; formal analysis, Q.H.; investigation, Q.H., Y.L. and L.Z.; resources, Q.H., Y.L. and L.Z.; data curation, Q.H.; writing—original draft preparation, Q.H.; writing—review and editing, Q.H., Y.L. and L.Z.; visualization, Q.H.; supervision, Y.L. and L.Z.; project administration, Y.L. and L.Z. All authors have read and agreed to the published version of the manuscript.

Funding

This research was funded by Guangxi Science and Technology Major Program: Research on key technologies of the filling and emptying system of large water-saving ship lock (AA23023018).

Institutional Review Board Statement

Not applicable.

Informed Consent Statement

Not applicable.

Data Availability Statement

Data are contained within the article.

Conflicts of Interest

The authors declare no conflicts of interest.

References

  1. Barbosa, F.G.P.; de Figueiredo, N.M.; Filho, L.C.P.C.; Borges, H.M. Computational Tool for Sizing and Optimization of Planimetric Geometric Parameters of Inland Navigation Channels and of Port Access in Brazil. J. Waterw. Port Coast. Ocean Eng. 2021, 147, 04020044. [Google Scholar] [CrossRef]
  2. Jiang, P.; Tong, S.; Xu, G.; Huang, G. Review and application of determination methods on navigable hydraulic index of rapids in mountainous river. Ocean Eng. 2022, 248, 110830. [Google Scholar] [CrossRef]
  3. Helal, E.; Elsersawy, H.; Hamed, E.; Abdelhaleem, F.S. Sustainability of a navigation channel in the Nile River: A case study in Egypt. River Res. Appl. 2020, 36, 1817–1827. [Google Scholar] [CrossRef]
  4. Liao, P. Improved Analytical Model for Estimating the Capacity of a Waterway Lock. J. Waterw. Port Coast. Ocean Eng. 2018, 144, 04018021. [Google Scholar] [CrossRef]
  5. Wan, Z.; Li, Y.; Wang, X.; An, J.; Cheng, L.; Liao, Y. Effect of ship-lock-induced surges on navigation safety in a branched lower approach channel system. J. Hydroinform. 2022, 24, 481–496. [Google Scholar] [CrossRef]
  6. Natale, L.; Savi, F. Minimization of Filling and Emptying Time for Navigation Locks. J. Waterw. Port Coast. Ocean Eng. 2000, 126, 274–280. [Google Scholar] [CrossRef]
  7. Belzner, F.; Thorenz, C.; Oertel, M. A Modernized Safety Concept for Ship Force Evaluations During Lock Filling Processes. In Proceedings of the PIANC Smart Rivers 2022; Lecture Notes in Civil Engineering; Springer: Singapore, 2023; pp. 271–280. [Google Scholar]
  8. Yang, Z.; Yang, B.; Chen, M.; Wang, D. Energy dissipation effect and mechanism of open ditch energy dissipater in high-head lock. Port Waterw. Eng. 2009, 12, 168–173. [Google Scholar] [CrossRef]
  9. Yang, Z.; Chen, M.; Yang, B.; Wang, D. Experimental Study on Energy Dissipation Effect of Chamber Energy Dissipater in Superhigh-Head Lock. J. Chongqing Jiaotong Univ. (Nat. Sci.) 2010, 29, 461–465. [Google Scholar]
  10. Wang, Z.; Chen, L.; Peng, Y. On form and energy dissipation effect of lock chamber’s open ditch. Port Waterw. Eng. 2015, 7, 129–134. [Google Scholar] [CrossRef]
  11. Lv, W.; Liu, P.; Chen, L.; Zhang, X. Three-dimensional numerical simulation of energy dissipation effect in energy dissipater of lock chamber open ditch. J. Waterw. Harb. 2013, 34, 508–512. [Google Scholar] [CrossRef]
  12. Zhu, L. Numerical Simulation Study of Double Ditches detail Optimization for Lock Bottom Long-Culvert Filling and Emptying System. Master’s Thesis, Chongqing Jiaotong University, Chongqing, China, 2016. [Google Scholar]
  13. Chen, M.; Liu, T.; Li, J.; Huang, H. Energy dissipation characteristics of double-layer side ports in in-chamber culvert designed for large-scale lock chamber with extreme high water head. Chin. J. Hydrodyn. 2022, 37, 301–308. [Google Scholar] [CrossRef]
  14. Li, J. Research on Energy Dissipation Characteristics of the Open Ditch in Shiplock Chamber with Super Large Water Transmission Power. Master’s Thesis, Chongqing Jiaotong University, Chongqing, China, 2018. [Google Scholar]
  15. Li, R. Energy Dissipation Characteristics of the Multi-Layer Side Ports in a Long Culvert Designed for a Large-Scale Lock Chamber with 60 m Water Head. Master’s Thesis, Chongqing Jiaotong University, Chongqing, China, 2021. [Google Scholar]
  16. Zhou, P. Numerical Simulation of Energy Dissipation Characteristics of Cover Plate in Gate Chamber under the Condition of Super Water Transfer Power. Master’s Thesis, Chongqing Jiaotong University, Chongqing, China, 2018. [Google Scholar]
  17. Ma, X.; Hu, Y.; Li, Z. Impact of an energy dissipator on mooring conditions in ultra-high head locks with a comprehensive uniform-strength evaluation. Ocean Eng. 2022, 266, 112806. [Google Scholar] [CrossRef]
  18. Wan, Z.; Li, Y.; Cheng, L.; Wang, X.; Wang, B.; An, J. Investigating hydraulic operational schemes of a large-scale multi-lane lock group concerning water-level fluctuations in a branched approach channel system. Ocean Eng. 2022, 260, 111758. [Google Scholar] [CrossRef]
  19. Wu, Y.; Jiang, Y.; Jiang, B.; Wang, Z. Research and Prospect on Filling and Emptying System of Shiplock with Large-scale and Super-high Head. J. Yangtze River Sci. Res. Inst. 2016, 33, 53–57. [Google Scholar]
  20. Zhu, L.; Li, J.; Xuan, G.; Yan, X.; Huang, Y. Numerical study of hydraulic characteristics of self-diffluence structure in second diversion port of high-head lock. Hydro-Sci. Eng. 2017, 6, 1–8. [Google Scholar] [CrossRef]
  21. Li, Z.; Xuan, G. The Approach of Lock Hydraulic System Selection Based on Multiple Factors. In Proceedings of the PIANC Smart Rivers 2022; Lecture Notes in Civil Engineering; Springer: Singapore, 2023; pp. 693–703. [Google Scholar]
  22. Morgunov, K.P.; Ryabov, G.; Buchnev, I. Determination of the optimal modes of filling and emptying the chamber of the navigational lock of a low-pressure hydroelectric complex. J. Phys. Conf. Ser. 2021, 2061, 012136. [Google Scholar] [CrossRef]
  23. Nogueira, H.I.S.; Ven, P.v.d.; O’Mahoney, T.; Loor, A.D.; Hout, A.v.d.; Kortlever, W. Effect of Density Differences on the Forces Acting on a Moored Vessel While Operating Navigation Locks. J. Hydraul. Eng. 2018, 144, 04018021. [Google Scholar] [CrossRef]
  24. Liu, B.; Yang, J.; Huang, Y.; Wang, L. Hydraulic Research on Filling and Emptying System of Water-Saving Ship Lock for Navigation-Power Junction in Mountainous River. In Proceedings of the PIANC Smart Rivers 2022; Lecture Notes in Civil Engineering; Springer: Singapore, 2023; pp. 1492–1501. [Google Scholar]
  25. Savary, C.; Bertin, B.; Lenaerts, M.; El Ouamari, I.; Bousmar, D. Transverse Mooring Forces Due to Asymmetrical Filling in a Lock with Longitudinal Culverts and Side Ports. In Proceedings of the PIANC Smart Rivers 2022; Lecture Notes in Civil Engineering; Springer: Singapore, 2023; pp. 724–735. [Google Scholar]
  26. Badano, N.D.; Menéndez, Á.N. Numerical modeling of Reynolds scale effects for filling/emptying system of Panama Canal locks. Water Sci. Eng. 2021, 14, 237–245. [Google Scholar] [CrossRef]
  27. Calvo Gobbetti, L.E. Design of the filling and emptying system of the new Panama Canal locks. J. Appl. Water Eng. Res. 2013, 1, 28–38. [Google Scholar] [CrossRef]
  28. Stockstill, R.L.; Berger, R.C. A Three-Dimensional Numerical Model for Flow in a Lock Filling System. In World Environmental and Water Resources Congress 2009; Stockstill, R.L., Berger, R.C., Eds.; ASCE Library: Lawrence, KS, USA, 2009; pp. 1–10. [Google Scholar]
  29. Kašpar, T. Efficiency of energy dissipation during filling of the navigation lock. In Proceedings of the 15th International Conference on X-ray Microscopy—XRM2022, Hsinchu, Taiwan, 19–24 June 2022. [Google Scholar]
  30. Thorenz, C.; Schulze, L. Numerical Investigations of Ship Forces During Lockage. J. Coast. Hydraul. Struct. 2021, 1, 27. [Google Scholar] [CrossRef]
  31. Chen, L.; Liu, P.; Zhang, X.; Peng, Y. Layout of double open trench energy dissipater and energy dissipation characteristics of Guigang second line ship lock chamber. J. Waterw. Harb. 2013, 34, 144–149. [Google Scholar]
  32. Hite, J.E.; Stockstill, R.L. Hydraulic Design of a Longitudinal Culvert for Lock Filling and Emptying Systems. J. Hydraul. Eng. 2004, 130, 381–388. [Google Scholar] [CrossRef]
  33. Wang, Y.; Politano, M.; Laughery, R. Towards full predictions of temperature dynamics in McNary Dam forebay using OpenFOAM. Water Sci. Eng. 2013, 6, 317–330. [Google Scholar] [CrossRef]
  34. Shaheed, R.; Mohammadian, A.; Kheirkhah Gildeh, H. A comparison of standard k–ε and realizable k–ε turbulence models in curved and confluent channels. Environ. Fluid Mech. 2019, 19, 543–568. [Google Scholar] [CrossRef]
  35. Shayanseresht, S.; Manafpour, M. A Comparative Assessment of Various Turbulence Models Applied for Simulation of Air-Water Flow over Chute Spillway. Period. Polytech. Civ. Eng. 2021, 65, 1200–1212. [Google Scholar] [CrossRef]
  36. Santos, H.A.; Pinheiro, A.P.; Mendes, L.M.M.; Junho, R.A.C. Turbulent Flow in a Central Vertical Slot Fishway: Numerical Assessment with RANS and LES Schemes. J. Irrig. Drain. Eng. 2022, 148, 04022025. [Google Scholar] [CrossRef]
  37. Zhang, X.; Chen, M.; Xu, G.; Huang, H. An experimental study on the flow characteristics of a three-dimensional turbulent wall jet in a limited space. Adv. Water Sci. 2019, 30, 93–101. [Google Scholar] [CrossRef]
  38. Chen, M.; Chen, Y.; Miao, J.; Huang, H. Energy dissipation characteristics of the open ditch located in a large-scale ship lock chamber with an extreme high water head. Hydro-Sci. Eng. 2022, 5, 69–77. [Google Scholar] [CrossRef]
  39. JTJ 306-2001; Design Code for Filling and Emptying System of Shiplocks. Ministry of Transport of the People’s Republic of China: Beijing, China, 2001.
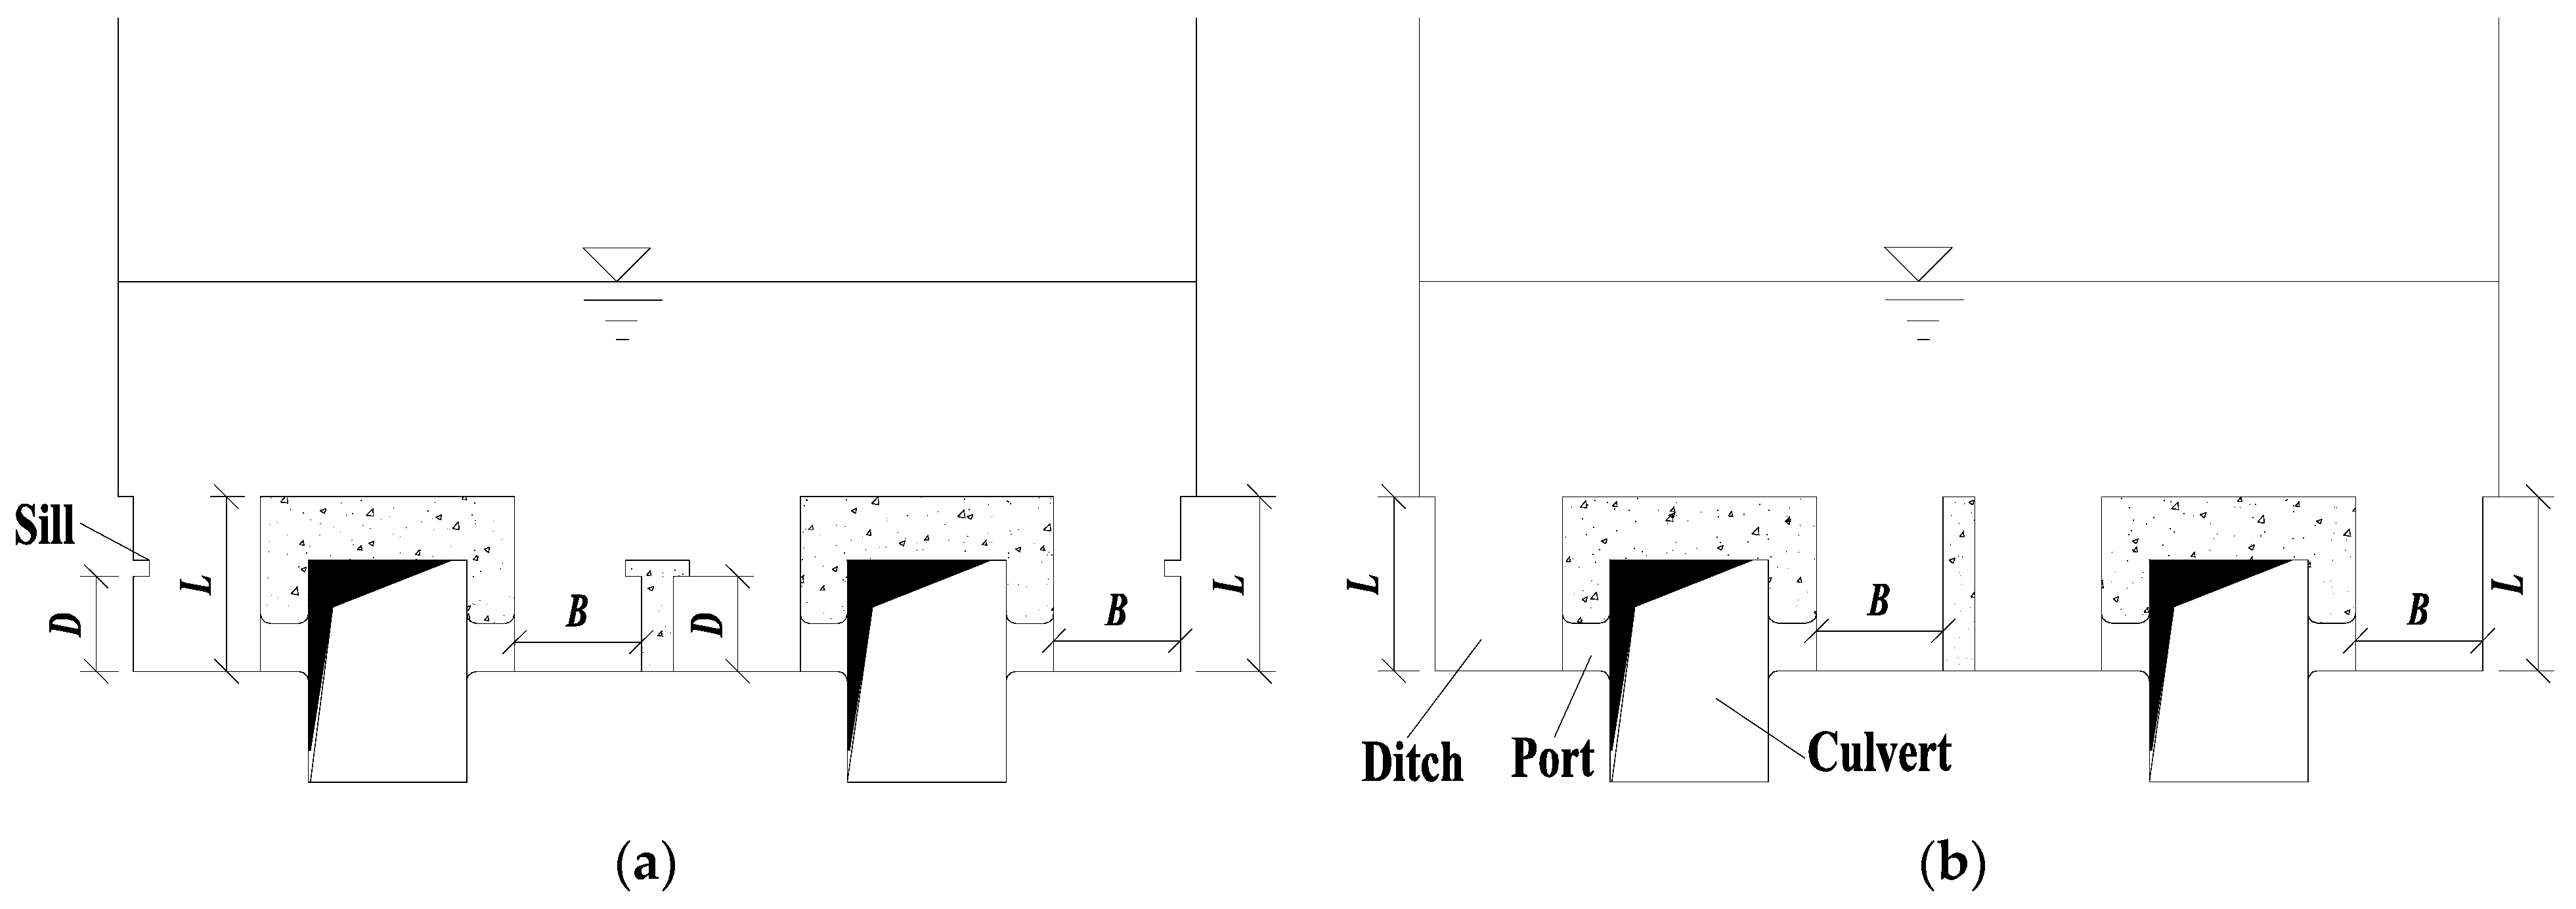
Figure 1. Research structure and variables. (a) With sill. (b) Without sill.
Jmse 12 00086 g001
Figure 2. Mesh.
Figure 2. Mesh.
Jmse 12 00086 g002
Figure 3. Unsteady velocity at the inlet of single port.
Jmse 12 00086 g003
Figure 4. Vertical velocity uniformity of different mesh sizes. (a) 1 m higher than the bottom. (b) 3.6 m below the water surface.
Jmse 12 00086 g004
Figure 5. Verification of the velocity distribution. (a) Spanwise plane. (b) Vertical plane.
Jmse 12 00086 g005
Figure 6. Cross-sectional flow patterns at different sill heights (unit: m/s).
Jmse 12 00086 g006aJmse 12 00086 g006b
Figure 7. Vertical velocity distributions at different sill heights (unit: m/s).
Jmse 12 00086 g007aJmse 12 00086 g007b
Figure 8. Comparison of vertical velocity uniformity of draft critical plane under different sill height conditions.
Jmse 12 00086 g008
Figure 9. Cross-sectional flow patterns at different ditch widths (unit: m/s).
Jmse 12 00086 g009aJmse 12 00086 g009b
Figure 10. Vertical velocity distributions at different ditch widths (unit: m/s).
Jmse 12 00086 g010
Figure 11. Comparison of vertical velocity uniformity of draft critical planes under different ditch width conditions.
Jmse 12 00086 g011
Figure 12. Cross-sectional flow patterns at different ditch depths (unit: m/s).
Jmse 12 00086 g012
Figure 13. Vertical velocity distributions at different ditch depths (unit: m/s).
Jmse 12 00086 g013
Figure 14. Comparison of vertical velocity uniformity of draft critical planes under different ditch depth conditions.
Jmse 12 00086 g014aJmse 12 00086 g014b
Figure 15. Relationship between (mBL)/(Ka) and VZA.
Jmse 12 00086 g015aJmse 12 00086 g015b
Figure 16. Relationship between (Dd)/B and VZA.
Jmse 12 00086 g016
Figure 17. Relationship between (Dd)/(BL) and VZA.
Jmse 12 00086 g017
Table 1. Simulated cases.
CasesB (m)L (m)D (m)CasesB (m)L (m)D (m)
A123.52A1934.5Without sill
A223.53A2035.52
A323.5Without sillA2135.53
A424.52A2235.54
A524.53A2335.55
A624.54A2435.5Without sill
A724.5Without sillA2543.52
A825.52A2643.53
A925.53A2743.5Without sill
A1025.54A2844.52
A1125.55A2944.53
A1225.5Without sillA3044.54
A1333.52A3144.5Without sill
A1433.53A3245.52
A1533.5Without sillA3345.53
A1634.52A3445.54
A1734.53A3545.55
A1834.54A3645.5Without sill
Table 2. Boundary conditions adopted in OpenFOAM v8 (in-text notation).
BoundaryAlpha.WaterUp_rghkEpsilonNut
inletfixedValueuniformFixedValuefixedFluxPressurefixedValuefixedValuecalculated
outletfixedValuezeroGradientfixedValuezeroGradientzeroGradientcalculated
wallzeroGradientnoSlipfixedFluxPressurekqRWallFunctionepsilonWallFunctionnutkWallFunction
Table 3. Schemes of time and spatial discretization adopted in OpenFOAM v8 (in-text notation).
ddtSchemesEuler
gradSchemesGauss linear
div(rhoPhi,U)Gauss linearUpwind grad(U)
div(phi,alpha)Gauss interfaceCompression vanLeer 1
div(phi,k)Gauss upwind
div(phi,epsilon)Gauss upwind
div(((rho*nuEff)*dev2(T(grad(U)))))Gauss linear
laplacianSchemesGauss linear corrected
interpolationSchemeslinear
snGradSchemescorrected
Table 4. Different mesh sizes.
Mesh SizePort
(m)
Local Area
(m)
Ditch (m)Bottom of Lock Chamber
(m)
Lock Chamber
(Horizontal/Vertical)
(m)
Mesh Number
(Initial/after Adaptation)
Coarse0.0750.150.30.61.2/0.4460,000/530,000
Medium0.06250.1250.250.51/0.333800,000/940,000
Fine0.050.10.20.40.8/0.2671,520,000/1,750,000
Disclaimer/Publisher’s Note: The statements, opinions and data contained in all publications are solely those of the individual author(s) and contributor(s) and not of MDPI and/or the editor(s). MDPI and/or the editor(s) disclaim responsibility for any injury to people or property resulting from any ideas, methods, instructions or products referred to in the content.