Article

Experimental Study of the Random Wave-Induced Hydrodynamics and Soil Response in a Porous Seabed Around Double Piles

1
College of Civil Engineering, Qingdao University of Technology, Qingdao 266033, China
2
College of Transportation and Civil Engineering, Shandong Jiaotong University, Jinan 250357, China
3
College of Harbor, Coastal and Offshore Engineering, Hohai University, Nanjing 210098, China
4
School of Engineering and Built Environment, Griffith University, Gold Coast Campus, Southport, QLD 4222, Australia
*
Author to whom correspondence should be addressed.
These authors contributed equally to this work.
J. Mar. Sci. Eng. 2024, 12(10), 1715; https://doi.org/10.3390/jmse12101715 (registering DOI)
Submission received: 31 August 2024 / Revised: 15 September 2024 / Accepted: 23 September 2024 / Published: 29 September 2024
(This article belongs to the Section Coastal Engineering)

Abstract

:
The evaluation of the wave-induced pore pressures around the offshore piles has attracted great attentions among coastal engineers, because they have been commonly used as foundations of numerous marine infrastructures. This paper presents comparative studies of the random wave-induced transient seabed response around single and double piles in a sandy seabed through a series of wave flume experiments. The influences of relative spacing ratios, wave incidence angles, and front pile diameters under different random wave parameters on oscillatory pore pressures in the vicinity of double piles are examined. In addition, variations in wave profiles and dynamic wave pressures surrounding single and double piles are quantitatively analyzed. Based on the experimental results, the following conclusions can be drawn: (1) under the influence of random waves, the wave profiles around the double piles exhibit obvious irregularity and nonlinearity; (2) the shielding effect existing in the tandem piles results in lower dynamic wave pressures around the rear pile compared to the front pile; (3) the pore pressures on the front surface of the double piles decrease with increasing soil depth, with a decreasing attenuation rate at each layer; (4) when the relative spacing ratio G / D 2 = 3 , the group-pile effect weakens, leading to an increase in the pore pressures around the rear pile, approaching the results of a single pile under conditions of lower significant wave heights or periods; (5) the intense disturbance effect caused by large wave incidence angles exacerbates the pore pressure response around the double piles; (6) when the diameter of the front pile in the tandem piles increases, it enhances the shielding effect, thus suppressing the seabed response around the rear pile. In contrast, it causes an increase in the wave surface around the double piles, exacerbating the pore pressure response in the seabed. The latter effect becomes more pronounced when the significant wave height is larger.

1. Introduction

Numerous marine infrastructures, such as offshore wind turbines, cross-sea bridges, and offshore oil and gas platforms, have widely used pile groups as their foundations [1,2,3,4]. These structures are vulnerable to the erosion and damage caused by extreme marine weather conditions. Furthermore, under the combined loading effects of waves, currents, and other cyclic loads, the seabed surrounding the structures can experience liquefaction, scouring, and shear failure, leading to impacts on the structures themselves [5,6,7,8]. For cyclic loads such as waves, when they interact with the structures, they cause periodic fluctuations in wave pressures around the structures, which subsequently alter the pore pressures and effective stresses within the seabed. Excessively high pore pressures can trigger liquefaction during seabed instability events [6,7,9,10]. Liquefaction causes the seabed soil to lose its bearing capacity, threatening the stability of nearby structures. Double piles are the most basic constituent units in pile group structures. Thus, predicting the hydrodynamics around the double piles and the response of the seabed to wave action is crucial for the design of pile foundations in marine constructions [7,11].
Previous experiments and field observations have revealed two mechanisms of the wave-induced seabed response: the oscillatory mechanism and the residual mechanism [7,12,13,14]. The oscillatory mechanism typically occurs on a sandy seabed with high permeability, where the upward pressure gradient induced by wave troughs at the surface of the seabed can easily trigger instantaneous liquefaction [7]. In contrast, in poorly draining silty and clayey seabeds, accumulation of pore pressures can be observed, indicating the presence of the residual mechanism. Recently, the dominant ranges of two mechanisms under combined wave and current loads were examined by Wan et al. [15]. In this work, only the oscillation mechanism in the seabed response surrounding the pile structures was studied.
In recent years, research on wave–seabed–pile interactions has primarily focused on a single pile. Considering a single pile [16,17,18], a numerical study was conducted to investigate the variations in pore pressures, revealing that the pile impeded the spatial development of pore pressures [7]. The hydrodynamic characteristics and the seabed response caused by waves around a partially embedded single pile were analyzed through experimental studies in a flume, examining the spatial and temporal domains [7]. Later, Lin et al. [19] performed numerical simulations on the oscillatory response of the seabed and the instantaneous liquefaction potential around a single pile under different angles of interaction between waves and currents.
Pile groups are used more commonly as foundations for offshore structures, unlike single piles, where the group effects are significant. Among previous studies, the influences of the wave and soil parameters on the response of the seabed in the vicinity of a high-rise structure foundation of the Donghai wind farm (Shanghai, China) were investigated [7]. Zhang et al. [20] established a comprehensive three-dimensional numerical model for a wave–seabed–pile foundation platform system (2 × 2 pile group). They concluded that the platform had minimal impact on the pore pressures in the seabed surrounding the pile foundation below, with the wave parameters and the characteristics of the seabed being the main factors affecting these variations. Based on the WSSI model proposed by Jeng [7], Lin et al. [21] investigated the phenomenon of near capture of a four-cylinder structure that interacts with waves at two incident wave angles. Later, Asumadu et al. [22] explored the hydrodynamic characteristics and oscillation mechanisms of the seabed response around offshore tripod foundations, considering parameters such as the pile diameter, spacing, and wave incidence angles, while also discussing the distribution of the liquefaction zones in the seabed. Currently, numerical simulation methods are widely used to study the dynamic response around pile group structures; however, there is a lack of supporting experimental data.
The aforementioned studies are limited to regular wave loads, although the waves exhibit notable randomness and irregularity in real marine environments. Given that the nature of random waves continuously varies in space and time, probabilistic statistical theory can be applied for analysis based on the characteristics of the time and frequency domains [23]. Spectral analysis facilitates the transition from the time domain to the frequency domain. To date, various wave spectra have been reported in the literature [24,25,26]. Among these, the JONSWAP spectrum proposed during the Joint North Sea Wave Project [24] is one of the most widely used. Liu and Jeng [27] may have been the first to attempt to determine the response of the soil induced by irregular waves. They proposed a semi-analytical solution for the response of the seabed in a finite thickness of the soil layer under random wave action, based on the framework of regular waves. Later, Xu and Dong [28] used integrated modeling techniques to probabilistically analyze the liquefaction potential of the seabed under the influence of random waves and regular waves with equivalent significant wave heights, revealing that the liquefaction depth caused by random waves is greater than that induced by regular waves. Thus, relying on the findings related to the dynamic response of the seabed under regular wave conditions to infer the effects of random wave loading is deemed inadequate. Yu et al. [29] conducted flume experiments that examined the transient pore pressure response of sandy seabeds induced by random waves of the JONSWAP spectrum type. Their study showed significant discrepancies between the results obtained from the regular and random wave loading. However, these studies have focused mainly on the seabeds without structures.
Regarding the random wave-induced soil response around marine structures, Sumer and Cheng [30] experimentally studied the buoyancy issues of pipelines within liquefied soils under regular and irregular wave conditions. They concluded that the processes of accumulation of pore pressures within the seabed for both types of waves were similar [30]. Zhou et al. [31] developed an FEM model with COMSOL to determine that the peripheral pore pressures of the buried pipelines increased with the increase in the permeability and saturation of the seabed under the action of random waves. However, the liquefaction potentials showed the opposite trend. Later, Zhang et al. [32] performed a series of wave flume experiments to investigate the spatial–temporal variations in the pore pressures near a single pile induced by random waves of the JONSWAP spectrum. To date, no experimental research has been reported on the hydrodynamic and seabed response caused by random waves around group piles.
This paper presents an experimental study of the hydrodynamic characteristics and seabed response around single and double piles subjected to random wave loading. The JONSWAP spectrum was used to simulate random wave loading in the tests. In Section 2, details of the experimental setup and procedures are outlined. Section 3 discusses the hydrodynamic characteristics of the flow fields around single and double piles under the influence of random waves. In Section 4, the changes in the pore pressures within the seabed caused by random waves on the front surface of single and double piles are explored. Then, the effects of various parameters on the transient seabed responses around double piles are discussed, including the relative spacing ratios, wave incident angles, and the diameter of the front pile. Finally, the key findings of this study are summarized in Section 5.

2. Laboratory Experiment

This study examined the changes in wave profiles, dynamic wave pressures, and pore pressures around single and double piles under random wave loading through a series of wave flume experiments. Particular attention was given to the influence of relative spacing ratios, wave incident angles, and front pile diameter on the seabed response around double piles.

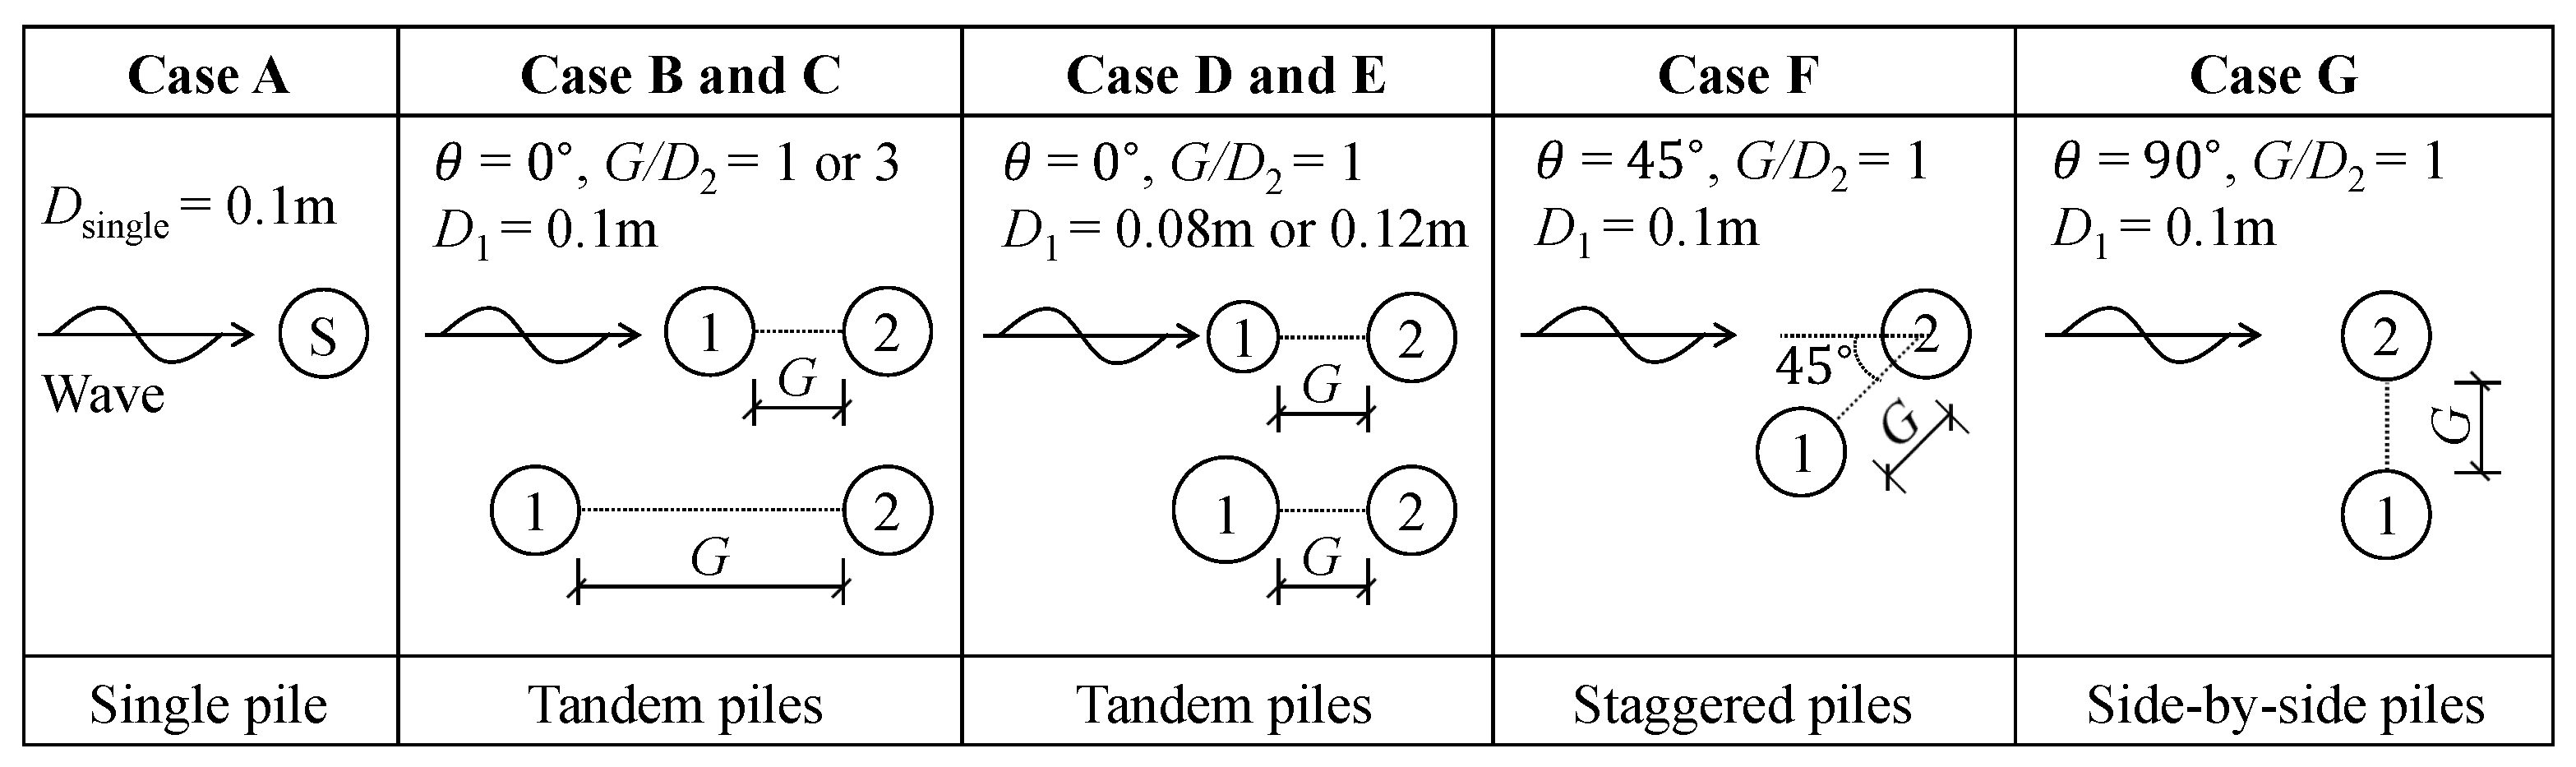
2.1. Experimental Setup

The experiment was carried out on a large wave flume at the Port and Navigation Hydrodynamics Laboratory of Shandong Jiaotong University in China, with dimensions of 50 m (length) × 1.2 m (width) × 1.3 m (depth). Transparent acrylic panels on both sides allowed real-time observation of the testing process, and the bottom was constructed of rigid impermeable materials. Throughout the series of flume experiments, the average depth of the water was consistently maintained at 0.45 m. As illustrated in Figure 1, the wave flume was equipped with a paddle-type wave generator installed at the upstream, capable of generating stable regular waves and random waves. The wave height for both types can reach up to 0.25 m, with a wave period range of 1.0 to 4.0 s. Downstream of the flume, a sloped wave absorber was installed to dissipate the wave energy, reducing the interference of the reflected waves with the experimental results. Furthermore, by manually controlling the flow generation system, it was possible to achieve bidirectional currents within the wave flume. In the middle section, an experimental soil tank was set up, measuring 3.6 m (length) × 1.2 m (width) × 0.3 m (depth), positioned 21.7 m away from the wave generator. Each side of the soil tank featured a 3.15 m long horizontal concrete platform, and both platforms had a slope ratio of 1:10 with the bottom of the flume to minimize the frictional effects on the experimental results, allowing the waves to smoothly propagate towards the experimental soil tank.
For single-pile experiments, a transparent organic glass single-pile foundation model was vertically embedded at the bottom of the experimental soil tank, with a pile diameter of D s i n g l e = 0.1 m, placed 23.7 m from the wave generator. In the double-pile experiments, the diameter and position of the front pile were varied, while the rear pile, with a diameter of D 2 = 0.1 m, was kept in the same fixed position as in the single pile tests. As shown in Figure 2, the experiments considered two relative spacing ratios for the double piles, G / D 2 = 1 and 3, in addition to three different diameters for the first pile, D 1 = 0.08 m, 0.1 m, and 0.12 m. The effects of varying angles θ = 0 ° , 45°, and 90° between the center line connecting the two piles and the incident wave direction were also examined. In this study, seven pile arrangement schemes (Figure 2: Cases A–G) were adopted. Each scheme was tested under seven wave conditions (Table 1), resulting in a total of 49 test sets, each set repeated at least twice.
In order to simulate the dynamic response around the pile foundation in the real ocean, based on the gravity similarity parameter G [18]:
G = W s γ D 2
where γ represents the submerged unit weight of soil and W s represents the submerged weight of the pile structure. Based on the dimensional analysis of prototypes and models, it can be concluded that:
λ G = λ W s λ γ λ D 2 = 1
where λ represents the ratio between the prototype values and model values of each physical parameter. For the same seabed material, λ γ = 1 . The length of the pile model in the flume tests was 1.75 m, with a depth of 0.3 m buried in the soil layer and a wall thickness of 0.005 m. The submerged weight corresponding to pile models of different diameters is shown in Table 2.

2.2. Instrument Setup

The experimental setup for the measurement transducers incorporated 4 wave gauges (G1, G2, G3, and G4), 16 wave pressure sensors (Points 1 to 16), and 36 pore pressure sensors (Points 17 to 52), as shown in Figure 1b,c. These instruments were used for the statistical analysis of wave profiles, wave pressures, and variations in the pore pressures surrounding the pile foundations during single- and double-pile experiments.
Four wave gauges were designed by Yunchuangyuan Intelligent Technology Co., Ltd., Nanjing, China (YWH203-D, accuracy of ± 0.15 % ). They were used to monitor the changes in the free-surface elevation in real time. As illustrated in Figure 1b, wave gauge G1 was placed 3.15 m from the front face of pile 2 to record the incident wave surface after a wave above the concrete slope. The remaining three wave gauges (G2, G3, and G4) were placed at the front, side, and rear of pile 2, each located 0.1 m from the center of pile 2, providing insight into the shading and interference effects caused by the front pile on the wave profile alterations around the rear pile. The wave pressures and pore pressures surrounding the pile foundation were obtained from the CY302 miniature intelligent pressure sensors (outer diameter 6 mm) and the CY303 intelligent pore water pressure sensors (outer diameter 8 mm), designed and manufactured by Keda Shengying Technology Co., Ltd. in Chengdu, China. The measurement ranges for these sensors were 0–20 kPa and 0–30 kPa, respectively, both exhibiting an accuracy of ± 0.1 % . As shown in Figure 1c, a total of 16 CY302 type sensors were used to measure the wave pressures acting on the surfaces of the double piles. Points 1 to 12 were located at a distance of 0.15 m below the static water level on the surface of the double piles. Among these, points 1 to 5 and 7 to 11 were arranged along the periphery of the piles at a 45-degree angle. There was a 90-degree interval between points 5 and 6, as well as between points 11 and 12. Points 13 and 15, as well as 14 and 16, were located at a distance of 0.3 m below the static water level on the front and back surfaces of the double piles, respectively. A total of 36 CY303 type sensors were used to collect the changes in pore pressures around the double piles embedded in the seabed, with 30 sensors fixed in the reserved drill holes on the surface of the piles and 6 installed on support components located 0.05 m from the surface of pile 2. During the single-pile experiments, the number and layout of the sensors surrounding the pile were identical to those used for pile 2 in the double-pile experiments. The field layout of the pressure sensors for both the single- and double-pile experiments is illustrated in Figure 3.
Wave gauges, miniature intelligent pressure sensors, and intelligent pore pressure sensors utilized in both single- and double-pile experiments simultaneously collected statistical data through the tl-sg1005+ switchboard, with a sampling frequency of 100 Hz.

2.3. Soil Properties

This study focuses on the oscillation mechanism of the seabed response surrounding single- and double-pile foundations. Quartz sand was selected as the seabed material. The median particle size of the sand was d 50 = 0.2037 mm. The particle size distribution curve of the soil sample was determined by sieving (see Figure 4). For other types of seabed such as clay or clay substrata with accumulated pore pressures, similar experimental and data analysis methods can be used to study them as described in this paper.
The dry density ρ d and the specific gravity G s of the soil sample were determined using the cutting ring method and the specific gravity bottle method, respectively. According to the proportional relationship between the permeability coefficient and the hydraulic gradient, the permeability coefficient k s was obtained by the constant head permeability test. The elastic modulus E was measured with a triaxial apparatus. The Poisson ratio μ of the soil sample was assumed to be 0.3 on the basis of the empirical values. Therefore, the shear modulus G can be derived from the relationship G = 0.5 E / ( 1 + μ ) . The relative density test was used to measure the maximum and minimum dry densities, in order to obtain the relative density D r of the soil sample. The properties of the soil sample are listed in Table 3.

2.4. Hydrodynamic Conditions

We conducted experimental investigations on single and double piles with different configurations, performing comparative analyses on the hydrodynamic characteristics and the seabed response induced by random wave action. A total of 49 tests were performed, with each test repeated at least twice and the average taken to minimize errors due to randomness. The experiment had high repeatability. The parameters for the random waves used in the single and double pile experiments are presented in Table 1. In each test serial, seven pile configuration layouts (see Figure 2) were considered.
The JONSWAP spectrum type was used for the generation of random waves in the tests, with the following spectral density function [23]:
S ( f ) = β J H 1 / 3 2 T p 4 f 5 exp [ 1.25 ( T p f ) 4 ] γ exp [ ( T p f 1 ) 2 / 2 σ 2 ] ,
β J = 0.06238 0.23 + 0.033 γ 0.185 ( 1.9 + γ ) 1 × [ 1.094 0.01915 ln γ ] ,
T p = T 1 / 3 1 0.132 ( γ + 0.2 ) 0.559 , σ = 0.07 , f f p 0.09 , f > f p ,
where T p denotes the wave period corresponding to the spectral peak point, while f p signifies the wave frequency at the spectral peak point, where T p = 1 / f p . The parameter γ represents the peak enhancement factor, which is utilized to control the sharpness of the peak of the JONSWAP spectrum, which typically ranges from 1.0 to 7.0. For this study, an average value of γ = 3.3 was selected.
The similarity criterion based on Froude number ( F r ) for flume experiment:
λ F r = λ U m λ g 1 / 2 λ D 1 / 2 = 1
Since λ g = 1 , we can obtain:
λ U m = λ D 1 / 2
λ T = λ D λ U m = λ D 1 / 2
Therefore:
λ K C = λ U m λ T λ D = 1
The above derivation indicated that both F r and K C numbers can be satisfied simultaneously in the flume experiment. The variation ranges of F r and K C numbers in the present experiments were 0–0.24 and 0–4.26, respectively, both of which varied within the marine environment of the South China Sea [18].

2.5. Experimental Process

The experiments were carried out with the following setup:
(1)
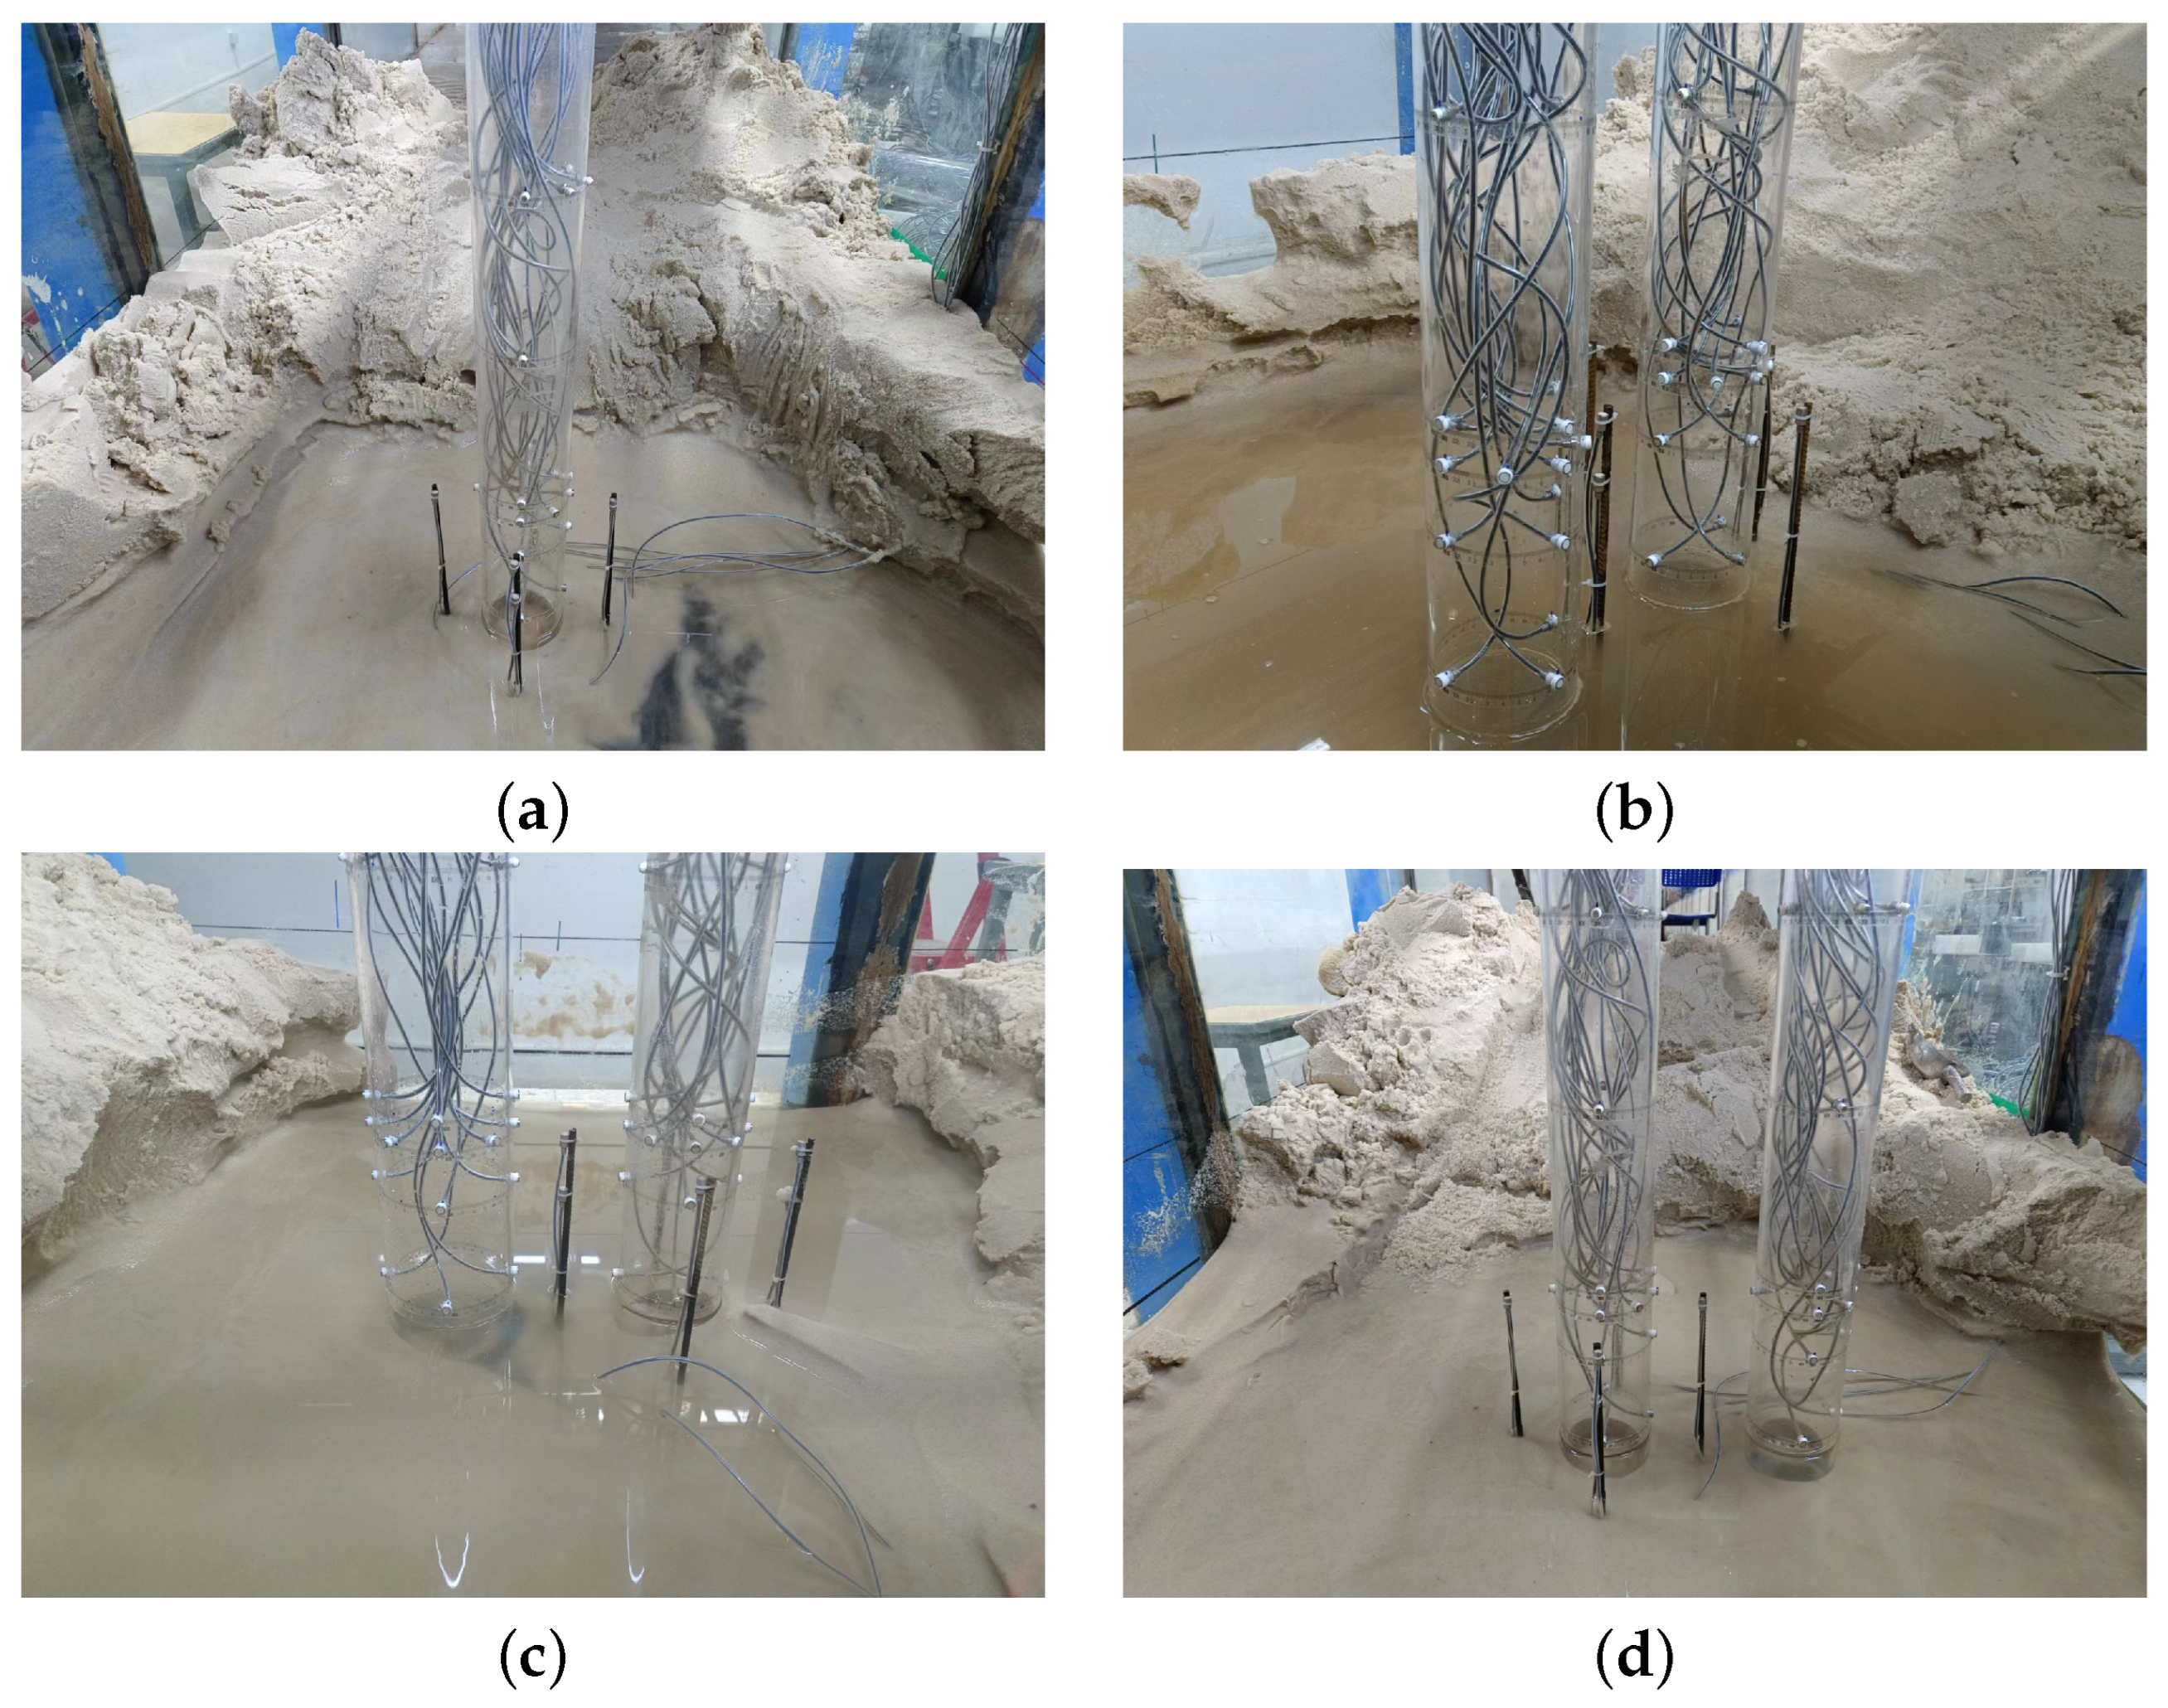
Arrangement of single and double piles and sensors: After thoroughly cleaning the wave flume and the sand tank in the test section, the wave pressure sensors and some pore pressure sensors were installed into pre-drilled holes on the pile surfaces. The remaining pore pressure sensors were affixed to a steel frame within the soil tank. Four wave gauges were secured to a wooden plank positioned above the walls of the wave flume. It is essential for the pore pressure sensors to be immersed in water for at least 24 h to ensure any trapped air is completely expelled, thereby enhancing the accuracy of the experiment.
(2)
Filling the soil tank: Quartz sand was gradually poured into the middle section of the soil tank while simultaneously adding water and continuously stirring the mixture until a uniform liquid state was achieved. After filling the sand, it was left to settle for at least three days to allow consolidation, resulting in a final consolidated soil layer thickness of approximately 0.3 m, with the surface soil smoothed using a scraper.
(3)
Water filling in the wave flume: Water was slowly added to the wave flume until the water level above the soil tank reached 0.45 m, at which point the filling was halted.
(4)
Activating the wave generator: For pure wave testing, the wave generator was directly turned on after waiting for the water surface to stabilize.
(5)
Sensor data collection statistics: All sensors began data acquisition simultaneously, with a sampling frequency set at 100 Hz and a data collection duration of 210 s. During this period, the oscillatory pore pressures in the sandy seabed sufficiently developed and reached a state of equilibrium.
(6)
Shutdown of the wave generator.
(7)
The next set of experiments under the same case repeated steps (4)–(6); when changing to the next case, steps (1)–(6) were repeated.

3. Hydrodynamic Characteristics Around the Double Piles under Random Wave Action

The group pile effect affects the dynamic response around the double piles. Due to the shielding and interference effects caused by the front pile (pile 1; refer to Figure 1b, the wave profiles and dynamic wave pressures around the rear pile (pile 2) in the double-pile configuration do not align with those of a single pile. In this section, the hydrodynamic characteristics around the double piles under random wave conditions are discussed, as well as the comparative analysis with the results from the single-pile experiments. The intersection of the center line of pile 2 and the seabed surface was designated as the origin of the coordinates (which, for single-pile experiments, corresponded to the single-pile center line), with the positive x direction set along the wave propagation direction and the positive z direction oriented upward from the seabed surface. Taking the double-pile experiment with a relative spacing ratio G / D 2 = 1 , wave incident angle θ = 0 ° , and front pile diameter D 1 = 0.1 m (Case B) as an example, a comparative analysis was performed on the differences and similarities of the wave profiles and dynamic wave pressures around the single and double piles. In the following discussion, ‘single pile’ refers to the only pile in the single pile tests, while ‘pile 1’ and ‘pile 2’ refer to the front and rear pile in the double pile tests, respectively. The arrangement can be seen in Figure 1b,c.

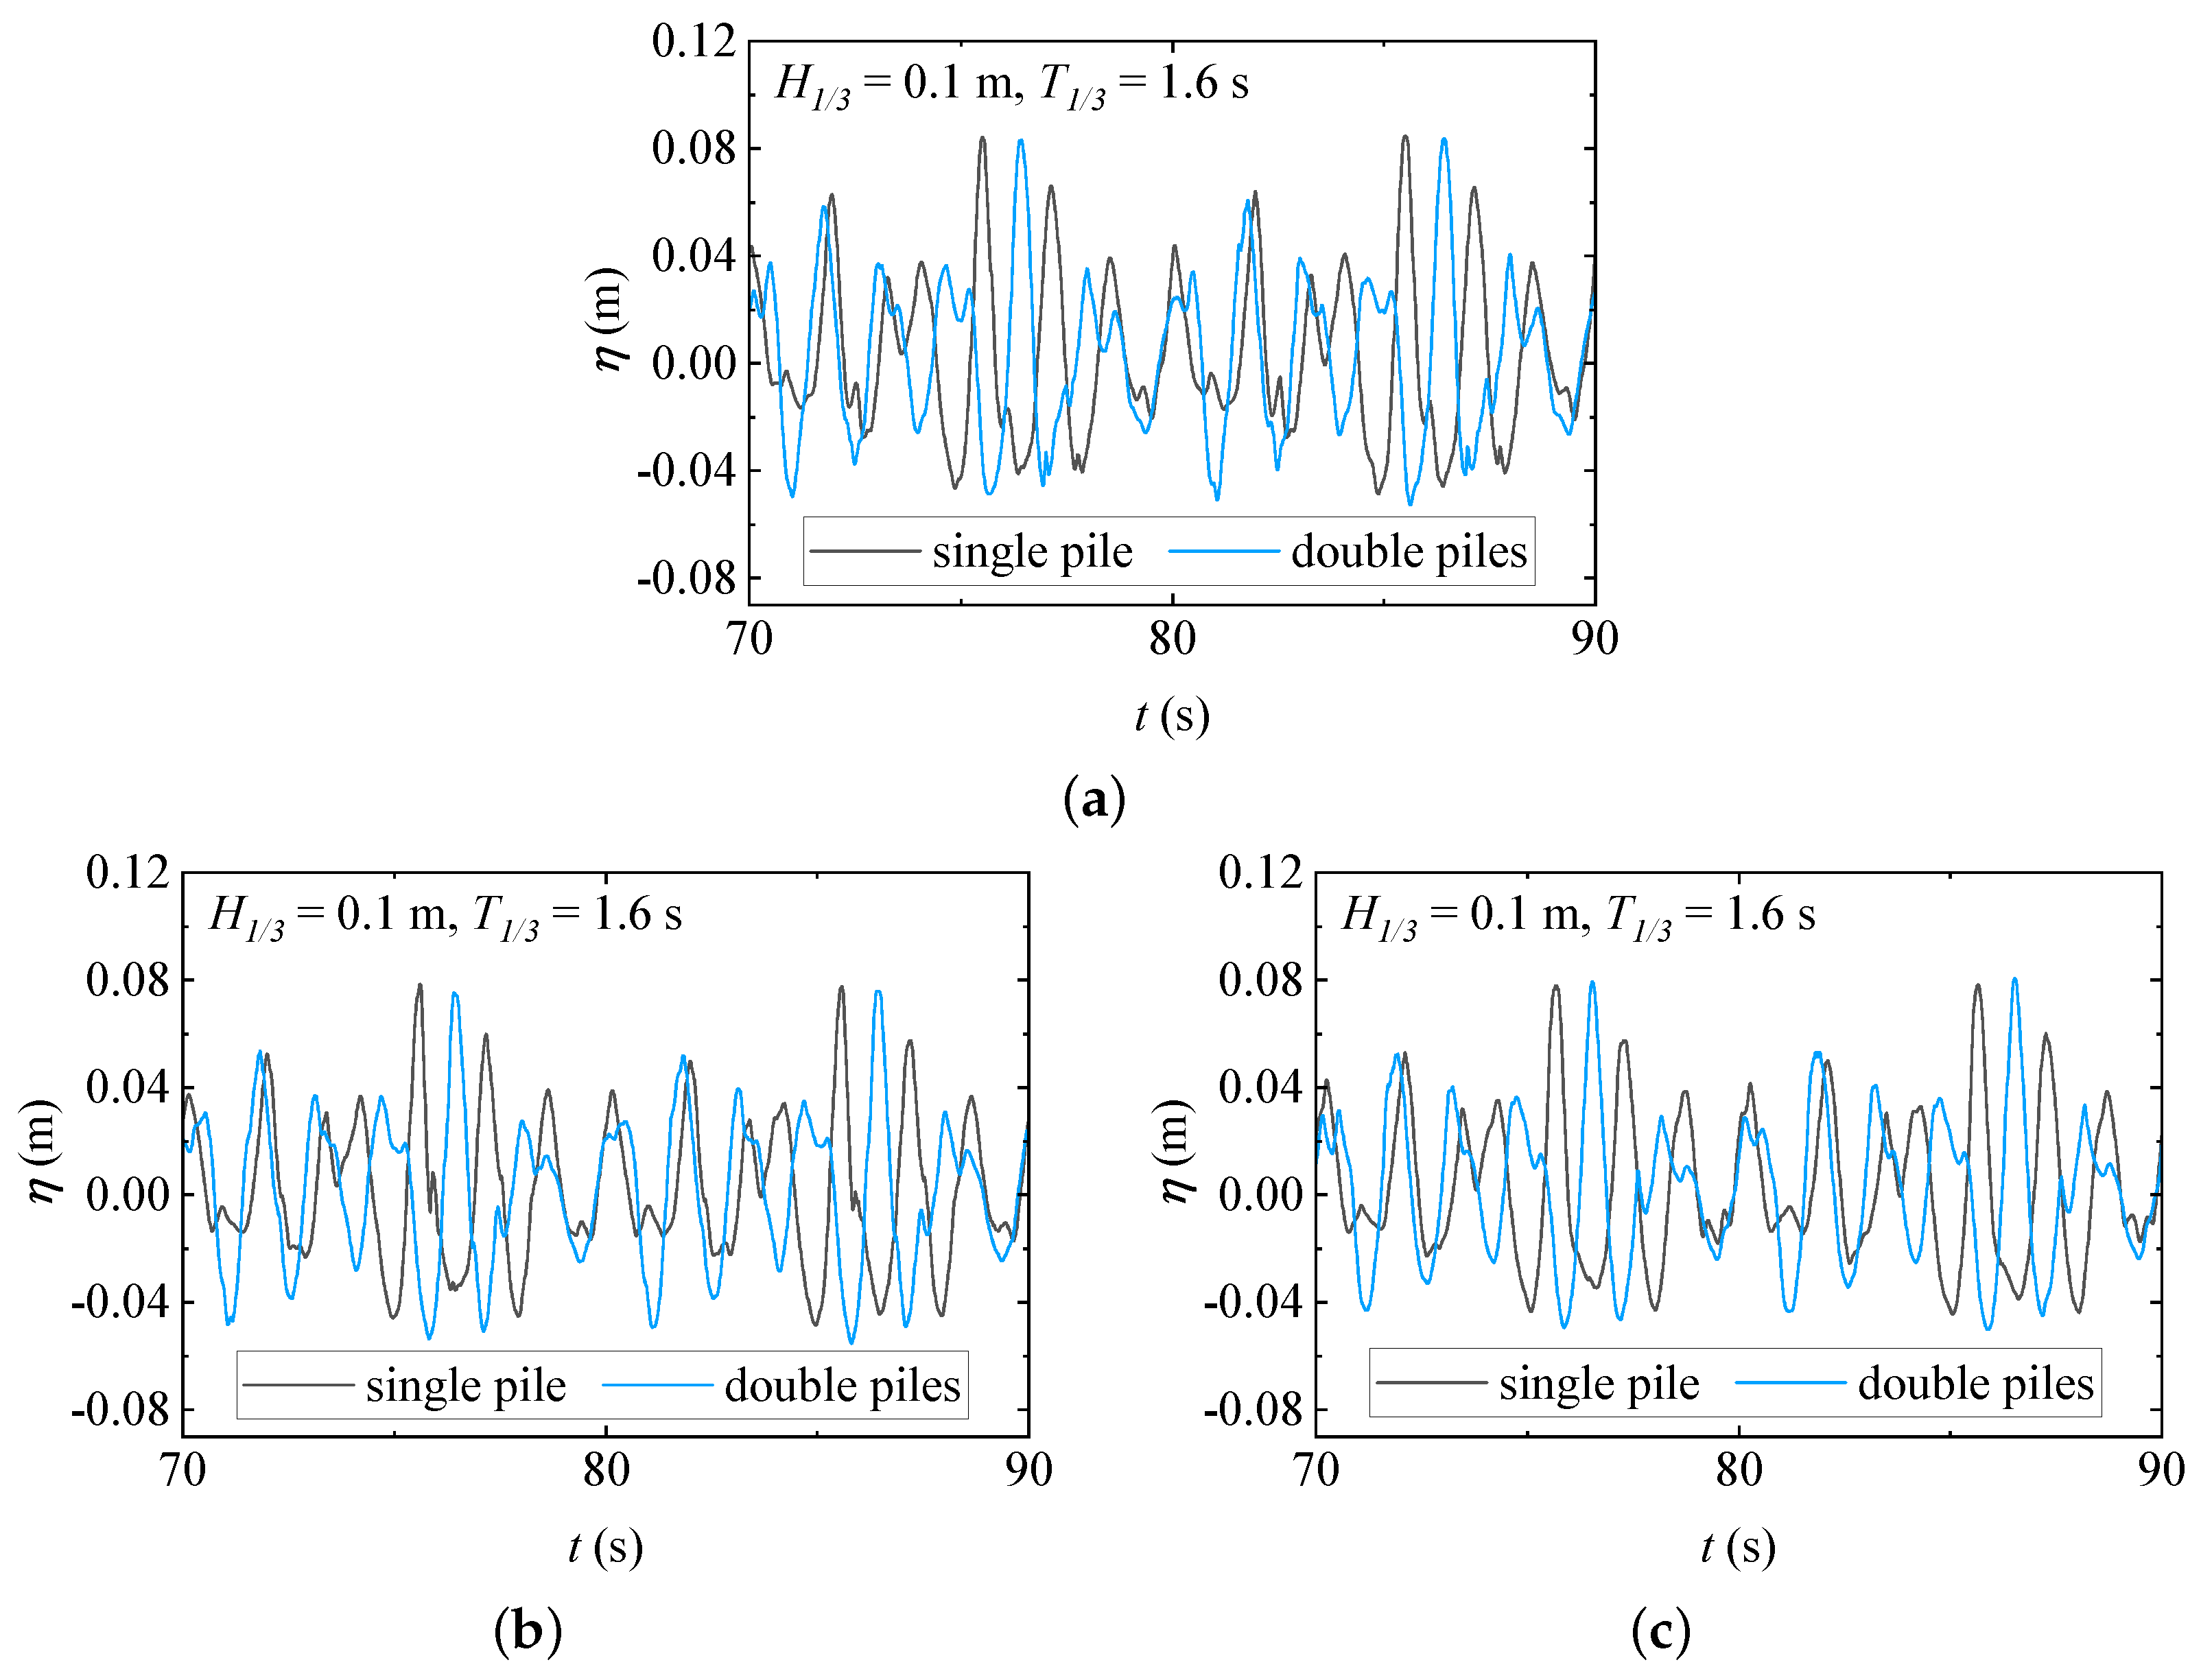
3.1. Wave Profiles Around the Double Piles

In the tests, wave gauges (G2, G3, and G4) were used to measure wave surface variations around a single pile and pile 2 within a range of 0.05 m. Figure 5 depicts the time series of wave surfaces around the single pile and pile 2 under the influence of random waves. Unlike regular waves, the wave surface of random waves exhibits an obvious randomness and irregularity. It can be observed from the figures that the nonlinearity of the wave profiles around the single pile and pile 2 was pronounced. This can be attributed to the diffraction occurring as the waves interacted with the structures. Due to the obstruction of wave propagation by the front pile in the double piles, there was a significant phase difference in the wave profiles around pile 2 and the single pile. Furthermore, the blocking effect of the pile structure caused the front wave height of the single pile and pile 2 to exceed their rear wave height by 7.48% and 5.27%, respectively.

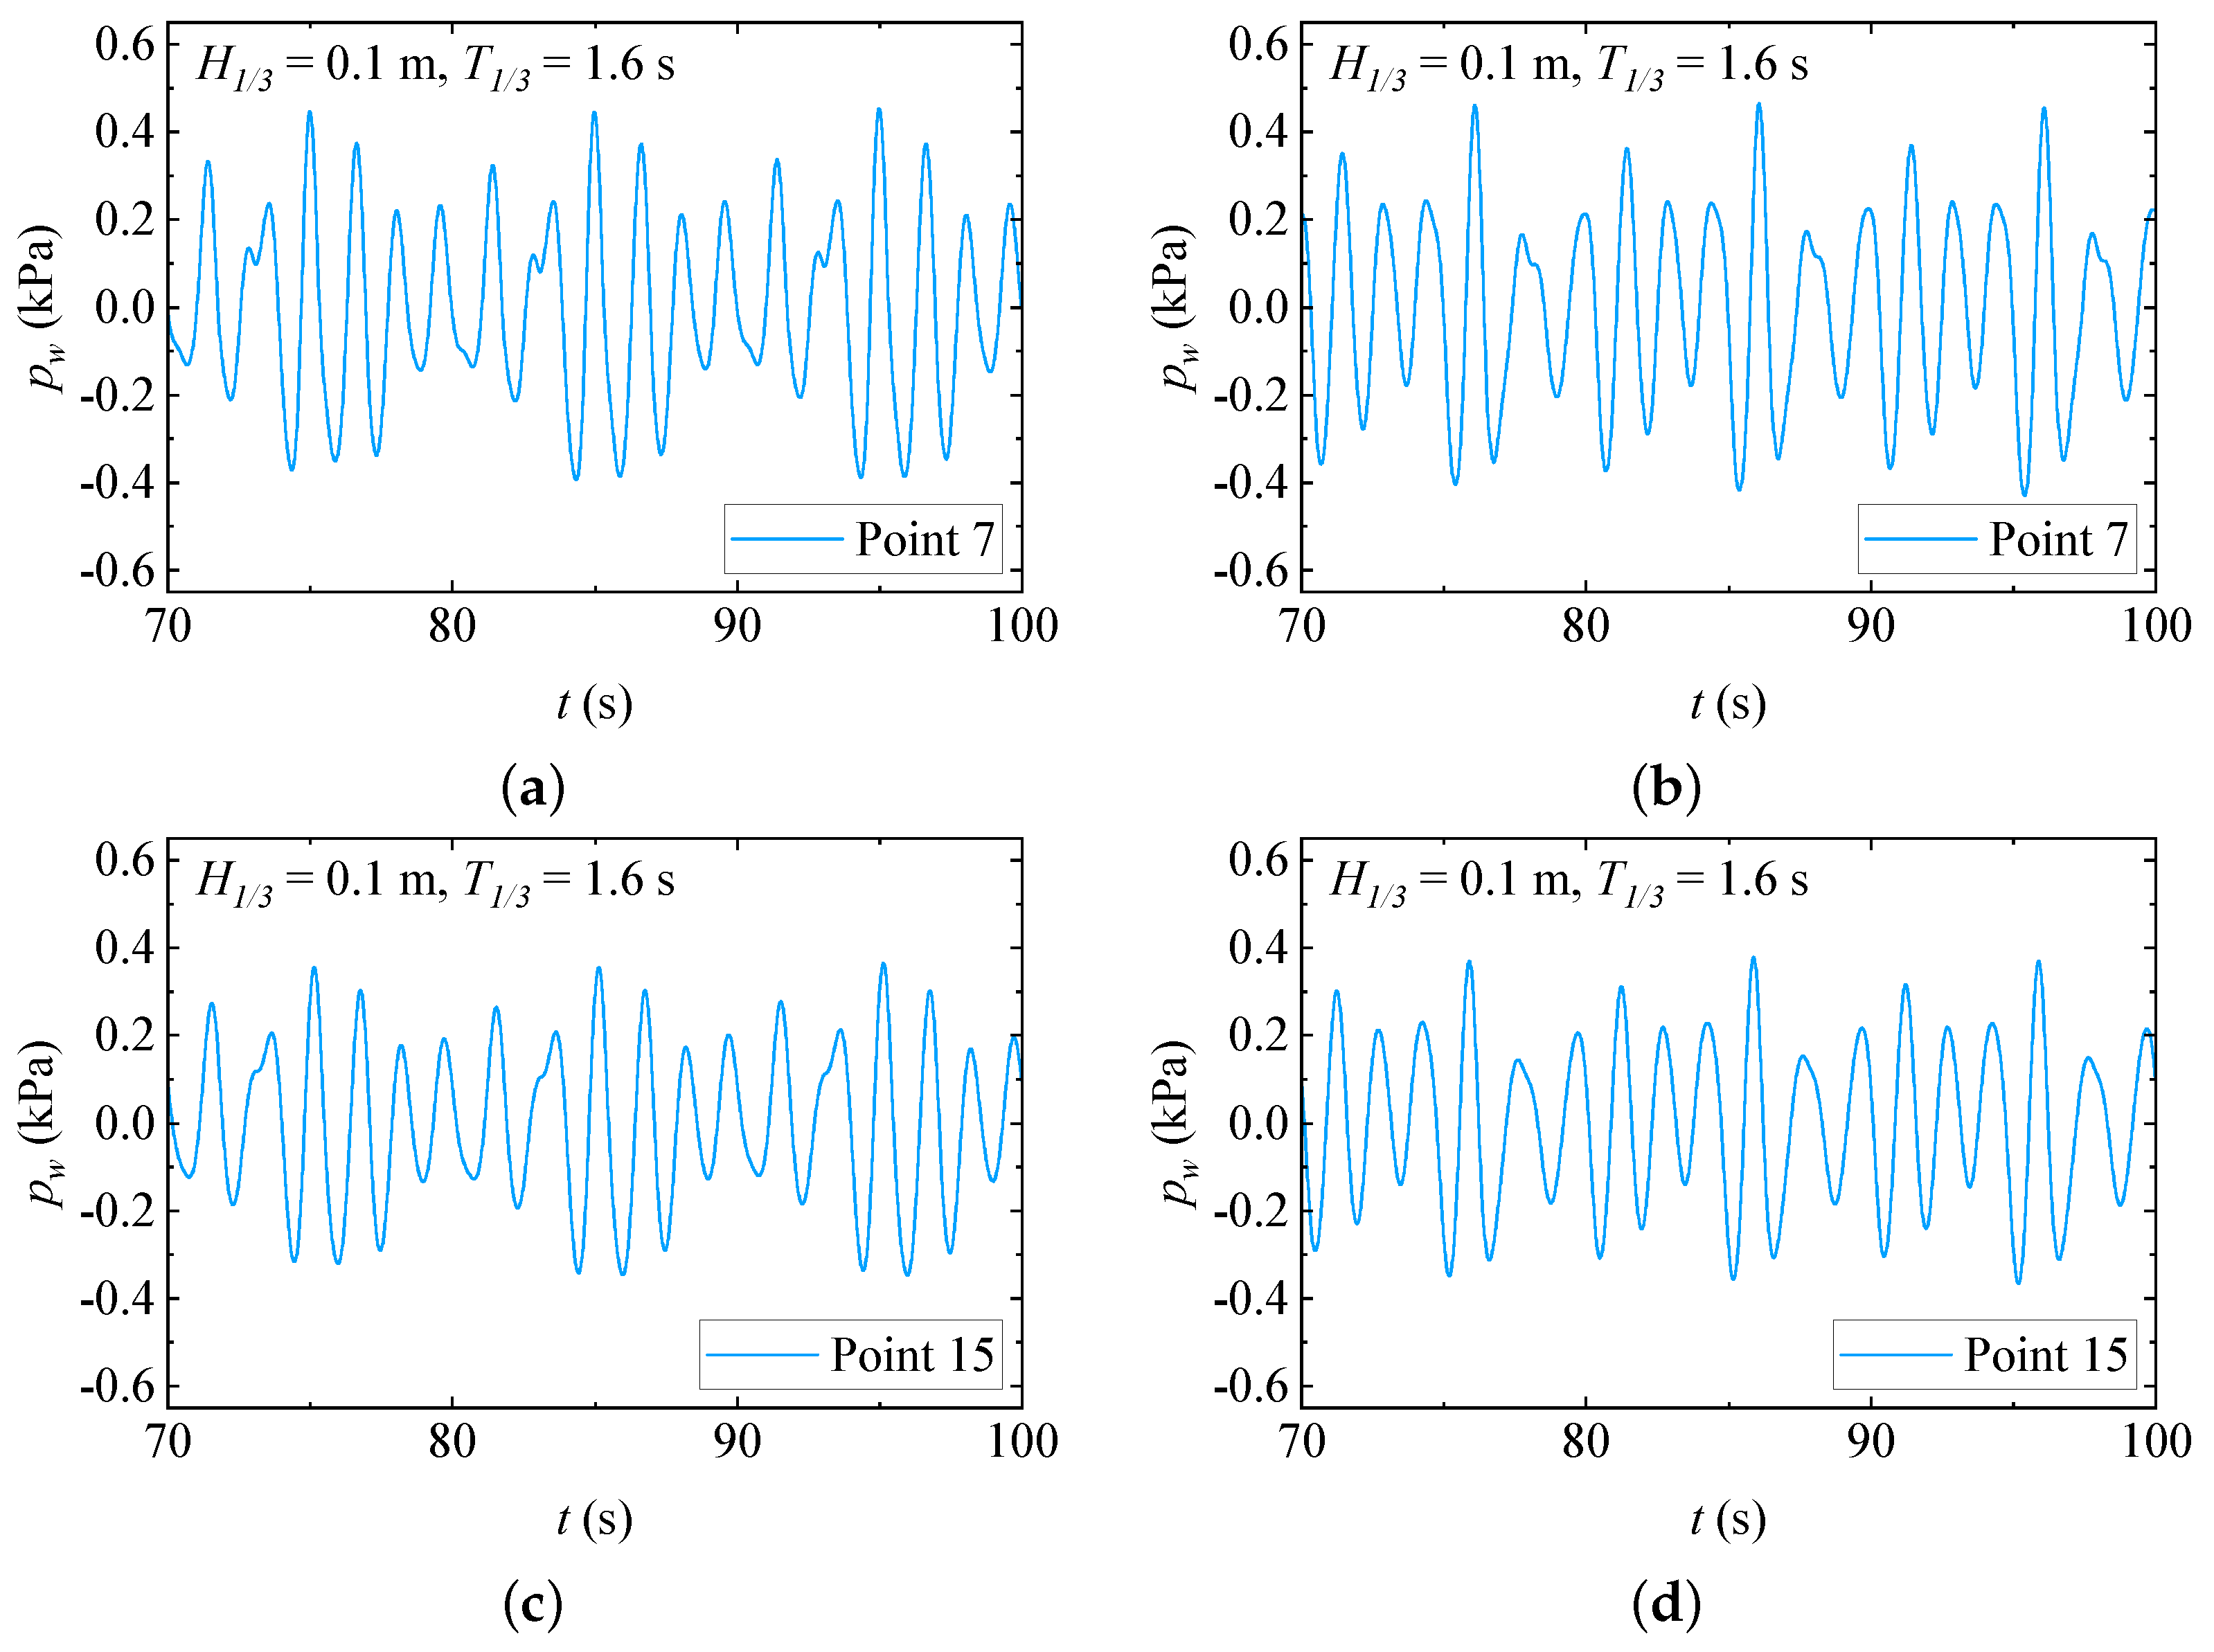
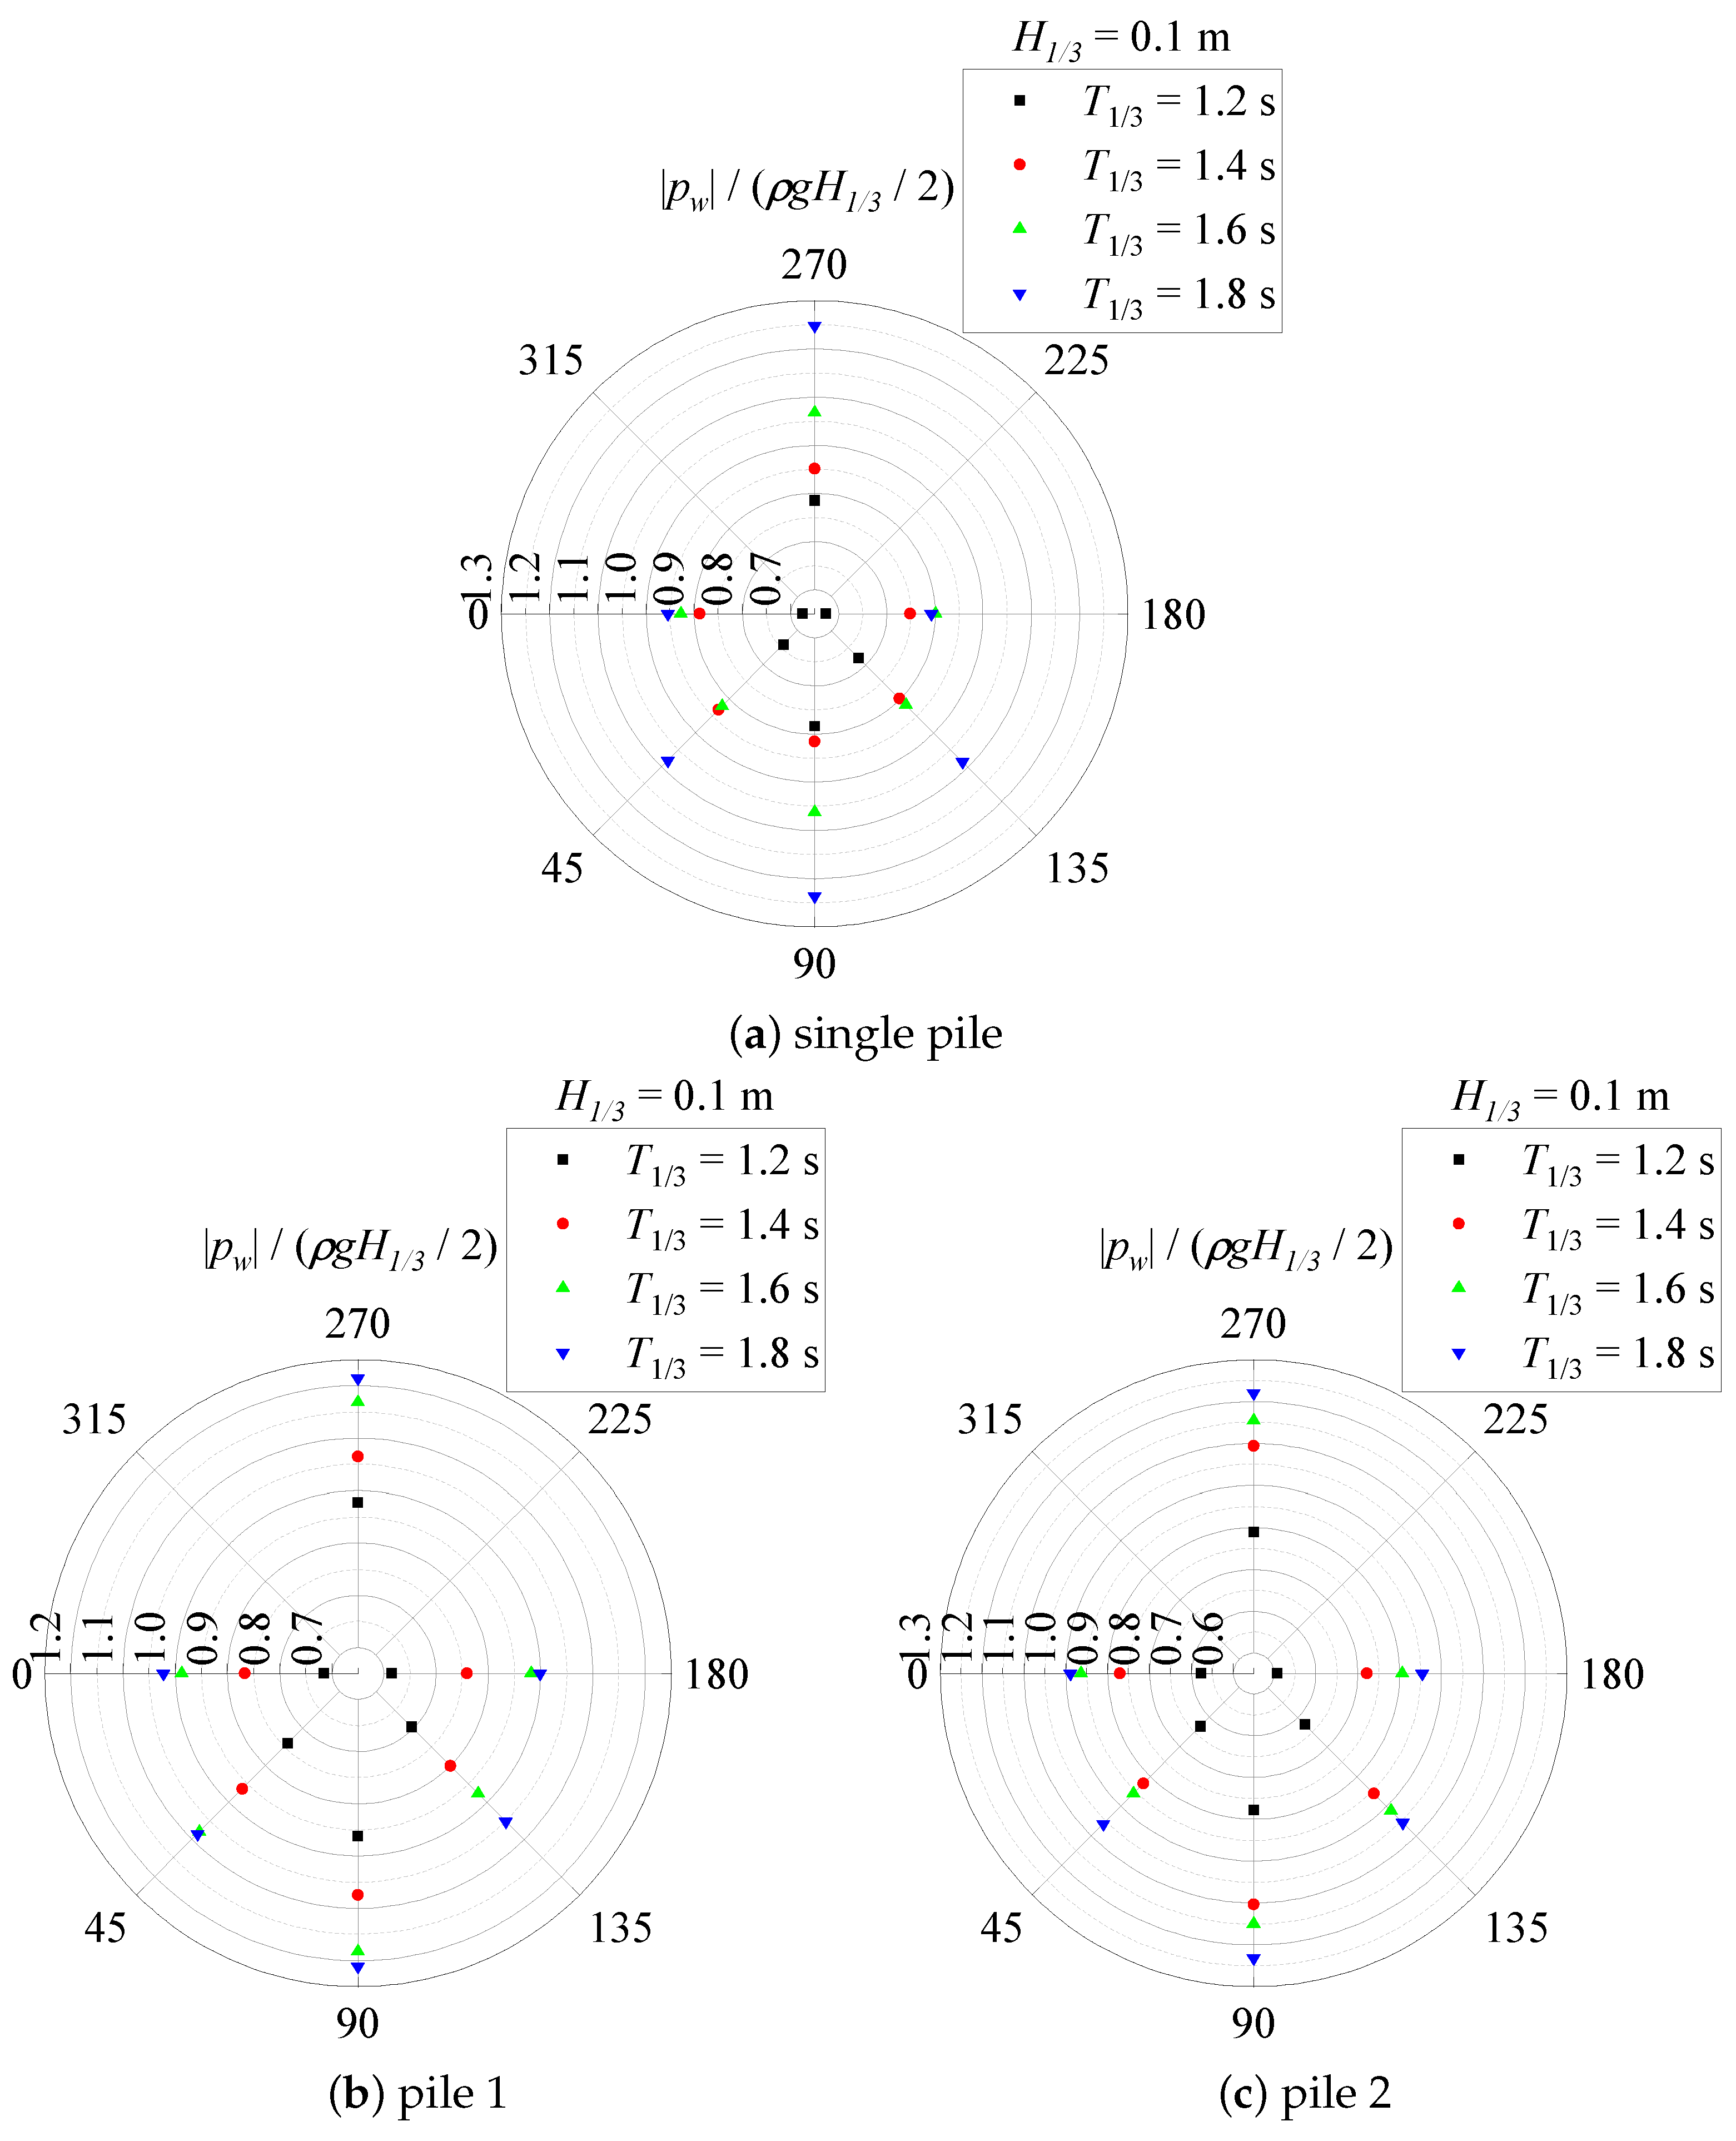
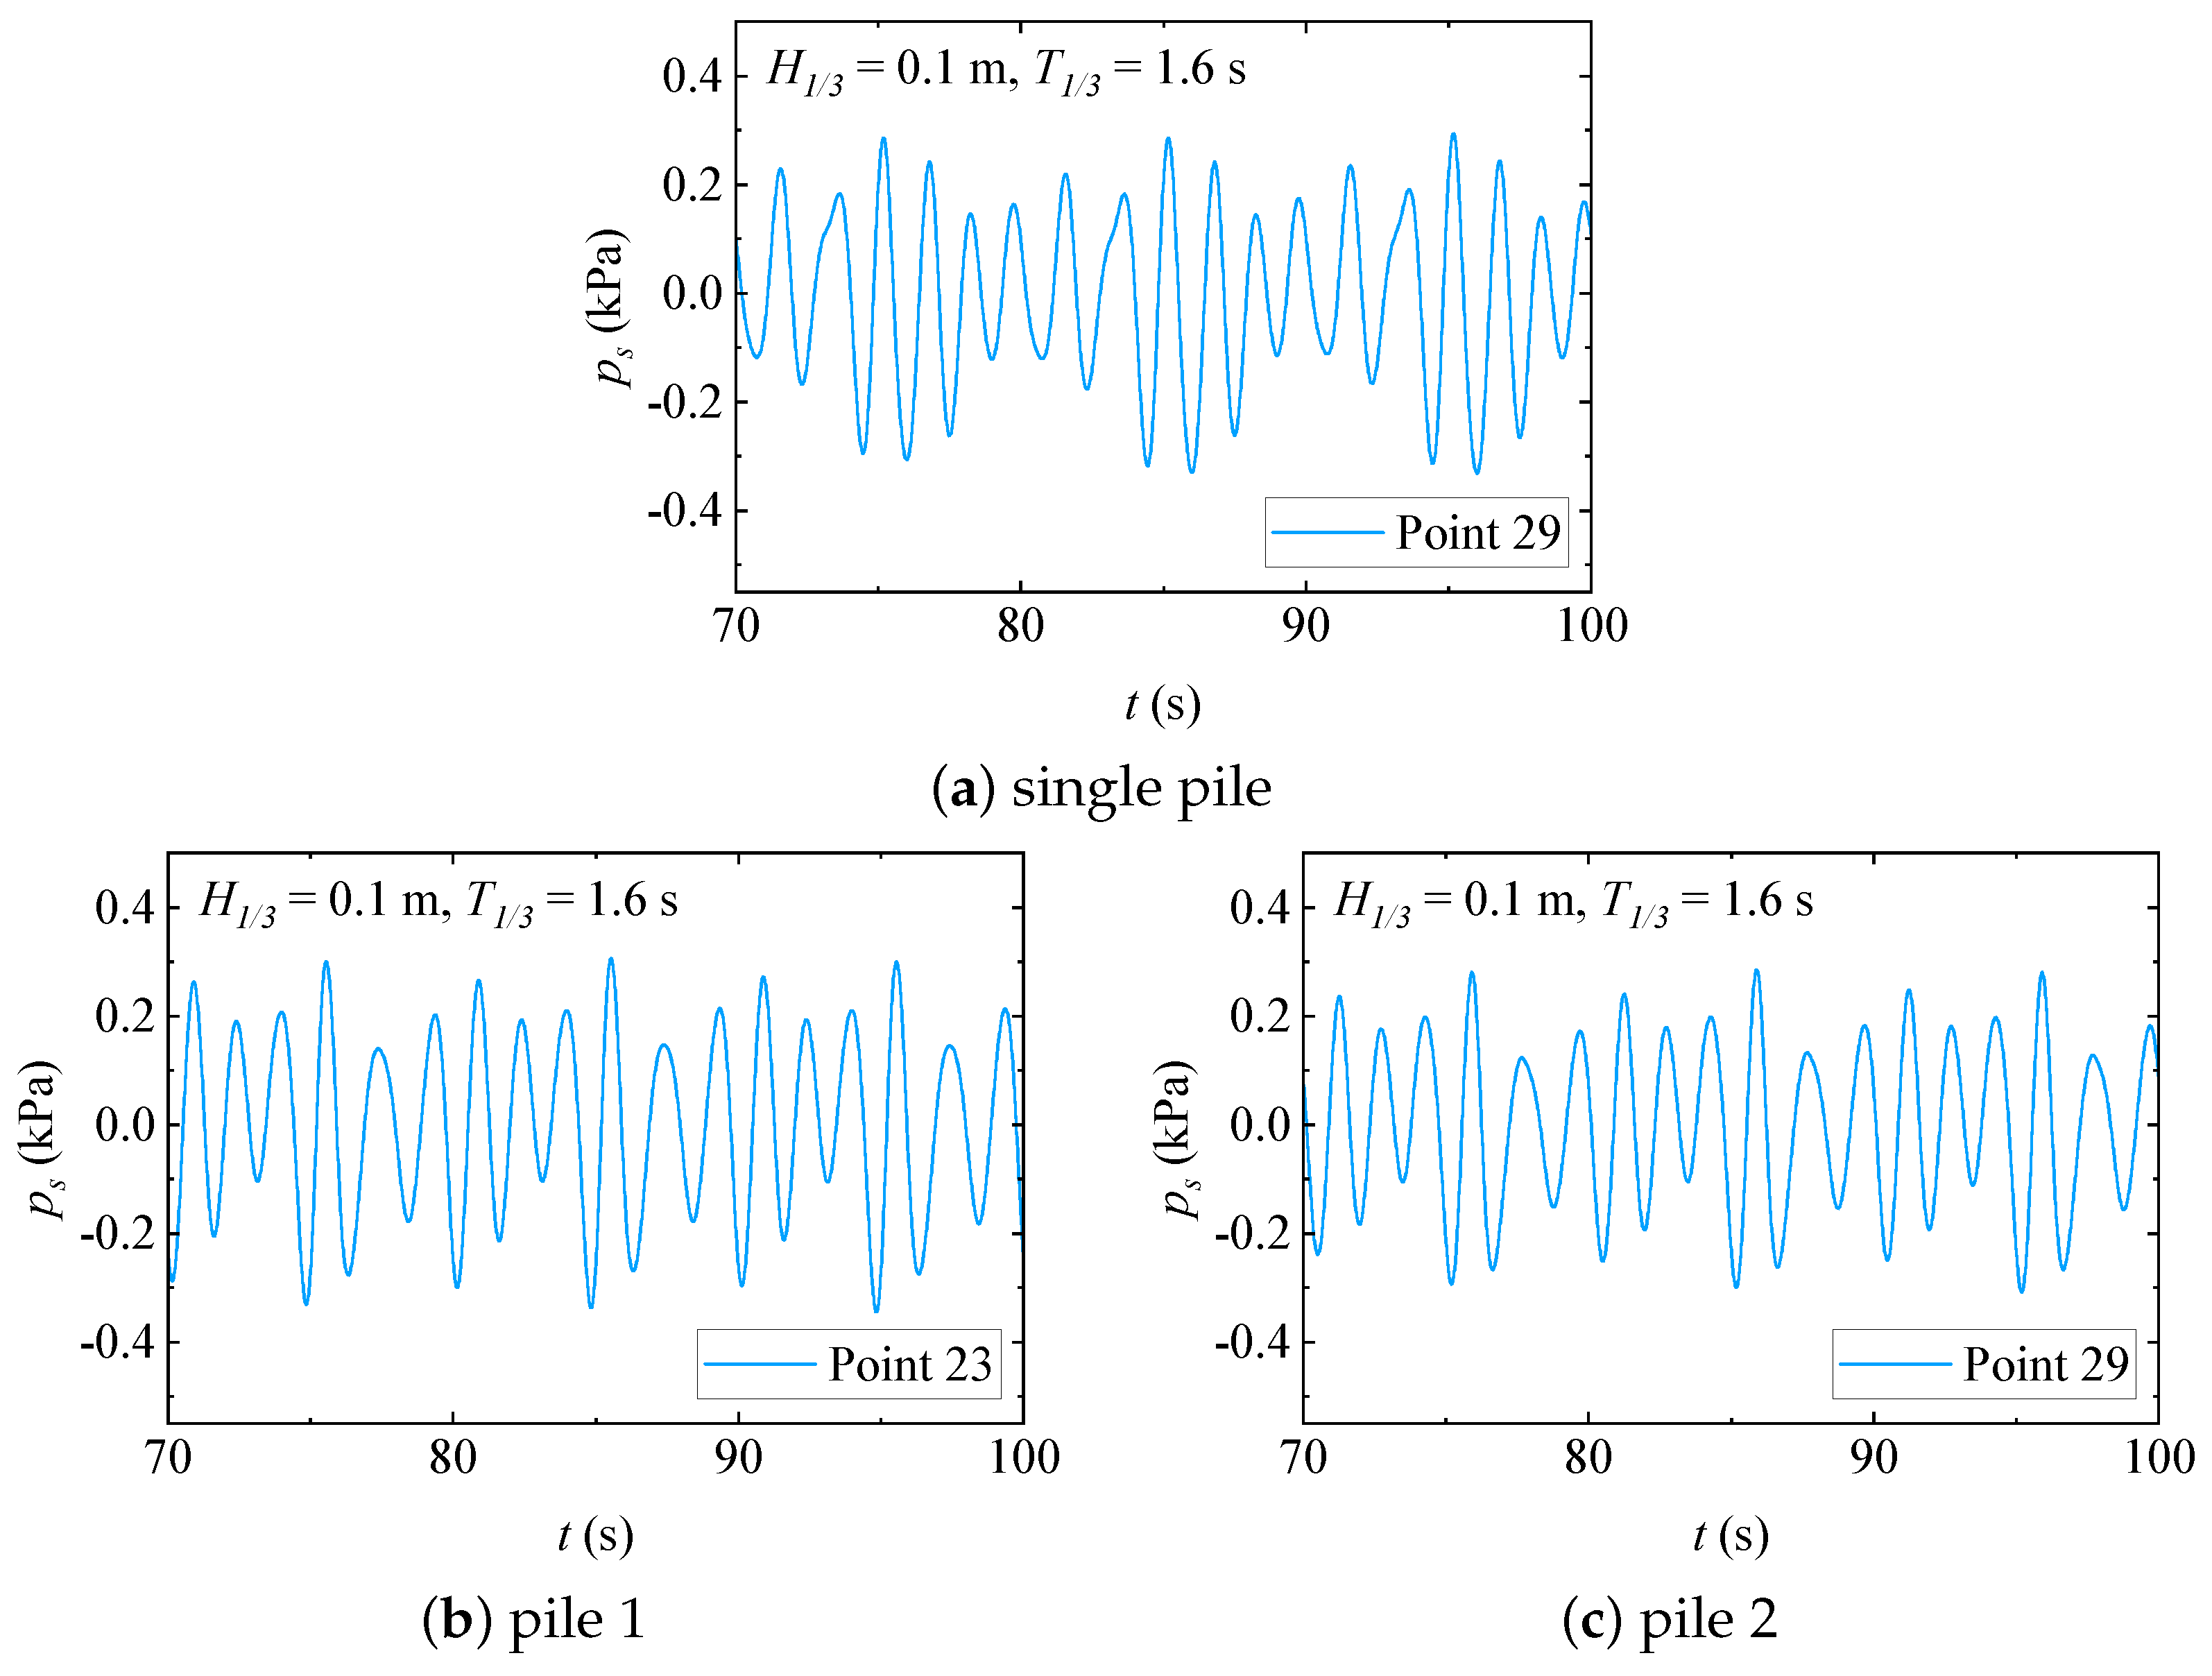
3.2. Dynamic Wave Pressures Around the Double Piles

To investigate the dynamic wave pressures around the double piles under random waves, wave pressure sensors, numbered 1 to 12, were used to measure the wave pressures at a distance of 0.15 m below the still water level at the surface of the double piles. Points 13–16 were installed at a point 0.3 m below the still water level. This provided the distribution of wave pressures along the pile’s direction. Herein, dynamic wave pressures were calculated by subtracting the total wave pressures measured by wave pressure sensors from the hydro-static pressures (that is, the unit weight times water depth).
Figure 6 illustrates the temporal variations in dynamic wave pressures along the pile direction for the front surface of the single pile and pile 2. Similarly to the free water surface, the wave pressures induced by random waves also exhibited randomness over time. As the wave energy dissipated while propagating downward along the pile, the maximum wave pressure recorded by the pressure sensors in front of the single pile and pile 2 decreased by 24.45% and 23.05%, respectively.
Figure 7 plots the spatial distributions of dynamic wave pressures on the surfaces of single and double piles at a distance of 0.15 m below the still water level under varying significant wave periods, with a dimensionless treatment applied using ( ρ g H 1 / 3 )/2, where ρ is the density of water and g is the acceleration due to gravity. Since the wave period directly affects the wave number and wavelength, the dynamic wave pressures experienced by the surfaces of the single and double piles generally increased with increasing significant wave period. The dynamic wave pressures on the surface of pile 1 were higher than that of the single pile, which resulted from the interaction between incident waves and the reflected waves from pile 2 in the wave field around pile 1.
For the tandem pile arrangement with a wave incidence angle of θ = 0 ° , the shading effect of the front pile on the rear pile resulted in the dynamic wave pressures on the surface of pile 2 being generally less than on pile 1. When the significant wave period was relatively short (for example, T 1 / 3 = 1.2 s), this shading effect was particularly pronounced, with the maximum dynamic wave pressure of pile 1 exceeding that of pile 2 by 10.08%. The tandem double piles were aligned along the center line of the flume, and similarly to a single pile, the overall structure exhibited a symmetrical distribution along the direction of the wave propagation, with approximately equal dynamic wave pressures on both the left and right sides. However, due to the obstruction caused by the structure to the propagation of the wave energy, the maximum dynamic wave pressure at the front stagnation point of the single and double piles was greater than at the rear stagnation point.
The sides of the piles were consistently affected by the interaction between the incident and reflected waves, resulting in higher wave pressures on the sides compared to the front and back, particularly at the 90° position, where the dynamic wave pressures on the pile surface reached their maximum.

4. Seabed Response Around the Double Piles under Random Wave Action

This section focuses mainly on the pore pressures induced by random waves on the seabed. The parametric analysis of the seabed response surrounding the double piles took into account the effects of the relative spacing ratio, the angle of incidence of the waves, and the diameter of the front pile. The pore pressures mentioned in this work refer to the excess pore pressures obtained after subtracting the hydro-static pressures, with the maximum peak value recorded during the measurement period defined as | p s | . It is important to note that d denotes the depth of the soil tank, while ρ g h represents the hydro-static pressure on the surface of the seabed, where h is the depth of the water in the test section.

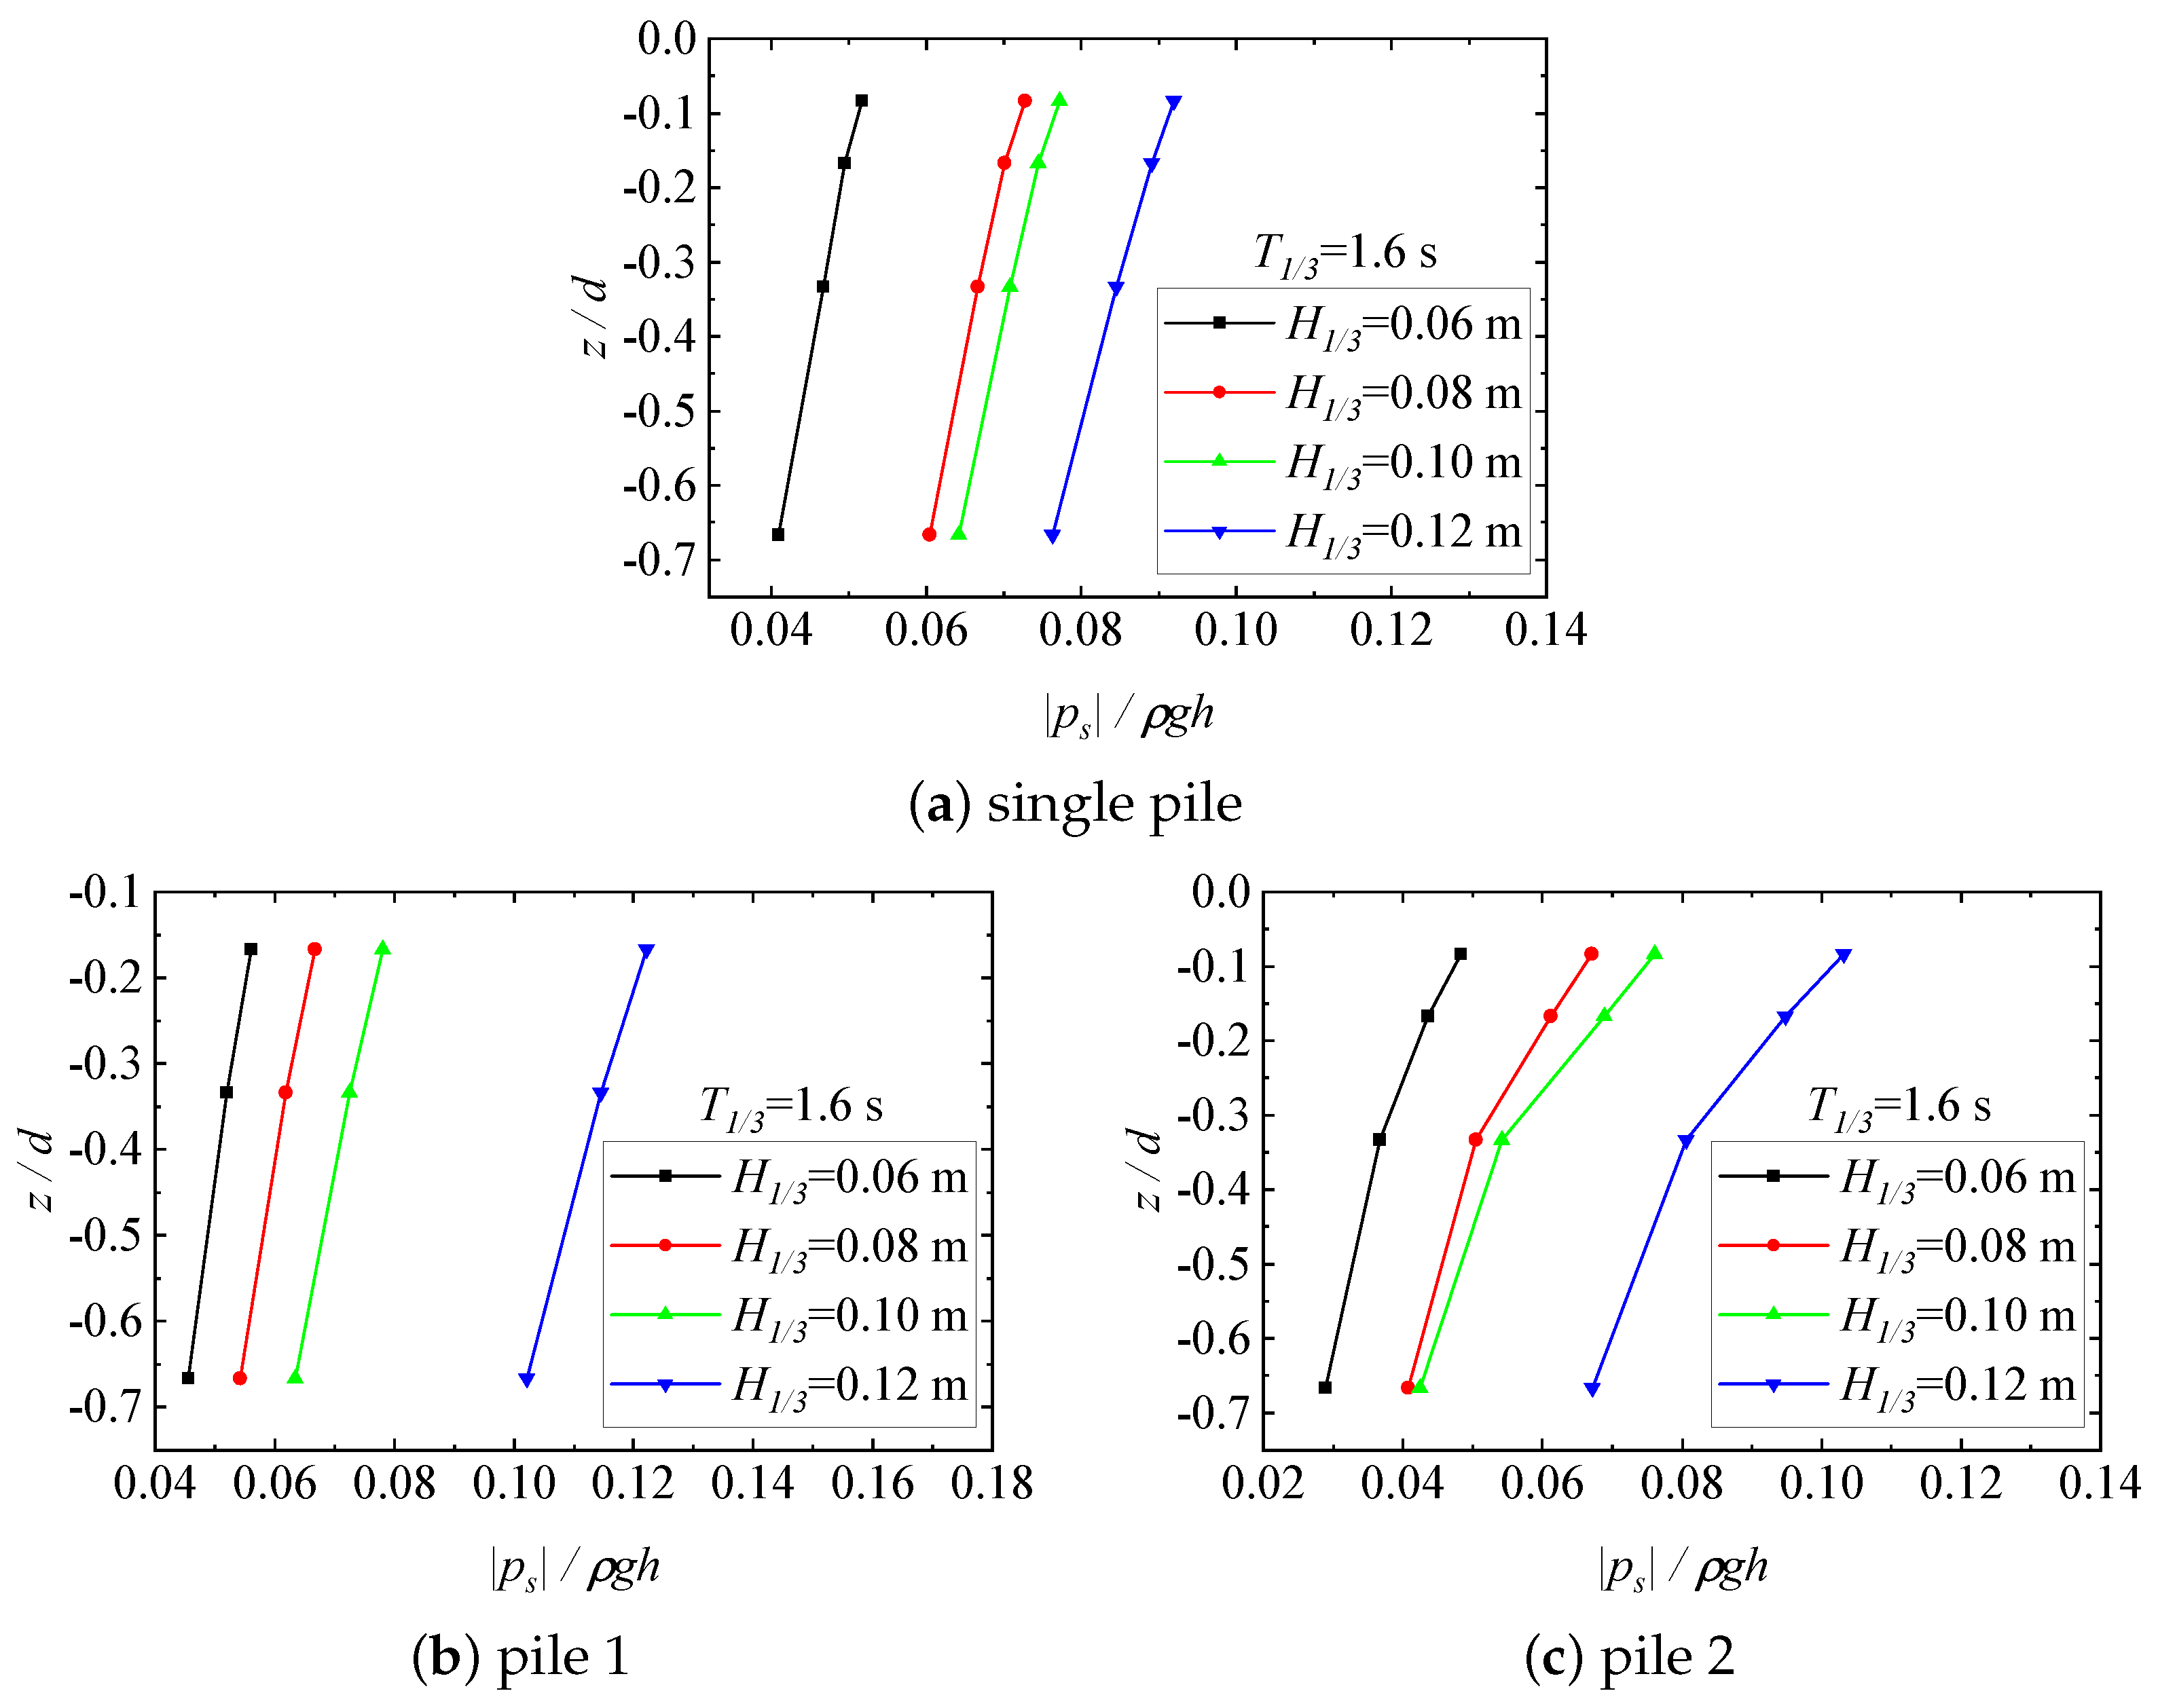
4.1. Seabed Response in Front of the Single and Double Piles

In wave fields, the interaction between double piles influences the surrounding seabed response, resulting in differences compared to a single pile. Taking the double-pile test with G / D 2 = 1 , θ = 0 , and D 1 = 0.1 m (Case B) as an example, Figure 8 illustrates the variations in pore pressures at a depth of 0.05 m below the surface of the seabed induced by random waves for single and double piles. The significant wave height H 1 / 3 was 0.1 m, and the significant wave period T 1 / 3 was 1.6 s. The measurement point for the single pile and pile 2 was located at point 29, as shown in Figure 1c ( z / d = 1 / 6 ), while the measurement point for pile 1 was at point 23 ( z / d = 1 / 6 ). Given that random waves act unpredictably on the seabed surface, the pore pressures on the surface in front of the single and double piles exhibited random fluctuations over time. The amplitude of the pore pressures in front of the single pile and pile 1 exceeded that of pile 2 by 7.60% and 11.76%, respectively. This was due to the shielding effect of the front pile on the rear pile in the tandem piles.
The influence of different random wave parameters on the pore pressure response in front of the single and double piles was further explored. Figure 9a–c depict the vertical distributions of the maximum pore pressure along the depth of the soil under various significant wave heights with T 1 / 3 = 1.6 s. During the double-pile experiment, a failure occurred midway through the pore pressure readings from the sensor positioned 0.025 m in front of pile 1, resulting in data loss. Consequently, only data from the sensor positioned below 0.05 m from the seabed surface in front of pile 1 were analyzed.
As the depth of the soil increased, the pore pressures gradually dissipated. This led to a continuous decrease in the maximum pore pressure in front of the single and double piles, with the attenuation rate decreasing in each layer along the depth of the seabed. Due to the positive correlation between the wave energy and the wave height, the amplitude of the pore pressures generated by random waves around the single and double piles continuously increased with an increase in the significant wave height. Zhang et al. [32] also observed these phenomena in the wave flume tests of partially buried single pile under the action of random waves. The interaction between the incident waves around pile 1 and the reflected waves from pile 2 in the double-pile case was more intense than that of the single-pile case, resulting in higher pore pressures on the front surface of pile 1 compared to that of the single pile. The shielding effect of the closely spaced double piles was obvious. Therefore, the maximum pore pressure on the front surface of pile 2 at different significant wave heights was consistently lower than for pile 1.
When the significant wave height was relatively large (for example, H 1 / 3 = 0.12 m), the maximum pore pressure on the front surface of pile 2, particularly near the seabed surface ( z / d 1 / 6 ), increased compared to the single pile. However, it remained lower than that of the single pile under the other three significant wave heights. This may be attributed to the more pronounced interaction between incident and reflected waves in the wave field around the double piles at higher significant wave heights, exacerbating the pore pressure response near the seabed surface around the trailing pile. In contrast, pore pressures in the deeper layers of the soil, farther from the surface of the seabed, were relatively less influenced by hydrodynamics. Consequently, the leading pile mainly shielded the trailing pile, causing the maximum pore pressure at position z / d 1 / 3 to remain lower than that of the single pile. Furthermore, the blocking effect of the leading pile resulted in a higher attenuation rate of the pore pressures with the depth of pile 2 compared to pile 1 and single pile.
Figure 10a–c further illustrate the impact of a significant wave period on the pore pressures at various depths of the seabed for the single and double piles with H 1 / 3 = 0.1 m. For different significant wave periods, the amplitudes of the pore pressure in front of the single and double piles progressively decreased with increasing seabed depth, with the rate of attenuation gradually diminishing as well. When the significant wave period increased, the wavelength elongated, which in turn increased the wave-induced pressure. Consequently, as observed in Figure 10, the pore pressures on the front surface of the single and double piles increased with increasing significant wave period. The maximum pore pressure on the front surface of pile 1 was generally greater than that of the single pile over different significant wave periods, while pile 2 typically showed lower values compared to the single pile.

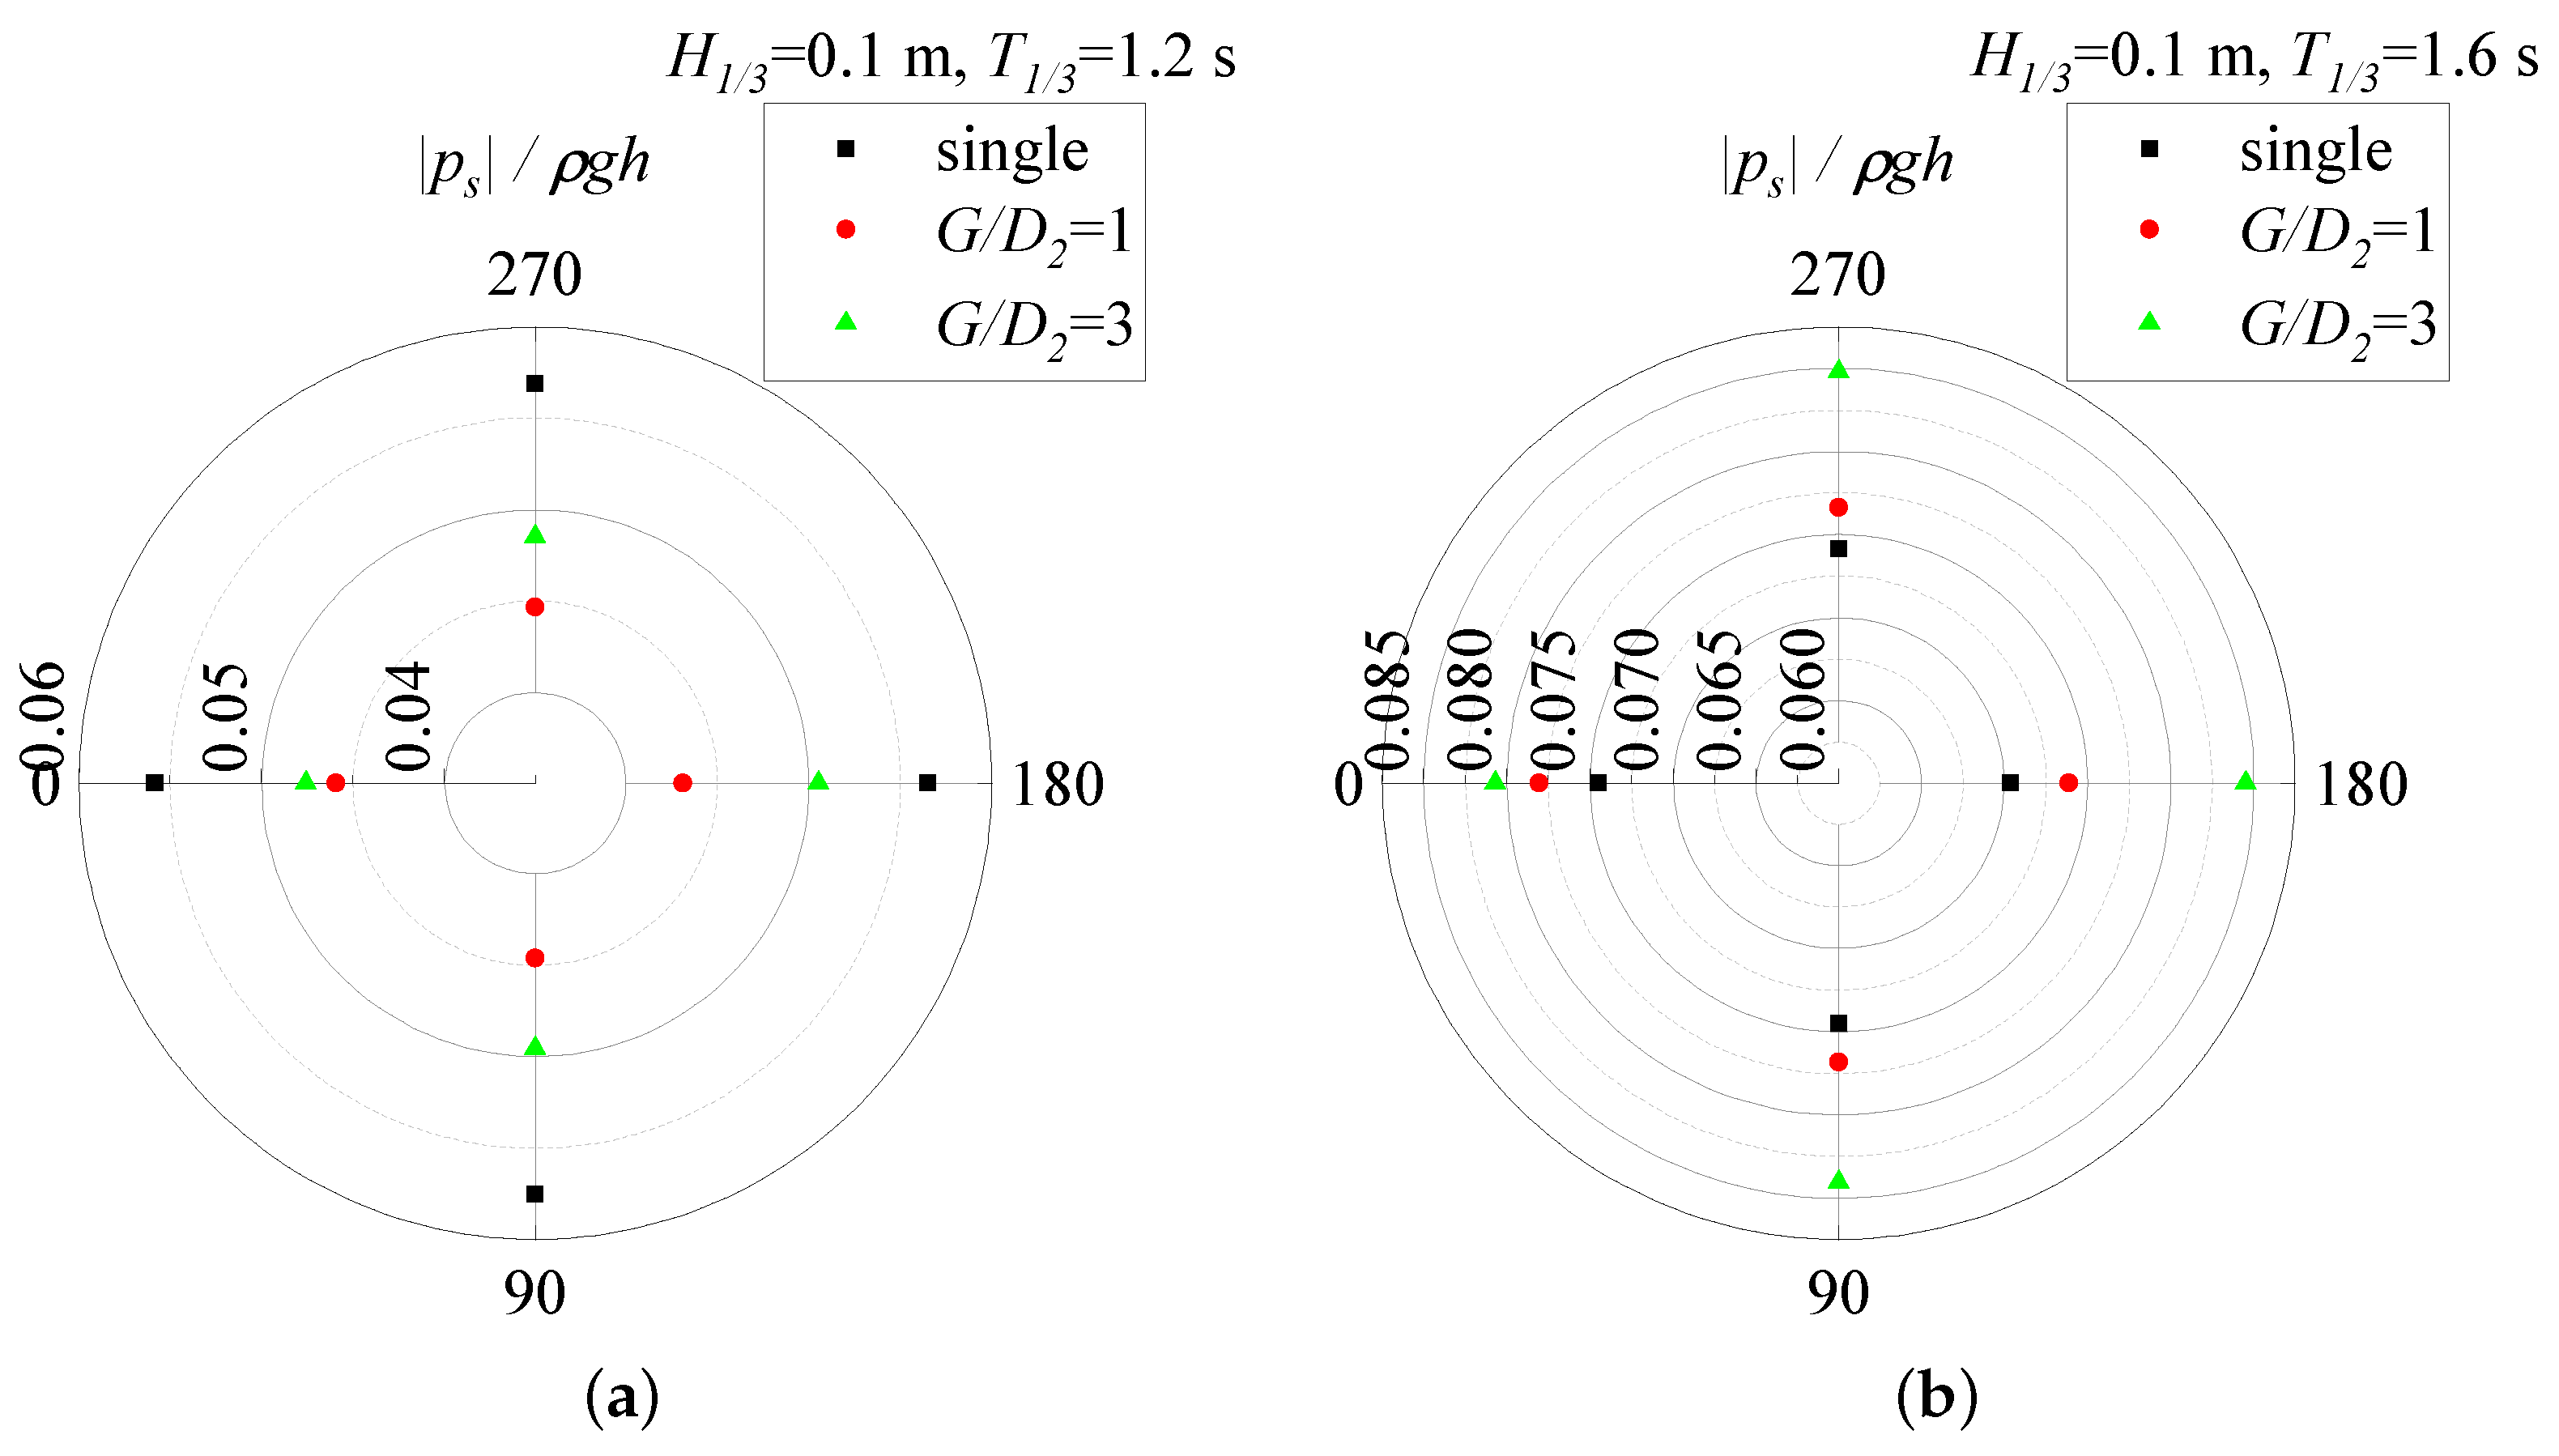
4.2. Effects of the Relative Spacing Ratios

We discuss the response of the pore pressures in the seabed surrounding the double piles due to random waves that have different relative spacing ratios, with a fixed wave incidence angle of θ = 0 ° and a front pile diameter of D 1 = 0.1 m. Figure 11a,b illustrate the vertical distributions of the maximum pore pressure in front of the double piles at different significant wave heights when the relative spacing ratio G / D 2 = 3 . As the relative spacing ratio of the double piles increased to 3, the group-pile effect correspondingly decreased, causing the double piles to gradually behave as two isolated single piles, thus weakening the suppressive influence of the front pile on the pore pressure response in the seabed around the rear pile. Consequently, from Figure 11b, it can be observed that the pore pressures in front of pile 2 were consistently higher at a relative spacing ratio of G / D 2 = 3 compared to G / D 2 = 1 . Furthermore, at this point, the shielding effect of pile 1 on pile 2 was reduced, resulting in a lower rate of decrease in pore pressures in the vertical direction for pile 2 compared to a relative spacing ratio of G / D 2 = 1 .
For cases with smaller significant wave heights, with a relative spacing ratio of G / D 2 = 3 , the maximum pore pressure in front of pile 2 approached the results of a single pile. As the significant wave height gradually increased, this peak became higher relative to that of a single pile, potentially even exceeding that of pile 1. This was attributed to the more significant interaction between the incident and reflected waves caused by the larger significant wave height. At the same time, the shielding effect of the front pile on the rear pile decreased in this relative spacing ratio.
Figure 12 and Figure 13 present the spatial distributions of the maximum pore pressure 0.05 m below the seabed around the double piles in two significant wave periods ( T 1 / 3 = 1.2 s and T 1 / 3 = 1.6 s) for the relative spacing ratios G / D 2 = 1 and G / D 2 = 3 , respectively, and compare these results with those of a single pile. According to Figure 12 and Figure 13, as the significant wave period increased, the pore pressures around the double piles in both relative spacing ratios also increased correspondingly. The angle of 0° corresponds to the maximum pore pressure at the stationary point directly facing the direction of wave propagation. Measurements of pile-side pore pressure were taken along the wave propagation direction from 0° to 180°.
For single and double piles with a relative spacing ratio of G / D 2 = 1 , the pore pressures gradually decreased from the front to the back of the pile, while the attenuation rate increased along the side of the pile. This phenomenon is closely related to the structure’s obstruction of some of the wave energy propagation. In the case of closely spaced serial double piles, the group pile effect was pronounced, leading to the pore pressures around pile 2 being lower than those around pile 1 and the single pile. However, when the relative spacing ratio increased to 3, the maximum pore pressure along pile 1’s side started to rise, whereas the peaks around pile 2 appeared at the pile’s side. This occurrence may be related to the reflection waves emanating from the rear pile. Under this relative spacing ratio, the pore pressures around the double piles tended to approach that of a single pile, particularly evident when the significant wave period was small (for example, T 1 / 3 = 1.2 s). For larger significant wave periods, the influence of the long-period reflection waves on the results gradually increased. Furthermore, given the structural symmetry of the tandem double piles in the wave field along the wave propagation direction, the maximum pore pressure on either side of the piles showed minimal variation.

4.3. Effects of the Wave Incident Angles

The incident wave angle refers to the angle between the direction of the wave propagation and the center line between the double piles. In this study, three different incident wave angles were used: θ = 0 ° , θ = 45 ° , and θ = 90 ° , with G / D 2 = 1 and D 1 = 0.1 m.
Figure 14 and Figure 15 illustrate the vertical distributions of the maximum pore pressure on the front surface of the double piles with various wave heights, with θ = 45 ° and θ = 90 ° . For both incident wave angles, the pore pressures in front of the double piles at different depths of the soil layer increased with increasing wave height, while they gradually decreased along the vertical direction. As the incident angle of the wave increased from 0° to 90°, the double piles transitioned through tandem, staggered, and parallel arrangements.
At an incident angle of 0°, the shielding effect between the tandem piles was particularly pronounced. When the angle increased to 45°, the shielding effect of the front pile on the rear pile decreased, resulting in a larger contact area between the double piles and the incoming waves, leading to a more notable mutual interference effect. Consequently, as seen in Figure 14b, the pore pressures in front of pile 2 were generally higher than that of pile 2 in the double tandem pile configuration. However, the pore pressures in front of pile 2 remained lower than those of pile 1, indicating that the shielding effect was still comparatively more obvious.
For the case where the direction of the incoming waves was perpendicular to the center line connecting the double piles, i.e., θ = 90 ° , the double piles exhibited a side-by-side arrangement, further increasing their contact area with the incoming waves, thus significantly improving the obstructive effect of the double piles on wave propagation. This phenomenon is ultimately reflected in Figure 15, which shows that the pore pressures on the front surface of the double piles were generally higher than those observed at other angles of incident waves or for a single pile. Therefore, it is evident that, compared to the shielding effect, greater emphasis should be placed on the impact of the interference effect on the dynamic response surrounding the double piles. Furthermore, since the double piles were arranged in parallel, the shielding effect of the front pile on the rear pile nearly disappeared, resulting in uniform pore pressures on the front surfaces of both piles.
To analyze the spatial distributions of the pore pressures around the double piles induced by random waves at varying wave incident angles, H 1 / 3 = 0.1 m and T 1 / 3 = 1.6 s were selected. As shown in Figure 16, the pore pressures around the double piles increased with increasing wave incident angle, highlighting the progressively significant mutual interference between the piles. For wave incident angles of θ = 0 ° and θ = 45 ° , the shielding effect of the front pile on the rear pile was more pronounced, resulting in higher pore pressures around pile 1 than around pile 2. As the incident angle increased to 45°, both shielding and interference effects were present around the double piles. This led to the pore pressures around pile 2 beginning to exceed those of the single-pile case. Therefore, a wave incident angle of θ = 45 ° can serve as the “critical angle” at which the front pile shielding effect is almost eliminated. At θ = 90 ° , the pore pressures surrounding the double piles were significantly higher than those of a single pile, with the maximum exceeding 30%. When designing and manufacturing marine pile foundation facilities, it should be possible to avoid situations where the incident waves are more significant in the direction perpendicular to the central connection line of the pile groups. This is of great significance in reducing the liquefaction potential of the seabed around the pile group structure.

4.4. Effects of the Diameters of the Front Pile

The parametric analysis of the seabed response around the double piles mentioned above did not consider variations in the pile diameter. When examining the influence of the diameter of the pile, the central connection line of the double pile was aligned parallel to the wave direction, maintaining a relative spacing of G / D 2 = 1 . The diameter of pile 1, D 1 , ranged from 0.08 m to 0.12 m, with a spacing of 0.02 m, while the diameter of pile 2 was fixed at D 2 = 0.1 m.
Figure 17 and Figure 18 illustrate the spatial distributions of the pore pressures at z = 0.05 m for various diameters of the front pile under three sets of random wave parameters. Due to the serial arrangement of the double piles, pile 2 experienced a considerable shielding effect from pile 1, resulting in lower pore pressures surrounding pile 2 compared to those around pile 1. A comparison of Figure 17a,b with Figure 18a,b reveals that the pore pressures around the double piles increased with a significant wave height for different front pile diameters. The smaller diameter of the front pile resulted in a relatively minor blocking effect on the wave propagation; in addition, the intense wave field dynamics surrounding the double piles led to higher pore pressures around pile 2 when the diameter of the front pile was D 1 = 0.08 m, compared to the single-pile setup. In contrast, when the diameters of the other two front piles were greater than or equal to the rear pile, the pore pressures around the rear pile were generally lower than those of a single pile. It should be noted that when the significant wave height increased to 0.1 m, the pore pressures surrounding pile 2 in the double-pile configuration with a front pile diameter of D 1 = 0.12 m exceeded that of a single pile, even exceeding the values observed with a front pile diameter of D 1 = 0.08 m. This phenomenon was attributed to the substantial obstruction of wave propagation by the larger diameter front pile, causing an obvious elevation in the overall wave surface around the double piles.
Figure 17b,c and Figure 18b,c discuss the effects of two significant wave periods on the pore pressures around double piles with various pile diameters. A larger significant wave period corresponds to a larger wavelength. Therefore, the pore pressures around the double piles were higher at T 1 / 3 = 1.6 s than at T 1 / 3 = 1.2 s. When changing the significant wave period, the significant wave height was large ( H 1 / 3 = 0.1 m). At this point, the larger diameter of the front pile exacerbated the pore pressures on the seabed as a result of the increase in the wave surface around the double piles. Consequently, the pore pressures around the double piles with a front pile diameter of D 1 = 0.12 m were consistently higher than the results for the other two front pile diameters. However, the pore pressures around the double piles with a front pile diameter of D 1 = 0.1 m were less than those with a front pile diameter of D 1 = 0.08 m. This phenomenon indicated that the increase in wave surface caused by this diameter of the front pile had a less obvious promoting effect on pore pressures than the suppressive effect of the shielding effect.

5. Conclusions

In this study, random wave-induced pore pressures in the vicinity of the double-pile system with different configurations were examined using wave flume tests. Based on the statistical analysis of the experimental results, the following conclusions are drawn.
  • Under the action of random waves, the wave profiles around the double piles displayed irregularity, and the nonlinearity was significant. There was a phase difference in the wave profile around the double piles compared to the single pile. The blocking effect of the structure on the wave propagation caused the wave surface in front of pile 2 to be higher than that behind it.
  • The wave pressures around the surface of the tandem piles increased with the significant wave period. When T 1 / 3 = 1.2 s, the obvious shielding effect caused the dynamic wave pressures around pile 2 to be smaller than that for pile 1 and a single pile. As the significant wave period increased, the impact of the long-period reflected waves gradually became larger.
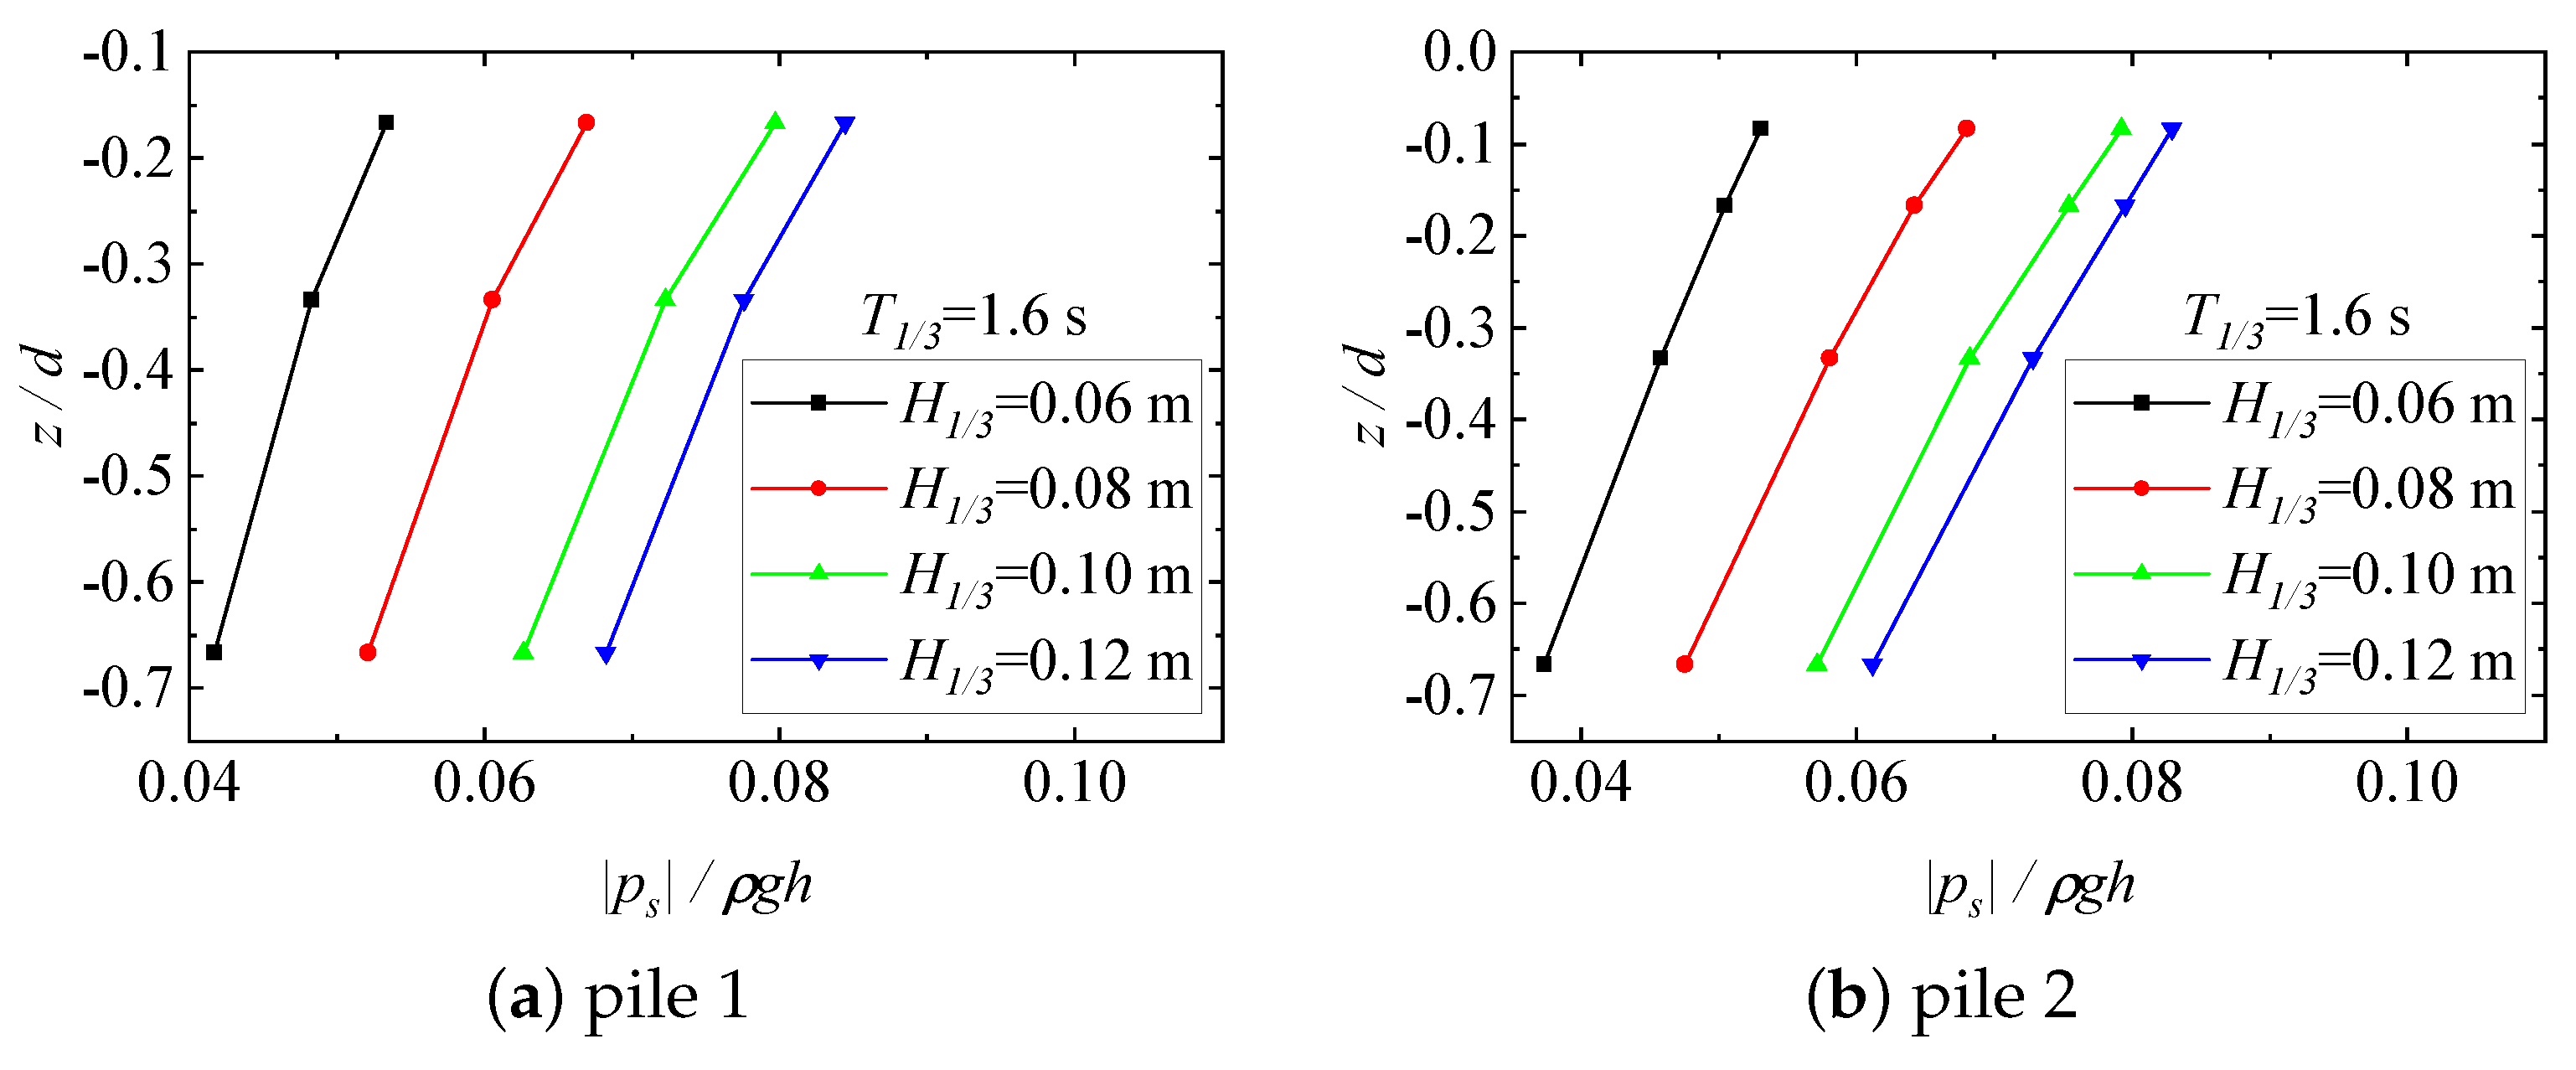
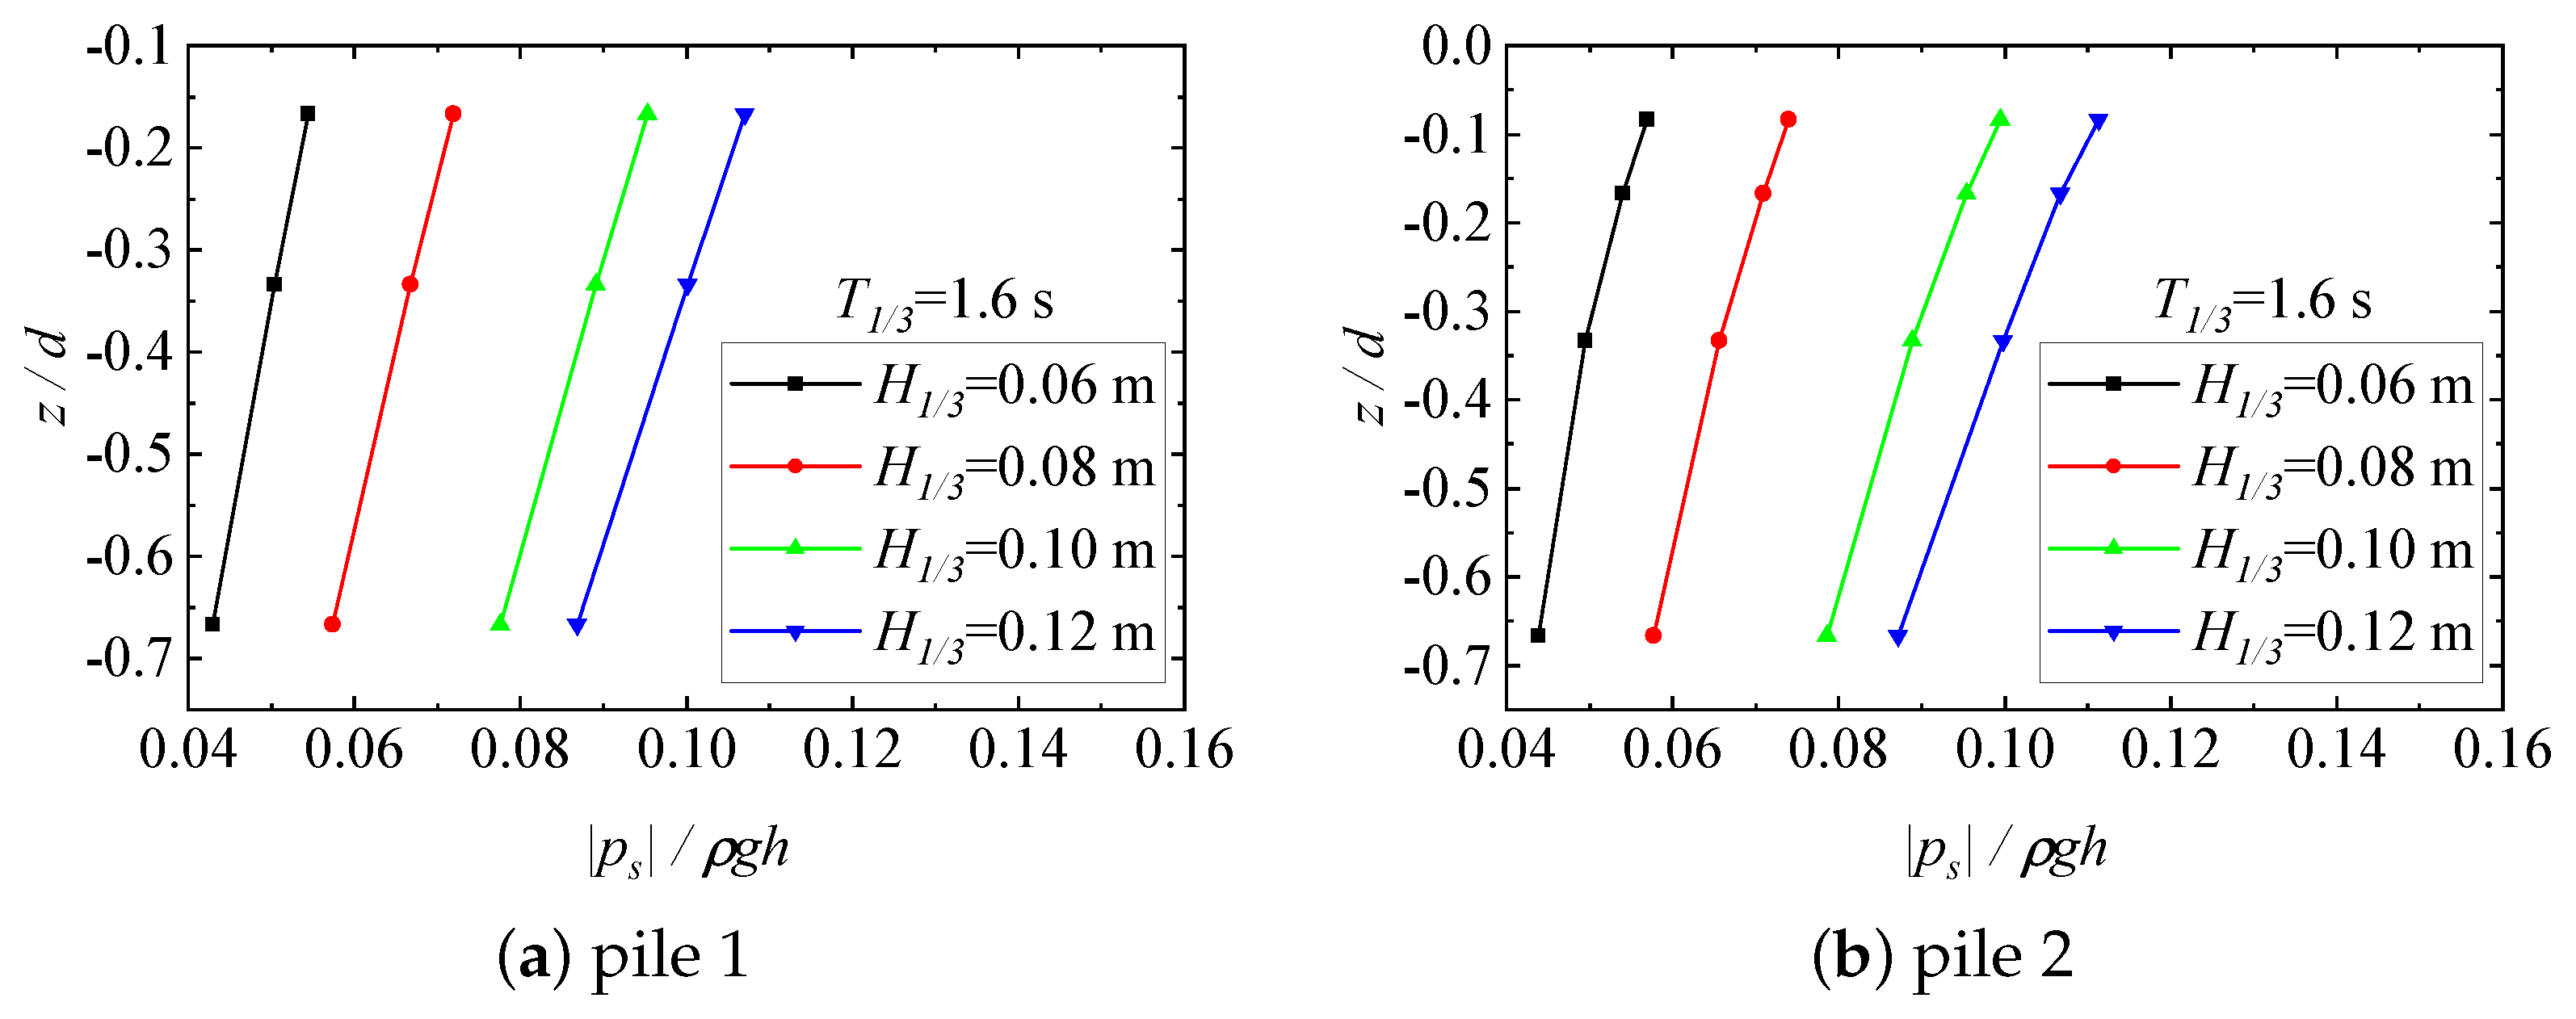
  • The pore pressures at the front surface of the double piles decreased continuously as the soil layer depth increased, and those attenuation rates also decreased layer by layer. As the significant wave height or period increased, the pore pressures in front of the double piles also increased.
  • When G / D 2 = 3 , the group-pile effect decreased, and the pore pressures around pile 2 gradually approached that of a single pile. As the significant wave height or period increased, the strong wave field around the double piles and the influence of long-period reflected waves caused them to increase relative to those of a single pile.
  • As the angle of wave incidence increased to 90°, the overall contact area between the double piles and the waves increased in the direction of the incoming waves. The mutual interference between the double piles also intensified, resulting in significantly higher pore pressures around them compared to the single pile and other wave incident angles.
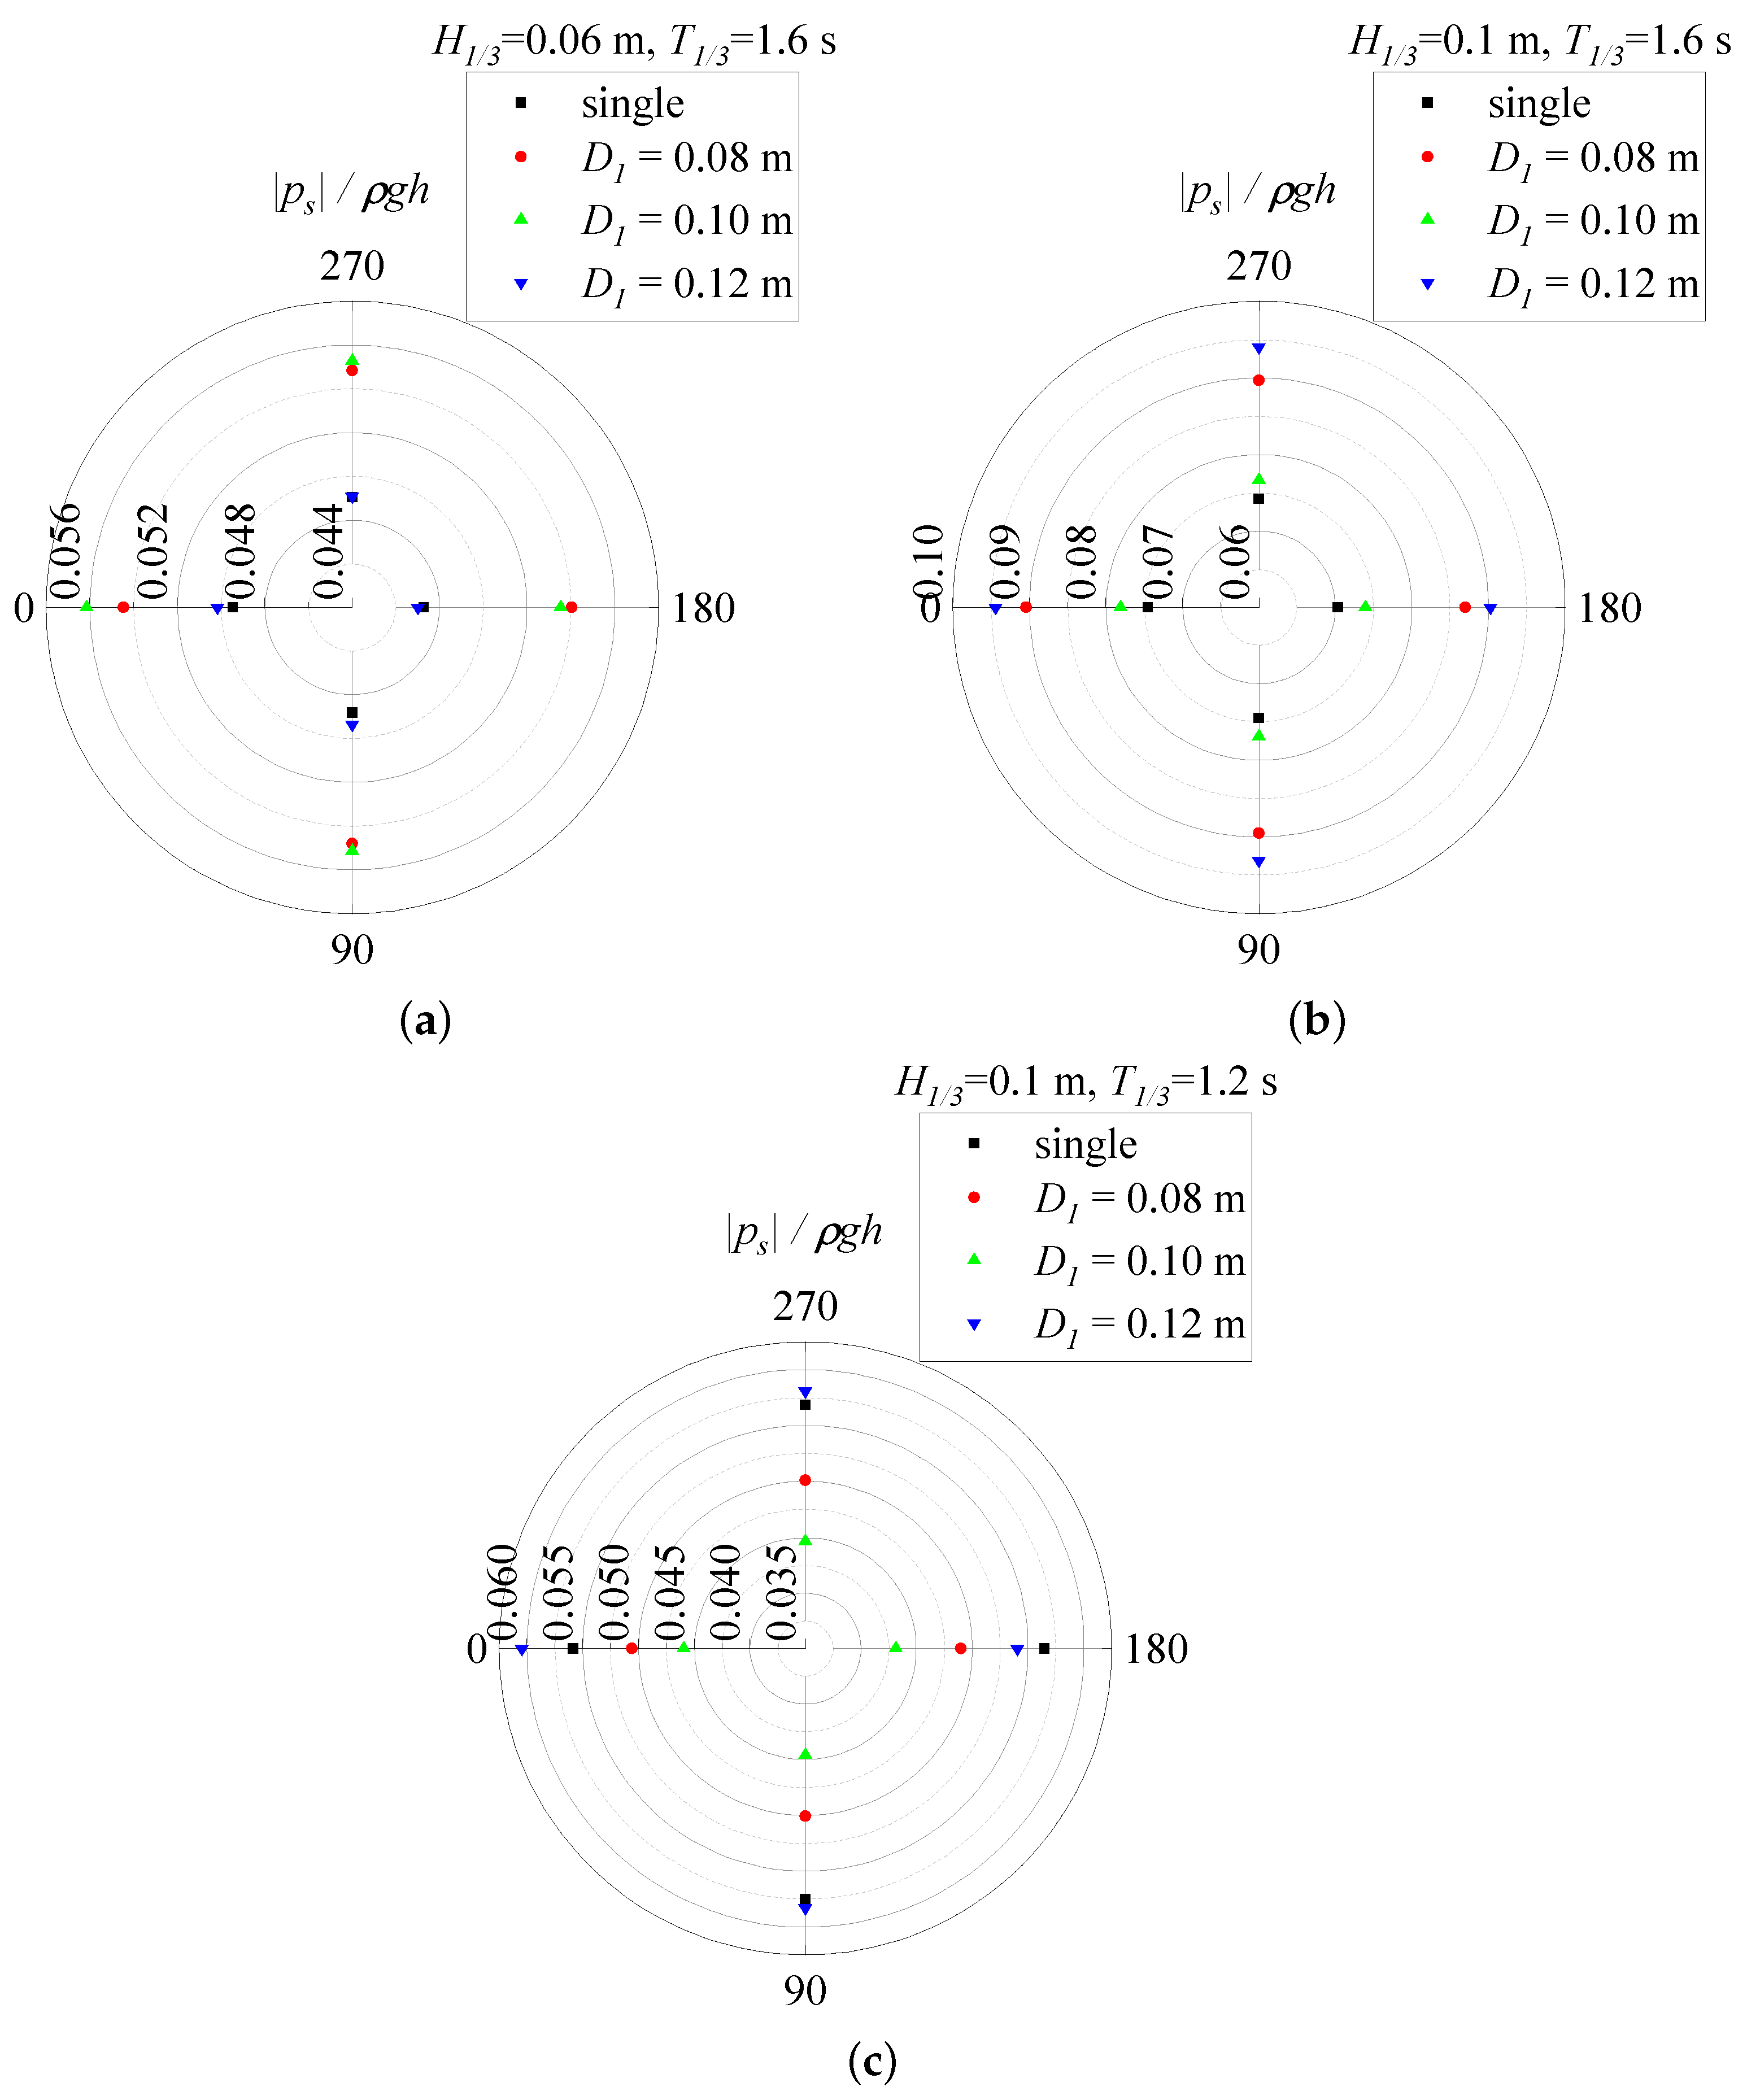
  • On the one hand, a larger diameter of the front pile suppressed the pore pressure response in the seabed around the rear pile. This was evident when the significant wave height was small. On the other hand, as the significant wave height increased, the wave rise caused by the large diameter of the front pile had a more pronounced impact on the seabed response than the shielding effect.
  • When designing more complex marine structures, the diameter of the pile foundation should be considered to be consistent. In addition, the spacing between pile groups should be considered to be less than three times the diameter of the piles. Furthermore, it should be avoided as much as possible that the central connection line of the pile group was perpendicular to the direction of significant incident wave propagation.
In this study, only double piles were considered in the wave experiments. It is necessary to conduct wave experiments for a group of piles such as four piles as foundation of a platform. Furthermore, only wave-induced pore pressures around double piles were measured, it is necessary to further investigate the relationship between local scour and pore pressures around piles, which have not been available in the literature. In addition, this paper only focused on physical modeling rather than numerical simulation. For numerical simulation, the existing coupling model (FSSI-CAS) proposed by Ye et al. [11] could be adopted for the present cases in the future. Numerical simulation can be used to further investigate the effects of different seabed parameters or random wave spectra on the seabed response and liquefaction potential around pile group structures. In the real marine environment, waves and currents co-exist, and the influence of currents cannot be ignored.

Author Contributions

Conceptualization, D.-S.J. and L.C.; methodology, K.S., B.C. and L.C.; validation, M.W.; formal analysis, M.W., W.S. and Y.G.; investigation, M.W., W.S. and Y.G.; resources, D.-S.J., K.S., B.C. and H.Z.; data curation, M.W., W.S. and Y.G.; writing—original draft preparation, M.W.; writing—review and editing, D.-S.J., L.C., K.S., B.C. and H.Z.; visualization, M.W.; supervision, D.-S.J. and L.C.; project administration, D.-S.J.; funding acquisition, D.-S.J. All authors have read and agreed to the published version of the manuscript.

Funding

This research was jointly supported by the National Natural Science Foundation of China (Grant No: 52271281) and the Shandong Provincial High-Level Talent Workstation.

Institutional Review Board Statement

Not applicable.

Informed Consent Statement

Not applicable.

Data Availability Statement

The experimental data are available upon request to the corresponding author.

Conflicts of Interest

The authors declare no conflicts of interest.

References

  1. Lan, Y.M.; Liu, H.; Huang, P.X.; Xue, L.P.; Chen, G. Experimental studies on hydrodynamic loads on piles and slab of Donghai Bridge, Part II: Hydrodynamic forces on pile array and slab in wave-current combinations. Chin. J. Hydrodyn. 2004, 20, 332–339. (In Chinese) [Google Scholar] [CrossRef]
  2. Lin, Y.F.; Li, J.Y.; Shen, D.; Song, C. Structure characteristics and design technique keys of wind turbine foundation in Shanghai Donghai bridge offshore wind farm. Shanghai Electron. Power 2007, 2, 153–157. [Google Scholar]
  3. Liu, S.X.; Li, Y.C.; Li, G.W. Wave current forces on the pile group of base foundation for the east Sea bridge, China. J. Hydrodyn. 2007, 19, 661–670. [Google Scholar] [CrossRef]
  4. Xiao, Z.; Song, L.; Li, J. Stability of the large cylindrical structures in Hong Kong–Zhuhai–Macao bridge: A case study. Appl. Ocean. Res. 2020, 97, 102092. [Google Scholar] [CrossRef]
  5. Sumer, B.M.; Hatipoglu, F.; Fredsoe, J.; Hansen, N.K.O. Critical flotation density of pipelines in soils liquefied by waves and density of liquefied soils. J. Waterw. Port Coastal Ocean. Eng. Asce 2006, 132, 252–265. [Google Scholar] [CrossRef]
  6. Sumer, B.M. Liquefaction around Marine Structures; World Scientific: Hackensack, NJ, USA, 2014. [Google Scholar] [CrossRef]
  7. Jeng, D.S. Mechanics of Wave-Seabed-Structure Interactions: Modelling, Processes and Applications; Cambridge University Press: Cambridge, UK, 2018. [Google Scholar] [CrossRef]
  8. Diaz-Carrasco, P.; Croquer, S.; Tamimi, V.; Lacey, J.; Poncet, S. Advances n numerical Reynolds-Average Navier STokes modelling of wave-structure-seabed interactions and scour. J. Mar. Sci. Eng. 2021, 9, 611. [Google Scholar] [CrossRef]
  9. Li, X.; Gao, F.; Yang, B.; Zang, J. Wave-induced pore pressure response and soil liquefaction around pile foundation. Int. J. Offshore Polar Eng. 2011, 21, 233–239. [Google Scholar]
  10. Kirca, V.S.O.; Sumer, B.M.; Fredsøe, J. Influence of clay content on wave-induced liquefaction. J. Waterw. Port Coast. Ocean. Eng. Asce 2014, 140, 04014024. [Google Scholar] [CrossRef]
  11. Ye, J.; Zhou, H.; He, K. A generalized framework of two-way coupled numerical model for fluid–structure-seabed interaction (FSSI): Explicit algorithm. Eng. Geol. 2024, 340, 107679. [Google Scholar] [CrossRef]
  12. Nago, H.; Maeno, S.; Matsumoto, T.; Hachiman, Y. Liquefaction and densification of loosely deposited sand bed under water pressure variation. In Proceedings of the 3rd International Offshore and Polar Engineering Conference (ISOPE1993), Singapore, 6–11 June 1993; Volume I, pp. 578–584. [Google Scholar]
  13. Zen, K.; Yamazaki, H. Mechanism of wave-induced liquefaction and densification in seabed. Soils Found. 1990, 30, 90–104. [Google Scholar] [CrossRef]
  14. Sumer, B.M.; Fredsøe, J. The Mechanics of Scour in the Marine Environment; World Scientific: London, UK, 2002. [Google Scholar] [CrossRef]
  15. Wan, Z.P.; Cui, L.; Jeng, D.S. Mechanisms of seabed response under combined wave and current loading: Partially dynamic (u-p) coupling model. Ocean. Eng. 2024, 310, 118721. [Google Scholar] [CrossRef]
  16. Li, M.; Zhang, H.; Guan, H.; Lin, G. Three-dimensional investigations of wave-pile group interaction using the scaled boundary finite element method. Part I: Theoreal developments. Ocean. Eng. 2013, 64, 174–184. [Google Scholar] [CrossRef]
  17. Li, M.; Guan, H.; Zhang, H.; Liu, J. Three-dimensional investigations of wave-pile group interaction using the scaled boundary finite element method. Part II: Application results. Ocean. Eng. 2013, 64, 185–195. [Google Scholar] [CrossRef]
  18. Qi, W.G.; Gao, F.P. Physical modeling of local scour development around a large-diameter monopile in combined waves and current. Coast. Eng. 2014, 83, 72–81. [Google Scholar] [CrossRef]
  19. Lin, J.; Zhang, J.S.; Sun, K.; Wei, X.L.; Guo, Y.K. Numerical analysis of seabed dynamic response in vicinity of mono-pile under wave-current loading. Water Sci. Eng. 2020, 13, 74–82. [Google Scholar] [CrossRef]
  20. Zhang, Q.; Zhou, X.L.; Wang, J.H.; Guo, J.J. Wave-induced seabed response around an offshore pile foundation platform. Ocean. Eng. 2017, 130, 567–582. [Google Scholar] [CrossRef]
  21. Lin, Z.; Dubravka, P.; Guo, Y.; Liao, C.; Tang, T. Near-trapping effect of wave-cylinders interaction on pore water pressure and liquefaction around a cylinder array. Ocean. Eng. 2020, 218, 108947. [Google Scholar] [CrossRef]
  22. Asumadu, R.; Zhang, J.; Osei-Wusuansa, H. 3-D numerical study of offshore tripod wind turbine pile foundation on wave-induced seabed response. Ocean. Eng. 2022, 255, 111421. [Google Scholar] [CrossRef]
  23. Goda, Y. Random Seas and Design of Marine Structures; World Scientific Press: London, UK, 2000. [Google Scholar]
  24. Hasselmann, K.; Barnett, T.P.; Bouws, E.; Carlson, H.; Cartwright, D.E.; Enke, K.; Ewing, J.A.; Gienapp, H.; Hasselmann, D.E.; Kruseman, P.; et al. Measurements of Wind-Wave Growth and Swell Decay during the Joint North Sea Wave Project (JONSWAP). Technical Report 8. In Erganzungsheft zur Deutschen Hydrographischen Zeitschrift Reihe A; MPG Publisher: Carmichael, CA, USA, 1973. [Google Scholar]
  25. Huang, N.; Long, S.; Tung, C.; Yuen, Y.; Bliven, L. A unified two-parameter wave spectral model for a general sea state. J. Fluid Mech. 1981, 112, 203–224. [Google Scholar] [CrossRef]
  26. Wen, S.C.; Zhang, D.C.; Cheng, B.H.; Guo, P.F. Theoretical wind wave frequency spectra in deep water. I. Form of spectrum. Acta Oceanol. Sinca 1998, 7, 1–16. [Google Scholar]
  27. Liu, H.; Jeng, D.S. A semi-analytical solution for random wave-induced soil response and seabed liquefaction in marine sediments. Ocean. Eng. 2007, 34, 1211–1224. [Google Scholar] [CrossRef]
  28. Xu, H.X.; Dong, P. A probabilistic analysis of random wave-induced liquefaction. Ocean. Eng. 2011, 38, 860–867. [Google Scholar] [CrossRef]
  29. Yu, J.H.; Gao, F.P.; Li, C.F. Response spectra for transient pore-pressure in a sandy seabed under random waves: Frequency-filtering effect. Ocean. Eng. 2023, 279, 114490. [Google Scholar] [CrossRef]
  30. Sumer, B.M.; Cheng, N.S. A random-walk model for pore pressure accumulation in marine soils. In Proceedings of the 9th International Offshore and Polar Engineering Conference (ISOPE99), Brest, France, 30 May–4 June 1999; Volume 1, pp. 521–528. [Google Scholar]
  31. Zhou, X.L.; Zhang, J.; Lv, H.J.; Chen, J.J.; Wang, J.H. Numerical analysis on random wave-induced porous seabed response. Mar. Georesour. Geotechnol. 2018, 36, 974–985. [Google Scholar] [CrossRef]
  32. Zhang, Q.; Zhai, H.; Wang, P.; Wang, S.; Duan, L.; Chen, L.; Liu, Y.; Jeng, D.S. Experimental study on irregular wave-induced pore-water pressures in a porous seabed around a mono-pile. Appl. Ocean. Res. 2020, 95, 102041. [Google Scholar] [CrossRef]
Figure 1. Schematic diagram of the experimental setup: (a) the side view of the wave flume; (b) plane view of wave flume and locations of wave gauges; and (c) location of wave pressure sensors and pore pressure sensors.
Jmse 12 01715 g001
Figure 2. Arrangement schemes for the single-pile case (Case A) and the double-pile cases that include double piles with various spacing (Case B and Case C), different pile diameters (Case D and Case E), staggered piles (Case F), and side-by-side piles (Case G).
Jmse 12 01715 g002
Figure 3. Photos of the experimental sites: (a) single pile (Case A); (b) double piles with G / D 2 = 1 , θ = 0 , D 1 = 0.1 m (Case B); (c) double piles with G / D 2 = 1 , θ = 0 , D 1 = 0.12 m (Case E); (d) double piles with G / D 2 = 1 , θ = 90 , D 1 = 0.1 m (Case G).
Jmse 12 01715 g003
Figure 4. The grain size distribution of the soil sample: d 50 = 0.2037 mm, d 10 = 0.1564 mm, d 30 = 0.1811 mm, d 60 = 0.2119 mm, c u = 1.3553 , and c c = 0.9893 .
Jmse 12 01715 g004
Figure 5. Wave profiles at a distance of 0.05 m around the single and double piles under the action of random waves: (a) G2 (single and double piles); (b) G3 (single and double piles); (c) G4 (single and double piles). ( H 1 / 3 = 0.1 m, T 1 / 3 = 1.6 s.)
Jmse 12 01715 g005
Figure 6. Time history of the dynamic wave pressures on the front surface of single pile and pile 2: (a,c) single pile (Case A); (b,d) pile 2 in the double piles (Case B). ( H 1 / 3 = 0.1 m, T 1 / 3 = 1.6 s). (a) P7 (single pile), (b) P7 (pile 2), (c) P15 (single pile), (d) P15 (pile 2).
Jmse 12 01715 g006
Figure 7. Spatial distributions of the dynamic wave pressures on the surface of the single and double piles caused by random waves under different significant wave periods: (a) single pile (Case A); (b) pile 1 in double piles (Case B); (c) pile 2 in double piles (Case B). ( H 1 / 3 = 0.1 m, T 1 / 3 = 1.6 s. Pile 1: x = 0.25 0.15 m, z / h = 2 / 3 , points 1–6. Pile 2 and single pile: x = 0.05 m 0.05 m, z / h = 2 / 3 , points 7–12.)
Jmse 12 01715 g007
Figure 8. Time history of the pore pressures at a distance of 0.05 m below the seabed surface in front of the single and double piles under random wave action: (a) single pile (Case A); (b) pile 1 in double piles (Case B); (c) pile 2 in double piles (Case B). ( H 1 / 3 = 0.1 m, T 1 / 3 = 1.6 s. Pile 1: x = 0.25 m, z / d = 1 / 6 , point 23. Pile 2 and single pile: x = 0.05 m, z / d = 1 / 6 , point 29.)
Jmse 12 01715 g008
Figure 9. Vertical distributions of the maximum pore pressure caused by random waves on the front surface of the single and double piles as a function of the significant wave height: (a) single pile (Case A); (b) pile 1 in double piles (Case B); (c) pile 2 in double piles (Case B). ( T 1 / 3 = 1.6 s. Pile 1: x = 0.25 m, points 23, 39, and 47. Pile 2 and single pile: x = 0.05 m, points 20, 29, 43, and 50.)
Jmse 12 01715 g009
Figure 10. Vertical distributions of the maximum pore pressure caused by random waves on the front surface of the single and double piles as a function of the significant wave period: (a) single pile (Case A); (b) pile 1 in double piles (Case B); (c) pile 2 in double piles (Case B). ( H 1 / 3 = 0.1 m. Pile 1: x = 0.25 m, points 23, 39, and 47. Pile 2 and single pile: x = 0.05 m, points 20, 29, 43, and 50.)
Jmse 12 01715 g010
Figure 11. Vertical distributions of the maximum pore pressure caused by random waves on the front surface of the double piles with respect to the significant wave height when G / D 2 = 3 : (a) pile 1 in double piles (Case C); (b) pile 2 in double piles (Case C). ( T 1 / 3 = 1.6 s. Pile 1: x = 0.25 m, points 23, 39, and 47. Pile 2: x = 0.05 m, points 20, 29, 43, and 50.)
Jmse 12 01715 g011
Figure 12. Spatial distributions of the maximum pore pressure around pile 1 at a distance of 0.05 m below the seabed surface under two significant wave periods of G / D 2 = 1 (Case B) and G / D 2 = 3 (Case C). These are compared with a single pile (Case A): (a) T 1 / 3 = 1.2 s; (b) T 1 / 3 = 1.6 s. ( H 1 / 3 = 0.1 m, z / d = 1 / 6 . Pile 1: x = 0.25 0.15 m, points 23, 25, 27, and 28. Single pile: x = 0.05 0.05 m, points 29, 31, 33, and 34.
Jmse 12 01715 g012
Figure 13. Spatial distributions of the maximum pore pressure around pile 2 at a distance of 0.05 m below the seabed surface under two significant wave periods of G / D 2 = 1 (Case B) and G / D 2 = 3 (Case C). These are compared with a single pile (Case A): (a) T 1 / 3 = 1.2 s; (b) T 1 / 3 = 1.6 s. ( H 1 / 3 = 0.1 m, z / d = 1 / 6 . Pile 2 and single pile: x = 0.05 0.05 m, points 29, 31, 33, and 34.
Jmse 12 01715 g013
Figure 14. Vertical distributions of the maximum pore pressure caused by random waves on the front surface of the double piles at an incident angle of θ = 45 as a function of the significant wave height: (a) pile 1 in double piles (Case F); (b) pile 2 in double piles (Case F). ( T 1 / 3 = 1.6 s. Pile 1: x = 0.25 m, points 23, 39, and 47. Pile 2: x = 0.05 m, points 20, 29, 43, and 50.)
Jmse 12 01715 g014
Figure 15. Vertical distributions of the maximum pore pressure caused by random waves on the front surface of the double piles at an incident angle of θ = 90 as a function of the significant wave height: (a) pile 1 in double piles (Case G); (b) pile 2 in double piles (Case G). ( T 1 / 3 = 1.6 s. Pile 1: x = 0.25 m, points 23, 39, and 47. Pile 2: x = 0.05 m, points 20, 29, 43, and 50.)
Jmse 12 01715 g015
Figure 16. Spatial distributions of the maximum pore pressure around double piles at a distance of 0.05 m below the seabed surface under three wave incidence angles of θ = 0 (Case B), θ = 45 (Case F), and θ = 90 (Case G). These are compared with a single pile (Case A): (a) pile 1; (b) pile 2. ( H 1 / 3 = 0.1 m, T 1 / 3 = 1.6 s, z / d = 1 / 6 . Pile 1: x = 0.25 0.15 m, points 23, 25, 27, and 28. Pile 2 and single pile: x = 0.05 0.05 m, points 29, 31, 33, and 34.)
Jmse 12 01715 g016
Figure 17. Spatial distributions of the maximum pore pressure around pile 1 at a distance of 0.05 m below the seabed surface under three front pile diameters of D 1 = 0.08 m (Case D), D 1 = 0.1 m (Case B), and D 1 = 0.12 m (Case E). These are compared with a single pile (Case A): (a) H 1 / 3 = 0.06 m, T 1 / 3 = 1.6 s; (b) H 1 / 3 = 0.1 m, T 1 / 3 = 1.6 s; (c) H 1 / 3 = 0.1 m, T 1 / 3 = 1.2 s. ( z / d = 1 / 6 . Pile 1: x = 0.25 0.15 m, points 23, 25, 27, and 28. Single pile: x = 0.05 0.05 m, points 29, 31, 33, and 34.)
Jmse 12 01715 g017
Figure 18. Spatial distributions of the maximum pore pressure around pile 2 at a distance of 0.05 m below the seabed surface under three front pile diameters of D 1 = 0.08 m (Case D), D 1 = 0.1 m (Case B), and D 1 = 0.12 m (Case E). These are compared with a single pile (Case A): (a) H 1 / 3 = 0.06 m, T 1 / 3 = 1.6 s; (b) H 1 / 3 = 0.1 m, T 1 / 3 = 1.6 s; (c) H 1 / 3 = 0.1 m, T 1 / 3 = 1.2 s. ( z / d = 1 / 6 . Pile 2 and single pile: x = 0.05 0.05 m, points 29, 31, 33, and 34.)
Jmse 12 01715 g018
Table 1. The wave parameters used in the present study.
Serial Number H 1 / 3 (m) T 1 / 3 (s)
10.061.6
20.081.6
30.101.6
40.121.6
50.101.2
60.101.4
70.101.8
Table 2. The pile model parameters used in the present study.
Pile Diameter D (m)Submerged Weight W s (N/m)
0.082.3
0.102.9
0.123.5
Table 3. The properties of the soil sample used in the present study.
Soil PropertiesValueUnit
Dry density ( ρ d )1.5337g/cm2
Specific gravity ( G s )2.6540-
Permeability coefficient ( k s )0.0767cm/s
Poisson’s ratio ( μ )0.3-
Shear modulus (G)9.23MN/m2
Void ratio (e)0.7304-
Porosity (n)0.4221-
Maximum dry density ( ρ d m a x )1.6076g/cm3
Minimum dry density ( ρ d m i n )1.2963g/cm3
Relative density ( D r )0.7994-
Median particle size ( d 50 )0.2037mm
Disclaimer/Publisher’s Note: The statements, opinions and data contained in all publications are solely those of the individual author(s) and contributor(s) and not of MDPI and/or the editor(s). MDPI and/or the editor(s) disclaim responsibility for any injury to people or property resulting from any ideas, methods, instructions or products referred to in the content.

