Article

A Study on Offshore Anchor Selection with a Focus on Torpedo Anchor Stability and Performance

1
Engineering Science and Ocean Engineering, National Taiwan University, Taipei 10617, Taiwan
2
Civil Engineering, National Taiwan University, Taipei 10617, Taiwan
*
Authors to whom correspondence should be addressed.
J. Mar. Sci. Eng. 2024, 12(10), 1721; https://doi.org/10.3390/jmse12101721
Submission received: 28 August 2024 / Revised: 25 September 2024 / Accepted: 26 September 2024 / Published: 30 September 2024
(This article belongs to the Section Ocean Engineering)

Abstract

:
The global pursuit of renewable energy has significantly accelerated offshore wind energy development. Floating offshore wind turbines (FOWTs) are increasingly in the spotlight as they offer superior capabilities for harnessing abundant wind resources in deep-water areas, outperforming traditional fixed-bottom turbines. The deployment and station-keeping of these floating structures are critically dependent on robust mooring systems and the precise selection of anchoring solutions. This paper provides an overview of various anchors, including driven and suction caissons, torpedo, and drag anchors, and their applications in real-world projects. These commonly used anchors were discussed in relation to mooring types, soil conditions, and expected bearing capacities. Torpedo anchor installation failures have been reported in cases where excessive tilt angles occur during deployment. This motivates us to present an in-depth study on the importance of directional stability during installation of torpedo anchors. The study will utilize computational fluid dynamics Star-CCM+ 2402 to analyze and assess the impact of the center of gravity configuration on stabilization. Additionally, theoretical formulas will be used to estimate the holding capacity that the torpedo anchor can provide. These insights are designed to assist wind energy developers in making informed and effective anchoring decisions for floating wind turbine projects.

1. Introduction

To deal with the challenge of climate change brought about by global warming, nations worldwide have decided to adopt renewable energy solutions to conserve resources and reduce carbon emissions. Among these solutions, offshore wind energy stands out as a technology with significant promise and considerable potential for development [1,2]. As international demand for renewable energy continues to rise and fixed-foundation wind farms are progressively developed, the availability of suitable sites for these installations is becoming increasingly limited. There is a growing shift towards exploiting locations in deeper waters, which offer superior wind energy potential [3,4]. The increased depth necessitates a significant rise in the steel required for fixed foundations, thereby driving up development costs [5], which must support the complex transport and enhanced technical requirements [6] associated with deep-water operations. The primary challenge in developing FOWTs lies in the complexity of their mooring systems, which are currently less technologically mature than the fixed wind turbine systems that utilize massive underwater foundations anchored directly to the seabed. Research on mooring systems encompasses a broad spectrum of advanced technologies [7] with selecting appropriate anchoring solutions as a critical focus.
Due to industry demands, innovative anchor designs such as the variable buoyancy anchor [8], ring suction anchor [9], and suction anchor with fins [10,11] have emerged. However, in this study, we focus on evaluating typical anchors, including driven piles, suction caissons, drag anchors, and torpedo anchors. Key factors for anchor type selection are further discussed, such as:
  • Types of mooring systems: Types of mooring systems include catenary and taut leg systems. The catenary system is suitable for use when the water depth is shallow [12]. The primary concern with using a taut leg system in shallow water is that the mooring lines become overly stiff, leading to excessive tension and vertical loading on the anchors [7].
  • Soil composition of the seabed: Another critical factor that should be considered in anchor selection is the soil properties. Soil is mainly divided into two properties: (a) cohesive and (b) cohesionless.
  • Manufacturing, transport, and installation costs: Building an offshore wind energy facility entails significant financial investment [13], with substantial costs associated with anchors’ manufacturing, installation, and transportation. Byrne and Houlsby’s [14] estimates suggest that foundation costs could account for up to 35% of the total cost of installing offshore wind systems. Cost data for floating systems are limited due to the novelty, fast developments, and few actual deployments.
This study follows that selecting anchoring solutions is a critical factor in mooring systems, as it directly influences the holding capacity that can be delivered to stabilize the floating platform. In particular, we focus on torpedo anchors. Unlike drag anchors, which are economical and popular but only suitable for horizontal loads, torpedo anchors offer resistance to vertical loads [15]. This characteristic makes torpedo anchors particularly suitable for taut and semi-taut mooring systems. These mooring systems are gaining popularity due to their smaller footprint and the reduced platform motions they cause compared to catenary systems [7]. These factors motivate us to conduct an in-depth analysis of torpedo anchors.
Moreover, the torpedo anchor is noted for its rapid installation speed [16]. According to O’Loughlin et al. [17], the installation time of a torpedo anchor is estimated to be the shortest among suction caissons, suction-embedded plate anchors, and dynamically-embedded plate anchors. It achieves sufficient kinetic energy to penetrate the seabed by free-falling through the water. During this process, the hydrodynamic behavior of the torpedo anchor significantly affects its impact velocity on the seabed. According to Triantafyllou and Hover [18], the directional stability of a slender object moving through water is influenced by the relative positions of its center of gravity and hydrodynamic center. An object is considered stable if its center of gravity is below the hydrodynamic center and unstable if it is above. Consequently, the position of the center of gravity directly impacts the directional stability of a torpedo anchor during its descent. The risk of anchor failure during installation is considerable, with a reported failure rate of 16.7%, underscoring the necessity for further investigation [19]. This study aims to address this issue by employing computational fluid dynamics techniques to analyze the directional stability of torpedo anchors in water. The primary objectives are:
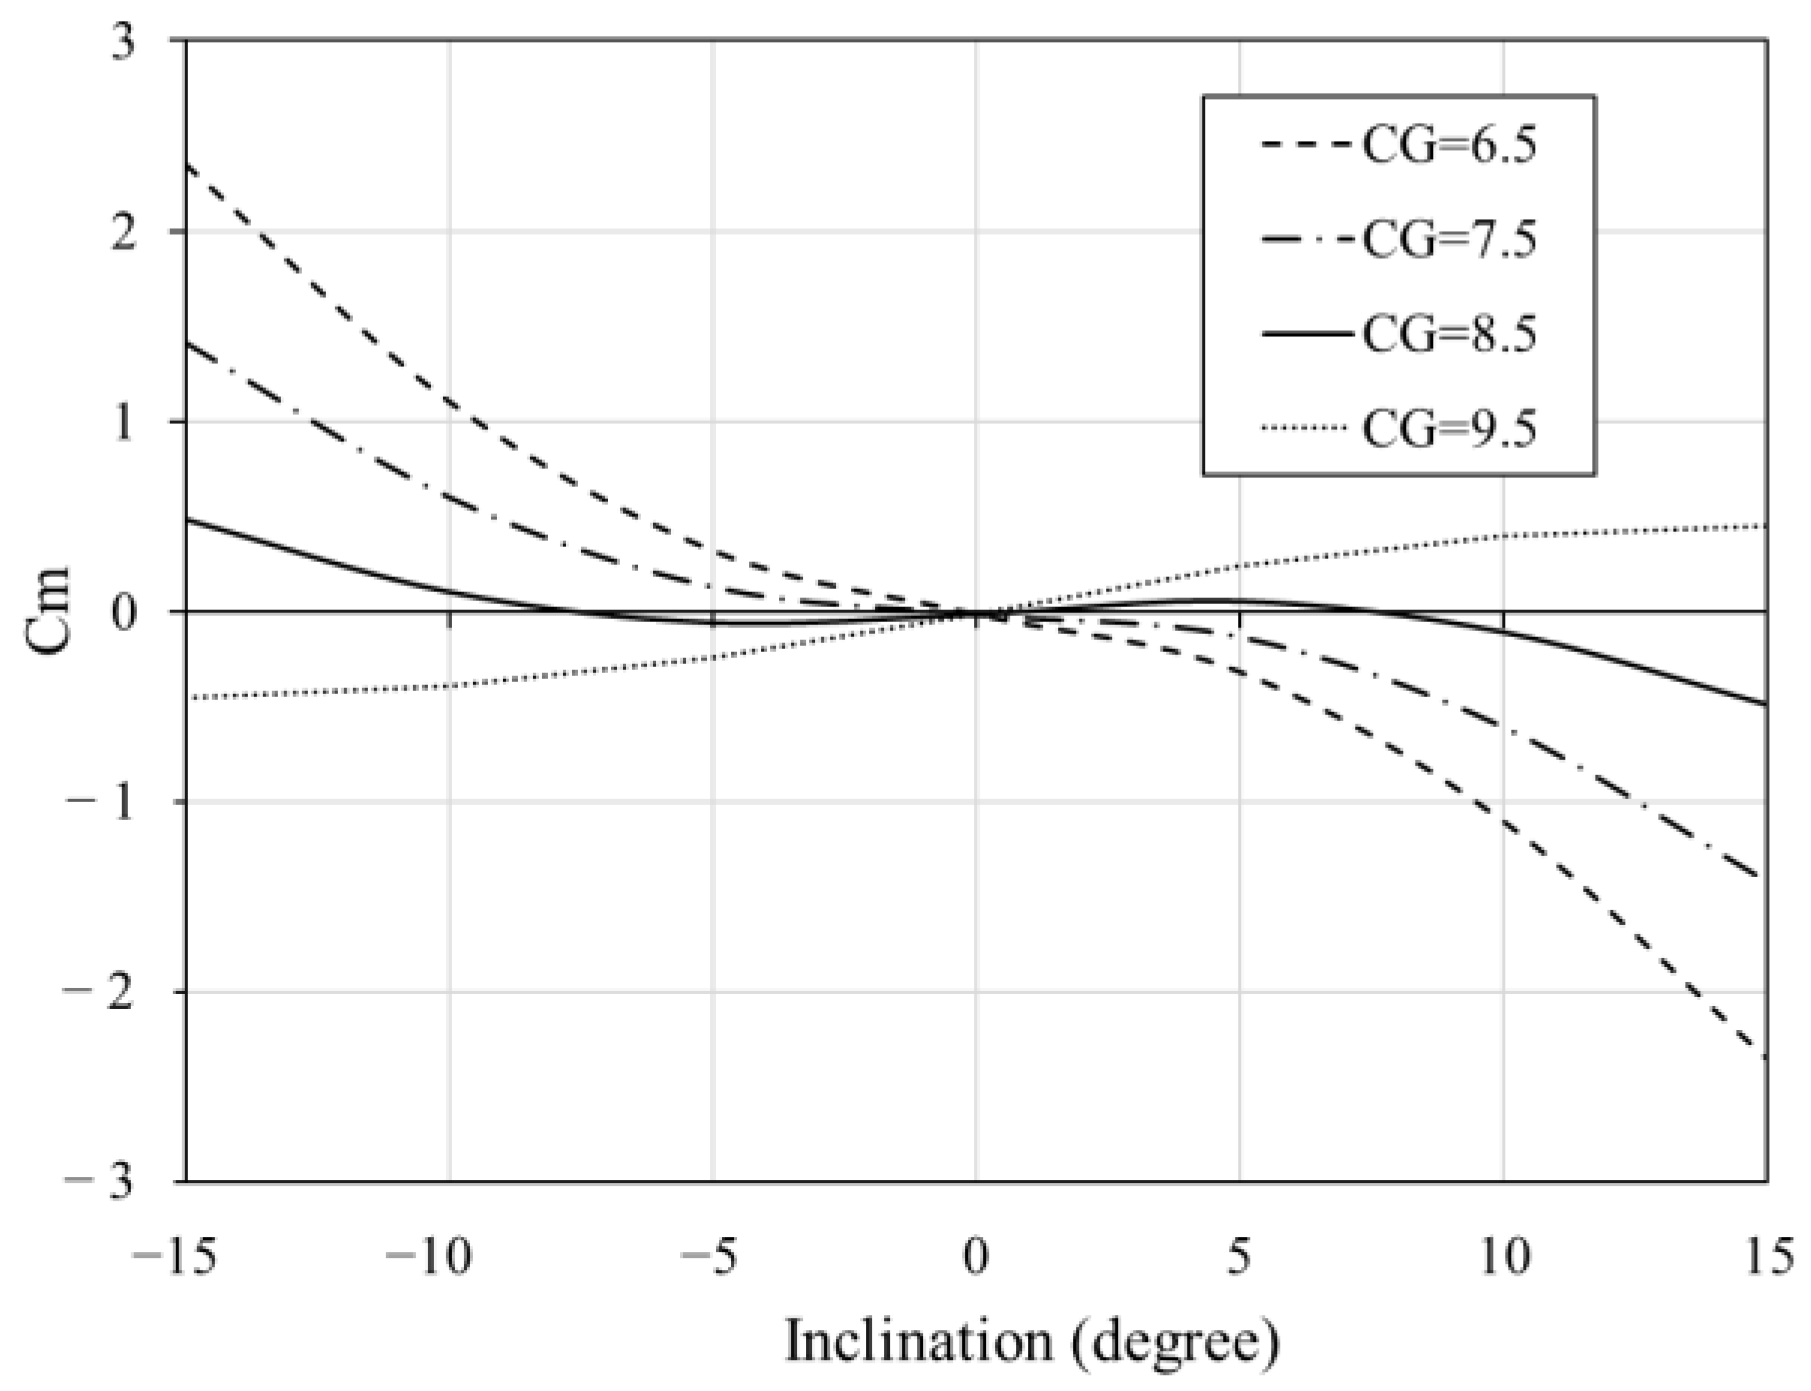
  • To determine the optimal position of the center of gravity and investigate the stability;
  • To enhance the stability of torpedo anchors with respect to the location of the gravity center;
  • To evaluate the relationship between penetration velocity, penetration resistance, and penetration depth of torpedo anchors;
  • To estimate the maximum holding capacity of a prototype torpedo anchor.
By analyzing these factors, this study will provide valuable insights into the effectiveness of torpedo anchors and offer guidance for optimizing their design and manufacturing processes. This study is organized as follows: Section 2 reviews the types of anchors, including driven piles, suction anchors, drag anchors, and torpedo anchors. We also examine the torpedo anchor from both hydrodynamic and geotechnical engineering perspectives in Section 3. Finally, the study concludes with a summary and references.

2. Types of Anchors for FOWTS

The floating structure of FOWTs imposes different load conditions on the anchoring system. Loads on mooring systems can be classified into horizontal and vertical components. Catenary mooring systems suffer greater horizontal tension. In contrast, taut leg mooring systems suffer greater vertical tension. Additionally, the effectiveness of anchoring solutions is heavily influenced by the soil conditions at the installation site, which can vary significantly in type and characteristics. In 2023, Cerfontaine et al. [20] compared the loads on various anchors in soil under different conditions. For instance, assuming a suction anchor with a dry weight of 10 tons, the vertical resistance difference between sand and clay is approximately 50 % . For this reason, various kinds of seabed substrates present challenges and opportunities for anchor performance. Therefore, a comprehensive engineering analysis is essential to determine the most suitable anchor type. In the following section, we investigate some commonly used of anchor type in offshore wind projects.

2.1. Driven Piles

Driven piles are slender hollow steel tubes extensively used in various engineering domains due to their robust structural properties. They provide stable support for buildings and are crucial for anchoring fixed offshore wind turbines. Driven piles are a well-established technology in offshore engineering known for their proficiency [21].
  • Installation and Functionality:
    • Driven piles are installed using powerful pile-driving hammers that drive them deeply into the seabed, ensuring secure anchorage and sufficient holding capacity to support wind turbine structures. They can also anchor large floating structures and withstand both vertical and horizontal loads.
    • The installation process requires large cranes and specialized equipment, making it technically demanding, especially in deep water. Figure 1a illustrates the slender, hollow steel pipes embedded into the seabed during installation.
  • Design and Performance:
    • Randolph and Murphy [22] discuss the design theory for driven piles, which helps determine pile dimensions and optimal chain bracket positions.
    • The anchorage force primarily comes from the frictional resistance between the pile’s outer surface and surrounding soil, which is crucial for maintaining stability and load-bearing capacity.
    • Driven piles are versatile, supporting both catenary and tensioned mooring systems. However, high installation costs and environmental concerns, such as hammer noise [23], necessitate the use of bubble curtains to mitigate noise and protect aquatic life. These factors must be carefully assessed for each project.
  • Case Study:
    • Driven piles have been used in the Ichthys LNG development project off northwest Australia [24,25]. The project includes some of the largest floating structures globally. Erbrich et al. [26] confirm that driven piles provide sufficient installation performance.
Once the foundation pile penetrates the seabed, the forces acting on it are illustrated in Figure 1b. According to the API [27] recommended guidelines, the vertical resistance of driven piles in cohesive soil is determined, and the bearing resistance at the base is calculated as follows:
F b = A p N c S u ,
where N c is the bearing factor of the pile tip, S u denotes the undrained shear strength, and A p implies the bearing area of the pile. Additionally, the friction resistance of the shaft can be expressed as:
F f = A s α S u ,
where A s denotes the embedded surface area of the pile, and α implies the friction factor. It takes into account the varying shear strength along the length of the pile and introduces an average resistance by Randolph and Murphy [22], which can be expressed by:
α = 0.5 ( S u σ v ) 0.5   f o r S u σ v 1 ,
α = 0.5 ( S u σ v ) 0.25   f o r S u σ v > 1 ,
where σ v is the vertical effective stress. After calculating the bearing resistance ( F b ) and friction resistance ( F f ) , the vertical pull-out capacity ( F v ) of the driven pile can be expressed:
F v = F b + F f + W s ,
where W s is the submerged weight in the soil. The calculation methods provided by the API are straightforward to apply and are still widely used in the offshore industry. Current pile-related research primarily focuses on the environmental conditions of clay, silt, and sand. The anchor can also be applied to sand with larger particle sizes and non-cohesive properties because the external force (the hammer) can drive the pile into the seabed.
Driven piles are indeed capable of withstanding horizontal loads; however, the calculation process is more complex than that for vertical pull-out capacity. Reese and Van Imper suggest that horizontal loading induces intricate soil-structure interactions, where lateral soil resistance varies with depth and displacement, resulting in nonlinear behavior [28]. This complexity contrasts with the relatively straightforward considerations of end bearing and skin friction involved in vertical load calculations. According to the ABS guidance [29], for static lateral loads, the ultimate unit lateral bearing pressure of piles in soft clay ranges between 8 S u and 12 S u . The following methods are recommended for application:
F h = 9 S u A h   ,
where F h is the horizontal lateral capacity, and A h  represents the lateral projected area of the pile’s main body.

2.2. Suction Caissons

The first permanent suction caisson moorings were installed in 1995 at depths of 100–200 m for catenary anchor lines. In 1997, suction caissons and fiber rope taut leg moorings were first used in deep water in Brazil [30]. Today, suction caissons are widely used in marine engineering.
  • Installation and Functionality:
    • Suction caissons are hollow steel pipes with closed tops and larger diameters compared to pile anchors, providing a robust anchoring solution [31].
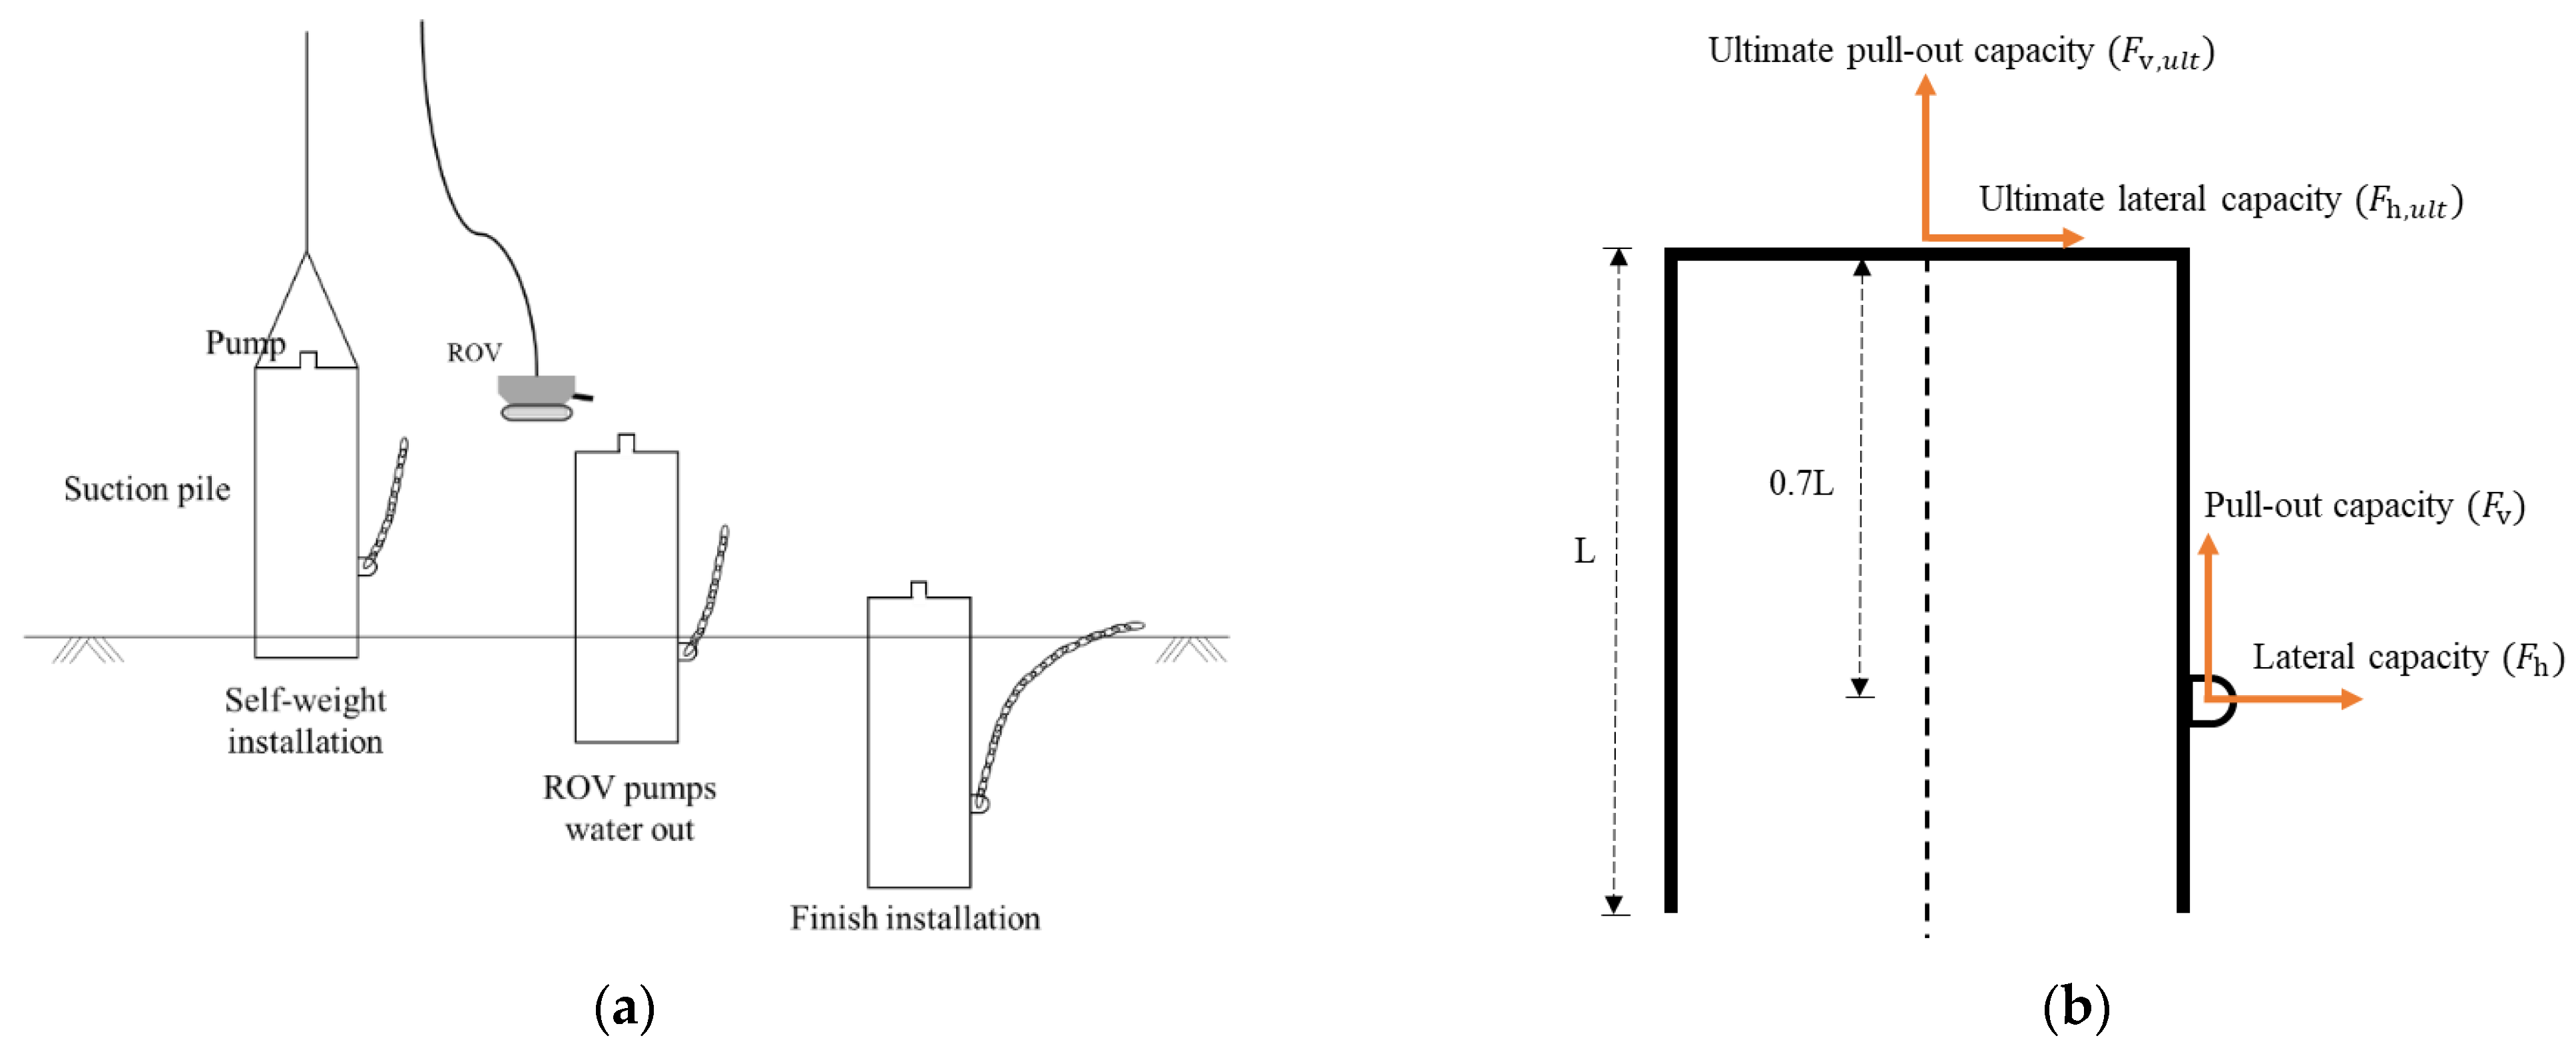
    • The design creates a pressure differential during installation, allowing secure embedding into the seabed. A pump, typically operated by a remotely operated underwater vehicle (ROV), removes seawater from inside the pile, drawing it into the seabed [30,32]. Figure 2a illustrates the installation process, which includes self-weight penetration and water being pumped out, controlled by the ROV.
  • Performance and Applications:
    • The holding capacity comes from friction between the soil and the anchor’s contact areas. Suction caissons are suitable for catenary and taut leg mooring systems, offering stability in various conditions.
    • They can penetrate harder seabed, but care must be taken to avoid pipe wall deformation due to excessive negative pressure.
  • Considerations:
    • Suction caissons are adaptable and effective for diverse seabed conditions, including clay [33] and sandy soils [34]. However, they have different effects on break-out resistance depending on soil type [35].
    • The need for substantial deck space during transport and crane installation vessels contribute to higher deployment costs. These factors should be considered in offshore project planning.
The padeye of the suction anchor is typically positioned on the side of the anchor body. In Figure 2b, F v , u l t and F h , u l t represent the overall pull-out and lateral capacity acting on the suction caisson within the seabed. These capacities differ from F v and F h , which refer to the forces exerted by the mooring chain on the padeye. According to the recommendations by Randolph and House [33], placing the padeye approximately 0.7 L below the inner bottom plate of the caisson cover minimizes the impact of vertical force and moment, thereby optimizing the anchor’s ultimate lateral capacity ( F h , u l t ) . At this position, the load inclination at the mudline is nearly zero, achieving optimal performance. Supachawarote indicates that the ultimate pull-out capacity in clay is expressed by Equation (7) as the sum of two distinct contributions [36]: the external shaft interface friction ( π L D α S u , a v e ) and the reverse end-bearing term ( N c S u , t i p π D 2 / 4 ) .
F v , u l t = π L D α S u , a v e + π D 2 4 N c S u , t i p ,
where L and D are the length and diameter of the suction caisson, respectively. When a horizontal load is applied to the padeye and failure occurs translationally (without rotation), the pure lateral capacity of the anchor is mobilized. The ultimate lateral capacity ( F h , u l t ) is expressed by Equation (7) as the sum of the resistance along the anchor shaft ( L D N h S u , a v e ) and the tip ( S u , t i p π D 2 / 4 ) .
F h , u l t = L D N h S u , a v e + π D 2 4 S u , t i p ,
where N h is the lateral bearing factor. It has been widely demonstrated that the maximum horizontal capacity is achieved when anchor failure occurs through pure rigid translation [37]. Inclined loading indicates a significant interaction between pull-out and lateral failure mechanisms. According to the Supachawarote [36], the normalized failure envelopes for vertical and horizontal loads can be described by elliptical functions in Equation (9).
( F h F h , u l t ) a + ( F v F v , u l t ) b = 1 ,
where pure pull-out capacity ( F v , u l t ) and ultimate lateral capacity ( F h , u l t ) are evaluated, and a and b are shape factors that depend on the L / D ratio. The a and b coefficients can be obtained from Equations (10) and (11).
a = 4.5 L 3 D ,
b = 0.5 + L D ,
The F v F h failure envelopes can be obtained when the suction caisson is in clay. A change in loading angle without adjusting the padeye location could have either a positive or negative effect on the resultant holding capacity, depending on the putout-lateral interaction for a given L / D ratio [38].
While concrete caissons have seen some use, most suction caissons are constructed from steel, with diameter-to-wall thickness ratios ( D / t ) typically ranging between 100 and 250 . Internal stiffening elements are incorporated to avert structural buckling both during installation and under the influence of mooring forces and soil resistance during operation. The combination of low embedment ratios and the relatively high rigidity of suction caissons results in failure through rigid body movement, in contrast to anchor piles, which tend to develop plastic hinges when they fail.

2.3. Drag Anchors

Drag anchors, also known as drag embedment anchors, are efficient and easy to recover. They consist of a shank and a fluke that penetrates the seabed [39]. Their high efficiency, defined by the ratio of holding capacity to weight, makes them ideal for applications requiring strong anchorage without heavy equipment.
  • Installation and Functionality:
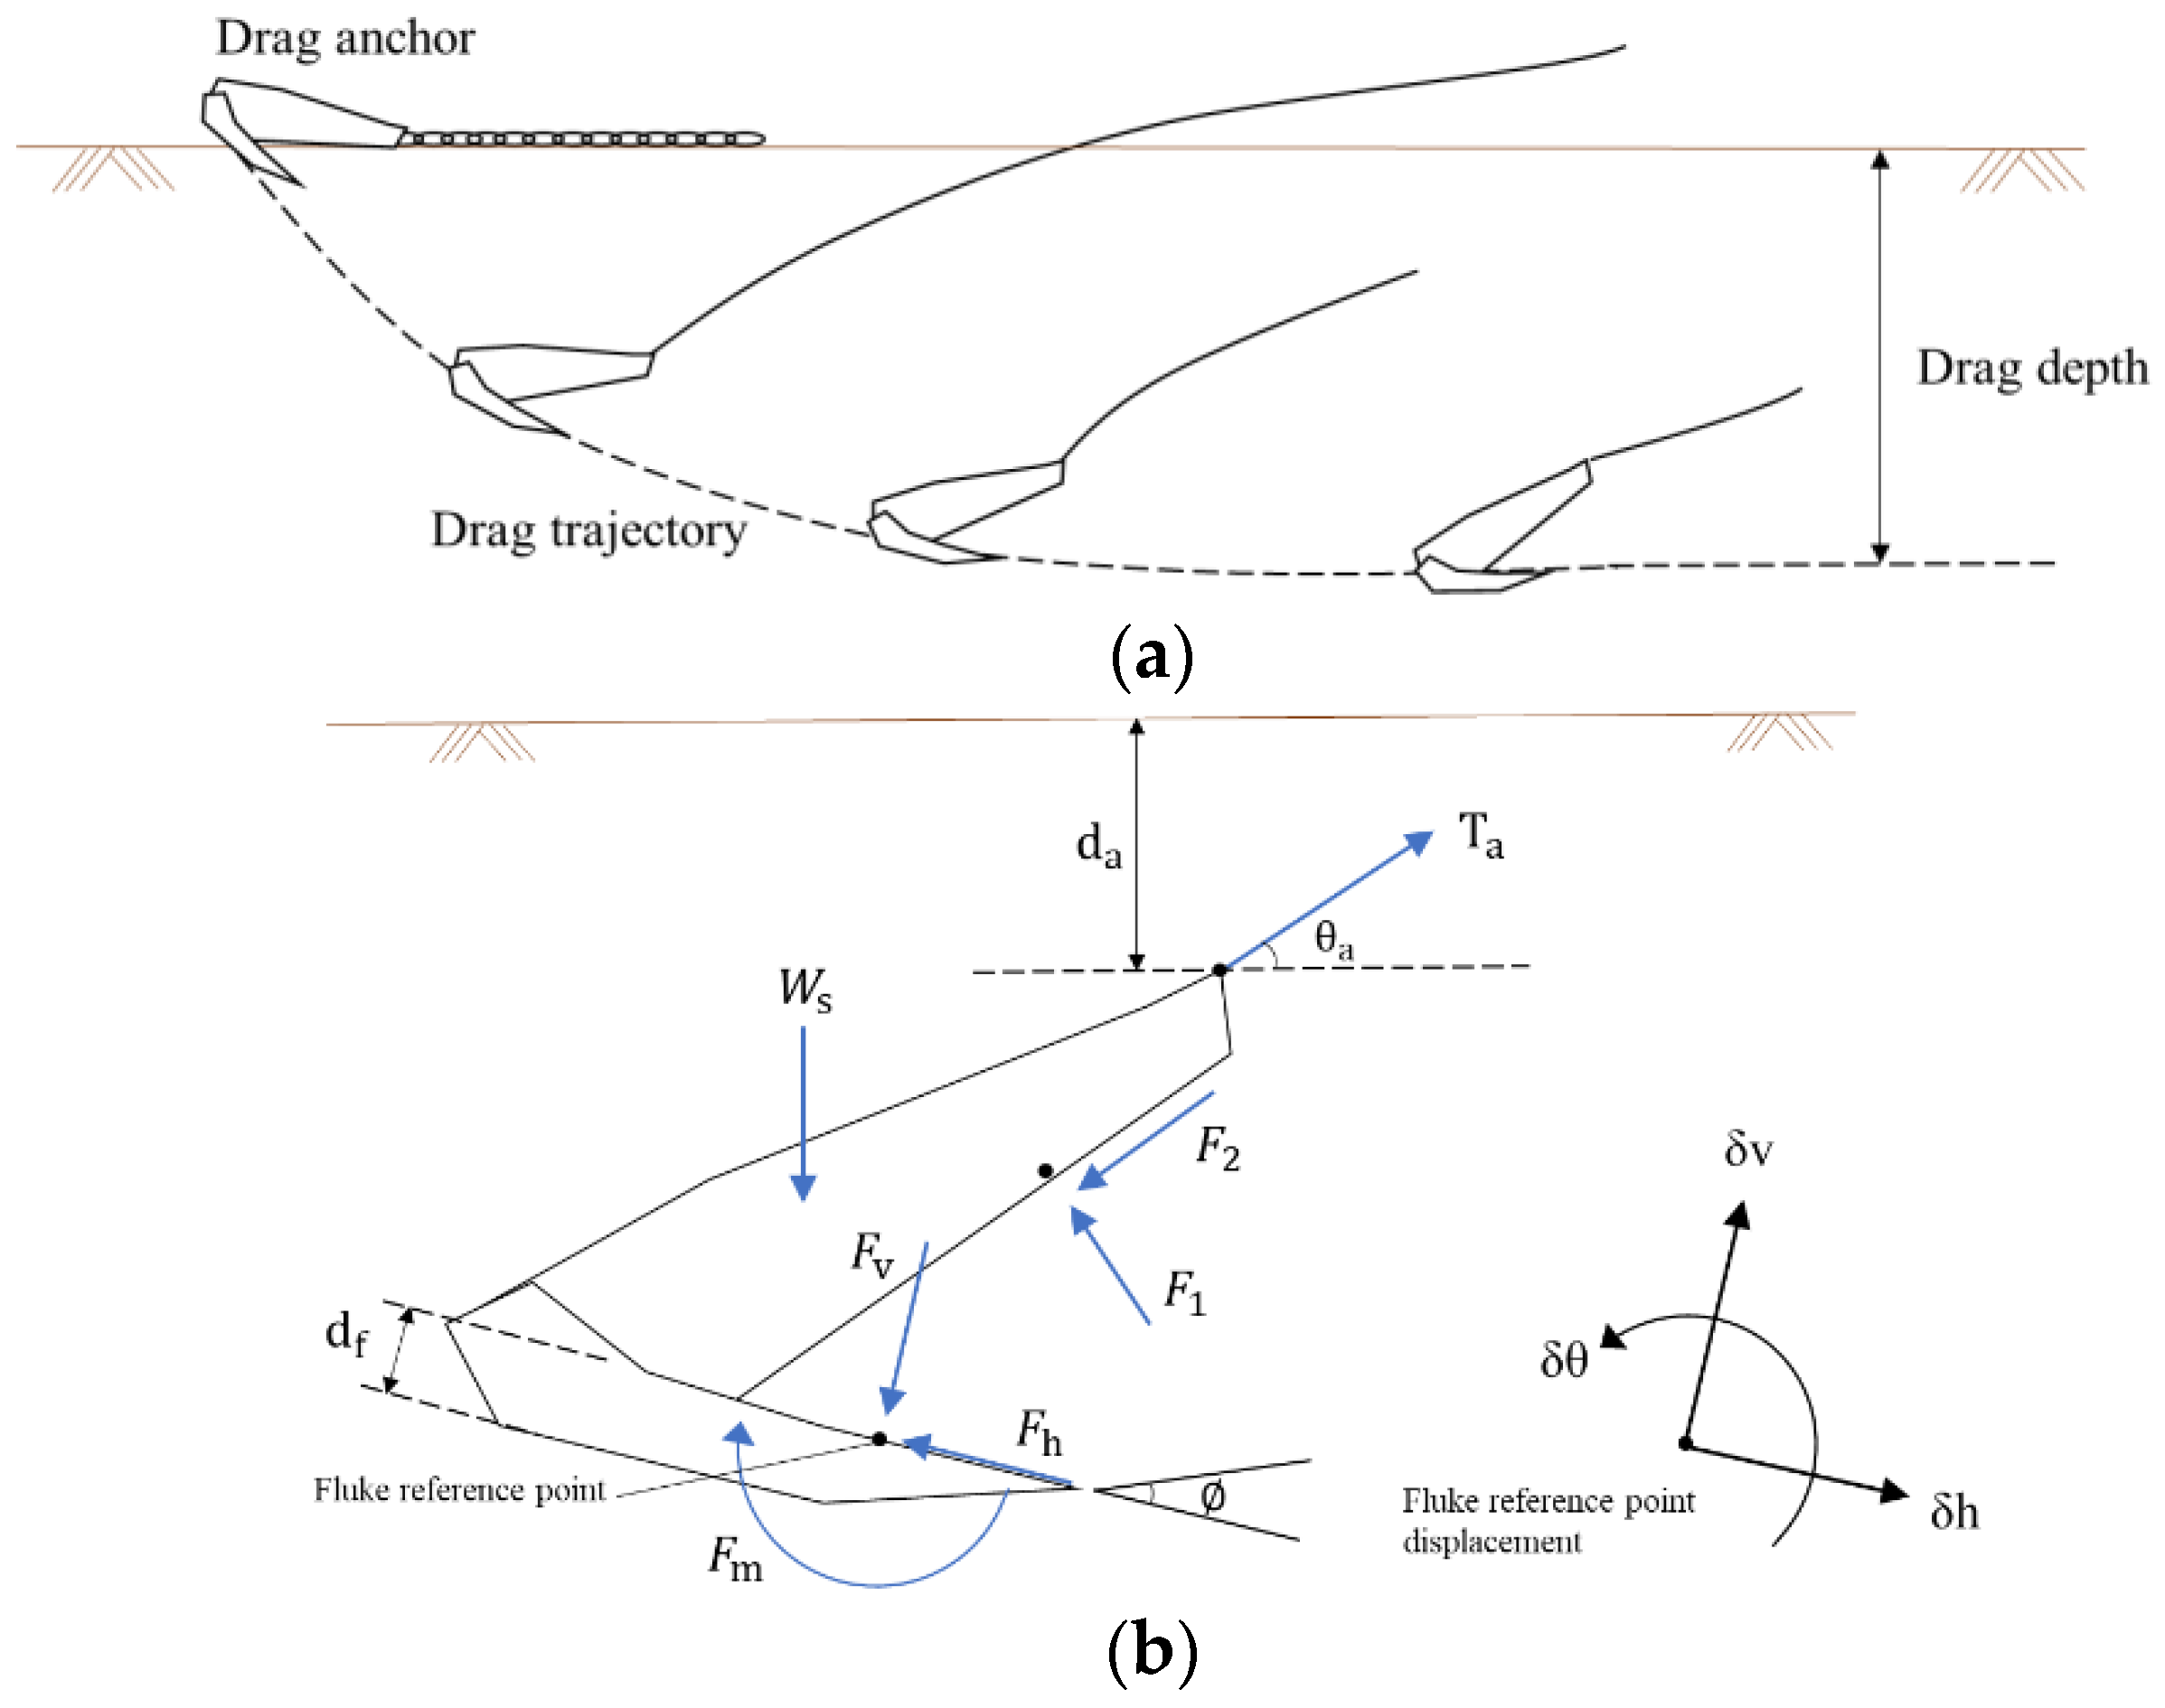
    • Drag anchors cannot be precisely positioned, as their final location depends on how they embed during dragging. The holding capacity increases with deeper penetration. Figure 3a illustrates the installation process, where an Anchor Handling Vessel (AHV) drags the anchor into place.
    • Drag anchors are unsuitable for vertical loads and cannot be used as shared anchors.
  • Testing and Performance:
    • Testing drag anchor resistance is crucial to ensure adequate holding capacity, typically using the AHV’s tensioning equipment to confirm proper embedment and stability.
    • They are effective in catenary mooring systems, handling horizontal loads well. Predicting performance involves:
      Estimating the anchor trajectory, linking drag distance to embedment depth.
      Calculating holding capacity based on soil strength. Research [40,41] focuses on these dynamics in clay soils.
  • Soil Considerations:
    • Drag anchors struggle in hard soils due to limited penetration but are effective in softer soils like clay, which allow deeper embedding and better support, including some vertical loads. These factors are critical for determining their suitability in offshore mooring systems.
Ozmutlu [42] notes that drag anchors are effective in offshore wind projects like Hywind, WindFloat, and Fukushima. O’Neill et al. [39] developed a method using soil mechanics and the yield envelope method to calculate drag anchors’ ultimate bearing capacity in clay soils. In soft, undrained soil, failure happens due to localized plastic flow around the anchor, regardless of its orientation. The plastic yield locus of an anchor represents the combination of vertical ( F v ) , horizontal ( F h ) , and bending moment ( F m ) loading that causes the anchor to fail. The trajectory can be expressed as a mathematical function (by Equation (12)) of these three forces for a given geometry and set of soil [39].
f F v ,   F h ,   F m = 0 ,
Considering a simplified weightless drag anchor deeply embedded in undrained soil, a chain load T a on the anchor padeye can be expressed in terms of forces parallel ( F h ) and perpendicular ( F v ) to the top face of the fluke, and the negative moment ( F m ) about a specific reference point on the fluke, as shown in Figure 3b. Anchor failure will occur under the combinations of these three loads, causing the anchor to move parallel ( δ H ), perpendicular ( δ v ) to the fluke, and rotationally ( δ θ ) about the same fluke reference point.
The yield loci for anchor flukes can be represented by a mathematical function in F v F h F m space. For a detailed formulation and the curve-fitting parameters, please refer to O’Neill et al. [39]. The effects of soil–chain interaction and the calculation of anchor line angles are based on the chain equation proposed by Neubecker and Randolph [43]. For an expanded explanation, including the relevant equations, see the original references [39].

2.4. Torpedo Anchors

Torpedo anchors, developed by Medeiros [44], are gravity-installed anchors designed for reliable offshore anchorage. Their adaptable design suits various applications, such as risers and FPSOs [16,19]. They rely on their weight and gravity for installation, making them versatile for floating platforms and subsea equipment.
Key points about torpedo anchors include:
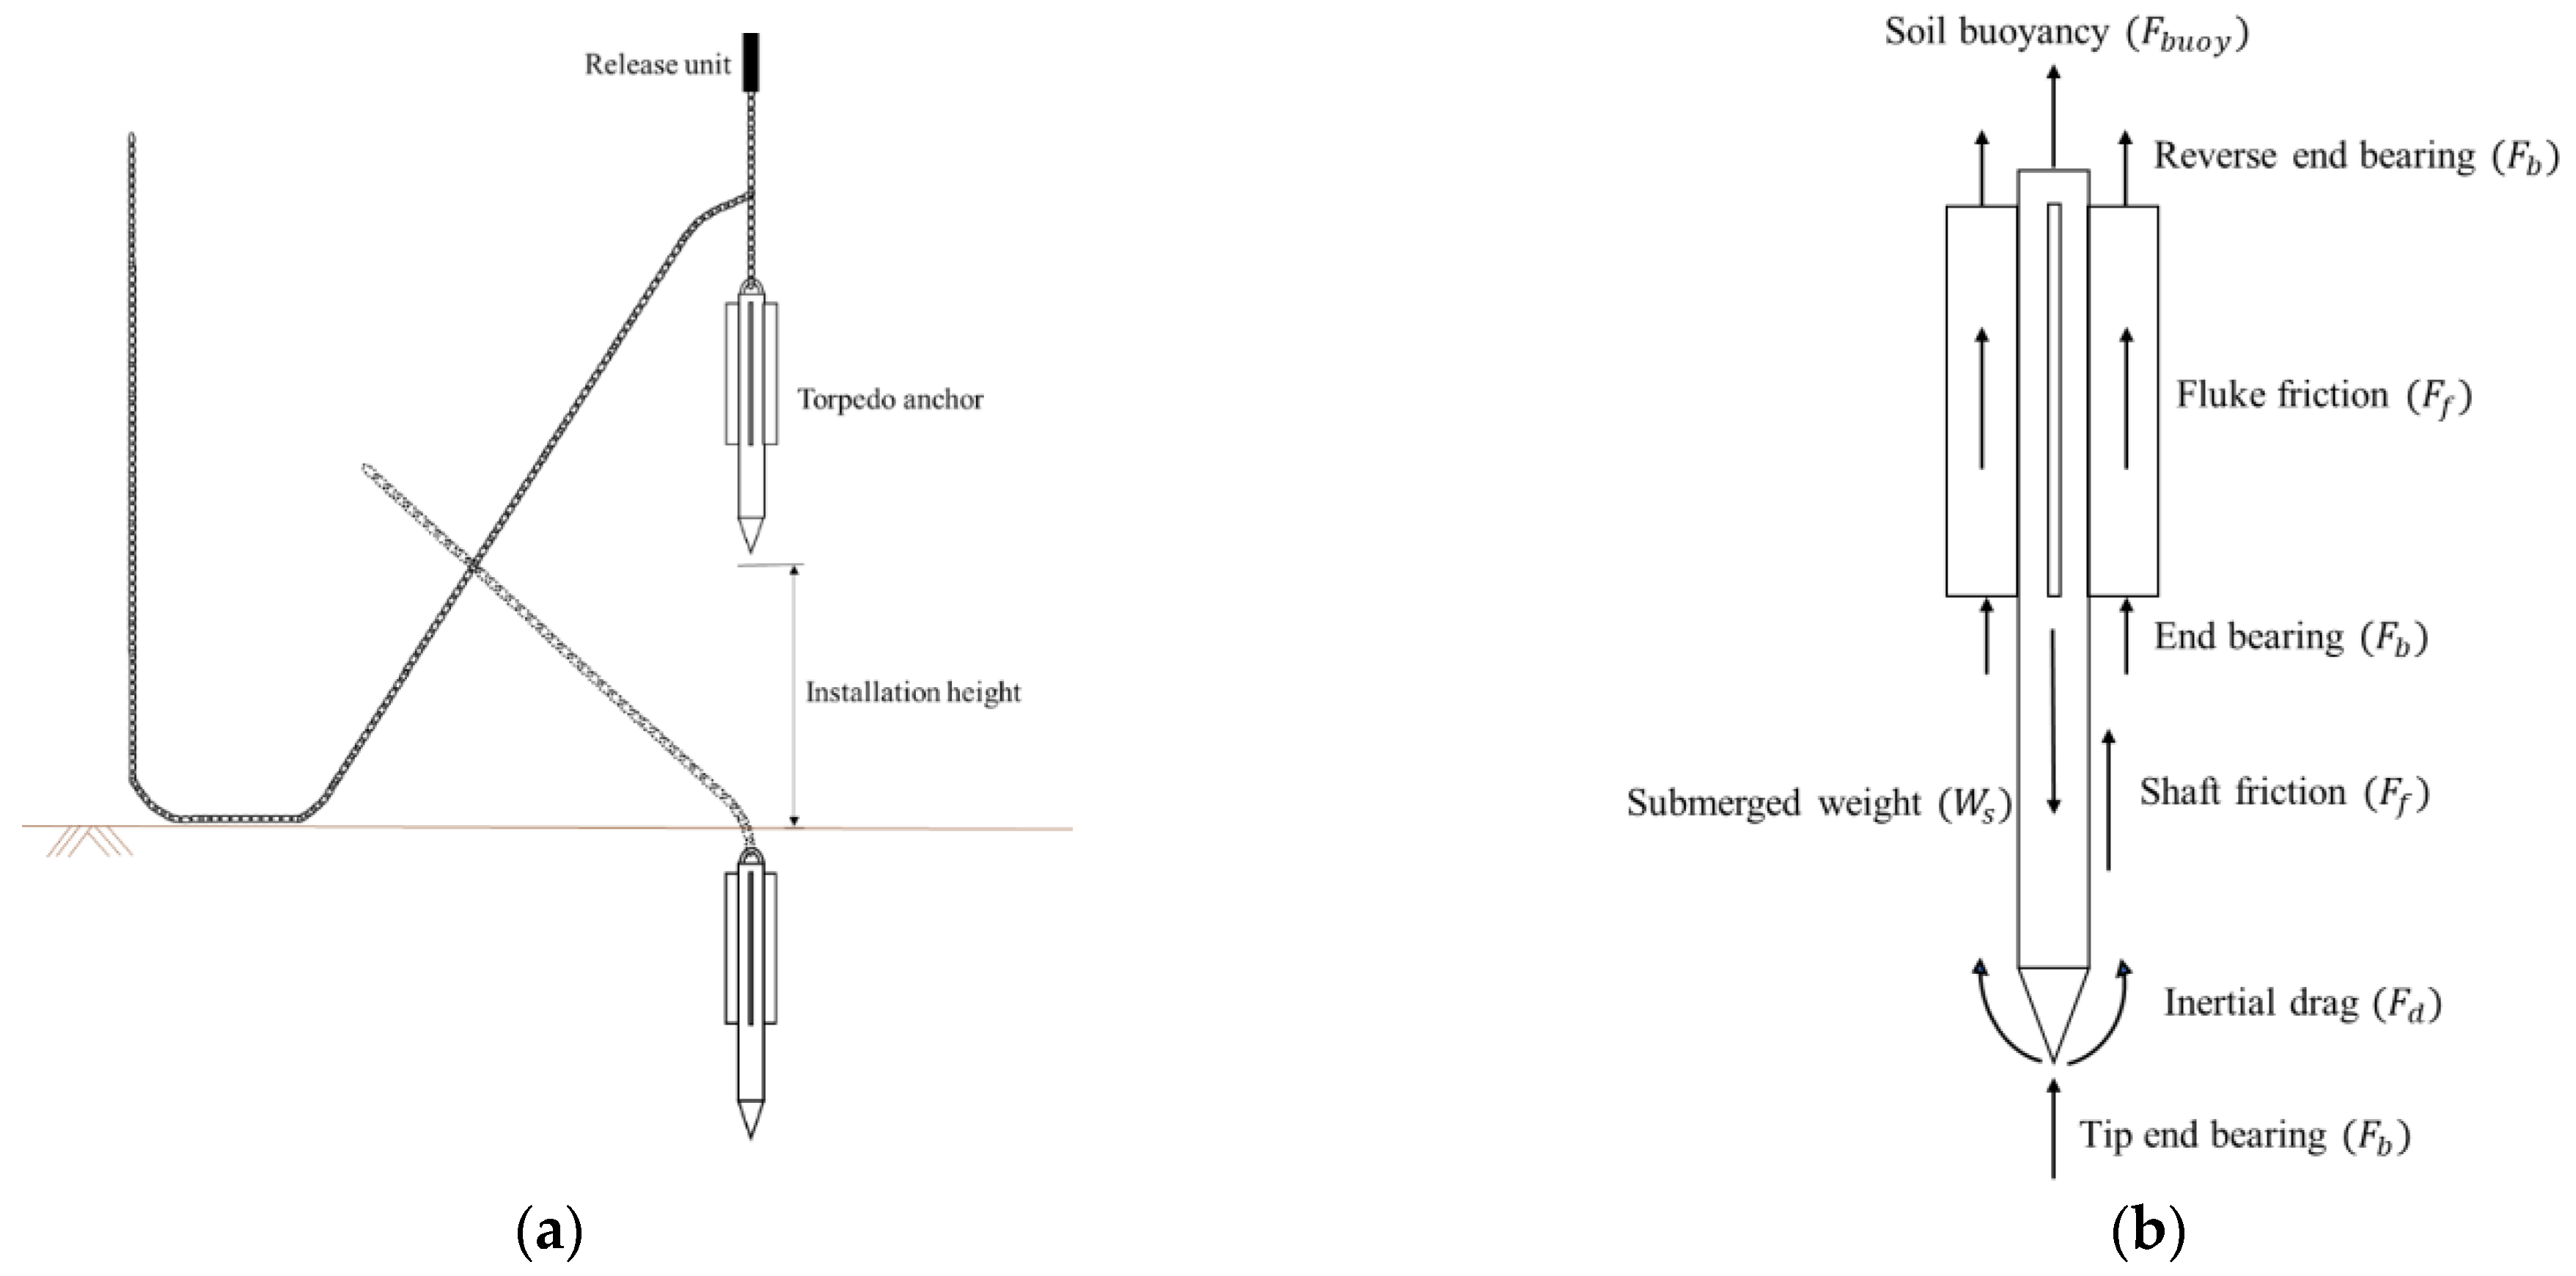
  • Gravity-Based Installation: Torpedo anchors are released in water and allowed to free-fall, using the kinetic energy from their descent to penetrate the seabed (as illustrated in Figure 4a). This method simplifies installation and reduces costs by minimizing the need for complex equipment.
  • Cost-Effectiveness: The gravity-based process reduces the need for specialized vessels and expensive equipment, leading to significant savings.
  • Deployment Conditions: Successful deployment depends on:
    • Seabed Compatibility: The seabed must be suitable for the anchor’s penetration dynamics.
    • Release Height: The height from which the anchor is released must be sufficient to generate the necessary kinetic energy.
This approach offers notable installation efficiency and cost-effectiveness, particularly under favorable environmental conditions.
Torpedo anchors rely on sufficient kinetic energy to embed deeply into the seabed. If the energy from free fall is inadequate, installation may fail. To minimize this risk, assess seabed conditions thoroughly. They work well in clay soils but require caution in silt or sandy soils. Understanding the seabed’s nature is crucial for anchor suitability. Currently, torpedo anchors are used in risers [16] and FPSO [19] in waters approximately 1200 m deep with clay seabed. Their use has been primarily limited to Brazilian waters, with few other application cases. The unique installation method of torpedo anchors involves utilizing their own gravity to free-fall through the water, achieving sufficient kinetic energy to penetrate the seabed. Consequently, the falling distance and penetration depth are critical factors for successful installation. However, because this installation method cannot guarantee effectiveness, it is unsuitable for use as a sharing anchor.

2.4.1. Holding Capacity of Torpedo Anchors

Based on the calculation method for the vertical load of driven piles provided by the API guidance [27], the torpedo anchor’s penetration depth prediction can be developed [45]. This model is based on Newton’s second law of motion and includes forces such as the dry weight of the anchor, the anchor’s buoyancy in the soil, friction, load-carrying resistance along the shaft and tip, and the inertial resistance provided by the soil. The model is represented as follows:
m d 2 z d t 2 = W s F γ R f F b + F f F d ,
where m is dry weight of the anchor, W s denotes submerged weight in the water, F γ the buoyant weight of the anchor in the soil, R f implies a rate or velocity-dependent term, F b represents the bearing resistance, F f is the frictional resistance, and F d implies the soil drag resistance. The bearing resistance and frictional resistance are respectively expressed by Equations (1) and (2). O’Loughlin et al. [45] demonstrated that neglecting the strain rate effect in Equation (14) when calculating R f could result in an error of approximately 40 % in predicting the penetration depth. Therefore, O’Loughlin et al. [46] employs semi-logarithmic ( λ ) and power functions ( β ) to develop the relationship between shear strength and shear strain. The rate dependence is expressed:
R f = 1 + λ log ( v / d v / d r e f )   o r   R f = ( v / d v / d r e f ) β ,
where λ and β are strain rate parameters, v denotes the penetration velocity, d implies the diameter of the anchor, and v / d r e f denotes the normalized reference velocity. The soil drag resistance ( F d ) , considering sediments as viscous soft clay material commonly encountered in the seabed, is given as:
F d = 1 2 C d ρ s A p v 2 ,
where C d , ρ s , and A p are the drag coefficient, density of soil, and projected area of anchor, respectively. From Equation (13), both the falling distance and its pull-out capacity can be considered simultaneously.

2.4.2. Hydrodynamic Directional Stability

The hydrodynamic behavior of the torpedo anchor during free fall is crucial for successful installation. Directional stability significantly influences whether the torpedo anchor can be installed correctly. In addition, the torpedo anchor’s drop distance, penetration depth, and holding capacity must be carefully evaluated. In the following we analyze the directional stability using methods presented by Silva [47]. This method requires using a computational fluid dynamics technique, holding the anchor in a static position while studying the flow from different directions.

3. Numerical Analysis of Torpedo Anchor

The dimensions of the torpedo anchor, known as T-98, are listed in Table 1. Silva suggests establishing the static model using CFD to analyze the directional stability of the torpedo anchor in water [47]. This study will be analyzed using STAR-CCM+ [48].

3.1. Governing Equations

This study employed a computational fluid dynamics technique for numerical simulations to model the movement of a torpedo in the water. Given that the torpedo anchor can achieve a high Reynolds number, the flow field is considered turbulent. The finite volume method (FVM) was utilized to solve the Reynolds-averaged Navier–Stokes (RANS) equations and the continuity equations within polyhedral mesh integrals, as proposed by Launder and Spalding in Equations (16) and (17), respectively [49].
ρ u ¯ i t + ρ u ¯ i u ¯ j x j = p ¯ x i + x j μ u ¯ j x i + u ¯ i x j + τ i j + ρ g i
u ¯ i x i = 0
where u ¯ i , u ¯ j ,   a n d   x i , j are the average velocity components and displacement component of the fluid in the i or j direction. In addition, p ¯ , ρ , μ , t , τ i j , and g i denote the average hydrodynamic pressure, fluid density, dynamic viscosity, time, Reynolds stress tensor, and the gravity acceleration component in the i direction. When the flow field is turbulent, the k ε model calculates the turbulent kinetic energy ( k ) and the turbulent dissipation rate (ε). The relationship between the turbulent kinetic energy and the turbulent dissipation rate is defined as follows:
D ( ρ k ) D t = x j μ + μ t σ k ( k ) x j + τ i j u ¯ i x j ρ ε
D ( ρ ε ) D t = x j μ + μ t σ ε ( ε ) x j + c 1 ρ ε k τ i j u ¯ i x j c 2 ρ ε 2 k
where c 1 and c 2 are model coefficients, σ k and σ ε are the turbulent Prandtl number, and μ t is the turbulent viscosity. τ i j is calculated as follows:
τ i j = μ t u ¯ i x j + u ¯ j x i 2 3 ρ k δ i j
Accordingly, the turbulent viscosity μ t is calculated as follows:
μ t = c μ ρ k 2 ε
The constants c μ , c 1 , c 2 , σ k , and σ ε are 0.09, 1.44, 1.92, 1.0, and 1.3, respectively [49].

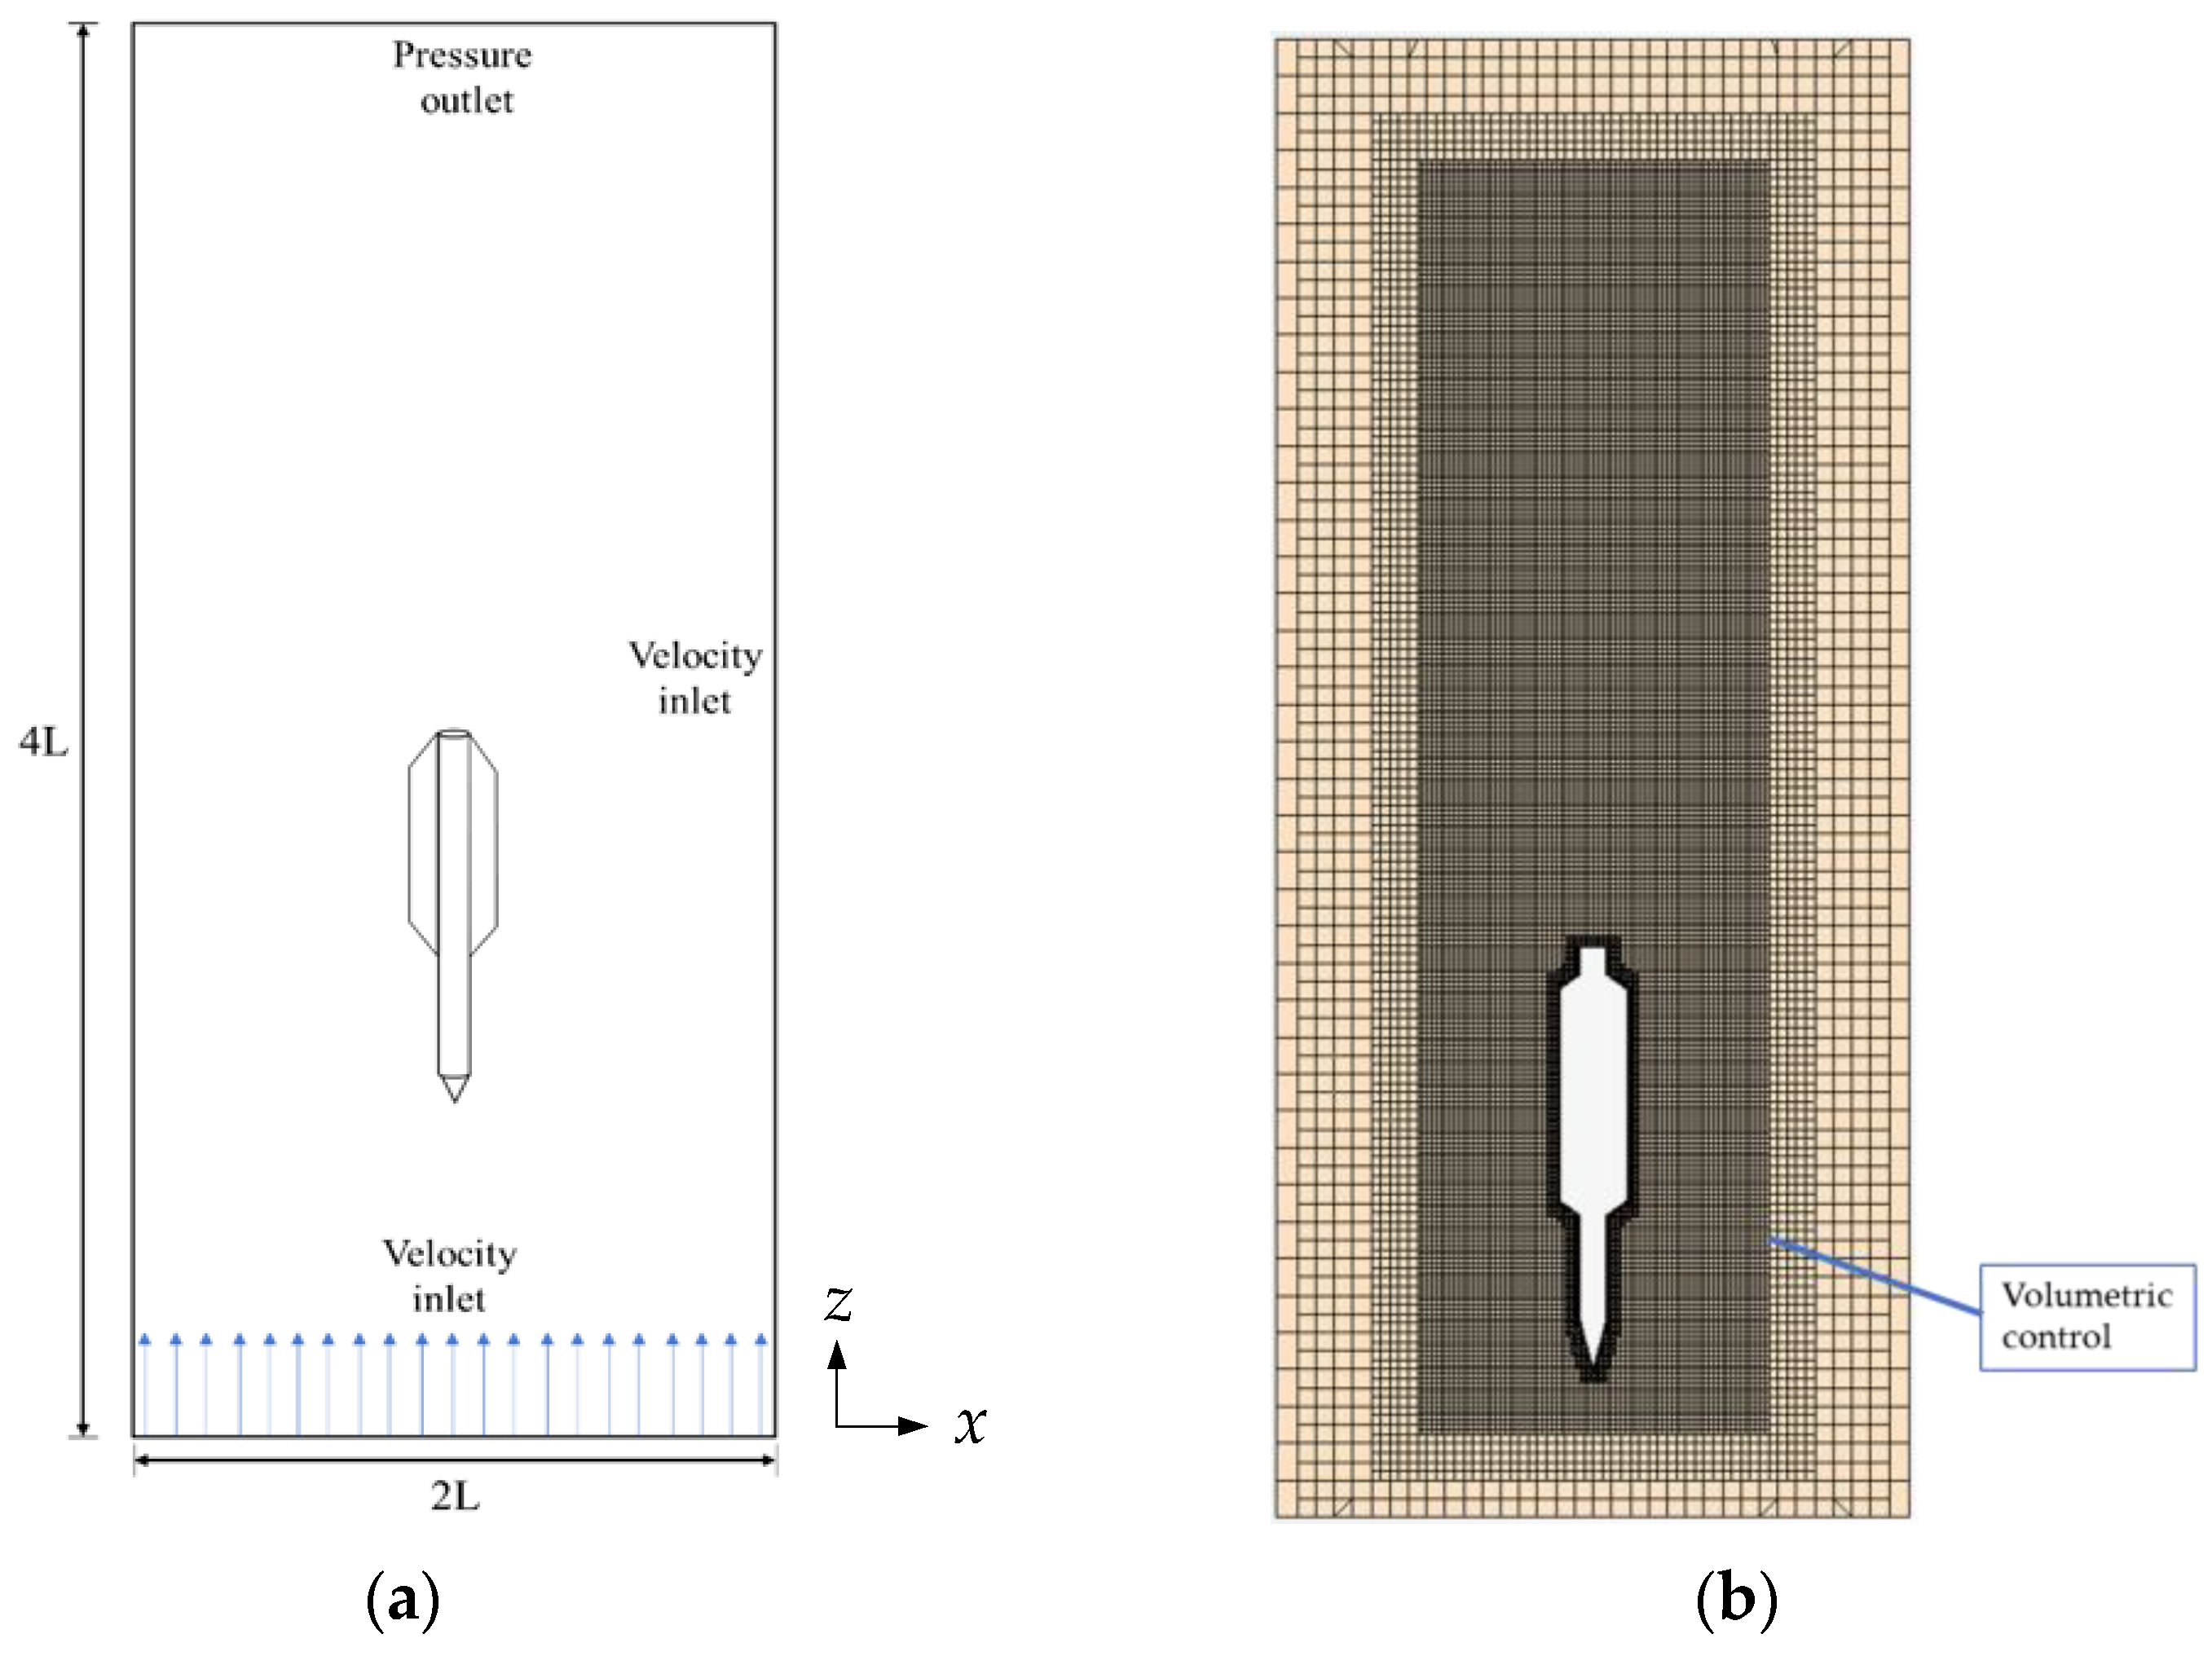
3.2. CFD Model Set-Up

This simulation was performed in a steady state with a fixed flow velocity, assuming a flow velocity of 20 m/s [47]. The velocity inclination at the inlet velocity of boundary conditions accounts for the relative inclination between the torpedo and the flow (as shown in Figure 5). Hence, it is essential to assign these values to the solver:
  • Inlet settings: To accurately account for the effect of fluid on the torpedo anchor when tilted, the water velocity in the inlet region can be expressed as:
    v x = v i · sin θ
    v z = v i · cos θ
    where v x , v z are the velocity of the fluid in the x direction and z direction, respectively, v i is fluid velocity (− 20   m / s ), and θ  denotes inclination angle.
  • Outlet settings: The condition is set on the downstream surface, located at the top of the domain, where the relative pressure is assumed to be zero.
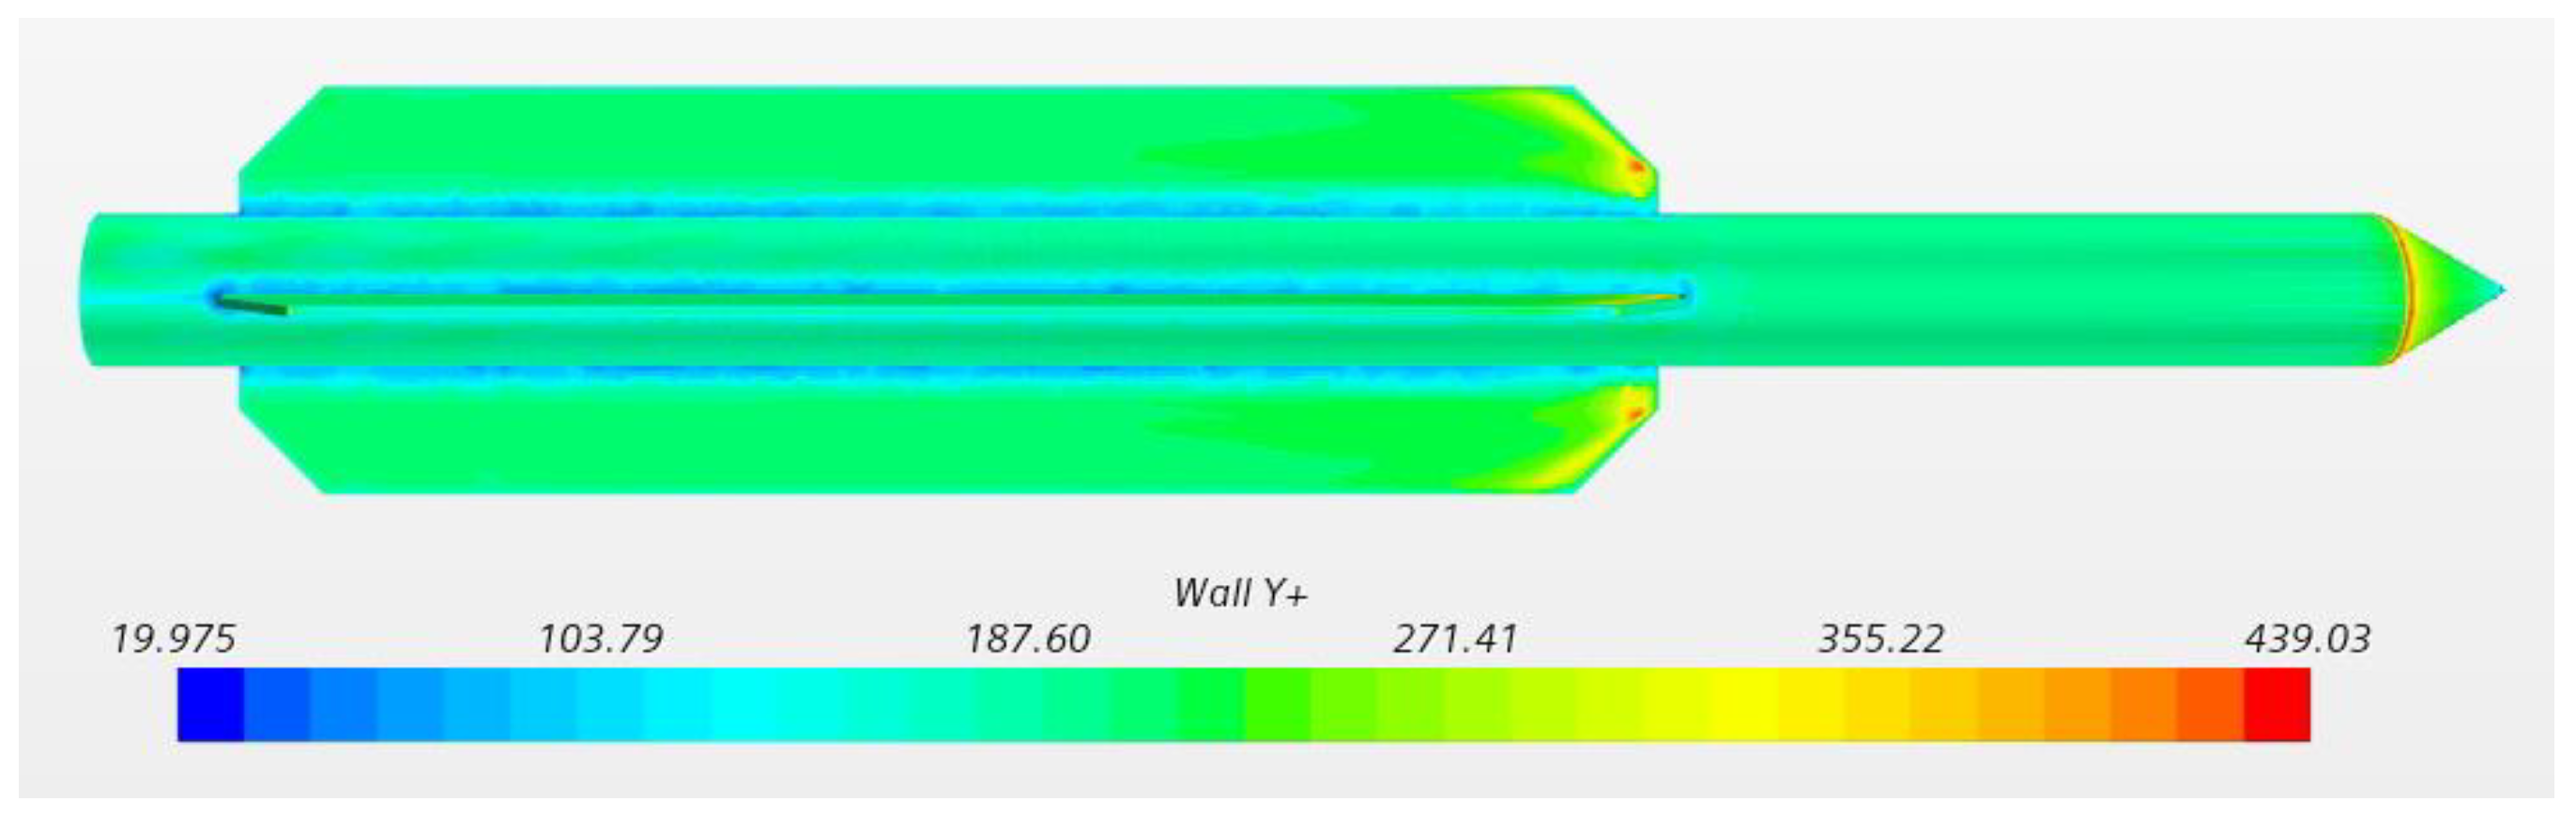
  • Torpedo surface settings: The torpedo surface is treated as a smooth wall, ensuring no tangential or normal velocities are present.
This study employs a static model to analyze the drag coefficient and directional stability of the torpedo anchor, utilizing the software STAR-CCM+ 2402 [48]. The movement of the torpedo anchor in water is simplified by fixing the anchor in position and allowing fluid within the computational domain to flow around it at the specified velocity. Figure 5 presents a schematic of the static model and mesh configuration. The 3 D computational domain measures 2 L  in length, 2 L in width, and 4 L in height, where L = 17   m and represents the length of the torpedo. The dimensions of the torpedo anchor are based on values from the reference [19] and are detailed in Table 1. In the model, the torpedo anchor is fixed in the x z plane with an initial inclination angle ranging from 15 ° to 15 ° . Fluid flows into the bottom of the computational domain and flows out from the top of the domain. The top (outlet) boundary condition is set to z e r o relative pressure, while the side wall boundary condition is configured as a moving wall with the same velocity as the inlet. This study also incorporates a volume grid surrounding the torpedo anchor, designed to reduce computation time while ensuring accurate results.

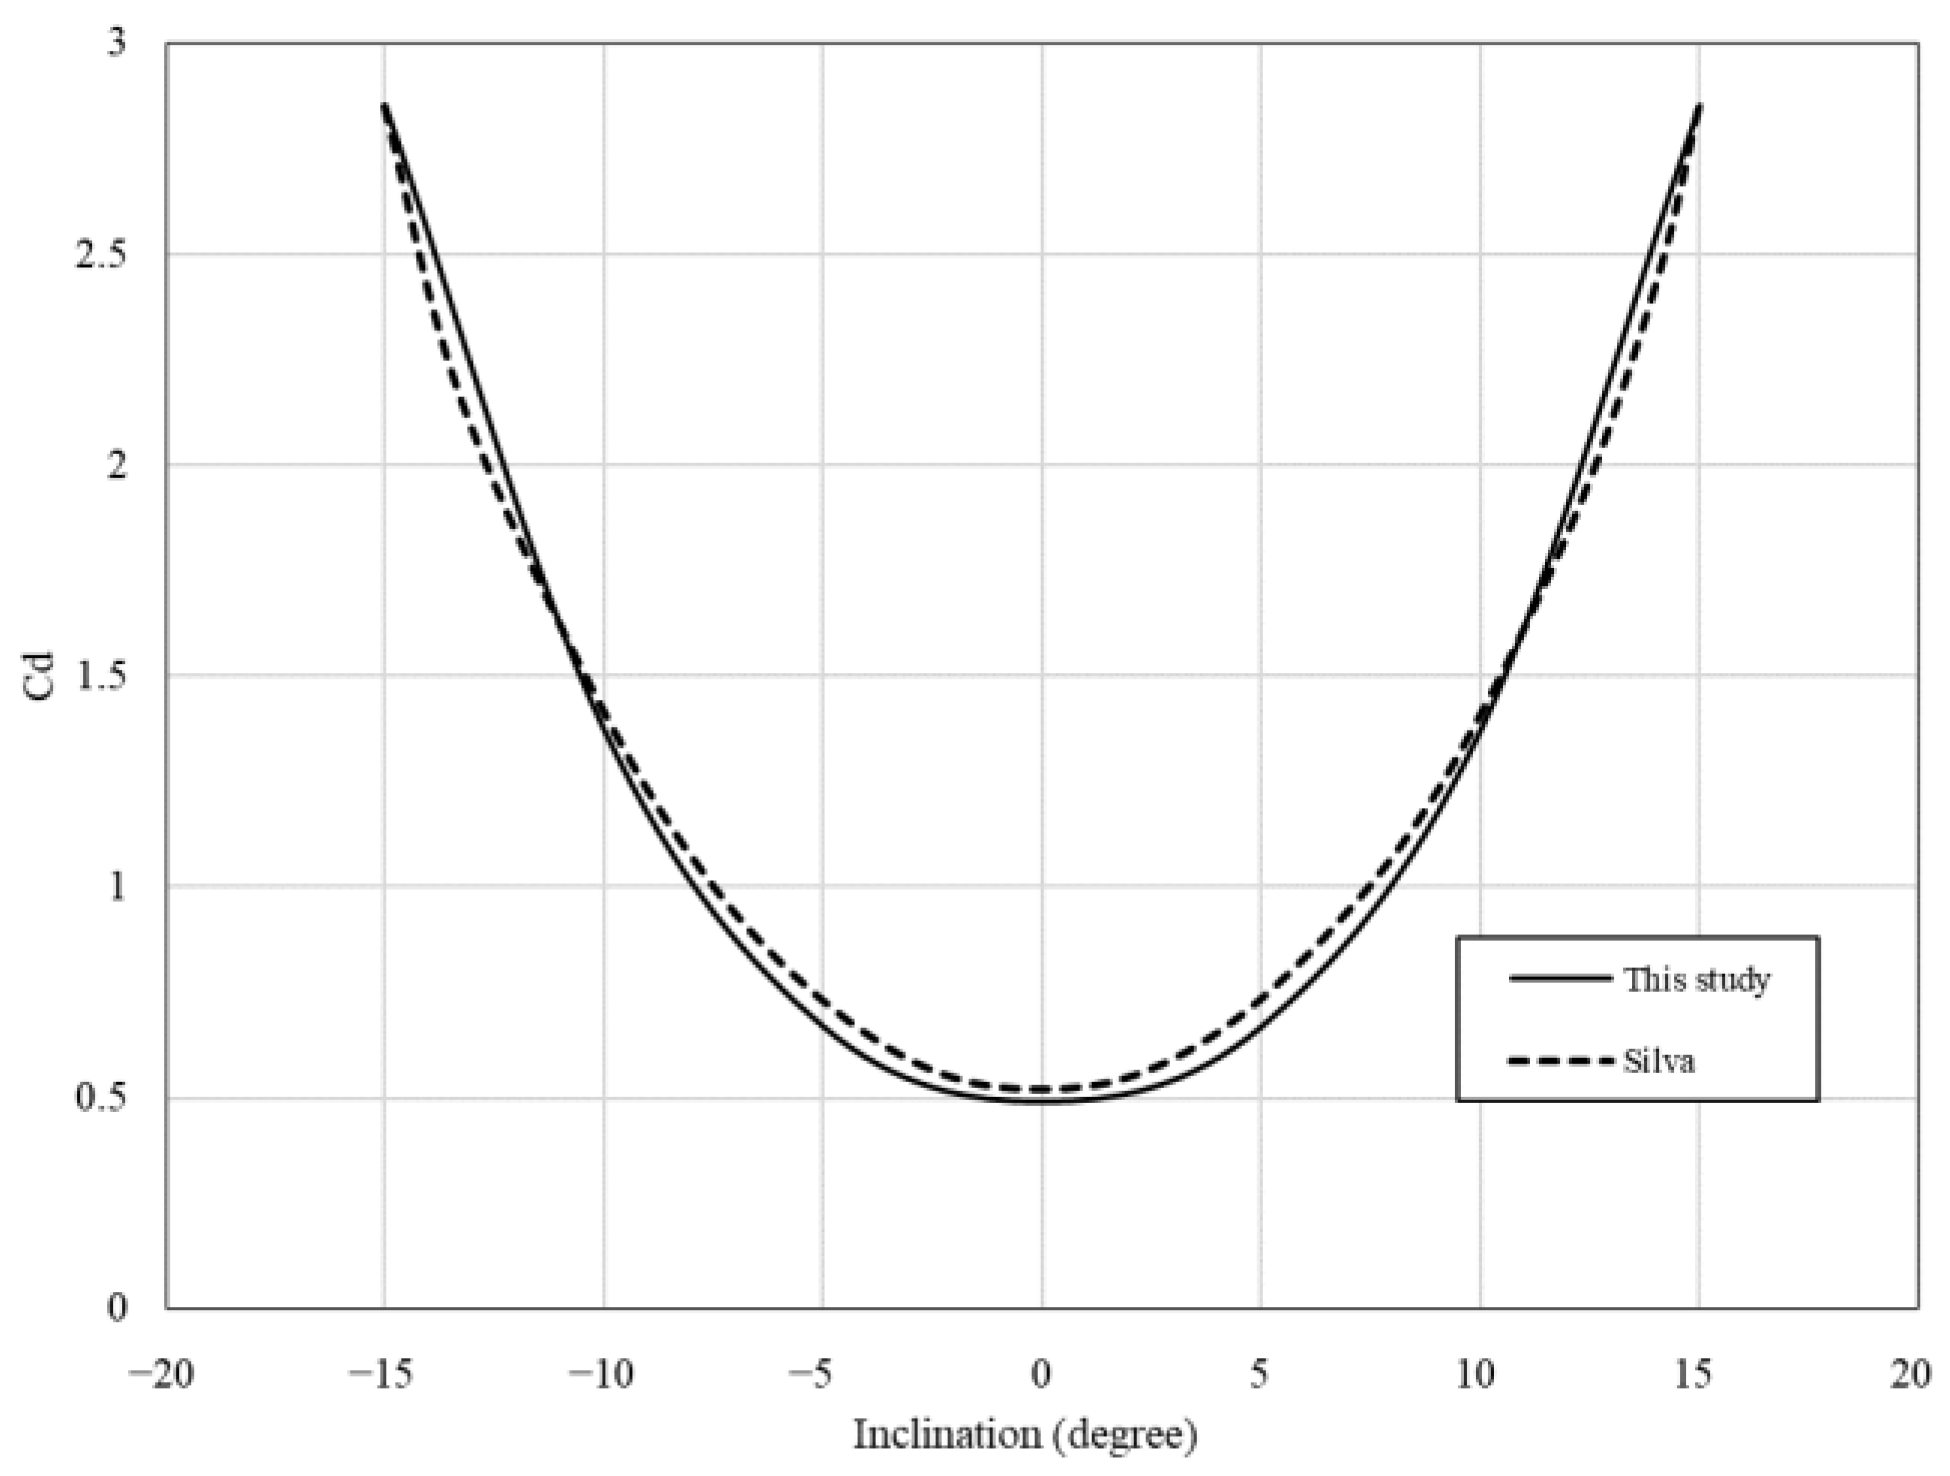
3.3. Convergence Study and Validation

A torpedo anchor, with dimensions specified in Table 1 and no tilt, was selected for the convergence study. Figure 6 illustrates the investigation, which ranged from 10,000 to 4,500,000 cells (control volumes) to estimate the torpedo anchor’s drag coefficient ( C d ). The results for the drag coefficient converged at approximately 2,600,000 cells, which was chosen for our numerical study.
To ensure the reliability of the results, the CFD numerical model in this study was validated through convergence studies, wall y + analysis, and comparison with existing literature. The model employs wall function validation by modeling the near-wall region [49]. Wall functions are empirically derived equations that describe the physics of this region and are based on the universal law of the wall, which posits that the velocity distribution near the wall is similar for most turbulent flows. Schlichting and Gersten [50] indicates that a key parameter for assessing the suitability of wall functions is the dimensionless wall distance ( y + ) :
y + = y u r ν
where u r , y , and ν are the frictional velocity, absolute distance from the wall, and kinematic viscosity, respectively. The wall functions concept was initially proposed by Launder and Spalding [49]. The fundamental idea is to apply additional boundary conditions at a certain distance from the wall to satisfy the Logarithmic Law (log-law) of the boundary layer. According to ANSYS Fluent report [51], the first grid point (the location of the first computational cell closest to the wall) must be positioned within the log-law region of the boundary layer, and the first grid point should meet the condition 30 < y + < 300 .
Accurate results in CFD require careful meshing of the boundary layer, particularly near the wall. The dimensionless parameter y + represents the distance from the wall to the first grid point. For reliable outcomes, the first grid point should ideally fall within the log-law region of the boundary layer, where 30 < y + < 300 .
In Figure 7, the y + values for the first grid point range from 19 to 439 . While some areas fall outside the recommended range, the majority of values are within acceptable limits. Despite these deviations, the overall validation of the numerical model remains strong. The use of wall functions still effectively simulates turbulent flows in this context, especially considering the complex geometry and practical meshing constraints of the model.

3.4. CFD Model Results

We have calculated the relationship between the drag coefficient and the inclination angle using the CFD model, as shown in Figure 8. This study compared the drag coefficient of T-98 in the vertical direction with the results found in Silva [47]. The data showed a difference of approximately 5 % , indicating that the calculation results are of reference value. From Figure 8, we can see that as the inclination angle of T-98 exceeds 5 degrees, the resistance increases rapidly and reduces the impact velocity. Therefore, excessive inclination angles should be avoided as much as possible.
This study assumes that the initial gravity center (CG) of T-98 is located at 1 / 2 of the total length ( 8.5 m away from the tip). Curves for the moment coefficients ( C m ) can also be extracted from this simulation. The moment coefficients can be written as:
C m = M 1 2 ρ s A p v 2 L f ,
where M , ρ s , A p , v , and L f are the moment by CFD model, water density of 1000   k g / m 3 , anchor’s projected area of 1.15   m 2 , flow velocity of 20   m / s , and fin length of 10   m , respectively. We can obtain inclination with respect to C m using the CFD model, as shown in Figure 9. The inclination angle increases, and the C m exhibits similar behavior, with the absolute value of the C m rising at higher inclination angles. For the current reference coordinates, the inclination angle and C m have the same sign; hydrodynamic effects will cause the torpedo to incline at a larger angle. It signifies torpedo instability when the data are in the first or third quadrant. In contrast, data in the second or fourth quadrant indicate stability, as the hydrodynamic forces help restore the torpedo to a vertical orientation. In other words, assuming the torpedo has a tilt angle of + θ (clockwise angle), a clockwise moment will increase the inclination angle, indicating instability in the first and third quadrants. Conversely, a counterclockwise moment will decrease the inclination angle, indicating stability in the second and fourth quadrants. Thus, for directional stability, the C m should be in the second and fourth quadrants.
This figure (Figure 9) shows that when the gravity center of T-98 is at half its length (CG = 8.5), it fails to meet stability requirements. To investigate the anchor’s stability concerning the center of gravity, we adjusted the gravity center position from 6.5   m to 9.5   m , with the results presented in Figure 10. We can see that the torpedo anchor becomes more unstable as the gravity center moves farther from the tip (larger CG). Our numerical results show that a stable state is reached when the initial gravity center position of T-98 is adjusted downward by 1   m ( C G = 7.5 ). After analyzing the directional stability of T-98, the obtained gravity center position must be practical for application. Medeiros [16] indicates that the materials inside the torpedo anchor are primarily scrap chains and concrete. The configuration of these materials is a critical factor to consider in achieving the required directional stability.

3.5. Theoretical Prediction of Pullout Capacity

The penetration behavior of a torpedo anchor in clay can be predicted using Equation (13) for the pull-out capacity detailed in Section 2.4.1. O’Loughlin et al. [46] used centrifuge testing to refine the calculation method for the rate or velocity-related term ( R f ) in Equation (13), and confirmed the validity of this formula through their research. Table 2 lists the soil properties with respect to depth z , for this example, as taken from [52]. The bearing factor ( N c ) is referenced from [53] with a value of 12 from centrifuge tests.
Brandão et al. details the relationship between the T-98’s penetration velocity, depth, and time in the seabed [19]. Figure 11 from Brandão et al. [19] displays the correlation between velocity and depth, indicating an impact velocity of approximately 26.8   m / s and a final penetration depth of 35.2   m . The pull-out capacity can be calculated by applying the parameter assumptions from Table 1 and Table 2 to Equation (13).
Figure 12 reveals that the holding capacity of the torpedo anchor is primarily derived from frictional resistance, which is approximately three times greater than the bearing resistance. The results, shown in this figure, indicate that the T-98 can provide a vertical resistance of approximately 4945   k N   ( W s F γ + F b + F f ) upon installation completion. Additionally, the holding capacity provided by the T-98 is about five times its net weight, demonstrating the torpedo anchor’s high anchoring efficiency.

4. Conclusions

This study primarily describes several common anchors, including driven piles, suction caissons, drag anchors, and torpedo anchors, which have been used for the station-keeping of large offshore structures. From the summary of Table 3, the following conclusions can be made:
  • Seabed Conditions:
    Driven piles and suction caissons offer the most predictable holding capacity. They can be reliably used in various types of soils.
    Drag anchors and torpedo anchors are suitable mainly for silt or clay seabed. Torpedo anchors may not work at all in seabed with sand layers.
  • Project Cost Perspective:
    Driven piles and suction caissons provide sufficient holding capacity, but require auxiliary installation tools, such as hydraulic pile hammers and ROVs. With proper calculations during the engineering stage, proof loading in the field can be waived.
    Drag anchors and torpedo anchors offer high anchoring efficiency and quick installation, and therefore cost less. However, they may not be able to provide the same high holding capacity as driven piles and suction caissons, which may be required by the mooring system of a very large floating structure. Additionally, the drag anchor must be proof loaded in the field.
In this study, the hydrodynamic behavior of the torpedo anchor was analyzed, emphasizing the need for ensuring directional stability during installation. The proposed CFD approach helps mitigate the challenges associated with configuring the gravity center. The directional stability of the T-98 torpedo anchor in practical use was analyzed. The findings indicate that stability can be achieved by positioning the center of gravity approximately 0.44  times the total length (CG = 0.44 × L ) from the tip. Additionally, the torpedo anchor can generate an anchoring force of up to five times its weight, demonstrating its practical effectiveness.

Author Contributions

Methodology, A.N.; Software, H.-C.C. and Y.-H.L.; Validation, K.-T.M.; Writing—original draft, H.-C.C. and A.N.; Writing—review & editing, Y.-H.L. and K.-T.M.; Supervision, K.-T.M. All authors have read and agreed to the published version of the manuscript.

Funding

This research was funded by National Science and Technology Council, grant number 111-3116-F-002-007, and Yushan Fellow Program, grant number 112V1005-3.

Institutional Review Board Statement

Not applicable.

Informed Consent Statement

Not applicable.

Data Availability Statement

The original contributions presented in the study are included in the article, further inquiries can be directed to the corresponding authors.

Conflicts of Interest

The authors declare no conflict of interest.

References

  1. Esteban, M.D.; Diez, J.J.; López, J.S.; Negro, V. Why offshore wind energy? Renew. Energy 2011, 36, 444–450. [Google Scholar] [CrossRef]
  2. Zheng, S.; Greaves, D.M.; Borthwick, A.G.L.; Meylan, M.H.; Zang, J.; Brocchini, M.; Liang, H. Recent advances in marine hydrodynamics. Phys. Fluids 2024, 36, 070402. [Google Scholar] [CrossRef]
  3. Possner, A.; Caldeira, K. Geophysical potential for wind energy over the open oceans. Proc. Natl. Acad. Sci. USA 2017, 114, 11338–11343. [Google Scholar] [CrossRef] [PubMed]
  4. Zheng, Z.; Chen, J.; Liang, H.; Zhao, Y.; Shao, Y. Hydrodynamic responses of a 6 MW spar-type floating offshore wind turbine in regular waves and uniform current. Fluids 2020, 5, 187. [Google Scholar] [CrossRef]
  5. Katsouris, G.; Marina, A. Cost Modelling of Floating Wind Farms; ECN: Petten, The Netherlands, 2016. [Google Scholar]
  6. Henderson, A.R.; Witcher, D. Floating offshore wind energy—A review of the current status and an assessment of the prospects. Wind. Eng. 2010, 34, 1–16. [Google Scholar] [CrossRef]
  7. Ma, K.T.; Luo, Y.; Kwan, C.T.T.; Wu, Y. Mooring System Engineering for Offshore Structures; Gulf Professional Publishing: Houston, TX, USA, 2019. [Google Scholar]
  8. Martinez, R.; Arnau, S.; Scullion, C.; Collins, P.; Neilson, R.D.; Kapitaniak, M. Variable buoyancy anchor deployment analysis for floating wind applications using a Marine Simulator. Ocean Eng. 2023, 285, 115417. [Google Scholar] [CrossRef]
  9. Jostad, H.P.; Andersen, K.H. Design of suction piles for offshore applications. In Analysis of Pile Foundations Subject to Static and Dynamic Loading; CRC Press: Boca Raton, FL, USA, 2021; pp. 107–129. [Google Scholar]
  10. Lee, J.; Aubeny, C.P. Lateral undrained capacity of a multiline ring anchor in clay. Int. J. Geomech. 2021, 21, 04021047. [Google Scholar] [CrossRef]
  11. Fu, D.; Zhou, Z.; Yan, Y.; Pradhan, D.L.; Hennig, J. A method to predict the torsional resistance of suction caisson with anti-rotation fins in clay. Mar. Struct. 2021, 75, 102866. [Google Scholar] [CrossRef]
  12. Chen, C.A.; Chen, K.H.; Igarashi, Y.; Chen, D.; Ma, K.T.; Lai, Z.Y. Design of Mooring System for a 15MW Semi-Submersible, TaidaFloat, in Taiwan Strait. In Proceedings of the International Conference on Offshore Mechanics and Arctic Engineering, Melbourne, Australia, 11–16 June 2023; American Society of Mechanical Engineers: New York, NY, USA. [Google Scholar]
  13. Sarker, B.R.; Faiz, T.I. Minimizing transportation and installation costs for turbines in offshore wind farms. Renew. Energy 2017, 101, 667–679. [Google Scholar] [CrossRef]
  14. Byrne, B.W.; Houlsby, G.T. Foundations for offshore wind turbines. Philosophical Transactions of the Royal Society of London. Ser. A Math. Phys. Eng. Sci. 2003, 361, 2909–2930. [Google Scholar] [CrossRef] [PubMed]
  15. de Araujo, J.B.; Machado, R.R.D.; de Medeiros, C.J., Jr. High holding power torpedo pile: Results for the first long term application. In Proceedings of the International Conference on Offshore Mechanics and Arctic Engineering, Vancouver, BC, Canada, 20–24 June 2004. [Google Scholar]
  16. Medeiros, C., Jr. Low cost anchor system for flexible risers in deep waters. In Proceedings of the Offshore Technology Conference, Houston, TX, USA, 6–9 May 2002; OTC: Boca Raton, FL, USA. [Google Scholar]
  17. O’Loughlin, C.; White, D.; Stanier, S. Novel anchoring solutions for FLNG-opportunities driven by scale. In Proceedings of the Offshore Technology Conference, Houston, TX, USA, 4–7 May 2015; OTC: Boca Raton, FL, USA. [Google Scholar]
  18. Triantafyllou, M.S.; Hover, F.S. Maneuvering and Control of Marine Vehicles; Massachusetts of Institute of Technology: Cambridge, MA, USA, 2003. [Google Scholar]
  19. Brandão, F.E.N.; Henriques, C.C.D.; Araújo, J.B.D.; Ferreira, O.C.G.; dos Santos Amaral, C. Albacora Leste field development-FPSO P-50 mooring system concept and installation. In Proceedings of the Offshore Technology Conference, Houston, TX, USA, 1–4 May 2006; OTC: Boca Raton, FL, USA. [Google Scholar]
  20. Cerfontaine, B.; White, D.; Kwa, K.; Gourvenec, S.; Knappett, J.; Brown, M. Anchor geotechnics for floating offshore wind: Current technologies and future innovations. Ocean Eng. 2023, 279, 114327. [Google Scholar] [CrossRef]
  21. Randolph, M.F.; Carter, J.; Wroth, C. Driven piles in clay—The effects of installation and subsequent consolidation. Geotechnique 1979, 29, 361–393. [Google Scholar] [CrossRef]
  22. Randolph, M.F.; Murphy, B. Shaft capacity of driven piles in clay. In Proceedings of the Offshore Technology Conference, Houston, TX, USA, 6–9 May 1985; OTC: Boca Raton, FL, USA. [Google Scholar]
  23. Würsig, B.; Greene, C., Jr.; Jefferson, T. Development of an air bubble curtain to reduce underwater noise of percussive piling. Mar. Environ. Res. 2000, 49, 79–93. [Google Scholar] [CrossRef] [PubMed]
  24. Townsend, W. Ichthys: From Challenge to Reality. In Proceedings of the Abu Dhabi International Petroleum Exhibition and Conference, Abu Dhabi, United Arab Emirates, 11–14 November 2012; SPE: Richardson, TX, USA. [Google Scholar]
  25. Kumar, B.R. Case 29: Ichthys LNG Project. In Project Finance: Structuring, Valuation and Risk Management for Major Projects; Springer: Berlin/Heidelberg, Germany, 2022; pp. 237–240. [Google Scholar]
  26. Erbrich, C.; Lam, S.Y.; Zhu, H.; Derache, A.; Sato, A.; Al-Showaiter, A. Geotechnical design of anchor piles for Ichthys CPF and FPSO. In Proceedings of the Offshore Site Investigation Geotechnics 8th International Conference Proceeding, London, UK, 12–14 September 2017; Society for Underwater Technology: Houston, TX, USA, 2017. [Google Scholar]
  27. Institute, A.P. Recommended Practice for Planning, Designing, and Constructing Fixed Offshore Platforms-Working Stress Design: Upstream Segment. In API Recommended Practice 2A-WSD (RP 2A-WSD): Errata and Supplement 1, December 2002; American Petroleum Institute: New York, NY, USA, 2000. [Google Scholar]
  28. Reese, L.C.; Van Impe, W.F. Single Piles and Pile Groups under Lateral Loading; CRC press: Boca Raton, FL, USA, 2000. [Google Scholar]
  29. American Bureau of Shipping. Guidance Notes on Design and Installation of Dynamically Installed Piles; American Bureau of Shipping: Houston, TX, USA, 2018. [Google Scholar]
  30. Sparrevik, P. Suction pile technology and installation in deep waters. In Proceedings of the Offshore Technology Conference, Houston, TX, USA, 6–9 May 2002; OTC: Boca Raton, FL, USA. [Google Scholar]
  31. Hogervorst, J. Field trails with large diameter suction piles. In Proceedings of the Offshore Technology Conference, Houston, TX, USA, 5–8 May 1980; OTC: Boca Raton, FL, USA. [Google Scholar]
  32. Tjelta, T.I. Suction piles: Their position and application today. In Proceedings of the ISOPE International Ocean and Polar Engineering Conference, Stavanger, Norway, 17–22 June 2001; ISOPE: Bristol, UK. [Google Scholar]
  33. Randolph, M.; House, A. Analysis of suction caisson capacity in clay. In Proceedings of the Offshore Technology Conference, Houston, TX, USA, 6–9 May 2002; OTC: Boca Raton, FL, USA. [Google Scholar]
  34. Senders, M.; Randolph, M.F. CPT-based method for the installation of suction caissons in sand. J. Geotech. Geoenvironmental Eng. 2009, 135, 14–25. [Google Scholar] [CrossRef]
  35. Steensen-Bach, J. Recent model tests with suction piles in clay and sand. In Proceedings of the Offshore Technology Conference, Houston, TX, USA, 4–7 May 1992; OTC: Boca Raton, FL, USA. [Google Scholar]
  36. Supachawarote, C. Inclined Load Capacity of Suction Caisson in Clay; University of Western Australia: Perth, Australia, 2006. [Google Scholar]
  37. Allersma, H.G.B.; Kirstein, A.A.; Brinkgreve RB, J.; Simon, T. Centrifuge and numerical modelling of horizontally loaded suction piles. In Proceedings of the ISOPE International Ocean and Polar Engineering Conference, Brest, France, 30 May–5 June 1999; ISOPE: Bristol, UK. [Google Scholar]
  38. Randolph, M.; Gourvenec, S. Offshore Geotechnical Engineering; CRC Press: Boca Raton, FL, USA, 2017. [Google Scholar]
  39. O’Neill, M.; Bransby, M.; Randolph, M. Drag anchor fluke soil interaction in clays. Can. Geotech. J. 2003, 40, 78–94. [Google Scholar] [CrossRef]
  40. Stewart, W. Drag embedment anchor performance prediction in soft soils. In Proceedings of the Offshore Technology Conference, Houston, TX, USA, 4–7 May 1992; OTC: Boca Raton, FL, USA. [Google Scholar]
  41. Aubeny, C.; Chi, C. Mechanics of drag embedment anchors in a soft seabed. J. Geotech. Geoenvironmental Eng. 2010, 136, 57–68. [Google Scholar] [CrossRef]
  42. Ozmutlu, S. Harnessing Offshore Mooring Experience and Anchoring Technology for the Floating Renewable Energy Systems. VRYHOF. 2018. Available online: https://www.kivi.nl/uploads/media/5ae711f5178c0/SOZ-KIVI%20lecture%20-%20Anchoring%20Technologies%20for%20FOWT%20by%20Vryhof%20Anchors.pdf (accessed on 25 September 2024).
  43. Neubecker, S.; Randolph, M. Profile and frictional capacity of embedded anchor chains. J. Geotech. Eng. 1995, 121, 797–803. [Google Scholar] [CrossRef]
  44. de Medeiros, C.J.; Hassui, L.H.; Machado, R.D. Pile for Anchoring Floating Structures and Process for Installing the Same. U.S. Patent No 6,106,199, 22 August 2000. [Google Scholar]
  45. O’Loughlin, C.; Randolph, M.; Richardson, M. Experimental and theoretical studies of deep penetrating anchors. In Proceedings of the Offshore Technology Conference, Houston, TX, USA, 3–6 May 2004; OTC: Boca Raton, FL, USA. [Google Scholar]
  46. O’Loughlin, C.; Richardson; Randolph, M.; Gaudin, C. Penetration of dynamically installed anchors in clay. Géotechnique 2013, 63, 909–919. [Google Scholar] [CrossRef]
  47. de Carvalho e Silva, D.F. CFD hydrodynamic analysis of a torpedo anchor directional stability. In Proceedings of the International Conference on Offshore Mechanics and Arctic Engineering, Honolulu, HI, USA, 16 February 2010. [Google Scholar]
  48. Simcenter STAR-CCM+, version 202X.Y; Siemens Industries Digital Software: Plano, TX, USA, 2024.
  49. Launder, B.E.; Spalding, D.B. The numerical computation of turbulent flows. In Numerical Prediction of Flow, Heat Transfer, Turbulence and Combustion; Elsevier: Amsterdam, The Netherlands, 1983; pp. 96–116. [Google Scholar]
  50. Schlichting, H.; Gersten, K. Boundary-Layer Theory; Springer: Berlin/Heidelberg, Germany, 2016. [Google Scholar]
  51. Fluent, A. Lecture 7: Turbulence Modeling; ANSYS: Canonsburg, PA, USA, 2014. [Google Scholar]
  52. Kim, Y.; Hossain, M.; Wang, D.; Randolph, M. Numerical investigation of dynamic installation of torpedo anchors in clay. Ocean Eng. 2015, 108, 820–832. [Google Scholar] [CrossRef]
  53. O’Loughlin, C.D.; Richardson, M.D.; Randolph, M.F. Centrifuge tests on dynamically installed anchors. In Proceedings of the International Conference on Offshore Mechanics and Arctic Engineering, Honolulu, Hawaii, USA, 31 May–6 June 2009. [Google Scholar]
  54. Viggiani, C.; Mandolini, A.; Russo, G. Piles and Pile Foundations; CRC Press: Boca Raton, FL, USA, 2014. [Google Scholar]
  55. Reese, L.C.; Beard, R.M. A design method for an anchor pile in a mooring system. In Proceedings of the Offshore Technology Conference, Houston, TX, USA, 27 April–1 May 1973; OTC: Boca Raton, FL, USA. [Google Scholar]
  56. Randolph, M.F.; Oneill, M.P.; Stewart, D.P.; Erbrich, C. Performance of suction anchors in fine-grained calcareous soils. In Proceedings of the Offshore Technology Conference, Houston, TX, USA, 4–7 May 1998; OTC: Boca Raton, FL, USA. [Google Scholar]
  57. Neubecker, S.; Randolph, M. The performance of drag anchor and chain systems in cohesive soil. Mar. Georesources Geotechnol. 1996, 14, 77–96. [Google Scholar] [CrossRef]
Figure 1. Schematic diagram of driven pile; (a) depicts the installation process, while (b) presents the force diagram acting on the driven pile anchor.
Jmse 12 01721 g001
Figure 2. Schematic diagram of suction caisson; (a) illustrates the installation process, and (b) shows the forces acting on the anchor.
Jmse 12 01721 g002
Figure 3. Schematic diagram of drag anchor; (a) shows the installation process, while (b) illustrates the force diagram acting on the drag anchor.
Jmse 12 01721 g003
Figure 4. Schematic diagram of torpedo anchor; (a) shows the installation process, while (b) illustrates the force diagram acting on the torpedo anchor.
Jmse 12 01721 g004
Figure 5. (a) Boundary condition and (b) mesh settings for directional stability analysis modeled with L = 17   m .
Jmse 12 01721 g005
Figure 6. Convergence studies of the number of cells.
Jmse 12 01721 g006
Figure 7. y + distribution on the torpedo anchor.
Jmse 12 01721 g007
Figure 8. Vertical drag coefficient of T-98 at different inclination angles [47].
Jmse 12 01721 g008
Figure 9. The physical meaning of the relationship diagram between C m and directional stability (CG = 8.5).
Jmse 12 01721 g009
Figure 10. C m at different gravity center positions.
Jmse 12 01721 g010
Figure 11. Predicting the relationship between penetration velocity and depth for T-98.
Jmse 12 01721 g011
Figure 12. Different components of penetration resistance.
Jmse 12 01721 g012
Table 1. Dimensions of the torpedo anchor.
TypeMass
( m , Tonne)
Diameter
(m)
Length
(m)
Fins
(m)
T-98981.071710 × 0.9
Table 2. Parametric assumptions for soil properties.
ParameterValue
Undrained   shear   strength   ( S u ) 5 + 2   z (kPa)
Effective unit weight 6   ( kN / m 3 )
Reference   shear   strain   rate   ( γ ˙ r e f ) 0.1   ( s 1 )
Strain-rate parameters ( λ ,   β )0.1, 0.05
Friction   factor   ( α )0.33
Table 3. Summary of the four commonly used anchors.
Anchor TypesRef.Example Projects and LocationsSuitable
Soil Types
Suitable Mooring SystemAs Shared AnchorAdvantagesDisadvantages
Drive pile[54,55]Ichthys LNG in AustraliaSand, Silt, ClayCatenary,
Taut leg
Suitable
  • Extensive range of applications and mature technology
  • Available capacity
  • Piling equipment required
  • Expensive to install
Suction caisson[30,56]FPU P-19 and P-26 in BrazilSand, Silt, ClayCatenary,
Taut leg
Suitable
  • Suitable for use at any water depth
  • Available capacity
  • Requires ROV assistance for installation
  • Expensive to install
Drag anchor[42,57]Hywind in Norway, WindFloat in Portugal, and Fukushima in JapanSilt, Clay, (Sand in some cases)Catenary onlyNot suitable
  • Exhibits a high anchoring efficiency
  • Cost-effective
  • Not suitable for dragging into hard soil
  • Difficult to accurately predict the installation location
Torpedo anchor[16,19]FPSO P-50 and many other FPSOs in BrazilSilt, ClayCatenary,
Taut leg
Not suitable, possible in certain cases
  • Quick installation
  • Cost-effective
  • Lack of installation experience outside of offshore Brazil
  • Sand layer can block the anchor penetration
  • Uncertainty in the anchor’s verticality
Disclaimer/Publisher’s Note: The statements, opinions and data contained in all publications are solely those of the individual author(s) and contributor(s) and not of MDPI and/or the editor(s). MDPI and/or the editor(s) disclaim responsibility for any injury to people or property resulting from any ideas, methods, instructions or products referred to in the content.

