Article

A Spatial–Temporal Analysis and Multi-Scenario Projections of Carbon Sequestration in Sea Islands: A Case Study of Pingtan Island

1
Island Research Center, Ministry of Natural Resources, Pingtan 350400, China
2
School of Marine Science and Engineering, Nanjing Normal University, Nanjing 210023, China
*
Author to whom correspondence should be addressed.
J. Mar. Sci. Eng. 2024, 12(10), 1745; https://doi.org/10.3390/jmse12101745
Submission received: 10 September 2024 / Revised: 24 September 2024 / Accepted: 25 September 2024 / Published: 3 October 2024
(This article belongs to the Section Marine Ecology)

Abstract

:
As an indispensable part of the marine ecosystem, the health status of the sea affects the stability and enhancement of the overall ecological function of the ocean. Clarifying the future land and sea utilization pattern and the impacts on the carbon stocks of island ecosystems is of great scientific value for maintaining marine ecological balance and promoting the sustainable development of the island ecosystem. Using Pingtan Island as an example, we simulate and predict changes in island utilization and carbon stocks for historical periods and multiple scenarios in 2030 via the PLUS-InVEST model and the marine biological carbon sink accounting method. The results show that (1) from 2006 to 2022, the carbon stock of Pingtan Island decreased by 7.218 × 10⁴ t, resulting in a cumulative economic loss of approximately USD 13.35 million; furthermore, from 2014 to 2018, the implementation of many reclamation and land reclamation projects led to a severe carbon stock loss of 6.634 × 10⁴ t. (2) By 2030, the projected carbon stock under the three different policy scenarios will be greater than that in 2022. The highest carbon stock of 595.373 × 10⁴ t will be found in the ecological protection scenario (EPS), which will be 4.270 × 10⁴ t more than that in 2022. With the strong carbon sequestration effect of the ocean, the total social carbon cost due to changes in island utilization is projected to decrease in 2030. (3) The factors driving changes in island utilization will vary in the design of different future scenarios. The results of this study not only provide a solid scientific basis for the sustainable development of island areas, but they also highlight the unique contribution of islands in the field of marine ecological conservation and carbon management, contributing to the realization of the dual-carbon goal.

1. Introduction

Islands, with their unique location, rich natural resources, and superior environmental endowments, serve not only as key geographic support points in sea areas but also as indispensable platforms for maintaining the health of the marine environment and safeguarding ecological balance [1]. In recent years, with the intensification of global climate change, carbon storage, as one of the important means of mitigating global climate change, has received extensive attention from the international community. As the world’s largest carbon sink, the oceans’ efficient carbon sequestration capacity is of great significance in maintaining the balance of the global carbon cycle. However, with increasing human activities and changes in the natural environment, the mechanism of marine carbon sequestration is affected by many factors. The variability in different habitat types [2], the increase in natural disasters [3], and changes in the carbon sequestration capacity of island ecosystems in response to anthropogenic and climatic disturbances [4] all affect the sequestration and release of marine carbon. Especially in island regions, the complexity and diversity of the interactions between the ocean and the land make the study of carbon sequestration on islands a great challenge.
China is a country with a vast sea area and a large number of islands, with more than 7000 islands with an area larger than 500 m2. Recently, islands’ spatial expandability and unique resource potential have become increasingly prominent, promoting the economic development of China’s coastal towns [5]. However, as bridges connecting land and sea [6], the special geographical location and dispersed spatial attributes of sea islands lead to their obvious ecological vulnerability and high sensitivity. With the continuous intensification of human development activities and environmental problems such as ocean acidification and sea level rise caused by global warming [7], the conflict between the development of island resources and ecological protection has become increasingly serious. Chinese scholars have conducted in-depth studies on land use changes on different islands, revealing the frequent and drastic conversion phenomenon between different island use types. With the continuous escalation of sea reclamation, China’s county-level and town-level islands are characterized mainly by a “land reclamation”–“urbanization and utilization” pattern [8]. For example, from 2010 to 2020, the area of cultivated land and forested land on Hainan Island lost a total of 446.85 km2 due to rapid urbanization [9].
However, different island utilization types have different carbon sequestration capacities [10,11]. With the intensification of human development activities, the conversion of different island utilization types has become more intense; these changes will inevitably impact the changes in the carbon stock of islands. For example, carbon stocks on Hainan Island decreased by approximately 1.50 Tg due to land use and land cover changes from 1992 to 2019 [12]. However, as a key component of the blue carbon sink, island ecosystems play crucial roles in the global carbon cycle [13]. Changes in carbon stocks in island ecosystems have far-reaching impacts on atmospheric CO2 concentrations and global ecosystem carbon stocks [6,8,13]. Currently, most studies on island utilization focus on island land, and few explore the impact of changes in island sea area utilization on island carbon stocks. Oceans play a strong role in regulating CO2, and estimates of only terrestrial carbon stocks on islands tend to underestimate the carbon sink capacity of island ecosystems. Therefore, in the context of global climate change, exploring the carbon sequestration mechanism of island ecosystems and evaluating their carbon sequestration potentials based on changes in the utilization of sea and land on islands will not only promote the ecological balance of China’s islands more comprehensively but also help to guide management departments in formulating relevant scientific carbon storage strategies and provide a certain scientific basis and reference for the global ocean carbon cycle management strategy [14].
Quantitative methods for determining regional ecosystem carbon stocks include sample surveys, model analysis, remote sensing estimation, and energy consumption carbon emission accounting [15,16]. The model estimation method is widely used by scholars and is based on the relationships among ecosystem vegetation, soil, and climate. The CA–Markov, CLUS-S, and FLUS models, coupled with the InVEST model, are widely used to forecast land use transitions and carbon stock variations across diverse scales [17,18,19]. The PLUS model retains the advantages of the CA model, which can calculate the development potential of different utilization types through the random forest algorithm, thus obtaining higher simulation accuracy and real landscape pattern indicators [19]. Furthermore, a combination of the PLUS model and the InVEST model has strong explanatory power and advantages at the spatial and temporal scales and can more accurately estimate the changes in the ecosystem carbon stock caused by changes in different utilization types. At present, few studies have been conducted on the coupling of the PLUS and InVEST models for island ecosystems in the context of land–sea integration. Moreover, owing to the extreme complexity of the ocean carbon cycle mechanism, few studies have attempted to accurately quantify ocean carbon stocks caused by ocean utilization changes; most have quantified carbon stocks in the whole ocean area via simple estimations. For example, Liu [20] used the remote sensing estimation method to estimate upper ocean organic carbon storage in the East China Sea. Yue [21] used the marine biological accounting method to account for the carbon sinks of marine organisms. Atwood et al. [22] used a modeling method to quantify the global carbon stocks in marine sediments. The use of marine biological accounting methods and remote sensing estimation methods has increased because they require fewer data and are relatively simple; thus, these methods are convenient for calculating marine carbon sinks in areas with limited data.
Overall, islands are typical areas of land–sea influence, and we should conduct a comprehensive carbon stock change assessment for island ecosystems. Owing to the special geographic location of islands and the difficulty of obtaining relevant data, few studies have been conducted on carbon stock changes in island ecosystems; in particular, the effects of alterations in various sea use patterns on the carbon stock of island ecosystems have not been comprehensively addressed. While islands are important platforms for the development of marine resources, their ecological environment is fragile. If human development activities are not scientific or rational, they will irreversibly harm the islands. Pingtan Island has a poor natural environment and is a typical ecologically fragile zone in which economic development is largely dependent on the marine economy. As Pingtan Island has become an international tourist island, the intensity of human development activities has been increasing. The continuous advancement of reclamation projects and aquaculture activities has resulted in the continuous conversion of land and sea resources on Pingtan Island, which will inevitably lead to great changes in carbon stocks [23]. Therefore, this study innovatively takes the land area and sea area of the islands as a whole and constructs a carbon stock accounting model for the change in the utilization of the sea and land of the islands. We aim to conduct an in-depth analysis of the impact of the spatiotemporal changes in land and sea utilization patterns on the carbon storage of Pingtan Island and to evaluate the carbon sequestration potential resulting from changes in island utilization. This study will not only provide a scientific basis for quantifying carbon storage in China’s islands but also serve as an important reference for global low-carbon development strategies in island regions. In the context of global climate change and increasingly severe carbon emissions, the results of this study may be expected to provide scientific decisions for relevant management authorities and to contribute to the study of global marine carbon storage to realize global sustainable development.

2. Materials and Methods
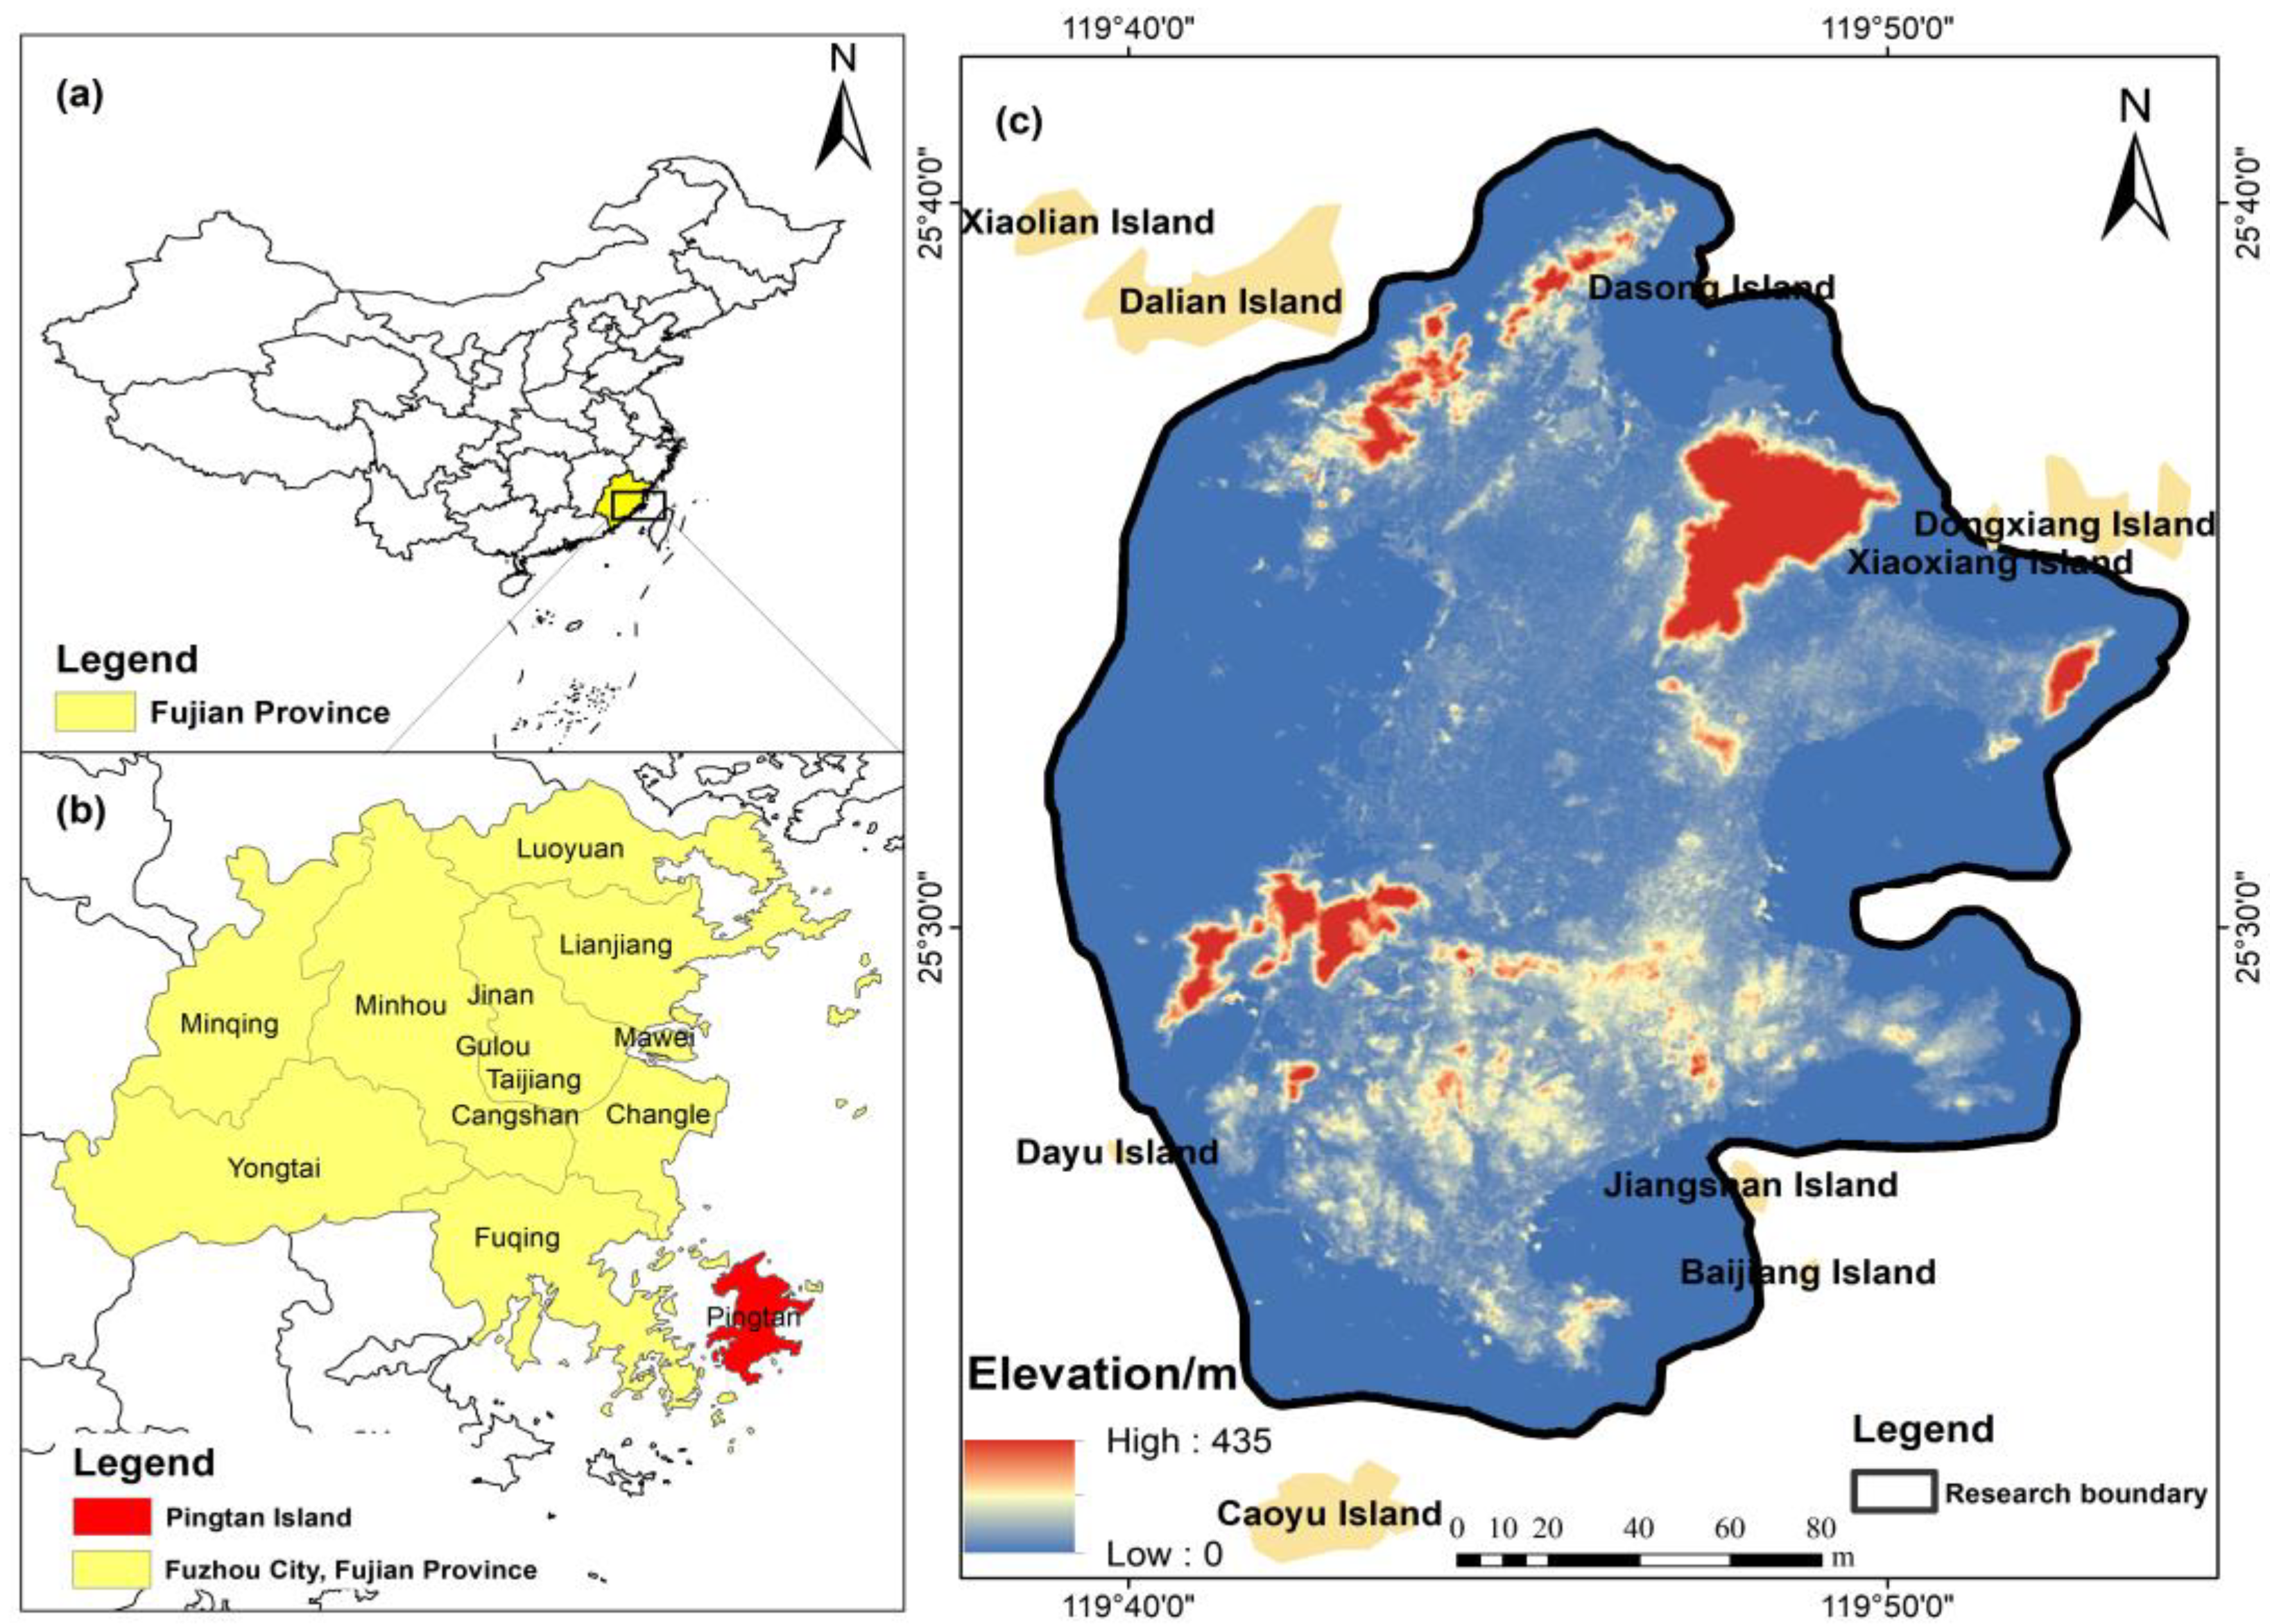
2.1. Study Area

Pingtan Island, also known as Haitan Island, is the fifth largest island in China and is located off the coast of southeastern China. Pingtan Island has a land area of approximately 278 km2 (Figure 1). Its geographical position is between 119°32′–120°10′ E and 25°15′–25°45′ N. Pingtan Island has a subtropical maritime monsoon climate, with an average annual temperature of 19.5 °C and an average annual precipitation of 1196.2 mm. Pingtan Island relies heavily on mariculture for its economic development [24], with shellfish aquaculture and algae aquaculture accounting for more than 90% of its mariculture industry. Since Pingtan Island became an international tourism island, the urbanization process on Pingtan Island has gradually intensified, and the continuous advancement of human development activities such as land reclamation has led to significant conversion between the internal resources of the island and the land and sea resources. Pingtan Island is a continental island, which is an island where the mainland extends to the seabed and then emerges from the sea due to the local subsidence of the crust or sea level rise [25]. Large fault changes in the topography of the sea area of an island usually indicate that its geological structure is characterized by factors such as submarine crust fracture and plate activity. According to the chart of the sea area where Pingtan Island is located, the actual situation of Pingtan Island is combined with the deep-water topographic features of the waters to determine a demarcation line on the basis of obvious changes in the topographic slope; this line is used as the boundary of the sea area (Figure 1).

2.2. Data Acquisition and Preprocessing

The land use data for Pingtan Island for the years 2006, 2010, 2014, 2018, and 2022 were obtained from the Data Center for Resources and Environmental Sciences, Chinese Academy of Sciences (http://www.resdc.cn/, accessed on 1 March 2024), with a resolution of 30 m. Remote sensing images during these five years and mariculture map layers were obtained from the Island Research Center of the Ministry of Natural Resources; the multiyear aquatic fishery data were obtained from the Pingtan Yearbook 2015–2022 [26]. In accordance with the research requirements and practical circumstances of Pingtan Island, remote sensing images were combined with relevant mariculture survey data via ArcGIS 10.8 software to obtain island utilization data. This not only improved the accuracy and timeliness of island utilization data but also provided strong data support for island resource management and sustainable development planning. Specifically, for the land area of the island, the utilization data of the land area of the island were combined with remote sensing images for visual interpretation and reclassification; ultimately, the land area of Pingtan Island was classified into seven categories: cultivated land, woodland, grassland, unused land, construction land, land water bodies, and wetland. For the sea area of the island, existing mariculture survey data were combined with visual interpretations of the five remote sensing images, and field investigations were conducted on uncertain aquaculture types; ultimately, the sea areas utilized on Pingtan Island were classified as shellfish farming areas, algal farming areas, integrated farming areas, and unused sea areas.
In this study, by integrating existing research with Pingtan Island’s unique context, 10 driving factors were selected from natural and socioeconomic factors (Table 1) [16,27]. Concurrently, the data were uniformly preprocessed according to the format requirements of the PLUS model; the spatial resolution of the data was 30 m raster data, and the geographic coordinate system was GCS_WGS_1984.

2.3. Method

This study used the PLUS model, InVEST model, and marine carbon sink accounting model to estimate historical and future carbon storage. The research objectives of this study were as follows: (1) exploring the current status of land and sea use changes on Pingtan Island from 2006 to 2022; (2) using the PLUS model to simulate the land and sea use changes on Pingtan Island in 2030 under the three development scenarios of the natural development scenario, economic development scenario, and ecological preservation; and (3) using the InVEST model and the marine carbon sink accounting model to simulate the change in carbon storage on Pingtan Island from 2006 to 2022 and forecast the change in carbon storage under three scenarios for 2030 to comprehensively assess the carbon effect of the island’s ecosystem.

2.3.1. Dynamic Degree of Island Utilization

The dynamic attitude index can reflect the difference in the velocity of alterations and the intensity of different utilization types in the study area [15,28]. A single land use type dynamic degree model was used to explore the dynamic changes in each type of area on Pingtan Island; the calculation formula is given below:
K = U b U a U a × T 1
where Ua and Ub represent the areas of the island utilization type at the beginning and end of this study, respectively (km2); T represents the study period in years; and K represents the annual average change rate of an island utilization type during the study period.

2.3.2. PLUS Model

The PLUS model can simulate regional utilization type changes and analytical decisions of each utilization type expansion at the patch level and consists of the land expansion analysis strategy (LEAS) and the cellular automata model (CARS) [29,30]. Using the random forest algorithm, the LEAS module obtains not only the expansion probability of each land use type but also the contribution of each driver to the expansion of each land use type during that period. In addition, the module retains the ability to analyze the mechanisms of land use change and to better explain land use change and nonlinear relationships with potential drivers [16,31,32,33]. Overall, the PLUS model is able to analyze the expansion of island use types on Pingtan Island from 2006 to 2022 with a patch-level land use simulation model using the LEAS module, estimate the island use demand on Pingtan Island up to 2030 via the Markov chain algorithm, and ultimately accurately simulate and predict the future demand for island use under different future scenarios set up via the CARS module.
First, we must assess the suitability of the model for the study area. The kappa coefficient enables a quantitative evaluation of the accuracy and applicability of the PLUS model in predicting land use types. The larger the kappa coefficient is, the greater the likelihood that the PLUS model will predict future land use types under different scenarios. In this study, the island utilization data from 2014 and 2018 were input into the PLUS model, and the output island utilization simulation data from 2022 were compared with the actual island utilization data from 2022 to verify its accuracy. The results revealed that the kappa coefficient was 0.929, and the overall accuracy was 0.947, indicating that the simulation was good and reliable [34].

2.3.3. Multi-Scenario Setting

In this study, three scenarios were established by referring to the relevant literature [16,35] and formulating conversion rules and conversion rates for increasing and decreasing island utilization categories, which were based on the actual situation of Pingtan Island.
(1) Natural development scenario (NDS): The island utilization change in this scenario continues the past pattern of island utilization change and is not subject to any policy influence [36]. On the basis of the transition probability matrix of island utilization changes from 2006 to 2022, the area requirements for 2030 were calculated via the Markov chain in the PLUS model [30].
(2) Ecological protection scenario (EPS): According to the requirements of the strict implementation of green ecological protection in the Master Plan of Pingtan County Comprehensive Pilot Area (2010–2030) and reference to the relevant literature [37,38], the possibility of converting woodland into construction land is reduced by 50%; the possibility of converting construction land into woodland is increased by 30%; and the land water, ecological protection red line zones, and nature reserves are set as restricted development zones.
(3) Economic development scenario (EDS): This scenario reflects the trend in land use changes in recent years to promote the construction of international tourism islands and ecological protection; by referring to the relevant literature [37,39] and considering the actual demand, the possibility of converting cultivated land, woodland, and unutilized land to construction land increased by 20%, and construction land was not converted to other types of island use.
The three scenarios have different emphases. The NDS emphasizes following past trends without policy intervention, the EPS stresses the reduction in human-made development and construction activities and the enhancement in ecological protection and restoration, and the EDS prioritizes the conversion of built-up land for tourism and economic growth.

2.3.4. InVEST Model

The InVEST model takes each land utilization type in the study area as an assessment unit and divides it into four components: aboveground biomass, belowground biomass, soil, and dead organic matter [40]. The carbon stock of each land utilization type can then be obtained by calculating the carbon density of these components [41,42,43]. This model is widely used in terrestrial ecosystems. In contrast to that in terrestrial ecosystems, the mechanism of the marine carbon cycle is extremely complex and is affected by many factors. It is difficult to classify marine ecosystems precisely according to the InVEST model. Benthic organisms and sediments occupy a central position in the marine carbon cycle; furthermore, the distribution of their carbon content varies significantly among the various types of cultured marine areas [44,45]. Sediment carbon stocks are large, accounting for 25% of global carbon and 91% of total ocean carbon [46,47]; marine sediment organic carbon is the ultimate effect of the ocean carbon sink [48]. As one of the most important groups of organisms in marine ecosystems, marine benthic organisms play a key role in carbon accumulation and regulation [49]. Therefore, in this study, the calculation was appropriately simplified, with a focus on assessing the benthic carbon stock and sediment organic carbon stock in the waters of Pingtan Island. Since the roots or structures of marine organisms and dead organic matter eventually accumulate in marine sediments [46,47], dead organic matter and the root system of marine organisms were temporarily disregarded. The specific calculation formula is as follows:
C i t = C a b o v e + C b e l o w + C s o i l + C d e a d
C = 0 7 ( S i × C i t )
C i t = C s e d + C b e n
C m i x = 0 4 ( S i × C i t )
where Cit is the total carbon density of island land use type i (t/ha); Cabove, Cbelow, Csoil, and Cdead are the aboveground biogenic carbon density (t/ha), belowground biogenic carbon density (t/ha), soil carbon density (t/ha), and dead organic matter carbon density of island land use type i (t/ha), respectively; C′ is the carbon stock of island land area (t); Si is the area of island sea area utilization type i (ha); C″it is the total carbon density of island sea area utilization type i (t/ha); Cben is the carbon density of the benthic organisms of island sea area utilization type i (t/ha); Csed is the carbon density of the sediments of island sea area utilization type i (t/ha); and Cmix is the carbon density of the carbon stock of benthic organisms and sediments in island waters (t).
For the land area of Pingtan Island, on the basis of the outcomes of previous studies, the carbon densities of relevant studies in Fujian Province were prioritized [50,51,52]. Some of the data were corrected by taking the average value, resulting in the value of the carbon density data for the land area of Pingtan Island (Table 2).
For the sea area of Pingtan Island, historical data and the literature were leveraged to prioritize research from southeastern coastal waters in the determination of the benthic biomass and sediment organic carbon content for different marine utilization types [44,46,48,55,56,57,58]. With the selection of appropriate carbon content ratios for benthic organisms [59] and sediment dry bulk densities [45], the carbon density of different types of utilization in the sea area of Pingtan Island was finally obtained (Table 3). Specifically, this study derived the corresponding benthic carbon density values on the basis of the methodology of Barnes et al. [49] by multiplying the average benthic biomass of each island marine use type by the average carbon content ratio. Similarly, the present study refers to the calculation method of related scholars [56,60] by multiplying the average content of sediment organic carbon of each island utilization type by the dry weight of the sediment, which can be used to derive the corresponding sediment organic carbon density.

2.3.5. Integrated Accounting of Island Carbon Stocks

In contrast to land, the ocean carbon cycle mechanism is very complex and involves biological pump processes, air–sea interface transfer (including solubility pumps), sedimentation, and fishery activities [54]. As one of the most basic biological pump mechanisms in marine ecosystems, marine phytoplankton constitute less than 1% of the total global vegetation biomass but account for 40% of the total global carbon sequestration, thus significantly affecting the carbon cycle [55]. Relevant studies have shown that phytoplankton carbon sequestration is closely related to sea area and that changes in the sea area of islands caused by human development activities have a significant effect on phytoplankton carbon sequestration [56]. The development of island fisheries is the most obvious example of the human exploitation of island waters; fishery shellfish and algae not only produce aquatic products but also have strong carbon sequestration capacities [57]. Phytoplankton and fishery organisms have become important parts of the ocean carbon cycle and biological carbon sinks [58]. When accounting for carbon stocks in island waters, we cannot ignore the carbon storage capacity of phytoplankton and fishery shellfish and algae. Accordingly, this study posits that the assessment of carbon stocks in island waters should incorporate the carbon sequestration capacity of marine organisms. The methodology for accounting for marine biological carbon sinks compensates for the inadequacy of using the InVEST model to calculate marine carbon stocks. The combination of the two will more comprehensively and accurately reflect the carbon balance of island seas under changes in island utilization.
C = C m i x + C p h y + C f i s
C = C + C
where C″ is the carbon stock in island waters (t); Cmix is the carbon stock in benthic organisms and sediments in island waters (t); Cphy is the carbon sink in phytoplankton in island waters (t); Cfis is the carbon sink in marine fisheries in island waters (t); and C is the carbon stock in the island (t).
(1)
Accounting for marine phytoplankton carbon sinks
The input of the marine phytoplankton carbon sink is actually the quantification of primary productivity; at present, the quantification of phytoplankton primary productivity is based mainly on the black-and-white bottle method, the isotope 14C tracer method, the chlorophyll a method [63], and the remote sensing modeling method [64]; the present study was conducted to quantify the phytoplankton carbon sink on the basis of remotely sensed chlorophyll a concentration data in the sea area of Pingtan Island from 2006 to 2022 by utilizing empirical formulas [65,66]. To predict phytoplankton carbon sinks in 2030 under different scenarios, the mean value of phytoplankton primary productivity in the sea area of Pingtan Island from 2006 to 2022 was selected for estimation in this study. The calculation formula is as follows:
C p h y = P × A × 365 × 3.67 × 10 3
where Cphy is the phytoplankton carbon sink, t/yr; P is the phytoplankton primary productivity, mg/(m2·d); A is the area of the research sea region, km2; and 3.67 is the amount of CO2 absorbed by phytoplankton for every 1 g of carbon fixed.
P = C × Q × E × D 2
where C is the chlorophyll content of the researched sea region; E is the depth of the euphotic zone, and the depth of the euphotic zone is 3 times the transparency. According to the combination of coastal data in Fujian Province, the average transparency is 1.78 m; Q is the assimilation coefficient, which is 3.7 mgC/mgchla·h; and D is the daytime duration on Pingtan Island, which is 12 h.
(2)
Accounting for marine fishery carbon sinks
In this study, mussels, oysters, razor clams, seaweed, and kelp were selected as the objects of marine carbon sink accounting. According to a survey of marine aquaculture in Pingtan County conducted by the Fujian Institute of Oceanography in 2021, the area of aquaculture in the sea around Pingtan Island accounts for 64% of aquaculture in the county. The Pingtan County Yearbook data from various years were combined, and the results revealed that aquaculture in Pingtan County is relatively homogenous in terms of species, with small differences in aquaculture among townships. The average annual unit aquaculture production and species in Pingtan Island and Pingtan County were assumed to remain consistent; thus, 0.64 was selected as the percentage of the average annual marine carbon sink capacity of Pingtan Island and Pingtan County.
C f i s = 0.64 × ( S 1 + S 2 )
where Cfis is the marine carbon sink of Pingtan Island, S1 is the carbon sequestration capacity of shellfish in Pingtan County, and S2 is the carbon sequestration capacity of algae in Pingtan County.
S 1 = ( C B j + C Z j )
C B j = P j × K j × N j × C F j
C Z j = P j × K j × N j × C F j
where CBj and CZj are the carbon sink capacities of the shells and soft tissues of the jth shellfish, respectively (g/yr); Pj is the biomass of the jth shellfish; Kj is the conversion coefficient between the wet weight and dry weight of the jth shellfish; Nj and Nj’ are the proportions of the dry masses of the shells and soft tissues in the jth shellfish, respectively (g/yr); and CFj and CFj’ are the ratios of the carbon contents in the shells and the soft tissues of the jth shellfish in the dry weight state, respectively.
S 2 = ( P i × K i × C F i )
where Pi is the biomass of the ith algal plant, Ki is the conversion coefficient between the wet and dry weights of the ith algal plant, and CFi is the carbon content ratio at the dry mass of the ith algal plant.
The wet weight-dry weight conversion coefficients, mass content-specific gravity, and carbon content-specific gravity of shellfish and algal organisms were determined on the basis of the relevant parameters of the Marine Carbon Sink Accounting Methodology [67] (Table 4).
Owing to missing aquatic fishery data for Pingtan County before 2013, aquatic fishery data from 2013 to 2022 were calculated to determine the linear relationship between the carbon sink capacity of the fishery on Pingtan Island and time. The formula was applied to calculate the fishery carbon sinks of Pingtan Island in 2006, 2010, and 2030. The formula is as follows:
y f i s = 71.25 + 0.036 x ( R 2 = 0.601 ,   p = 0.008 *** )
where yfis the carbon sink of fisheries in the sea area of Pingtan Island (×104 t); x is time (yr).

3. Results

3.1. Impact of Island Utilization on Carbon Stocks, 2000–2020

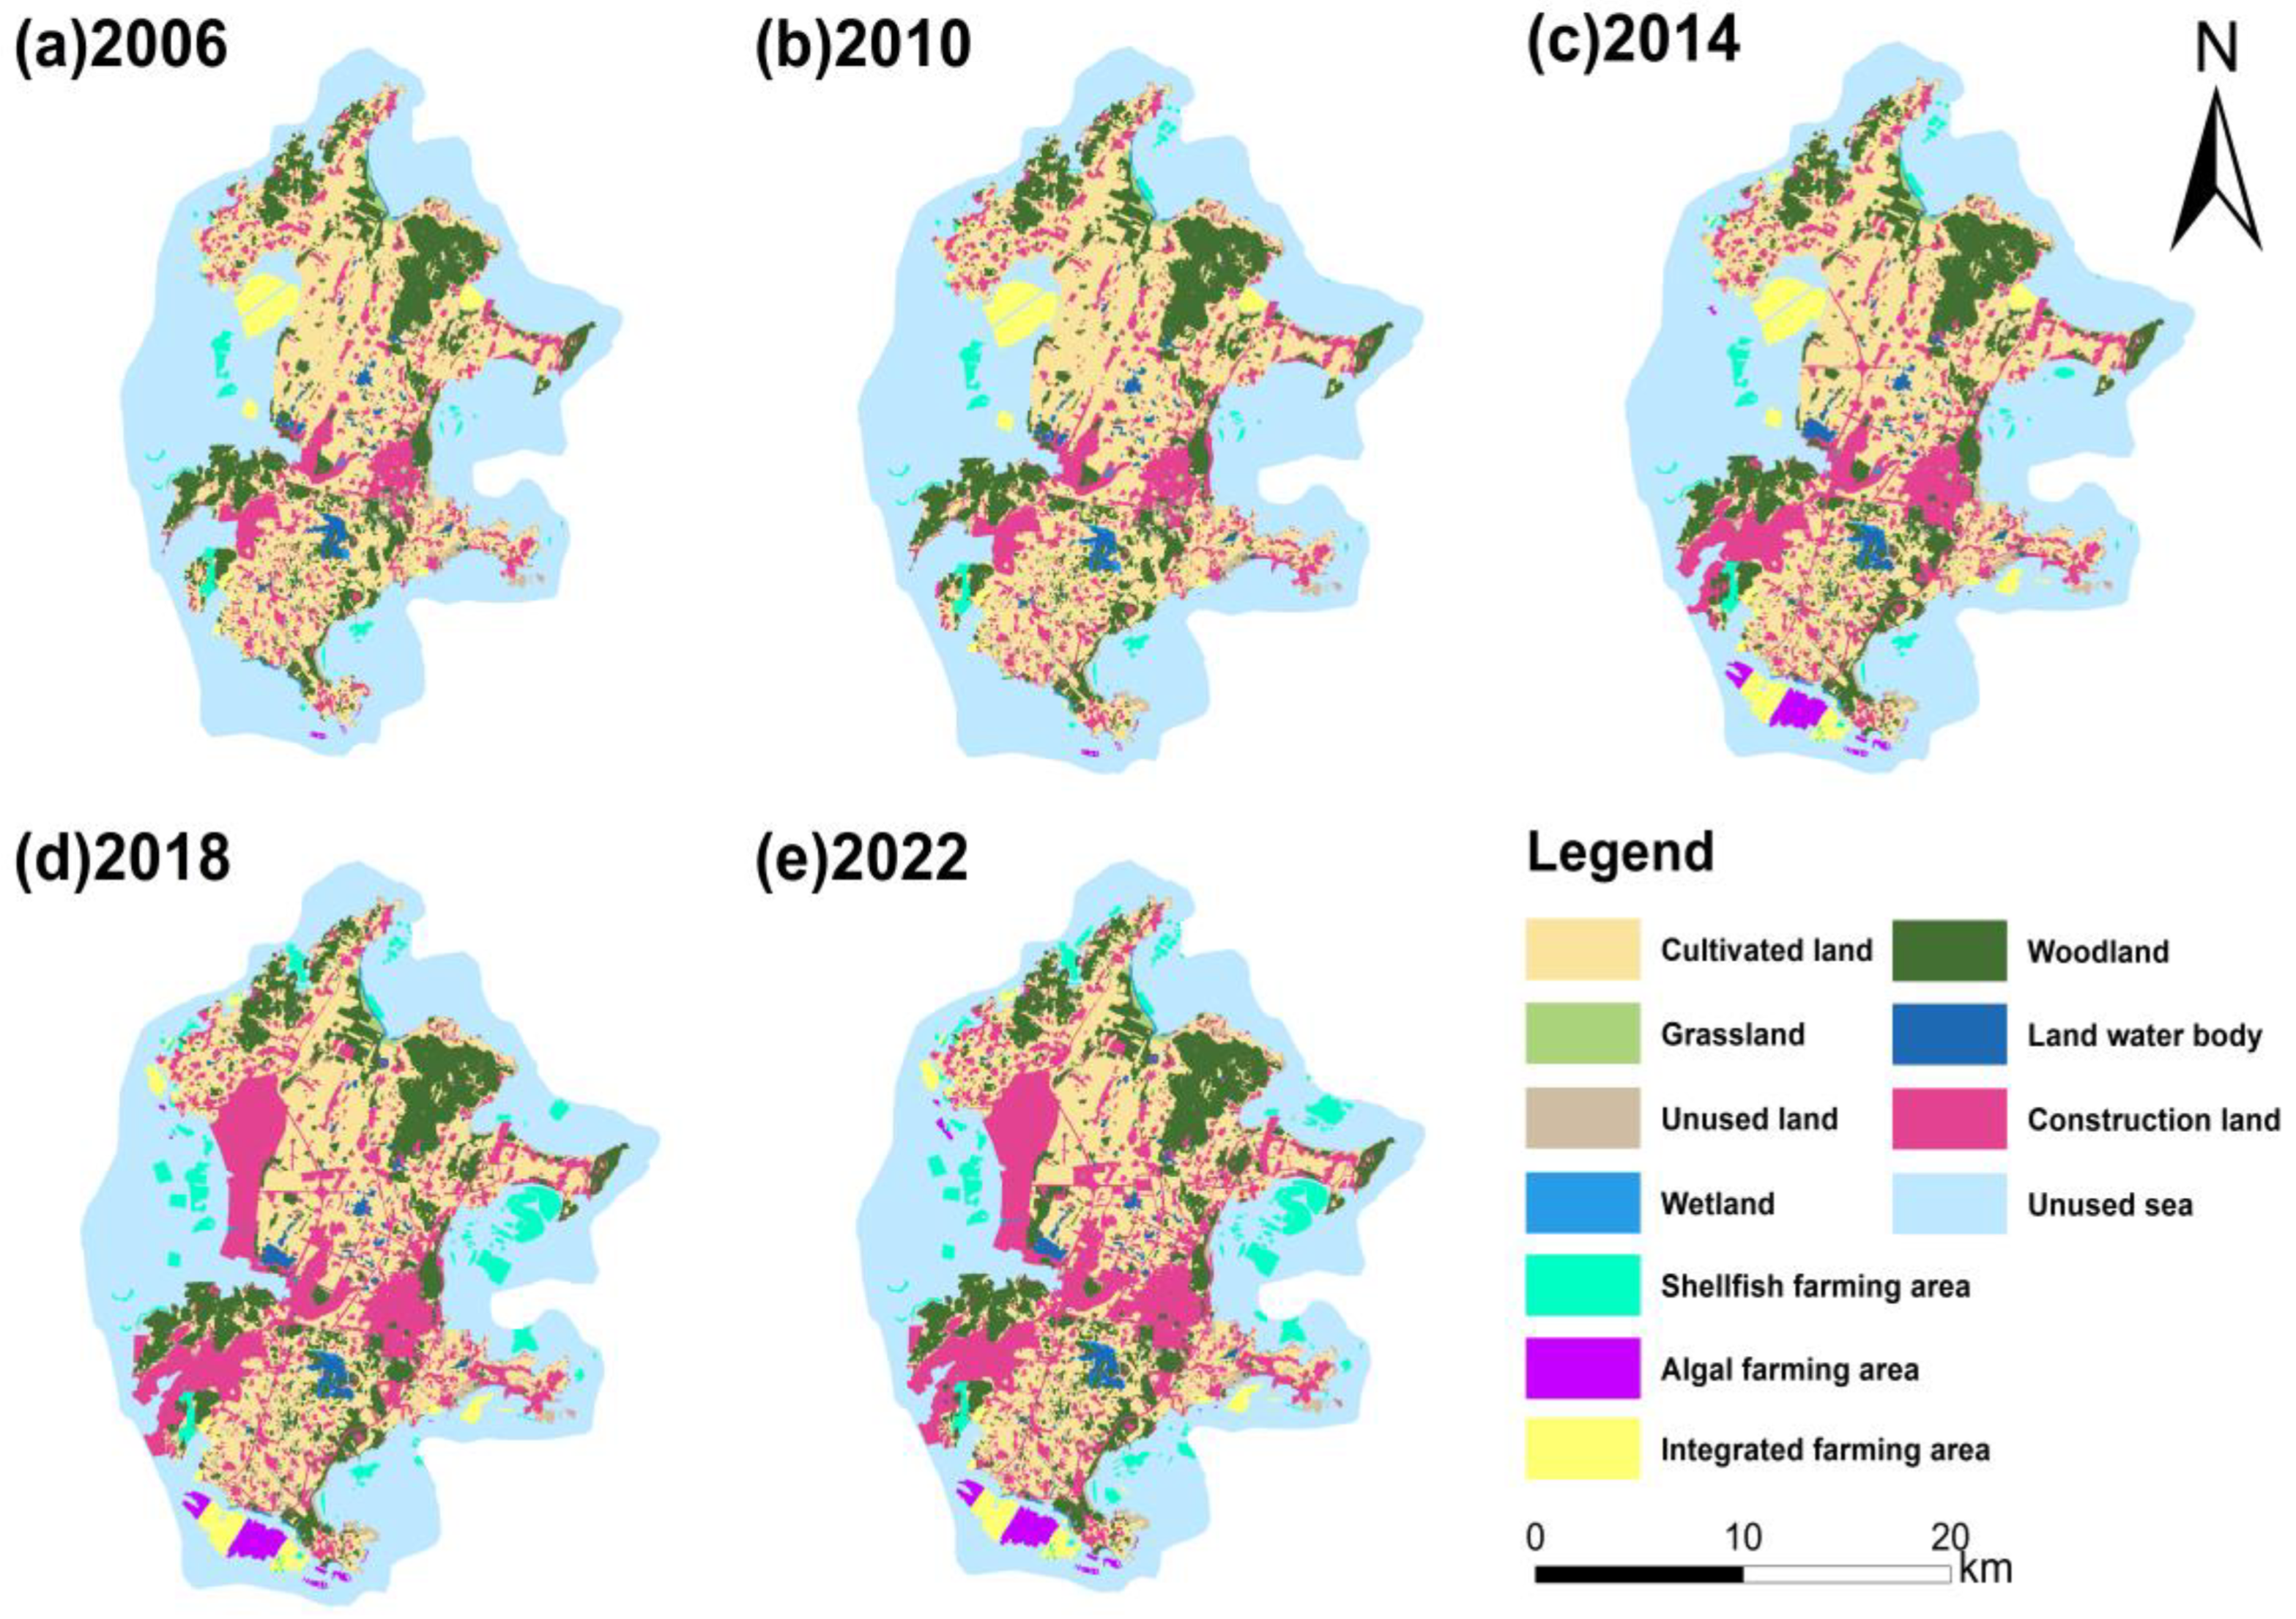
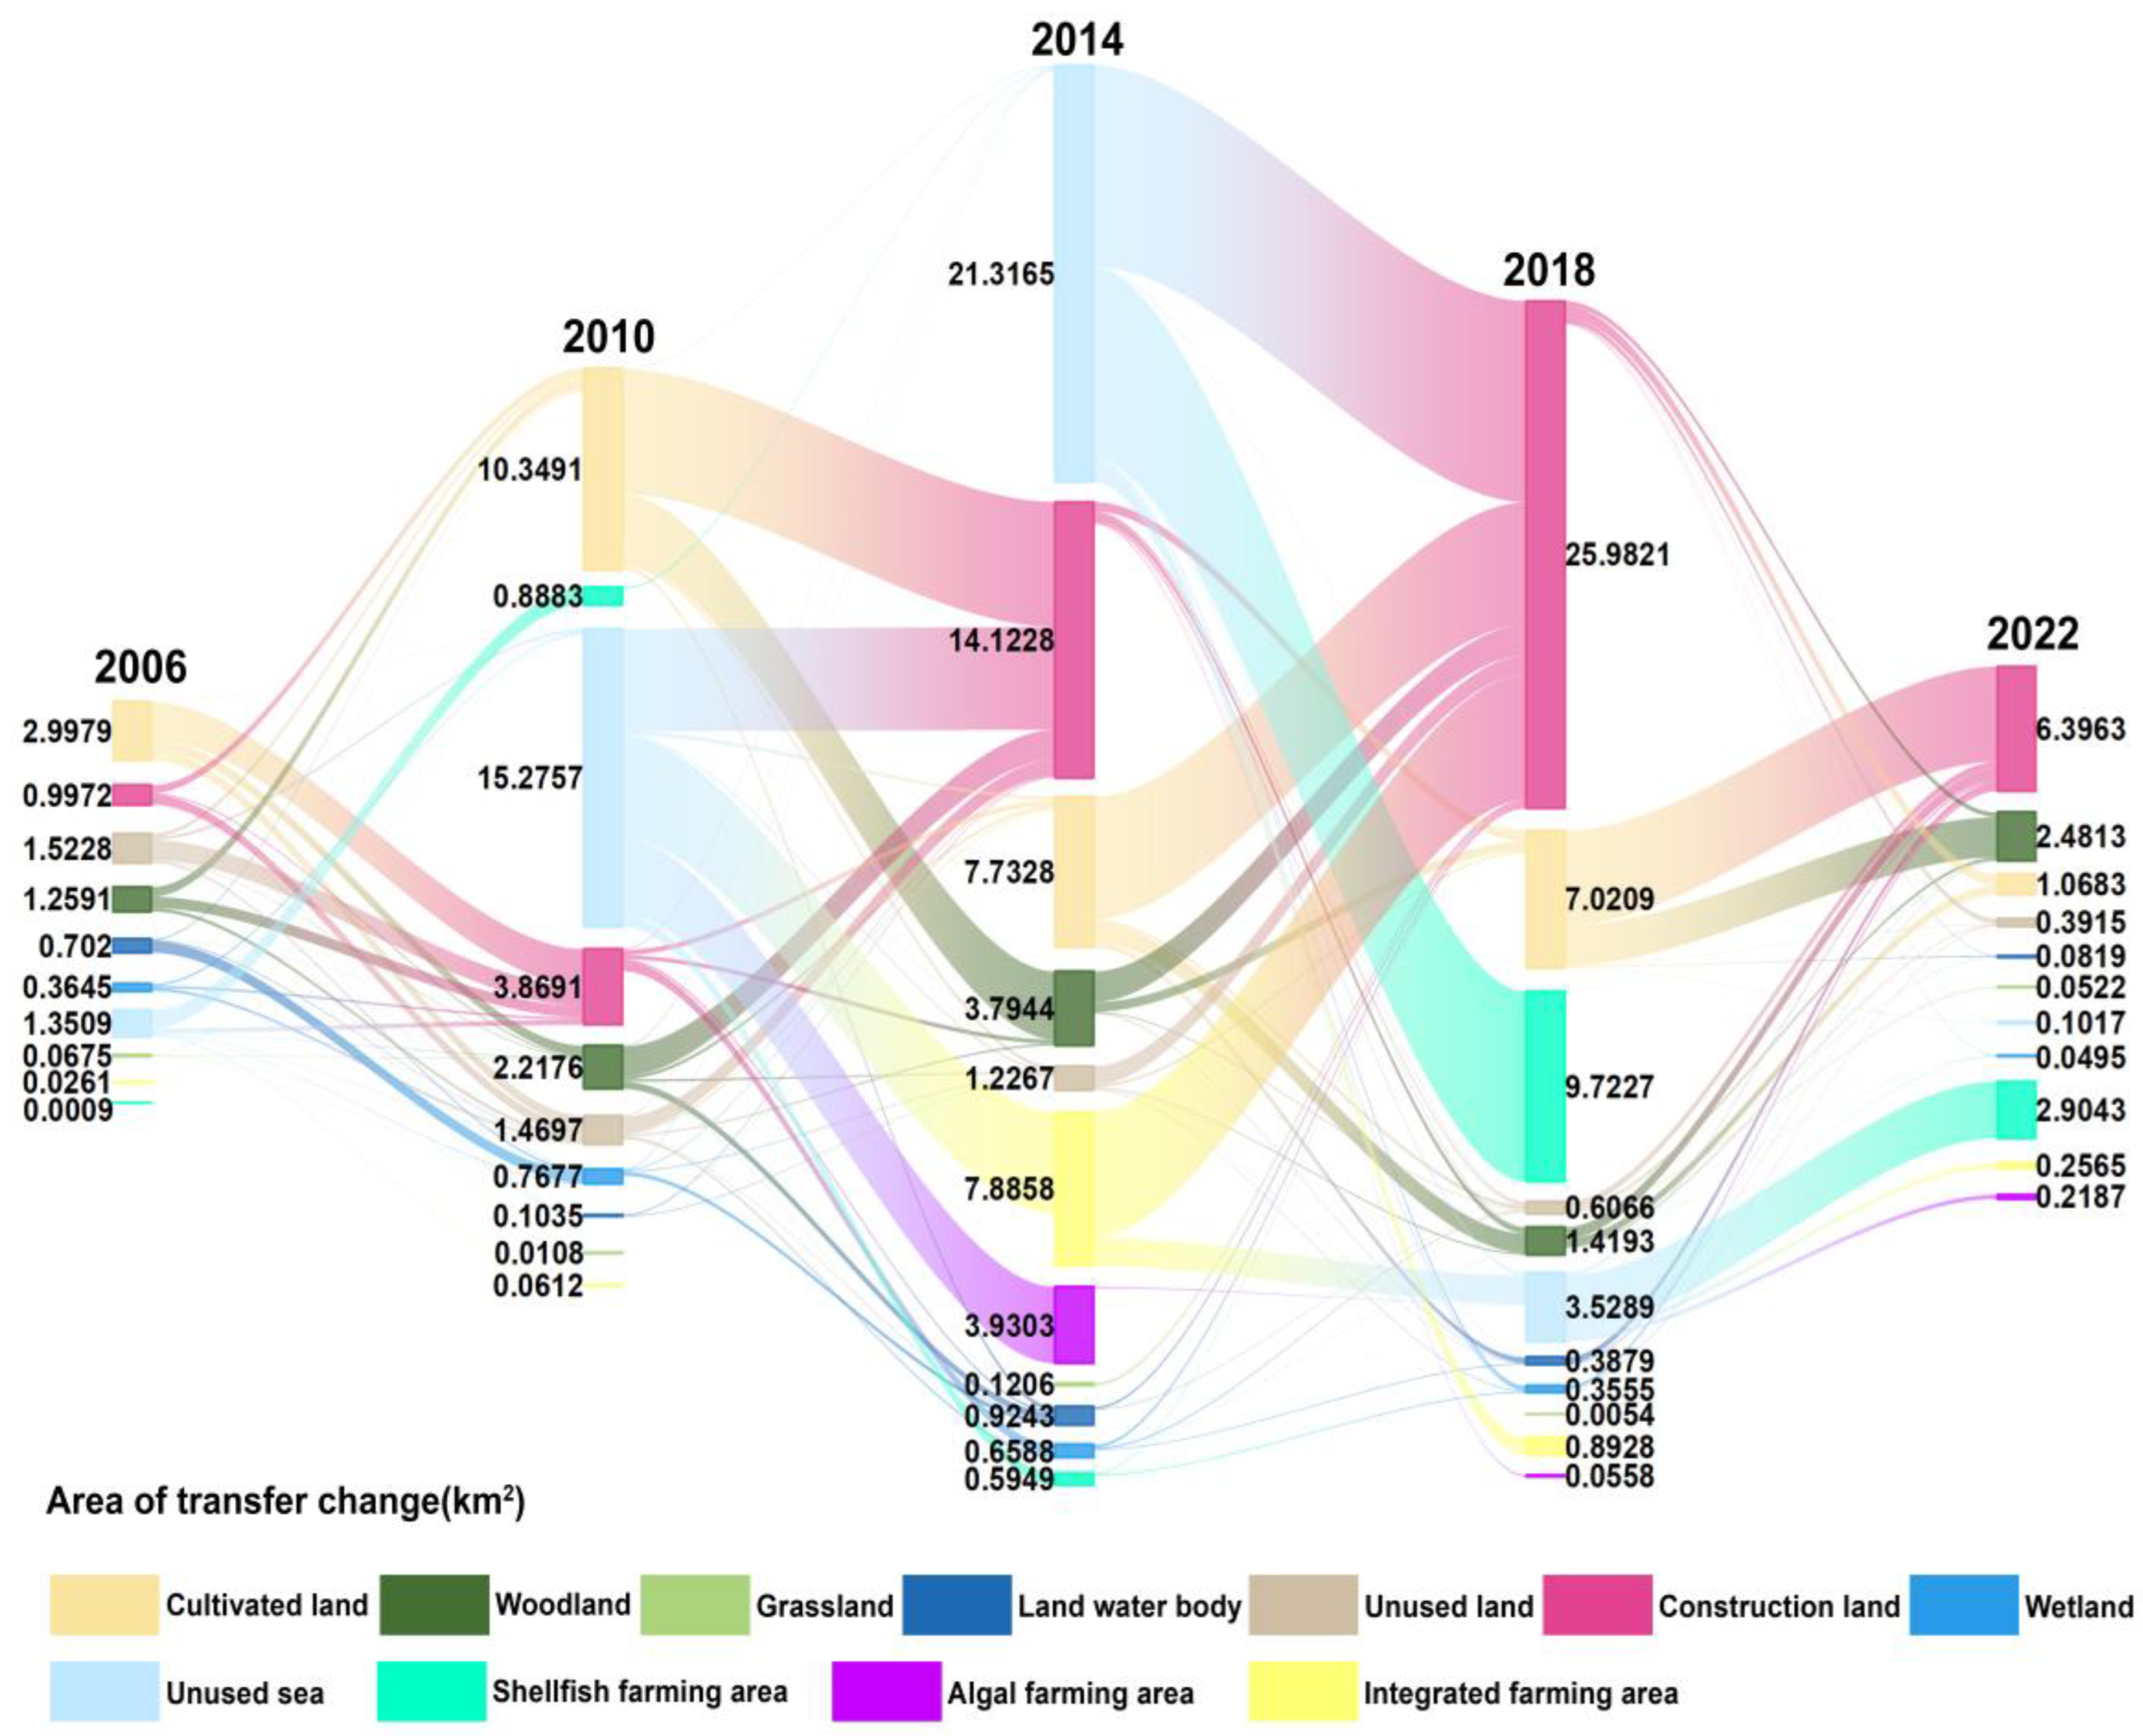
3.1.1. Island Utilization Changes from 2006 to 2022

Between 2006 and 2022, the land area of Pingtan Island changed considerably (Table 5, Figure 2); the area of cultivated land decreased by 23.99 km2 at an average annual rate of −5.46%, the area of unused land decreased by 1.184 km2, and the area of grassland decreased slightly (−0.11 km2). Moreover, construction land expanded significantly at an average annual growth rate of 12.76%, adding an area of 45.826 km2. In terms of sea area, unused sea area dominated, but the sea area for shellfish farming grew rapidly, with an average annual growth rate of 23.63%. In addition, the algae farming area increased by 4.148 km2. On the other hand, the integrated farming area and unused sea area decreased by 1.5 km2 and 39.074 km2, respectively. Overall, the construction of land and sea for shellfish farming was the most significant type of land and sea area increase.
Figure 3 illustrates the direction of transfer for each island utilization type. From 2006 to 2010, the primary sources of construction land expansion were cultivated land (1.9008 km2), woodland (0.5778 km2), and unused land (1.017 km2). Additionally, the marine areas of Pingtan Island remained relatively stable. From 2010 to 2014, construction land expansion was driven by cultivated land (6.4107 km2) and unused sea areas (5.2668 km2), marking the onset of land reclamation activities. Additionally, policies promoting afforestation led to the conversion of 3.4749 km2 of cultivated land to woodland. The increase in algae and integrated aquaculture areas reduced the area of unused sea by 9.1476 km2. Between 2014 and 2018, the island’s land use patterns underwent the most significant changes, primarily due to shifts in unused sea areas, cultivated land, and integrated farming areas. The increase in construction land area was caused by the decrease in the unutilized sea area (10.3005 km2), cultivated land area (4.8591 km2), and integrated farming area (6.4314 km2); the increase in shellfish farming area was derived mainly from the unutilized sea area (9.7227 km2). From 2018 to 2022, the rate of island use transition gradually decreased. Construction land expansion was attributed primarily to the conversion of 4.8591 km2 of cultivated land, whereas shellfish farming areas expanded by reclaiming 2.9043 km2 of unused sea areas.

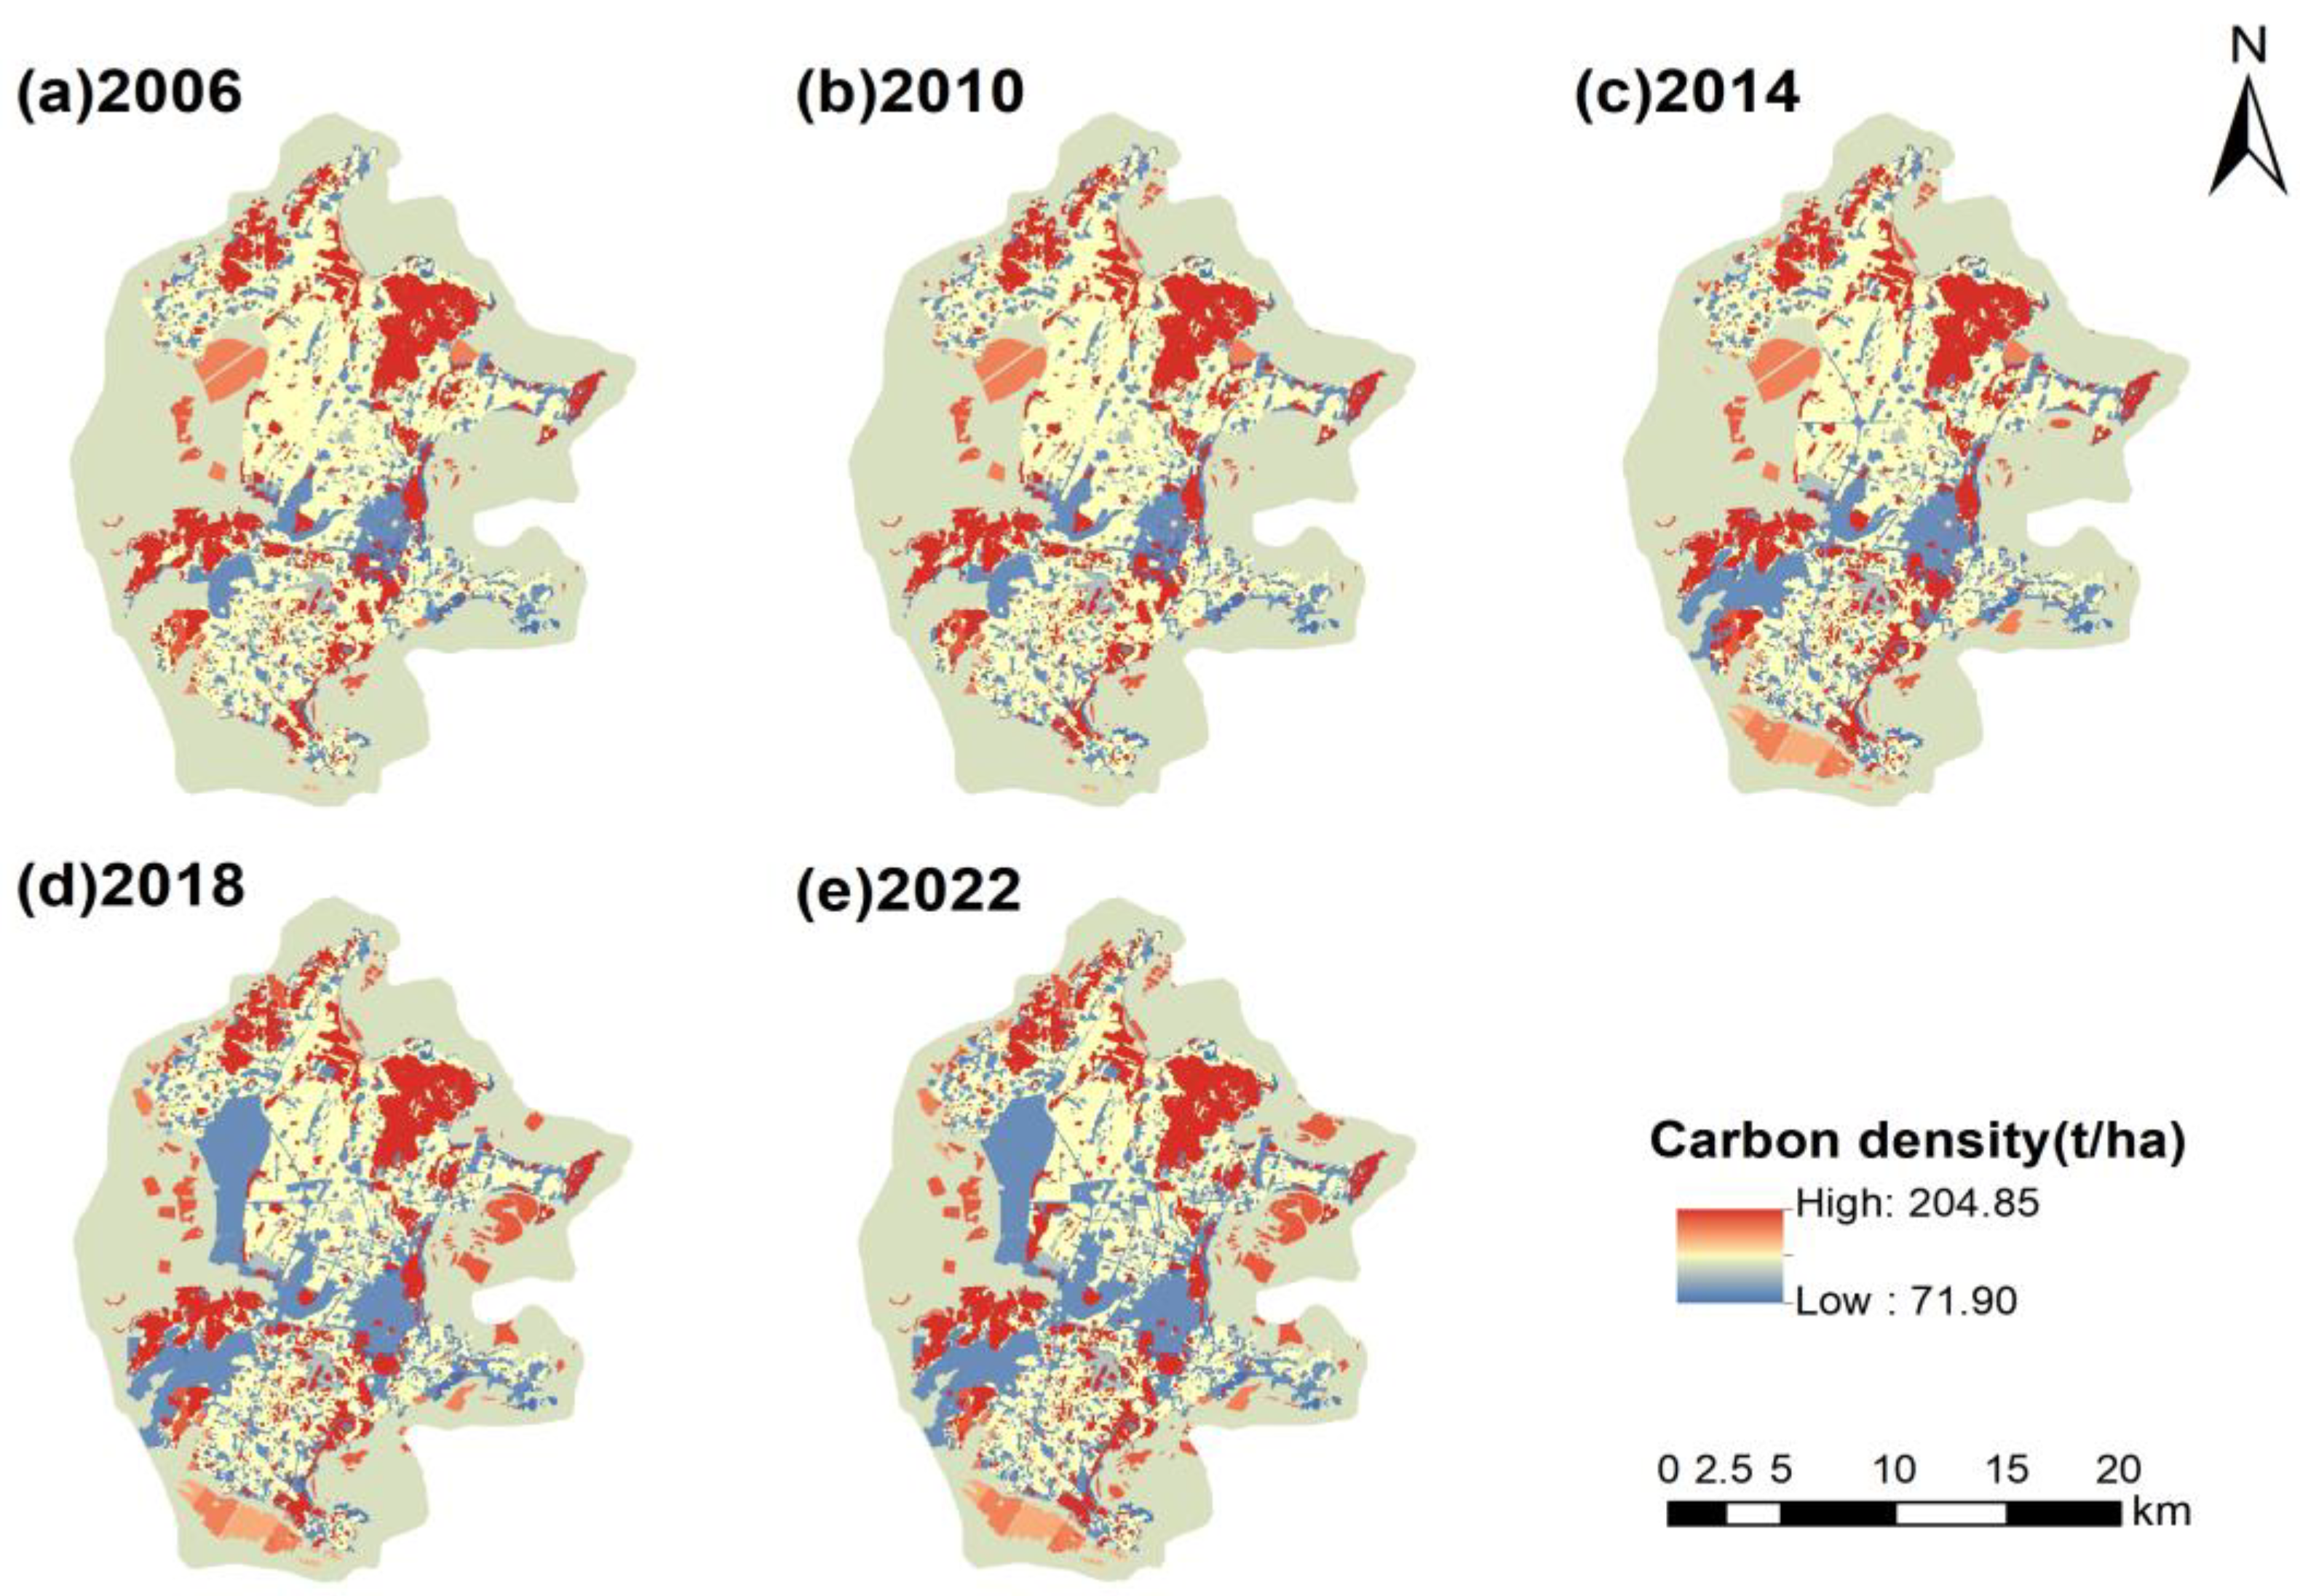
3.1.2. Island Carbon Stock Changes from 2006 to 2022

To understand the spatial distribution of and general trend in carbon stocks on Pingtan Island from 2006 to 2022, we assessed the spatial distribution of carbon density by island utilization type (Figure 4). The areas with higher carbon density are located mainly in the northern and southwestern regions of the landmass of Pingtan Island, which have high vegetation cover and higher elevation. The areas with lower carbon density are distributed mainly in the central and southern regions of the landmass of Pingtan Island, which consist mainly of construction land and cultivated land with frequent human activities. In the eastern, western, and southern parts of the sea area of Pingtan Island, the presence of sea farming has resulted in a significantly higher carbon stock in these regions than in other parts of the sea area. Table 6 reveals that the total carbon storage on Pingtan Island has significantly fluctuated (−7.218 × 10⁴ t) over the past 16 years. Specifically, during the periods of 2006–2010, 2010–2014, 2014–2018, and 2018–2022, the carbon storage of Pingtan Island decreased by 3.091 × 10⁴ t, increased by 1.122 × 10⁴ t, decreased by 6.634 × 10⁴ t, and increased by 1.385 × 10⁴ t, respectively.
Compositionally, the total carbon stock on Pingtan Island consists of the carbon stock in the land area of the island and the carbon stock in the sea area of the island (Table 6). For the terrestrial area, carbon storage exhibited a fluctuating upward trend, with an overall increase of 10.302 × 10⁴ t from 2006 to 2022. Specifically, the terrestrial carbon storage capacity of Pingtan Island reached a peak of 335.997 × 10⁴ t in 2018. In contrast, the marine carbon storage capacity of Pingtan Island exhibited a fluctuating downward trend, with a total decrease of 17.52 × 10⁴ t from 2006 to 2022. Specifically, the sea area of Pingtan Island had the highest carbon stock in 2006 (215.903 × 10⁴ t). The components of the carbon stock in the sea area of Pingtan Island were further analyzed. The sedimentary and benthic carbon storage decreased overall by 14.535 × 10⁴ t, with the lowest carbon storage occurring in 2018 (239.956 × 10⁴ t). The phytoplankton carbon sink also exhibited a downward trend, decreasing by 3.18 × 10⁴ t, with the highest carbon storage occurring in 2006 (15.887 × 10⁴ t). Moreover, the island’s fishery carbon sink increased by 0.195 × 10⁴ t from 2006 to 2022, peaking in 2018 (1.257 × 10⁴ t) and reaching its lowest value in 2014 (0.916 × 10⁴ t).

3.2. Multi-Scenario Projection of Carbon Stocks in 2030

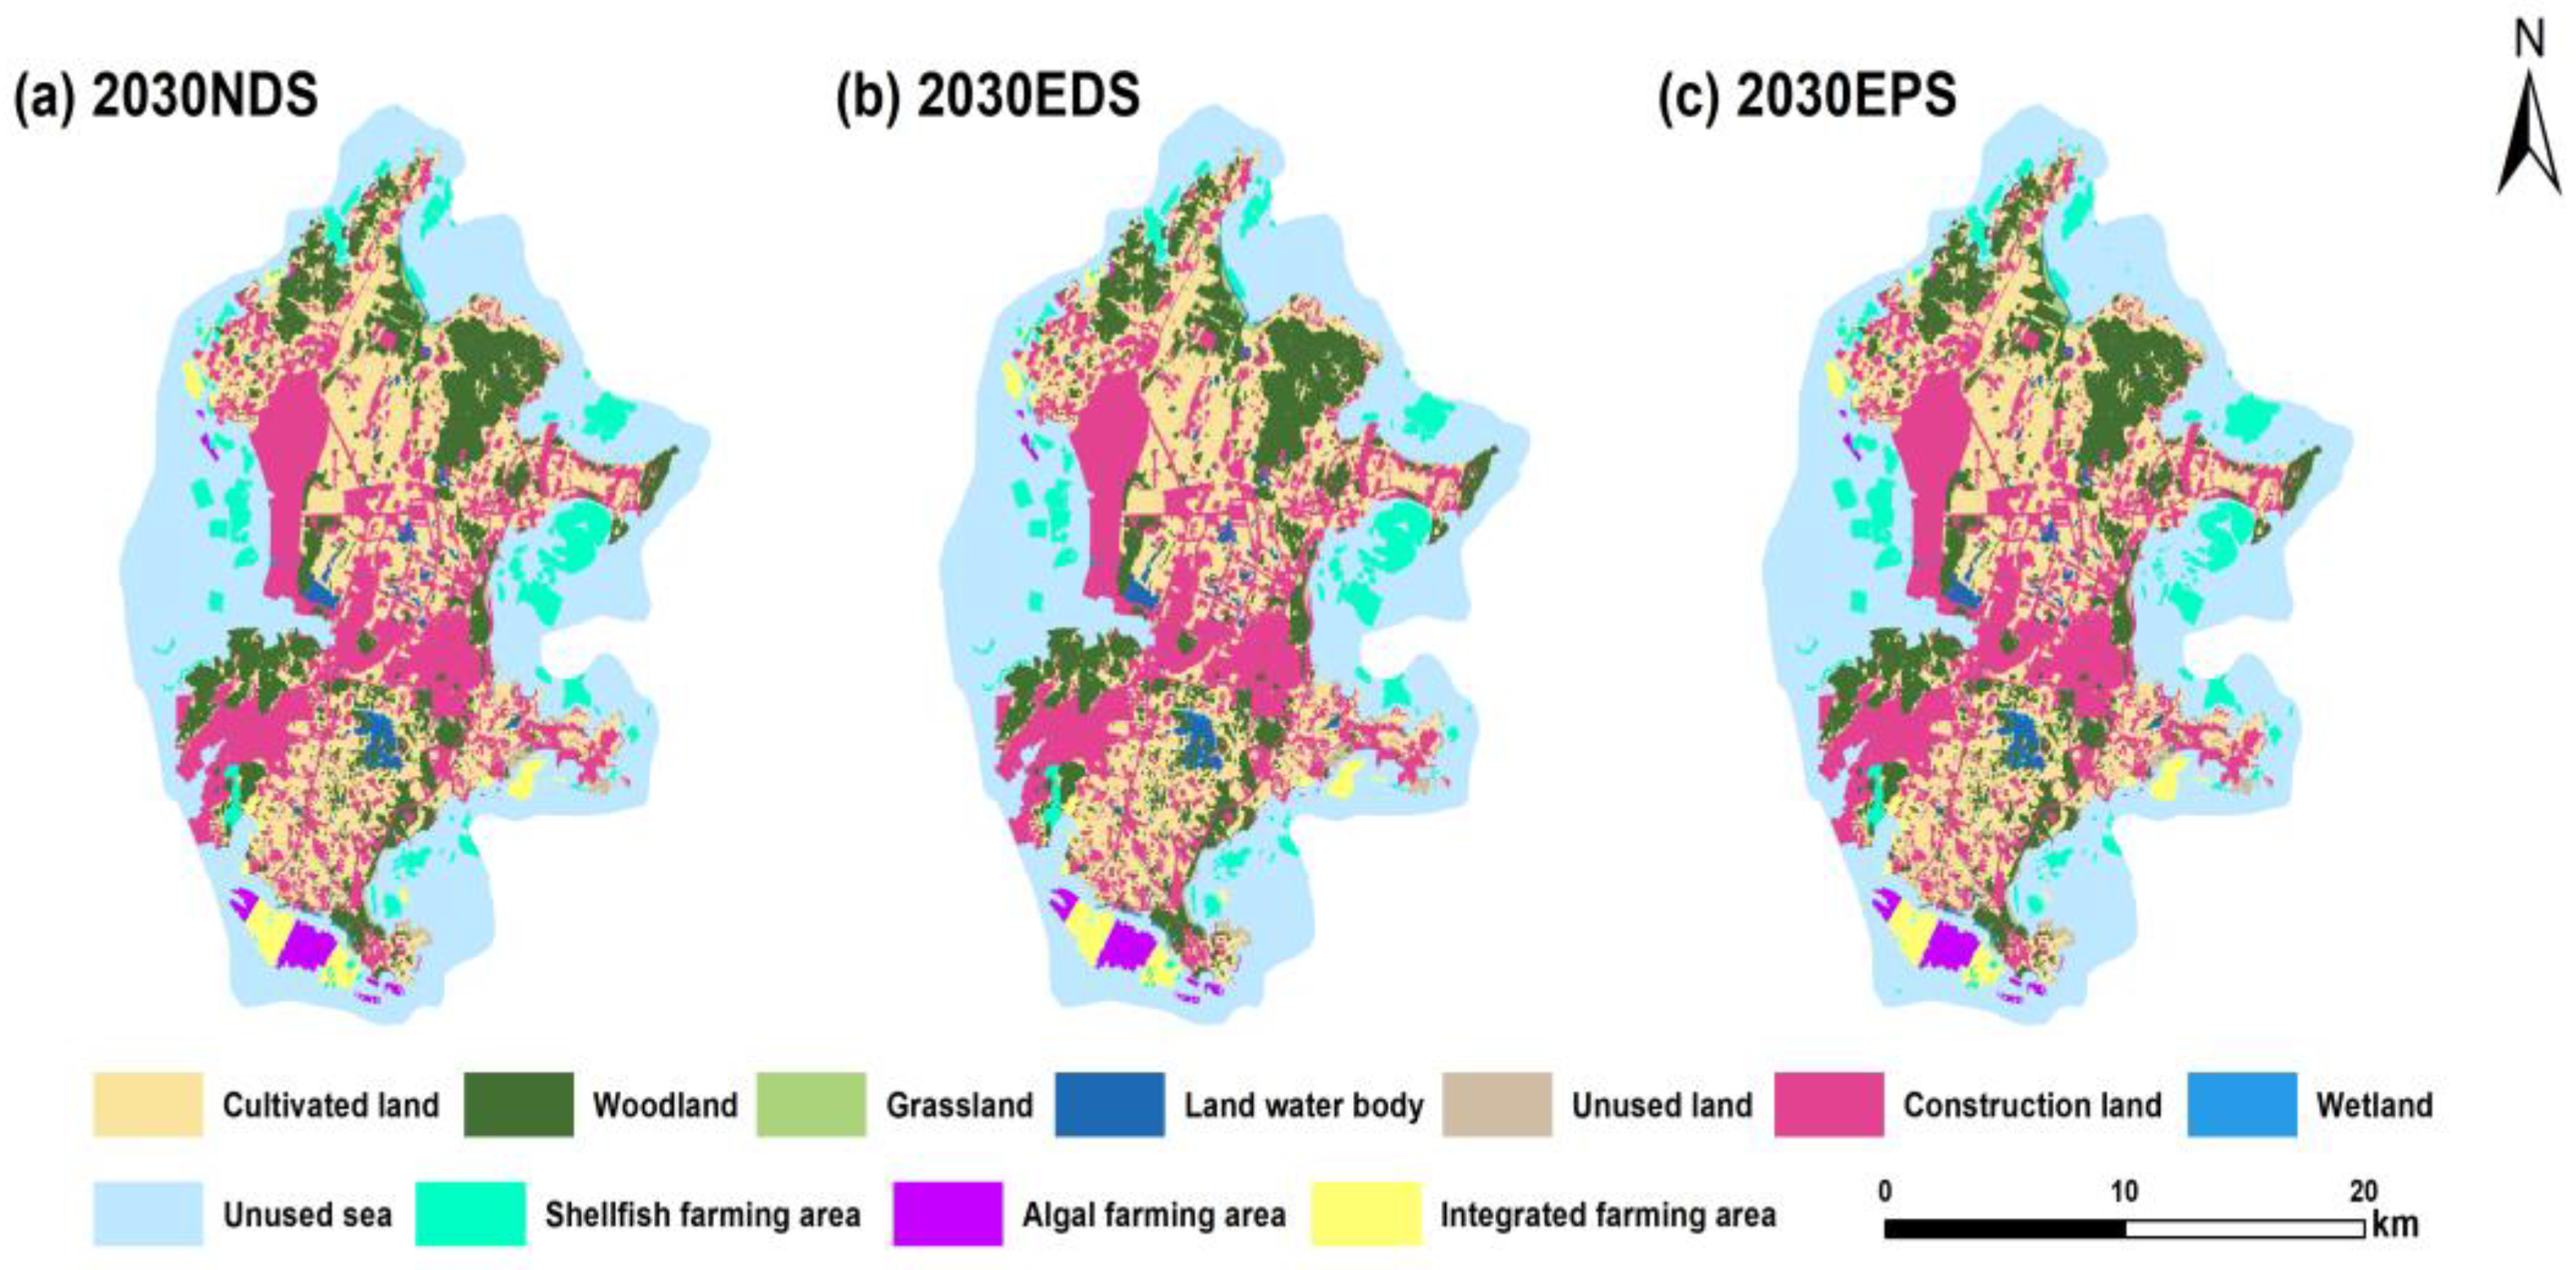
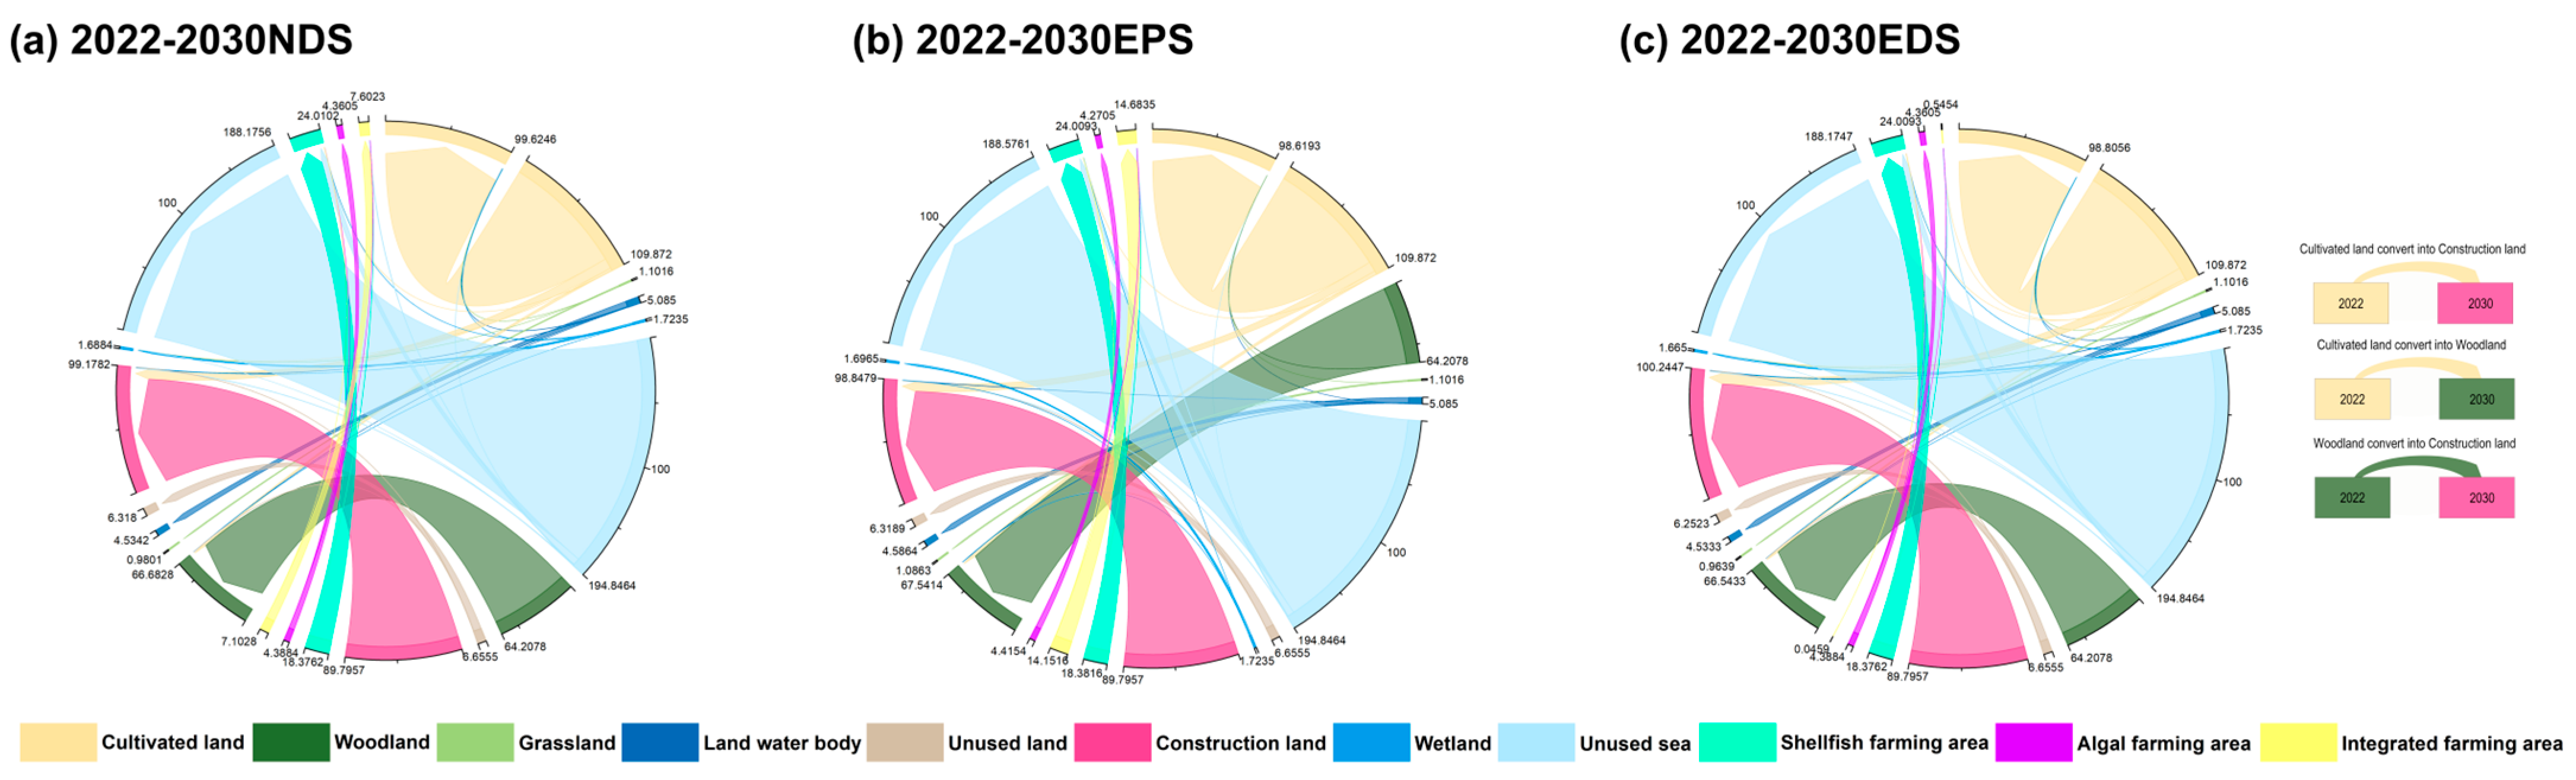
3.2.1. Multi-Scenario Simulation of Island Utilization Changes

On the basis of the current status of utilization changes on Pingtan Island, the types of island utilization under different scenarios in 2030 were predicted (Figure 5). The island utilization patterns under the three scenarios remain essentially the same (Figure 5). Under the NDS, the areas of woodland and construction land will increase by 2.472 km2 and 9.384 km2, respectively, compared with those in 2022. The cultivated land area will decrease by 10.25 km2, and the wetland area will decrease by 0.03 km2. The transfer areas of cultivated land to construction land and woodland will be 8.3718 km2 and 2.2536 km2, respectively. Compared with those in 2022, the areas of shellfish farming and integrated farming will increase by 5.634 km2 and 0.5 km2, respectively.
Under the EDS, the areas of cultivated land, grassland, unused land, and wetland decrease to different degrees; among them, the area of cultivated land decreases the most (11.06 km2), and the areas of woodland and construction land increase by 2.335 km2 and 10.444 km2, respectively. The areas of shellfish farming and integrated farming will show increasing trends, in which the shellfish farming area will increase the most (5.634 km2), and the unused sea area will decrease the most (−6.676 km2). Figure 6 shows that the increase in construction land will be caused mainly by the conversion of cultivated land, with a transfer area of 9.3267 km2. The decrease in the unused sea area is caused mainly by the increase in the area of shellfish farming, with a transfer area of 5.4315 km2.
Under the EPS, the areas of woodland, grassland, land water bodies, construction land, shellfish farming areas, and integrated farming areas will increase to varying degrees by 2030. Among them, the construction land area will experience the largest increase (9.052 km2), and the shellfish farming area will experience the most significant growth (5.633 km2). Figure 6 shows that the cultivated land area will be primarily converted into woodland (3.1005 km2) and construction land (8.208 km2), whereas the increase in shellfish farming will mainly originate from unused sea areas (5.238 km2).

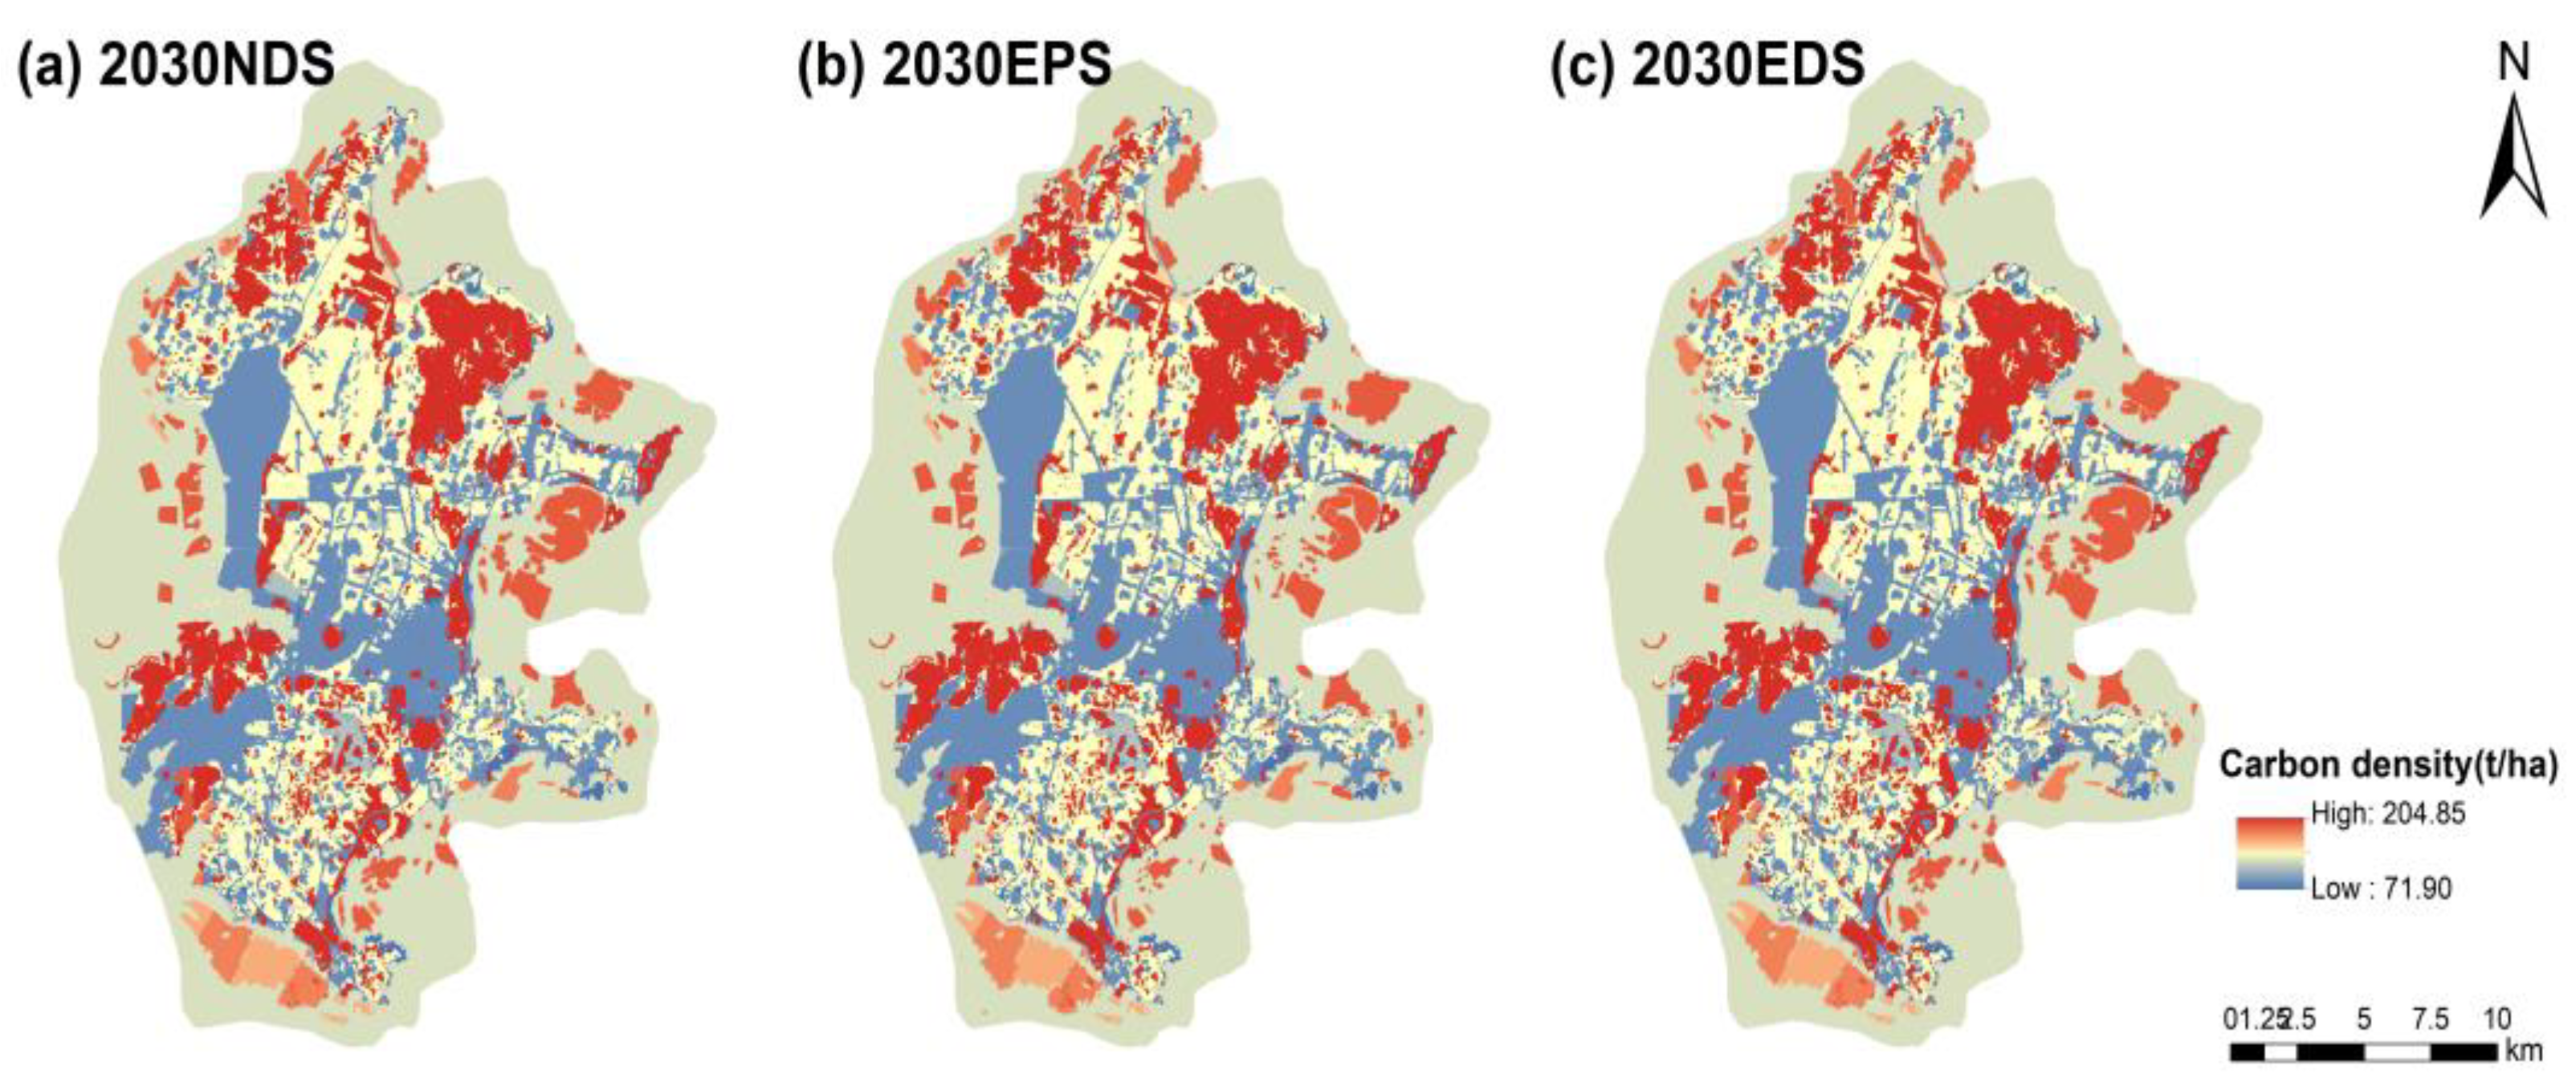
3.2.2. Carbon Stock Changes Based on Island Utilization Changes under Different Scenarios

Under the NDS, EDS, and NDS, the areas with relatively high carbon density on Pingtan Island are concentrated north and south of Pingtan Island, whereas the central part of Pingtan Island has relatively low carbon density due to urbanization development (Figure 7). Between 2022 and 2030, the carbon storage of Pingtan Island under the three scenarios will change significantly (Table 6). In 2030, total carbon storage on Pingtan Island will reach 595.373 × 10⁴ t, 594.031 × 10⁴ t, and 594.521 × 10⁴ t under the EPS, EDS, and NDS, respectively. Compared with that in 2022, carbon storage will increase by 4.27 × 10⁴ t, 2.928 × 10⁴ t, and 3.418 × 10⁴ t under the EPS, EDS, and NDS, respectively. The results indicate that the carbon storage capacity of Pingtan Island from 2022 to 2030 ranks in the order of EPS > NDS > EDS, which is consistent with Yu’s findings [68]. In terms of the total carbon stock composition of Pingtan Island, compared with that in 2022, the changes in the carbon stock in the land area of Pingtan Island under the three scenarios are not significant, and the increase in the carbon stock in the sea area of Pingtan Island is the main reason for the increase in the total carbon stock of Pingtan Island. Specifically, the increase in the carbon stocks of benthic organisms and sediments in the marine carbon stock of Pingtan Island contributed the most to the increase in the total carbon stock of Pingtan Island.

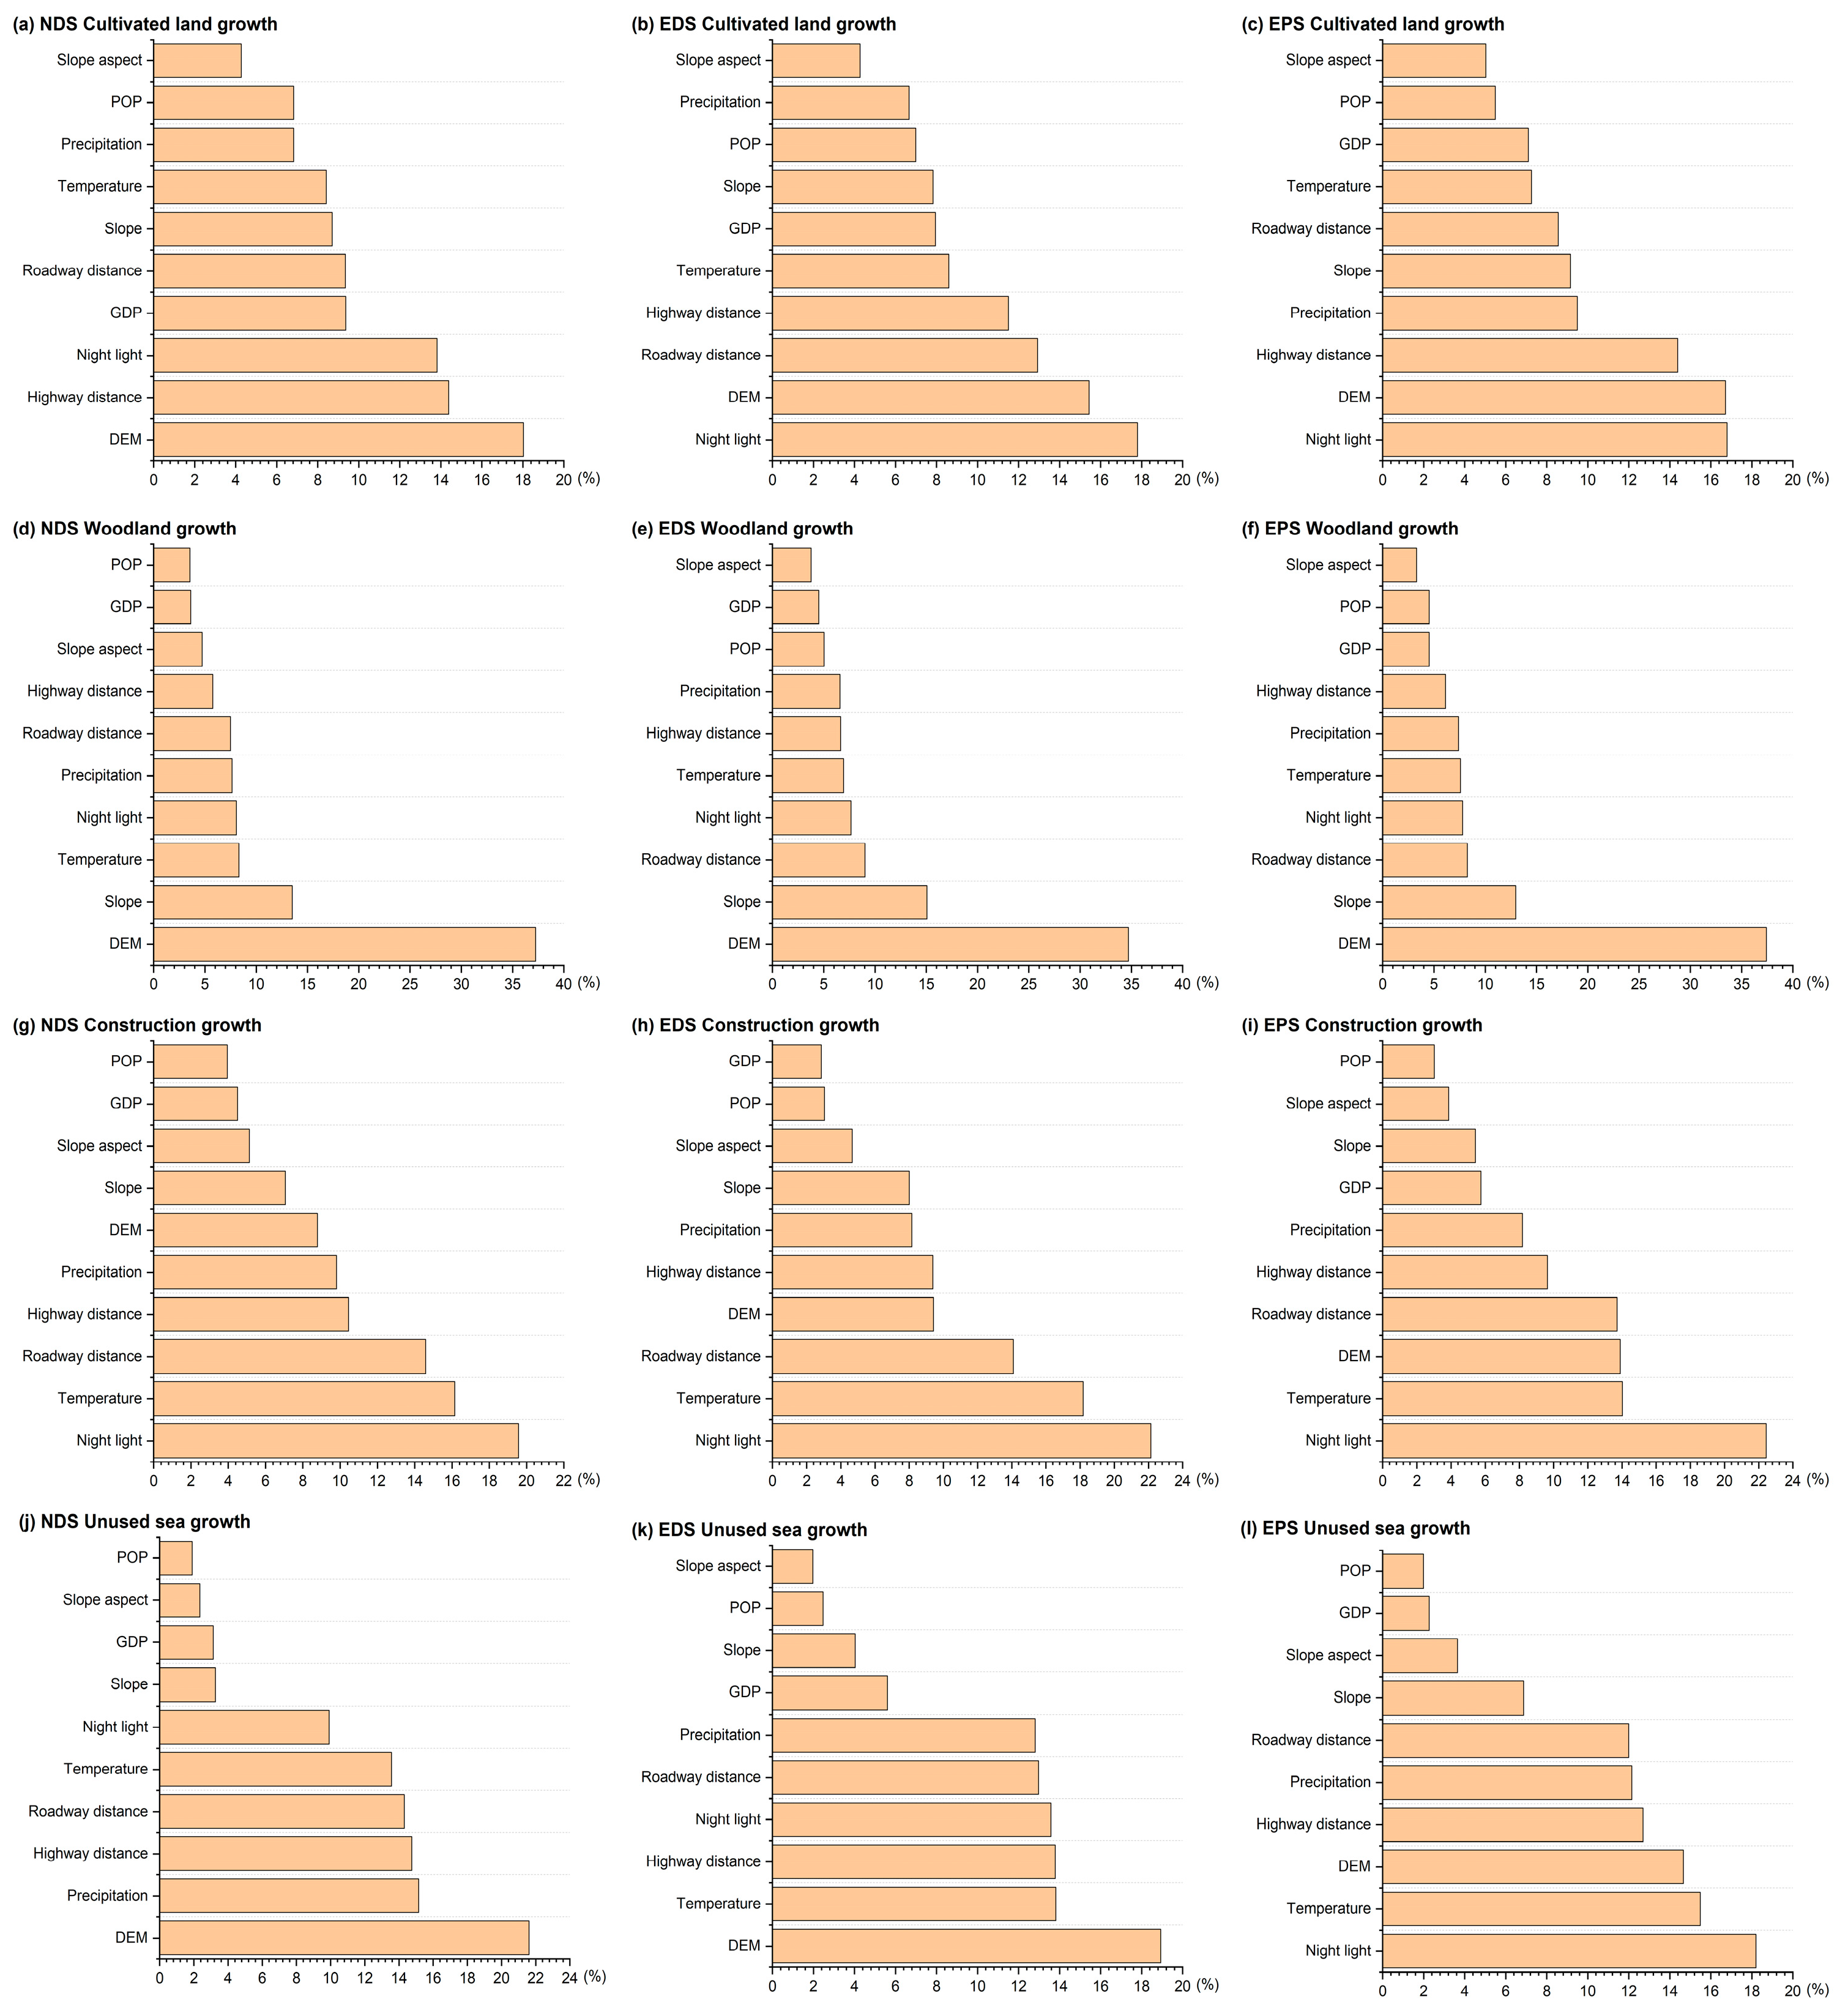
3.3. Impact of Various Driving Factors on Island Utilization

In this study, the LEAS module of the PLUS model was used to predict the contributions of different drivers to changes in island utilization types under the three scenarios from 2022 to 2030, which will help us understand the potential causes of future changes in island utilization types (Figure 8). Among the three scenarios, there are significant differences in the expansion of cultivated land, woodland, construction land, and unused sea area, and the order of importance of each driver for the expansion of the three island utilization types under different scenarios in 2030 is shown in Figure 8. Under the NDS, the DEM has the greatest effect on cultivated land growth, whereas under the EDS, nighttime lighting has the greatest influence on cultivated land growth. Under the EPS, both the DEM and nighttime lighting limit the expansion of cultivated land. Nighttime lighting is a major factor in the expansion of construction land under all three scenarios. Under the NDS and EDS, the main driving factor of the unused sea area is elevation. Under the EPS, the greatest indicator of the expansion of the unused sea area is nighttime lighting.

4. Discussion

4.1. Effects of Island Utilization Changes on Carbon Stocks

For the land area of Pingtan Island, woodland is the most influential type of island utilization, as it can offset the decrease in island carbon stock caused by the expansion of construction land and the decrease in other types of island utilization. Sediments and benthic carbon storage dominate the marine carbon storage of Pingtan Island (>95%), and shellfish farming areas can accumulate more carbon stocks than other types of sea utilization. Additionally, with the intensification of human activities related to marine development, especially large-scale land reclamation projects, the sea area of Pingtan Island has significantly decreased. This change has directly jeopardized the survival environment of phytoplankton, subsequently causing a significant decrease in the carbon sequestration capacity of phytoplankton. From 2006 to 2022, with the continuous urbanization of Pingtan Island, the expansion of construction land occupied a large amount of cultivated land and unused sea area, and the overall trend in the carbon stock decreased. The shift from high-density island utilization types to low-density island utilization types was the main reason for the reduction in the carbon stock on Pingtan Island.
The land-sea carbon stock gap peaked in 2018 on Pingtan Island, which was attributed mainly to the continuous advancement of land reclamation activities from 2014 to 2018. This drastic shift in the type of island utilization directly affects the distribution of carbon stocks in island ecosystems. With the profound implementation of the “13th Five-Year Plan” for National Island Protection Work and the promulgation of relevant policies to strictly control land reclamation, land reclamation activities have since been suppressed. The fishery economy of the island has developed under reasonable planning and protection. The development of more carbon-intensive mariculture has enhanced marine ecological restoration and carbon sequestration. Although some terrestrial habitats may still be degraded, the significant increase in the carbon sink capacity of the marine ecosystem led to an increasing trend in carbon stocks on Pingtan Island in 2022. According to the simulations of the different scenarios, Pingtan Island attains the greatest carbon increase effect under the EPS and the smallest carbon stock under the EDS. The constraints under the EPS limit the urbanization process, inhibit the conversion of high-density utilization types such as woodland and grassland to low-density island utilization types, and improve the carbon sequestration effect of ecological protection on Pingtan Island. Under the EDS, the occupation of woodland by construction land is an important reason for the serious loss of carbon stocks on Pingtan Island. From 2022 to 2030, the carbon sequestration effect of the ocean will gradually surpass that of land as the dominant carbon sink (Table 6). By 2030, the carbon stock of Pingtan Island will increase significantly, which is attributed mainly to the significant increase in the carbon stock of island waters. This finding not only reflects the strong resilience of island ecosystems in the context of habitat degradation but also reveals the importance of the ocean in the island carbon cycle. Specifically, the continued development of the island’s fishery economy will significantly contribute to the enhancement in the carbon sink capacity of the island’s marine ecosystem. Therefore, under reasonable marine fishery development activities, the carbon sequestration effect of Pingtan Island’s ocean in 2030 will exceed that of Pingtan Island’s land, resulting in an increase in Pingtan Island’s total carbon storage. This indicates that we cannot ignore the carbon sequestration capacity of island seas in the assessment and management of the carbon cycle of island ecosystems. It is not only a key part of maintaining the ecological balance of islands but also an important force in response to global climate change and promoting the goal of carbon neutrality. Therefore, when promoting an island management strategy, we must take a land-sea perspective to realize the sustainable development of islands.

4.2. Analysis of Drivers of Island Utilization Changes

According to Figure 8, for cultivated land, we found that in island areas with poor natural conditions and poor land resources, low-altitude and flat places are often more easily cultivated [69,70]. Nighttime lighting, which reflects the spatial distribution of human activities, also indicates the occupation of and alteration in cultivated land by those activities [29]. Alterations in cultivated land areas are strongly influenced by nighttime lighting in the context of promoting economic development and urbanization [71,72]. However, in the scenario of promoting ecological protection and sustainable development on the island, the expansion of cultivated land is influenced mainly by the combination of the DEM and nighttime lighting. Changes in woodland area are affected mainly by elevation. Woodlands are located mainly in mountainous areas with high elevations and low population densities, which are less affected by human activities and thus favor woodland expansion [18]. In the case of construction land, nighttime lighting is the main factor indicating its expansion; increased nighttime lighting means increased human activity and a further expansion of urbanization in the island area [71]. Against the background of the gradually warming climate and rising sea level, the expansion of the sea area in the island area is strongly influenced by elevation [73]. The lower the elevation is, the greater the likelihood that the area will be affected by sea level rise. Under the EPS, the greatest indicator of the expansion of the unused sea area is nighttime lighting, as it reflects efforts to limit the detrimental impact of human activities on the island’s ecological environment and promote the sustainable development of the island [73]; more nighttime lighting indicates higher levels of human activities [71].

4.3. Impact of Carbon Stock Changes on Social Cost of Carbon

The continuous increase in carbon emissions on Pingtan Island not only exacerbates immense pressure on the island’s ecosystem but also has detrimental effects on human economic and social systems. The social cost of carbon (SCC) is a crucial indicator for evaluating the economic costs associated with carbon emissions, aiming to quantify the damage incurred by each additional ton of CO2 emitted and convert this damage into present value through the application of discount rates [74]. Recently, Rennert et al. [75] created a comprehensive assessment model for quantifying the benefits of emission reductions and reached an average estimate of 185 USD/tC for the SCC. The model has made significant methodological progress by integrating the latest scientific understanding of all components of SCC estimation, thus making it more in line with current social development and significantly improving the accuracy and timeliness of the estimation.
On the basis of the above studies, this study chooses an SCC of 185 USD/tC as the average annual assessment standard for Pingtan Island, accounting for the specific situation of Pingtan Island without considering other influencing factors. By multiplying this standard with the reduction in carbon storage in Pingtan Island’s ecosystem, this study calculates the total economic loss to Pingtan Island’s ecosystem caused by carbon emissions resulting from changes in island use. From 2006 to 2022, the Pingtan Island ecosystem reduced carbon production by 7.218 × 10⁴ t due to changes in island utilization, resulting in a cumulative economic loss of approximately USD 13.35 million. From 2022 to 2030, the carbon sequestration effect on the Pingtan Island ecosystem due to changes in the type of island utilized will lead to a reduction in the total SCC and EPS> NDS > EDS. Under the EPS, the total SCC on Pingtan Island decreases the most (USD 7.90 million), and under the EDS, the total SCC on Pingtan Island decreases the least (USD 5.42 million). This shows that the total SCC arising from changes in island utilization on Pingtan Island is immense. With the strong carbon sequestration effect of the ocean, the total SCC due to changes in island utilization will decrease in 2030, with the largest reduction under the EPS. We should pay more attention to reasonable island utilization and ecological protection measures to improve the ecological protection of islands, increase carbon storage, and reduce the total SCC.

5. Conclusions

In this study, the impact of changes in island utilization on island carbon stocks was investigated using Pingtan Island as an example. Under the influence of human reclamation projects and urbanization, the carbon stock of Pingtan Island showed a decreasing trend from 2006 to 2022, resulting in a large loss of the total social cost of carbon. With the slowing of human development activities, under the regulating effect of the ocean, the carbon stock of Pingtan Island is expected to increase in 2030, and the total social cost of carbon is expected to decrease; nighttime lighting and the DEM may be important factors influencing the landscape pattern of the island in the future. The specific conclusions are as follows:
(1)
From 2006 to 2022, the reclamation and urbanization of Pingtan Island led to an overall decreasing trend in carbon stocks, resulting in a cumulative economic loss of approximately USD 13.35 million. In particular, the significant expansion of land for construction has occupied a large amount of cultivated land and unutilized sea areas, leading to a significant reduction in carbon stocks. This finding emphasizes the importance of rational island resource planning for the maintenance of ecosystem carbon stocks.
(2)
The 2030 results show that future carbon stocks will be greater in all scenarios than in 2022, with EPS > NDS > EDS. The carbon stock under the EPS will be 595.373 × 10⁴ t, which will be 4.270 × 10⁴ t greater than that in 2022. This result suggests that by implementing ecological restoration policies, the carbon stock of island ecosystems can be effectively enhanced to combat climate change.
(3)
The analysis of the driving factors of island utilization change in 2030 reveals that the DEM will be the greatest driving factor of woodland expansion, and nighttime lighting will be the greatest indicator of construction land expansion under the three scenarios. Under the EPS, nighttime lighting will be the greatest indicator of cultivated land and unused sea area expansion. Under the NDS, the DEM will be the largest driving factor affecting cultivated land expansion. Under the EDS, nighttime lighting will be the greatest indicator of cultivated land expansion, and the DEM will be the greatest driver of unused sea area expansion.
In conclusion, this study not only reveals the spatial and temporal distribution characteristics of the sea and land carbon stock changes in Pingtan Island but also provides the scientific basis and reference for the formulation of relevant island carbon management policies, ecological environmental protection, and island sustainable development planning. Given the strong carbon sink potential of the oceans, we suggest that in the future planning of island resources, spatial policies for ecological protection should be rationally formulated and strictly enforced, the disorderly expansion of construction land should be controlled, and the ecological use of the sea should be rationally planned so as to effectively enhance the carbon stock of the islands. Furthermore, we call for the strengthening of long-term monitoring and data collection in order to establish a more comprehensive database and information system on ocean carbon sinks. In this study, limited by the difficulty and precision of data acquisition, there may be errors between our carbon density data selection and the real value. Furthermore, although the PLUS model demonstrated a high degree of accuracy in simulating future land use patterns, the accuracy of the model is still subject to the operator’s subjective influence. Due to the complexity of the ocean carbon cycle, the accounting of carbon stock in the islands was only carried out for the land use change and ocean use change in the islands. In the future, we will select more measured data and consider more factors to deeply explore the carbon cycle mechanism of land and sea ecosystems so as to comprehensively assess the carbon stock changes in island ecosystems.

Author Contributions

Conceptualization, S.C.; methodology, M.X. and H.L.; software, F.T. and Y.Z.; validation, J.X., F.T., and Y.G.; formal analysis, M.X.; investigation, Y.C.; resources, H.L.; data curation, Y.G.; writing—original draft preparation, S.C.; writing—review and editing, S.C.; funding acquisition, H.L. All authors have read and agreed to the published version of the manuscript.

Funding

This research was funded by the Natural Science Foundation of Fujian Province, China, grant number 2023J011388, and the Research Project of Xiamen Municipal Bureau of Ocean Development, grant number Z.220101.

Institutional Review Board Statement

Not applicable.

Informed Consent Statement

Not applicable.

Data Availability Statement

All the data used in this study are mentioned in Section 2, “Materials and Methods”.

Conflicts of Interest

The authors declare no conflicts of interest.

References

  1. Wang, J.; Zhang, F.; Li, J.R.; Sun, M.; Sun, M.; Wang, Q.B. Analysis on the characteristics and problems of island economic development in China. Mar. Sci. Bull. 2019, 38, 250–256. [Google Scholar]
  2. Chowdhury, A.; Naz, A.; Maiti, S.K. Variations in Soil Blue Carbon Sequestration between Natural Mangrove Metapopulations and a Mixed Mangrove Plantation: A Case Study from the World’s Largest Contiguous Mangrove Forest. Life 2023, 13, 271. [Google Scholar] [CrossRef] [PubMed]
  3. Chowdhury, A.; Naz, A.; Sharma, S.B.; Dasgupta, R. Changes in Salinity, Mangrove Community Ecology, and Organic Blue Carbon Stock in Response to Cyclones at Indian Sundarbans. Life 2023, 13, 1539. [Google Scholar] [CrossRef]
  4. Roos, C.I.; Field, J.S.; Dudgeon, J.V. Fire activity and deforestation in Remote Oceanian islands caused by anthropogenic and climate interactions. Nat. Ecol. Evol. 2023, 7, 2028–2036. [Google Scholar] [CrossRef] [PubMed]
  5. Qing, W.S.; Zhang, Y.F. Research progress on island economy. Prog. Geogr. 2013, 32, 1401–1412. [Google Scholar]
  6. Chi, Y.; Liu, D.; Xing, W.; Wang, J. Island ecosystem health in the context of human activities with different types and intensities. J. Clean. Prod. 2021, 281, 125334. [Google Scholar] [CrossRef]
  7. Pata, U.K.; Kumar, A. The Influence of Hydropower and Coal Consumption on Greenhouse Gas Emissions: A Comparison between China and India. Water 2021, 13, 1387. [Google Scholar] [CrossRef]
  8. Sui, Y.Z.; Huang, W.G.; Zhang, H.G.; Li, S.J. Research on spatial-temporal changes in island land reclamation with remote sensing. Mar. Environ. Sci. 2013, 32, 594–598. [Google Scholar]
  9. Fang, Z.S.; Zhong, C.R.; Wang, F.X.; Cheng, C.; Lv, X.B.; Chen, X. Spatial-temporal evolution and prediction of ecosystem carbon storage on Hainan Island by coupling InVEST and FLUS models. Bull. Soil Water Conserv. 2023, 43, 320–329+342. [Google Scholar] [CrossRef]
  10. Zhang, B.F.; Zhang, J.; Miao, C.H. Urbanization level in Chinese counties: Imbalance pattern and driving force. Remote Sens. 2022, 14, 2268. [Google Scholar] [CrossRef]
  11. Lu, L.; Xue, Q.; Zhang, X.; Qin, C.; Jia, L. Spatiotemporal variation and quantitative attribution of carbon storage based on multiple satellite data and a coupled model for Jinan City, China. Remote Sens. 2023, 15, 4472. [Google Scholar] [CrossRef]
  12. Liu, Q.; Yang, D.; Cao, L.; Anderson, B. Assessment and Prediction of Carbon Storage Based on Land Use/Land Cover Dynamics in the Tropics: A Case Study of Hainan Island, China. Land 2022, 11, 244. [Google Scholar] [CrossRef]
  13. Yin, L.T.; Zheng, W.; Gao, M.; Lu, J.F. Coastal vulnerability of Miaodao archipelago based on InVEST model. Mar. Environ. Sci. 2021, 40, 221–227. [Google Scholar] [CrossRef]
  14. Zhang, M.; Lai, L.; Huang, X.J.; Chuai, X.W.; Tan, J.Z. The carbon emission intensity of land use conversion in different regions of China. Resour. Sci. 2013, 35, 792–799. [Google Scholar]
  15. He, Y.; Ma, J.; Zhang, C.; Yang, H. Spatio-Temporal evolution and prediction of carbon storage in Guilin based on FLUS and InVEST models. Remote Sens. 2023, 15, 1445. [Google Scholar] [CrossRef]
  16. Wang, R.Y.; Cai, H.; Chen, L.K.; Li, T.H. Spatiotemporal evolution and Multi-Scenario prediction of carbon storage in the GBA based on PLUS–InVEST models. Sustainability 2023, 15, 8421. [Google Scholar] [CrossRef]
  17. Huang, C.; Zhang, C.C.; Li, H. Assessment of the impact of rubber plantation expansion on regional carbon storage based on time series remote sensing and the InVEST model. Remote Sens. 2022, 14, 6234. [Google Scholar] [CrossRef]
  18. Du, S.; Zhou, Z.; Huang, D.; Zhang, F.; Deng, F.; Yang, Y. The response of carbon stocks to and use/cover change and a vulnerability Multi-Scenario analysis of the Karst region in Southern China based on PLUS-InVEST. Forests 2023, 14, 2307. [Google Scholar] [CrossRef]
  19. Wu, F.; Wang, Z.Y. Assessing the impact of urban land expansion on ecosystem carbon storage: A case study of the Changzhutan metropolitan area, China. Ecol. Indic. 2023, 154, 110688. [Google Scholar] [CrossRef]
  20. Liu, Q. Methods for the Estimation of Organic Carbon Stocks in the Upper Layer of the East China Sea by Satellite Remote Sensing. Ph.D. Thesis, Wuhan University, Wuhan, China, 2013. [Google Scholar]
  21. Yue, D.D.; Wang, L.M. The relationship of shellfish mariculture production and its carbon sinks in China. Jiangsu Agric. Sci. 2012, 40, 246–248. [Google Scholar] [CrossRef]
  22. Atwood, T.B.; Witt, A.; Mayorga, J.; Hammill, E.; Sala, E. Global patterns in marine sediment carbon stocks. Front. Mar. Sci. 2020, 7, 165. [Google Scholar] [CrossRef]
  23. Pata, U.K.; Erdogan, S.; Solarin, S.A.; Okumus, I. Evaluating the influence of democracy, financial development, and fishery product consumption on fishing grounds: A case study for Malaysia. Mar. Policy 2024, 168, 106301. [Google Scholar] [CrossRef]
  24. Li, Q.S.; Huang, J.L.; Wang, C.; Wang, B.K.; Wu, Y.J.; Zhang, J.W.; Lin, H.S.; Luo, H.H. The suitability evaluation of Pingtan Island development based on the comprehensive analysis of ecological economy and industry. Mar. Sci. 2017, 41, 1–10. [Google Scholar]
  25. Chen, F. Geomorphology and evolutionary development of Haitan Island. Mar. Sci. Bull. 1994, 60–66. Available online: https://kns.cnki.net/kcms2/article/abstract?v=2arE9-pF_S2PENRprq-TyMXPdoyFOKqRG3ph9iDZXjUZ_Jn-dkNOnnRd_lK33lBwKHbAYwanVZqFuJnqnVnYu9_cMz5vpmm_k5EEbqFTfgX6zqIj9M6qu6XiPaQ8xApbga8BsyRE9whMqVUhf3dqcZjpUFcM-1v5aFOCzH7EFWjUF4i9C1ghRunuKMqIUai3&uniplatform=NZKPT&language=CHS (accessed on 29 December 2023).
  26. Pingtan Comprehensive Experimental Zone Party Working Committee and Management Committee. Pingtan Statistical Yearkbook 2015–2022. 2023. Available online: https://www.pingtan.gov.cn/zwgk/tjxx/tjnj/ (accessed on 29 December 2023).
  27. Shi, M.; Wu, H.; Fan, X.; Jia, H.; Dong, T.; He, P.; Baqa, M.F.; Jiang, P. Trade-Offs and synergies of multiple ecosystem services for different land use scenarios in the Yili River Valley, China. Sustainability 2021, 13, 1577. [Google Scholar] [CrossRef]
  28. Wang, S.; Liu, J.; Zhang, Z.; Zhou, Q.; Zhao, X. Spatial-temporal features of land use in China. Acta Geogr. Sin. 2001, 56, 631–639. [Google Scholar]
  29. Li, L.; Ji, G.; Li, Q.; Zhang, J.; Gao, H.; Jia, M.; Li, M.; Li, G. Spatiotemporal evolution and prediction of ecosystem carbon storage in the Yiluo River Basin based on the PLUS-InVEST model. Forests 2023, 14, 2442. [Google Scholar] [CrossRef]
  30. Liang, X.; Guan, Q.; Clarke, K.C.; Liu, S.; Wang, B.; Yao, Y. Understanding the drivers of sustainable land expansion using a patch-generating land use simulation (PLUS) model: A case study in Wuhan, China. Comput. Environ. Urban Syst. 2021, 85, 101569. [Google Scholar] [CrossRef]
  31. Wang, C.Y.; Li, T.Z.; Guo, X.H.; Xia, L.L.; Lu, C.D.; Wang, C.B. Plus-InVEST study of the Chengdu-Chongqing urban agglomeration’s land-use change and carbon storage. Land 2022, 11, 1617. [Google Scholar] [CrossRef]
  32. Sun, C.; Liang, L.; Shi, Y.; Wang, Q.; Shi, J.; Wang, Y. Spatial-temporal variation analysis and prediction of carbon storage in urban ecosystems based on PLUS-InVEST model: A case study of Jiangsu Province. In Proceedings of the 2023 11th International Conference on Agro-Geoinformatics (Agro-Geoinformatics), Wuhan, China, 25–28 July 2023; pp. 1–6. [Google Scholar]
  33. Kupfer, J.A. Landscape ecology and biogeography: Rethinking landscape metrics in a post-FRAGSTATS landscape. Prog. Phys. Geogr.-Earth Environ. 2012, 36, 400–420. [Google Scholar] [CrossRef]
  34. Tian, L.; Tao, Y.; Fu, W.X.; Li, T.; Ren, F.; Li, M.Y. Dynamic simulation of land use/cover change and assessment of forest ecosystem carbon storage under climate change scenarios in Guangdong Province, China. Remote Sens. 2022, 14, 2330. [Google Scholar] [CrossRef]
  35. Li, F.X.; Wang, L.Y.; Chen, Z.J.; Clarke, K.C.; Li, M.C.; Jiang, P.H. Extending the SLEUTH model to integrate habitat quality into urban growth simulation. J. Environ. Manag. 2018, 217, 486–498. [Google Scholar] [CrossRef] [PubMed]
  36. Gao, L.; Tao, F.; Liu, R.; Wang, Z.; Leng, H.; Zhou, T. Multi-scenario simulation and ecological risk analysis of land use based on the PLUS model: A case study of Nanjing. Sustain. Cities Soc. 2022, 85, 104055. [Google Scholar] [CrossRef]
  37. Wang, Q.Z.; Guan, Q.Y.; Sun, Y.F.; Du, Q.Q.; Xiao, X.; Luo, H.P.; Zhang, J.; Mi, J.M. Simulation of future land use/cover change (LUCC) in typical watersheds of arid regions under multiple scenarios. J. Environ. Manag. 2023, 335, 117543. [Google Scholar] [CrossRef] [PubMed]
  38. Wu, Y.; Wang, J.; Gou, A. Research on the evolution characteristics, driving mechanisms and multi-scenario simulation of habitat quality in the Guangdong-Hong Kong-Macao Greater Bay based on multi-model coupling. Sci. Total Environ. 2024, 924, 171263. [Google Scholar] [CrossRef] [PubMed]
  39. Gao, X.; Yang, L.W.Q.; Li, C.X.; Song, S.Y.; Wang, J. Land use change and ecosystem service value measurement in Baiyangdian Basin under the simulated multiple scenarios. Acta Ecol. Sin. 2021, 41, 7974–7988. [Google Scholar]
  40. Sharp, R.; Douglass, J.; Wolny, S.; Arkema, K.; Bernhardt, J.; Bierbower, W.; Chaumont, N.; Denu, D.; Fisher, D.; Glowinski, K. VEST 3.9.0 User’s Guide; The Natural Capital Project; Stanford University, University of Minnesota, The Nature Conservancy, and World Wildlife Fund: Stanford, CA, USA, 2020. [Google Scholar]
  41. Bai, Y.; Zheng, H.; Zhuang, C.W.; Ouyang, Z.Y.; Xu, W.H. Ecosystem services valuation and its regulation in Baiyangdian baisn: Based on InVEST model. Acta Ecol. Sin. 2013, 33, 711–717. [Google Scholar]
  42. Wu, N.; Song, X.Y.; Kang, W.H.; Deng, X.H.; Hu, X.Q.; Shi, P.J.; Liu, Y.Q. Standard of payment for ecosystem services in a watershed based on InVEST model under different standpoints: A case study of the Weihe River in Gansu Province. Acta Ecol. Sin. 2018, 38, 2512–2522. [Google Scholar]
  43. Fatemeh, D.; Amir, H.; Ameneh, D.; Augusto, R.A.C.; Christine, F.; Cirella, G.T.; Morteza, N. Ecosystem services valuation using InVEST modeling: Case from southern Iranian mangrove forests. Reg. Stud. Mar. Sci. 2023, 60, 102813. [Google Scholar]
  44. Quan, W.; Yin, M.M.; Kang, H.J.; Zhou, Q.H.; Xu, C.L.; Zhang, C.N. Spatial distribution pattern of sediment carbon content in Dongtou offshore aquaculture waters. J. Appl. Oceanogr. 2015, 34, 580–585. [Google Scholar]
  45. Liano, Y.B.; Shou, L.; Zeng, J.N.; Gao, A.G.; Jiang, Z.B. A comparative study of macrobenthic community under different mariculture types in Xiangshan Bay, China. Acta Ecol. Sin. 2011, 31, 646–653. [Google Scholar]
  46. Ye, X.; Chen, J.; Wang, A.J.; Huang, C.B.; Wang, W.G.; Li, D.Y. Sources, burial fluxes of carbon in sediments of the western Taiwan Strait. Acta Oceanol. Sin. 2011, 33, 73–82. [Google Scholar]
  47. Li, X.G.; Song, J.M. Sources, transport and transformation of carbon in marine sediments. Stud. Mar. Sin. 2004, 12, 106–117. [Google Scholar]
  48. Dickens, A.F.; Baldock, J.A.; Smernik, R.J.; Wakeham, S.G.; Arnarson, T.S.; Gélinas, Y.; Hedges, J.I. Solid-state 13C NMR analysis of size and density fractions of marine sediments: Insight into organic carbon sources and preservation mechanisms. Geochim. Et Cosmochim. Acta 2006, 70, 666–686. [Google Scholar] [CrossRef]
  49. Barnes, D.K.A.; Sands, C.J. Functional group diversity is key to Southern Ocean benthic carbon pathways. PLoS ONE 2017, 12, e0179735. [Google Scholar] [CrossRef] [PubMed]
  50. Xu, L.; He, N.P.; Yu, G.R. A dataset of carbon density in Chinese terrestrial ecosystems (2010s). China Sci. Data 2019, 4, 90–96. [Google Scholar]
  51. Wang, W.J. Reserve estimation, spatiotemporal distribution and its influencing factors of soil organic carbon in Fujian Province, China. Geoscience 2019, 33, 1295–1305. [Google Scholar] [CrossRef]
  52. Huang, T.; Liu, S.H. Evaluation of land use change and carbon storage in Fujian Province based on PLUS-InVEST model. J. Soil Water Conserv. 2024, 38, 246–257. [Google Scholar] [CrossRef]
  53. Shao, E.H.; Xu, W.M.; Yang, H.; Lin, X.; Liao, Y.T. Land use simulation and carbon stock assessment in Nanping City coupled with PLUS-InVEST model. J. Hainan Univ. (Nat. Sci.) 2024, 42, 186–196. [Google Scholar] [CrossRef]
  54. Gao, Z.B.; Wang, X.R.; Sui, X.Y.; Wang, X.; Fang, Y.T.; Zhu, Q.; Lv, L.G. Multi-scenario predictions of habitat quality in Nanjing based on FLUS and InVEST models. J. Agric. Resour. Environ. 2022, 39, 1001–1013. [Google Scholar] [CrossRef]
  55. Zhang, J.; Li, X.M.; Chen, X.P.; Huang, H.; Wang, K.; Zhang, S.Y. Distribution characteristics and sources of organic matter in surface sediments along the coastal of natural seaweed beds. Mar. Sci. 2023, 47, 21–29. [Google Scholar]
  56. Ye, J.H.; Qiu, C.Y.; Zeng, W.X.; Shi, Y.F.; Zhao, M.Q.; Han, Q.Y. Review of organic carbon in seagrass bed sediment. Mar. Sci. 2022, 46, 130–145. [Google Scholar]
  57. Nie, M.C.; Huang, C.L.; Sui, Q.; Zou, L.; Zhu, L.; Sun, X.M.; Zhao, X.G.; Xia, B.; Chen, B.J.; Qu, K.M. Carbon and nitrogen stable isotope analysis and source identification of organic matter in sediments of sangou bay. Prog. Fish. Sci. 2022, 43, 84–97. [Google Scholar] [CrossRef]
  58. Xue, C.F.; Sheng, H.; Wei, D.Y.; Yang, Y.; Wang, Y.P.; Jia, J.J. Sediment dry weight analysis and its sedimentological significance: A case study of the East China Sea inland shelf area. Oceanol. Limnol. Sin. 2020, 51, 1093–1107. [Google Scholar]
  59. Cai, Y.J.; Xue, Q.j.; Lu, Y.j.; Gong, Z.J. C:N:P stoichiometry of five common macrozoobenthic taxa in shallow lakes along the Yangtze River. J. Lake Sci. 2015, 27, 76–85. [Google Scholar]
  60. Emerson, S.; Hedges, J.I. Processes controlling the organic carbon content of open ocean sediments. Paleoceanography 1988, 3, 621–634. [Google Scholar] [CrossRef]
  61. Luo, D.L.; Ruan, J.S.; Xu, C.Y.; Liao, D.Y. Concentration of the heavy metals and organic matter in surface sediments from the main shellfish culture areas of Fujian and their correlativity. Mar. Environ. Sci. 2004, 23, 33–36. [Google Scholar]
  62. Mao, J.; Yang, Y.F.; GU, Y.G.; Chen, S. Distribution and potential contamination assessment of biogenic elements in surface sediments from Nanao mariculture areas, Shantou. Ecol. Sci. 2012, 31, 252–258. [Google Scholar]
  63. Fei, Z.; Trees, C.C.; Li, B. Calculation of primary productivity using chlorophyll data. Adv. Mar. Sci. 1997, 1, 35–47. [Google Scholar]
  64. Wang, Q.X.; Cui, Z.G.; Qu, K.M.; Wang, Q.K.; Wei, Y.Q.; Sun, J. Advances in primary productivity and carbon biomass detection of marine phytoplankton. Mar. Sci. 2023, 47, 131–140. [Google Scholar]
  65. Lv, P.; Fei, Z.; Mao, X.; Zhu, M.; Zhang, K.; Liu, Y.; Li, B.; Xia, B. Estimation of chlorophyll-a distribution and primary productivity in the Bohai Sea. Haiyang Xuebao 1984, 6, 90–98. [Google Scholar]
  66. Zhao, S.H.; Ye, Y.H.; Luo, F.; Yang, M.C.; Zhang, Y.; Sun, F.F. Preliminary study on carbon sequestration accounting in Shenzhen offshore area. Environ. Sci. Technol. 2019, 42, 140–147. [Google Scholar] [CrossRef]
  67. Ministry of Natural Resources. The Marine Carbon Sink Accounting Methodology. 2023. Available online: http://aoc.ouc.edu.cn/2023/0302/c15169a424717/pagem.htm (accessed on 25 December 2023).
  68. Yu, Y.; Guo, B.; Wang, C.; Zang, W.; Huang, X.; Wu, Z.; Xu, M.; Zhou, K.; Li, J.; Yang, Y. Carbon storage simulation and analysis in Beijing-Tianjin-Hebei region based on CA-plus model under dual-carbon background. Geomat. Nat. Hazards Risk 2023, 14, 2173661. [Google Scholar] [CrossRef]
  69. He, D.; Jin, F.J.; Zhou, J. The changes of land use and landscape pattern based on Logistic-CA-Markov Model—A case study of Beijing-Tianjin-Hebei metropolitan region. Sci. Geogr. Sin. 2011, 31, 903–910. [Google Scholar] [CrossRef]
  70. Zou, M.; Wu, Q.Y.; Pang, J.W. Analysis of the land use spatial pattern and spatio-temporal changes in the area of Longkou based on DEM. Sci. Surv. Mapp. 2007, 32, 173–175. [Google Scholar]
  71. Xu, K.N.; Chen, F.L.; Liu, X.Y. The reality of China’s economic growth: A test based on global nighttime lights data. Econ. Res. J. 2015, 50, 17–29+57. [Google Scholar]
  72. Zhang, y.; Jiang, B.; Zhao, Y.H.; Zhao, Y. Study on carbon emission effect of urban land use in Northeast China based on land use change. Environ. Sci. Technol. 2022, 45, 209–217. [Google Scholar] [CrossRef]
  73. Nicholls, R.J.; Lincke, D.; Hinkel, J.; Brown, S.; Vafeidis, A.T.; Meyssignac, B.; Hanson, S.E.; Merkens, J.-L.; Fang, J. A global analysis of subsidence, relative sea-level change and coastal flood exposure. Nat. Clim. Chang. 2021, 11, 338–342. [Google Scholar] [CrossRef]
  74. Tol, R.S.J. A social cost of carbon for (almost) every country. Energy Econ. 2019, 83, 555–566. [Google Scholar] [CrossRef]
  75. Rennert, K.; Errickson, F.; Prest, B.C.; Rennels, L.; Newell, R.G.; Pizer, W.; Kingdon, C.; Wingenroth, J.; Cooke, R.; Parthum, B.; et al. Comprehensive evidence implies a higher social cost of CO2. Nature 2022, 610, 687–692. [Google Scholar] [CrossRef] [PubMed]
Figure 1. The location of the study area. (a) The location of the study area in Fujian Province, China. (b) The location of the study area in Fuzhou, Fujian Province. (c) The boundary and elevation of the study area.
Jmse 12 01745 g001
Figure 2. Spatial distribution of changes in island utilization, 2006–2022.
Jmse 12 01745 g002
Figure 3. The transfer process of different island utilization types on Pingtan Island, 2006–2022. The length and numerical label of each input or output column represent the total transferred area of a specific island utilization type, whereas the width of the connecting flows between columns signifies the amount of area that is transferred from one island utilization type to another.
Jmse 12 01745 g003
Figure 4. The spatial distribution of carbon density on Pingtan Island, 2006–2022. (Note: To better understand the characteristics of the spatial distribution of carbon density on Pingtan Island, we distributed the ocean carbon sinks proportionally and evenly to the area of each island sea use type and comprehensively calculated the value of carbon density for each island use type.)
Jmse 12 01745 g004
Figure 5. Spatial distribution of island utilization changes in 2030.
Jmse 12 01745 g005
Figure 6. Chord diagram of change in island utilization under three scenarios from 2022 to 2030.
Jmse 12 01745 g006
Figure 7. Spatial distribution of carbon density on Pingtan Island under three scenarios in 2030.
Jmse 12 01745 g007
Figure 8. Relative contribution rates of various driving factors to the growth of four types of island utilization in 2030.
Jmse 12 01745 g008
Table 1. Drivers of island utilization.
CategoryDataResolutionData Resources
Natural FactorsDEM30 mGeospatial Data Cloud
(http://www.gscloud.cn,
accessed on 12 January 2024)
Slope30 mGenerated by DEM in ArcGIS
Slope direction30 m
Average annual
temperature
1 kmCenter for Resource and Environmental Science and Data, Chinese Academy of Sciences
(http://www.resdc.cn/data,
accessed on 1 March 2024)
Average annual
precipitation
1 km
Socioeconomic factorsPopulation density1 km
GDP1 km
Nighttime lighting data0.004°
Distance from
railroad
30 mNational Center for Basic
Geographic Information (http://www.ngcc.cn,
accessed on 1 March 2024)
Distance to highway30 m
Table 2. Carbon density table for land area utilization types on sea islands.
Land Use TypeCaboveCbelowCsoilCdeadSources
Land water body0.000.0094.600.00[53]
Cultivated land2.562.74106.900.50[50,51,53,54]
Woodland55.2015.40127.306.95[50,53,54]
Grassland1.486.38111.800.53[50,53,54]
Construction land0.110.0075.400.00[53]
Unused land0.000.0071.900.00[50,53]
Wetland5.745.4777.650.00[50,51,53]
Land water body0.000.0094.600.00[53]
Table 3. Carbon density table for sea area utilization types on sea islands 1.
Sea Area Utilization TypeCbenCsedSources
Shellfish farming area0.22156.00[45,61]
Algal farming area0.11130.00[45,55,57]
Integrated farming area0.16133.90[45,62]
Unused sea0.06101.40[62]
1 According to many years of historical data for Pingtan Island, the benthic organisms in the sea area of Pingtan Island are mainly annelid polychaetes, mollusks, and crustaceans; the average carbon content ratio selected for these three types of organisms is 0.408 [59]; and the mass of the dry weight selected for the sediments is 1.3 g/cm3 [58].
Table 4. Correlation coefficients for the carbon sink capacity of algae and shellfish.
TypeConversion Factor (%)Mass Weight (%)Carbon Ratio (%)
Soft TissueShellSoft TissueShell
Oyster65.106.1493.8645.9812.68
Mussel75.288.4791.5344.4011.76
Razor Clam64.2111.4188.5942.8211.45
Kelp20100031.200
Laver20100041.960
Table 5. Area changes in island utilization types.
Types of Island Utilization2006–20222022–2030 (NDS)2022–2030 (EDS)2022–2030 (EPS)
Area (km2)Dynamic Index (%)Area (km2)Dynamic Index (%)Area (km2)Dynamic Index (%)Area (km2)Dynamic Index (%)
Cultivated land−23.99−1.36−10.25−1.17−11.06−1.26−11.251−1.28
Woodland1.6880.162.4720.482.3350.453.3320.65
Grassland−0.11−0.62−0.12−1.36−0.136−1.55−0.014−0.16
Land water body0.060.07−0.56−1.38−0.557−1.37−0.504−1.24
Unused land−1.184−1.11−0.336−0.63−0.406−0.76−0.337−0.63
Construction land45.8263.199.3841.3110.4441.459.0521.26
Wetland0.230.84−0.03−0.22−0.05−0.36−0.023−0.17
Shellfish farming area13.9064.735.6343.835.6343.835.6333.83
Algal farming
area
4.1485.91−0.028−0.08−0.028−0.08−0.118−0.34
Integrated farming area−1.5−1.320.500.880.50.880.50.88
Unused sea−39.074−1.25−6.666−0.43−6.676−0.43−6.27−0.4
Table 6. Distribution of carbon stocks by components on Pingtan Island, 2006–2030.
YearCarbon Storage on the Island (104 t)
Terrestrial Carbon StorageMarine Carbon Storage
Benthic Organisms and SedimentsPhytoplanktonFishery Algae and Shellfish
2006325.308256.1615.8870.966
2010323.870256.54513.7051.110
2014326.476254.27714.6830.916
2018335.997239.95612.5081.257
2022335.610241.62512.7071.161
2030
(NDS)
335.266244.29713.1281.830
2030
(EPS)
335.834244.58013.1291.830
2030
(EDS)
334.788244.28713.1261.830
Disclaimer/Publisher’s Note: The statements, opinions and data contained in all publications are solely those of the individual author(s) and contributor(s) and not of MDPI and/or the editor(s). MDPI and/or the editor(s) disclaim responsibility for any injury to people or property resulting from any ideas, methods, instructions or products referred to in the content.

