Article

Numerical Simulation of Saltwater Intrusion in the Yangtze River Estuary Based on a Finite Volume Coastal Ocean Model

by
Xinjun Wang
1,
Haiyun Shi
2,
Yuhan Cao
1,*,
Changming Dong
3 and
Chunhui Li
3
1
School of Marine Technology and Geomatics, Jiangsu Ocean University, Lianyungang 222005, China
2
Wuxi Ninecosmos Technology Co., Ltd., Wuxi 214000, China
3
School of Marine Sciences, Nanjing University of Information Science and Technology, Nanjing 210044, China
*
Author to whom correspondence should be addressed.
J. Mar. Sci. Eng. 2024, 12(10), 1752; https://doi.org/10.3390/jmse12101752 (registering DOI)
Submission received: 12 August 2024 / Revised: 25 September 2024 / Accepted: 26 September 2024 / Published: 4 October 2024
(This article belongs to the Section Physical Oceanography)

Abstract

:
Saltwater intrusion is a common issue in the Yangtze River estuary (YRE), significantly affecting the nearshore ecological environment and human activities. Using 20 years of runoff data, a high-resolution Finite-Volume Coastal Ocean Model (FVCOM) is constructed to simulate the lower reaches and estuary of the Yangtze River. This model is employed to analyze full-depth current and salinity characteristics and to explore the influence of factors such as runoff, wind, tides, and riverbank morphology on saltwater intrusion in the YRE. The model’s accuracy is validated by comparing its output with current speed and salinity observations and comparing long-term salinity variations with reanalysis data. The comparison shows that the model well reproduces the saltwater intrusion in the YRE. Over the long term, the salinity pattern exhibits a “high–low–high” variation. Analyzing the vertical structure of the intrusion, it is observed that during summer, surface waters are heated, resulting in stronger stratification, weaker mixing, and a more pronounced saltwater intrusion in the YRE. Using power spectrum and correlation analyses, runoff is identified as the factor having the greatest impact on saltwater intrusion, followed by meridional wind and changes in riverbank morphology. This study of the variations in long-term saltwater intrusion has important reference value for the protection of freshwater resources in the YRE.

1. Introduction

Estuarine regions are vital transition zones where river freshwater and ocean saltwater interact, facilitating the exchange of materials and energy. These areas are characterized by dynamic interactions between river and ocean processes, primarily driven by tides and waves. The circulation patterns in estuaries significantly impact the wetland ecosystem, water cycle, nutrient transport, and human activities [1,2]. The Yangtze River is the largest river flowing into the western Pacific Ocean. The Yangtze River estuary (YRE) is a large bifurcated mesotidal estuary receiving heavy sediment loading from the Yangtze River. The distribution of islands along the coastline and within the river mouth divides the YRE into three branching sections, ultimately forming four outlets that flow into the East China Sea. The hydrodynamic characteristics of the YRE are complex, influenced by factors such as sediment deposition [3,4], ocean dynamics [5,6], runoff [7], and riverbank morphology [8].
Saltwater intrusion is a common and significant physical phenomenon in estuaries, particularly in the YRE. This intrusion can have severe consequences for both industrial and agricultural activities, as well as for local communities. High salinity levels can negatively impact industrial production, freshwater aquaculture, and fisheries. In addition, saltwater intrusion increases the salinity of groundwater and soil, posing risks to local vegetation and causing substantial economic losses [9]. In recent years, numerous studies have investigated saltwater intrusion in the YRE using a variety of methods. For instance, Dai et al. [10] conducted a statistical analysis of long-term records of sediment flux, riverbed morphology, and estuarine hydrology, quantifying the spatiotemporal changes in sediment transport. They found that dam construction, sea level rise, and storms can significantly influence sediment transport between land and ocean, thus affecting saltwater intrusion into the YRE. Using spatiotemporal measurements of spring–neap tidal variations in flow velocity, salinity, and suspended sediment concentration, Wan et al. [11] identified the baroclinic pressure gradient caused by salinity as a main factor controlling the vertical velocity structure. Numerical simulations have become a widely used method for studying saltwater intrusion events. Various models have been employed to understand the dynamics of saltwater intrusion in the YRE. For instance, a three-dimensional (3D) hydrodynamic and salinity transport model based on MIKE3 was used to assess the impact of sea-level rise on saltwater intrusion in the YRE [12,13]. Zhu et al. [14] developed a 3D numerical model using an HSIMT-TVD advection scheme to examine the hydrodynamic processes and saltwater intrusion in the YRE. Xu et al. [15] used the MIKE21 hydrodynamic and salinity transport model to quantify the influence of the river discharge on saltwater intrusion in the YRE. The semi-empirical Estuarine, Coastal, and Ocean Model (ECOM si) was used to study the effect of seasonal tidal variation on saltwater intrusion [16]. Based on the ECOM si, Li et al. [17] studied the influence of the dikes of the deep waterway project on saltwater intrusion in the estuary under climatic and persistent strong northerly wind conditions. Huang et al. [18] performed numerical simulations to investigate how water abstraction from the east route of the South-to-North Water Transfer Project influences saltwater intrusion in the YRE.
The Unstructured Grid Finite-Volume Coastal Ocean Model (FVCOM) has been extensively applied to research nearshore tidal currents [19,20,21,22] and has also been used to explore the dynamic mechanisms of saltwater intrusion in estuaries [23]. Xue et al. [24] found that saltwater intrusion results from the nonlinear interactions of upstream freshwater flux, tidal currents, mixing, wind, and salt distribution in the inner shelf of the East China Sea. Similarly, Wang et al. [25] used a three-dimensional baroclinic numerical model and found that the nearshore current in the Yellow Sea is a key factor influencing saltwater intrusion in the north branch of the Yellow Sea. In the Pearl River estuary, Cheng et al. [26] used the FVCOM to simulate saltwater intrusion in the four western watercourses under three different lunar conditions. Moreover, Shen et al. [27] used the FVCOM Surface Wave Module (FVCOM-SWAVE) to predict the effects of land reclamation on saltwater intrusion and storm surges in the Pearl River estuary. While several studies focused on the relationship between saltwater intrusion in estuaries and a specific influencing factor, little is known about the multiple-scale variability of saltwater intrusion and the relationship between the long-term variation in intrusion distance and various influencing factors.
This study aims to analyze the periodic variations in saltwater intrusion in the YRE during 1993–2012 (20 years) and explore the effects of runoff, wind, tide, and riverbank morphology on saltwater intrusion in the region. In contrast to previous studies, we developed a high-resolution 3D FVCOM that covers the entire area from the lower reaches to the estuary of the Yangtze River. The model features a high-resolution unstructured mesh that better fits the study area. Moreover, runoff data from the Datong hydrological station, located 624 km upstream of the Yangtze River estuary, are included in the simulations to enhance the model’s accuracy.
The remainder of this paper is structured as follows. Section 2 describes the data, methods, model configuration, and model validation. Section 3 presents the main results, while Section 4 discusses the main dynamic factors influencing saltwater intrusion in the YRE. Finally, Section 5 provides a summary of the findings.

2. Materials and Methods

2.1. Data

2.1.1. Remote Sensing Data

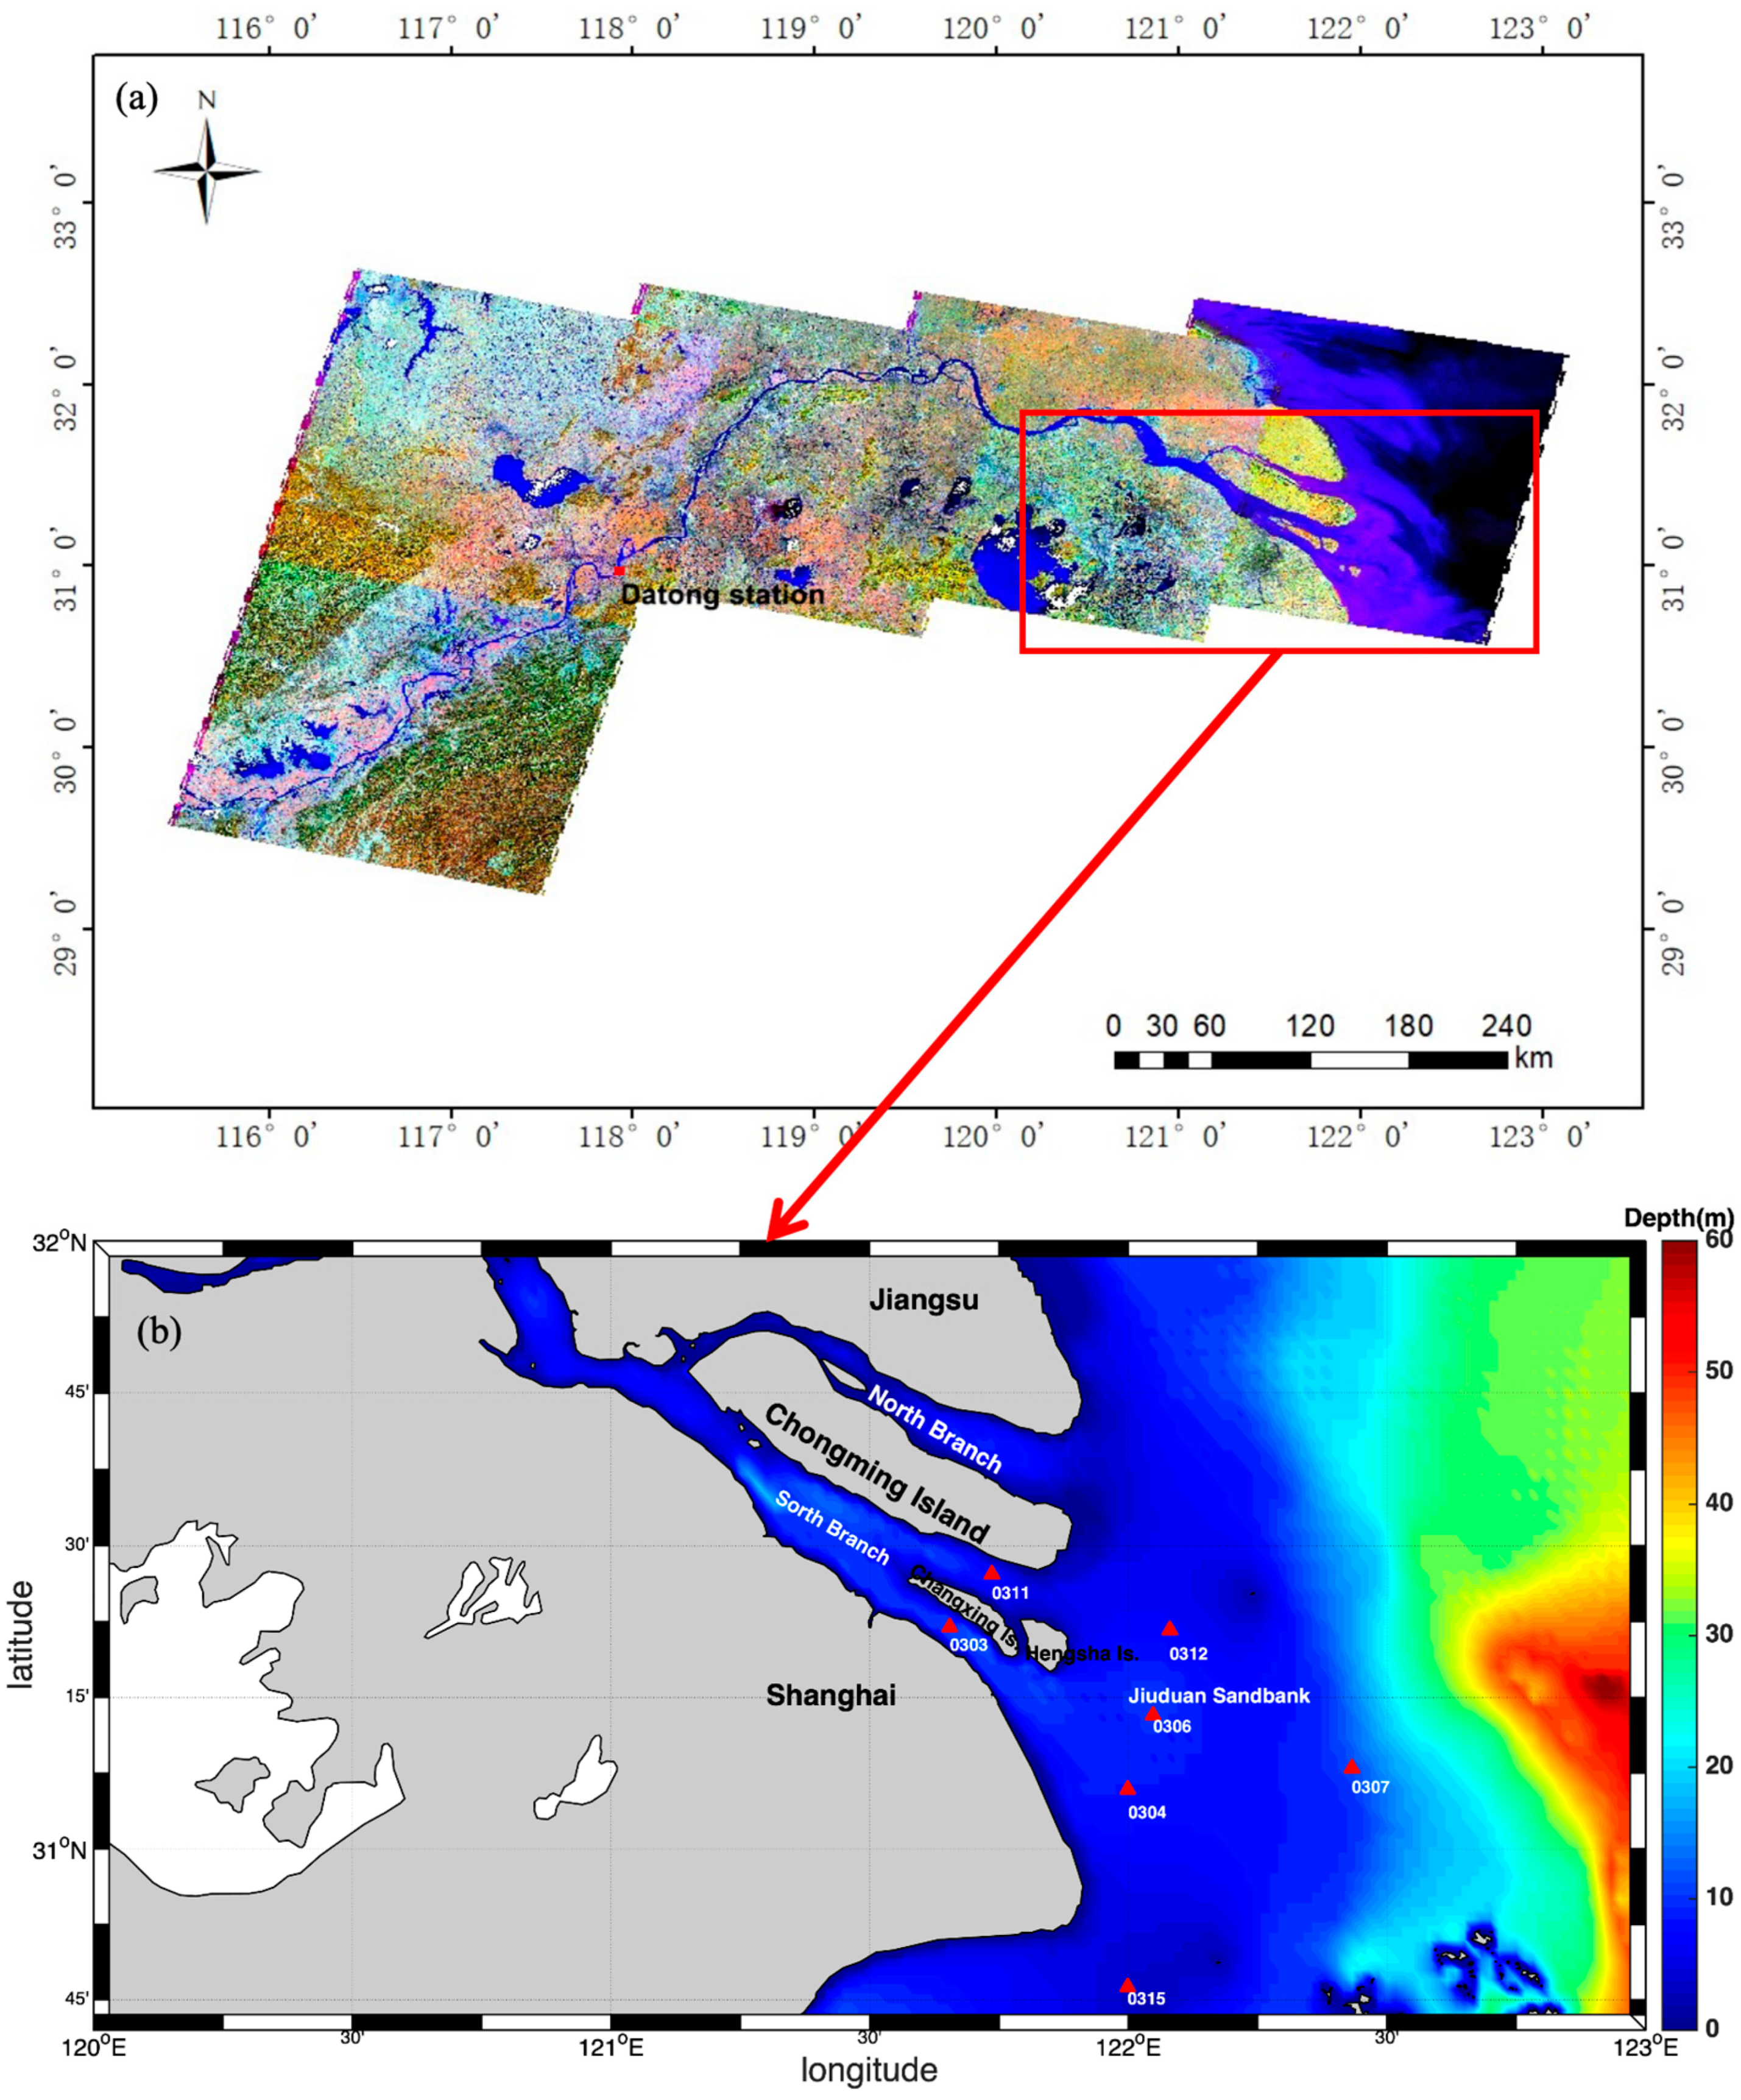
Satellite images of the study area are selected from Landsat TM, ETM, and UTM, captured in 1993, 1997, 2002, 2003, 2004, 2007, and 2012. The Landsat remote sensing images are obtained from the geospatial data cloud platform of the Chinese Academy of Sciences Computer Grid Information Center (http://www.gscloud.cn (accessed in 18 June 2024)). The schematic diagram of the research area consists of five Landsat satellite images stitched together (Figure 1a). The imaging dates for the five images are 24 December, 15 December, 5 February, 26 October 2003, and 15 February 2004, respectively. Table 1 summarizes the main information of the satellite images used to analyze riverbank morphology changes. The satellite images are processed using ENVI5.6 for radiometric calibration, atmospheric correction, image cropping, density segmentation, image vectorization, and stripe processing.

2.1.2. Forcing Data

The hydrological data for the study area comes from the Datong Station, which is the main hydrological control station on the Yangtze River’s main stream, located in Guichi District, Chizhou City, Anhui Province (Figure 1a). Datong Station plays a critical role in monitoring the water entry into the Yangtze River and protecting the water source. The station is classified as a first-class precision station for both flow and sediment measurements. Since 1950, it has continuously monitored water levels, annual runoff, sediment transport, average sediment content, and other key hydrological characteristics. According to the Jiangsu Provincial Water Resource Bulletin, the Yangtze River Basin Sand Bulletin, China River Sand Bulletin, and other sources, the station records an average annual runoff of about 896.4 billion cubic meters [28]. The model’s initial river boundary conditions are derived from the daily runoff data provided by Datong Station.
Temperature and salinity data are sourced from the global numerical products of the Hybrid Coordinate Oceanic Circulation Model (HYCOM), with a spatial resolution of 1/12 degrees and a temporal resolution of once a day. The spatial extent of the data covers 30–32° N, 121–123° E.
The initial tidal boundary conditions for the YRE are simulated using the global ocean tidal model NAOTIDE, which includes 16 tidal components: M2, S2, N2, K2, K1, O1, P1, Q1, MU2, NU2, T2, L2, 2N2, J1, M1, and OO1.
Wind and heat flux are provided by the Climate Forecast System (CFSR) and Climate Forecast System Reanalysis version 2 (CFSv2) datasets from the National Centers for Environmental Prediction (NCEP) Reanalysis, with spatial resolutions of 0.312° × 0.312° and 0.205° × 0.204°, respectively, and 6-hourly temporal resolution. The spatial coverage extends from 29 to 33° N and 115 to 123° E.

2.1.3. Bathymetry and Topography Data

Bathymetry data are obtained from the ETOPO1 dataset provided by the National Oceanic and Atmospheric Administration (NOAA). This dataset offers a 1-arc min global relief model of the Earth’s surface, integrating land topography and ocean bathymetry. The YRE covers a vast area, stretching from Datong to the nearshore zone. The estuary undergoes multilevel bifurcations. The North Branch and South Branch are separated by Chongming Island, while Changxing and Hengsha Islands separate the north and south channels. The Jiuduan Sandbank further divides the south channel into the north and south passages. The water depth is greatest in the eastern part of the estuary and decreases around the islands and near the coast (Figure 1b).
Topography data for the study area are digitized from the Navigation Reference Map of the Lower Yangtze River published by the Nanjing Navigation Bureau of the Yangtze River, as well as from nautical charts published by the China Navigation Book Publishing House.
Figure 1. (a) Satellite schematic diagram of the research area and (b) topography of the Yangtze River estuary. Shaded is the bathymetry (unit: m) from ETOPO1. The red triangles represent measuring stations.
Jmse 12 01752 g001

2.2. Model Configuration

The FVCOM is a prognostic, unstructured-grid, finite-volume, free-surface, 3D primitive equation coastal ocean circulation model developed through the joint efforts of UMASSD and WHOI [29,30]. It is used to simulate saltwater intrusion in the YRE. The model adopts the finite volume method (FVM), which offers both high accuracy and computational efficiency. The use of an unstructured triangular mesh allows for precise fitting to the study area’s irregular coastal geometry. Its governing Equations in a rectangular coordinate are given as follows:
u t + u u x + v u y + w u z f v = 1 ρ 0 P x + z K m u z + F u
v t + u v x + v v y + w v z + f u = 1 ρ 0 P y + z K m v z + F v
P z = ρ g
u x + v y + w z = 0
T t + u T x + v T y + w T z = z K h T z + F T
S t + u S x + v S y + w S z = z K h S z + F S
where u, v, w are the velocity component of the x (east), y (north), and z (vertical upward) direction, T is the temperature, S is the salinity, P is the pressure, f is the Coriolis parameter, g is the gravitational acceleration, Km is the vertical rotation viscosity coefficient, and Kh is the vertical rotational diffusion coefficient of heat. Fu, Fv, FT, and FS represent the diffusion terms of horizontal momentum, heat, and salinity, respectively. The depth of the overall water column is D = H + ξ , H is the bottom depth, and ξ is the free surface height [31].
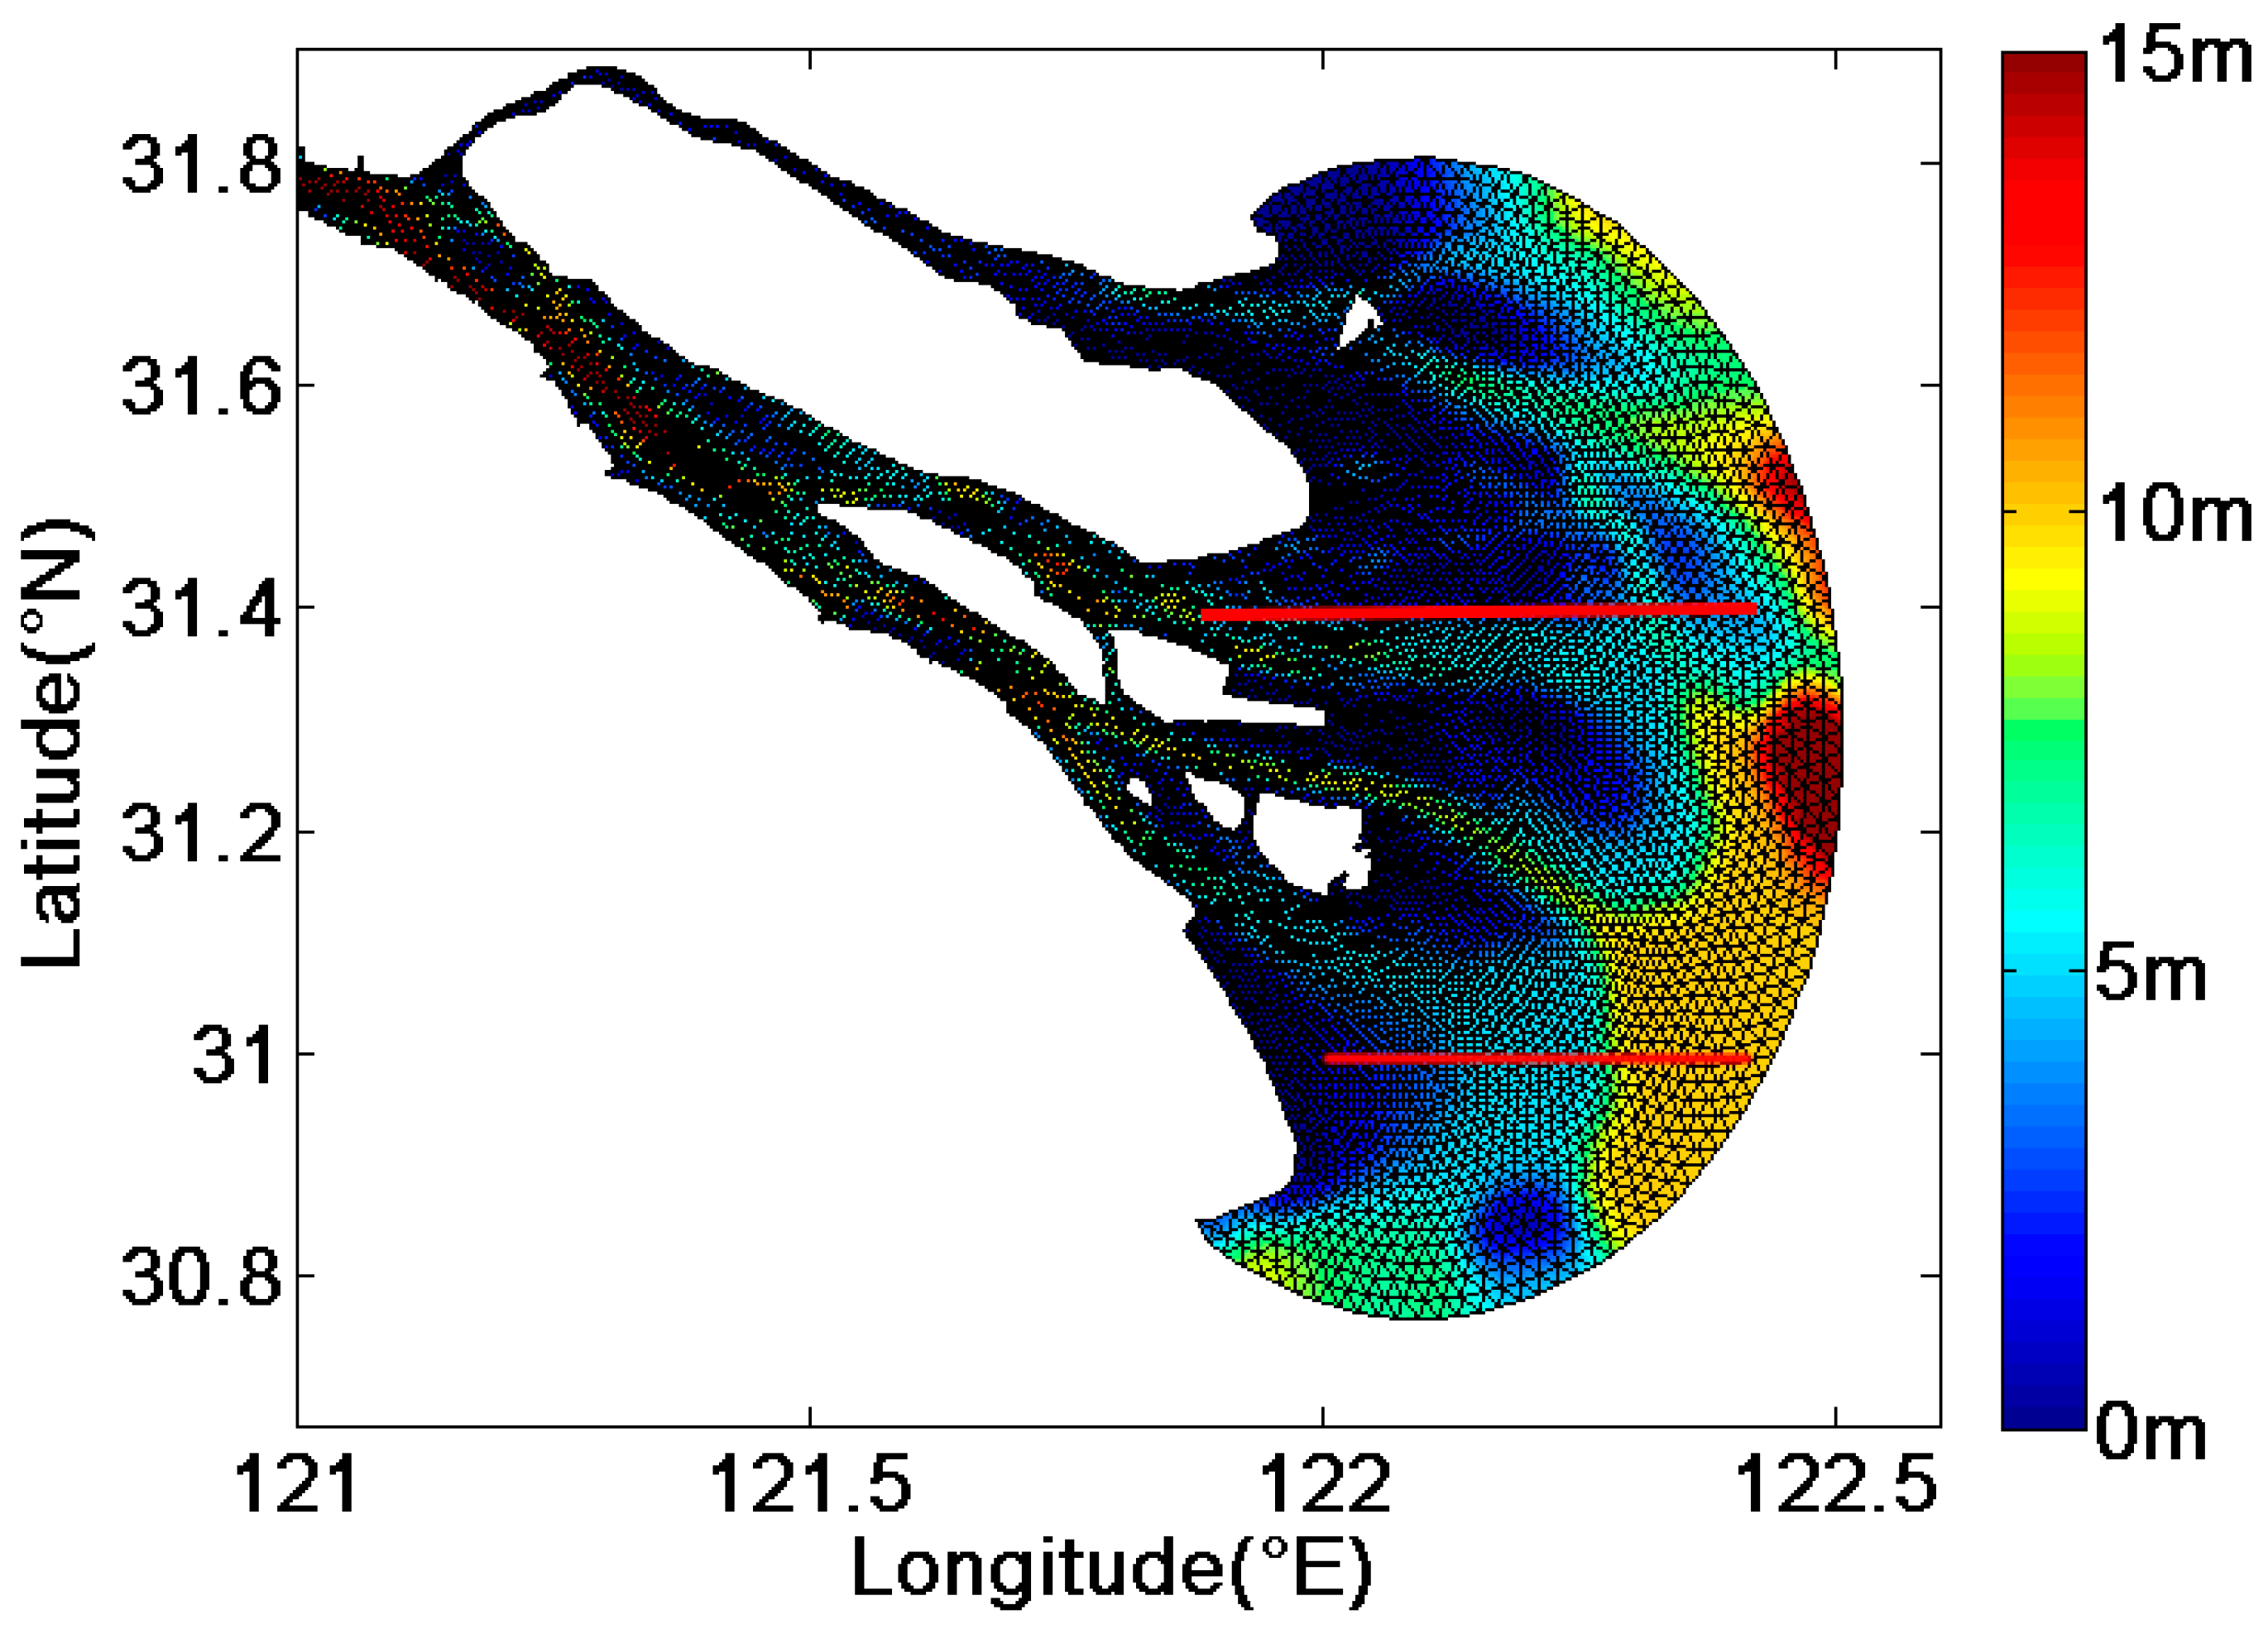
The FVCOM is configured to cover the lower reaches of the Yangtze River to the estuary, using long-term runoff data from Datong Station in Anhui Province. The simulation area extends from Jiujiang City in Jiangxi Province to the estuary of the Yangtze River between Shanghai and Nantong City in Jiangsu Province, spanning a longitude range of 116.13–122.51° E. The simulation period runs from 00:00 on 2 October 1992 to 00:00 on 31 December 2012. The grid for the study area was generated using Surface Water Modeling System (SMS) software version 8.1, with the Yangtze River coastline and the central river boundary extracted from Google Earth. The spatial resolution of the grid is 500 m in the river segment, with finer mesh (100 m) in shallow areas (Figure 2). The mesh resolution varies from 500 m to 2000 m near the estuary, with a total of 26,459 nodes and 46,142 cells. The river boundary consists of 22 nodes, while the offshore open boundary includes 95 nodes (Figure 3). Vertically, the model uses a hybrid terrain-following coordinate with a total of 10 layers. The external time step is set to 0.6 s, with an internal-to-external time step ratio of 8. Output is recorded every hour. To obtain the initial conditions, the model undergoes a three-month spin-up period, starting from 00:00 on 2 October 1992 and driven by wind forcing. After stabilization, the analysis focuses on data from a 20-year period, running from 1 January 1993 to 31 December 2012.

2.3. Calculation of Saltwater Intrusion Distance

Saltwater intrusion is a common phenomenon in estuaries. This study applies the threshold method to define the distance of saltwater intrusion:
L = ( B A ) × π R 180 × c o s φ ,
where L is the intrusion distance (unit: km) and B is the longitude of the saltwater boundary, which is 122.51 °E. A is defined as the longitude at which the salinity reaches the threshold of 0.5, R is the radius of the Earth of 6356.755 km, and φ is the geographic latitude.

2.4. Power Spectrum Analysis

Power spectrum analysis is a method used to objectively and quantitatively identify significant periodicities in time series data. By applying harmonic analysis, the amplitude of harmonics of different orders are calculated, with larger amplitudes corresponding to stronger energy [32]. Assuming a random power signal X(t),
X ( t ) = X T ( t ) , t [ T / 2 , T / 2 ]
where T represents a certain time series and XT(t) is the power signal with a time interval of [−T/2, T/2]. The average power during this time interval can be expressed as
P T = 1 T T / 2 T / 2 X 2 ( t ) d t
where PT represents the average power spectral density. Fourier transform of X(t):
F T ω = F X T ( t )
where F[ ] represents the Fourier transform, FT(ω) represents the power signal after the Fourier transform, and ω is the frequency. When T is infinitely large, XT(t) tends toward X(t). If the F T ( ω ) 2 2 π T limit exists, then
P T = lim T 1 T T / 2 T / 2 X 2 ( t ) d t = 1 2 π lim T F T ( ω ) 2 T d ω
The power spectrum P(ω) expression is as follows:
P ( ω ) = lim T F T ω 2 2 π T

2.5. Model Validation

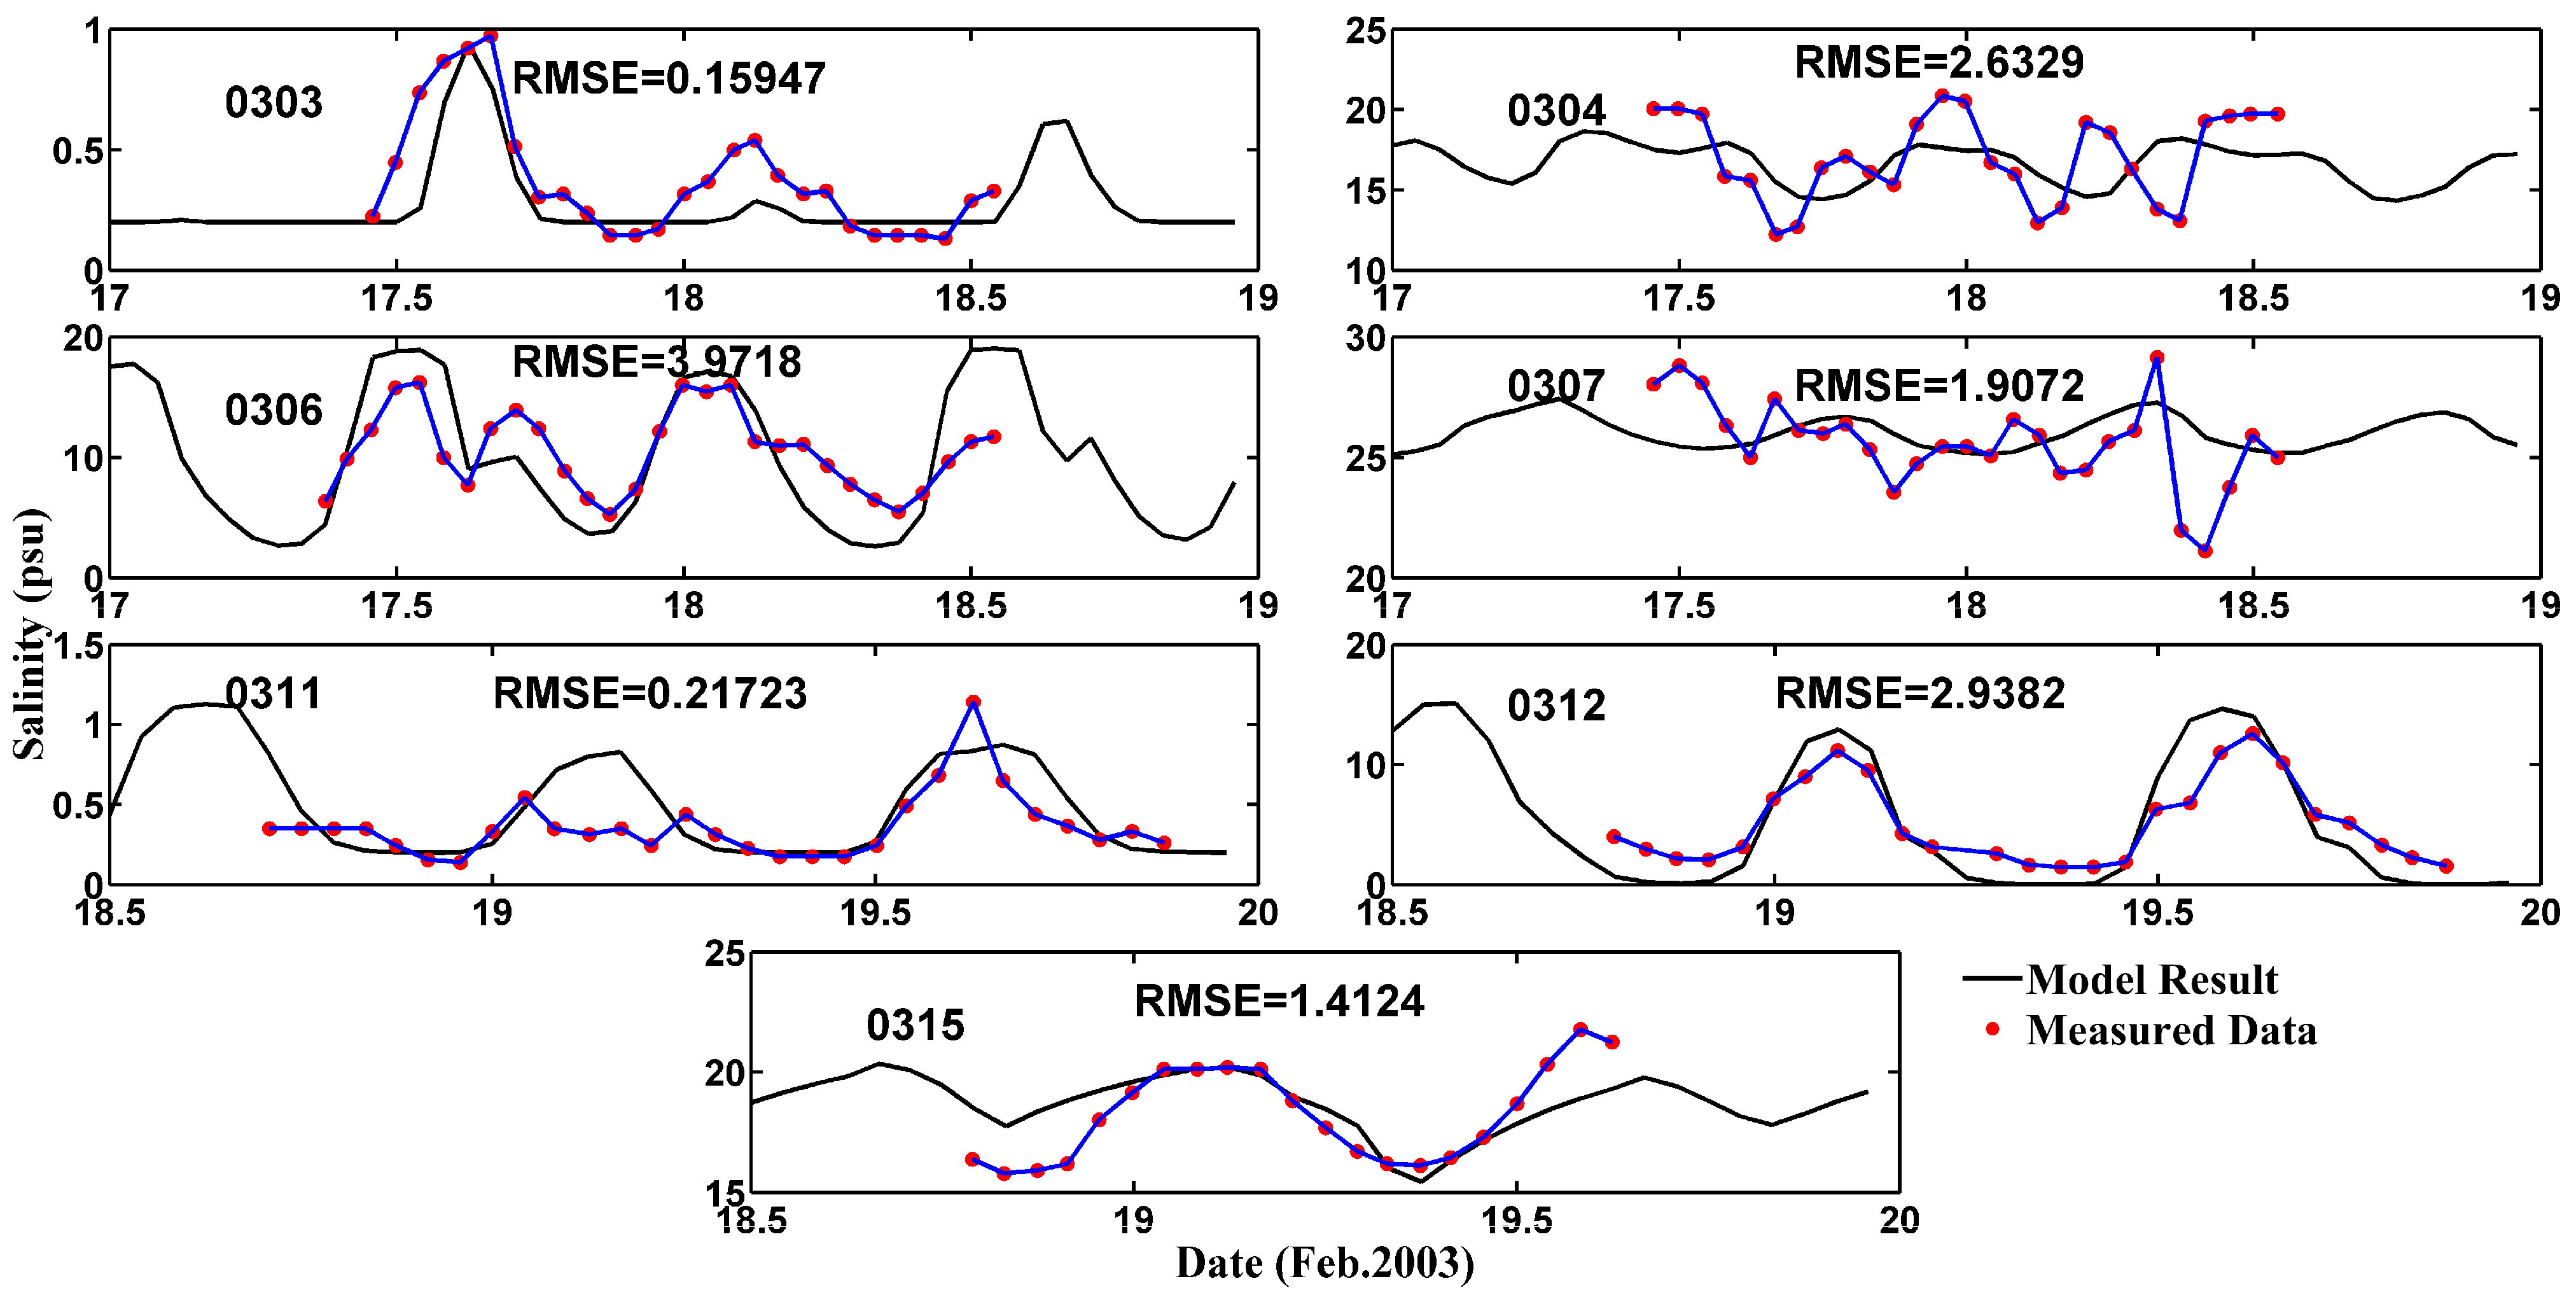
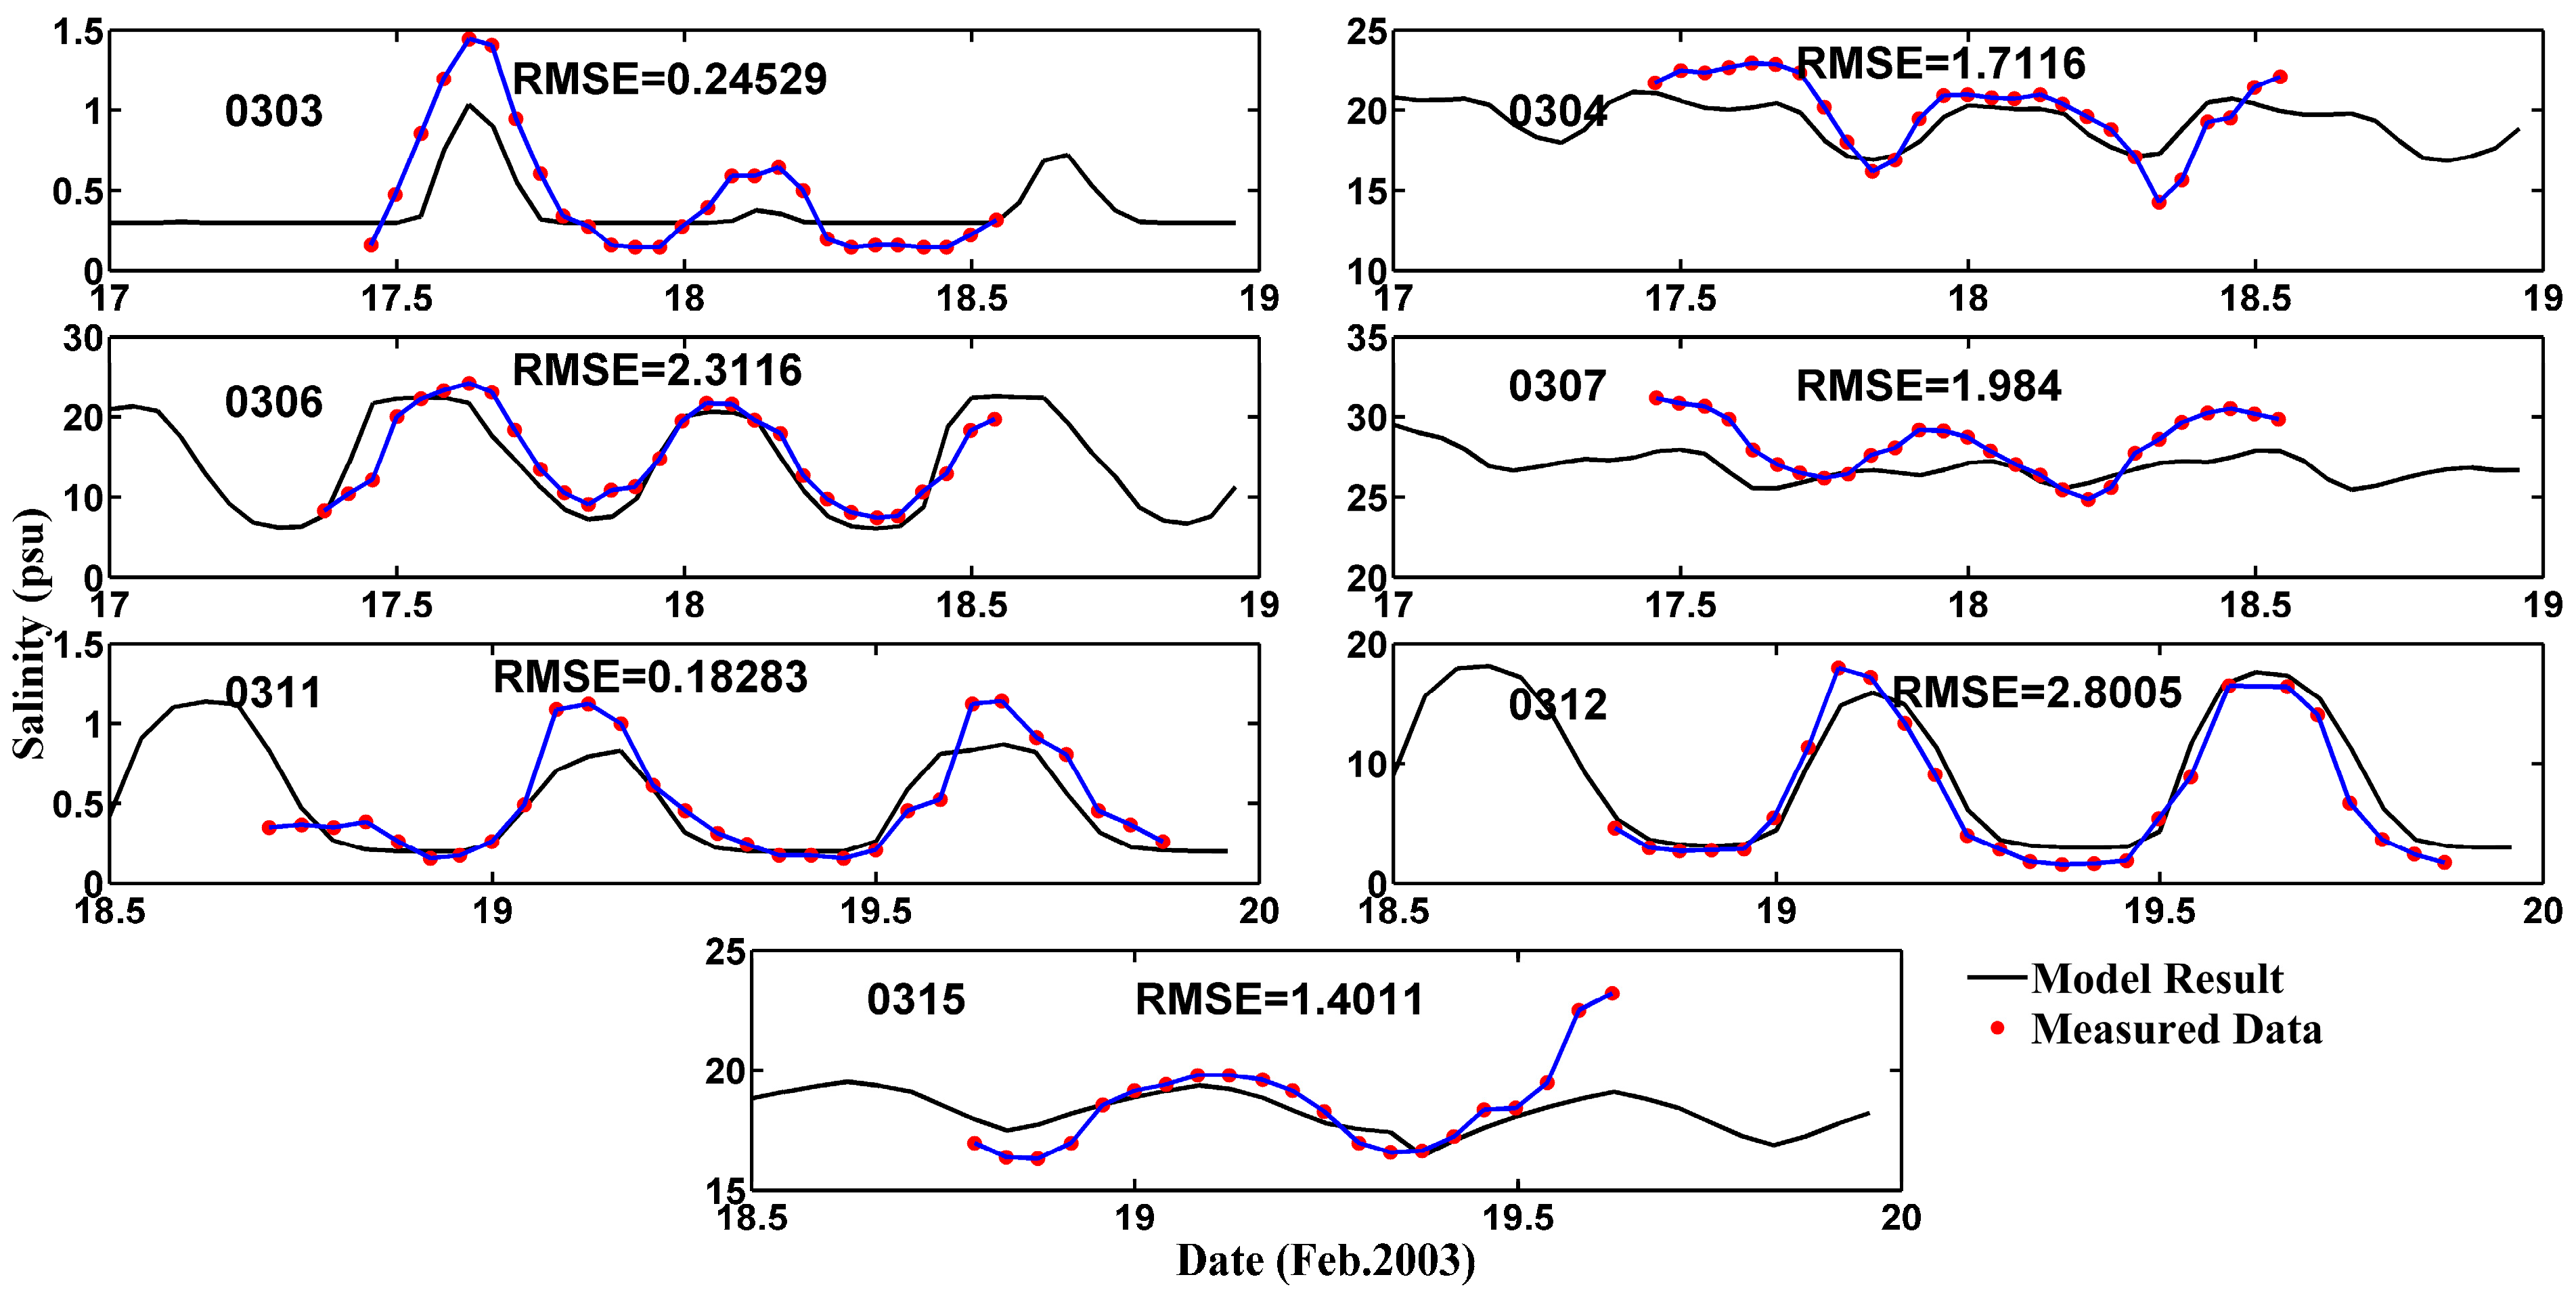
The model’s results for surface and bottom layer current speed and salinity are validated using observational data collected during ship measurements in the YRE by East China Normal University from 17 February to 19 February 2003, which corresponds to the dry season. Data from seven measuring stations (0303, 0304, 0306, 0307, 0311, 0312, and 0315) are selected to verify the simulated current speed and salinity (Figure 1b).
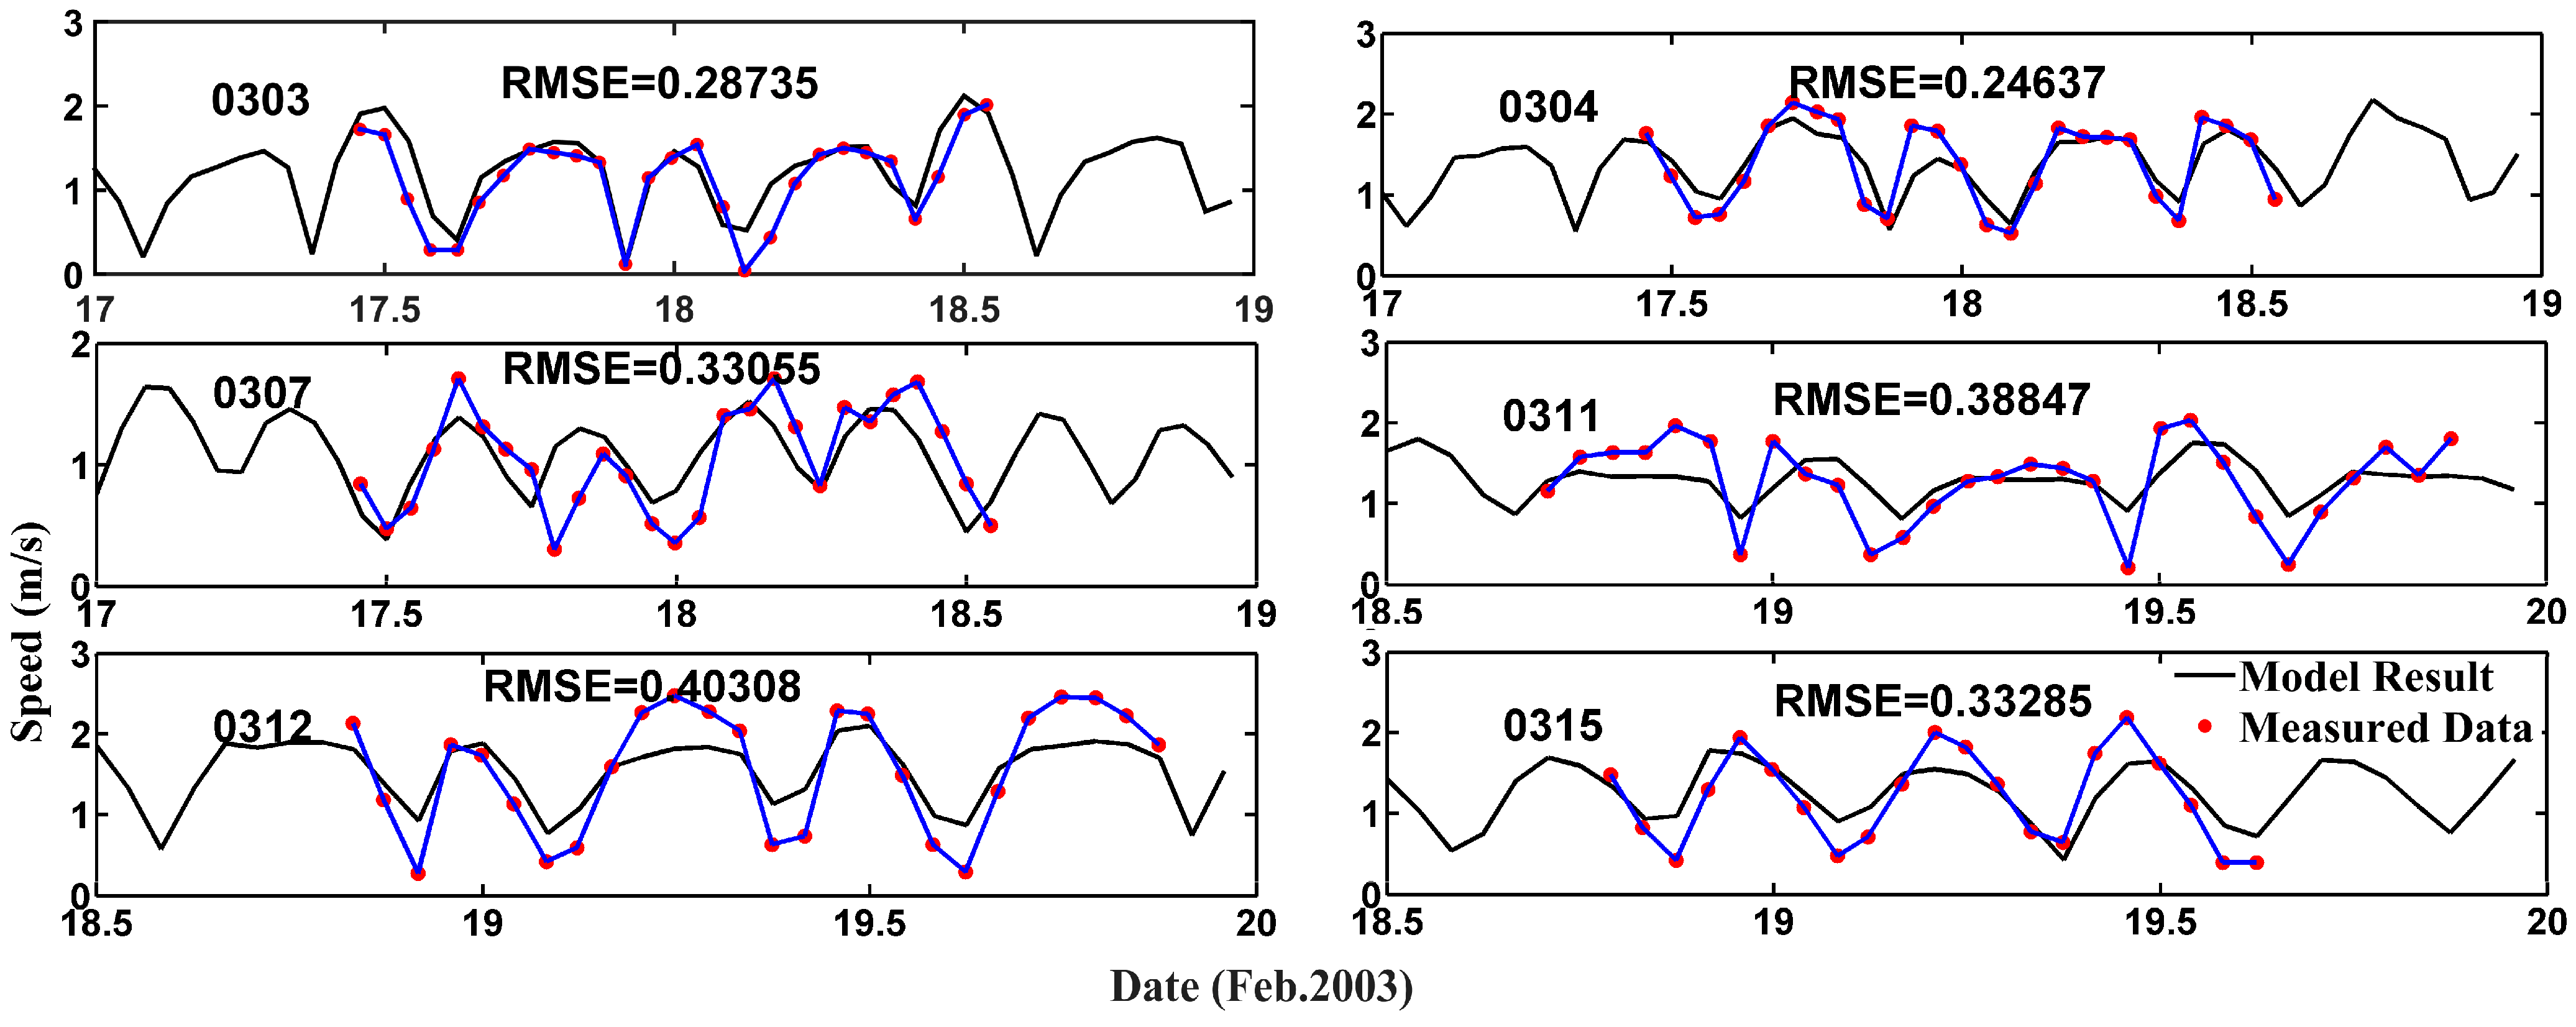
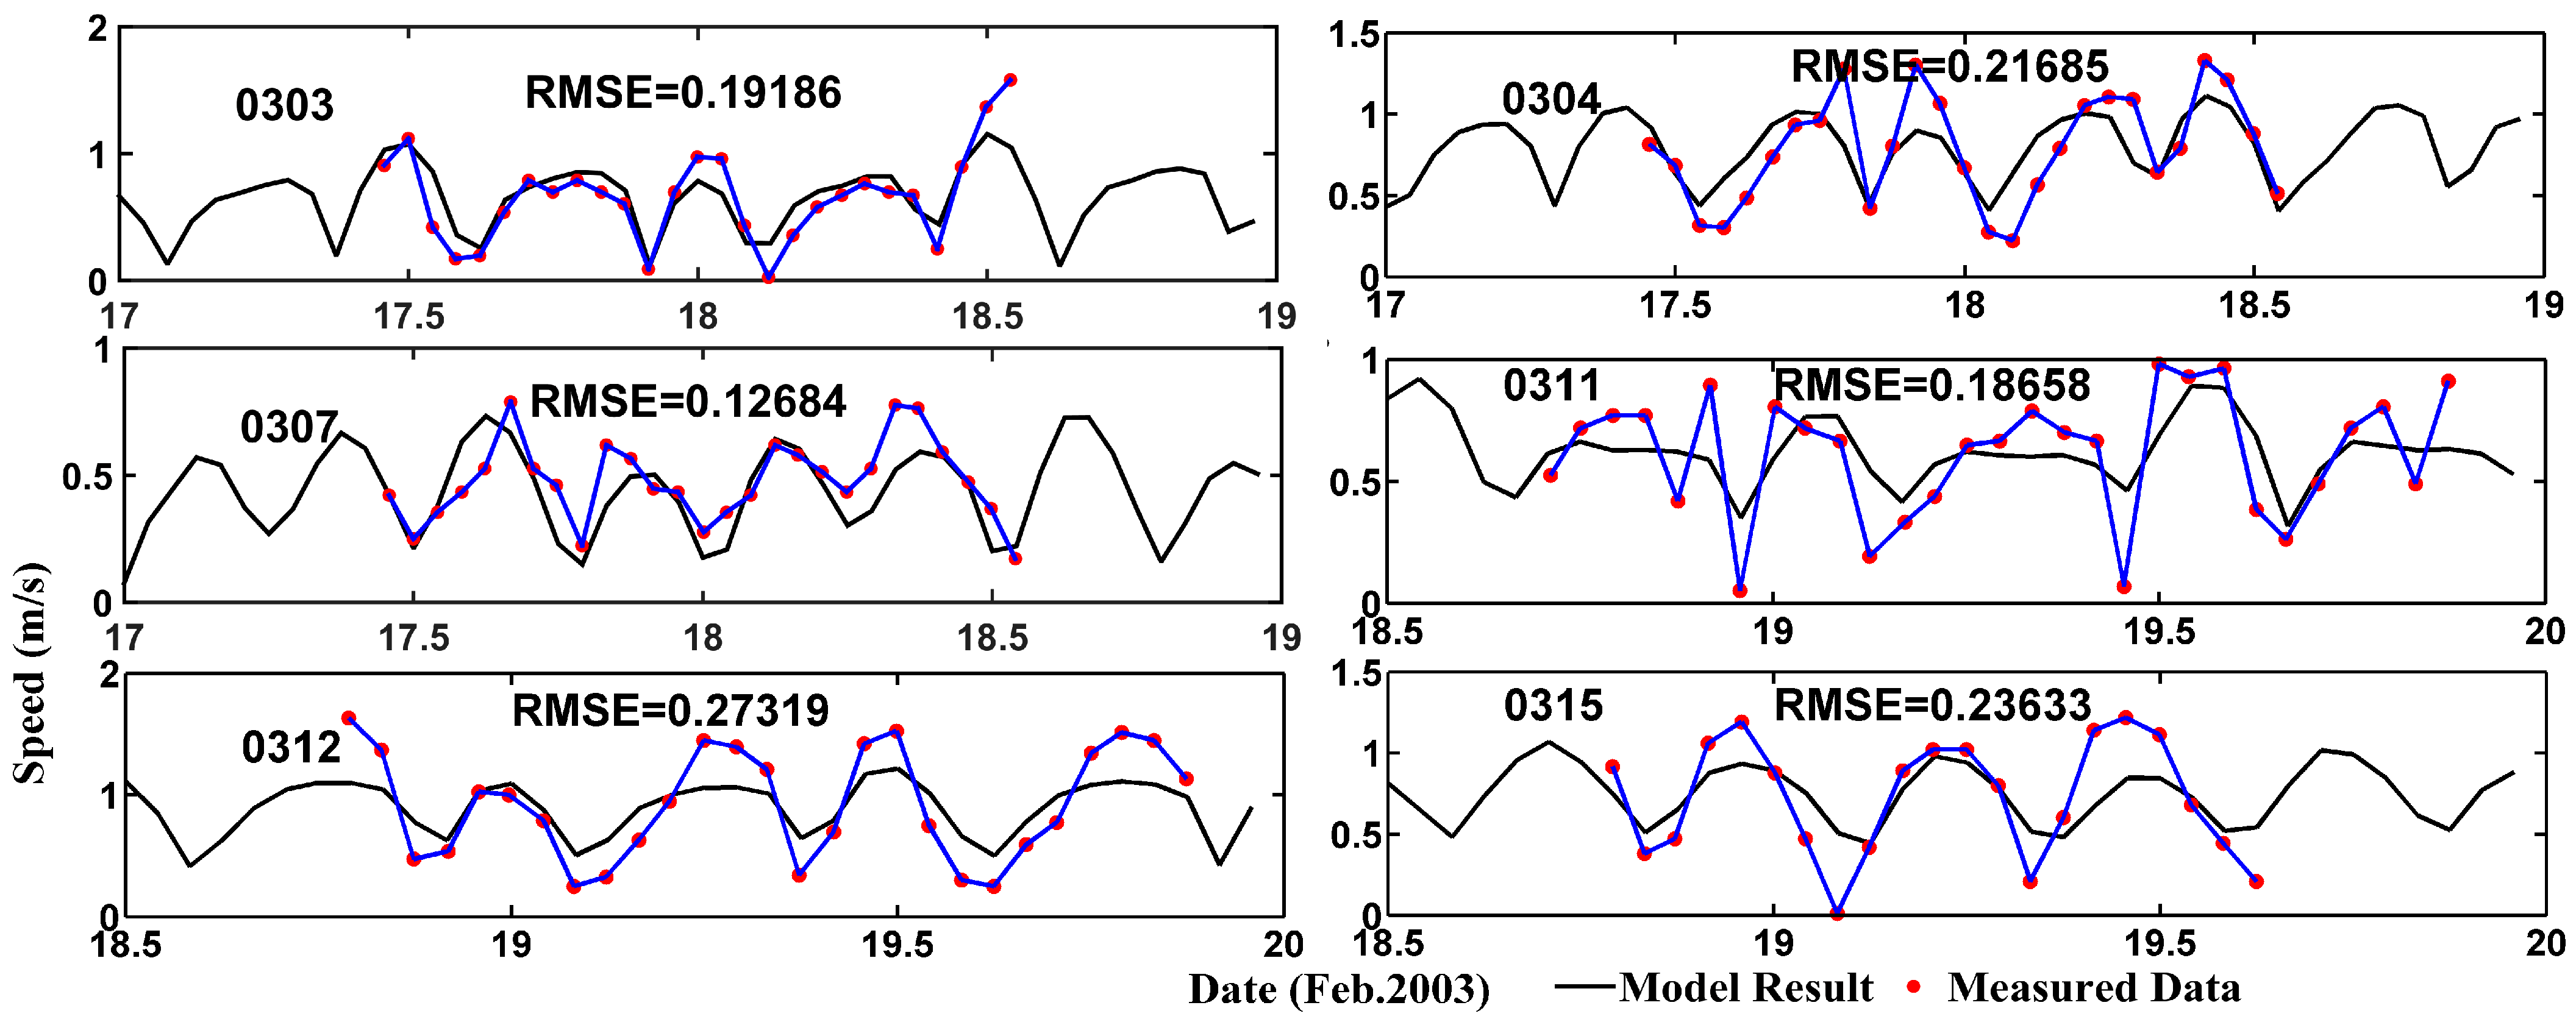
A comparison between the simulated surface current speed and observation data (Figure 4) shows that the model accurately captures the variations at six stations. The root mean square error (RMSE) ranges from 0.246 m/s at station 0304 to 0.403 m/s at station 0312, indicating that the model provides reliable estimates of surface current speed. Figure 5 compares the bottom current speed with the minimum RMSE of 0.127 m/s at station 0307 and the maximum RMSE of 0.273 m/s, demonstrating that the model also performs well in simulating bottom current speed.
Figure 6 and Figure 7 present comparisons of surface and bottom salinity between the model and observed data. The RMSEs of the surface salinity at stations 0303, 0304, 0306, 0307, 0311, 0312, and 0315 are 0.16 PSU, 2.63 PSU, 3.97 PSU, 1.91 PSU, 0.22 PSU, 2.94 PSU, and 1.42 PSU, respectively. The RMSEs of the bottom salinity at the seven stations are 0.24 PSU, 1.71 PSU, 2.31 PSU, 1.98 PSU, 0.18 PSU, 2.80 PSU, and 1.40 PSU, respectively.
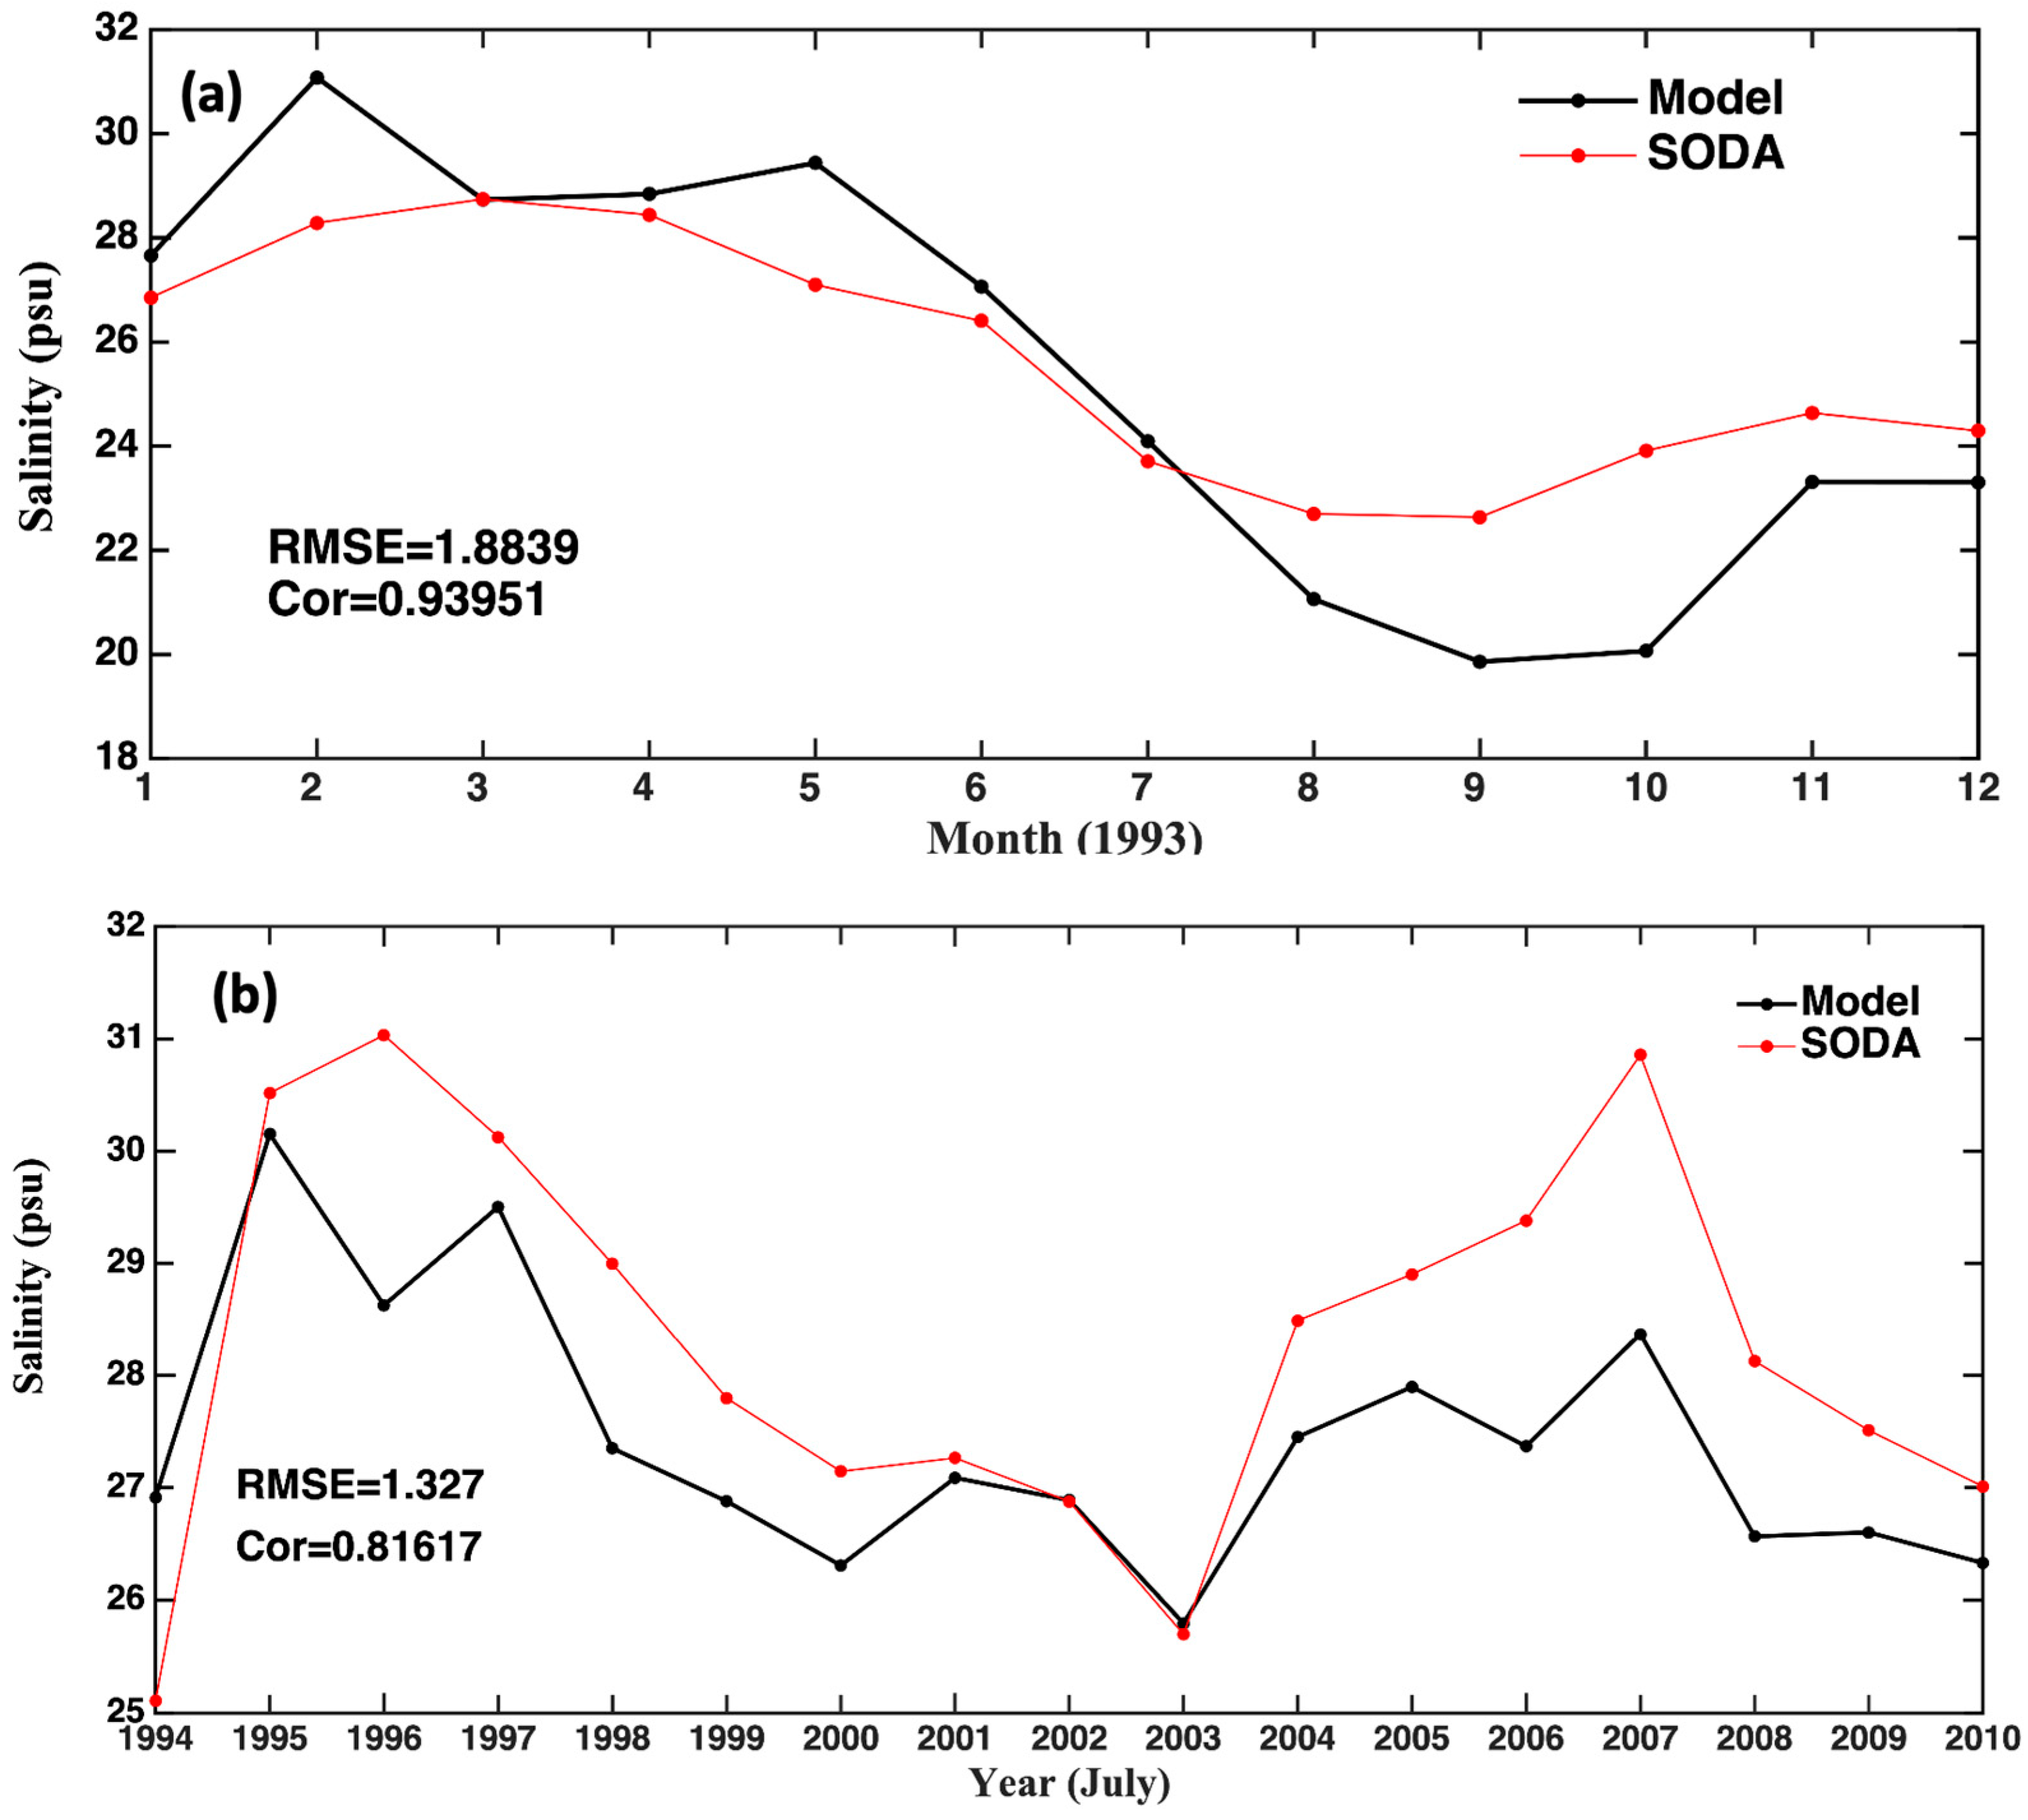
The Simple Ocean Data Assimilation (SODA) is an ocean reanalysis dataset consisting of gridded variables for the global ocean, as well as several derived fields. The SODA reanalysis project was developed by the University of Maryland in the early 1990s [33]. The monthly mean SODA reanalysis dataset from 1993 to 2010 was used to validate the salinity of the model. SODA products have been widely used to study global and regional large-scale ocean dynamics [34,35,36,37]. SODA reanalysis data covered the grid points (122.25° E, 31.25° N) in the simulation area of this study, and the salinity of the grid points is selected for verification. Figure 8a shows the monthly average surface salinity simulated by the model and the surface salinity of SODA in 1993. The RMSE of the monthly average surface salinity is approximately 1.88 PSU and the correlation coefficient between the simulated surface salinity and SODA is 0.94. In the interannual scale, the validation of the model’s result for surface salinity is conducted by using monthly average surface salinity data from SODA over the 1994–2010 period (Figure 8b). The RMSE is 1.327 PSU and the correlation coefficient is 0.816. The above numbers suggest that the simulated current speed and salinity by the model are reliable.

3. Results

3.1. Salinity Characteristics of the Yangtze River Estuary

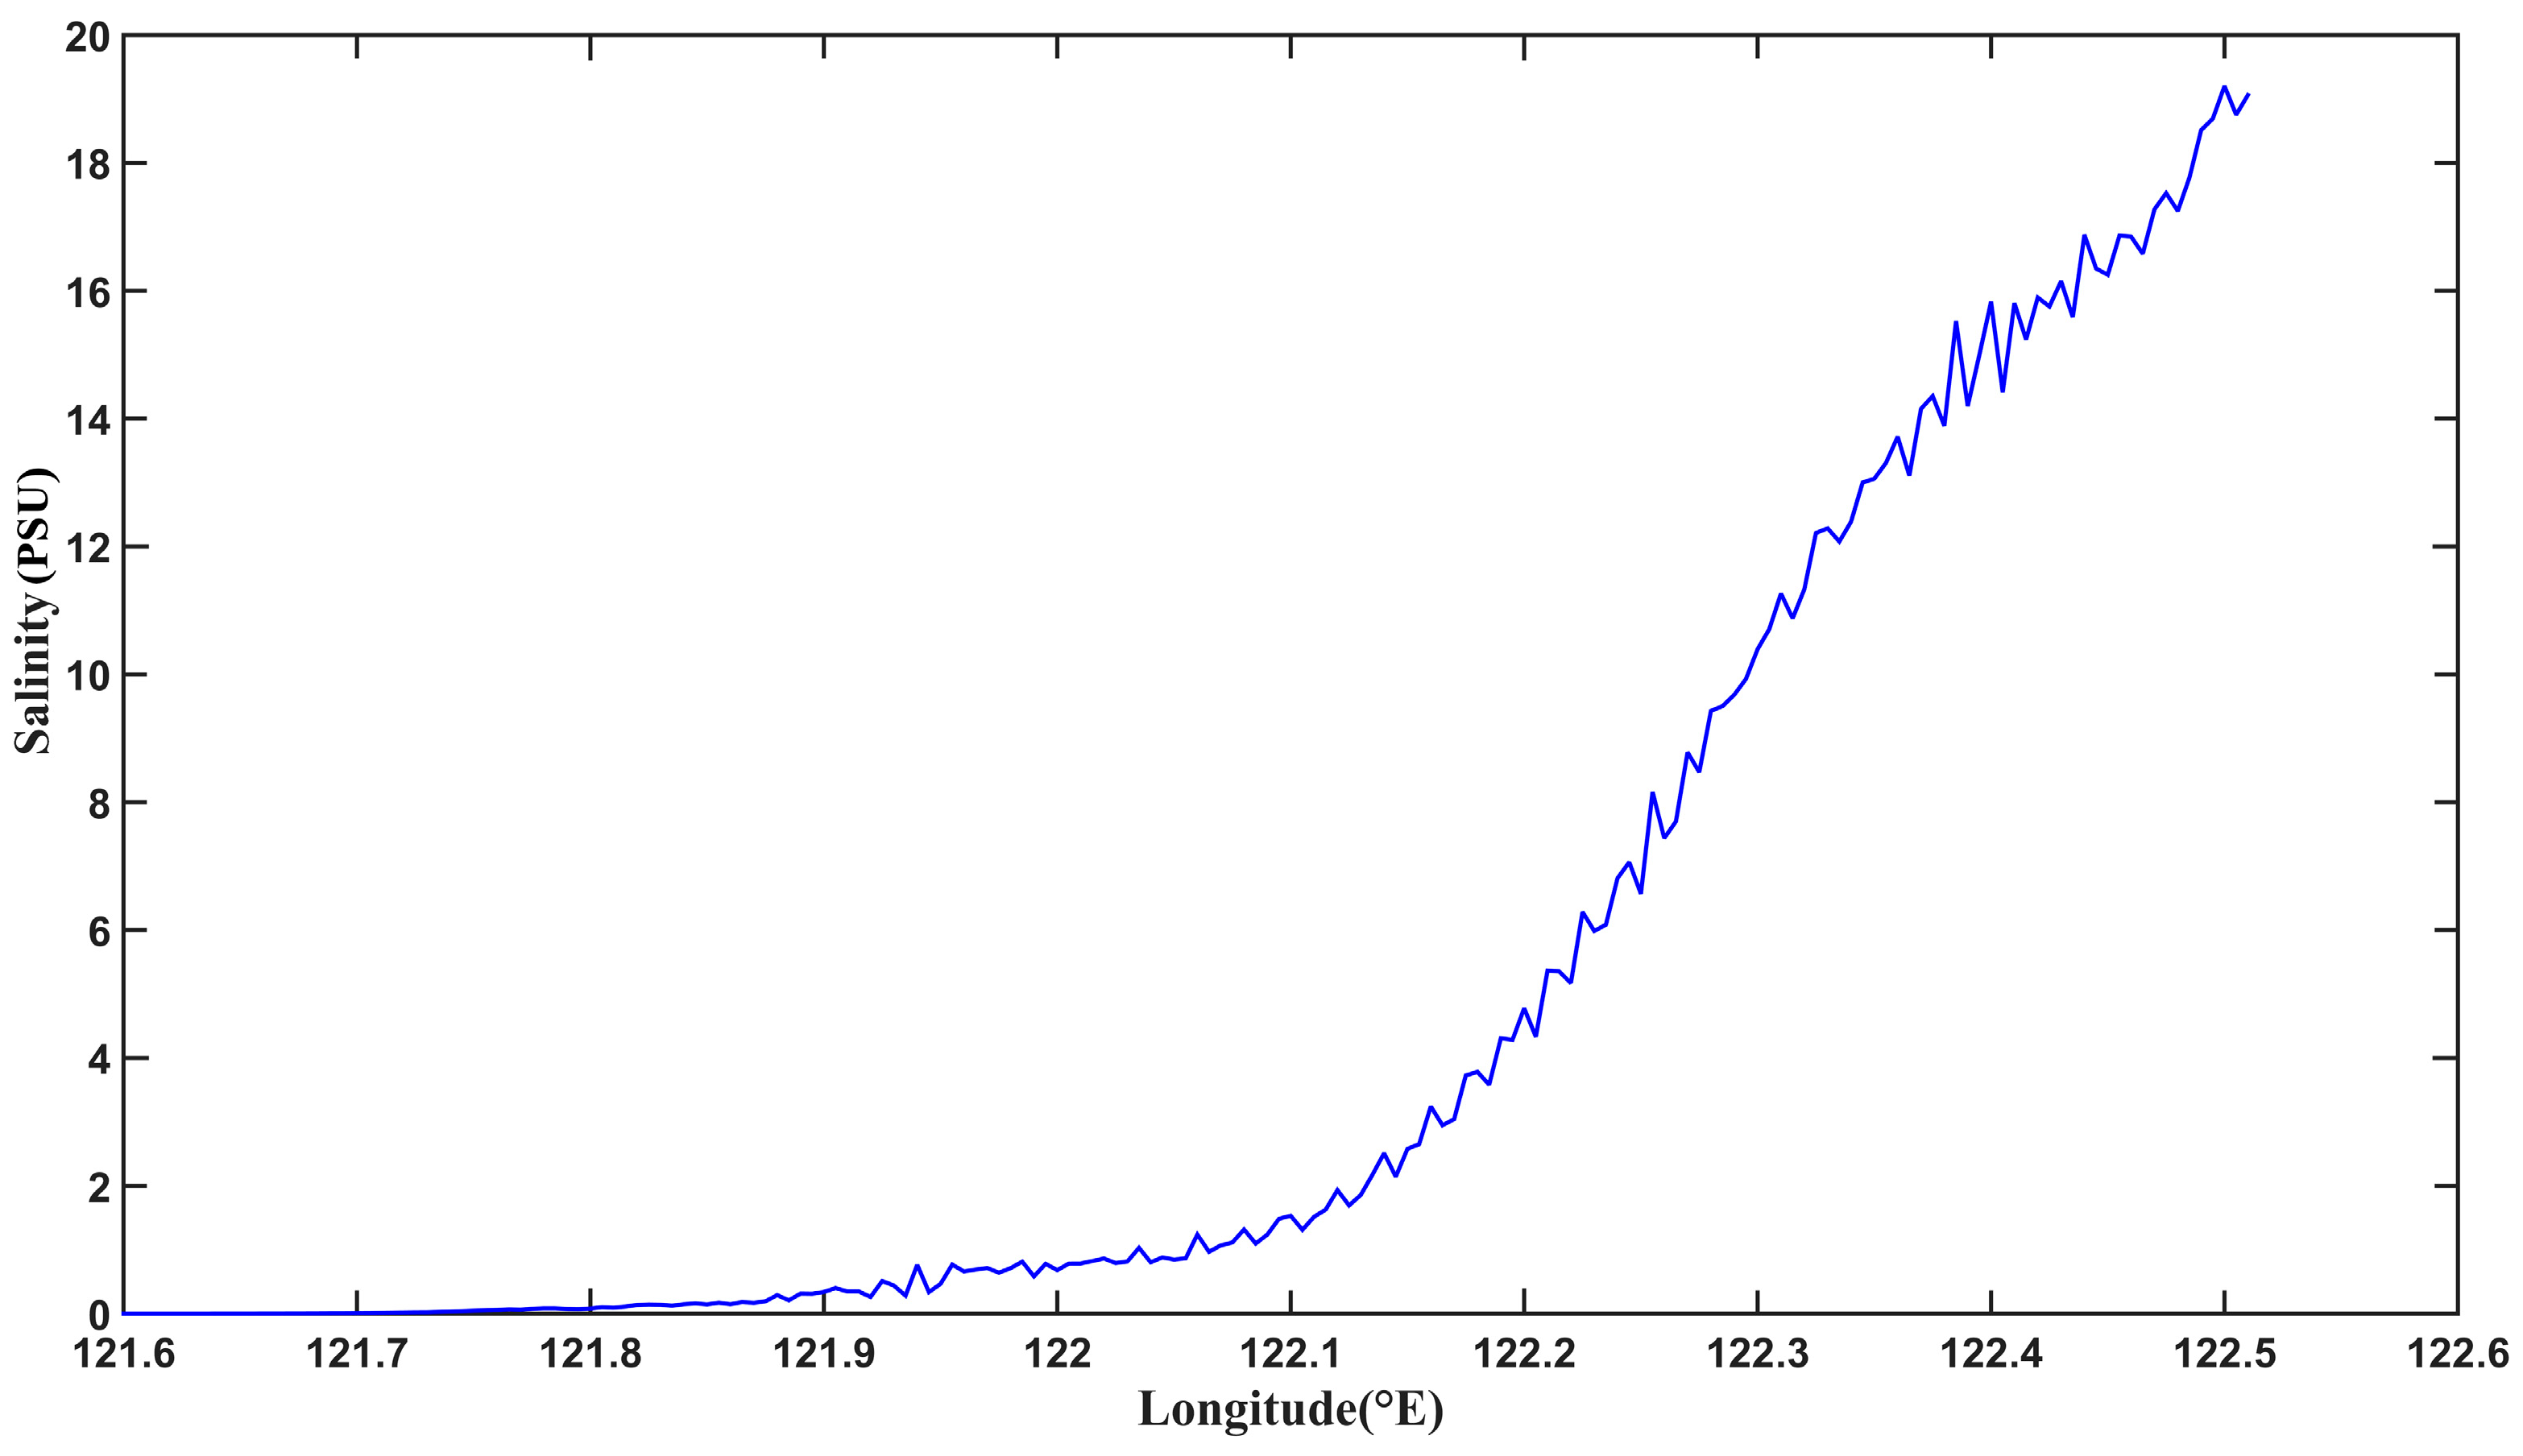
By analyzing long-term patterns, the spatial distribution of the multi-year average salinity in the study area is obtained. Vertical, temporal, and latitudinal averages of the model results are used to obtain the longitudinal salinity distribution (Figure 9). The results show that salinity begins to increase from approximately 121.8° E eastward. Within the range of 121.8–122.15° E, salinity slowly increases. Beyond 122.15° E, salinity rises, almost showing a linear increase. This indicates that in the region between 121.8 and 122.15° E, there is an intense mixing of freshwater and saltwater, while east of 122.15° E, only a small amount of freshwater continues to mix with saltwater. As shown in Figure 9, the longitudinal salinity distribution is not a smooth curve but instead shows a sawtooth-shaped fluctuation.
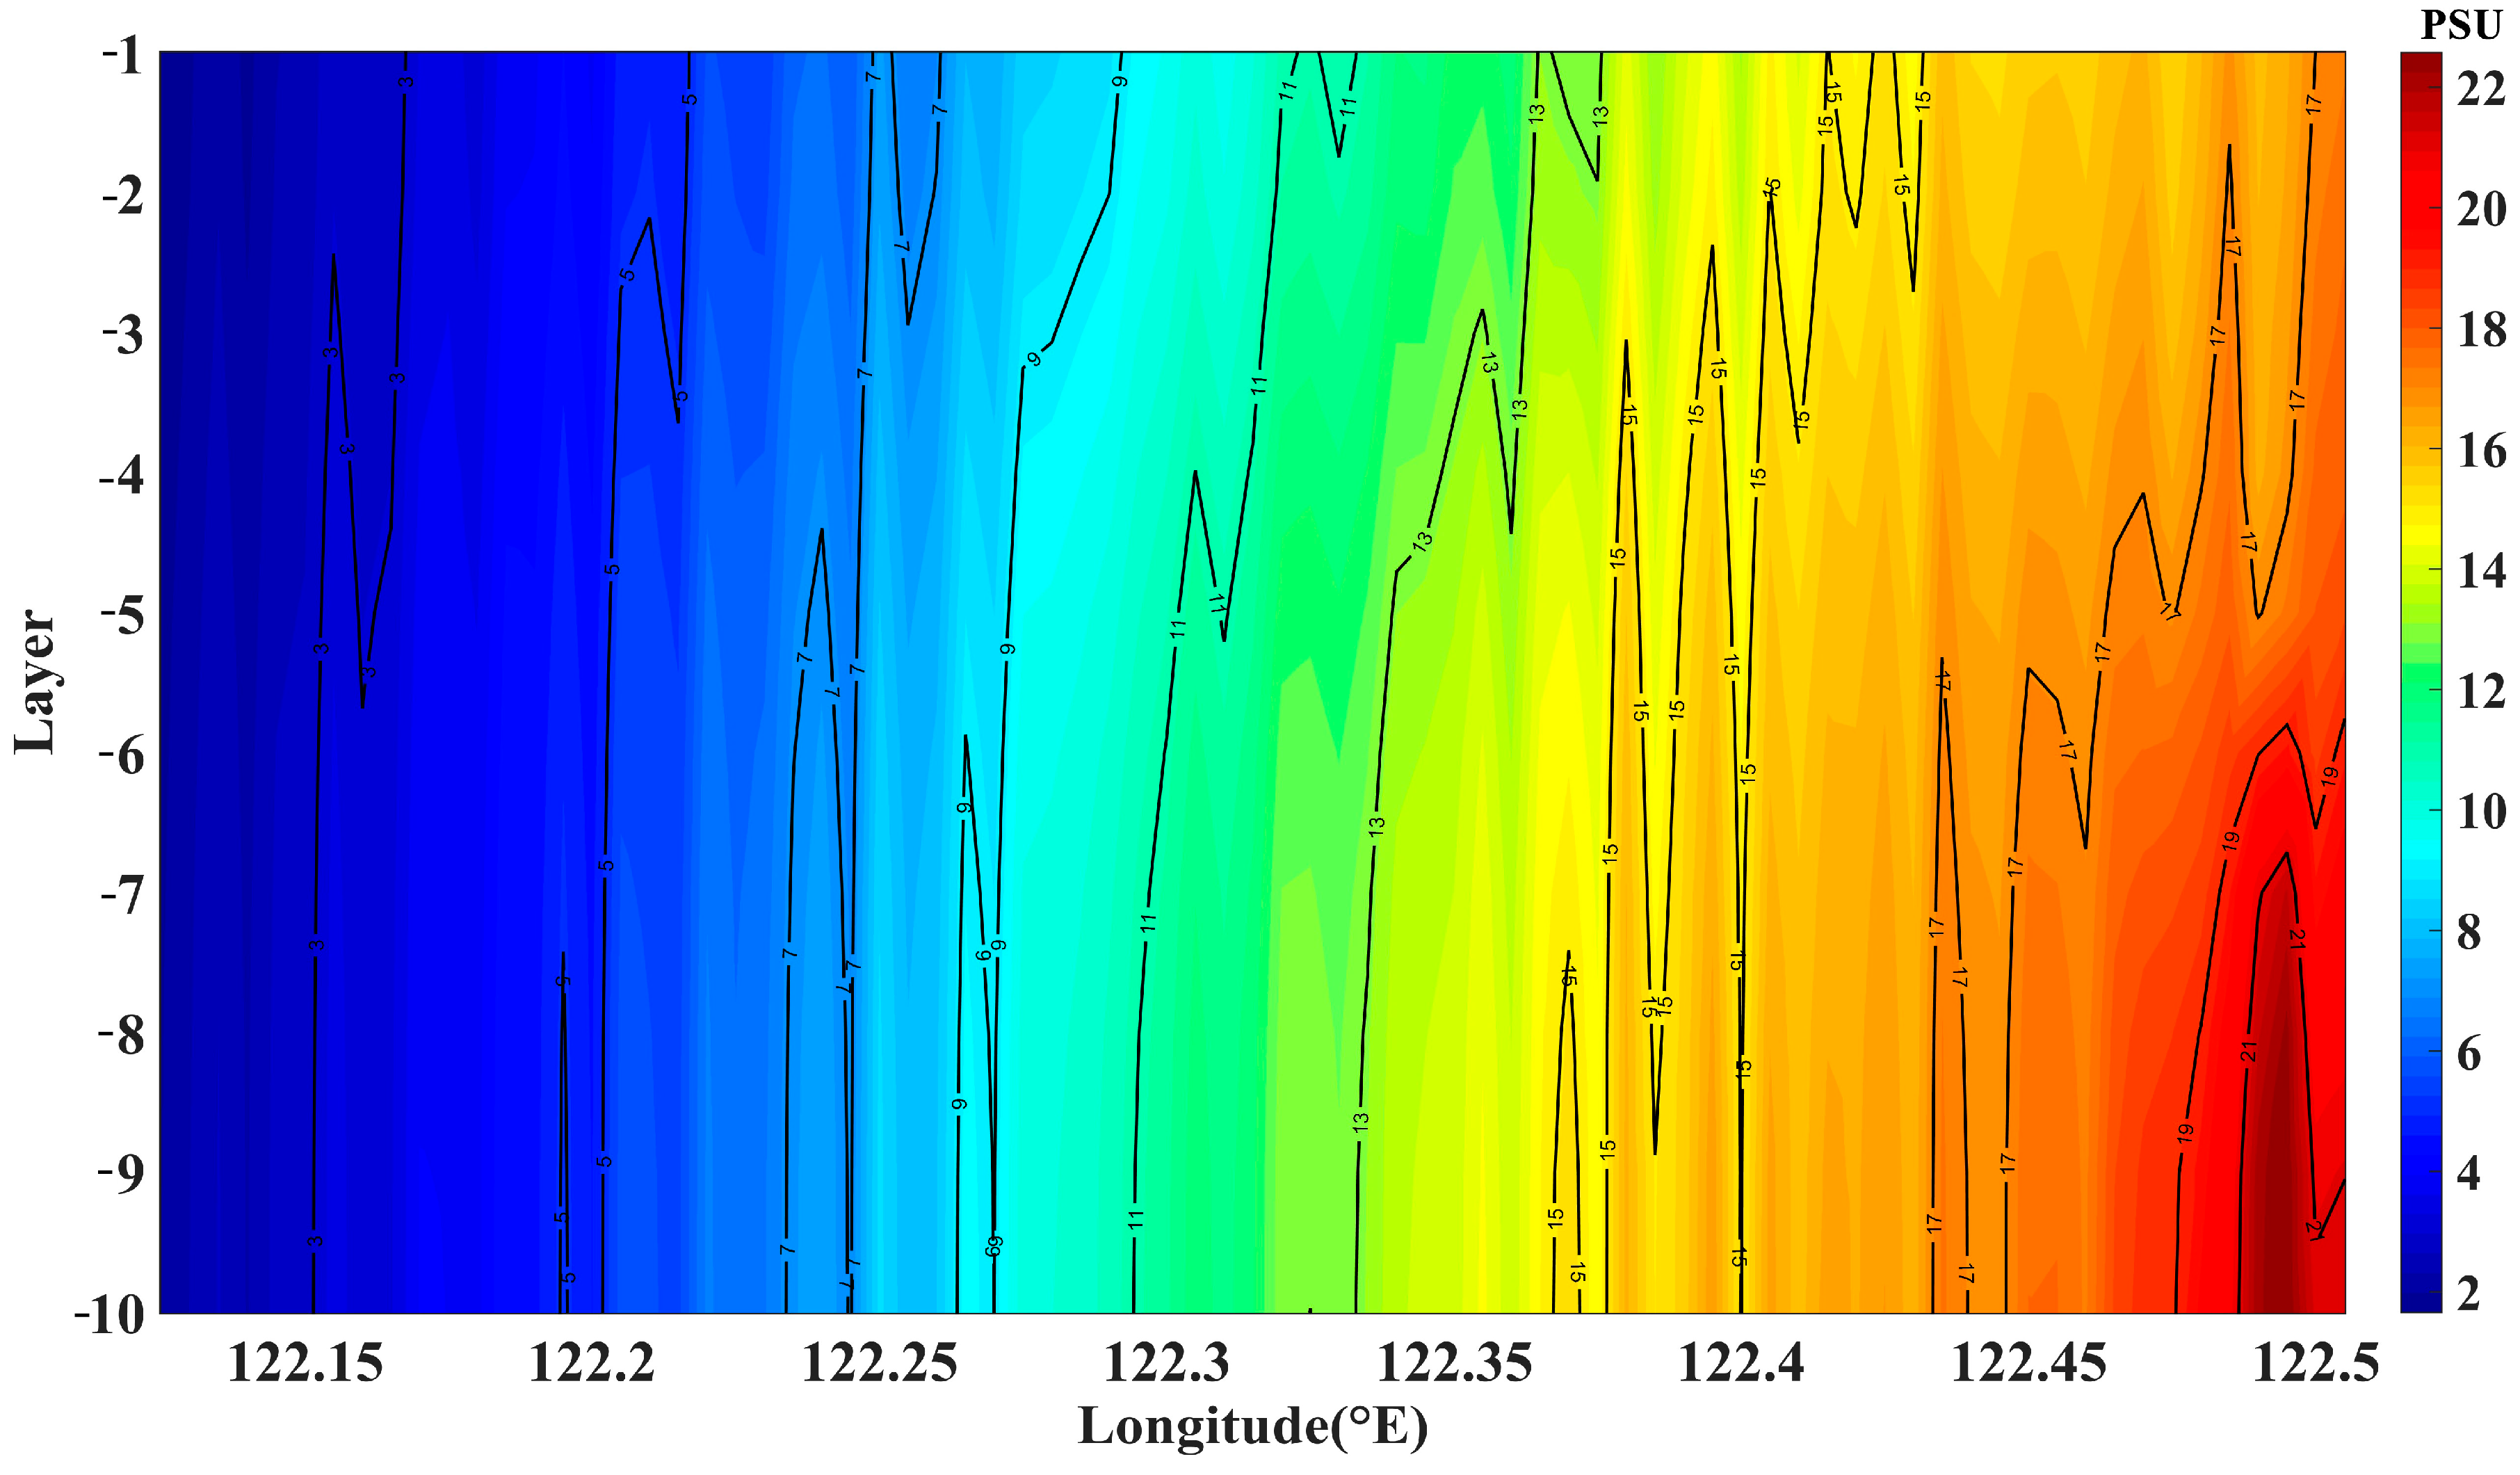
The FVCOM constructed in this study is three-dimensional. By averaging the simulated salinity in the latitudinal and temporal directions, the vertical–longitudinal section of salinity is obtained (Figure 10). The west side is freshwater, which is evenly distributed vertically. On the east side, high-salinity water dominates, with surface water having lower salinity compared to the bottom layer, indicating that freshwater covers the saline water.
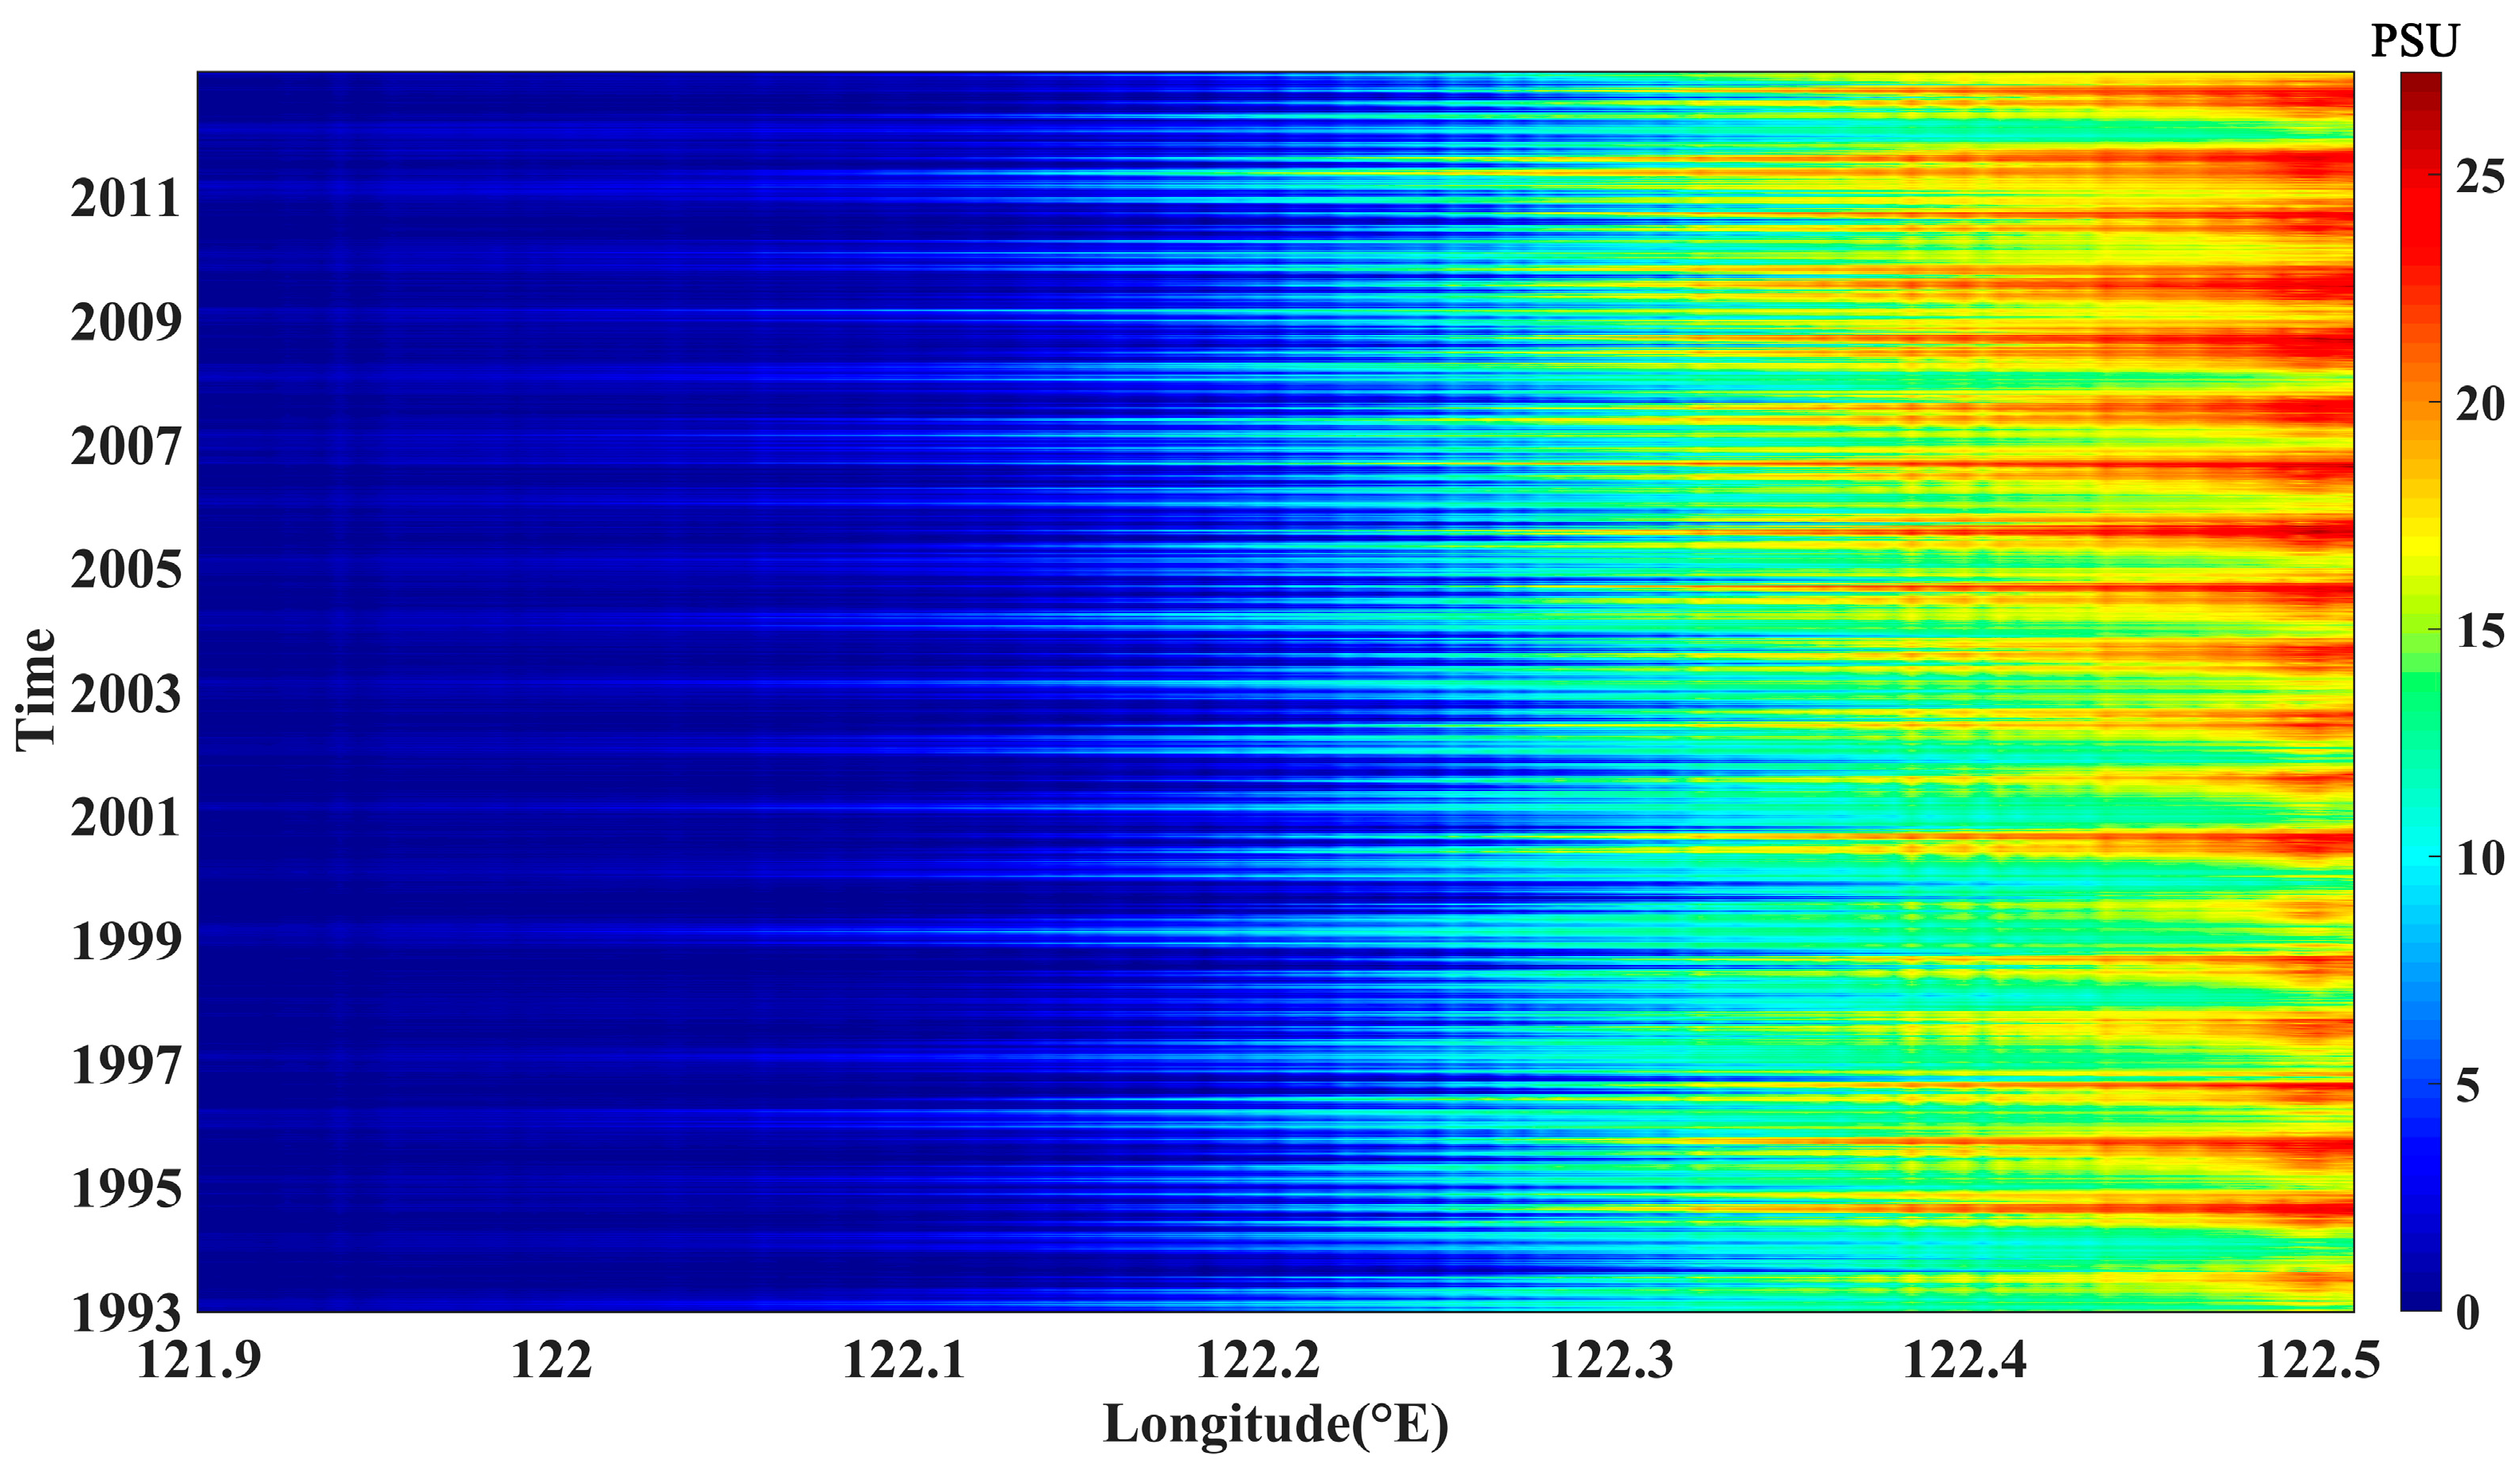
The temporal variation in salinity in the YRE was analyzed by vertically averaging the simulated salinity field (Figure 11). The results show that the salinity in the YRE exhibits inter-annual variability. There are 20 salinity peaks, each corresponding to the winter season of the respective year. The temporal variation in salinity follows a “high–low–high” pattern. In 1993, the salinity value is relatively low, and it increases from 1994 to 1996, decreases again from 1997 to 1999, and then steadily increases since 2000, maintaining a high-salinity distribution until 2012.

3.2. Saltwater Intrusion in the Yangtze River Estuary

To investigate the annual variation in the saltwater intrusion distance in the YRE from 1993 to 2012, Equation (7) is used to calculate the daily simulated saltwater intrusion distance. A 1 yr moving average is then applied to the time series, as shown in Figure 12. The result shows an overall increasing trend in saltwater intrusion. From early 1993 to mid-1994, the saltwater intrusion distance into the YRE decreased significantly. Between mid-1994 and the end of 1995, it slowly increased, followed by another sharp decrease from early 1996 to mid-1998. The saltwater intrusion distance showed a clear oscillation between mid-1998 and mid-2001, with a repeating pattern of increase and decrease. Over the following approximately 7 years, the saltwater intrusion distance steadily increased by approximately 9 km. This significant increase was primarily attributed to the extensive construction and impounding of numerous reservoirs and dams along the upper, middle, and lower reaches of the Yangtze River, most notably the Three Gorges Dam and its reservoir. These developments reduced runoff, thereby weakening its force in the YRE and exacerbating saltwater intrusion. The average intrusion distance from mid-2008 to 2012 remains larger than the multi-year average.
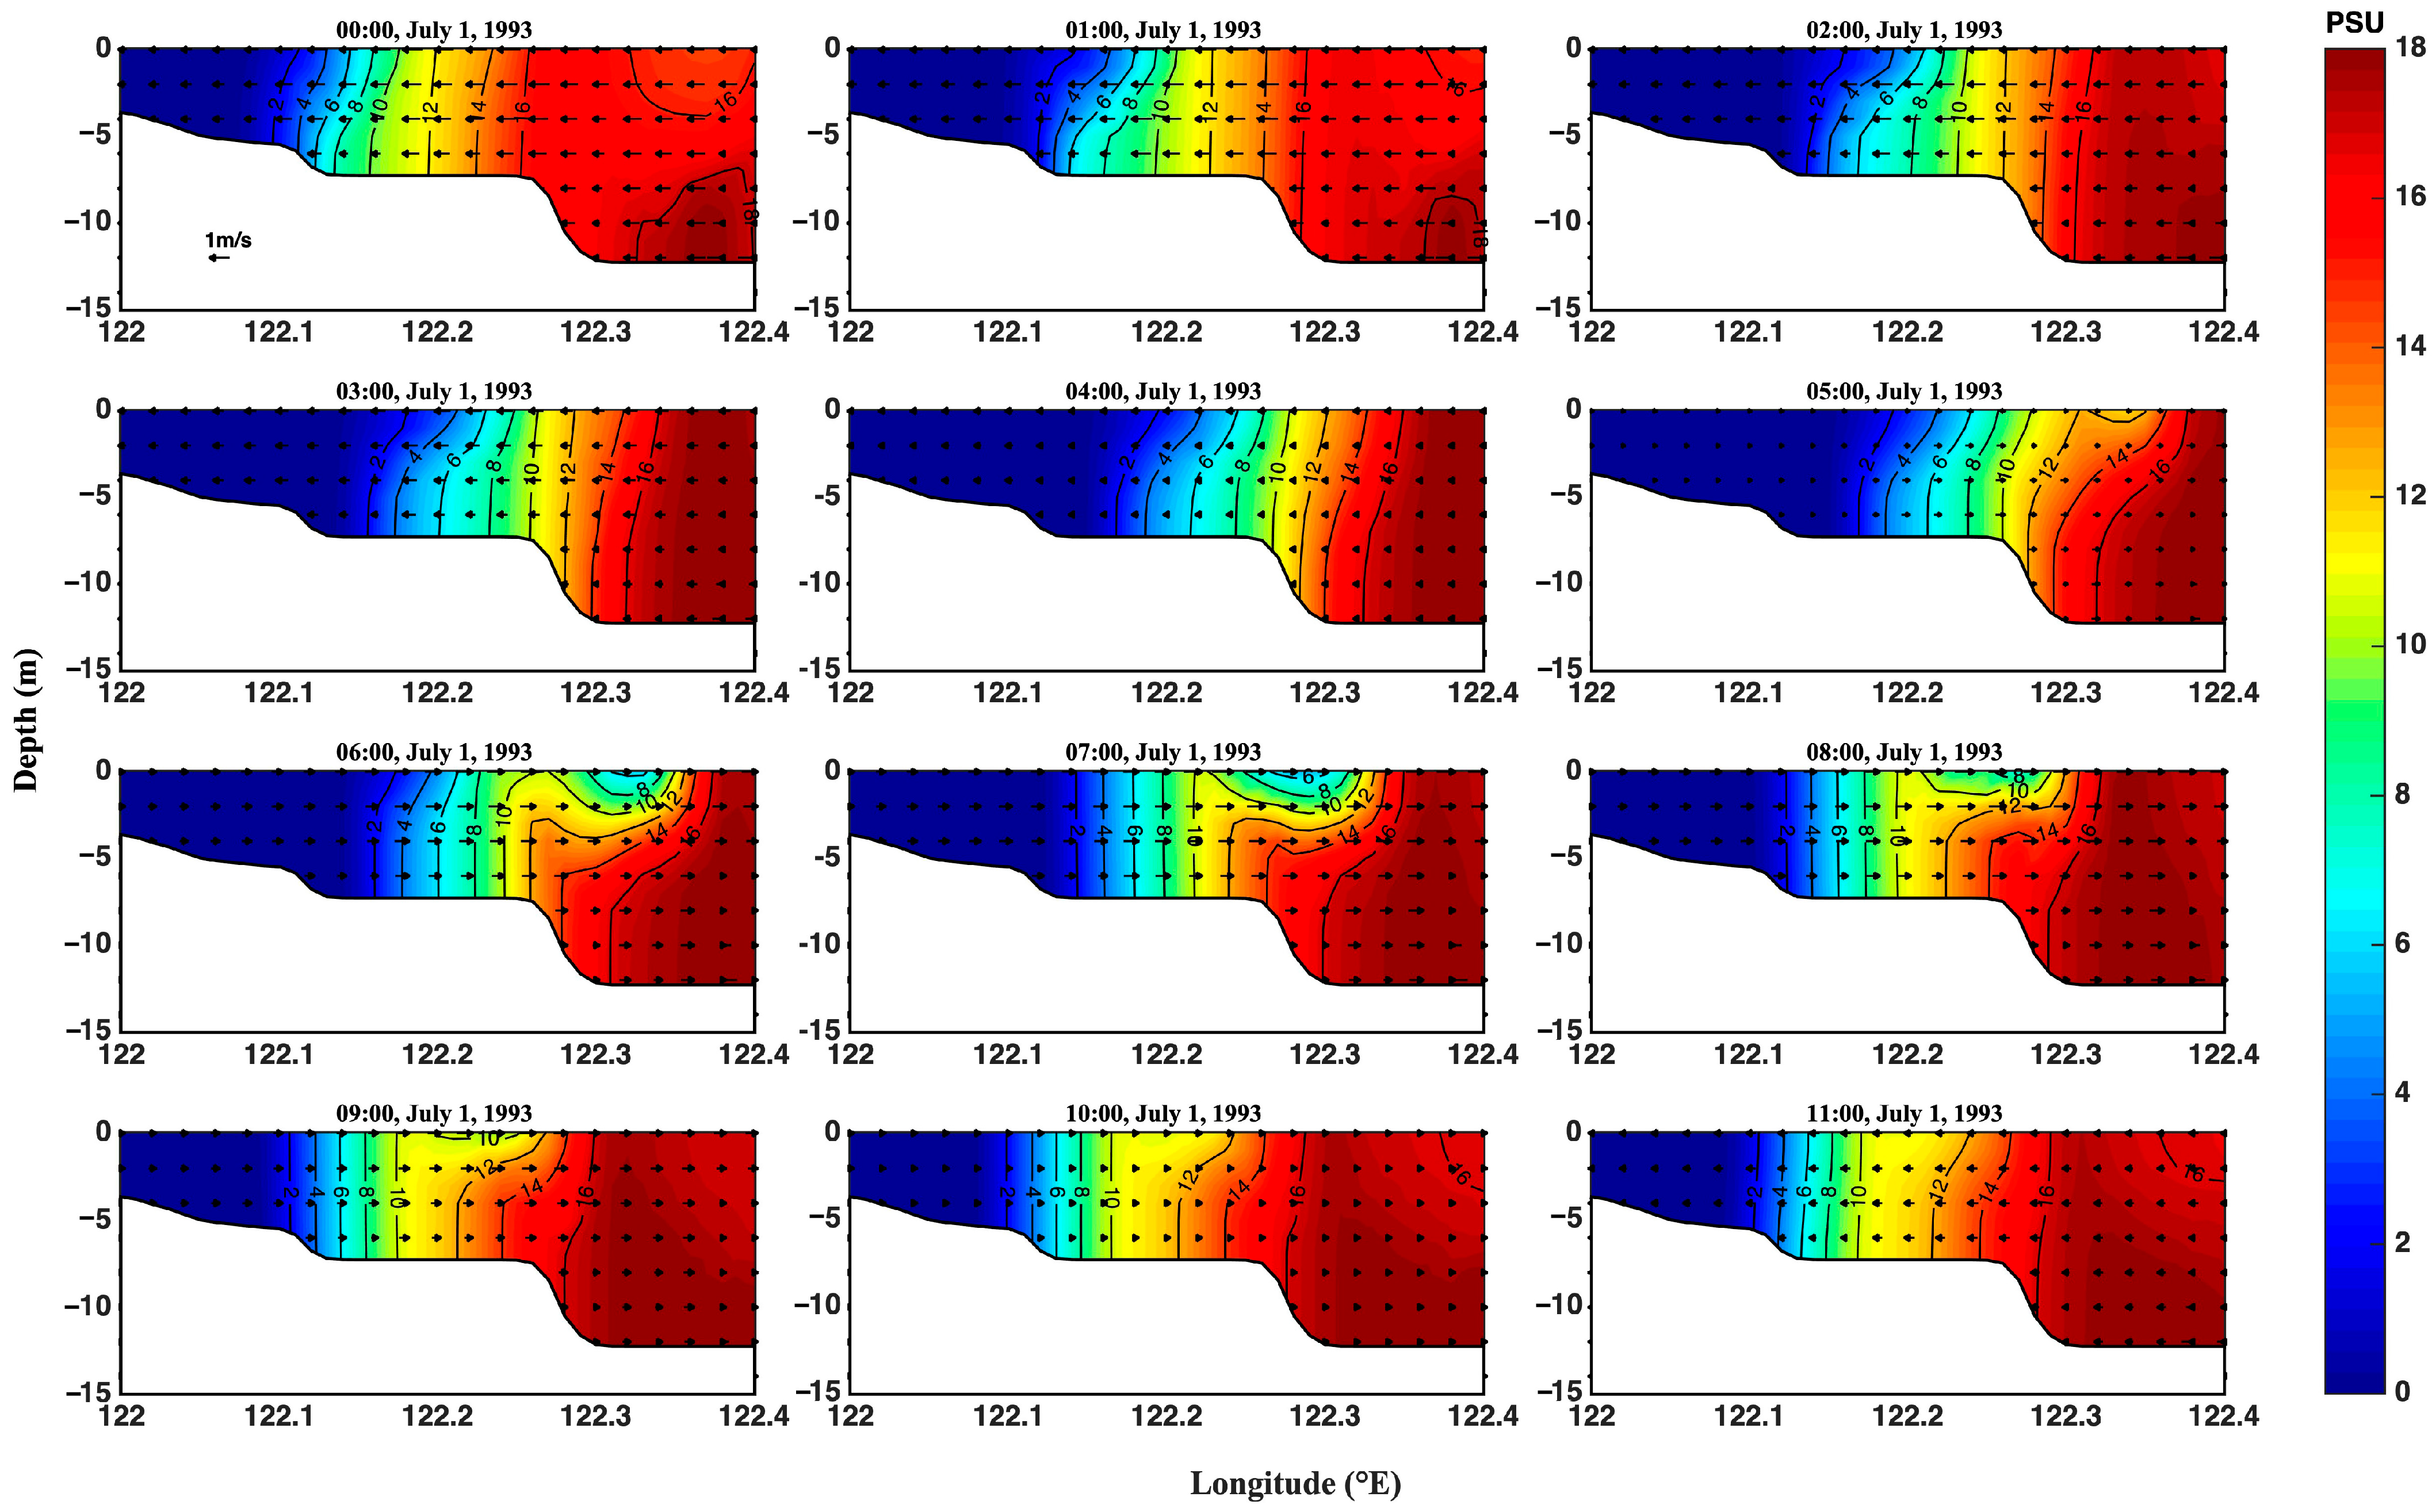
To explore the vertical structure of saltwater intrusion, two cross-sections were taken at the YRE (red line in Figure 3) to analyze the salinity and current field distribution from 0:00 to 11:00 on 1 July 1993. Figure 13 shows that along the 31° N latitudinal section, the topography of the YRE gradually deepens from west to east. Between 0:00 and 4:00 (local time 8:00–12:00), the salinity distribution gradually increases from west to east. At the same longitude, saltwater and freshwater are evenly mixed at different depths. During this time, saltwater intrusion is not particularly noticeable. From 5:00 until 9:00 (local time 13:00–17:00), freshwater begins to gradually cover the saltwater, creating a salinity profile where the water is fresher at the surface and saltier at the bottom. This indicates more pronounced saltwater intrusion. The enhanced stratification is due to the heating of the sea surface in summer, which weakens mixing and results in salinity stratification. After 9:00, the salinity distribution returns to the pattern observed between 0:00 and 4:00, with the entire intrusion process exhibiting periodic oscillations.
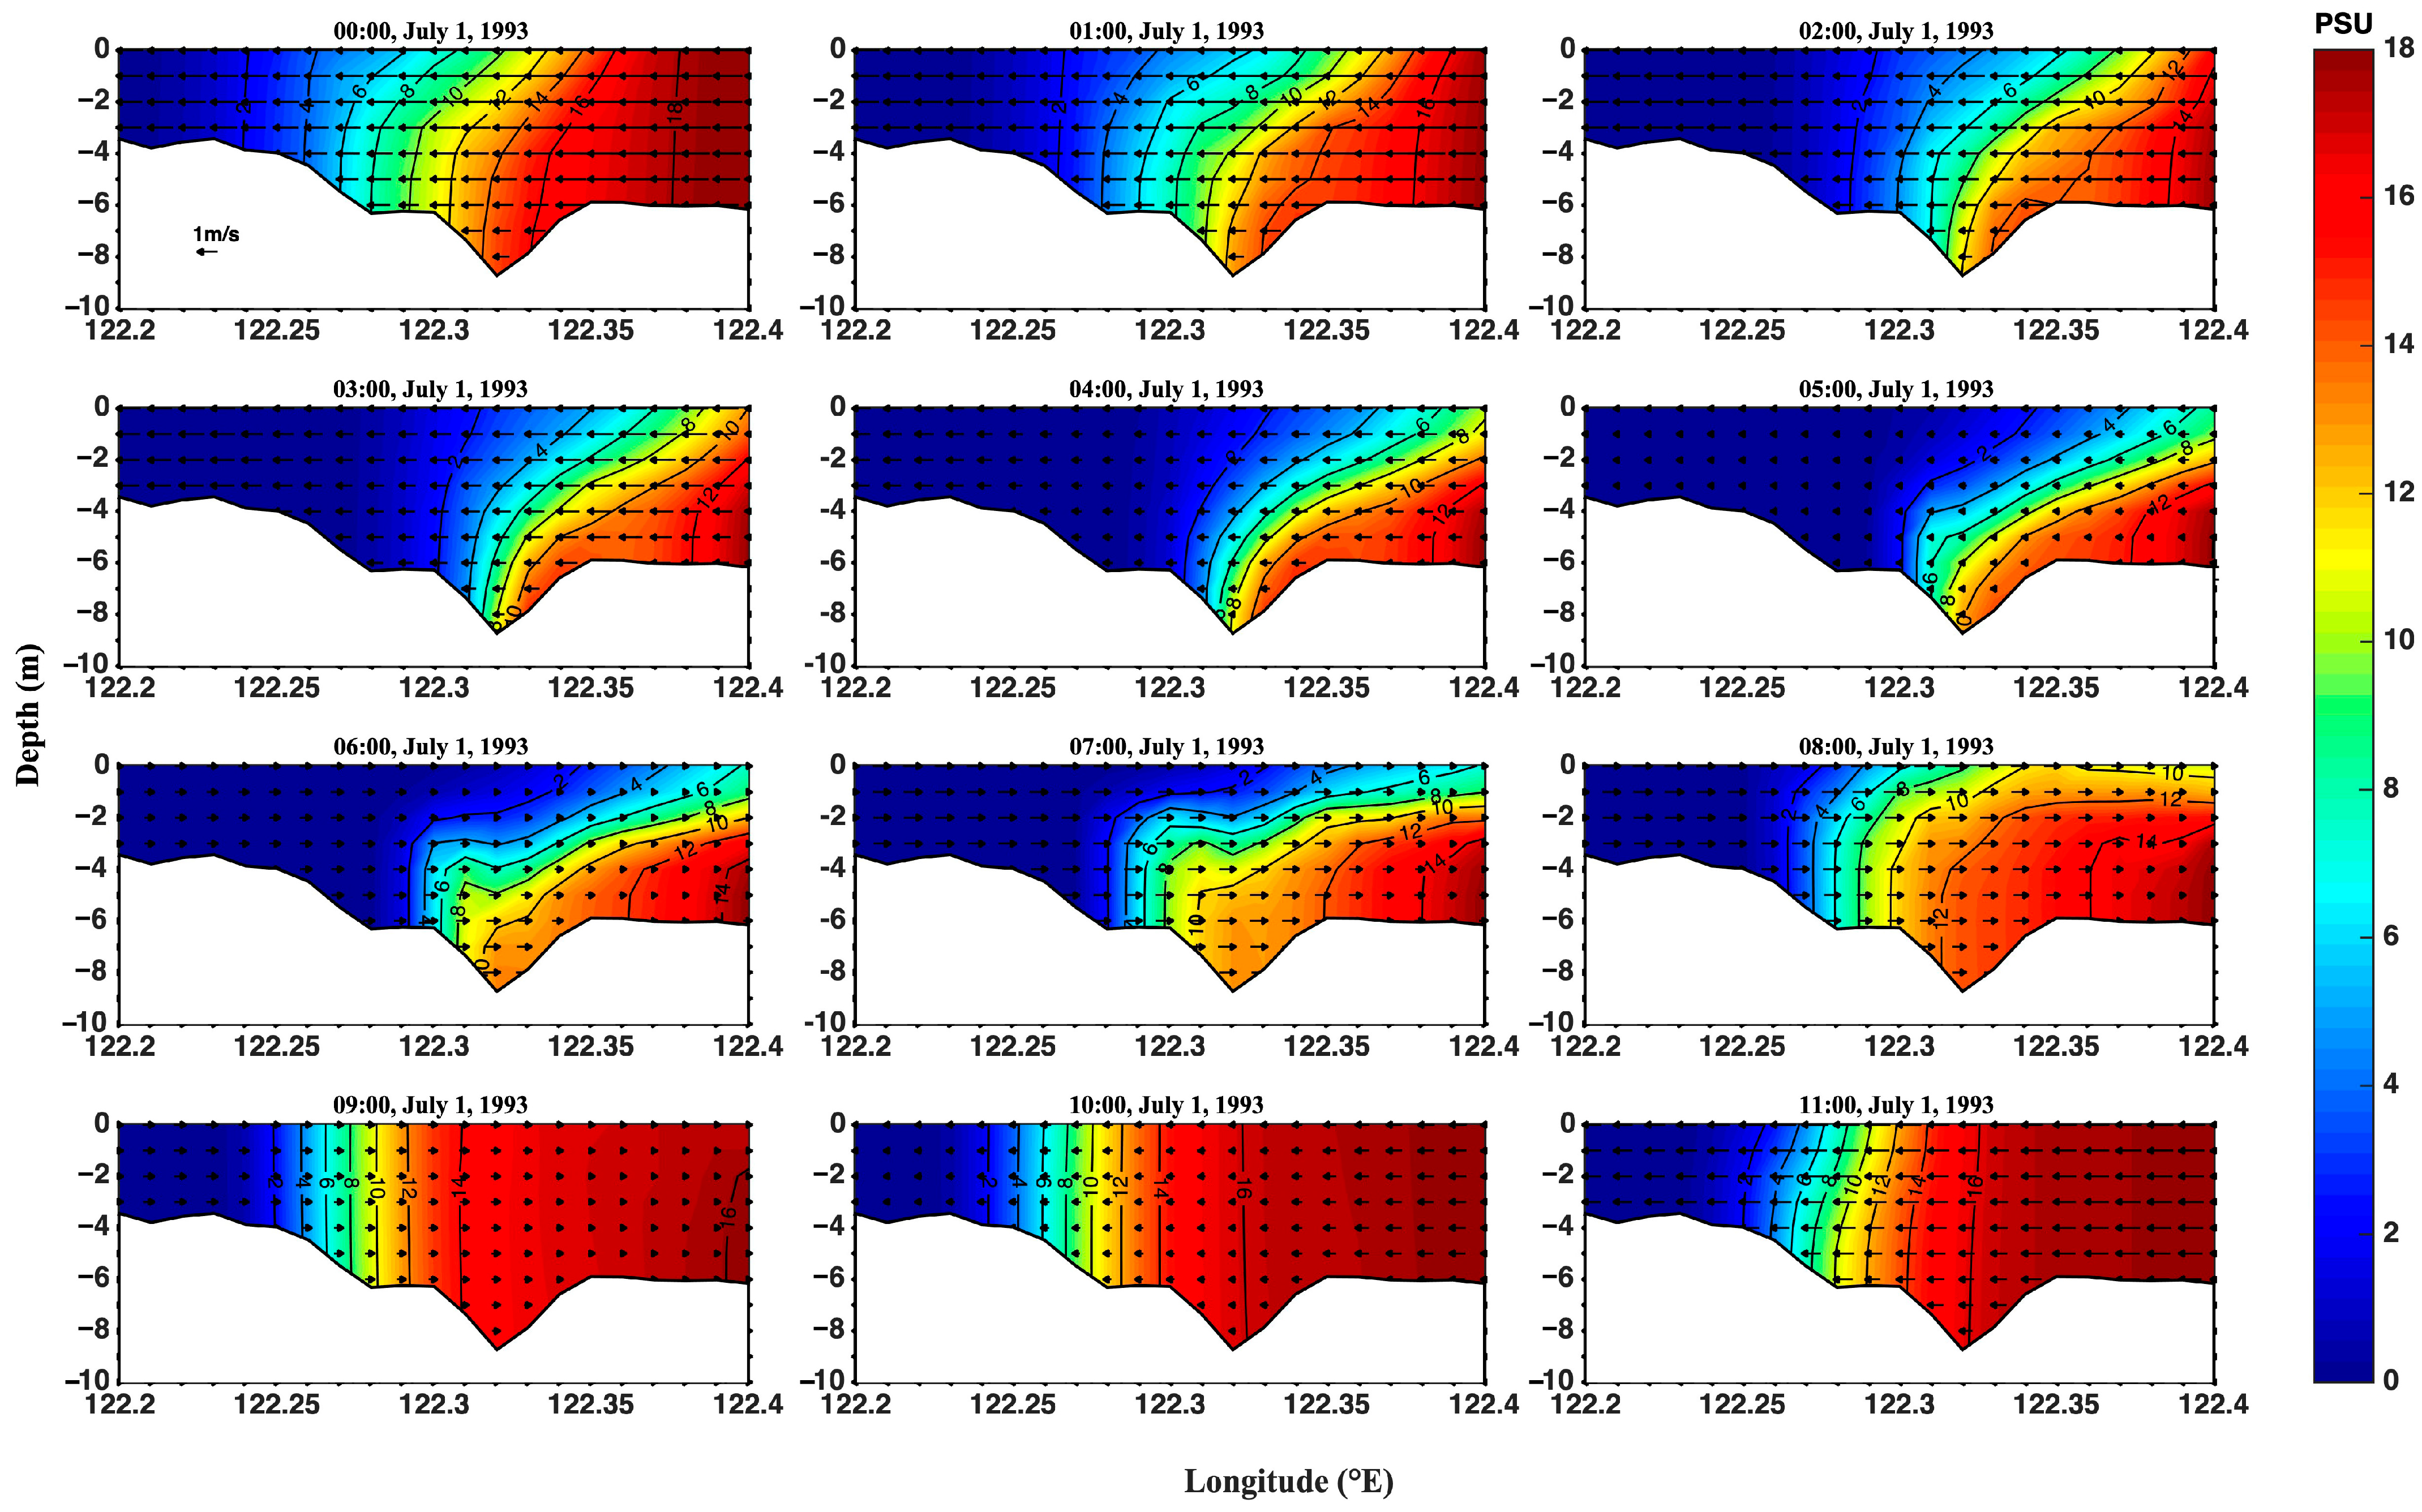
The vertical–latitudinal sections of salinity and current from 0:00 to 11:00 on 1 July 1993 are also analyzed along the 31.4° N section in the YRE (Figure 14). The topography of this section gradually deepens and then shallows from west to east, with the overall water depth being shallower than that along the 31° N section. The salinity distribution gradually increases from west to east. From 0:00 to 8:00, salinity stratification is clearly observed, especially at 8:00 when freshwater covers saltwater, making saltwater intrusion very evident. After 9:00, the salinity shows a vertically uniform distribution. The entire change cycle is consistent with the salinity variation observed along the 31° N section, indicating that the saltwater intrusion behaves uniformly in the north–south direction.
Power spectrum analysis is applied to the daily time series of saltwater intrusion distance for the period of 1993–2012 (Figure 15). The results identify several periods tested with a 99% confidence level, including cycles of 341–410 days, 27 days, 23.95 days, 13.65–16.13 days, and 4.51–9.63 days. The 341–410-day period corresponds to the annual variation cycle, which is consistent with the 11.9 months periodic variation in runoff, indicating that this periodic variation is mainly influenced by runoff.
Additionally, the analysis identifies a 27-day period in saltwater intrusion distance, consistent with the anomalous monthly period of 27.55 days observed in the tidal levels of the YRE. The 13.65–16.13-day period is consistent with the 14.76-day tidal cycle related to the synodic day, further linking this variation to tidal changes. The intra-seasonal cycle of 4.51–9.63 days may be influenced by both atmospheric pressure fluctuations and tides.

4. Discussion

Previous research has identified tides, runoff, and wind as the primary dynamic factors influencing saltwater intrusion in the YRE on a short time scale [7,16,38]. Additionally, long-term changes in riverbank morphology significantly impact saltwater intrusion in the YRE [39,40,41]. This section explores the main controlling factors of saltwater intrusion in the YRE at different time scales by analyzing the 20-year model’s results and corresponding forcing data.

4.1. Effect of Runoff on Saltwater Intrusion in the Yangtze River Estuary

The Yangtze River is rich in water resources, but its runoff varies significantly on both annual and seasonal scales. Large volumes of freshwater flow into the estuary, mixing with saltwater. Different runoff amounts have varying effects on the saltwater intrusion distance. A monthly moving average analysis is conducted on the daily average saltwater intrusion distance, and the daily runoff data are recorded at Datong Station, as shown in Figure 16a. Correlation analysis between the two time series shows a correlation coefficient of −0.875, indicating a strong inverse relationship: as freshwater inflow into the sea increases, saltwater intrusion distance in the YRE decreases. This is consistent with the observations where saltwater intrusion distance extends further during the dry season when river inflow is lower. The difference in the runoff volumes between the dry and wet seasons in the lower reaches of the Yangtze River is substantial. The flow rate during the dry season is approximately 14,145 m3/s less than the flow rate (49,790 m3/s) during the wet season. The dry season in the lower reaches of the Yangtze River corresponds to winter, which also contributes to the stronger saltwater intrusion observed in the YRE during the winter months.
Figure 12 shows the lowest saltwater intrusion distance over the 20-year period, recorded in mid-1998. This is likely due to a large-scale precipitation event and flood disaster in the Yangtze River Basin that year, which caused a surge in the water level and abnormally high runoff at the estuary of the Yangtze River (Figure 16a), leading to a reduction in saltwater intrusion distance.

4.2. Effect of Wind on Saltwater Intrusion in the Yangtze River Estuary

The research area is influenced by a subtropical monsoon climate, with southwest monsoon prevailing in summer and northwest monsoon prevailing in winter. Wind stress transfers momentum to the ocean, affecting ocean currents and, consequently, saltwater intrusion. For this analysis, 10 m sea surface wind data within the range of 122.1–122.5° E are averaged regionally and daily. A one-month sliding average of the daily meridional and zonal winds is then used to analyze the monthly variations in wind speed and saltwater intrusion distance, as shown in Figure 16b. The analysis shows that the meridional wind speed is significantly higher than the zonal wind speed, which is consistent with the region’s monsoon characteristics. Correlation analysis shows that the correlation coefficient between the saltwater intrusion distance and zonal wind is −0.0623, while the correlation with meridional wind is −0.5610. This indicates that meridional wind has a much stronger impact on saltwater intrusion in the YRE.
As shown in Figure 16b, when the meridional wind speed is negative, which indicates prevailing northerly winds in the estuary, higher wind speeds result in longer saltwater intrusion distances. In contrast, when the meridional wind speed is positive, indicating prevailing southerly winds, higher wind speeds lead to shorter saltwater intrusion distances. This effect can be explained by Ekman transport. In the northern hemisphere, the volumetric transport of ocean water, driven by wind, occurs perpendicular to the wind direction and to the right. Therefore, in the YRE, the prevailing northerly winds in winter produce a significant Ekman transport toward the land, intensifying saltwater intrusion and increasing the intrusion distance [24,42,43,44].

4.3. Effect of Tides on Saltwater Intrusion in the Yangtze River Estuary

Tides play an important role in influencing saltwater intrusion in the YRE [7]. The estuary is mainly dominated by runoff and tidal dynamics, with complex variations in tidal currents significantly impacting the salinity distribution. During spring tides, the salinity level is higher than during neap tides, with the maximum daily variation in salinity occurring during rising tides and the minimum during falling tides. To assess the effect of tides on saltwater intrusion, the daily tidal level difference between the highest and lowest tide levels is calculated using average hourly tide levels at 95 points along the offshore boundary during the same period. A moving average is applied to obtain the monthly variation relationship between daily tidal level difference and saltwater intrusion distance (Figure 16c). The correlation coefficient between tidal level difference and intrusion distance is 0.1413, indicating that while tidal changes do influence saltwater intrusion, their impact is relatively small compared to other factors such as runoff and wind.

4.4. Effect of Riverbank Morphology on Saltwater Intrusion in the Yangtze River Estuary

The evolution of riverbank morphology in the estuary is influenced by the combined effects of runoff and tides, which gradually alter the topography of the YRE. These changes in riverbank morphology also cause changes in the flow path and split-flow patterns, significantly influencing hydrodynamics and, consequently, the dynamics of saltwater intrusion in the estuary [45].
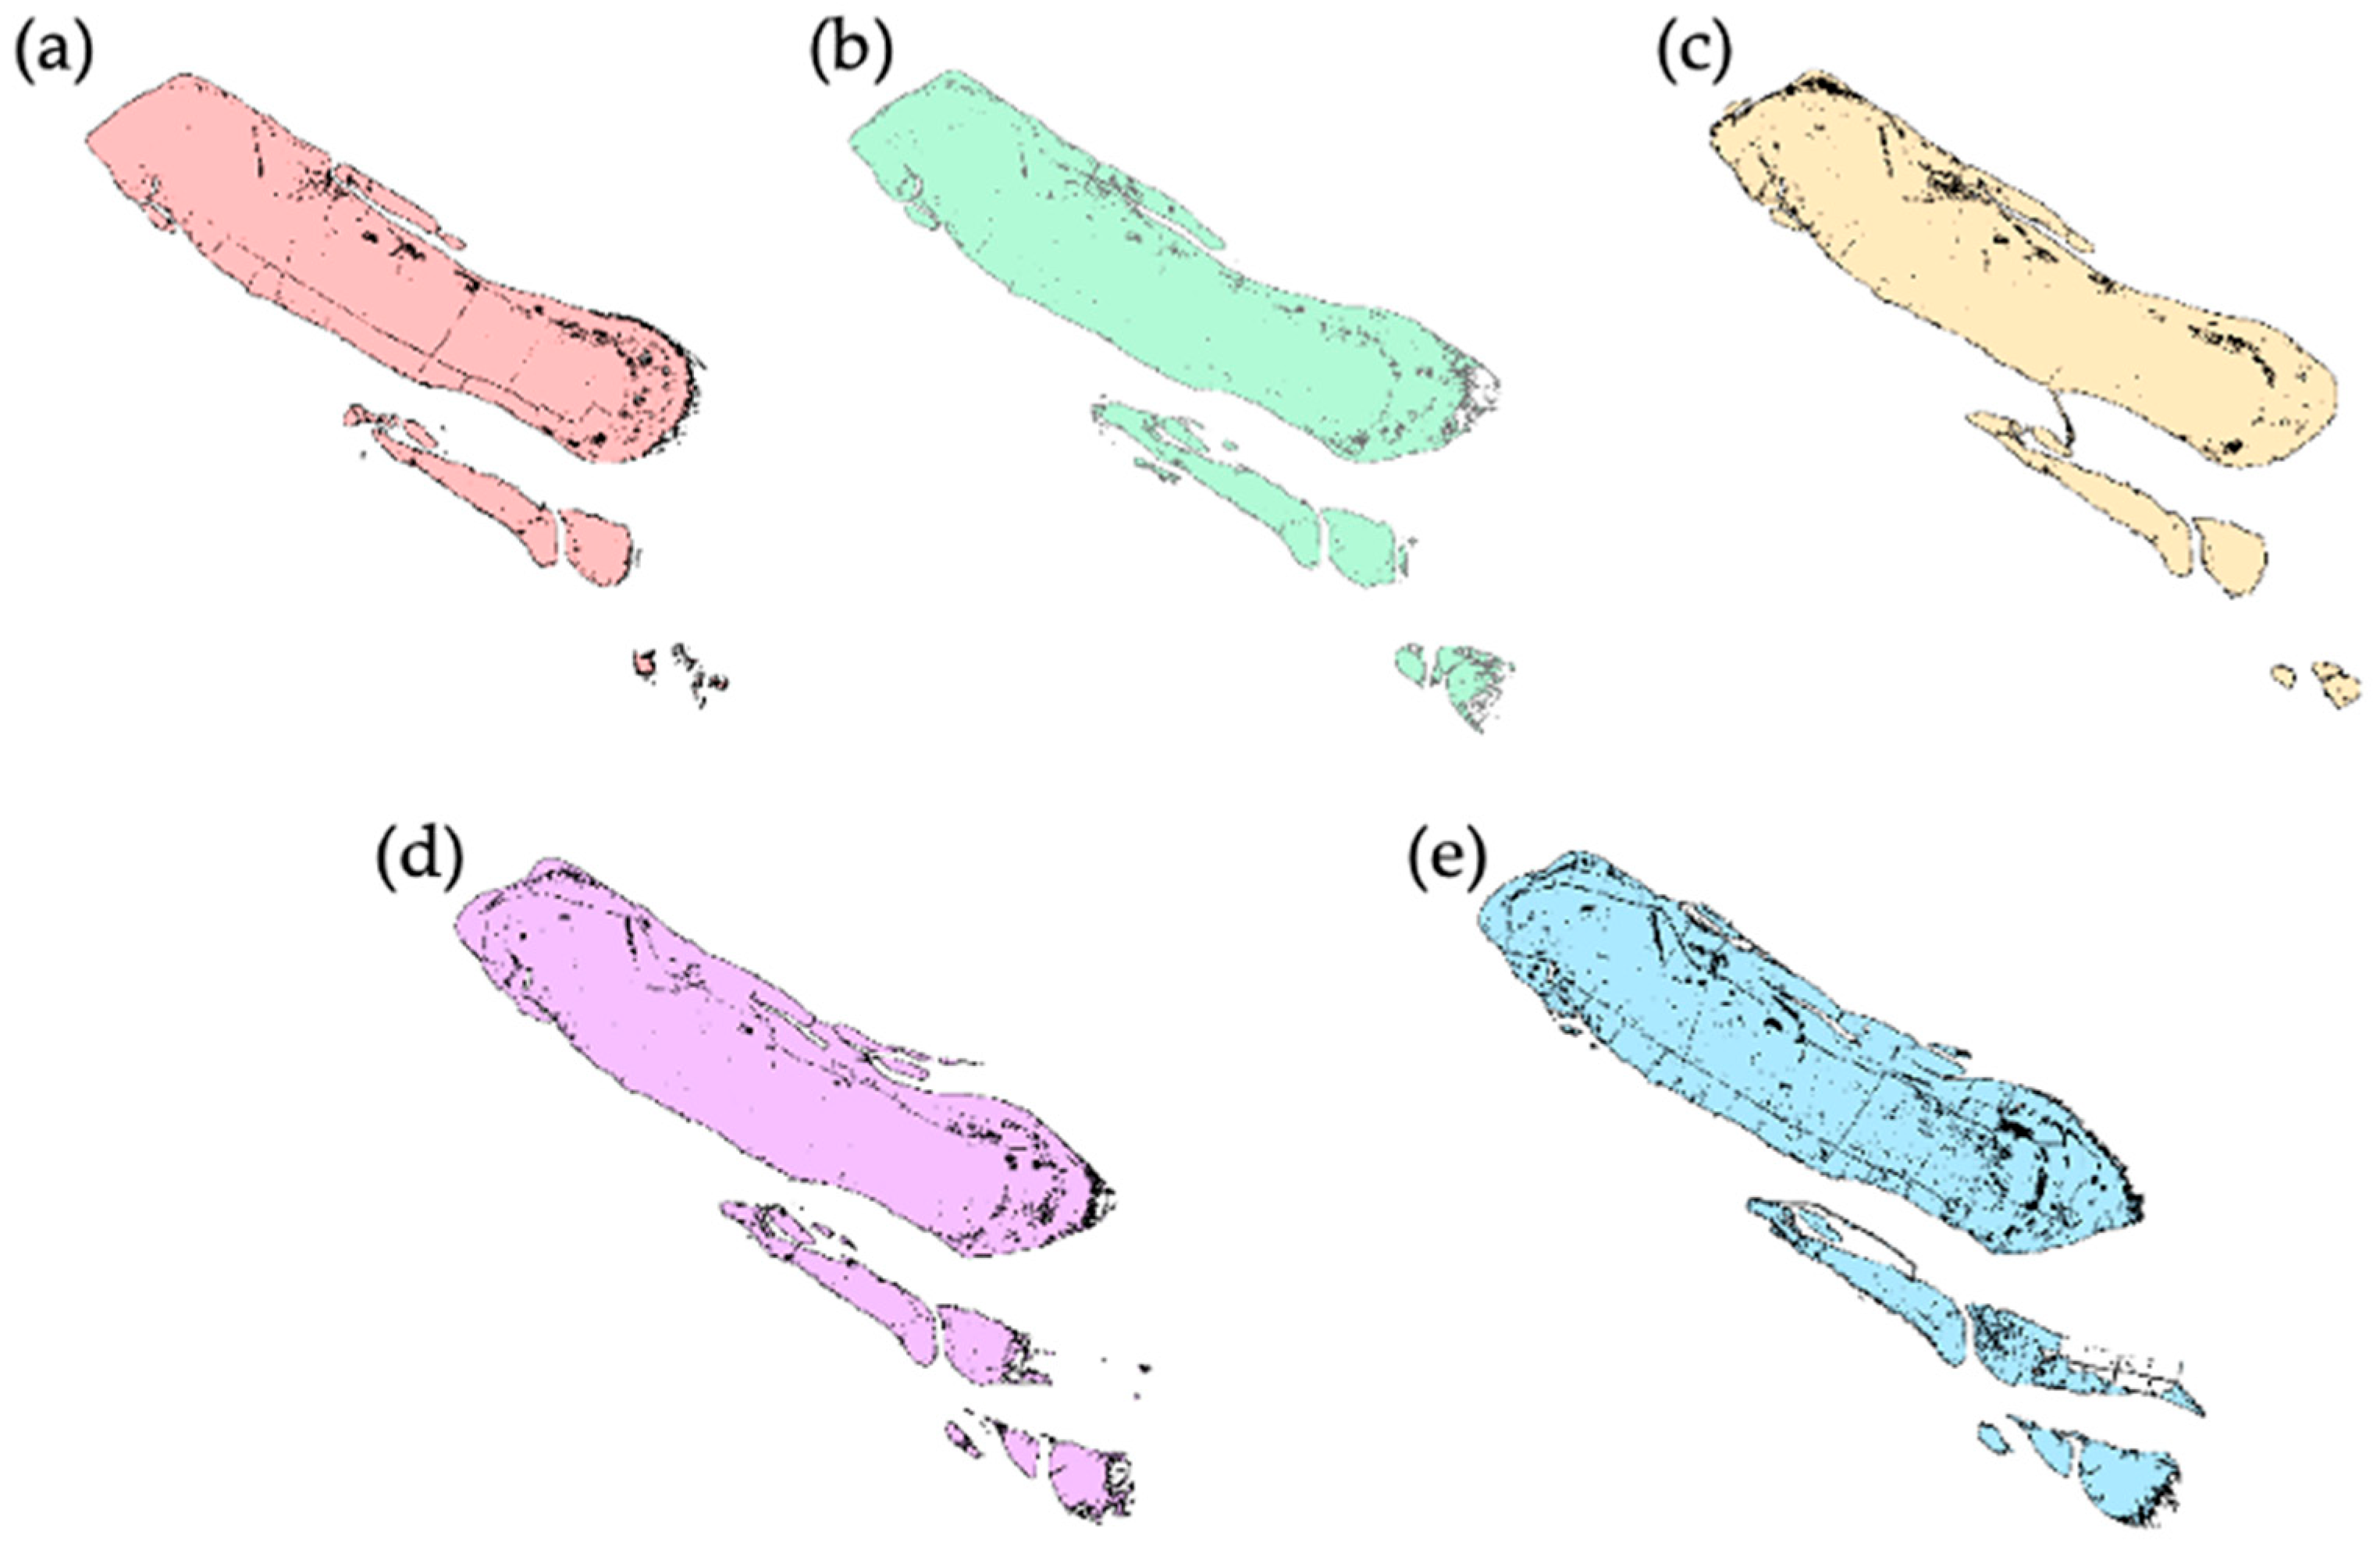
Figure 17 shows remote sensing images of Chongming District and its surrounding islands in the YRE from 1993, 1997, 2002, 2007, and 2012, with the land area of the islands calculated using ArcGIS version 10.8 geometric tools. In 1993, the land area of the islands in the study area was approximately 1489 km2, and increased to 1633.92 km2 in 1997. After the YRE was dredged in 2002, the land area decreased to 1519.16 km2. Due to sedimentation and reclamation activities, the land area increased to 1719.26 km2 in 2007 and further expanded to 1774.92 km2 by 2012.
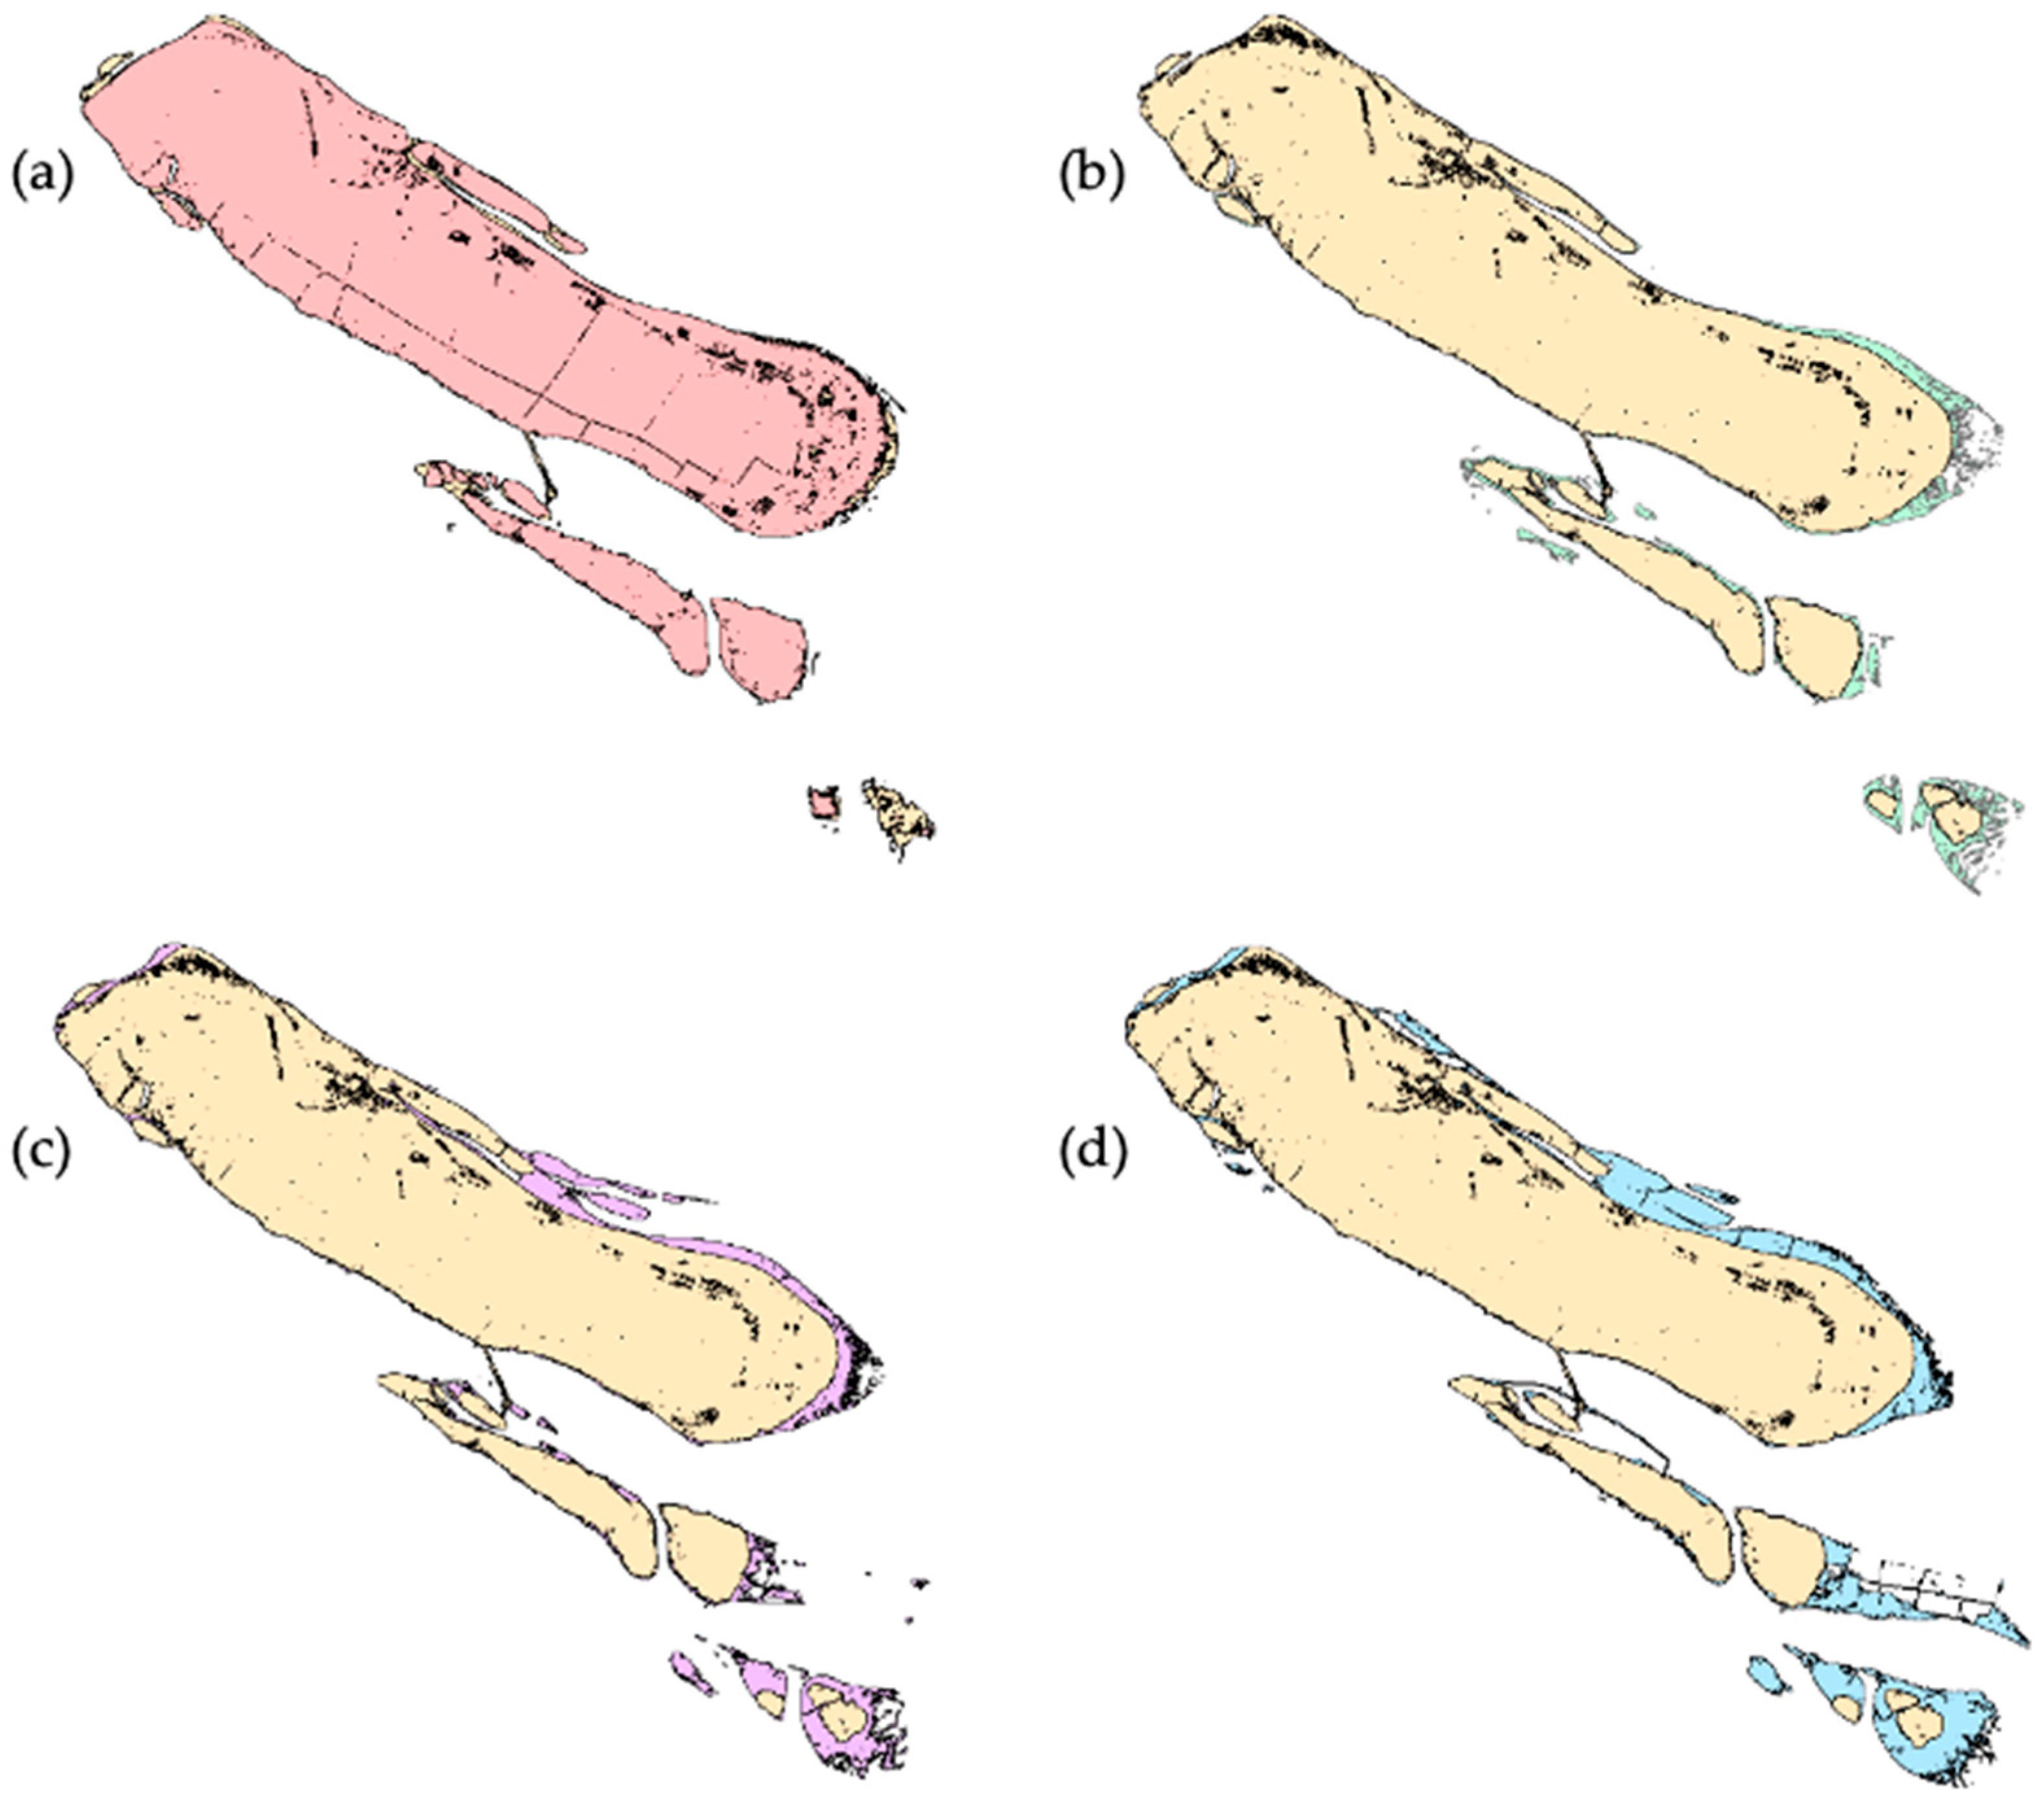
Figure 18 compares the impact of riverbank morphology changes on saltwater intrusion in other years and the year of river dredging (2002). Figure 18a illustrates the differences in riverbank morphology between 2002 and 1993, while Figure 18b shows the changes between 1997 and 2002. Notably, the sand tail of the Jiuduan Sandbank in 1997 showed an extension of siltation compared to 1993. Jiuduan Sandbank, a sand island influenced by ebb tide flows, experiences an annual downward movement of the sand head. As the sand head grows in volume, tidal strength increases, which amplifies the impact of saltwater intrusion (as shown in Figure 11). Figure 18c shows that the narrowing and siltation of the North Branch of Chongming Island weakens the upstream runoff effect, while erosion of the downstream riverbed leads to an increase in saltwater intrusion from 2002 to 2009 (as seen in Figure 13). Comparing river conditions between 2012 and 2002 (Figure 18d), the coastline of the North Branch is significantly narrowed. At the same time, siltation in the lower section of the North Branch significantly reduces the tidal capacity in the middle and lower sections, thereby weakening the effect of the rising and falling tides (Figure 18d). As shown in Figure 13, the distance of saltwater intrusion is reduced in 2002, which may be attributed to river dredging, increased runoff dynamics, and weakened saltwater intrusion.
In addition to the influencing factors discussed above, other factors such as sea level rise, large-scale circulation, and coastal currents also influence saltwater intrusion in the YRE. For example, sea level rise can exacerbate saltwater intrusion [46], especially during the dry season of the Yangtze River [47]. Moreover, human activities further exacerbate saltwater intrusion, particularly through water management projects such as the Three Gorges Dam [48] and the South-to-North Water Diversion Project [18]. These projects reduce runoff and weaken the water flow of the Yangtze River, ultimately affecting the volume of freshwater inflow into the sea. The engineering structures in waterways such as dikes also have significant impacts on saltwater intrusion into estuaries. The impact of dikes on saltwater intrusion varies under different wind conditions [17,44]. The aspect ratio of the dikes has an impact on the physical process of water exchange, further affecting saltwater intrusion into the estuary [49,50]. In future works, we will continue to investigate the impact of the above factors on saltwater intrusion into the YRE through sensitivity testing.

5. Conclusions

This study develops a 3D full-dynamic FVCOM, utilizing measured runoff data from the Datong Station, to simulate current and salinity distribution in the lower reaches and estuary of the Yangtze River. Based on the simulation results, we analyze the spatiotemporal characteristics of saltwater intrusion in the YRE and explore the factors influencing its variability. The root mean square errors between the simulated and observed current velocities and salinity levels in the YRE are relatively small, demonstrating the reliability of the model simulations.
The results reveal interannual variations in salinity in the YRE. In 1993, the salinity was low, but from 1994 to 1996, it increased significantly before decreasing again from 1997 to 1999. From 2000, salinity levels have shown a year-by-year increase, maintaining high levels until 2012. An overall trend in increasing saltwater intrusion is observed. In 1998, due to a major flood, the intrusion distance reached the lowest value in the 20-year period. However, from 2001 to 2008, the construction of numerous reservoirs and dams led to reduced runoff. During this period, the saltwater intrusion distance increased by 9 km. The vertical profile of the intrusion indicates that in summer, sea surface heating enhances stratification and weakens mixing, resulting in salinity stratification and significant saltwater intrusion.
A power spectrum analysis of the saltwater intrusion distance identified significant periodicities with 99% confidence at intervals of 341–410 days, 27 days, 23.95 days, 13.65–16.13 days, and 4.51–9.63 days. Correlation analysis shows that runoff has the strongest influence on saltwater intrusion distance, with a correlation coefficient of −0.8750. Meridional wind, zonal wind, and tidal level differences have correlation coefficients of −0.0623, −0.5610, and 0.1413, respectively. This highlights that runoff is the most important factor in determining the extent of saltwater intrusion. Additionally, the prevailing north wind in winter causes significant Ekman transport toward land, further exacerbating saltwater intrusion. This study also employs remote sensing technology to assess shoreline changes in the YRE, river dredging, changes in river conditions, reclamation activities, and river siltation, all of which have had a notable impact on saltwater intrusion.

Author Contributions

Conceptualization, H.S. and C.D.; methodology, H.S.; software, X.W., H.S. and C.L.; validation, X.W. and H.S.; formal analysis, X.W. and H.S.; investigation, X.W. and H.S.; resources, X.W. and H.S.; data curation, H.S.; writing—original draft preparation, X.W., H.S. and Y.C.; writing—review and editing, X.W., H.S., C.D., C.L. and Y.C.; visualization, Y.C.; supervision, Y.C.; project administration, Y.C.; funding acquisition, Y.C. All authors have read and agreed to the published version of the manuscript.

Funding

This research was funded by the National Natural Science Foundation of China, grant number 42306028; and the Natural Science Foundation of the Jiangsu Higher Education Institutions of China, grant number 23KJB170005.

Institutional Review Board Statement

Not applicable.

Informed Consent Statement

Not applicable.

Data Availability Statement

The Landsat remote sensing image data in this study are available from the geospatial data cloud platform of the Chinese Academy of Sciences Computer Grid Information Center (http://www.gscloud.cn (accessed in 18 June 2024)). The CFSv2 data are available at https://cfs.ncep.noaa.gov/cfsv2/downloads.html, and were downloaded in 1 February 2019. HYCOM data are accessible on the following website: https://www.hycom.org (accessed in 3 February 2019). The CFSR data are available at https://www.hycom.org/dataserver/ncep-cfsr, and were downloaded in 5 February 2019. The Simple Ocean Data Assimilation (SODA) reanalysis data are available at http://apdrc.soest.hawaii.edu/data/data.php (accessed in 25 September 2024)).

Acknowledgments

The authors would like to thank Hui Wu from the State Key Laboratory of Estuarine and Coastal Research, East China Normal University, for providing the observation data in this research.

Conflicts of Interest

Author Haiyun Shi was employed by the company Wuxi Ninecosmos Technology Co., Ltd. The remaining authors declare that the research was conducted in the absence of any commercial or financial relationships that could be construed as a potential conflict of interest.

References

  1. Kuang, C.; Chen, W.; Gu, J.; Su, T.C.; Song, H.; Ma, Y.; Dong, Z. River discharge contribution to sea-level rise in the Yangtze River Estuary, China. Cont. Shelf Res. 2017, 134, 63–75. [Google Scholar] [CrossRef]
  2. Hao, Z.; Xu, M.; Zou, X.; Wang, C. The changing Changjiang River estuarine-coastal ocean continuum in the anthropocene. Catena 2024, 238, 107904. [Google Scholar] [CrossRef]
  3. Liu, L.; Sun, F.; Zhao, H.; Mi, H.; He, S.; Chen, Y.; Liu, Y.; Lan, H.; Zhang, M.; Wang, Z. Compositional changes of sedimentary microbes in the Yangtze River Estuary and their roles in the biochemical cycle. Sci. Total Environ. 2021, 760, 143383. [Google Scholar] [CrossRef] [PubMed]
  4. Xu, H.J.; Huang, Z.; Bai, Y.C.; Su, L.S.; Hong, Y.C.; Lu, T.T.; Wang, X. Numerical analysis of sediment deposition in Yangtze river estuary: Insight from conceptual estuary models. Appl. Ocean Res. 2020, 104, 102372. [Google Scholar] [CrossRef]
  5. Wang, T.; Geyer, W.R.; Maccready, P. Total exchange flow, entrainment and diffusive salt flux in estuaries. J. Phys. Oceanogr. 2017, 47, 1205–1220. [Google Scholar] [CrossRef]
  6. Wang, T.; Geyer, W.R.; Engel, P.; Jiang, W.; Feng, S. Mechanisms of tidal oscillatory salt transport in a partially stratified estuary. J. Phys. Oceanogr. 2015, 45, 2773–2789. [Google Scholar] [CrossRef]
  7. Wu, H.; Zhu, J.; Chen, B.; Chen, Y. Quantitative relationship of runoff and tide to saltwater spilling over from the North Branch in the Changjiang Estuary: A numerical study. Estuar. Coast. Shelf Sci. 2006, 69, 125–132. [Google Scholar] [CrossRef]
  8. Liu, T.H.; Wang, Y.K.; Wang, X.K.; Duan, H.F.; Yan, X.F. Morphological environment survey and hydrodynamic modeling of a large bifurcation-confluence complex in Yangtze River, China. Sci. Total Environ. 2020, 737, 139705. [Google Scholar] [CrossRef]
  9. Wang, X.G.; Hollanders, P.H.J. Effect of groundwater table control on water saving irrigation strategies in the Qingtongxia irrigation district. J. Hydrodyn. 2004, 16, 166–175. [Google Scholar]
  10. Dai, Z.; Mei, X.; Darby, S.E.; Lou, Y.; Li, W. Fluvial sediment transfer in the Changjiang (Yangtze) river-estuary depositional system. J. Hydrol. 2018, 566, 719–734. [Google Scholar] [CrossRef]
  11. Wan, Y.; Zhao, D. Observation of saltwater intrusion and ETM dynamics in a stably stratified estuary: The Yangtze Estuary, China. Environ. Monit. Assess. 2017, 189, 89. [Google Scholar] [CrossRef] [PubMed]
  12. Chen, W.; Chen, K.; Kuang, C.; Zhu, D.Z.; He, L.; Mao, X.; Liang, H.; Song, H. Influence of sea level rise on saline water intrusion in the Yangtze River Estuary, China. Appl. Ocean. Res. 2016, 54, 12–25. [Google Scholar] [CrossRef]
  13. Chen, W.; Mao, C.; He, L.; Jiang, M. Sea-level rise impacts on the saline water intrusion and stratification of the Yangtze Estuary. J. Coast. Res. 2020, 95, 1395–1400. [Google Scholar] [CrossRef]
  14. Zhu, J.; Wu, H.; Li, L.; Qiu, C. Saltwater intrusion in the Changjiang Estuary. In Coastal Environment, Disaster, and Infrastructure—A Case Study of China’s Coastline; IntechOpen: Rijeka, Croatia, 2018; pp. 49–73. [Google Scholar]
  15. Xu, Z.; Ma, J.; Wang, H.; Hu, Y.; Yang, G.; Deng, W. River discharge and saltwater intrusion level study of Yangtze River Estuary, China. Water 2018, 10, 683. [Google Scholar] [CrossRef]
  16. Qiu, C.; Zhu, J.; Gu, Y. Impact of seasonal tide variation on saltwater intrusion in the Changjiang River estuary. Chin. J. Oceanol. Limnol. 2012, 30, 342–351. [Google Scholar] [CrossRef]
  17. Li, L.; Zhu, J.; Chant, R.J.; Wang, C.; Pareja-Roman, L.F. Effect of dikes on saltwater intrusion under various wind conditions in the Changjiang Estuary. J. Geophys. Res. Ocean. 2020, 125, e2019JC015685. [Google Scholar] [CrossRef]
  18. Huang, H.; Wang, Y.; Wang, S.; Lan, Y.; Huang, X. Saltwater Intrusion in the Changjiang River Estuary in Response to the East Route of the South-to-North Water Transfer Project in the New Period after 2003. Sustainability 2024, 16, 683. [Google Scholar] [CrossRef]
  19. Chen, C.; Huang, H.; Beardsley, R.C.; Xu, Q.; Limeburner, R.; Cowles, G.W.; Sun, Y.; Qi, J.; Lin, H. Tidal dynamics in the Gulf of Maine and New England Shelf: An application of FVCOM. J. Geophys. Res. Ocean. 2011, 116, C12010. [Google Scholar] [CrossRef]
  20. Ge, J.; Ding, P.; Chen, C.; Hu, S.; Fu, G.; Wu, L. An integrated East China Sea–Changjiang Estuary model system with aim at resolving multi-scale regional–shelf–estuarine dynamics. Ocean Dyn. 2013, 63, 881–900. [Google Scholar] [CrossRef]
  21. Ge, J.; Lu, J.; Zhang, J.; Chen, C.; Liu, A.; Ding, P. Saltwater Intrusion-Induced Flow Reversal in the Changjiang Estuary. J. Geophys. Res. Ocean. 2022, 127, e2021JC018270. [Google Scholar] [CrossRef]
  22. Zhang, Z.; Chen, C.; Song, Z.; Zhang, D.; Hu, D.; Guo, F. A FVCOM study of the potential coastal flooding in apponagansett bay and clarks cove, Dartmouth Town (MA). Nat. Hazards 2020, 103, 2787–2809. [Google Scholar] [CrossRef]
  23. Xue, P.; Chen, C.; Ding, P.; Beardsley, R.C.; Lin, H.; Ge, J.; Kong, Y. Saltwater intrusion into the Changjiang River: A model-guided mechanism study. J. Geophys. Res. Ocean. 2009, 114, C02006. [Google Scholar] [CrossRef]
  24. Yang, Z.; Khangaonkar, T. Modeling of salt intrusion, intertidal mixing, and circulation in a braided estuary. J. Coast. Res. 2008, 10052, 171–180. [Google Scholar] [CrossRef]
  25. Wang, J.H.; Zhang, D.B.; Zhang, W.S.; Zhang, J.S. Impacts of different dynamic factors on the saltwater intrusion in the northern branch of the yangtze estuary. China Ocean Eng. 2019, 33, 673–684. [Google Scholar] [CrossRef]
  26. Cheng, X.J.; Zhan, W.; Guo, Z.R.; Yuan, L.R. A modeling study on saltwater intrusion to western four watercourses in the Pearl River estuary. China Ocean Eng. 2012, 26, 575–590. [Google Scholar] [CrossRef]
  27. Shen, Y.; Jia, H.; Li, C.; Tang, J. Numerical simulation of saltwater intrusion and storm surge effects of reclamation in Pearl River Estuary, China. Appl. Ocean Res. 2018, 79, 101–112. [Google Scholar] [CrossRef]
  28. Xu, Z.; Ma, J.; Hu, Y. Saltwater intrusion function and preliminary application in the Yangtze River Estuary, China. Int. J. Environ. Res. Public Health 2019, 16, 118. [Google Scholar] [CrossRef]
  29. Chen, C.; Liu, H.; Beardsley, R.C. An Unstructured Grid, Finite-Volume, Three-Dimensional, Primitive Equations Ocean Model: Application to Coastal Ocean and Estuaries. J. Atmos. Ocean. Technol. 2003, 20, 159–186. [Google Scholar] [CrossRef]
  30. Chen, C.; Huang, H.; Beardsley, R.C.; Liu, H.; Xu, Q.; Cowles, G. A finite volume numerical approach for coastal ocean circulation studies: Comparisons with finite difference models. J. Geophys. Res. Ocean. 2007, 112, 83–87. [Google Scholar] [CrossRef]
  31. Wu, L.; Chen, C.; Guo, P.; Shi, M.; Qi, J.; Ge, J. A FVCOM-based unstructured grid wave, current, sediment transport model, I. Model description and validation. J. Ocean. Univ. China 2011, 10, 1–8. [Google Scholar] [CrossRef]
  32. Yu, K.; Liu, H.; Chen, Y.; Dong, C.; Dong, J.; Yan, Y.; Wang, D. Impacts of the mid-latitude westerlies anomaly on the decadal sea level variability east of China. Clim. Dyn. 2019, 53, 5985–5998. [Google Scholar] [CrossRef]
  33. Kalnay, E.; Kanamitsu, M.; Kistler, R.; Collins, W.; Deaven, D.; Gandin, L.; Iredell, M.; Saha, S.; White, G.; Woollen, J.; et al. The NCEP/NCAR 40-year reanalysis project. Bull. Am. Meteorol. Soc. 1996, 77, 437–471. [Google Scholar] [CrossRef]
  34. Lan, J.; Wang, Y.; Wang, G. A subsurface intensity index of the cold eddy in the East China Sea. Chin. J. Oceanol. Limnol. 2010, 28, 1275–1280. [Google Scholar] [CrossRef]
  35. Duan, Y.; Liu, H.; Yu, W.; Hou, Y. The mean properties and variations of the Southern Hemisphere subpolar gyres estimated by Simple Ocean Data Assimilation (SODA) products. Acta Oceanol. Sin. 2016, 35, 8–13. [Google Scholar] [CrossRef]
  36. Liu, H.; Zhang, Q.; Pang, C.; Duan, Y.; Xu, J. The seasonal variation of the north Pacific meridional overturning circulation heat transport. J. Oceanol. Limnol. 2019, 037, 423–433. [Google Scholar] [CrossRef]
  37. Qi, P.; Guo, Y.X. Interpretation of Subsurface Salinity EOFs on Southern ECS Shelf Using SODA Reanalysis: Large-Scale Patterns and Seasonal to Interannual Variations. J. Geophys. Res. Ocean. 2022, 127, e2020JC017038. [Google Scholar] [CrossRef]
  38. Li, L.; Zhu, J.; Wu, H.; Wang, B. A numerical study on water diversion ratio of the Changjiang (Yangtze) estuary in dry season. Chin. J. Oceanol. Limnol. 2010, 28, 700–712. [Google Scholar] [CrossRef]
  39. Shi, H.; Gao, C.; Dong, C.; Xia, C.; Xu, G. Variation of river islands around a large city along the Yangtze River from satellite remote sensing images. Sensors 2017, 17, 2213. [Google Scholar] [CrossRef]
  40. Lyu, H.; Zhu, J. Impact of the bottom drag coefficient on saltwater intrusion in the extremely shallow estuary. J. Hydrol. 2018, 557, 838–850. [Google Scholar] [CrossRef]
  41. Shi, H.; Cao, Y.; Dong, C.; Xia, C.; Li, C. The Spatio-Temporal Evolution of River Island Based on Landsat Satellite Imagery, Hydrodynamic Numerical Simulation and Observed Data. Remote Sens. 2018, 10, 2046. [Google Scholar] [CrossRef]
  42. Wu, H.; Zhu, J.; Choi, B.H. Links between saltwater intrusion and subtidal circulation in the Changjiang Estuary: A model-guided study. Cont. Shelf Res. 2010, 30, 1891–1905. [Google Scholar] [CrossRef]
  43. Tian, R. Factors controlling saltwater intrusion across multi-time scales in estuaries, Chester River, Chesapeake Bay. Estuar. Coast. Shelf Sci. 2019, 223, 61–73. [Google Scholar] [CrossRef]
  44. Tao, Z.; Chu, A.; Chen, Y.; Lu, S.; Wang, B. Wind effect on the saltwater intrusion in the Yangtze estuary. J. Coast. Res. 2020, 105, 42–46. [Google Scholar] [CrossRef]
  45. Li, Z.; Zhu, J. Numerical simulation of the North Branch regime change impact on saltwater intrusion in the Yangtze River Estuary from 2007 to 2016. J. East China Norm. Univ. (Nat. Sci.) 2022, 2022, 109. [Google Scholar]
  46. Werner, A.D.; Simmons, C.T. Impact of sea-level rise on sea water intrusion in coastal aquifers. Groundwater 2009, 47, 197–204. [Google Scholar] [CrossRef]
  47. Qiu, C.; Zhu, J. Assessing the influence of sea level rise on salt transport processes and estuarine circulation in the Changjiang River estuary. J. Coast. Res. 2015, 31, 661–670. [Google Scholar] [CrossRef]
  48. Qiu, C.; Zhu, J.-R. Influence of seasonal runoff regulation by the Three Gorges Reservoir on saltwater intrusion in the Changjiang River Estuary. Cont. Shelf Res. 2013, 71, 16–26. [Google Scholar] [CrossRef]
  49. Zhou, Z.; Ge, J.; Van Maren, D.S.; Kuai, Y.; Ding, P.; Wang, Z.B. Groyne-Induced Effects on Channel-Shoal Exchange and Saltwater Intrusion in Estuarine Environments. J. Hydraul. Eng. 2024, 150, 04023056. [Google Scholar] [CrossRef]
  50. Chang, Y.; Li, X.; Wang, Y.P.; Klingbeil, K.; Li, W.; Zhang, F.; Burchard, H. Salinity mixing in a tidal multi-branched estuary with huge and variable runoff. J. Hydrol. 2024, 634, 131094. [Google Scholar] [CrossRef]
Figure 2. Triangular grid and water depth (shadings, unit: m) in the study area.
Jmse 12 01752 g002
Figure 3. Triangular grid and water depth (shadings, unit: m) in the YRE. The red lines represent the selected research sections (31.4° N and 31° N for the northern and southern sections, respectively).
Jmse 12 01752 g003
Figure 4. Comparison of observed and simulated surface current speed in the Yangtze River estuary. The solid black line is the simulated current speed, and blue solid line with red dots is the observation.
Jmse 12 01752 g004
Figure 5. Same as Figure 4, but for bottom current speed.
Jmse 12 01752 g005
Figure 6. Comparison between observed and simulated surface salinity in the Yangtze River estuary. The solid black line is the simulated salinity, and blue solid line with red dots is the observation.
Jmse 12 01752 g006
Figure 7. Same as Figure 6, but for bottom salinity.
Jmse 12 01752 g007
Figure 8. Comparison between SODA and simulated surface salinity at the grid point position of 122.25° E and 31.25° N. The solid black line is the simulated salinity, and the solid red line is the SODA salinity. (a) Comparison of monthly average surface salinity in 1993; (b) comparison of monthly average surface salinity in July from 1993 to 2010.
Jmse 12 01752 g008
Figure 9. Longitudinal average of salinity in the Yangtze River estuary from 1993 to 2012 based on vertical, latitudinal, and temporal averaging.
Jmse 12 01752 g009
Figure 10. The 20 yr (1993–2012) average vertical–longitudinal section for the Yangtze River estuary based on latitudinal averaging. The color shading represents salinity, and the contour is isohaline (unit: PSU).
Jmse 12 01752 g010
Figure 11. Time series of hourly averaged salinity in the Yangtze River estuary between 1993 and 2012.
Jmse 12 01752 g011
Figure 12. Saltwater intrusion distance in the Yangtze River estuary from 1993 to 2012 (unit: km).
Jmse 12 01752 g012
Figure 13. Vertical–latitudinal sections of salinity and current along 31° N in the Yangtze River estuary from 0:00 to 11:00 (UTC) on 1 July 1993. The shading represents salinity, while the length and direction of the vectors represent current velocity and direction, respectively. The contour is the isohaline (unit: PSU).
Jmse 12 01752 g013
Figure 14. Same as Figure 13, but along 31.4° N.
Jmse 12 01752 g014
Figure 15. Power spectrum of saltwater intrusion distance in the Yangtze River estuary from 1993 to 2012. The black solid line is the power spectrum distribution (unit: km2/cpd), and the red dotted line indicates the 99% confidence level.
Jmse 12 01752 g015
Figure 16. Monthly variations in saltwater intrusion distance, downstream runoff, 10 m sea surface wind, and tide level difference from 1993 to 2012. (a) The blue line represents the saltwater intrusion distance (unit: km), and the red line represents the runoff measured at Datong Station (unit: m3/s). (b) The black line represents the distance of saltwater intrusion (unit: km), the red line represents the zonal wind speed (unit: m/s), and the blue line represents the meridional wind speed (unit: m/s). (c) The blue line represents the distance of saltwater intrusion (unit: km), and the red line represents the tide level difference (unit: m).
Jmse 12 01752 g016
Figure 17. Extraction results of Chongming District and its surrounding islands in the Yangtze River estuary from Landsat images in (a) 1993, (b) 1997, (c) 2002, (d) 2007, and (e) 2012.
Jmse 12 01752 g017
Figure 18. Changes in river conditions in the Yangtze River estuary (a) between 1993 and 2002, (b) between 1997 and 2002, (c) between 2002 and 2007, and (d) between 2002 and 2012.
Jmse 12 01752 g018
Table 1. Details of the satellite images over the study area.
DateSatelliteSensorResolution (m)
31 March 1993Landsat-5TM30
11 April 1997Landsat-5TM30
11 January 2002Landsat-7ETM30
7 April 2007Landsat-5TM30
6 November 2012Landsat-7UTM30
Disclaimer/Publisher’s Note: The statements, opinions and data contained in all publications are solely those of the individual author(s) and contributor(s) and not of MDPI and/or the editor(s). MDPI and/or the editor(s) disclaim responsibility for any injury to people or property resulting from any ideas, methods, instructions or products referred to in the content.