Article

Corrected Method for Scaling the Structural Response Subjected to Blast Load

1
Green & Smart River-Sea-Going Ship, Cruise and Yacht Research Center, Wuhan University of Technology, Wuhan 430063, China
2
School of Naval Architecture, Ocean and Energy Power Engineering, Wuhan University of Technology, Wuhan 430063, China
*
Author to whom correspondence should be addressed.
J. Mar. Sci. Eng. 2024, 12(10), 1767; https://doi.org/10.3390/jmse12101767
Submission received: 18 August 2024 / Revised: 26 September 2024 / Accepted: 30 September 2024 / Published: 5 October 2024
(This article belongs to the Section Ocean Engineering)

Abstract

:
In scale-down tests of ship structures subjected to a blast load, the accuracy of the predicted response of a prototype is affected by the material substitution and geometric distortion between a scaled model and a full-size structure; this is known as incomplete similarity. To obtain a more accurate response from a prototype during small-size tests, a corrected method for scaling the response of thin plates and stiffened plates under a blast load was derived. In addition, based on numerical simulations of explosion responses by employing the elastic–plastic model and the Johnson–Cook constitutive model, it was found that using the average yield stress derived from the equivalent plastic strain energy in the ideal elastic–plastic model can obtain consistent structural responses. Moreover, a method for calculating the distortion factor caused by the yield stress of different materials was proposed. Furthermore, it was demonstrated that the average effective plastic strain between the prototype and the corrected model is equal, and based on this, a similarity prediction method was established to correct the distortions caused by yield stress and the thickness of blast loaded plates. The results indicate that the proposed correction method can compensate for the differences caused by distorted factors of yield stress and thickness, with the maximum error in the structure’s peak displacement being less than 3%.

1. Introduction

In modern naval warfare, ships face the threat of strong shock loads generated by weapons, such as anti-ship missiles and torpedoes [1,2,3,4]. It is the most reliable and accurate method to investigate the damage mechanism of ship structures through full-scale structural explosion tests. However, due to the high cost and limited test conditions, full-scale tests are difficult to implement effectively. Conducting similar scaling tests has the advantages of having low economic costs, short durations, and simple test conditions, which are especially suitable for large structures, such as ships [5,6,7].
To accurately predict the response of a prototype, it is crucial to employ an appropriate similarity law to design a scale-down model. Due to the nonlinear effects involved in explosion scenarios, the similarity π-theorem is widely used to simplify problems [8,9]. The method posits that when all the dimensionless π terms of the scaled model is equal to those of the prototype, perfect similarity is achieved, allowing the scaled model to accurately predict the behavior of a prototype. However, in the field of explosive impact, distortions in material strain rates can distort the yield stress between a prototype and a scaled model, resulting in imperfect similarity [10,11,12,13].
In addition to the effects of material strain rates, issues of imperfect similarity also include material substitution and geometrical distortion. Numerous studies have been conducted to address the challenge of incomplete similarity in the structural impact response. Dynamic yield stress and density are typically the primary factors that affect material distortions. Alves and Oshiro [14] employed an aluminum structural model to predict the response of a steel structural prototype, formulating a corrected equation that correlates dynamic yield stress with impact velocity and validated their approach via similarity analysis of the dynamic responses across three different structures. Mazzariol and Alves [15] conducted experiments on circular tubes subjected to axial impact, taking into account the differences in density and dynamic yield stress between steel and aluminum. Mazzariol et al. [16] further refined the correction formulas for similarity distortions in impact responses of different materials, incorporating considerations for material density and dynamic yield stress. Wang et al. [17] proposed a direct similarity method for the material distortion of impact response, which established the difference function of the dynamic yield stress between the prototype and the model. Wang et al. [18] proposed a material similarity number that considers the effects of strain hardening, strain rate strengthening, and thermal softening, and established phase diagrams for different materials, which can be used to evaluate materials with characteristics most similar to the prototype. Li et al. [19] derived similarity laws for the impact response of structures under elastic–plastic conditions based on theoretical equations for thin plate impacts and used thickness compensation to address response distortions between different elastic–plastic materials. Wang et al. [20] established the minimum difference function of dynamic yield stress considering the effects of strain hardening and strain rate strengthening based on reference [17]. Wang et al. [21] proposed an impact response similarity law for anisotropic elastic structures, in which the distortions caused by material anisotropy and structural geometry were considered.
When designing the scale-down model, geometric distortion arises due to the difficulty of scaling the thickness as the same factor of length. Wang et al. [22] accounted for the effects of strain rate and thickness distortion by developing a dynamic yield stress loss function, which was validated through impact loading tests on T-beams. Oshiro and Alves [23] formulated a corrected equation for the geometric distortion exponent factor based on the material strain rate effect, setting a predetermined target exponent value and calculating the impact response of a typical structure to determine a reasonable value for the distortion exponent. This significantly enhanced the accuracy of the incomplete similarity model in predicting the prototype’s response. Mazzariol and Alves [24,25] introduced a correction method for the ratio of plastic bending moment to mass, considering differences in density, structural strength, and thickness. The validity of this correction method was confirmed through simulations and experiments on structural dynamic responses under impact loads. Wang et al. [26] developed a framework for similarity laws in structural impact responses, taking into account geometric distortions based on thin plate differential equations. This method effectively reveals the similarity patterns in structural deflection, stress, and strain under impact loads. However, it shows distortion when impact loads exceed a certain level. Yang et al. [27] derived similarity laws for geometric distortions in thin-walled circular tubes subjected to axial impacts using equation analysis methods. Chang et al. [28] applied a similar approach to derive geometric distortion similarity laws for thin-walled square tubes under axial impacts, incorporating both geometric and material distortions. Chang et al. [29] derived a similarity law for the geometric distortion of flat-bar stiffened plates in various directions, which reliably predicted response parameters such as displacement, velocity, energy, and impact force of the prototype. These studies demonstrate that similarity theory has made substantial progress in developing correction methods for material and geometric distortions.
While many of the corrected methods previously discussed use velocity as the load parameter, in the context of explosion impact responses, using structural response velocity as a basis for distortion correction factor is problematic due to the difficulty in accurately calculating it with a reasonable prediction formula. For the issue of similar distortion in explosive responses, Kong et al. [30] introduced the specific impulse as the correction load parameter for structural response. The validity and accuracy of this corrected method were confirmed through numerical simulations. In subsequent research on similar distortion, specific impulse has commonly been adopted as the correction parameter for explosive loads [31,32,33]. Fu et al. [32] proposed two methods for correcting the impulse—altering the mass of the charge or adjusting the stand-off distance—to address the response distortion caused by the strain rate effects in armored steel. Additionally, Qin et al. [33] employed the specific impulse correction method to tackle the strain rate issue, significantly enhancing the prediction accuracy of cabin explosion scaling tests.
In practical engineering applications, most ship structures utilize special high-strength steel. However, due to specifications and processing limitations, the scaling models designed are often replaced with ordinary steel [34], and the plate thickness dimensions frequently fail to meet the design requirements. This discrepancy results in plate thickness scaling differing from other dimensional scaling, leading to scaling distortion of thickness [35,36]. Such material substitution and thickness scaling distortion prevent the scaling model from achieving perfect similarity with the prototype. Qin et al. [37] predicted the structural response of a 921A steel prototype by employing the test results from a Q345 steel scaling model, which established a minimum difference two-paradigm equation for dynamic yield stress using the best approximation method and incorporated plate thickness compensation to enhance the accuracy of prototype response prediction. Kang et al. [38] formulated a correction relationship between mine blast impulse, strain rate, and plate thickness distortion. Kong et al. [39] explored three equivalent methods for stiffeners, considering the type of stiffener and plate thickness distortion in the incomplete scaling model, and achieved an accurate prototype response by improving the exponential factor method for geometric distortion. Chen et al. [40] developed a corrected equation between the geometric distortion of sandwich plates and a TNT charge, verifying the reliability of their method through confined cabin explosion tests. Despite some progress in correcting material and geometric distortions based on specific impulse for blast–response problems, there are relatively few studies that integrate the three parameters of blast impulse, dynamic yield stress, and plate thickness in a unified corrected equation.
In the study of structural impact response, the formulation of dimensionless expressions plays a critical role in providing a rapid and accurate evaluation of the impact behavior. Particularly for the response of thin plates under impulsive loading, researchers have developed several pertinent dimensionless expressions. Among the more notable are the Damage Number proposed by Nurick and Martin [41] and the Response Number proposed by Zhao [42], which are as follows
D n = I 2 ρ σ d h 2 ,   R n = I 2 ρ σ d h 2 L h 2
By establishing empirical formulas that relate the dimensionless numbers to the dimensionless number for deflection ϕ = δ / h , a rapid assessment of deflection response can be facilitated. These formulas highlight the impact of factors such as impulse, density, yield stress, and plate thickness on deflection response. Although a rapid assessment can be achieved by conducting calibration tests on actual prototype structures and formulating an empirical equation, this approach loses the significance of predictions using scaled models. The utility of these dimensionless numbers primarily extends to analyzing the impact response of thin plates, and their applicability has not been effectively validated for stiffened plate structures, which exhibit more complex response and deformation patterns. Additionally, the dynamic yield stress changed in the response process due to effects of strain hardening and strain rate strengthening, complicating the selection of an appropriate yield stress for input of the dimensionless equation. Consequently, the application of the above dimensionless equation is extended in this paper to correct the response distortion for thin plates and stiffened plates under explosive loading. Additionally, a method for calculating the dynamic yield stress distortion factor is proposed. The paper is organized as follows: Section 2 introduces the similarity law of structural response under explosive loading and the distortion correction method. Section 3 conducts a numerical verification of similar distortion effects in explosive response and proposes a method for calculating the dynamic yield stress distortion factor. Section 4 establishes a corrected formula for predicting similar distortion in explosive response and verifies its reasonableness through simulation. Section 5 summarizes the work conducted in this study.

2. Similarity Law and Correction for Blast Response

2.1. Similarity Law of Blast Response

Explosive loading is highly transient and nonlinear, making the dynamic response of stiffened and thin plates under blast loads complex and influenced by the interplay of factors such as structural dimensions, material properties, and explosive loading. Dimensional analysis is an effective approach for addressing these complexities, with the similarity π-theorem being a widely used method to simplify such problems [8,30]. In the π-theorem, a sufficient and relevant set of physical parameters is selected and expressed in dimensionless form. Perfect similarity between the prototype and the model is achieved when each of the corresponding dimensionless π-terms is equal, which is defined as follows:
π i m = π i p
where i is the number of dimensionless π terms, and m and p denote model and prototype, respectively.
The dynamic response process of the stiffened plate and thin plate under an explosive load can be characterized using the following parameters: explosive load parameters (mass of the explosive, W; stand-off distance, R; peak overpressure of the shockwave, Δ p Φ ; and specific impulse, I), structural dimensional parameters (length, L; width, B; thickness, h; and number of stiffeners, n0), structural material properties (density, ρ; yield stress, σd; plastic limit bending moment, M0; and plastic limit neutral plane force, N0) and structural response parameters (displacement, δ; velocity, v; time, t; strain, ε; and strain rate, ε ˙ ). Among these, the explosive load parameters can be represented by the specific impulse I [30]. By selecting length L, material density ρ, and yield stress σd as the fundamental dimensions, and ensuring that both the prototype and the scaled model satisfy the conditions for perfect similarity, the scaling factors for the explosive response parameters can be determined. They are summarized in Table 1.

2.2. Similarity Distortion and Correction

From Table 1, it can be concluded that if the input parameters (including load and structural parameters) of the prototype and the model adhere to a perfect scaling relationship, then the structural response parameters will also maintain perfect similarity. However, in ship explosion scaling tests, issues such as material substitution and geometric distortion—specifically in dynamic yield stress β σ d 1 and thickness β h β L —lead to incomplete similarity between a prototype and a model, significantly diminishing the model’s ability to accurately predict the prototype’s response. The similarity theory outlined in Table 1 assumes that the same scaling factor is applied to both thickness and length, which prevents the assessment of thickness distortion effects on structural response from the perspective of dimensional analysis. Consequently, this similarity theory cannot effectively address the challenges posed by material substitution and thickness scaling distortion. To overcome these limitations, a corrected equation should be established that integrates blast impulse, dynamic yield stress, and thickness into a unified framework.
The previous section introduced the dimensionless Equation (1) for the response of a thin plate structure subjected to impulsive loading. This equation illustrates the varying degrees of influence that impulse, structural density, yield stress, and plate thickness have on the deformation of the structure. The equation can be decomposed into two components: one representing the work done by the impulsive load and the other representing the energy absorption of the structure in response to the load. The ratio of the work done by the external load to the energy absorbed by the structure corresponds to the deformation of the structure under the external load. For a more detailed analysis of this dimensionless equation, both thin plates and stiffened plates are considered. It is assumed that the thickness of the plate and stiffeners in the stiffened plate are equal, and that the edge lengths of the thin plate and stiffened plate are also equal. Under these assumptions, the combined parameter reflecting the work input from the load can be expressed as follows:
E i = I ρ h 2 ρ h L 2 = I 2 L 2 ρ h
where Ei is the input of the impulse load. The equation can be expressed by considering the work done by the impulse load in the form of kinetic energy. In this context, the first term of the equation represents the square of the response velocity, while the second term corresponds to the mass of the structure. Consequently, the combined parameter that reflects the energy absorption capability of the structure can be expressed as follows:
E m = σ d S h
where Em represents the energy absorption of the structure, S′ denotes the area of the central surface of the structure, and S′·h corresponds to the volume of the structure. When the structure undergoes significant plastic deformation, the deformation is primarily governed by membrane stretching. Thus, the equation can be described as the structure absorbing energy through membrane stretching, characterized by a typical yield stress value.
When the structural response reaches maximum deformation, the energy input from the load is fully converted into the energy absorbed by the structure. For a thin plate, the area of the blast-facing surface is equal to the area of the structural midplane, whereas for a stiffened plate, these two area values differ. By dividing Equation (3) by Equation (4), we can derive a ratio that reflects this relationship between the input energy and the absorbed energy for both types of structures. They can be expressed as follows
E i E m p l a t e = I 2 ρ σ d h 2 , E i E m s t i f f e n e d   p l a t e = I 2 S ρ σ d h 2 S
where S and S′ both represent area scaling factors, and they can be eliminated. The similarity constant representing the structural response of both thin plate and stiffened plates under impulsive loading can be expressed as follows:
β I 2 β ρ β σ d β h 2
Correcting the distortion in yield stress and thickness using Equation (6) ensures that the structural displacement δ adheres to the geometric scaling. However, it should be noted that time response parameters may also experience distortion. From the analysis above, it is evident that the response characteristics of structural blast impact can be attributed to the interaction between the load impulse and the structural momentum. Assuming a small surface element ΔS of the structure is subjected to the blast impulse I, which induces a response with velocity v, the momentum theorem can be applied to express this relationship as follows:
F t = m v I Δ S = ρ h v Δ S I = ρ h v
Thus, the correction factor for velocity can be expressed as follows:
β v = β I β ρ β h
By substituting β v = β / β t into Equation (8), the correction factor for time can be expressed as follows:
β t = β ρ β h β β I
From the perspective of energy similarity, this paper derives a dimensionless formula for correcting deflection. This correction method not only guides the similarity distortion of thin plates under explosive loads but also extends to more complex stiffened plates. However, it is important to note that during the derivation of energy similarity, the expression for structural energy absorption was based primarily on membrane force stretching as the dominant mechanism of plastic dissipation. This indicates that the method is limited to correcting response distortions for structures undergoing large plastic deformations.

3. Simulation Verification for Correction Method

Numerical simulations of similar distortions in structural response under blast loading are conducted using AUTODYN 2022R1 software to validate the distortion correction method described in Section 2. In steel structures, selecting an appropriate yield stress value for distortion correction is challenging because the dynamic yield stress within the structure varies due to strain hardening and strain rate strengthening. To verify the accuracy of the correction method and to explore the response characteristics of yield stress under blast loading, simulations are carried out in Section 3.1 and Section 3.2 using an ideal elastic–plastic model and the Johnson–Cook constitutive model, respectively. For this correction method to be effective, the structural response must be predominantly governed by plastic deformation. Therefore, the explosive loading conditions are set to ensure that the structure undergoes sufficient plastic deformation.

3.1. Ideal Elastic–Plastic Model

In this subsection, the ideal elastic–plastic model is used to simulate the scaled-down blast response of thin plates and stiffened panels, aiming to validate the accuracy of the correction method. In the elastic–plastic model, the yield stress remains constant, unaffected by strain hardening and strain rate strengthening, which facilitates the direct calculation of the yield stress distortion factor.

3.1.1. Setting of Simulations and Conditions

The selected structures include thin plates and stiffened plates, as illustrated in Figure 1. The ideal elastic–plastic model is employed, with a density of 7.85 g/cm3, a modulus of elasticity of 2.06 × 10⁵ MPa, and a Poisson’s ratio of 0.33. The models adopt shell elements with clamped boundary conditions around the perimeter. The TNT explosive is positioned at the midpoint of the structure, and the explosive loading is applied using the Analytical Blast pressure loading method [43]. The finite element model is illustrated in Figure 1c,d. The mesh model primarily references the stiffened plate models from references [30,39], demonstrating that the mesh models meet the required convergence criteria. The subsequent finite element models adopt the same configuration. Additionally, the spatial attenuation of shockwave loads introduces variations in load distribution on the structure, depending on whether the explosion occurs in near-field or far-field environments. In a far-field explosion, the load distribution on the structure is relatively uniform. However, in a near-field explosion, the spherical wave effect is prominent, resulting in a noticeable gradient in load distribution across the structure. The differences in load distribution in near-field explosions complicate the selection of a typical impulse scaling value. Considering the effects of different structures and stand-off distances, four prototype conditions were set up, with the corresponding structural dimensions, properties, and load parameters shown in Table 2. Conditions I and II represent thin plates, while Conditions III and IV represent stiffened plates. Conditions I and III use a blast distance equal to the plate edge length, whereas Conditions II and IV use a blast distance equal to half the plate edge length in order to reflect the impact of near-field and far-field blast load distribution differences on structural response prediction.
The geometric scaling factor of the model is set to βL = 1/20. For each prototype condition, three correction scenarios are established to verify the reliability and applicability of the proposed correction method. These scenarios include yield stress–thickness (A), blast impulse–yield stress (B), and blast impulse–thickness (C), as outlined in Table 3. The conditions are defined as follows: Condition A: Correcting yield stress distortion based on thickness; Condition B: Correcting yield stress distortion based on impulse; and Condition C: Correcting thickness distortion based on impulse. For conditions A and B, the yield stress of the distortion models is 235 MPa. For Condition C, the thicknesses of the distortion models are 2.0 mm, 2.4 mm, 1.4 mm, and 1.7 mm, respectively.
The correction of blast impulse is achieved by adjusting the mass of the explosive, making it crucial to establish a reasonable relationship between the explosive mass and the impulse for effective distortion correction. However, due to the spatial distribution characteristics of blast loads, the specific impulse can vary significantly at different locations on the structure, particularly in near-field explosions. This variability complicates the selection of a typical specific impulse value for correction. Kong et al. [30] developed a fitting equation to relate specific impulse to explosive mass for a stiffened square plate, with the stand-off distance set equal to one side length of the plate. Fu et al. [32] established the fitting equations of specific impulse at the center of the structure and the total impulse in the plane of the whole structure with the explosive mass in a near-field explosion, respectively. The results indicated that using a specific impulse at the center for correction resulted in some deviation from the prototype response. However, the correction based on the total impulse across the whole structure provided a more accurate prediction of the prototype’s response, demonstrating the effectiveness of the latter approach in accounting for the spatial distribution of the blast load.
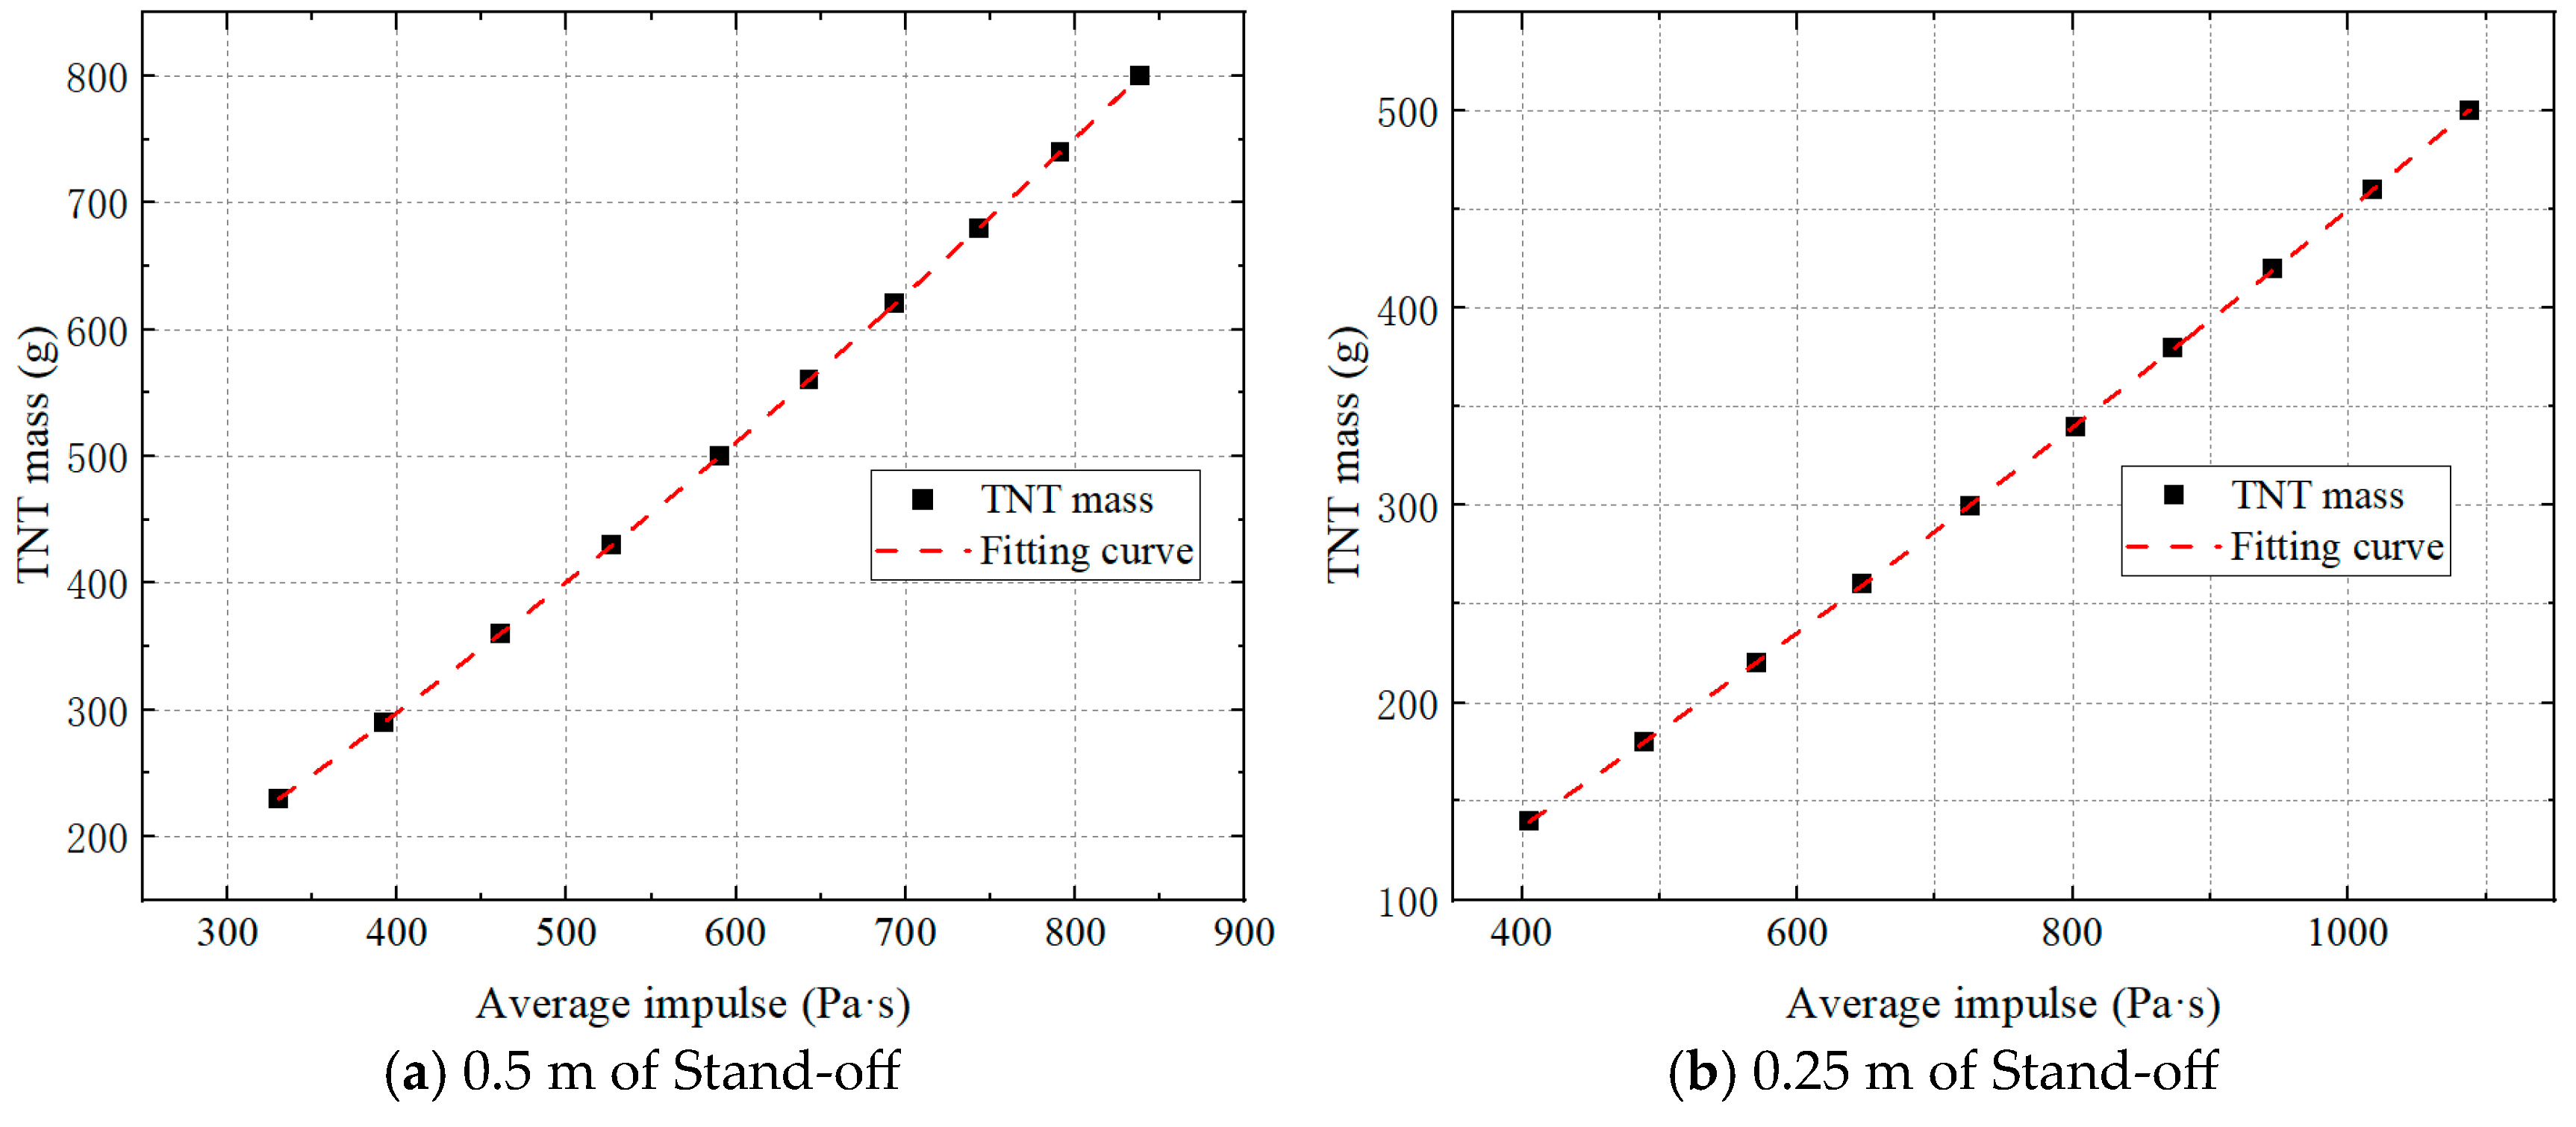
From the above analysis, it is evident that when considering impulse as a typical explosion loading parameter, its overall effect on the structure should be taken into account. Consequently, in this paper, the typical impulse parameter is defined as the average impulse across the plane of the structure, calculated as the ratio of the total impulse to the loaded surface area. The average impulses for the four prototype conditions are I-9536 Pa·s, II-12600 Pa·s, III-11792 Pa·s, and IV-14512 Pa·s, respectively. Using the βL = 1/20 scaling model as a benchmark, the stand-off distances are selected as 0.5 m and 0.25 m. The results for charge quantity versus average specific impulse are shown in Table 4 and Table 5. The relationship between average impulse and explosive mass is then obtained through quadratic fitting, as illustrated in Figure 2. The fitting equations can be obtained as follows:
0.5 m of stand-off
W = 3.35 × 10 4 I 2 + 0.733 I 49.97
0.25 m of stand-off
W = 7.48 × 10 5 I 2 + 0.417 I 41.54
where W is in g and I is in Pa·s. Substituting the average impulse value for each model condition into the quadratic fit equation yields the mass of explosive for the corresponding condition, as shown in Table 6. For the uncorrected model, the scaling factor for TNT mass is typically assumed to follow a complete scaling, i.e., βW = β3.

3.1.2. Comparison of Structural Response

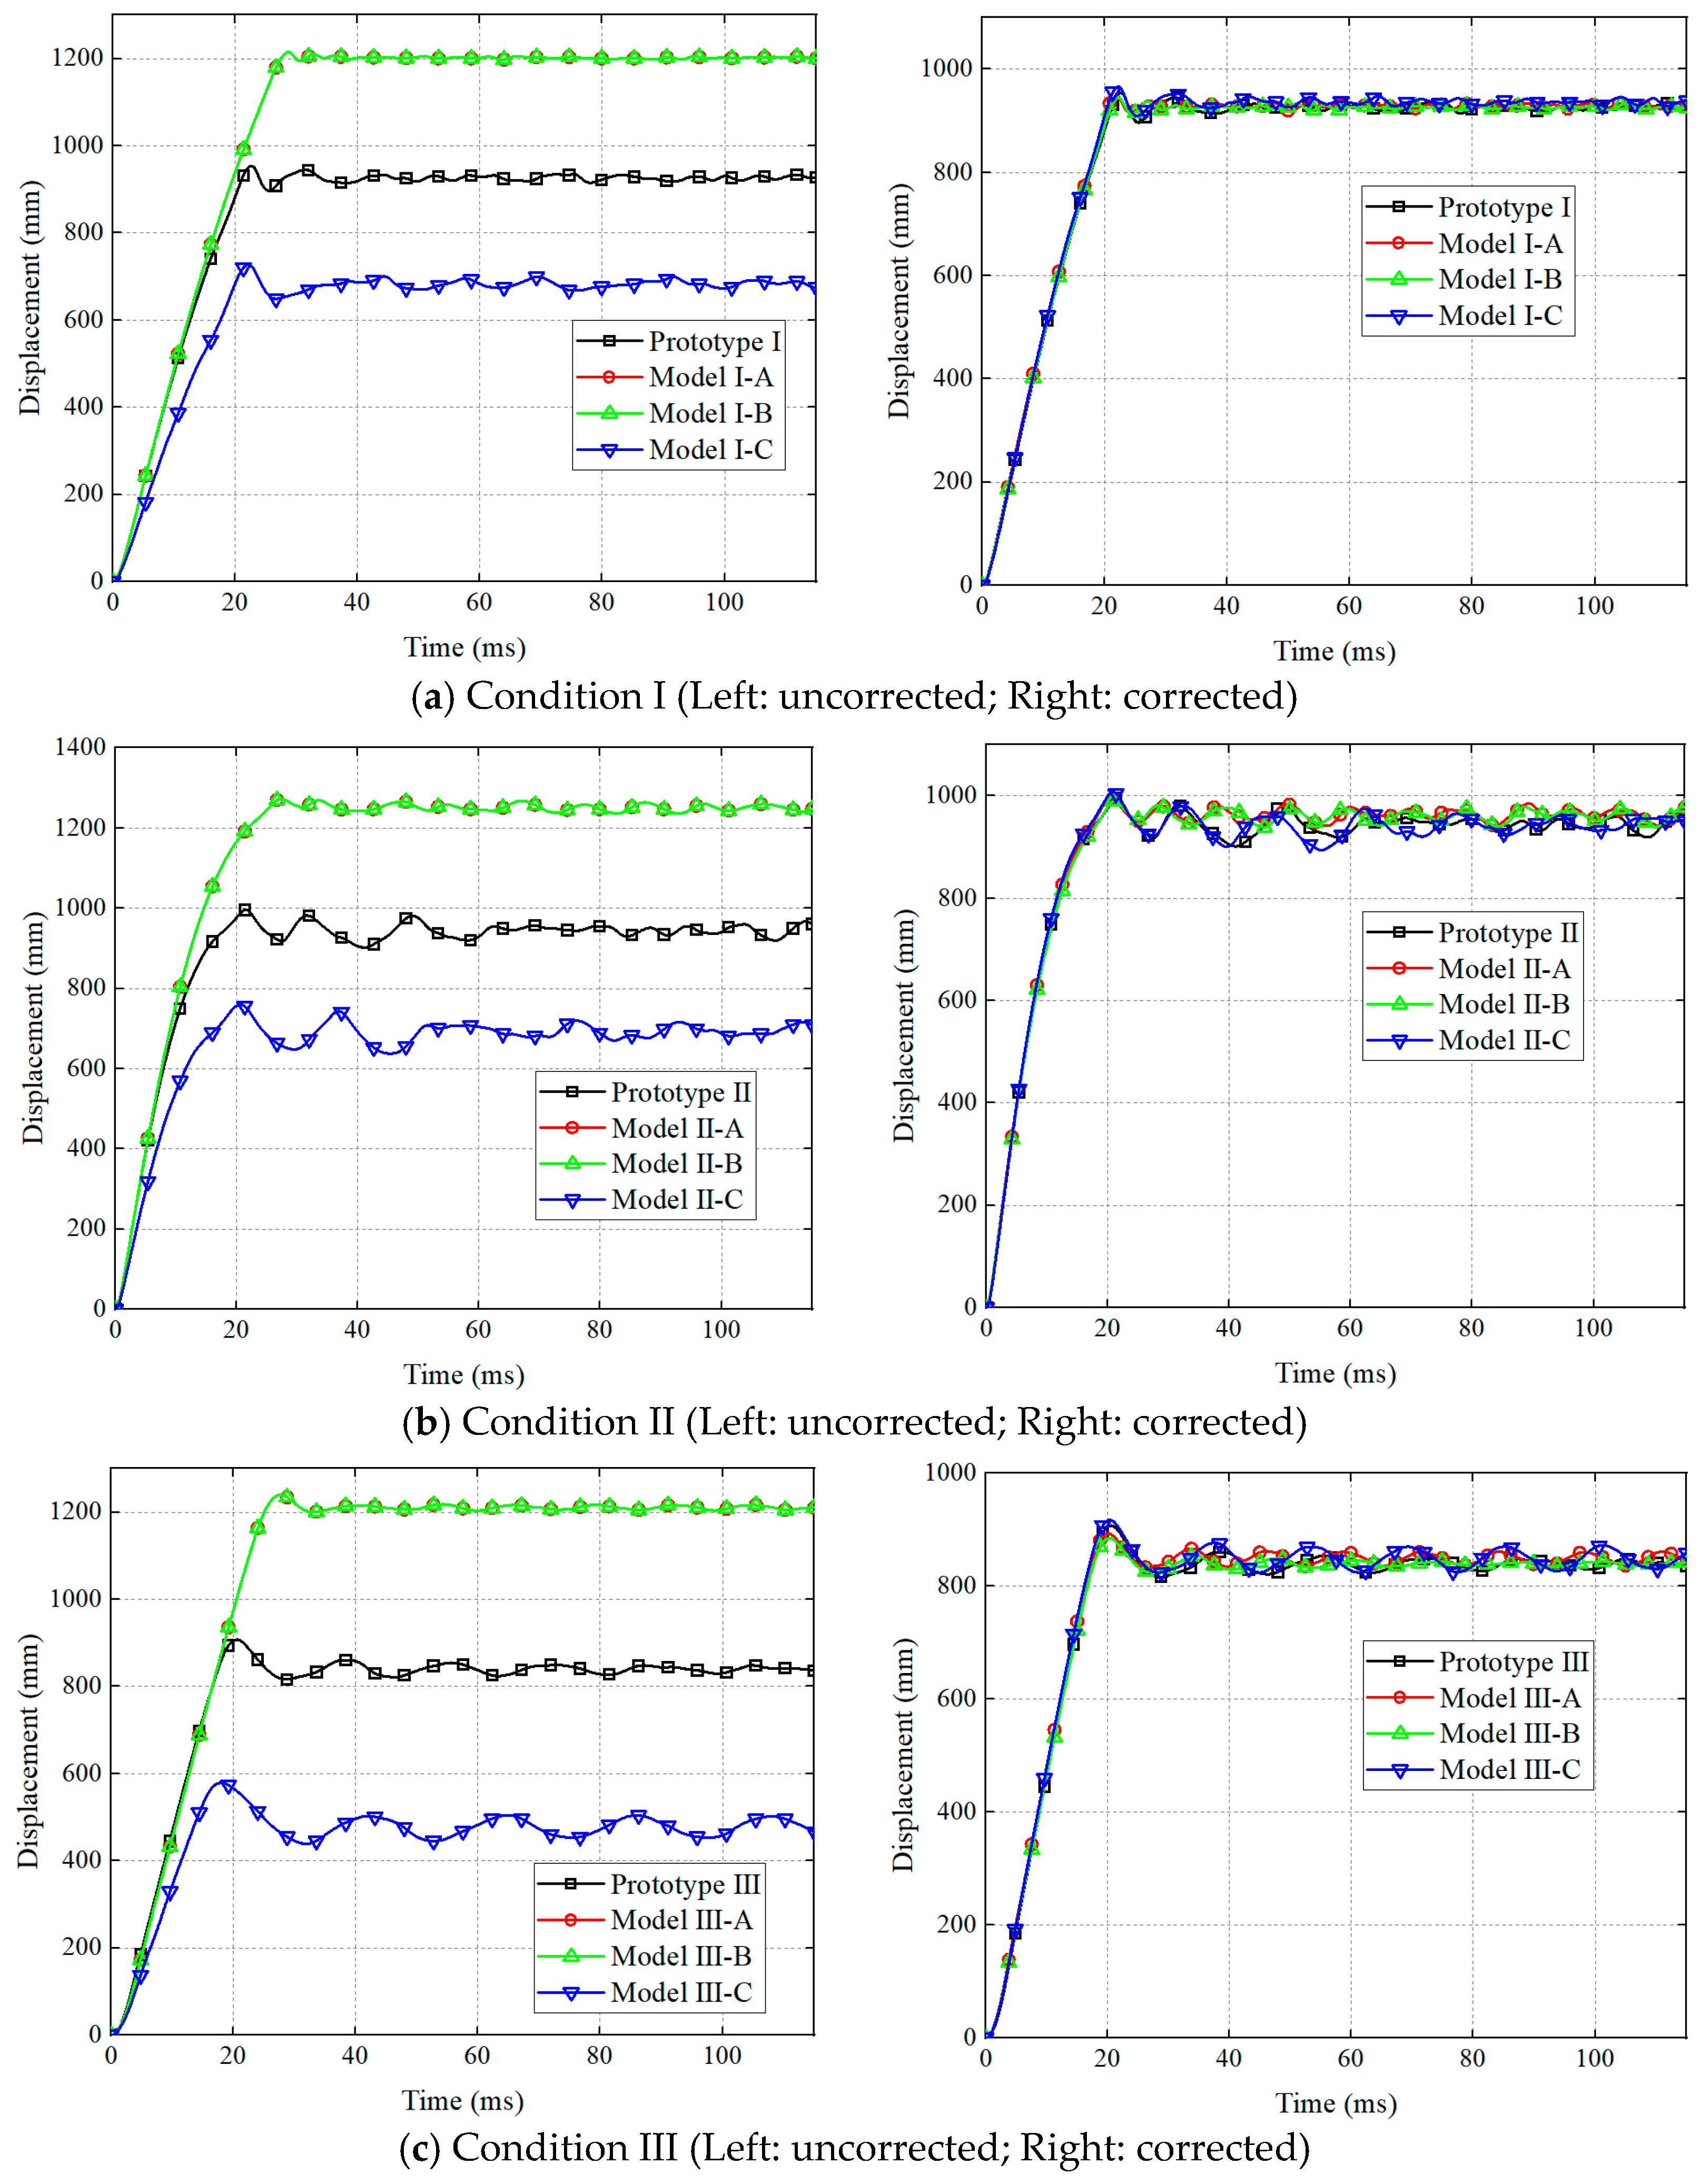
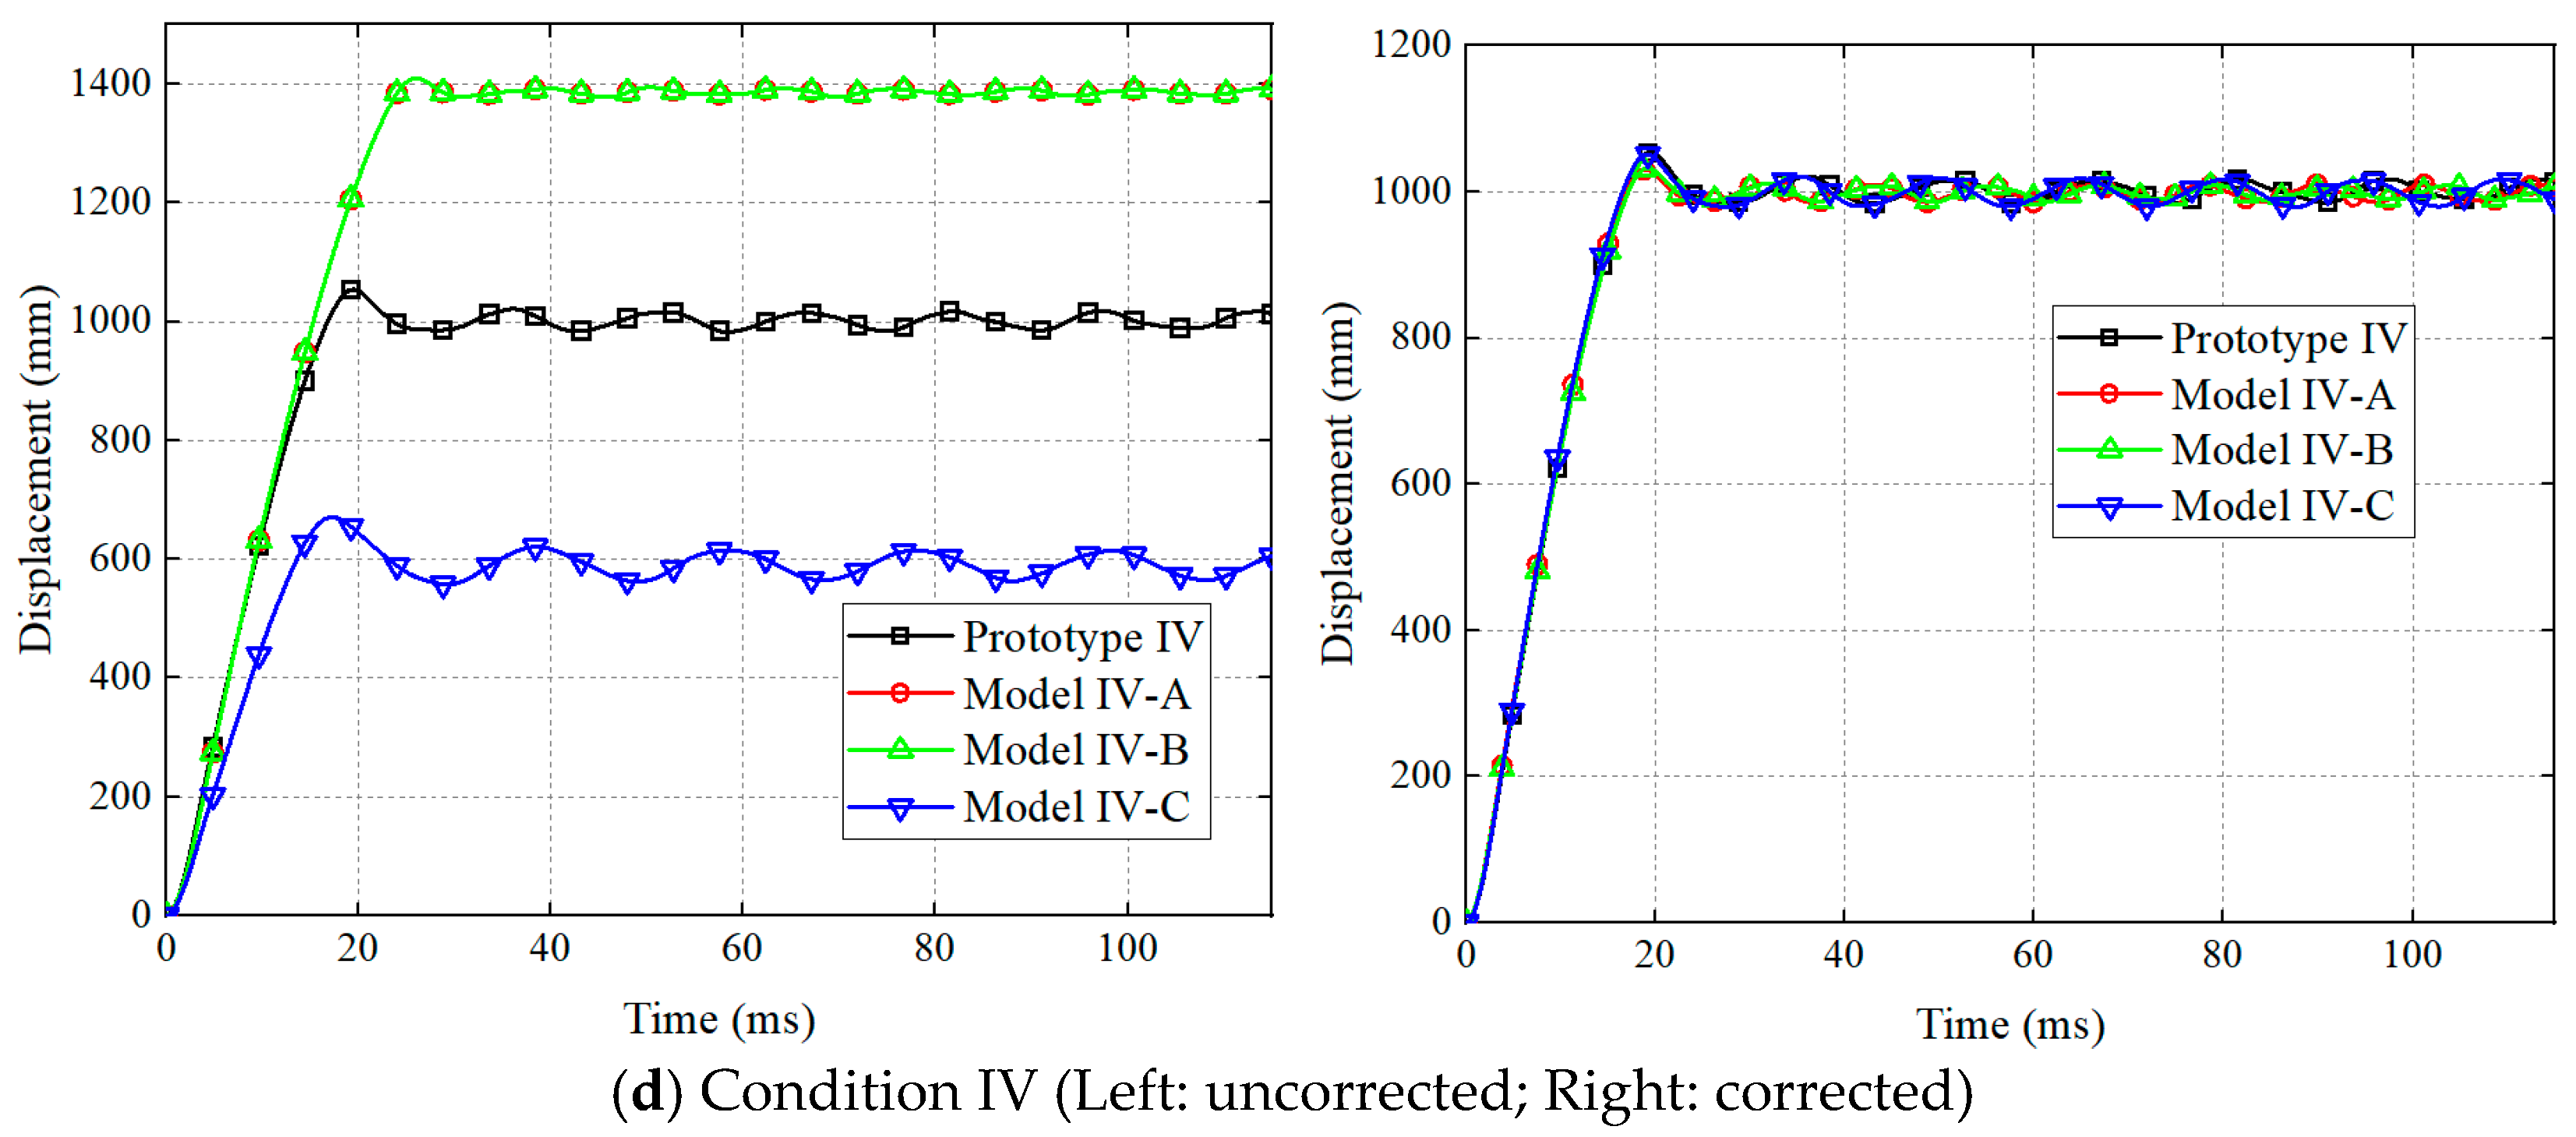
Through the simulations of thin plates and stiffened plates with an ideal elastic–plastic model under blast loading, the displacement–time curves at the midpoint of the structure were obtained, as shown in Figure 3. Table 7 presents the comparison of the peak displacement at the midpoint of the structure between the prototype and the uncorrected and corrected models. The comparison reveals that the correction method significantly improves the prediction accuracy of the prototype structure’s response. The overall error remains within a small range, with the maximum error not exceeding 3%. Whether addressing material distortion or thickness distortion, the accuracy of the response prediction corrected by impulse or thickness is markedly enhanced. For instance, in condition Ⅲ, the errors in the uncorrected results of the three distortion models exceeded 35%, while the errors in the corrected results were reduced to 1.51%, 2.40%, and 1.12%, respectively. This substantial reduction in error illustrates the reasonableness of the method.
Additionally, by comparing the simulation results across different stand-off distances shown in Figure 3, it was observed that using the calculated average impulse for impulse factor correction does not introduce prediction deviation when the stand-off distance changes. This finding indicates the reasonableness of selecting the average impulse for the correction method. Figure 3c,d show the simulation results for the ideal elastic–plastic stiffened plate. From these figures, it is evident that the correction method is also effective for more complex stiffened plate structures. The corrected scaled models consistently maintain high prediction accuracy throughout the entire response, including key aspects such as the maximum deflection, the final deflection, and the deflection’s increasing phase.

3.1.3. Validation of Scaling Factor for Work Done by Explosive Load

The corrected equation is derived from the ratio of the input for blast load to the energy absorbed by the structure to resist deformation. The work done by the blast load is represented by Equation (3), as detailed in Section 2. The scaling factor of Equation (3) can be expressed as follows:
β E i = β I β 2 / β ρ β h
In order to verify the reasonableness of Equation (12), the input values for the blast load of the prototype and the scaled model in the previous section were extracted and compared, as shown in Table 8. From the table, it can be observed that under conditions of large plastic deformations, the explosion load work values predicted by β I β 2 / β ρ β h are basically consistent with the prototype, and the maximum error is within 2%, which indicates the reasonableness of the equation.

3.2. Johnson–Cook Constitutive Model

In the simulations presented in the previous section, the elastic–plastic model was employed, which ensures that the dynamic yield stresses remain constant throughout the response. However, in practical scenarios, the dynamic yield stress is not always equal due to strain hardening and strain rate strengthening effects. This variability complicates the calculation of an appropriate yield stress distortion factor. In this subsection, the Johnson–Cook constitutive model is used to carry out numerical simulations of thin plates and stiffened plates under a blast load to investigate the distribution characteristics of the dynamic yield stresses and to propose a method for determining the yield stress distortion factor.
The structural dynamic response under explosion loading is highly complex, necessitating the selection of an appropriate material constitutive model to accurately simulate structural behavior. The Johnson–Cook constitutive model is commonly used to describe the strength variations of metallic materials subjected to large strain, a high strain rate, and a high temperature, and it is widely applied in various explosion impact engineering scenarios. The dynamic yield strength in the Johnson–Cook constitutive model is a function of strain, strain rate, and temperature, and the constitutive equation can be expressed as follows:
σ d = A + B ε e p n 1 + C ln ε ˙ 1 T m
where A, B, n, C, and m are material coefficients. ε e p is the effective plastic strain, ε ˙ = ε ˙ / ε ˙ 0 is the normalized effective plastic strain rate, ε ˙ 0 = 1 / s 1 , T = T T r / T m T r is the normalized temperature, T is the material temperature, Tr is the reference room temperature, and Tm is the material melting temperature.

3.2.1. Setting of Prototype Conditions

Four prototype conditions were established, with their corresponding structural dimensions, properties, and load parameters shown in Table 9. Conditions V and VI represent thin plates, while Conditions VII and VIII represent stiffened plates. Conditions V and VII use a blast distance equal to the plate edge length, while Conditions VI and VIII use a blast distance equal to half the plate edge length. The mesh model, boundary conditions, and load application method are consistent with those shown in Section 3.1. The prototype and the scaling model adopt 921A steel and Q235 steel, respectively; the density is 7.85 g/cm3, the elastic modulus is 2.06 × 10⁵ MPa, and Poisson’s ratio is 0.33. The parameters of the constitutive model refer to [44,45], as shown in Table 10.
In scaling tests, challenges such as plate processes, welding procedures, and residual stresses often arise. These factors do not satisfy the similarity criteria, making it difficult to quantify their effects on structural response. The presence of these issues can exacerbate scale effects and reduce the prediction accuracy of a scaled model. To mitigate these effects, ship explosion scaling tests typically use scaling factors of 1/4, 1/5, or 1/6, which help to predict the scaled test results while reducing the influence of such disturbing factors. Considering these challenges, this paper adopts the standard scaling factors mentioned above. However, to further assess the rationality of the proposed method, an additional scaling factor of 1/10 is introduced. This allows for a more comprehensive evaluation of the method’s effectiveness in predicting structural responses under different scaling conditions, ensuring that the approach remains reliable even when scaling down to smaller models.

3.2.2. Analysis of Dynamic Yield Stress and Setting of Scaling Condition

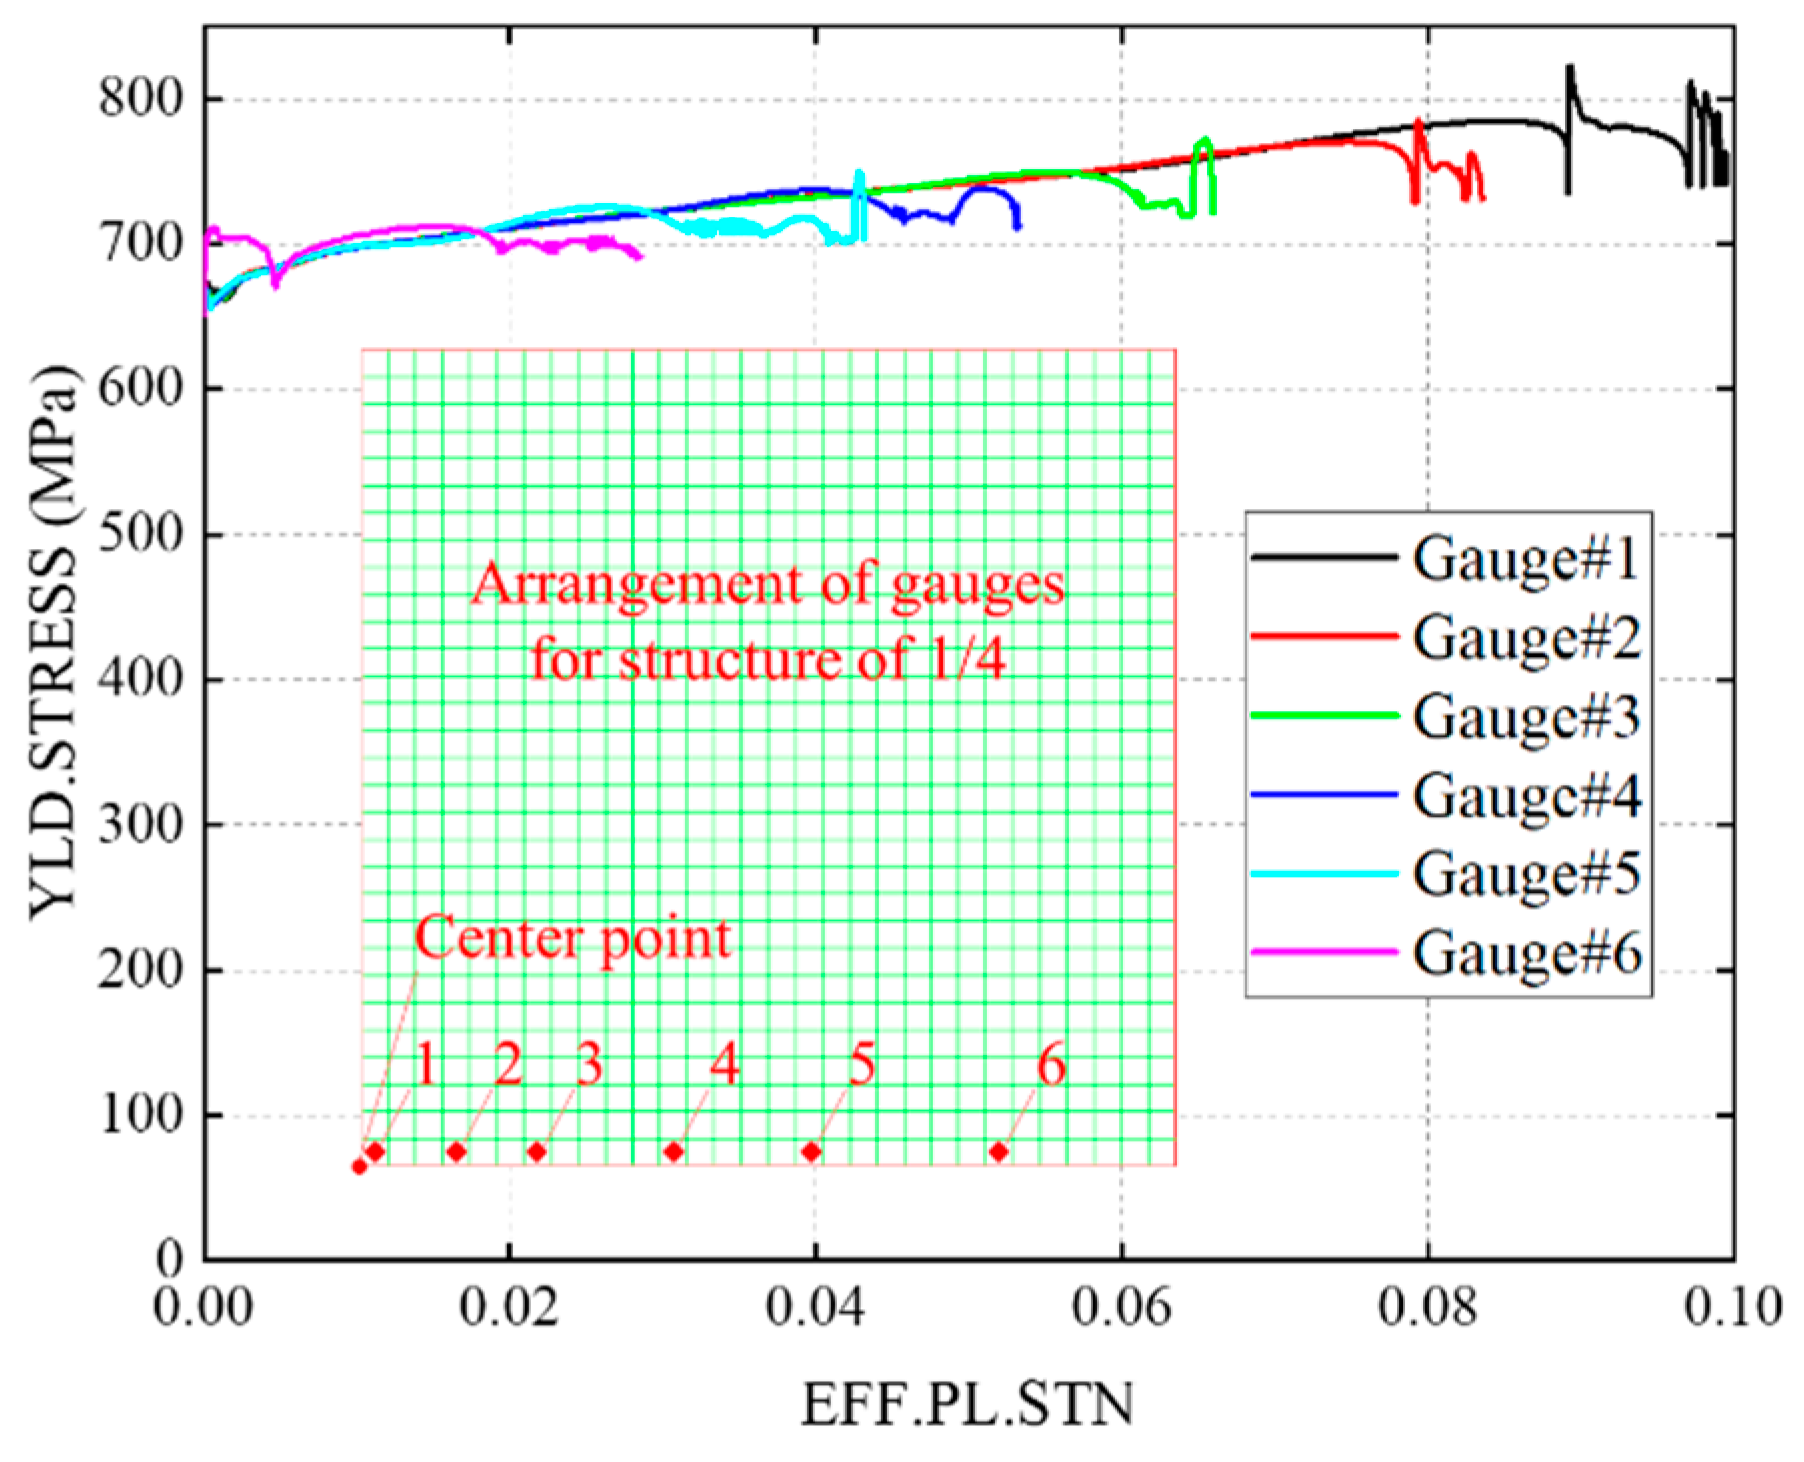
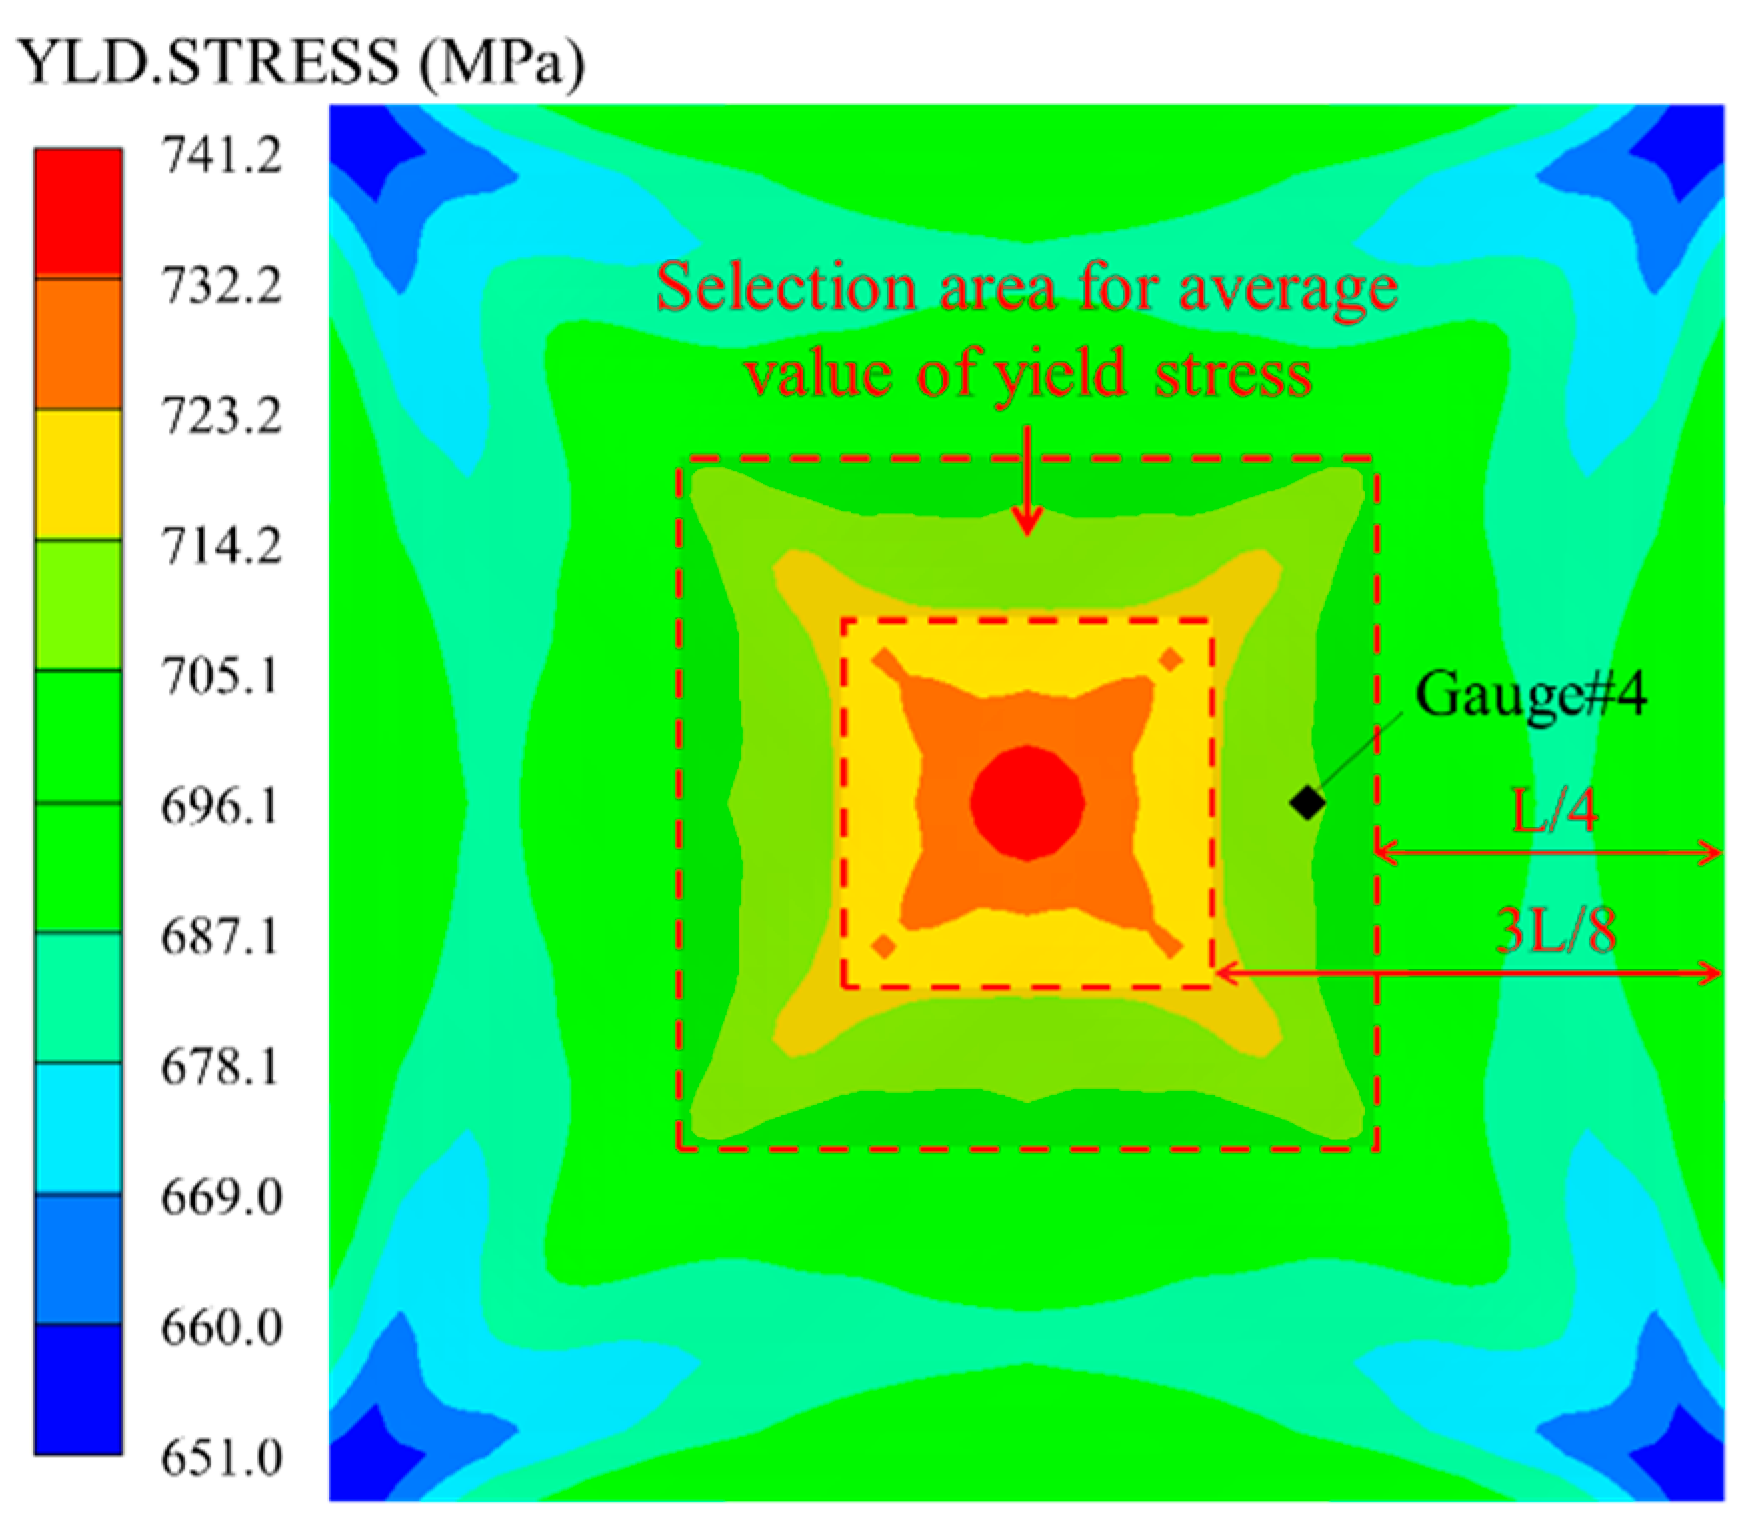
Due to the strain hardening and strain rate strengthening effects, the dynamic yield stress varies throughout the response, complicating the calculation of the appropriate distortion factor. Therefore, the distribution characteristics of dynamic yield stress is crucial for determining the distortion factor for yield stress. Taking prototype Condition V as an example, gauges are arranged across the structure: gauge 1 is near the midpoint, gauge 6 near the edge, with the other gauges distributed as shown in Figure 4. The curve of effective plastic strain versus yield stress reflects the trend of plastic strain energy resisting deformation. Figure 4 shows the effective plastic strain–yield stress curves at different gauges for Condition V. Figure 5 shows the yield stress distribution after stabilization. The figures reveal that the structure’s center is a high-yield stress region, with a gradual decrease towards the edges. Due to boundary constraints, yield stress near the edges increases slightly, but overall, the yield stress level remains low.
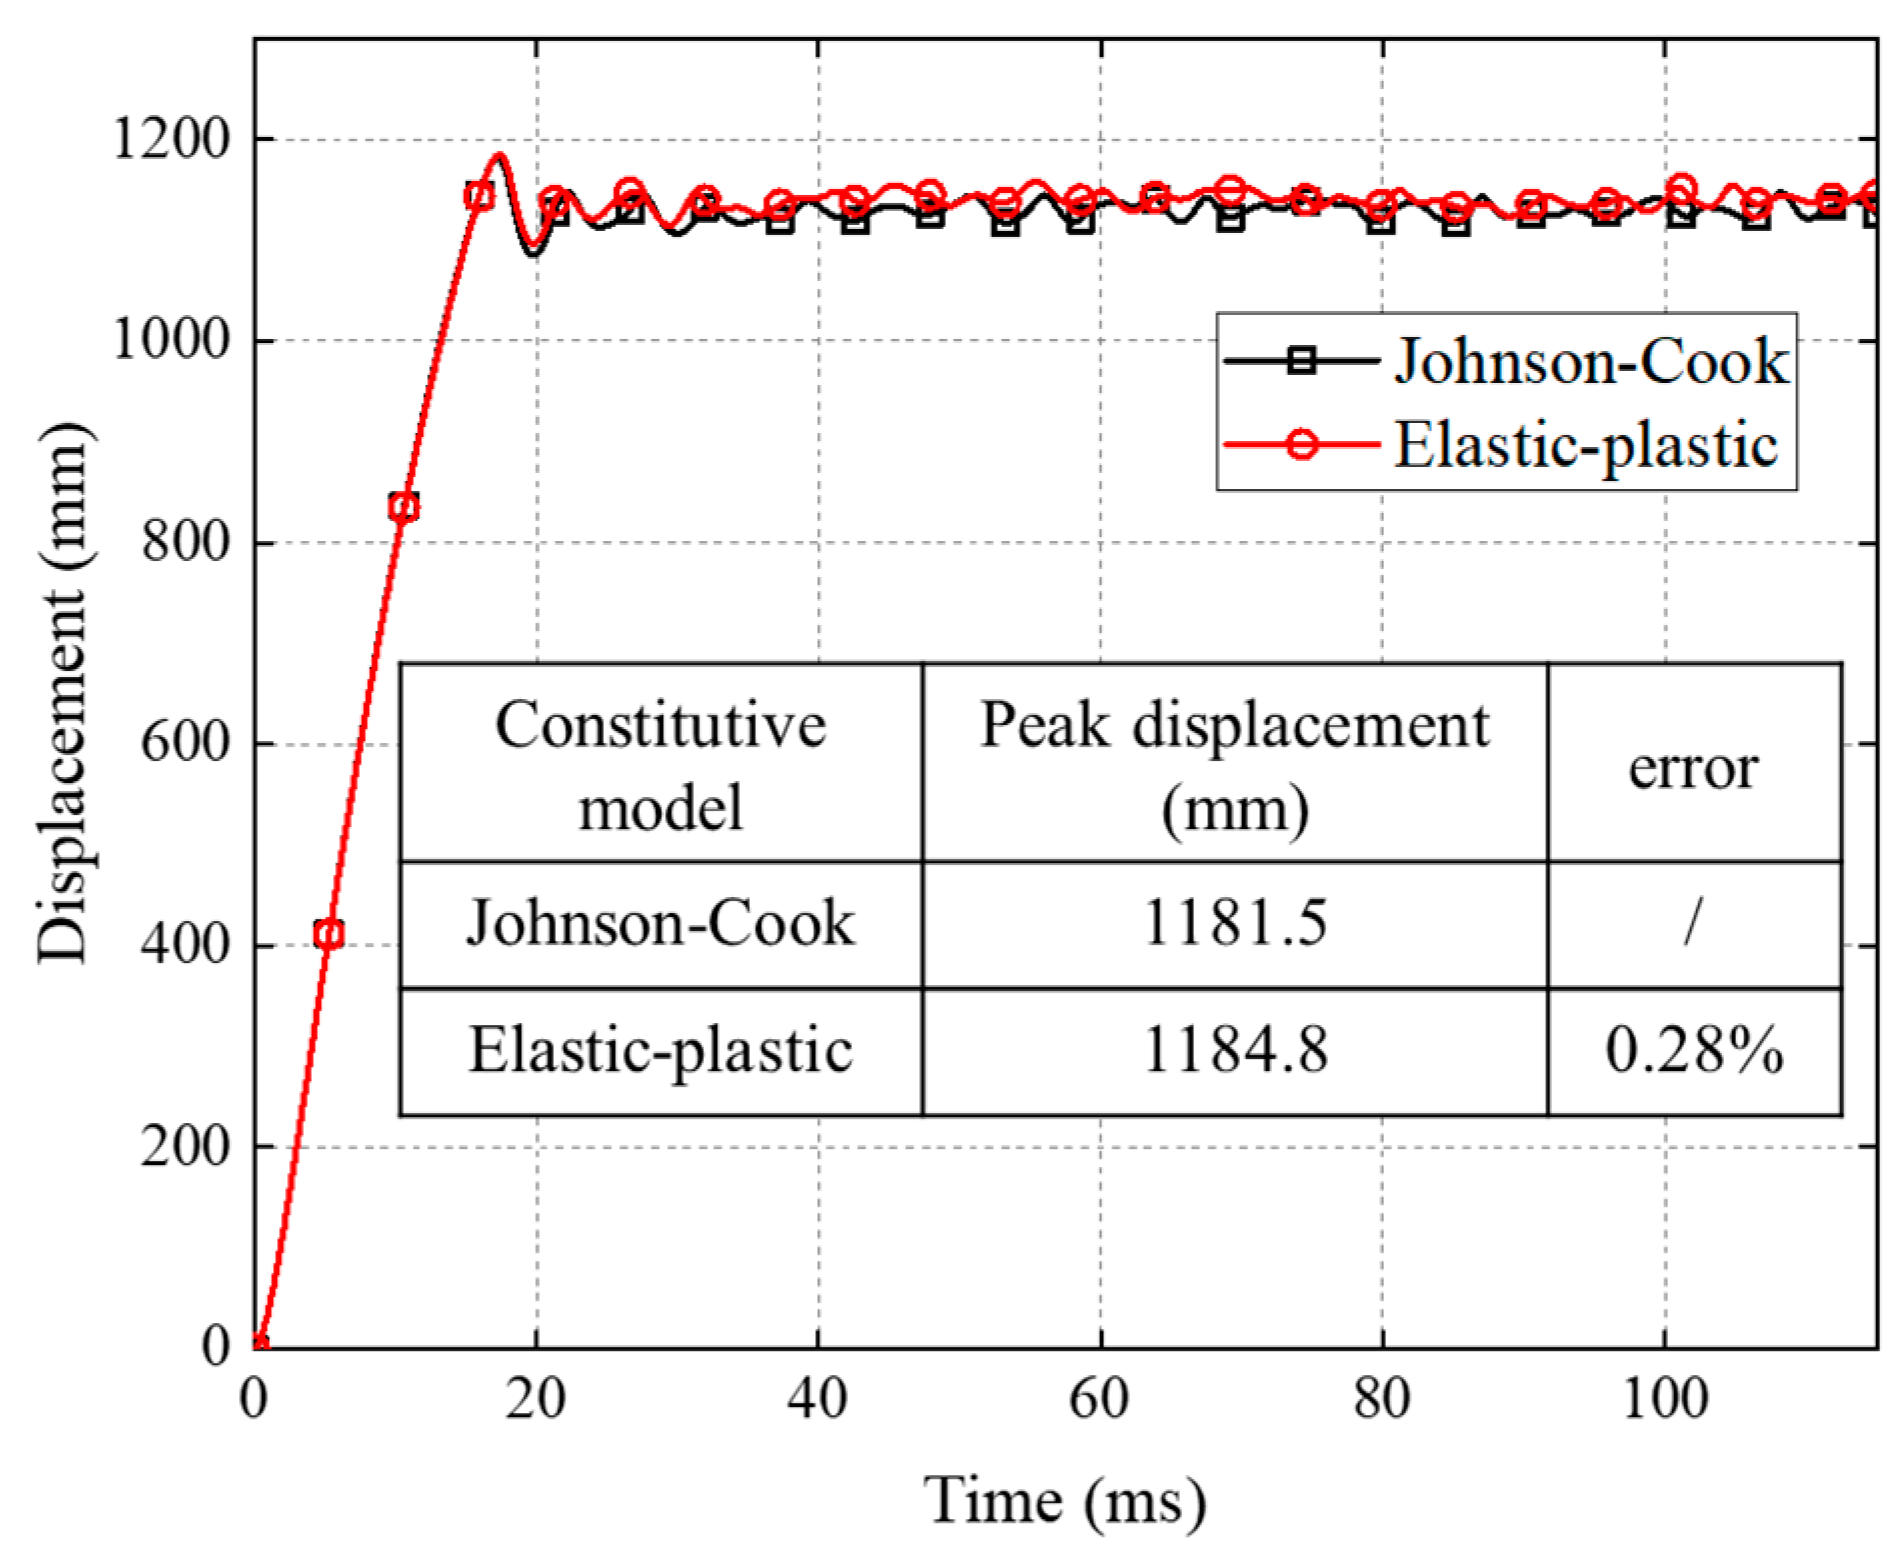
Additionally, the dynamic yield stress at the gauges shows a consistent increasing trend from the perimeter toward the center of the structure. When a structure undergoes large plastic deformation, its deformation energy is primarily dominated by membrane stretching. Under elastic–plastic conditions, the yield stresses involved in this membrane force stretching are assumed to be equal. Based on the analysis of the dynamic yield stress characteristics, the average yield stress value can be determined by integrating the effective plastic strain–yield stress curve from Figure 4, using the criterion of equal area enclosed by the curve (which ensures equal plastic strain energy). By applying this average yield stress value to the yield stress term in an ideal elastic–plastic model, a consistent structural response can be achieved. When analyzing Figure 4, the effective plastic strain-yield stress curve at gauge 4 is selected, and the average yield stress value based on the equal area criterion is found to be 712.4 MPa. This value was then substituted into the ideal elastic–plastic model for simulation. The resulting structural response was compared to the original response, as shown in Figure 6, with a very small error of 0.28%, demonstrating the accuracy of the method. Gauge 4 is located in the middle region between the distance L/4 and 3L/8 from the edge of the structure. The relative area for calculating the average yield stress value for Condition V is marked in Figure 5, with gauge 4 as the target point. Considering the distribution characteristics of yield stress, this method of calculating average yield stress can be applied to subsequent conditions.
Based on the above analysis, the calculation of the dynamic yield stress distortion factor can be further simplified to the calculation of the average yield stress. It is important to note that the response characteristics of stiffened plates differ somewhat from those of thin plates due to the influence of the stiffeners. However, under conditions of large plastic deformation, the stiffened plate also exhibits response characteristics dominated by membrane stretching, with the yield stress generally following the trend of increasing from the edge toward the center of the structure. Given this behavior, the stiffened plate structure can similarly adopt the location near L/4 as the optimal point for calculating the average yield stress value.
Given that the purpose of this subsection is to present the concept of average yield stress and verify its accuracy, an approximation method is employed to conduct the simulations. The specific steps are as follows: Firstly, define the effective plastic strain range for the strain hardening term in the Johnson–Cook constitutive equation for 921A steels and Q235 steels, and calculate the average yield stress within this strain range and use it as the initial value for the yield stress distortion factor between the prototype and the scaled model. Secondly, substitute the initial yield stress value into the corrected equation to determine the first correction factor for the impulse. Then, perform the first round of simulation, and extract the average yield stress value from the corrected scaling model. Finally, use the updated yield stress value as the updated distortion factor, and substitute this value into the correction equation to determine the second correction factor for the impulse. By applying this iterative approximation method, it ensures that the substituted value of the yield stress distortion factor closely aligns with the actual value, providing a more accurate prediction of the structural response.
Four groups of distortion-scaled conditions are set up, each with four scaling factors: 1/4, 1/5, 1/6, and 1/10. The corresponding distortion factors for each condition are shown in Table 11. The initial yield stress distortion factor is determined using the method outlined above, with the effective plastic strain value assumed to be 0.18, considering the large plastic deformation. For the strain-hardening term of the Johnson–Cook constitutive equation, a distortion factor of 0.541 is selected based on the average yield stresses of 734.9 MPa for 921A steel and 397.6 MPa for Q235 steel, within the effective plastic strain range of 0 to 0.18. According to the similarity law in Section 2 and Hopkinson’s scaling law, the impulse satisfies scaling factor β when the stand-off distance is scaled according to scaling factor β and the charge mass is scaled according to scaling factor β3. Therefore, under the condition that the scaling factor is β, the average impulse–charge mass relationship, as expressed in Equations (10) and (11), can be further refined as follows:
Stand-off distance as once the length of plate:
W = 3.35 × 10 4 I 2 β β 1 / 20 + 0.733 I β β 1 / 20 2 49.97 β β 1 / 20 3
Stand-off distance as half the length of plate:
W = 7.48 × 10 5 I 2 β β 1 / 20 + 0.417 I β β 1 / 20 2 41.54 β β 1 / 20 3
where W is in g and I is in Pa·s, β1/20 = 0.05. The corresponding mass of explosive can be obtained using these two equations. The dynamic average yield stresses of the four prototype conditions are V-712.4 MPa, VI-725.2 MPa, VII-717.4 MPa, and VIII-720.7 MPa, respectively.

3.2.3. Comparison of Structural Response

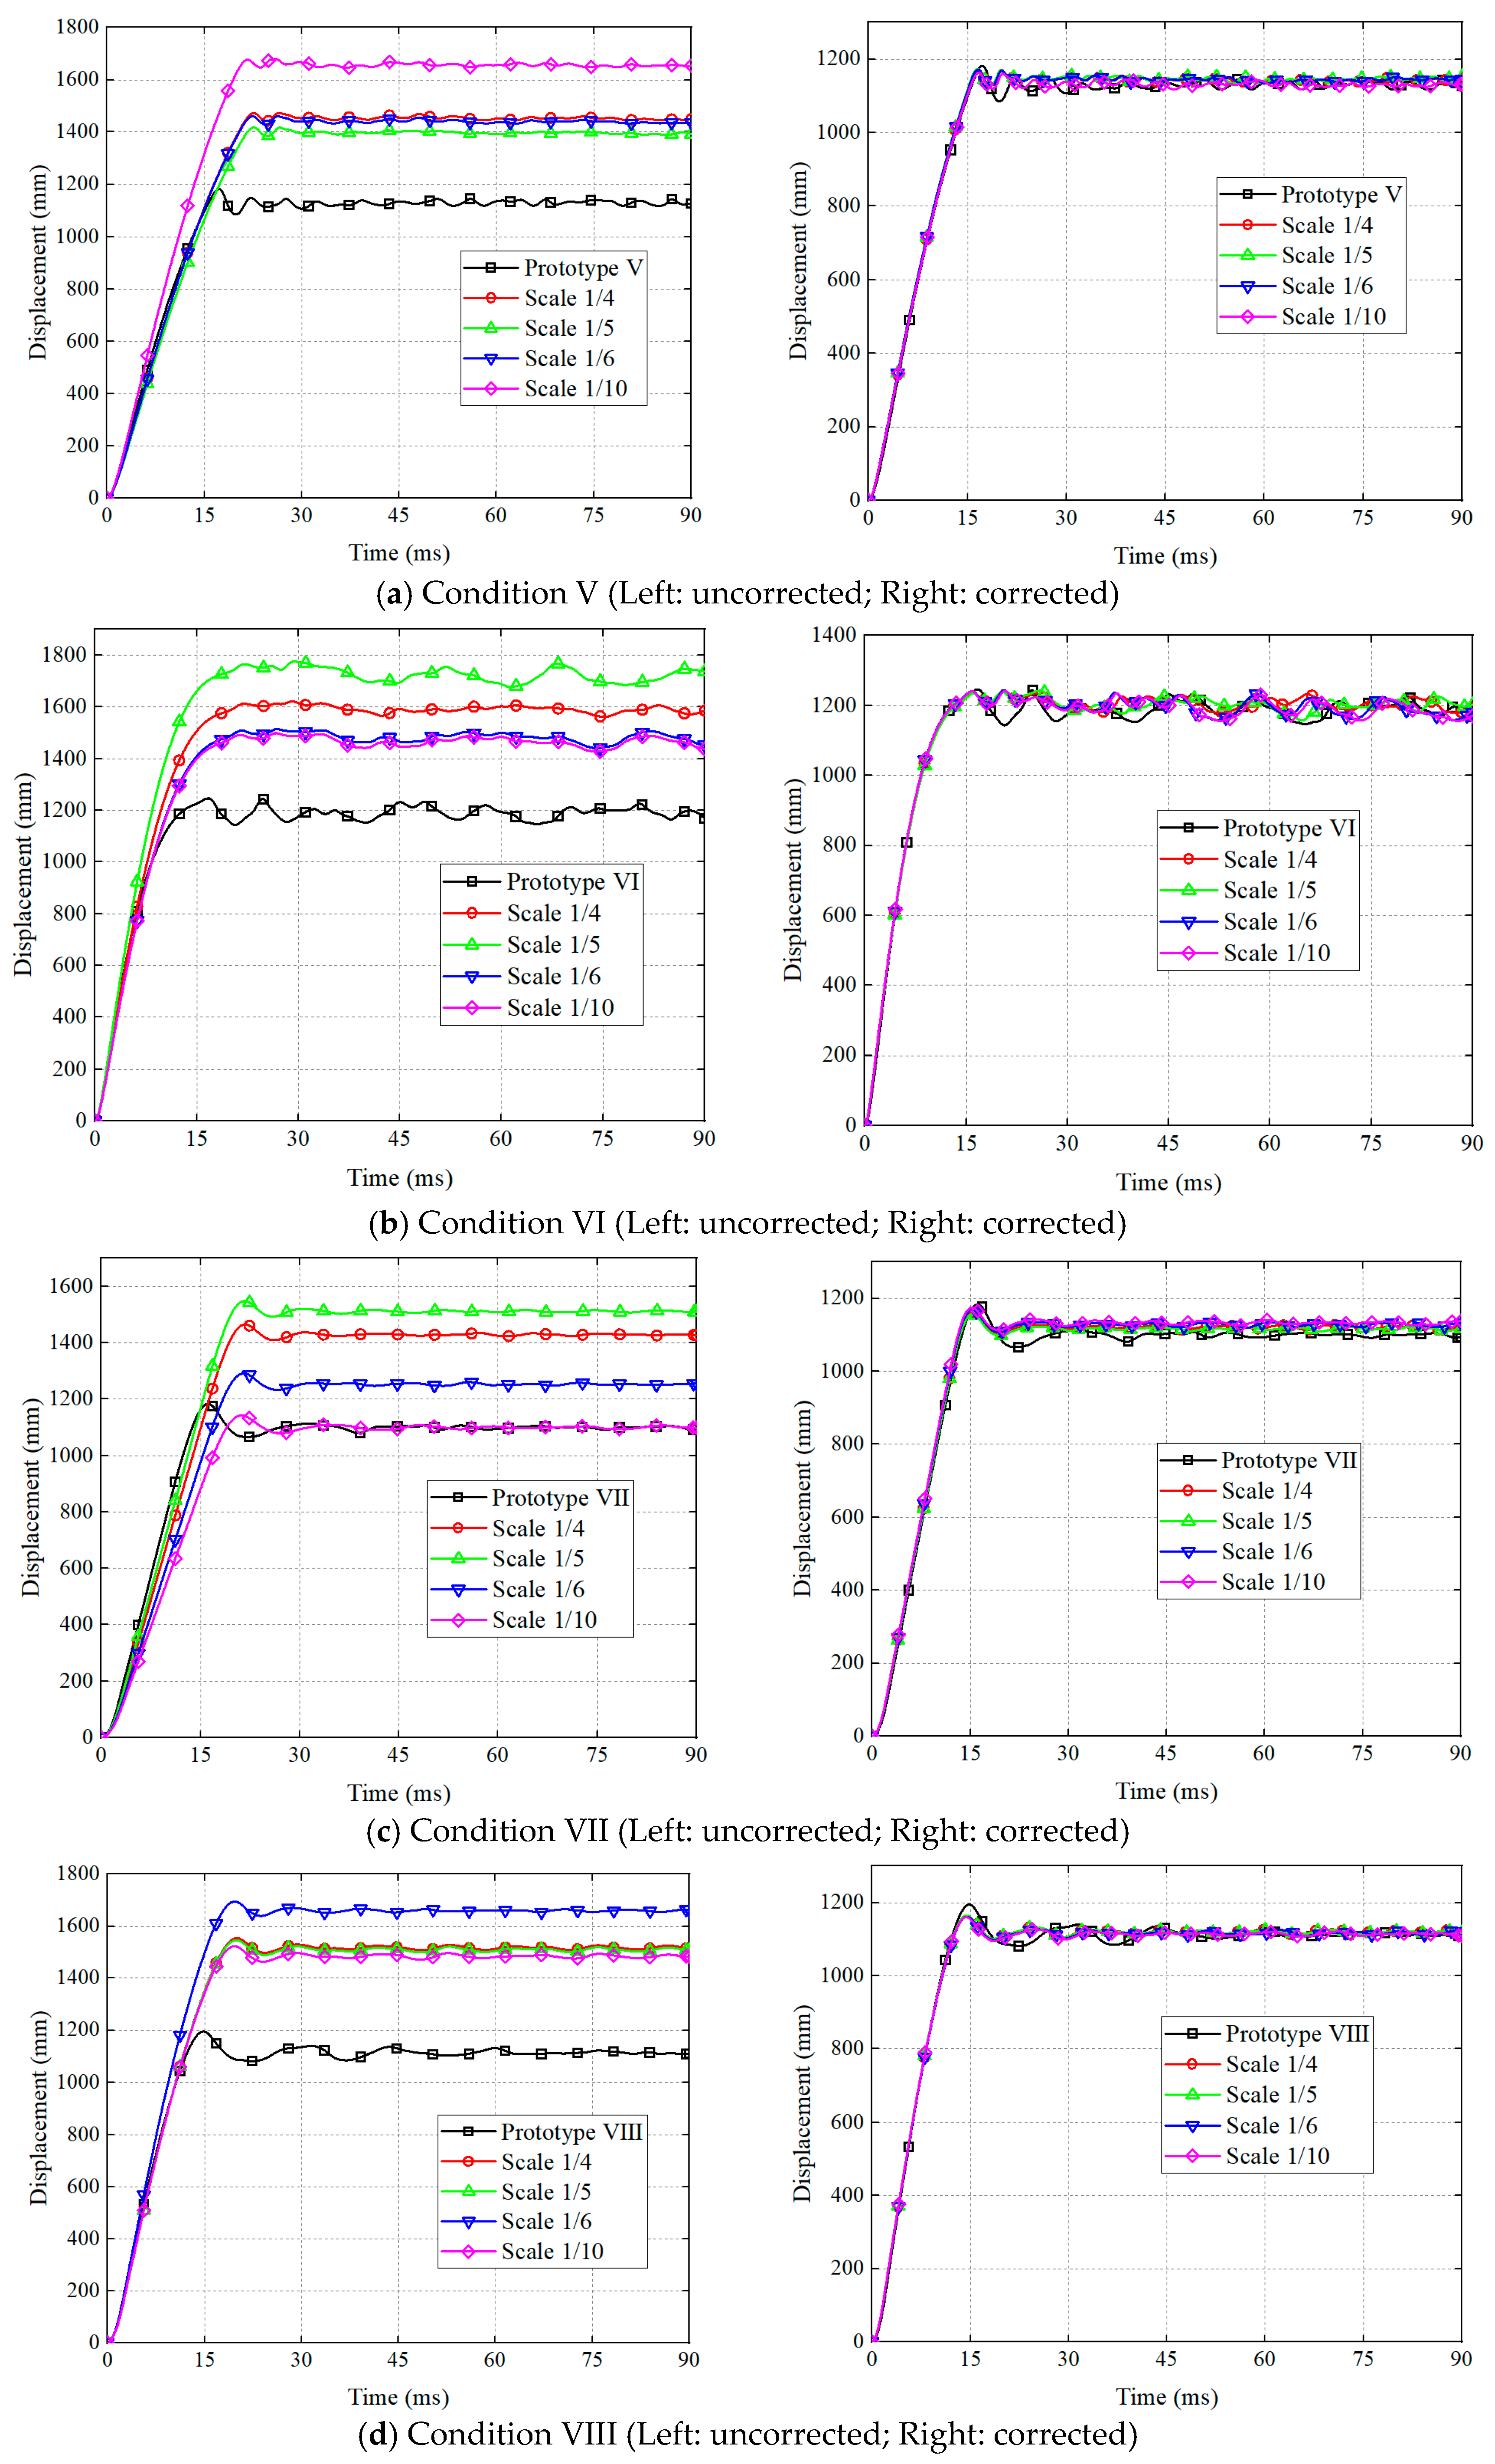
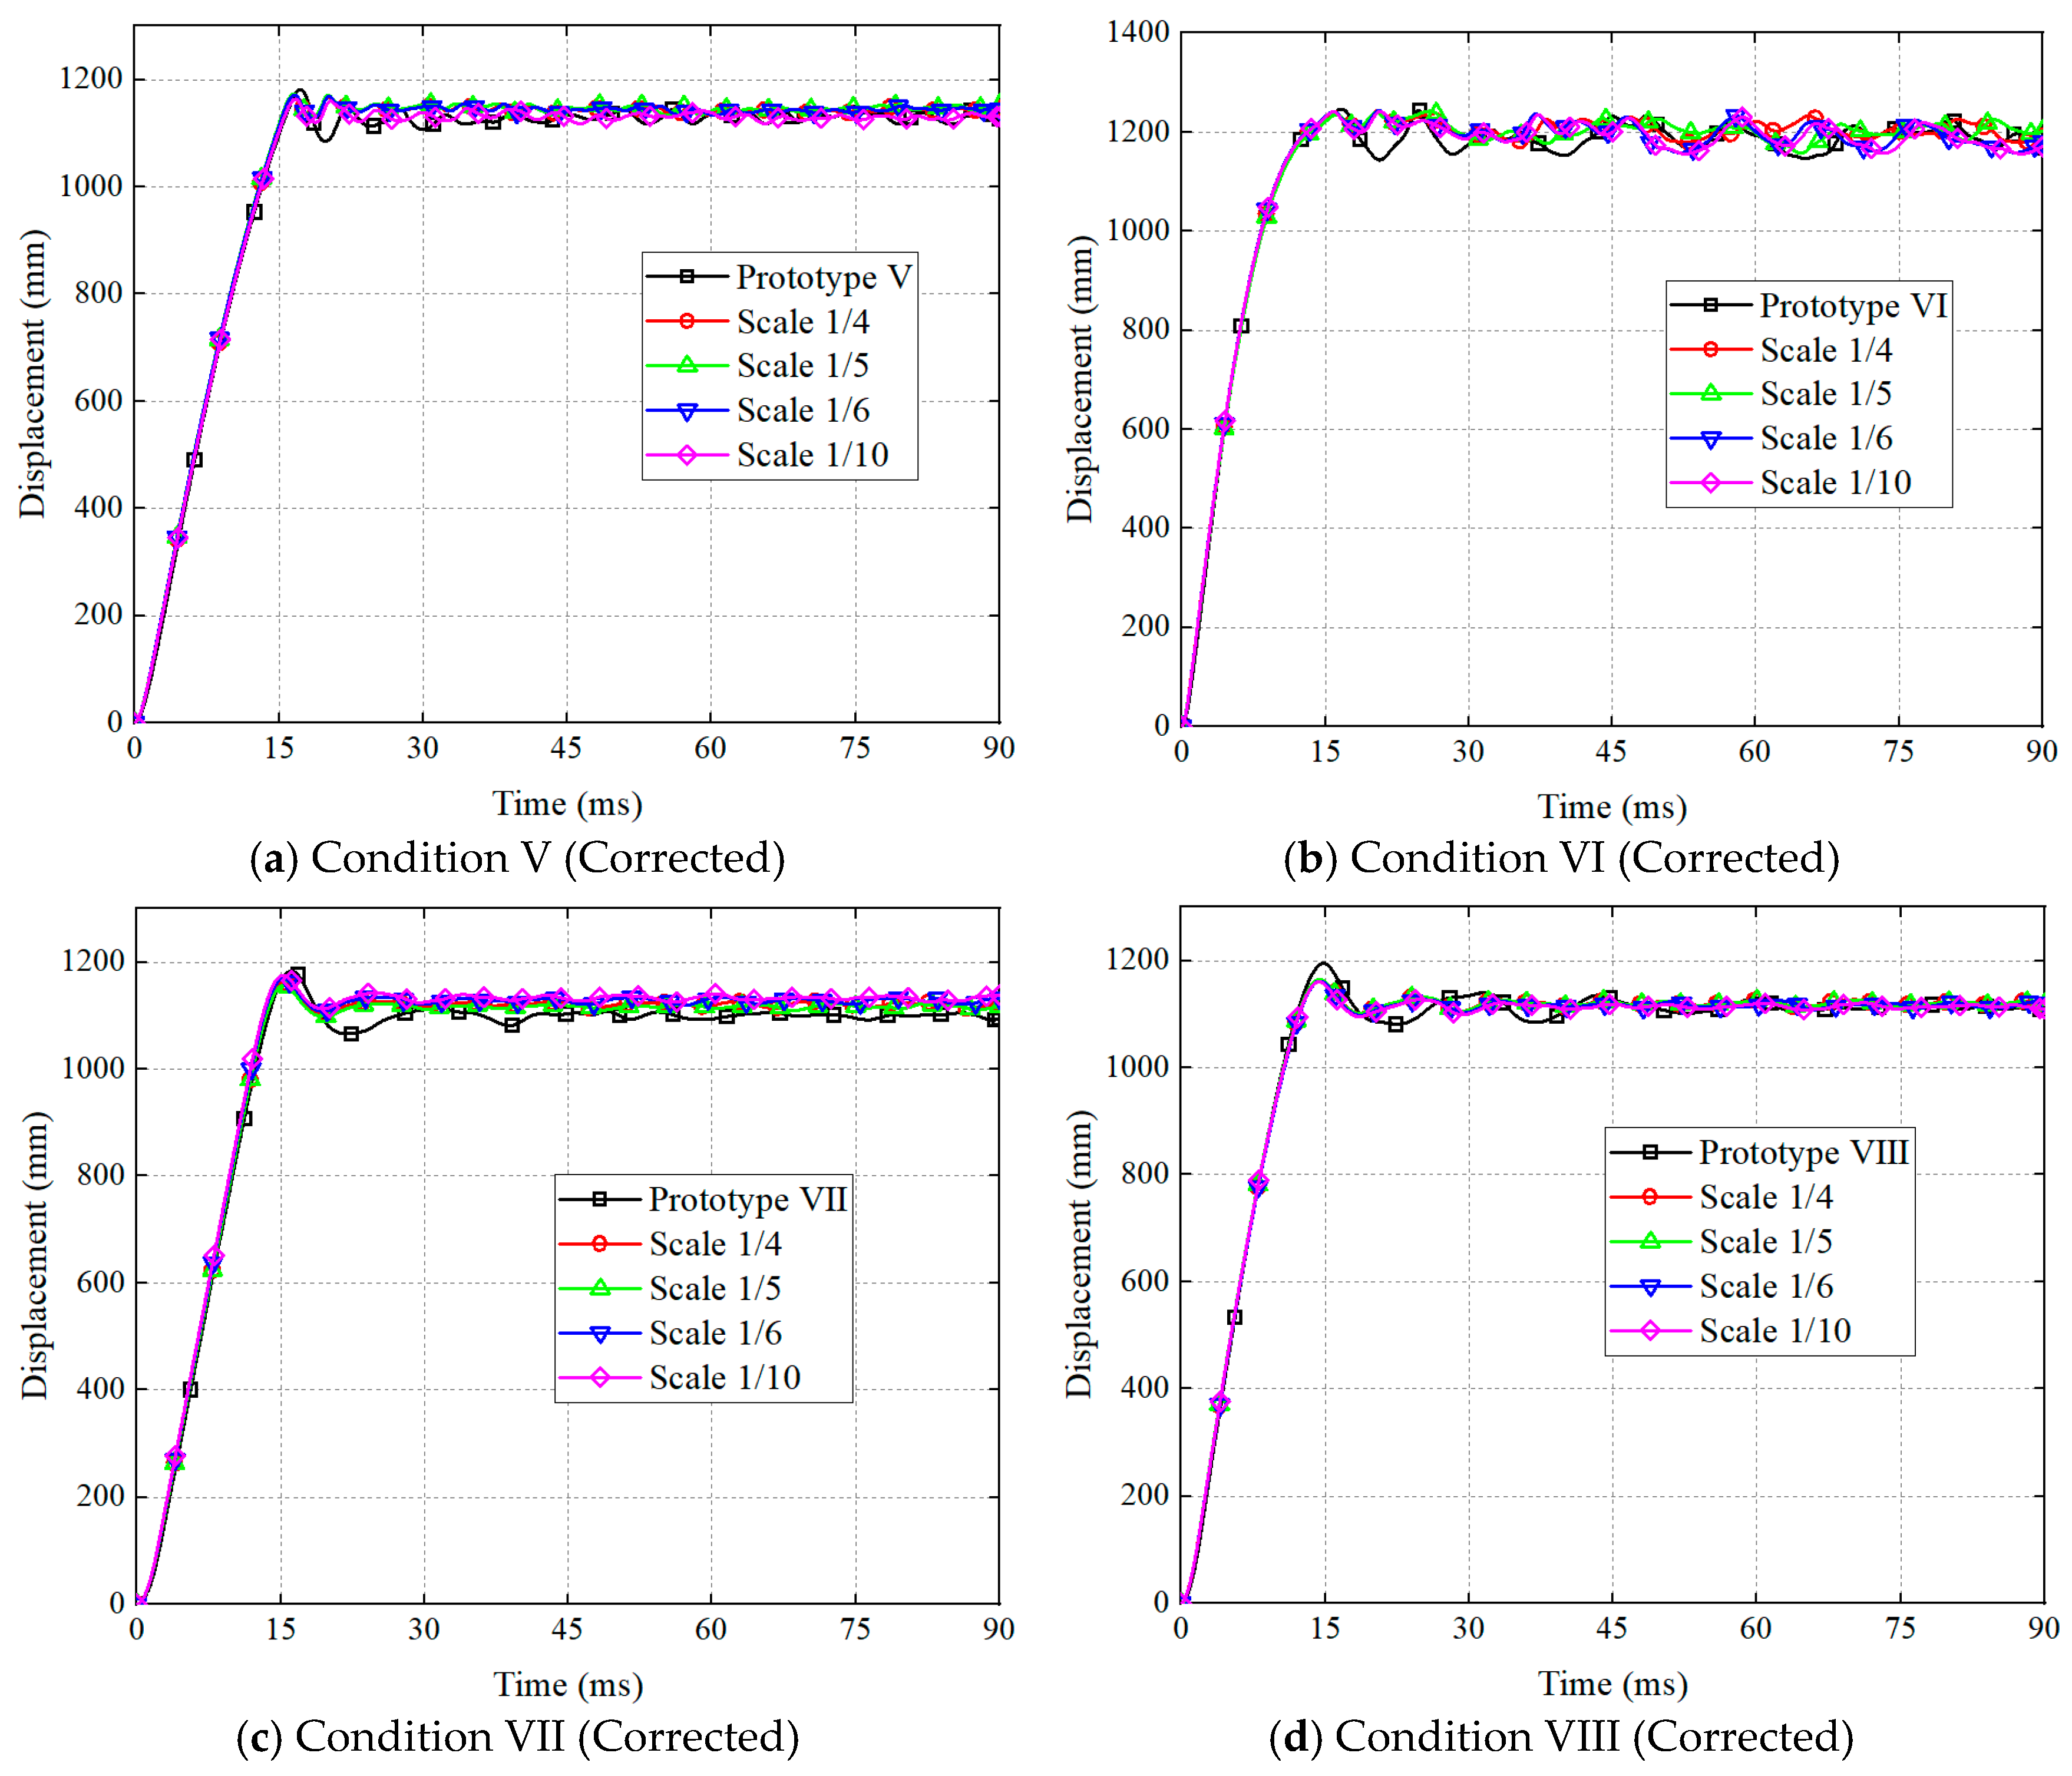
The deflection–time curve at the midpoint of the structure was selected for analysis, and the comparison between the results of the scaled model and the prototype is shown in Figure 7. From Figure 7, it is evident that the prediction results of the uncorrected model differ significantly from those of the prototype, while the corrected model can accurately predict the prototype’s response. The use of the average yield stress method significantly improves the accuracy of the prototype structural response prediction. The corrected model maintains high prediction accuracy throughout the response, including during the phases of maximum deflection, final deflection, and deflection increase. However, a slight deviation is observed between the corrected model and the prototype during the post-stabilization elastic response phase. This difference arises due to the substantial difference in yield stress between 921A steel and Q235 steel, leading to a large variance in elastic strain between the two materials. Consequently, the elastic displacements and rebound behavior differ, causing some inconsistency in the post-stabilization phase. Despite this, the deviation remains relatively small and is within acceptable limits for engineering applications.

4. Similar Distortion Prediction of Blast Response

4.1. Similar Prediction Method

In the previous section, the calculation of yield stress distortion factors was simplified, and using the average yield stress value for impulse correction effectively improved prediction accuracy. In this section, a similar distortion prediction method to predict the response of structures under explosive loading is proposed.

4.1.1. Scaling Factor for Effective Plastic Strain

The yield stress distortion factor is typically calculated using a constitutive equation. In this section, the Johnson–Cook constitutive equation is employed. However, due to material substitution and thickness distortion, the effective plastic strain between the scaled model and the prototype is distorted, making it difficult to directly calculate the distortion factor of yield stress by using Johnson–Cook constitutive equation. Therefore, the distortion of the effective plastic strain is analyzed in the following.
The distortion of the effective plastic strain reflects the difference in strain-hardening properties between a prototype and a scaled model. When the structure subjected to explosive load reaches maximum deformation, the work done by the explosive load is fully converted into the structure’s deformation energy, with both achieving their maximum values at that moment. Under plastic deformation conditions, the structure’s deformation energy is predominantly composed of plastic strain energy, with membrane stretching playing the dominant role in resisting the deformation. Based on the analysis of the average yield stress, it is possible to achieve consistent structural deformation by substituting the Johnson–Cook constitutive model with the elastic–plastic model that uses the average yield stress. This substitution ensures that the plastic strain energy used by the structure to resist deformation is consistent with the energy derived from the original Johnson–Cook constitutive model. Building on this, the deformation energy of the structure at the point of maximum deformation can be approximated as follows:
E m = σ ¯ d ε ¯ e p h S
where σ ¯ d is the average yield stress, ε ¯ e p is the average effective plastic strain, and S is the midplane area of the structure at maximum deformation. At maximum deformation, the input for explosive load is equal to the deformation energy of the structure, where the similarity ratio of the input for explosive load was demonstrated in the previous section, specifically in Equation (12). Equation (16) is expressed in the form of similarity constants, while making it equal to the input for explosive load, can be obtained as follows
β σ ¯ d β ε ¯ e p β h β S = β I β 2 / β ρ β h
The average yield stress scaling factor in the above equation can be expressed as β σ ¯ d = β I 2 / β ρ β h 2 . Although the structural response is influenced by distortions in thickness, material, and charge mass, the response mode and deformation shape remain essentially the same when the stand-off distance, constraints, and structure type are consistent. Additionally, the maximum deflection of the prototype and the corrected model adheres to geometric scaling, meaning the maximum deformed area of the corrected model and the prototype also satisfies area scaling, i.e., β S = β 2 , substituting into Equation (17)
β ε ¯ e p = 1
The above equation demonstrates that the average effective plastic strains of the modified model and the prototype are equal. Satisfying this condition offers valuable guidance for the accurate calculation of the yield stress distortion factor. The detailed equation of the distortion correction is established in the next subsection.

4.1.2. Establishment of Prediction Method

The reasonable calculation of the yield stress distortion factor is crucial for accurately correcting a structural response. Based on the earlier discussion, it is established that for both the prototype and the corrected model, the yield stress should satisfy the similarity relationship of impulse–average yield stress–thickness. This relationship can be expressed as follows:
β I c p β h c p = β σ ¯ d c p = σ ¯ d c σ ¯ d p
The response of a structure under explosive loading is primarily influenced by strain hardening and strain rate strengthening, with the effects of thermal softening being relatively minor. Therefore, in this paper, we focus mainly on the strain and strain rate terms in the Johnson–Cook constitutive model. Given this focus, the above equation can be further expressed as follows:
β I c p β h c p = β σ ¯ d c p = A c + B c ( ε e p c ) n c 1 + C c ln ε ˙ c A p + B p ( ε e p p ) n p 1 + C p ln ε ˙ p
The calculation of the impulse correction factor necessitates obtaining effective plastic strain and strain rate values that represent the average yield stresses of both the prototype and the corrected model. However, the strain and strain rate for the prototype and the corrected model cannot be obtained directly. The corresponding conversion relationship should be established with the uncorrected model.
In the input parameters of both the uncorrected and corrected models, the structural dimensions and materials remain the same, with the only difference being the mass of TNT. In Section 3.2.2, the strain hardening term of the Johnson–Cook constitutive model was selected, and the average yield stress within the corresponding effective plastic strain ranges was determined. The initial distortion factor of the yield stress was then used to carry out the impulse correction. In this section, the model using this method can be used as the uncorrected model for each condition.
Equation (18) indicates that the average effective plastic strain of the prototype and the corrected model are equal. Combined with Figure 4, it is evident that the dynamic yield stress generally follows a consistent trend with changes in effective plastic strain, and under the condition that the average effective plastic strain is equal, the values of effective plastic strain corresponding to the average yield stress computed by the Johnson–Cook constitutive equation should also be equal, i.e., ε e p c = ε e p p . In the uncorrected model, the effective plastic strain and strain rate corresponding to the average yield stress are ε e p m and ε ˙ m . There are some response distortions between the uncorrected model and the corrected model due to the difference in impulse; however, the overall configurations of the two models are not much different. Moreover, the response distortion due to different impulses is mainly caused by strain rate distortion; thus, it can be approximated as ε e p m = ε e p c = ε e p p . Based on Equation (9), the scaling factor of the strain rate can be expressed as β ε ˙ = β I / β ρ β h β , and the transformation equation between the strain rate of the uncorrected model, the corrected model and the prototype can be expressed as follows:
ε ˙ c = ε ˙ m β ε ˙ c m = ε ˙ m β I c p / β I m p ε ˙ p = ε ˙ m / β ε ˙ m p = ε ˙ m β h m p β m p / β I m p
Substituting the corresponding equations into Equation (20), the corrected equation can be expressed as follows:
β I c p β h m p = A m + B m ( ε e p m ) n m 1 + C m ln ε ˙ m β I c p / β I m p A p + B p ( ε e p m ) n p 1 + C p ln ε ˙ m β h m p β / β I m p
The impulse correction factor used to correct the model can be obtained by iteratively calculating the above equation. The prototype structural response can be accurately predicted using the corrected impulse.

4.2. Simulation Verification for Prediction Method

The computational parameters required for the prediction method are listed in Table 12. The steps to obtain these parameters are as follows: first, read the effective plastic strain and strain rate corresponding to the average yield stress of the uncorrected model, then use Equation (22) to iteratively calculate the impulse correction factor. This factor is then used with Equations (14) and (15) to determine the corresponding explosive charge. This calculated explosive mass is substituted back into the distortion model for simulation, and the displacement response prediction of the corrected model is obtained, as shown in Figure 8. It is demonstrated that this method yields good predictive accuracy, with the corrected structural response maintaining precise precision for peak values, final values, and the process of increasing deflection, closely matching that of the prototype. Comparing Table 11 with Table 12 reveals that the corrected values of the TNT mass calculated using the two methods are essentially equal, and the resulting structural responses also show minimal differences. The peak displacement at the midpoint of the structure, corrected using the similarity prediction method, is compared with that of the prototype, as presented in Table 13. The table shows that the overall error between the peak displacement at the midpoint of the structure corrected based on the similarity prediction method and the prototype is small, with a maximum deviation of no more than 3%. This indicates the reliability and accuracy of the similarity prediction method. To validate the rationality of the method presented in this paper, a comparison with other methods is conducted in Appendix A.

5. Discussion and Conclusions

This work studied the imperfect similarity of the dynamic response of thin plates and stiffened plates under blast loading. The similarity distortion correction equation for large plastic deformations of structures subjected to explosive loads was derived. Material and geometrical distortions were both considered in order to analyze their effects on the impact response of the structure under blast loading. The focus of this study can be summarized as follows:
(1)
The structural dynamic response difference between the model and the prototype under explosive loading due to the distortion of yield stress and thickness can be effectively compensated by using the combined corrected equation of impulse, yield stress and thickness. Numerical simulations of the explosion response for thin plates and stiffened plates with an ideal elastic–plastic model were carried out. The results showed that the maximum error in the peak displacement of the corrected models does not exceed 3%, demonstrating the accuracy and applicability of the correction method. Additionally, the predicted work input of the explosive load by β I β 2 / β ρ β h was consistent with the prototype, with a maximum error within 2%.
(2)
The analysis of the response characteristics of dynamic yield stress with Johnson–Cook constitutive model was carried out, and the average yield stress based on equal plastic strain energy was proposed. A consistent structural response can be obtained by applying the average yield stress to the ideal elastic–plastic model. An accurate prediction can be obtained by correcting the distortion factor based on the average yield stress.
(3)
The distortion of the effective plastic strain was analyzed, and the average effective plastic strain between the corrected model and the prototype was equal. Based on the distortion conversion relationship of effective plastic strain and strain rate, a prediction method based on the model structural response parameter is established. Simulation results indicate that the maximum error in the peak displacement of the corrected model is within 3%, demonstrating that the prediction accuracy can be effectively improved by using this method.
This study presents a similarity distortion correction method for structural dynamic response under explosive loading, which is applicable to the response of structures undergoing large plastic deformations. Future research will investigate the expansion of this distortion correction method’s applicability and explore the sensitivity of the parameters. Subsequently, the method will be extended to systematically address both the elastic–plastic response distortions of structures and the complex geometric distortions in stiffened plates.

Author Contributions

Methodology and Writing, Y.L.; Methodology, X.K.; Validation, H.Z.; Software C.Z.; Supervision and Project Administration, W.W. All authors have read and agreed to the published version of the manuscript.

Funding

The authors acknowledge Projects supported by the Joint Foundation of Ministry of Education (8091B022105), and National Natural Science Foundation of China (52171318, 12202329).

Institutional Review Board Statement

Not applicable.

Informed Consent Statement

Not applicable.

Data Availability Statement

The original contributions presented in the study are included in the article, further inquiries can be directed to the corresponding author.

Conflicts of Interest

The authors declare no conflicts of interest.

Nomenclature

WMass of the explosivetTime
RStand-off distanceεStrain
Δ p Φ Peak overpressure of the shockwave ε ˙ Strain rate
IimpulseEiWork done by impulse load
LLength of the plateEmMaximum deformation energy
BWidth of the plateSStructural planar area
hThickness of the plateεepEffective plastic strain
n0Number of stiffenersAStatic yield stress
ρMaterial densityBStrain hardening constant
σdDynamic yield stressnStrain hardening index
M0Plastic limit bending momentCStrain rate factor
N0Plastic limit neutral plane forcemThermal softening index
δMidpoint deflection σ ¯ d Average yield stress
vVelocity ε ¯ e p Average effective plastic strain

Appendix A

The prediction method proposed in this paper is compared with the methods used in previous studies. Three methods are listed here, mainly focusing on the scaling relationships between deflection and impulse from two perspectives. Method A: The impulse correction factor is consistent with this paper, but the deflection scaling factor satisfies β δ = β h . Method B: The impulse correction factor satisfies β I = β h β ρ β σ d , where β σ d = β σ 0 1 + C m ln ε ˙ m 1 + C p ln ε ˙ m β ρ β h β / β I , and β σ 0 is the static yield stress scaling factor. The deflection scaling factor is consistent with this paper. Method C: The impulse correction factor satisfies f β I = 0 ε a 0 ε ˙ a 1 + C m ln ε ˙ p β I β ρ β h β σ 0 p β σ 0 β ρ β h 2 β I 2 σ 0 p 1 + C p ln ε ˙ p d ε ˙ p d ε e q p , where β σ 0 = A m + B m ε e q p n m / A p + B p ε e q p n p . The minimum value of f β I is the desired impulse factor. Since the primary loading factor in this paper is impulse, while previous research methods primarily consider velocity, the appropriate modifications have been made, and the correction method remains consistent.
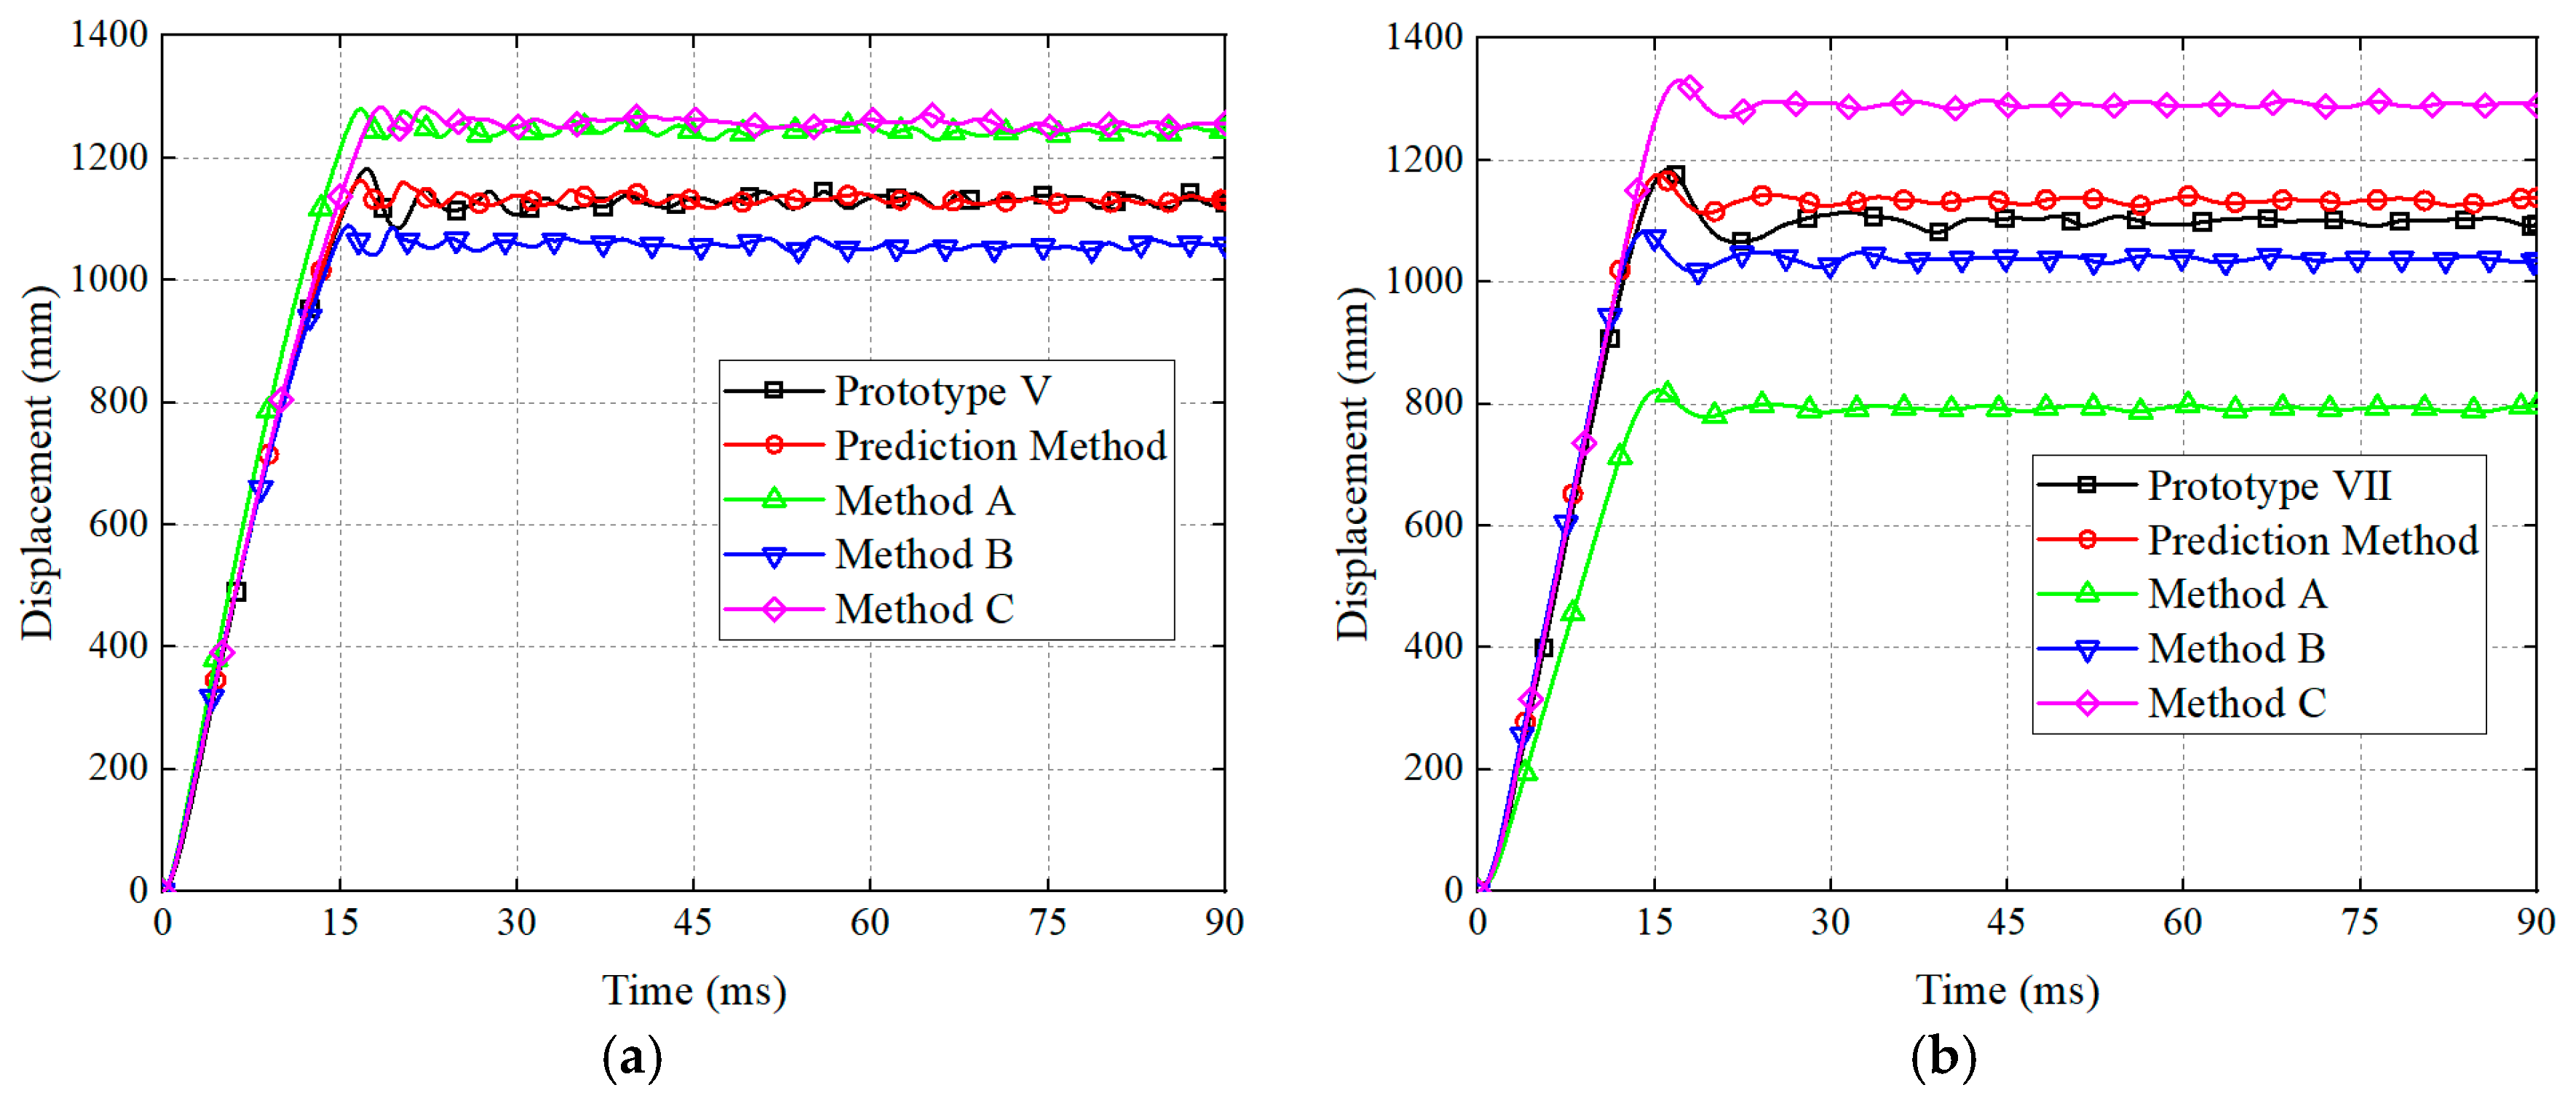
Simulations comparing methods were conducted for Case V and Case VII, involving corrections to the uncorrected models with a scaling factor of 1/10. The strain rates for the models corrected using Method B can be referenced from Table 12. They are 38.69 s−1 and 45.68 s−1, respectively. For Method C, the strain and strain rate ranges were set to [0, 0.15] and [0, 50] s−1. Figure A1 demonstrates that the prediction method proposed in this article achieves higher predictive accuracy. All three methods provide relatively good correction accuracy for the response of thin plates. However, in the correction of stiffened plate responses, Method B performs slightly better, while Methods A and C show some distortion. These analyses highlight the distinct advantages of the prediction method proposed in this paper, which is not only suitable for thin plates but also applicable to stiffened plates.
Figure A1. Comparison of response results of the correction methods. (a) Condition V-thin plate. (b) Condition VII-stiffened plate.
Jmse 12 01767 g0a1

References

  1. Zheng, C.; Kong, X.-S.; Wu, W.-G.; Liu, F. The elastic-plastic dynamic response of stiffened plates under confined blast load. Int. J. Impact Eng. 2016, 95, 141–153. [Google Scholar] [CrossRef]
  2. Zheng, C.; Kong, X.-S.; Wu, W.-G.; Xu, S.-X.; Guan, Z.-W. Experimental and numerical studies on the dynamic response of steel plates subjected to confined blast loading. Int. J. Impact Eng. 2018, 113, 144–160. [Google Scholar] [CrossRef]
  3. Peng, Y.; Yang, P.; Hu, K. Nonlinear dynamic response of blast-loaded stiffened plates considering the strain rate sensitivity. Mar. Struct. 2020, 70, 102699. [Google Scholar] [CrossRef]
  4. Suresh, C.; Ramajeyathilagam, K. Large deformation behaviour of thin mild steel rectangular plates subjected to underwater explosion loading under air and water backed conditions. Appl. Ocean. Res. 2021, 114, 102780. [Google Scholar] [CrossRef]
  5. Zhang, Z.H.; Chen, P.Y.; Qi, W. Scaling law of dynamic response of stiffened plates for a ship subjected to under water shock. J. Vi Bration Shock. 2008, 27, 81–86. [Google Scholar]
  6. Li, H.T.; Zhu, X.; Zhang, Z.H. Similarity law for dynamic response of hull girder subjected to underwater explosion in near field. J. Vib. Shock. 2010, 29, 28–32. [Google Scholar]
  7. Qin, Y.; Yao, X.; Wang, Z.; Wang, Y. Experimental investigation on damage features of stiffened cabin structures subjected to internal blast loading. Ocean Eng. 2022, 265, 112639. [Google Scholar] [CrossRef]
  8. Kong, X.; Zhou, H.; Xu, J.; Zheng, C.; Lu, A.; Wu, W. Scaling of confined explosion and structural response. Thin Walled Struct. 2023, 186, 110656. [Google Scholar] [CrossRef]
  9. Fu, S.; Gao, X.; Chen, X. The similarity law and its verification of cylindrical lattice shell model under internal explosion. Int. J. Impact Eng. 2018, 122, 38–49. [Google Scholar] [CrossRef]
  10. Oshiro, R.E.; Alves, M. Scaling impacted structures. Arch. Appl. Mech. 2004, 74, 130–145. [Google Scholar] [CrossRef]
  11. Alves, M.; Oshiro, R.E. Scaling the impact of a mass on a structure. Int. J. Impact Eng. 2006, 32, 1158–1173. [Google Scholar] [CrossRef]
  12. Yao, S.; Zhang, D.; Lu, F.; Chen, X.; Zhao, P. A combined experimental and numerical investigation on the scaling laws for steel box structures subjected to internal blast loading. Int. J. Impact Eng. 2017, 102, 36–46. [Google Scholar] [CrossRef]
  13. Ren, X.B.; Huang, Z.X.; Jiang, Y.B.; Chen, Z.H.; Cao, X.F.; Zhao, T.; Li, Y. The scaling laws of cabin structures subjected to internal blast loading: Experimental and numerical studies. Def. Technol. 2022, 18, 811–822. [Google Scholar] [CrossRef]
  14. Alves, M.; Oshiro, R.E. Scaling impacted structures when the prototype and the model are made of different materials. Int. J. Solids Struct. 2006, 43, 2744–2760. [Google Scholar] [CrossRef]
  15. Mazzariol, L.M.; Alves, M. Experimental study on scaling of circular tubes subjected to dynamic axial crushing using models of different materials. In Proceedings of the 22nd International Congress of Mechanical Engineering, Ribeirão Preto, Brazil, 3–7 November 2013. [Google Scholar]
  16. Mazzariol, L.M.; Oshiro, R.E.; Alves, M. A method to represent impacted structures using scaled models made of different materials. Int. J. Impact Eng. 2016, 90, 81–94. [Google Scholar] [CrossRef]
  17. Wang, S.; Xu, F.; Dai, Z.; Liu, X.; Li, X.; Yang, L.; Xi, X. A direct scaling method for the distortion problems of structural impact. Chin. J. Theor. Appl. Mech. 2020, 52, 774–786. [Google Scholar]
  18. Wang, S.; Xu, F.; Zhang, X.; Yang, L.; Liu, X. Material similarity of scaled models. Int. J. Impact Eng. 2021, 156, 103951. [Google Scholar] [CrossRef]
  19. Li, X.; Xu, F.; Ya, L.; Wa, S.; Li, X.; Xi, X.; Li, J. Study on the similarity of elasticity and ideal plasticity response of thin plate under impact loading. Explos. Shock. 2021, 41, 113103. [Google Scholar]
  20. Wang, Y.; Liang, D.; Xi, X.; Wang, J.; Liu, X.; He, H. Prediction techniques for the scaled models made of different materials under impact loading. Int. J. Impact Eng. 2023, 179, 104642. [Google Scholar] [CrossRef]
  21. Wang, S.; Chang, X.; Xu, F.; Li, J.; Wang, J. Similarity laws of geometric and material distortion for anisotropic elastic plate subjected to impact loads. Int. J. Impact Eng. 2023, 180, 104683. [Google Scholar] [CrossRef]
  22. Wang, T.; Ni, L.; Wu, T.; Wang, Y.; Xi, X.; He, H. Dynamic similitude technique for predicting the behaviour of structures subjected to impact loads. Int. J. Impact Eng. 2022, 163, 104160. [Google Scholar] [CrossRef]
  23. Oshiro, R.E.; Alves, M. Predicting the behaviour of structures under impact loads using geometrically distorted scaled models. J. Mech. Phys. Solids 2012, 60, 1330–1349. [Google Scholar] [CrossRef]
  24. Mazzariol, L.M.; Alves, M. Similarity laws of structures under impact load: Geometric and material distortion. Int. J. Mech. Sci. 2019, 157, 633–647. [Google Scholar] [CrossRef]
  25. Mazzariol, L.M.; Alves, M. Experimental verification of similarity laws for impacted structures made of different materials. Int. J. Impact Eng. 2019, 133, 103364. [Google Scholar] [CrossRef]
  26. Wang, S.; Xu, F.; Zhang, X.; Dai, Z.; Liu, X.; Bai, C. A directional framework of similarity laws for geometrically distorted structures subjected to impact loads. Int. J. Impact Eng. 2022, 161, 104092. [Google Scholar] [CrossRef]
  27. Ya, L.; Ch, X.; Xu, F.; Wa, S.; Li, X.; Xi, X.; Li, X. Study on the scaling law of geometrically-distorted thin-walled cylindrical shells subjected to axial impact. Explos. Shock. 2022, 42, 150–161. [Google Scholar]
  28. Chang, X.; Xu, F.; Yang, L.; Wang, S.; Li, X.; Hui, X.; Wang, J. Study on the similarity of axial crushing of thin-walled square tubes. J. Vib. Shock. 2023, 42, 284–294. [Google Scholar]
  29. Chang, X.; Xu, F.; Feng, W.; Li, X.; Liu, X. Similarity laws of geometric distortion for stiffened plate under low velocity impact loads. Thin Walled Struct. 2024, 199, 111830. [Google Scholar] [CrossRef]
  30. Kong, X.; Li, X.; Zheng, C.; Liu, F.; Wu, W.-G. Similarity considerations for scale-down model versus prototype on impact response of plates under blast loads. Int. J. Impact Eng. 2017, 101, 32–41. [Google Scholar] [CrossRef]
  31. Gao, X.; Fu, S.; Liu, Q.; Chen, D.; Zheng, Q.; Chen, X.; Wang, W. Dynamic scaling laws of spatial grid structures under inner explosion considering material and geometric distortions. Mech. Adv. Mater. Struct. 2022, 29, 5163–5176. [Google Scholar]
  32. Fu, T.; Zhang, M.; Zheng, Q.; Zhou, D.; Sun, X.; Wang, X. Scaling the response of armor steel subjected to blast loading. Int. J. Impact Eng. 2021, 153, 103863. [Google Scholar] [CrossRef]
  33. Qin, Y.; Wang, Y.; Wang, Z.; Yao, X. Investigation on similarity laws of cabin structure under internal blast loading. Ocean Eng. 2022, 260, 111998. [Google Scholar] [CrossRef]
  34. Qin, J.; Zhang, Z.H. A scaling method for predicting dynamic responses of stiffened plates made of materials different from experimental models. Explos. Shock. Waves 2010, 30, 511–516. [Google Scholar]
  35. Zhou, H.; Wang, D. Corrected similarity laws of stiffened panels considering geometric distortion under low speed impact load. Ocean Eng. 2021, 240, 109937. [Google Scholar] [CrossRef]
  36. Zhou, H.; Okada, T.; Kawamura, Y.; Wang, D.; Hayakawa, G. Improved Similarity Law for Scaling Dynamic Responses of Stiffened Plates with Distorted Stiffener Configurations. Appl. Sci. 2024, 14, 6265. [Google Scholar] [CrossRef]
  37. Qin, Y.; Wang, Y.; Wang, Z.; Yao, X. Investigation on similarity laws of cabin structure for the material distortion correction under internal blast loading. Thin Walled Struct. 2022, 177, 109371. [Google Scholar] [CrossRef]
  38. Kang, H.; Guo, X.; Zhang, Q.; Cui, H.; Wang, S.; Yan, W. Predicting the behavior of armored plates under shallow-buried landmine explosion using incomplete scaling models. Int. J. Impact Eng. 2021, 156, 103970. [Google Scholar] [CrossRef]
  39. Kong, X.; Zhou, H.; Kuang, Z.; Zheng, C.; Li, X.; Wu, W.; Guan, Z. Corrected method for scaling the dynamic response of stiffened plate subjected to blast load. Thin Walled Struct. 2021, 159, 107214. [Google Scholar] [CrossRef]
  40. Chen, C.; Liu, R.; Han, Z.; Cheng, Y. Dynamic response prediction of prototype from scale-down model for I-core sandwich panels subjected to internal explosion. Int. J. Impact Eng. 2023, 174, 104496. [Google Scholar] [CrossRef]
  41. Nurick, G.N.; Martin, J.B. Deformation of thin plates subjected to impulsive loading—A review: Part i: Theoretical considerations. Int. J. Impact Eng. 1989, 8, 159–170. [Google Scholar] [CrossRef]
  42. Zhao, Y.P. Suggestion of a new dimensionless number for dynamic plastic response of beams and plates. Arch. Appl. Mech. 1998, 68, 524–538. [Google Scholar] [CrossRef]
  43. AUTODYN Theory Manual. USA: Century Dynamics Incorporated. Available online: https://www.researchgate.net/profile/Alireza_Rashiddel/post/Is_there_a_way_to_implement_a_large_strain_viscoelastic_material_model_in_AUTODYN/attachment/5f85890de66b860001a8503c/AS%3A946132159045637%401602586893515/download/0-theory_manual_AUTODYN.pdf (accessed on 29 September 2024).
  44. Lei, X.; Lu, Y. Mechanical properties and constitutive relation of steel 921A under effects of fire and explosion. Ship Eng. 2019, 1, 69–73. [Google Scholar]
  45. Kong, X.-S.; Wu, W.-G.; Li, J.; Chen, P.; Liu, F. Experimental and numerical investigation on a multi-layer protective structure under the synergistic effect of blast and fragment loadings. Int. J. Impact Eng. 2014, 65, 146–162. [Google Scholar] [CrossRef]
Figure 1. Structural model of thin plate and stiffened plate. (a) Thin plate. (b) Stiffened plate. (c) Finite element model—thin plate. (d) Finite element model—stiffened plate.
Jmse 12 01767 g001
Figure 2. Fitted curves of average impulse and TNT mass at different stand-off distances.
Jmse 12 01767 g002
Figure 3. Midpoint displacement–time of prototype and scaled model. (Conditions I–IV).
Jmse 12 01767 g003aJmse 12 01767 g003b
Figure 4. Effective plastic strain–yield stress of Condition V.
Jmse 12 01767 g004
Figure 5. Yield stress distribution of Condition V.
Jmse 12 01767 g005
Figure 6. Comparison of displacement results for different constitutive.
Jmse 12 01767 g006
Figure 7. Midpoint displacement–time of prototype and scaled model. (Conditions V–VIII).
Jmse 12 01767 g007
Figure 8. Midpoint displacement–time of prototype and corrected scaled model.
Jmse 12 01767 g008
Table 1. Scaling factors for blast response parameters.
VariableScale FactorsVariableScale Factors
Length, L β L = L m / L p = β Plastic limit bending moment, M0 β M 0 = β σ d β L 3
Density, ρ β ρ = ρ m / ρ p = 1 Plastic limit neutral plane force, N0 β N 0 = β σ d β L 2
Yield stress, σd β σ d = σ d m / σ d p = 1 Displacement, δ β δ = β L
Specific impulse, I β I = β L β ρ β σ d Velocity, v β v = β σ d / β ρ
Width, B β B = β L Time, t β t = β L β ρ / β σ d
Thickness, h β h = β L Strain, ε β ε = 1
Number of stiffeners, n0 β n 0 = 1 Strain rate, ε ˙ β ε ˙ = β σ d / β ρ / β L
Table 2. Parameters of the prototype for Conditions I–IV.
PrototypeLength
(m)
Thickness
(mm)
Stiffener
(mm)
TNT Mass
(kg)
Stand-Off
(m)
Yield Stress
(MPa)
I1030/300010385
II36/20005
III20 500 × 20 300 × 20 400010
IV24 500 × 24 300 × 24 24005
Table 3. Scale factors for distortion model (βL = 1/20).
Distortion ModelβIβhβσdβt
I-A0.05000.06400.610.0640
I-B0.03910.05000.610.0639
I-C0.06670.06671.000.0500
II-A0.05000.06400.610.0640
II-B0.03910.05000.610.0639
II-C0.06670.06671.000.0500
III-A0.05000.06400.610.0640
III-B0.03910.05000.610.0639
III-C0.07000.07001.000.0500
IV-A0.05000.06400.610.0640
IV-B0.03910.05000.610.0639
IV-C0.07080.07081.000.0500
Table 4. Different TNT mass and average impulse for stand-off of 0.5 m.
TNT Mass (g)230290360430500560620680740800
Average impulse (Pa·s)330.3392.7460.9526.8590.4643.1693.2743.5791.2838.4
Table 5. Different TNT mass and average impulse for stand-off of 0.25 m.
TNT Mass (g)140180220260300340380420460500
Average impulse (Pa·s)405.2489.2570.4646.8725.6802.4872.8945.21017.61088.0
Table 6. TNT mass for each scaled model.
Distortion ModelTNT Mass (g)Distortion ModelTNT Mass (g)
I-A375.0III-A500.0
I-B269.7III-B359.0
I-C294.3III-C370.5
II-A250.0IV-A300.0
II-B181.7IV-B218.8
II-C197.9IV-C222.6
Table 7. Comparison of peak displacement between the prototype and model.
UncorrectedCorrected
ConditionPeak Displacement
(mm)
Error
(%)
Peak Displacement
(mm)
Error
(%)
Prototype I953.8
Model I-A1215.027.39948.9 −0.51
Model I-B1215.027.39945.0 −0.92
Model I-C727.1−23.77966.4 1.32
Prototype II996.6
Model II-A1272.927.72996.5 −0.01
Model II-B1272.927.72990.7 −0.59
Model II-C759.8−23.761007.5 1.09
Prototype III907.3
Model III-A1240.336.70893.6 −1.51
Model III-B1240.336.70885.5 −2.40
Model III-C578.7−36.22917.5 1.12
Prototype IV1054.2
Model IV-A1409.433.691030.6 −2.24
Model IV-B1409.433.691032.4 −2.07
Model IV-C670.8−36.371051.2 −0.28
Table 8. Comparison of prediction errors for work done by explosive loads.
ConditionWork Done (MJ)Error (%)ConditionWork Done (MJ)Error (%)
Prototype I23.320/Prototype III37.296/
Model I-A23.360.16Model III-A38.162.33
Model I-B23.250.30Model III-B38.021.95
Model I-C23.621.27Model III-C37.580.77
Prototype II34.528/Prototype IV51.024/
Model II-A34.500.09Model IV-A51.240.42
Model II-B34.270.74Model IV-B51.671.26
Model II-C35.101.66Model IV-C50.580.88
Table 9. Parameters of the prototype for Conditions V–VIII.
PrototypeLength
(m)
Thickness
(mm)
Stiffener
(mm)
TNT Mass
(kg)
Average
(Pa·s)
Stand-Off
(m)
Material
1022/400011,79210921A
27/280016,3685
14 500 × 14 300 × 14 500013,93610
19 500 × 19 300 × 19 300017,2645
Table 10. Material constitutive parameters.
MaterialA/MPaB/MPanCm
921A6513950.640.0241.03
Q235249.28890.7460.0580.94
Table 11. Scaled factors for different distortion models.
ModelβLβhFirst CorrectionSecond Correction
βIW (kg)βσdβIW (kg)
V1/40.2730.20146.500.4940.19243.76
1/50.2270.16725.140.5010.16123.88
1/60.1820.13413.780.5050.12913.16
1/100.09090.06692.3300.5160.06532.256
VI1/40.2590.19130.980.5050.18429.62
1/50.1850.13613.700.5090.13213.16
1/60.1850.13610.030.5140.1339.701
1/100.1110.08172.1660.5260.08062.126
VII1/40.2860.21061.820.4940.20158.16
1/50.2140.15829.040.4980.15127.48
1/60.2140.15821.440.5040.15220.45
1/100.1430.1055.3330.5170.1035.171
VIII1/40.2630.19433.800.5070.18732.44
1/50.2110.15517.310.5120.15116.71
1/60.1580.1168.7490.5150.1138.476
1/100.1050.07742.1630.5270.07642.126
Table 12. Computational parameters and scaling factors for scaled model.
ModelβL ε e p m ε ˙ m /s−1 β I c p W (kg)
V1/40.0235815.260.191143.58
1/50.0240819.540.160423.79
1/60.0239723.570.128913.12
1/100.0234038.690.065182.251
VI1/40.0282220.640.184229.62
1/50.0280325.310.132213.17
1/60.0276531.380.13289.706
1/100.0274351.830.080642.129
VII1/40.0236117.720.200658.10
1/50.0235121.130.151227.48
1/60.0235627.380.152120.44
1/100.0236545.680.10275.171
VIII1/40.0274022.930.186932.32
1/50.0271527.640.150216.65
1/60.0274730.050.11318.455
1/100.0263454.170.076262.122
Table 13. Comparison of peak displacements for prototype and model.
βLPeak Displacement
(mm)
Error (%) βLPeak Displacement
(mm)
Error (%)
V11181.5/VII11183.6/
1/41170.5−0.931/41162.0−1.82
1/51173.6−0.661/51157.1−2.23
1/61171.2−0.871/61169.0−1.23
1/101163.4−1.531/101175.4−0.69
VI11246.2/VIII11195.1/
1/41243.3−0.231/41164.8−2.53
1/51242.2−0.321/51164.7−2.54
1/61243.2−0.231/61161.4−2.82
1/101241.5−0.381/101160.2−2.92
Disclaimer/Publisher’s Note: The statements, opinions and data contained in all publications are solely those of the individual author(s) and contributor(s) and not of MDPI and/or the editor(s). MDPI and/or the editor(s) disclaim responsibility for any injury to people or property resulting from any ideas, methods, instructions or products referred to in the content.