Article

The Impact of Flow-Thermal Characteristics in Ship-Board Solid Oxide Fuel Cells

by
Jiqiang Li
1,*,
Yexun Ding
1,†,
Tong Wu
1,†,
Zhenyu Gong
1,
Yong Fan
1,
Haoran Ma
1,
Jeong-Tae Kwon
2,*,
Weixin Ni
3 and
Jichao Li
4,*
1
School of Transportation, Ludong University, Yantai 264025, China
2
Department of Mechanical Engineering, Hoseo University, Asan 31499, Republic of Korea
3
Shandong Kaigeruisen Energy Technology Co., Ltd., Yantai 264025, China
4
School of Mechanical and Electrical Engineering, Jining University, Qufu 273155, China
*
Authors to whom correspondence should be addressed.
These authors contributed equally to this work.
J. Mar. Sci. Eng. 2024, 12(10), 1779; https://doi.org/10.3390/jmse12101779
Submission received: 4 August 2024 / Revised: 22 September 2024 / Accepted: 30 September 2024 / Published: 7 October 2024
(This article belongs to the Special Issue Advanced Technologies for New (Clean) Energy Ships)

Abstract

:
Hydrogen is increasingly recognized as a clean and reliable energy vector for decarbonization in the future. In the marine sector, marine solid oxide fuel cells (SOFCs) that employ hydrogen as an energy source have already been developed. In this study, a multi-channel plate-anode-loaded SOFC was taken as the research object. A three-dimensional steady-state computational fluid dynamics (CFD) model for anode-supported SOFC was established, which is based on the mass conservation, energy conservation, momentum conservation, electrochemical reactions, and charge transport equations, including detailed geometric shapes, model boundary condition settings, and the numerical methods employed. The polarization curves calculated from the numerical simulation were compared with experimental results from the literature to verify the model’s accuracy. The curved model was applied by enlarging the flow channels or adding blocks. Numerical calculations were employed to obtain the current density, temperature distribution, and component concentration distribution under the operating conditions of the SOFC. Subsequently, the distribution patterns of various physical parameters during the SOFC operation were analyzed. Compared to the classical model, the temperature of the curved model was reduced by 1.3%, and the velocities of the cathode and anode were increased by 4.9% and 5.0%, respectively, with a 2.42% enhancement in performance. The findings of this study provide robust support for research into and the application of marine SOFCs, and offer they insights into how we may achieving “dual carbon” goals.

1. Introduction

Throughout history, maritime transport has served as a pivotal enabler of trade and commerce between nations. International agencies like the United Nations International Maritime Organization (IMO), governments, ports, and industry personnel have explored and implemented improvements and innovations to ensure the optimal resource utilization [1,2]. Among several viable fuel options, the use of hydrogen is considered particularly promising. It represents an ideal substitute for fossil fuels, as its sole byproduct is water. The IMO has announced key targets for its initial strategy to reduce greenhouse gas emissions from the shipping sector [3]. Hydrogen fuel cells are widely used in various sectors, including power generation, transportation (buses, coaches, motorcycles, bicycles), and logistics (forklifts, trucks, delivery vehicles), as well as in maritime applications (submarines) and unmanned aerial vehicles (drones). To date, financial support and tax reduction policies implemented by governments have incentivized enterprises and research institutions to engage in the research and development, promotion, and application of relevant technologies. Japan’s “Green Growth Strategy” proposes converting all existing conventional fuel vessels to low-carbon fuel-powered vessels, including hydrogen, ammonia, and liquefied natural gas, by 2050. The development and promotion of hydrogen fuel cell systems and electric propulsion systems for short-range and small vessels will be encouraged [4,5,6].
The American Bureau of Shipping (ABS) provides supplementary guidelines for marine and offshore fuel cell power, “Guide for Fuel Cell Power for Marine and Offshore [7]”, which define the types of vessels eligible for the use of fuel cell systems. Additionally, European countries have been continuously exploring and researching the application of SOFCs in marine vessels. Meanwhile, Yanmar, a Japanese company, utilizes components from Toyota’s fuel cell vehicles to develop and test maritime hydrogen fuel cell systems on a prototype vessel [8]. The international SOFC4Maritime project, initiated jointly by Alfa Laval, DTU Energy, Haldor Topsoe, Svitzer, and the Mærsk Mc-Kinney Møller Center for Zero Carbon Shipping [9], aims to optimize the use of future green marine fuels by applying SOFCs to power generation on ships.
Fuel cells come in various types, classified according to the type of electrolyte they use. They can be categorized into molten carbonate fuel cells (MCFCs) [10], phosphoric acid fuel cells (PAFCs) [11], proton exchange membrane fuel cells (PEMFCs) [12], and SOFCs [13]. MCFCs utilize molten carbonate as their electrolyte. They can achieve conversion efficiencies of up to 60% under high-temperature and high-pressure conditions. However, the lifespan of the cells is relatively short, at approximately five years [10]. PAFCs utilize phosphoric acid as the electrolyte, and the combination with hydrogen results in a 2.1% increase in fuel utilization and a 0.8% improvement in electrical efficiency [11]. PEMFCs use a proton exchange membrane as the electrolyte and are characterized by high efficiency, clean operations, and scalability, making them suitable for a variety of applications [12]. SOFCs use solid oxide as the electrolyte, which makes them leak-proof and even easier to manage. They also have the advantage of fuel flexibility. Unlike PEMFCs, which require hydrogen as their fuel, SOFCs can utilize a variety of fuels [13].
The SOFC is an efficient and clean energy conversion technology that can directly convert chemical energy into electricity, known as third-generation fuel cell technology. A typical SOFC consists of three layers: a fuel electrode (anode), an electrolyte, and an air electrode (cathode). Both the fuel electrode and the air electrode are porous electrode structures that enclose a dense electrolyte layer in the middle. The characteristics of SOFCs are similar to those of proton exchange membrane fuel cells (PEMFCs), except that the electrolyte in PEMFCs is a polymer that operates at low temperatures (usually less than 100 °C) [14,15,16]. The electrolyte in SOFCs is a solid oxide that operates at high temperatures (500–1000 °C), which also confers unique advantages over PEMFCs. These advantages include (1) the ability to use H2, hydrocarbons [17] (CH4), or CH3OH as fuel, eliminating the need for traditional precious metal catalysts; (2) a high power density [18]; (3) negligible ohmic impedance at the electrodes, with losses primarily generated by the electrolyte [19]; (4) the use of solid ceramic materials as key battery components [20]; (5) waste heat utilization, cogeneration, and high fuel utilization rates; and (6) fast reaction processes and simple equipment due to the battery operating temperature [21].
The characteristics of SOFCs enable total power generation efficiencies exceeding 60% in a single cycle, while the total system efficiency can reach as high as 85%. Today, the power density, reliability, and service life of SOFCs have been significantly improved, and their development is well-advanced, offering broad application prospects. The working principle of SOFCs is illustrated in Figure 1.
Hydrogen gas (H2) diffuses through the anode to the anode–electrolyte interface. Oxygen or air (O2) is continuously fed through the cathode. O2 is adsorbed on the cathode surface. Due to the catalytic action of the cathode, O2 obtains electrons to become O2−. Under the action of chemical potential, O2− enters the solid oxygen ion conductor, acting as an electrolyte. Due to the concentration gradient, the diffusion eventually reaches the interface between the solid electrolyte and the anode, and it reacts with H2. The lost electrons pass through the outer circuit, back to the cathode. The chemical reaction equations are as follows [22]:
Cathode:
O 2 + 4 e 2 O 2
Anode:
2 H 2 + 2 O 2 2 H 2 O + 4 e
Overall reaction equation:
O 2 + 2 H 2 2 H 2 O
The anode not only serves as the electrochemical oxidation site for the fuel but also facilitates charge transfer to the conductive contact. The cathode reduction process involves oxygen adsorption and subsequent production of oxygen ions. Consequently, numerous researchers have developed cathode and anode materials. In recent years, the use of biochar derived from pepper stalks as fuel [23], direct carbon SOFCs (DC-SOFCs) composed of yttrium-doped strontium titanate with in situ dissolved copper [24], and Fe-doped La0.3Sr0.7TiO3 (LSFT) [25] as anode materials has been extensively studied. These materials exhibit high structural stability, ionic conductivity, electrocatalytic activity, and electrochemical performance.
As the most critical part of an SOFC, the electrolyte is primarily used to transport the O2- generated by the cathode to the anode for participation in the reaction, and also to separate the fuel gas and oxygen to prevent direct contact and combustion, which would result in battery failure. Jeon et al. studied the effect of doped trace Fe2O3 on the structure and electrical properties of 8 mol% yttrium-stabilized zirconia (8YSZ). The power density of the stack based on the 8YSZ electrolyte doped with 500 ppm Fe2O3 was about 1.5 times higher than that of the stack using the original 8YSZ electrolyte [26]. Kairat et al. investigated the effect of the particle size composition of Zr0.84Y0.16O2−δ (YSZ), Ce0.73Gd0.27O2−δ (GDC) powder, and NiO/YSZ and NiO/GDC composites on their sintering kinetics. The results showed that the porosity and air permeability of the layer could be increased by 1.6 times and 4 times, respectively, by adding 5% by weight pore-forming agent [27].
The electrochemical reactions and transport processes occurring in different regions of an SOFC are extremely complex, including transport of chemical species, electrochemical reactions, transport of electrons and ions, and transfer of heat, momentum, and mass [28]. Numerical simulation can be employed as an auxiliary method for experimental research to aid our understanding of the fundamental mechanisms, favoring improvements in the stack structure and performance. Wei et al. [29] designed and established an SOFC-HCCI hybrid power system model. The effects of fuel type, fuel flow, equivalence ratio, and vapor–fuel ratio on system efficiency were analyzed. The focus was on evaluating the exergy destruction of different fuels (NH3, H2, natural gas) in the SOFC–engine hybrid system and optimizing system parameters, but there was a lack of analysis on the impact of the internal flow field structure on the performance of the SOFC. The results showed that system efficiency increased with increasing fuel flow, initially increased and then decreased with an increasing equivalence ratio, and decreased with an increasing vapor–fuel ratio. Mehr et al. [30] studied the effect of hydrogen content on the performance of fuel cell power plants from a thermodynamic perspective. The genetic algorithm was used to obtain a mixture ratio of hydrogen and syngas that increased the cogeneration efficiency by 3%. In the study, various models were used for experimental analysis, but detailed information regarding the CFD model was not explicitly mentioned. Hussain et al. [31]. constructed a three-dimensional model of a single-channel SOFC using numerical simulation method. The model was used to analyze the influence of material parameters and structural parameters on cell properties. It was found that under the current density of the cell with the highest performance (power density of 4 W/cm2, current density of 6700 A/m2), the largest contributing factors to induced losses were cathode activation concentration loss and ohmic loss. In the electrodes, electrolyte, and gas diffusion electrodes (GDEs), the charge balance of electrons and ions was solved, and Butler–Volmer charge transfer kinetics were used to describe the charge exchange current density. However, there was a lack of detailed analysis on the distribution of temperature and component concentrations. Due to the increase in electrochemical reaction rate and the decrease in concentration loss, the power density of the SOFC would increase with an increasing temperature. Furthermore, a reduction in the thickness of the electrolyte and anode would decrease the ohmic loss and enhance the electrochemical performance.
During the reaction process inside the SOFC, the electrochemical reaction of the gas takes place along the gas channel in the catalytic layer of the electrode, generating an electric current and simultaneously releasing heat. The uneven distribution of gas in the flow field leads to uneven mass distribution in the electrode, which in turn causes an uneven current and heat generation in local areas of the battery. Local inhomogeneity increases the risk of reduced battery performance or mechanical failure, ultimately shortening the battery life [32]. The structure of the flow field determines the distribution of the reaction gas, which in turn affects the distribution of key battery parameters. Chen et al. [33] proposed a novel parallel cylindrical flow field design for an SOFC and used a three-dimensional electrochemical multi-physics coupling model to evaluate its operating characteristics. The results showed that the new design exhibited better laminar properties, and the oxygen diffusion rate was increased by 60%, which is beneficial for achieving a more uniform reactant distribution. The research direction lacked studies conducted in the context of maritime environments, particularly the impact of flow-thermal characteristics on the performance of the SOFCs in shipboard settings. Gong et al. [34] proposed a new SOFC rotating L-type mainstream flow field and studied its heat flow characteristics and flow characteristics. The results showed that the maximum temperature difference (TD) in the rotating L-shaped flow field was 20% lower than that of the co-flow and cross-flow arrangements, and the average TD was 32.72% lower than that of the counter-flow arrangement. In the study, there was a lack of detailed analysis on the numerical values of the current density, velocity, and molar fractions of molecules. Gu et al. [35] proposed several new interconnector (IC) designs and numerically investigated them through 3D multi-physics modeling. Compared to the traditional through-channel-based IC design, the new IC design could achieve a more uniform O2 distribution at the SOFC cathode. The peak power density could be increased by 27.86%. It was also found that the degradation induced by IC oxidation was closely related to the contact area between the IC and the electrode. The study focused on improving the electrical performance of SOFCs by altering the IC design, while the present study investigated the impact of the flow field structure on the performance of SOFCs and developed an optimized flow field design.
Based on the above analysis, this study explored the impact of the flow channel structure. A multi-channel, plate-anode-loaded SOFC was taken as the research object. A three-dimensional, steady-state CFD model based on a strongly convergent planar SOFC was used to compare the performance of the co-flow and counter-flow models and provide a new flow channel optimization model. Based on heat transfer, mass transfer, momentum models, and electrochemical reaction equations, a three-dimensional, steady-state model of the SOFC was established. Through numerical calculations, SOFCs with classical and optimized channels were obtained. Several physical parameters (temperature field, velocity field, and molar fraction) were analyzed, and we obtained the distribution patterns of each physical parameter.

2. Mathematical Model and Three-Dimensional Numerical Model of SOFC

2.1. Model Assumption

The normal operation of a hydrogen-fueled SOFC reactor is a complex multi-physical and multi-influencing process. We made some assumptions to simplify the complex system for the numerical simulation:
  • The SOFC operates normally under steady and adiabatic conditions.
  • The gas mixture is an incompressible ideal gas due to the high operating temperature and ambient pressure, and it obeys the ideal gas state equation.
  • The flow is laminar in the channel as the flow rate is low (Re < 2400).
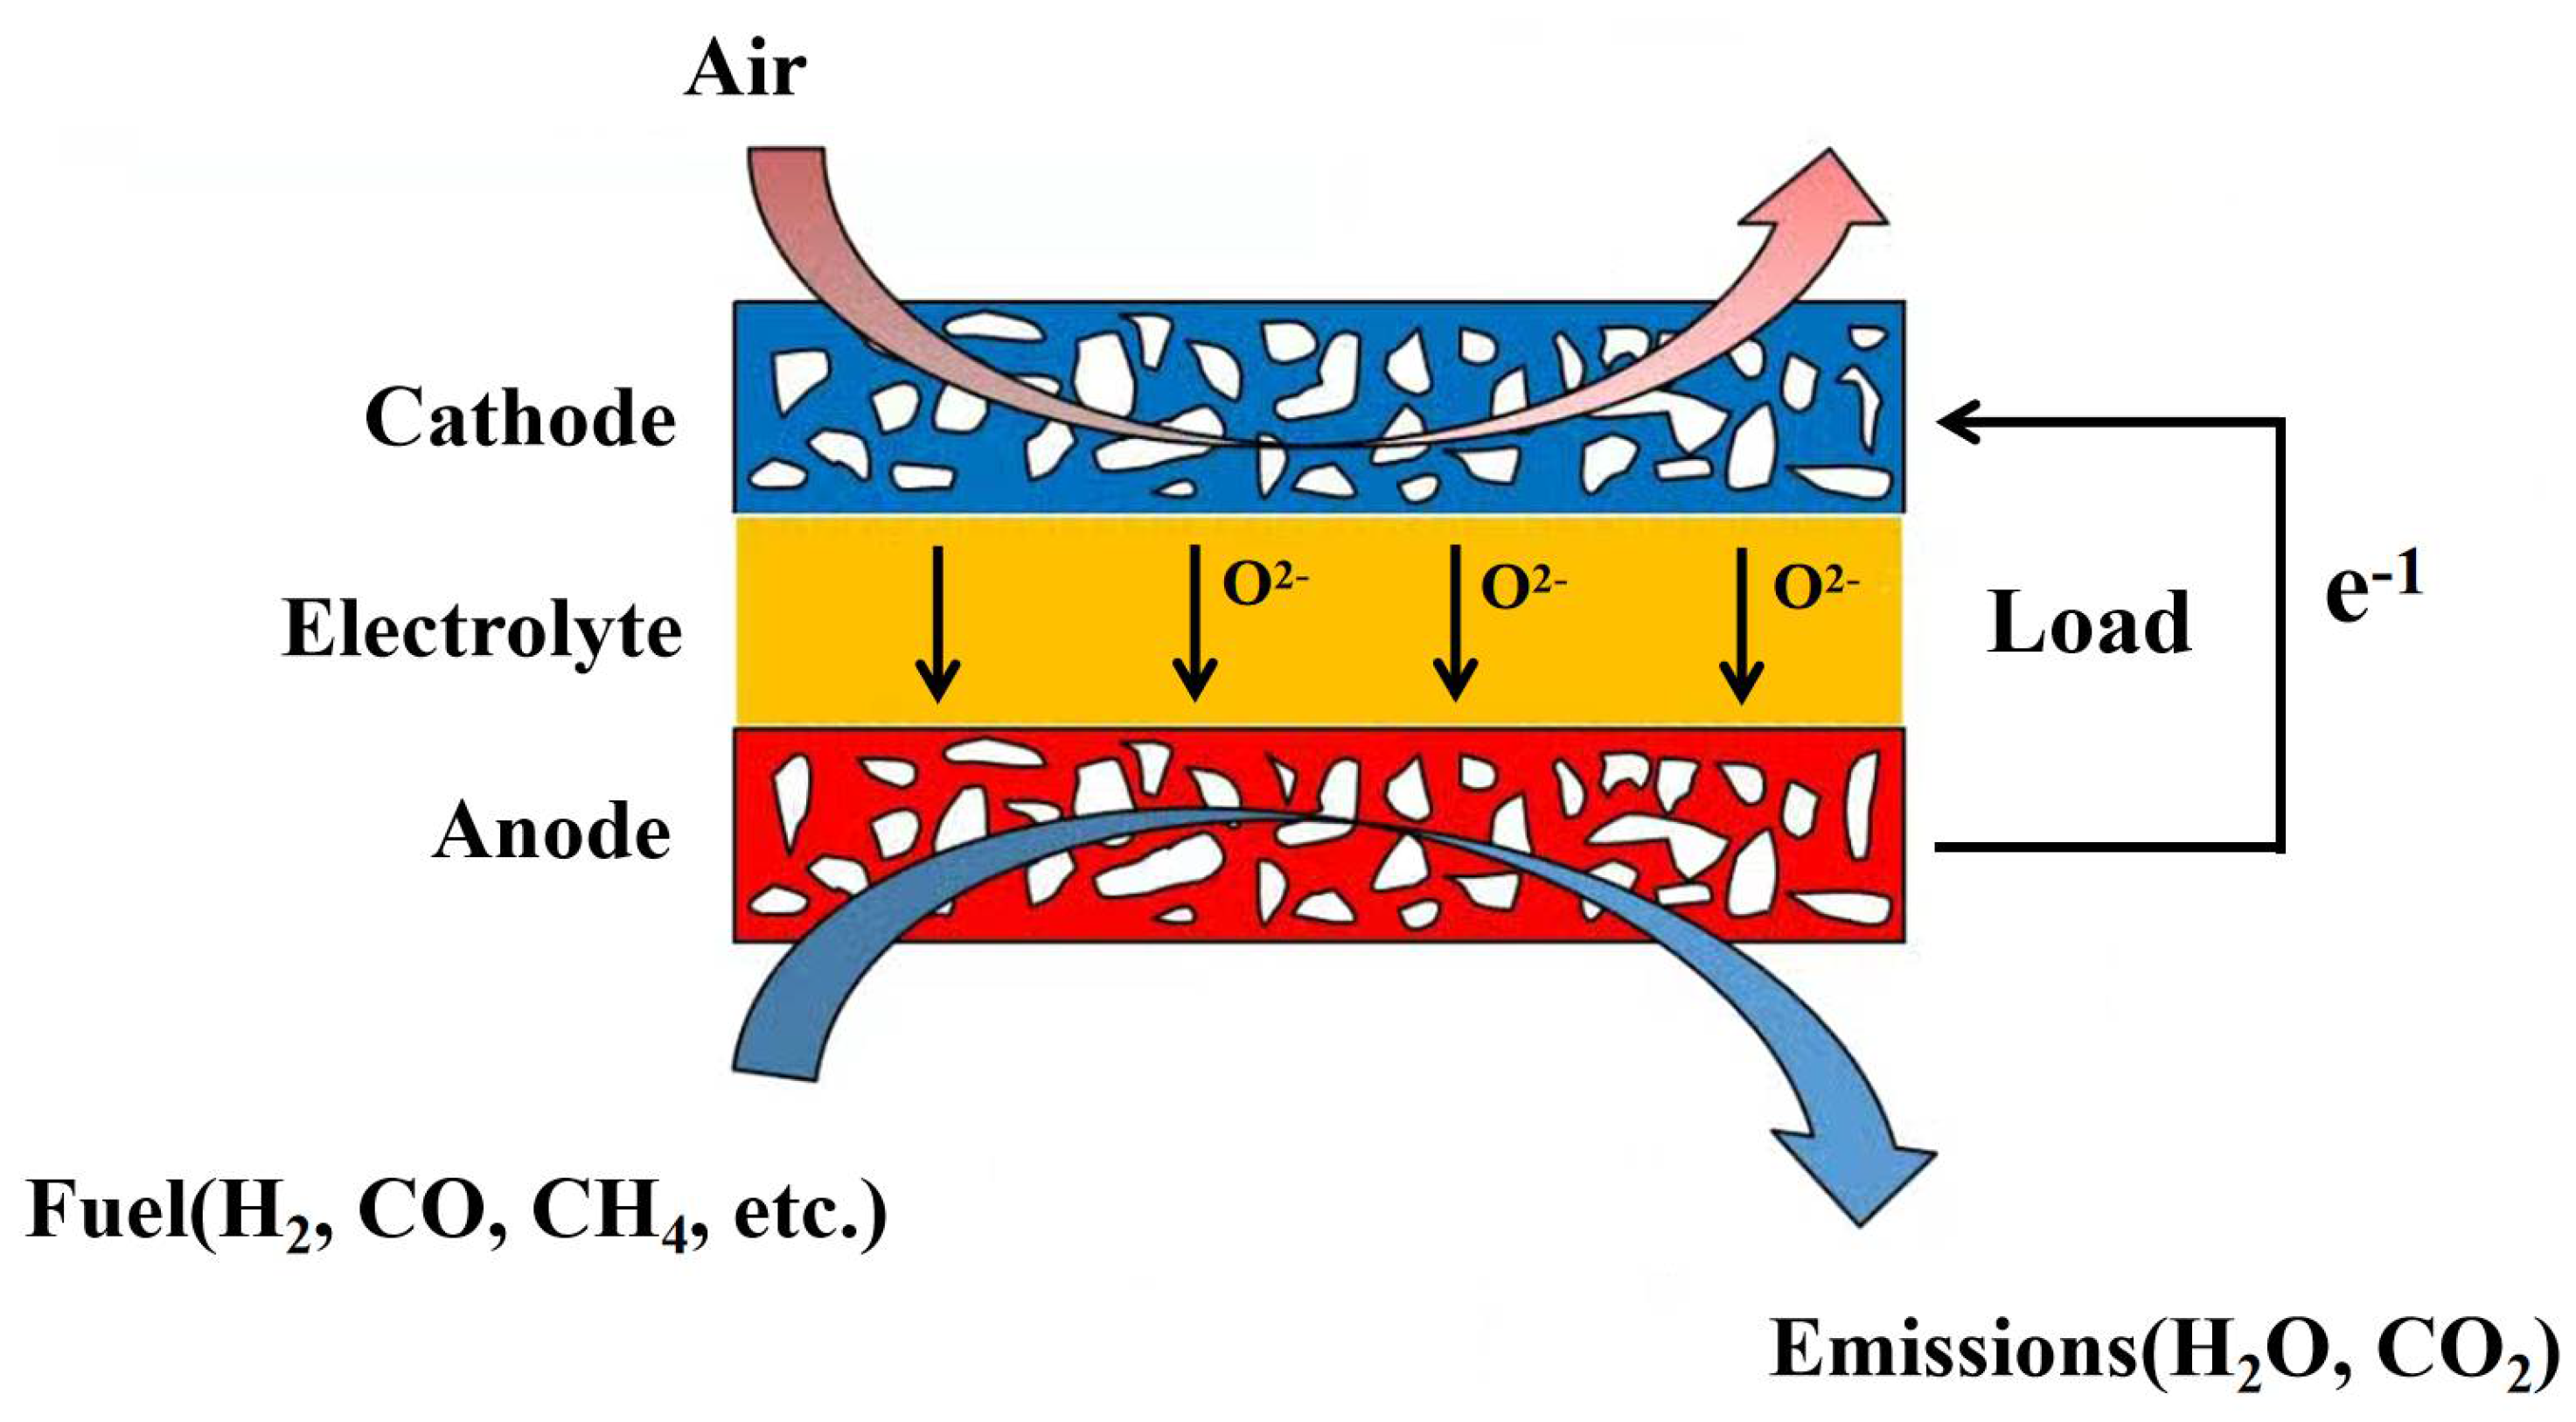
  • In the SOFC, all electrochemical and heterogeneous chemical reactions occur at the surface of the electrolyte.
  • The effects of gravity and the heat transfer in the stack are neglected.
  • The electrode is a homogeneous isotropic medium with a porous microstructure.

2.2. Model Governing Equation

In SOFCs, the transport of mass, momentum, charge, energy and chemical elements takes place simultaneously. SOFC models are generally composed of mass, momentum, energy and electrochemical dynamics equations. Appendix A gives the meanings of the related physical symbols.
Mass continuity equation:
· ρ u = Q b r
At the interface between the electrode and electrolyte, the consumption of O2 and H2 and the generation of H2O have different continuous source terms due to their different electrochemical reaction rates. This is calculated by using Equations (5)–(7).
Q b r , H 2 = M H 2 2 F i a n
Q b r , O 2 = M O 2 4 F i c a t
Q b r , H 2 O = M H 2 O 2 F i a n
Momentum conservation equation:
Since the electrochemical reaction consumes gas, the compressible Navier–Stokes equation can be chosen and combined with the continuity equation, expressed as follows [36]:
ρ u · u = · p I + μ u + u T 2 3 μ · u I
· ρ u = 0
In a porous electrode, the Brinkman formula is commonly used to describe the fluid velocity and pressure, in the following form:
μ κ + Q b u = · p I + μ u + u T 2 3 μ · u I
· ρ u = Q b r
The viscosity μ is calculated as follows [37]:
μ = 10 7 k = 0 6 b k T 1000 k
The fluid velocity and pressure field of single-phase flow in porous media can be obtained by solving the momentum conservation equation.
When ignoring the radiation heat transfer, the heat inside the SOFC is mainly composed of three parts: the heat generated by electrochemistry, the heat caused by activation polarization, and the heat caused by ohmic polarization.
Energy conservation equation:
ρ · C p · u · T · k e f f T = Q h
The effective heat conductivity is expressed as follows:
k e f f = ε k g + ( 1 ε )   k s
The specific constant pressure heat capacity for each gas j and the gas mixture is expressed by using Equation (15) [37]:
C p , j = k = 1 7 a k · T / 1000 k M j , C p , g = i x j · C p , j
The heat conduction coefficient of gas j, as well as for the gas mixture, is calculated as follows:
k j = 0.01 · k = 1 7 a k · T / 1000 k , k g = i x j · C p , j
The heat source term Q h is specifically expressed as follows:
Q h = i 2 σ e l e , a + i δ T S 2 F + η a c t
The component transport equation describes the different motions of each substance in the fluid mixture. In the stack channel, the gas convective flow completes the material transfer, and in the multi-porous electrode, the concentration difference between the two sides of the electrode caused by the chemical reaction promotes the gas diffusion to the electrode.
Mass transport can be described in terms of the Maxwell–Stefan diffusion equation and the convection equation. At rest, the mass equilibrium state can be expressed in the following formula:
· ρ ω i D e f f , i j x j + x j ω j p p + ρ U · ω i = S i
S i is determined by Faraday’s law [38]:
S H 2 = M w , H 2 2 F i a n
S O 2 = M w , O 2 4 F i c a t
S H 2 O = M w , H 2 O 2 F i c a t
The effective diffusion coefficient in the flow channel is calculated as follows [39]:
D i , j = 0.00143 T 1.75 p V i 1 / 3 + V j 1 / 3 2 1 M i + 1 M j
In porous electrodes, it is also necessary to consider Knudsen diffusion (23) due to wall collision. Its effective diffusion coefficient is shown as Equation (24) [36]:
D K n , i = 2 3 r e 8 R T π M i
D e f f , i = ε τ D i j D K n , i D i j + D K n , i
There are two kinds of charges in a fuel cell: electrons and ions. Reactions within a cell are often accompanied by a transfer of charge, and the charge conservation process is often described on the basis of Ohm’s law [40].
Electron conservation:
· σ e l e c ϕ e l e c = S a i
σ e l e c e f f = σ e l e c θ E . C 1 ε
Ion conservation:
· σ i o n ϕ i o n = S a i
σ i o n e f f = σ i o n 1 θ E . C 1 ε
The conductivity of different materials is different. At 1073 K, the conductivity of the cathode, anode, and interconnect was calculated as follows:
σ e l e , c = 4.2 × 10 7 T e x p 1200 T
σ e l e , a = 9.5 × 10 7 T e x p 1150 T
σ i n = 3.34 × 10 4 × e x p 10,300 T
The open circuit voltage is the maximum voltage of a fuel cell under a specific operating condition. However, due to polarization loss, the real voltage potential is often lower than the open circuit voltage. Polarization loss mainly includes concentration polarization, activation polarization, and ohmic polarization.
Because of this, the operating voltage can be calculated as follows [41]:
V c e l l = E o c v V a c t V c o n V o h m
The open circuit voltage can be expressed as follows [42]:
E o c v = E 0 + R T 2 F ln P H 2 P O 2 0.5 P H 2 O
E 0 = 1.317 2.769 × 10 4 T
During the electrochemical reaction of a fuel cell, the reaction material needs to cross the electrochemical reaction energy barrier to carry out the electrochemical reaction, and the electrical potential shift generated by this is called activation polarization. It is closely related to the material properties, microstructure, temperature, and current density of the stack, and it is usually obtained by the Butler–Volmer equation:
i = i 0 C R e x p α a F η a c t R T C O e x p α c F η a c t R T
C R = C H 2 C H 2 , r e f ,   C O = C H 2 O C H 2 O , r e f
α a = n α c
The exchange current density can be obtained by the following formula:
i 0 , a = k a R T 2 F e x p E a c t , a R T
i 0 , c = k c R T 2 F x p E a c t , c R T

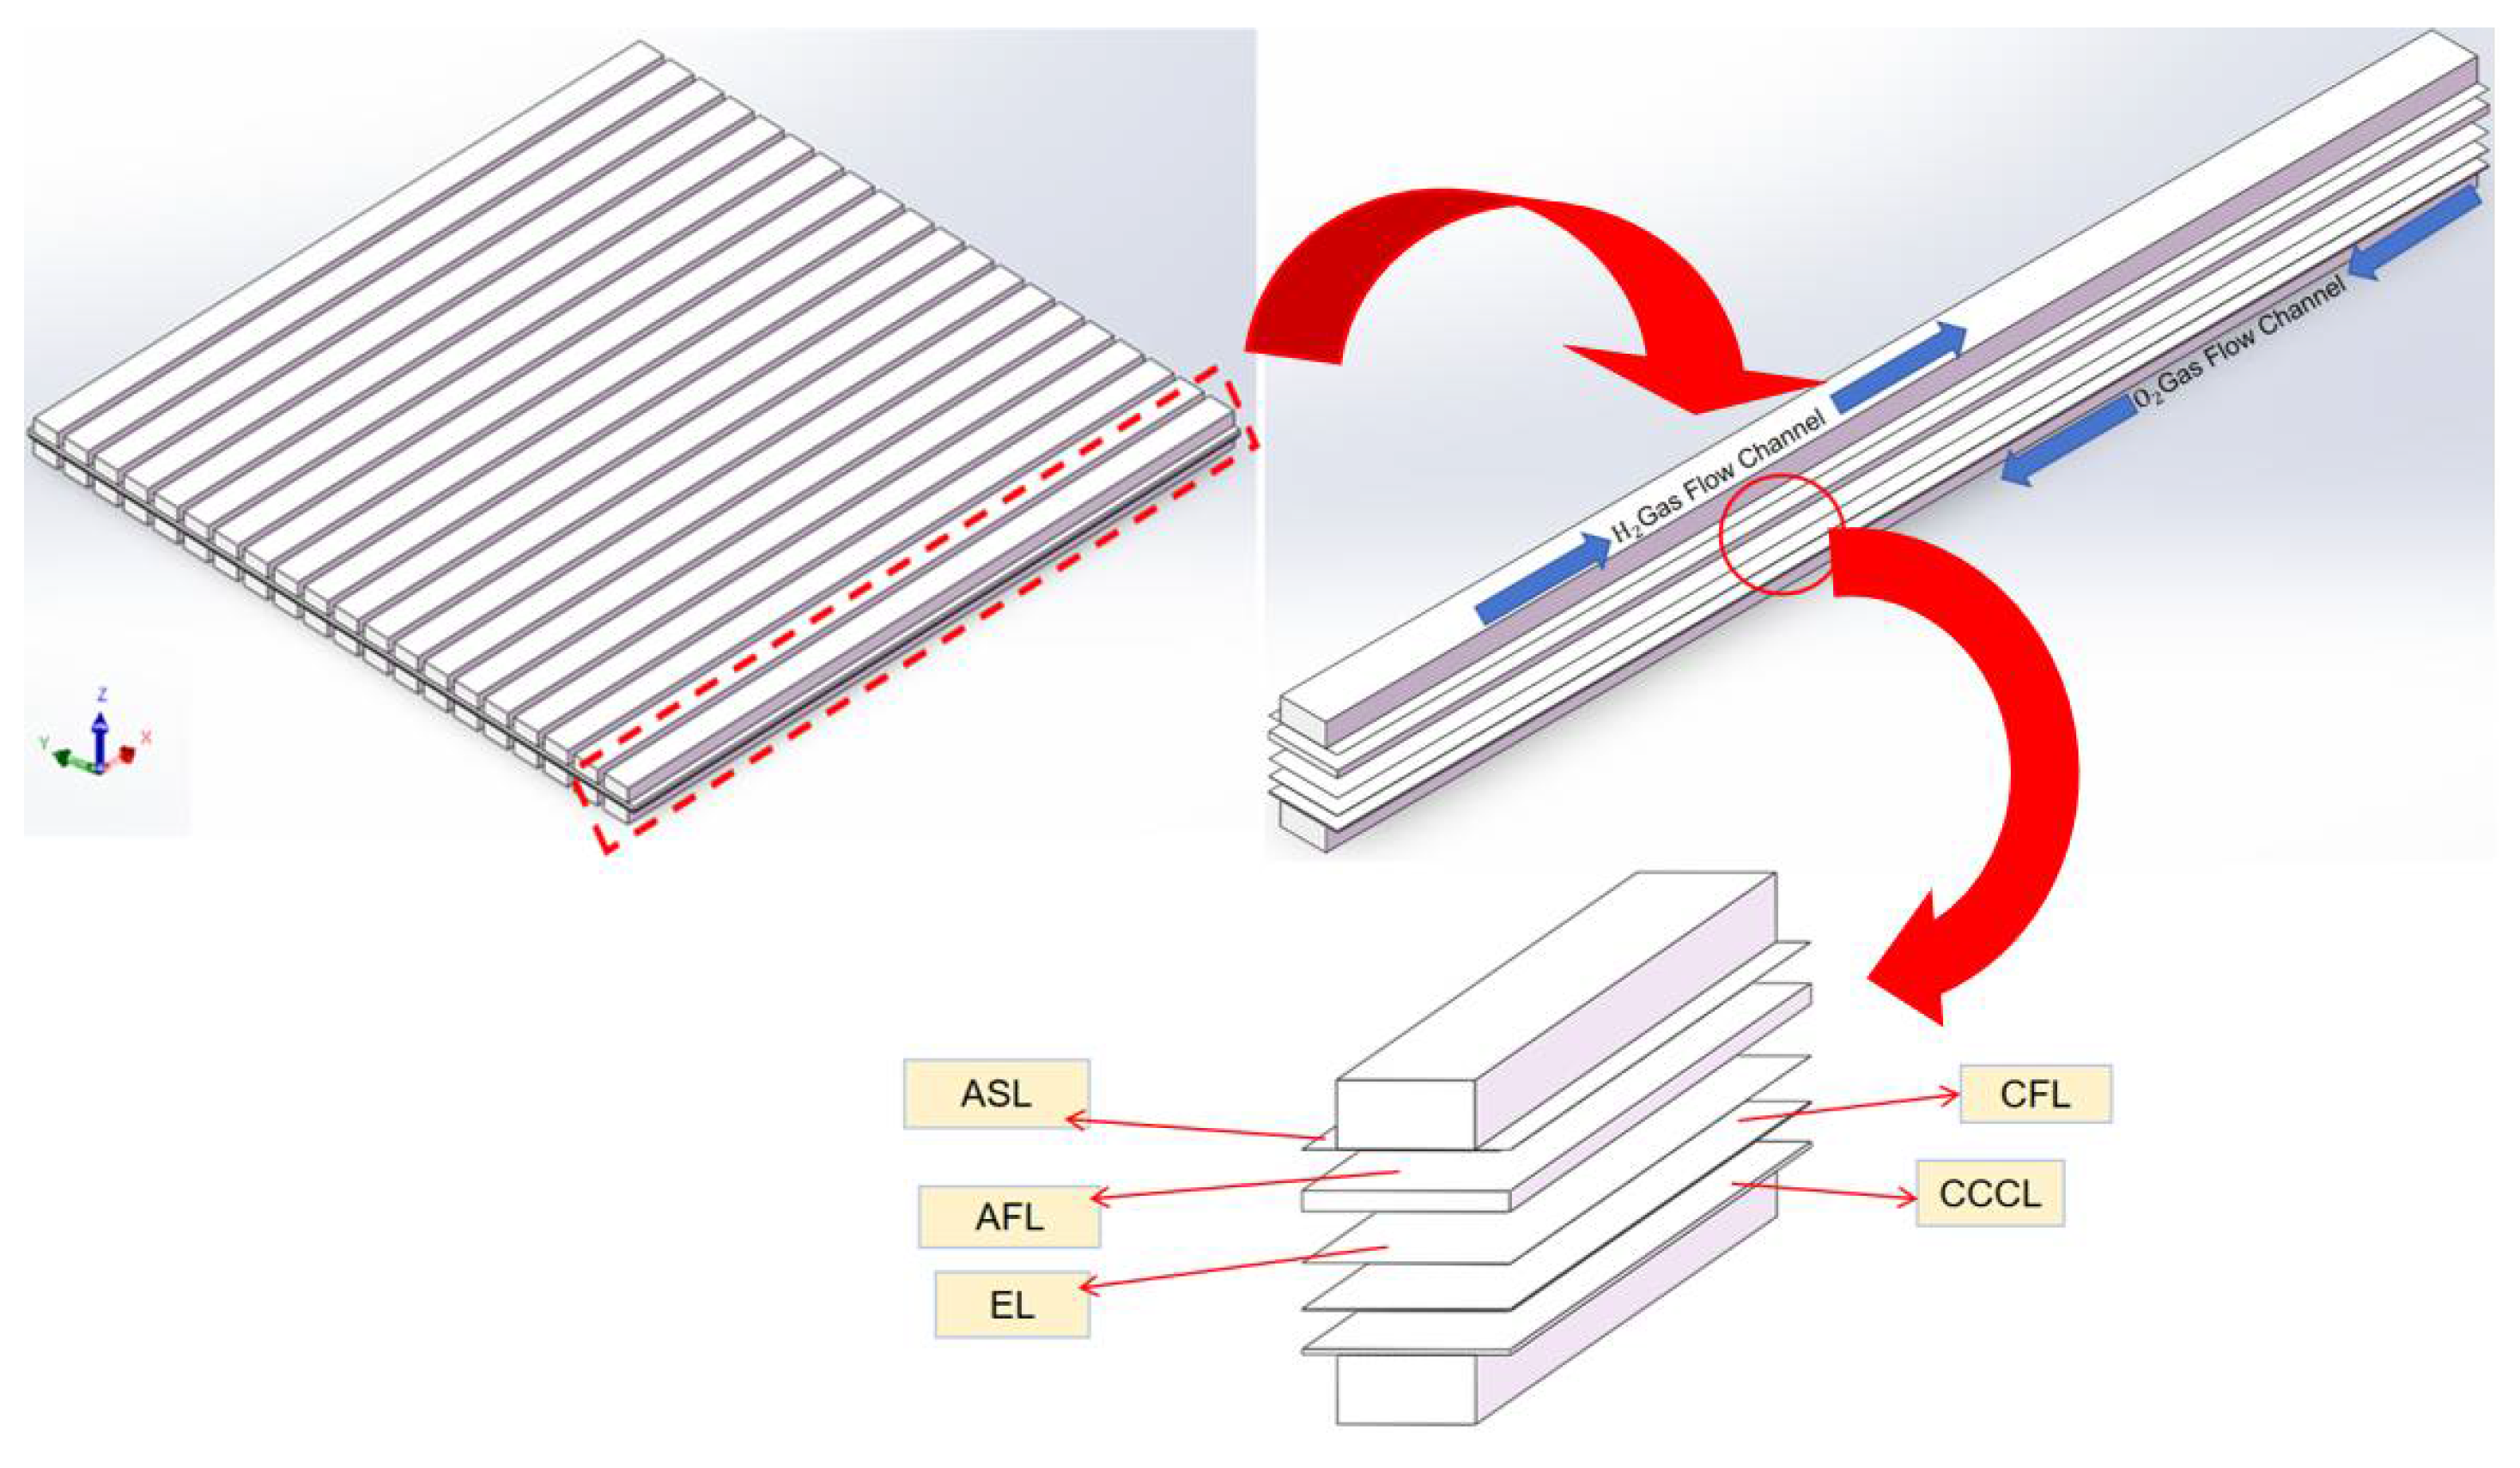
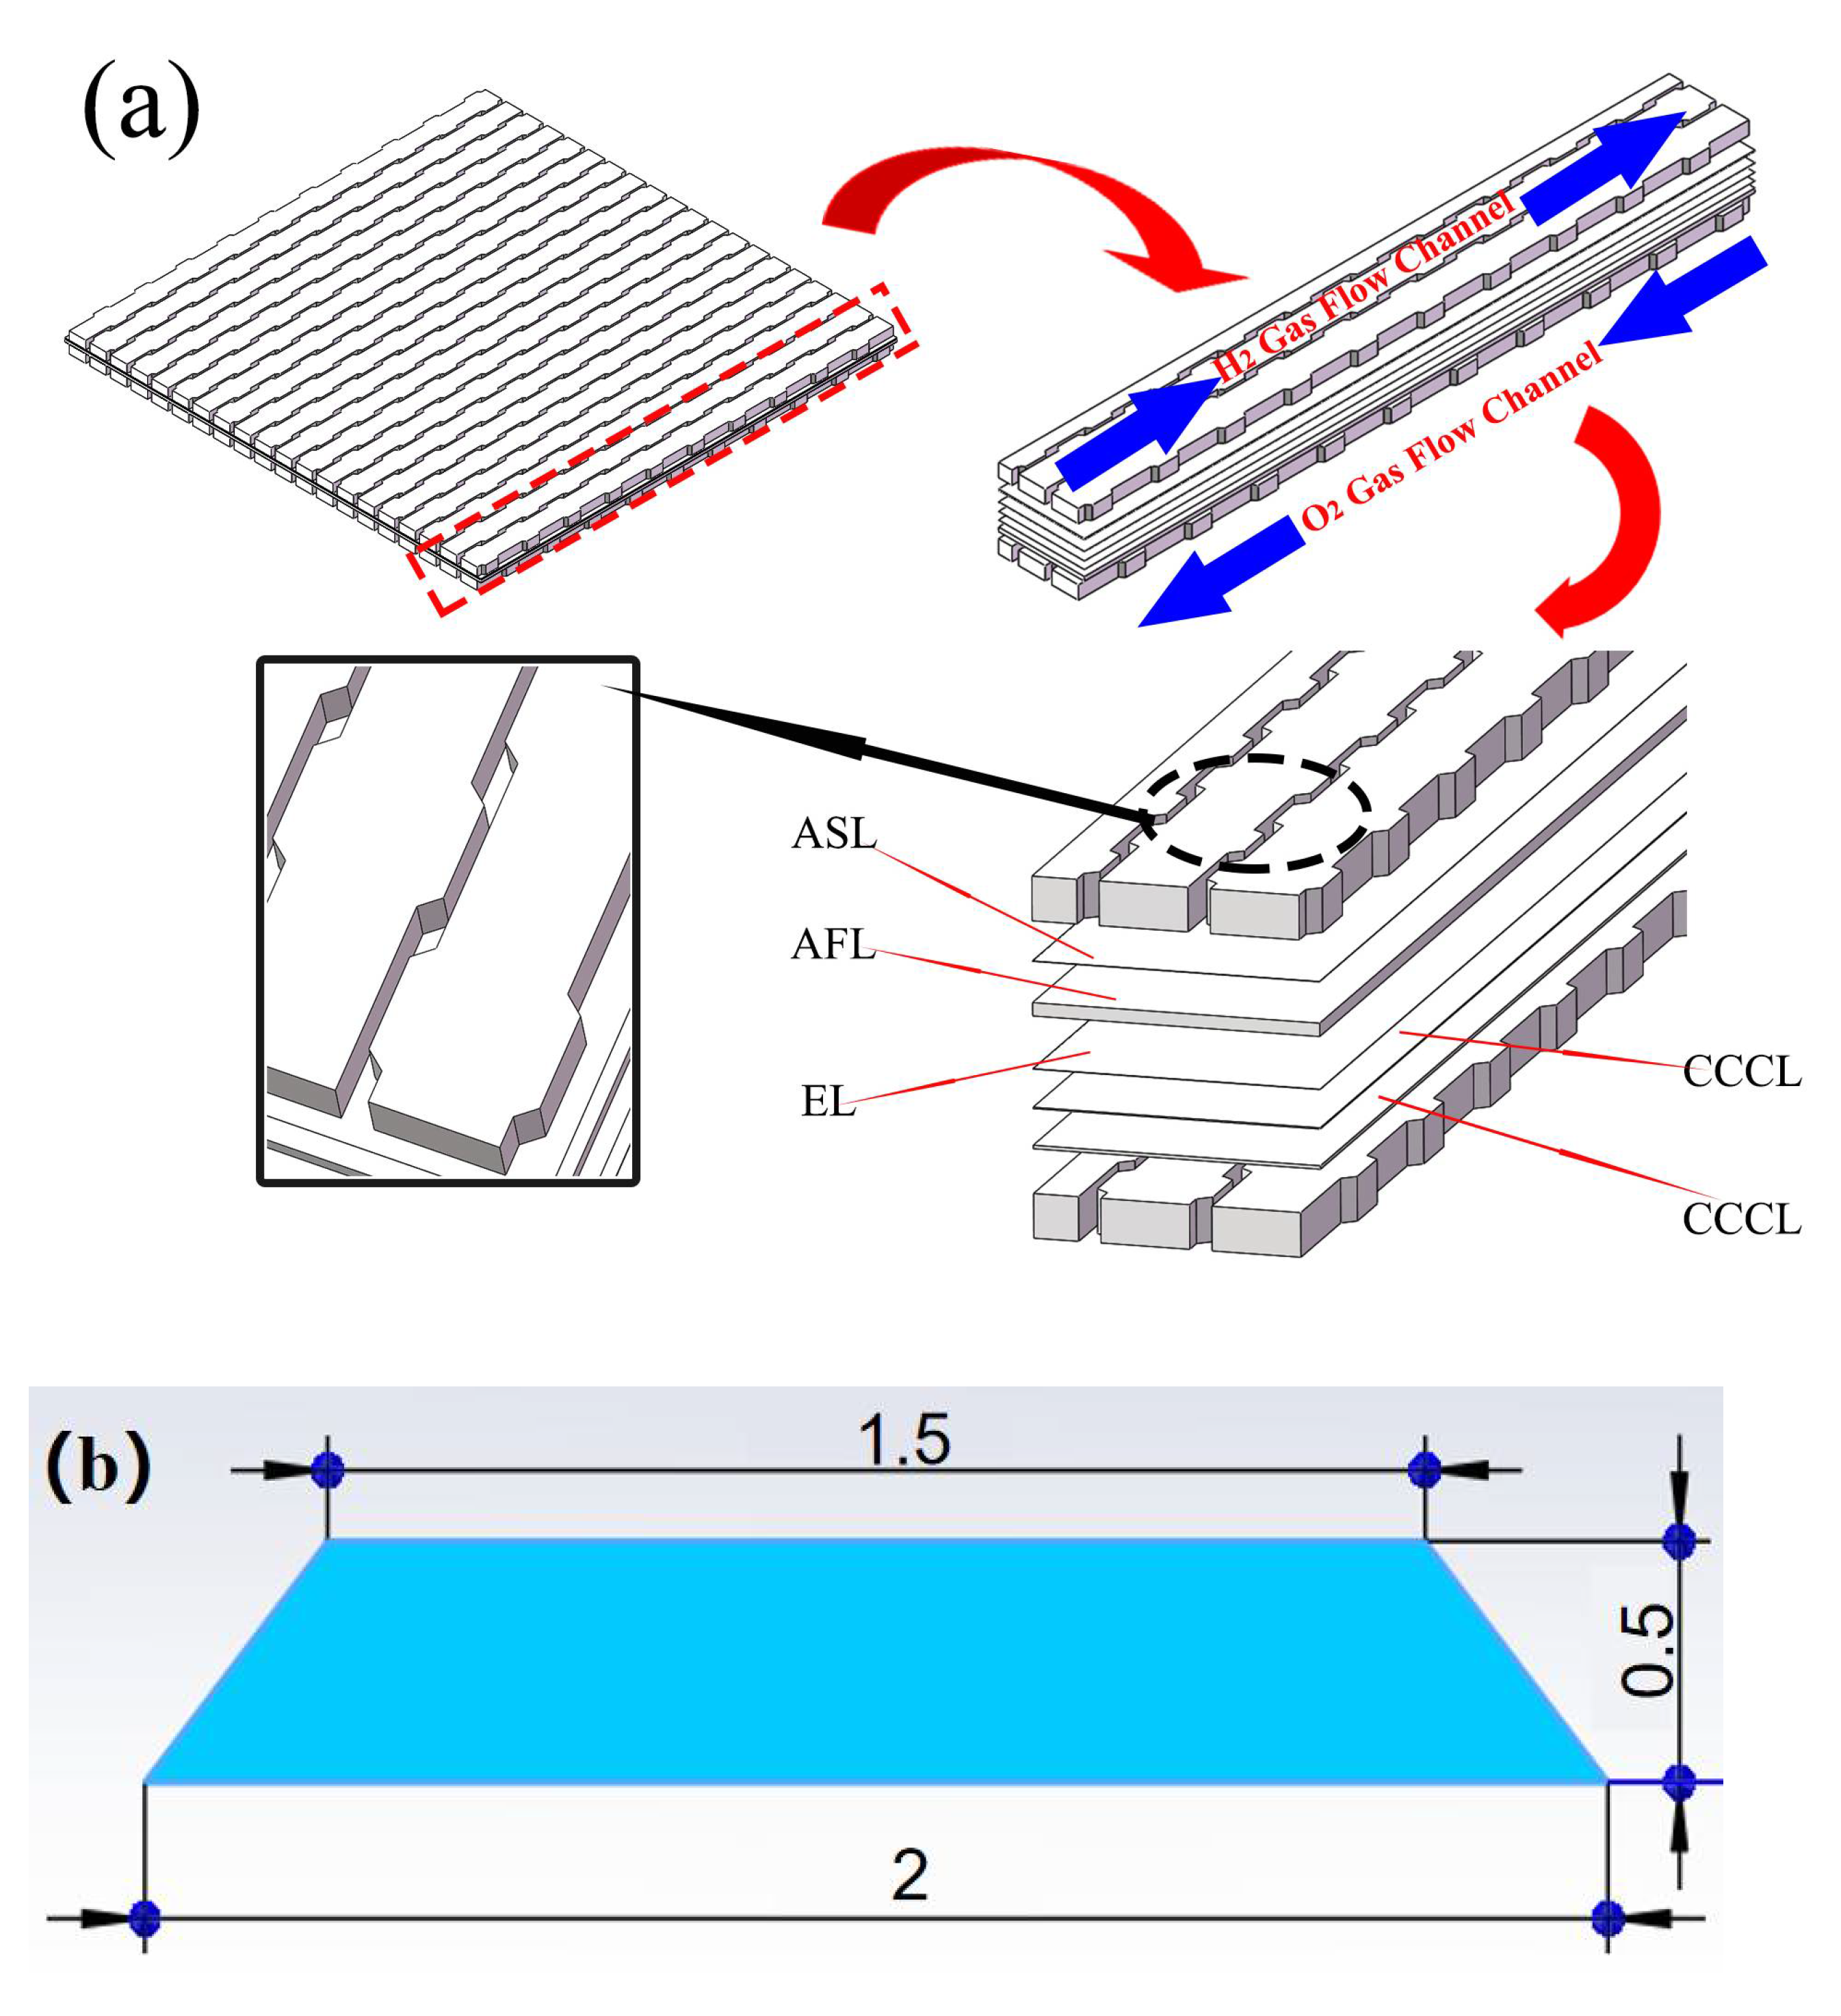
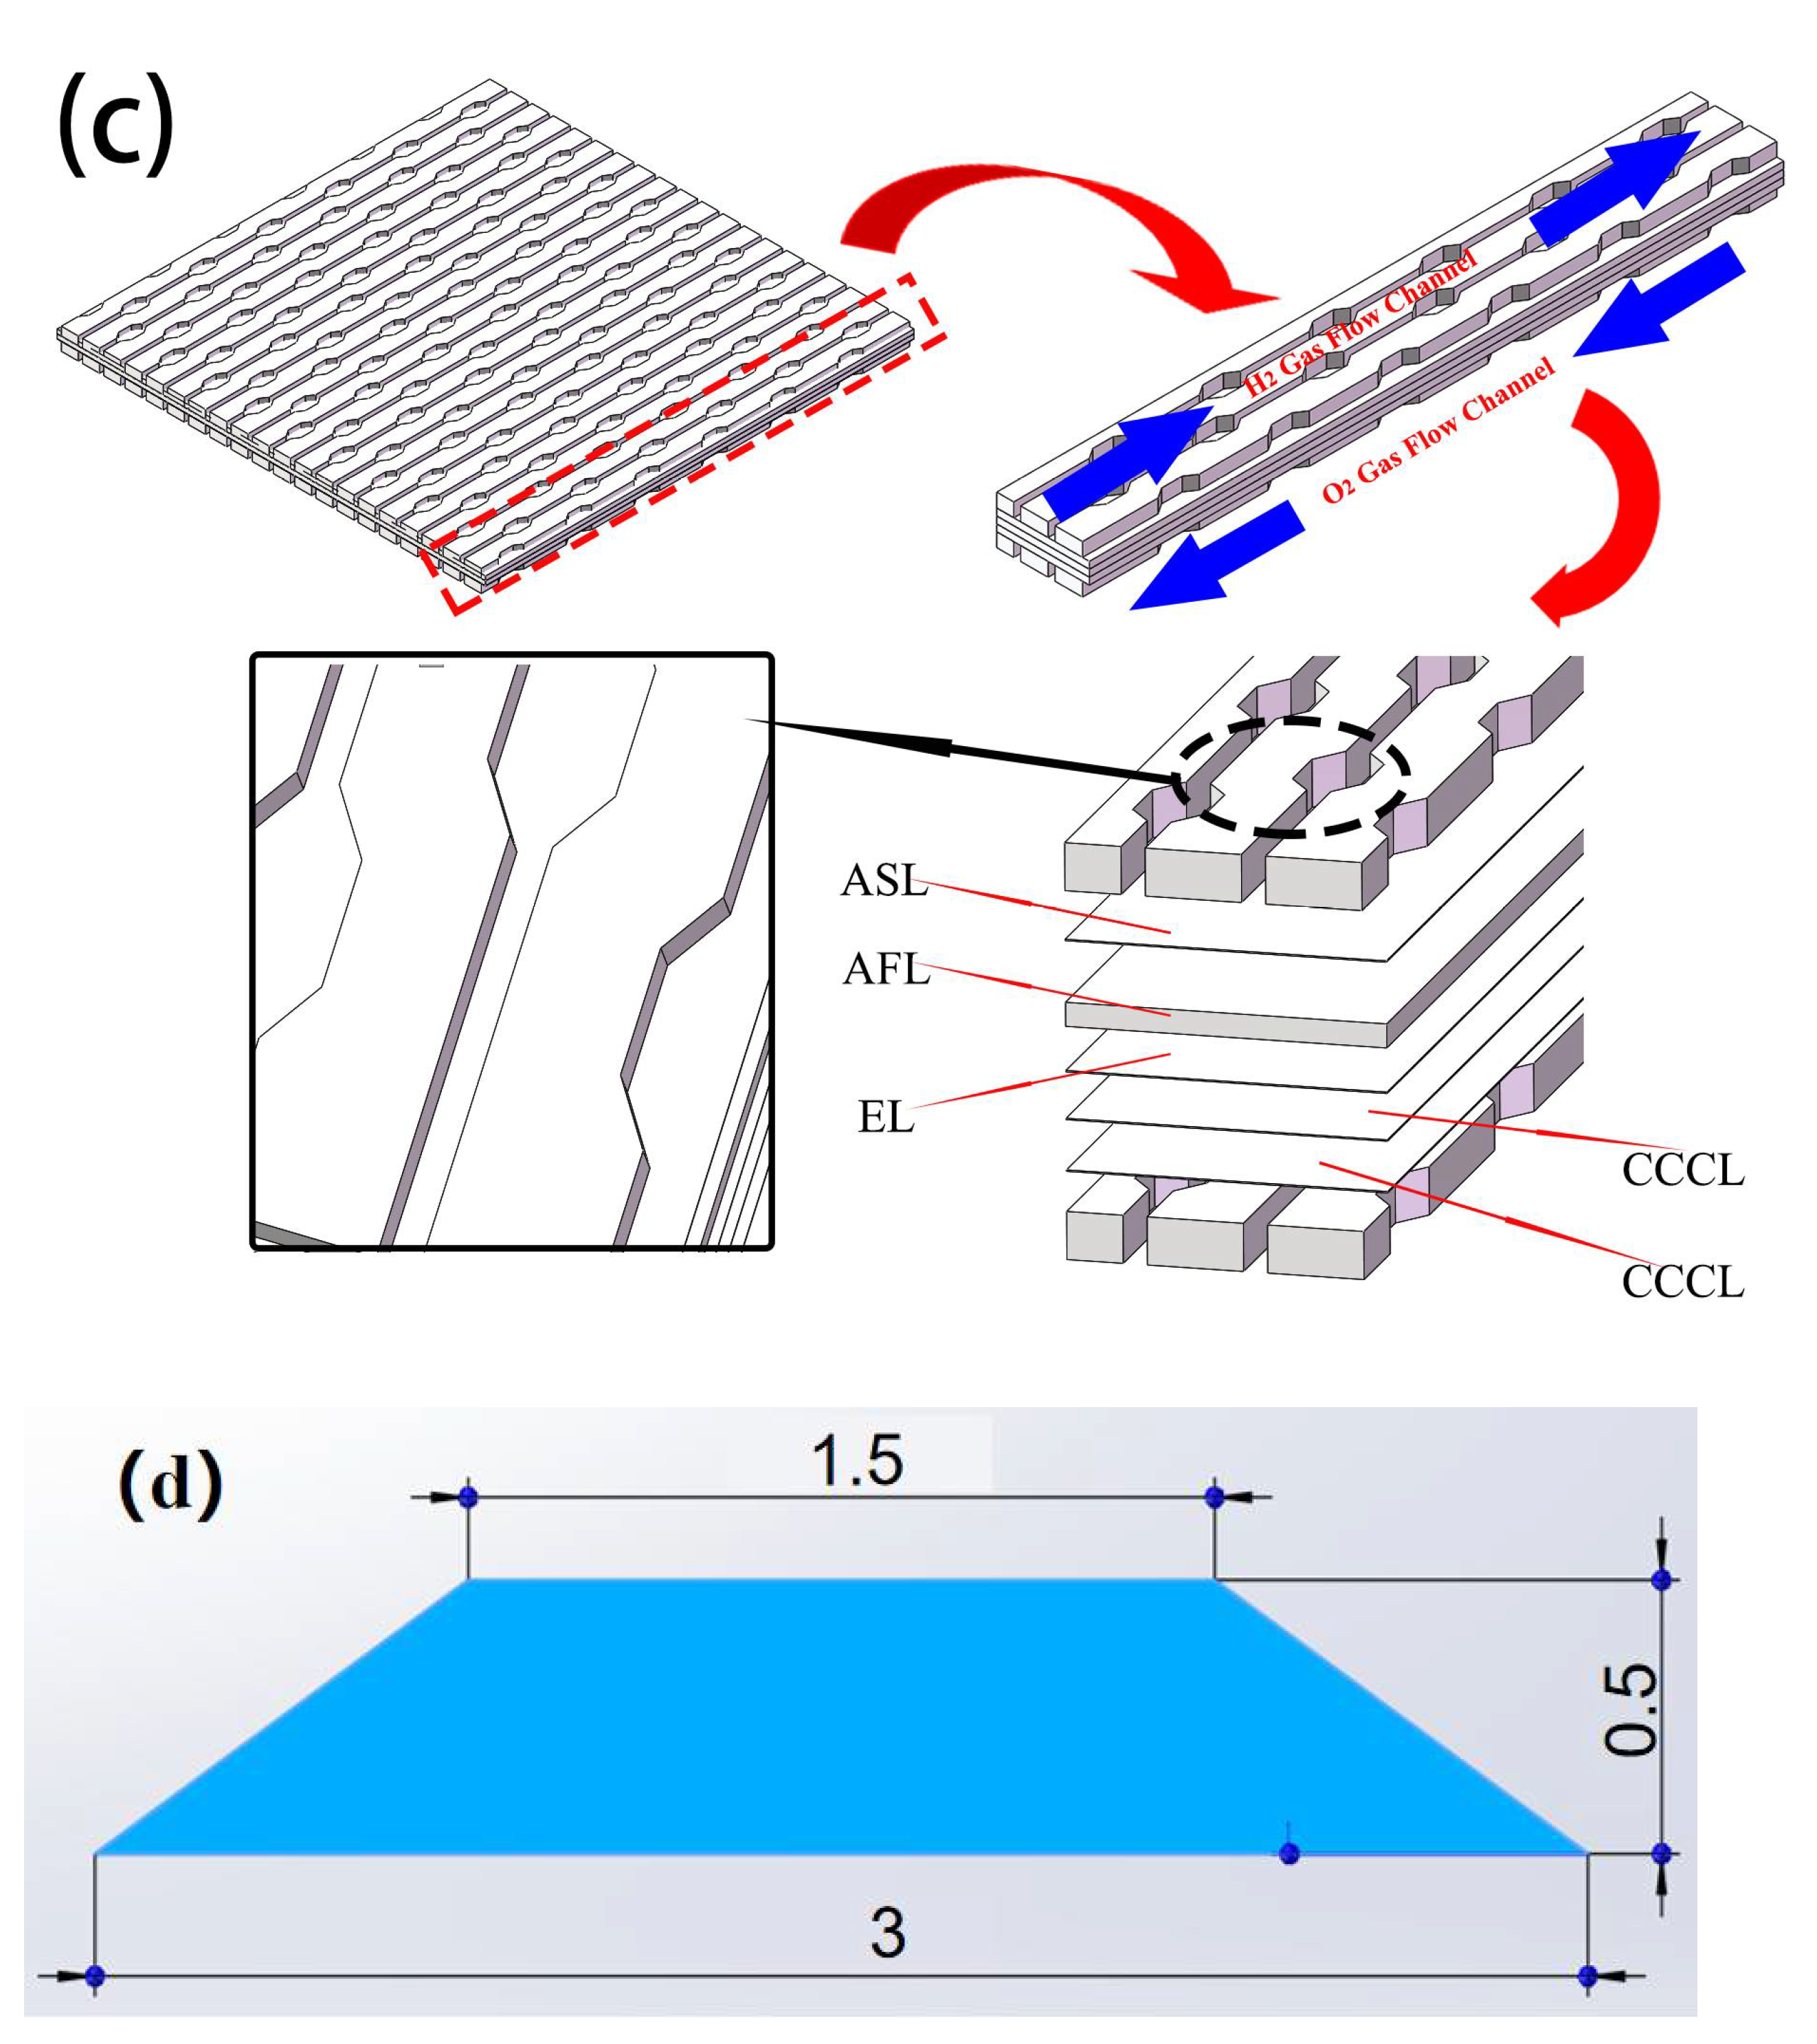
2.3. Classic and Curved SOFC Model

As shown in Figure 2, the classic co-flow channel SOFC stack model consists of eight parts, namely the cathode current collector layer (CCCL), cathode functional layer (CFL), electrolyte layer (EL), anode-supported layer (ASL), anode functional layer (AFL), air flow path, fuel flow path, and interconnect (IN). The anode material is Ni/8 mol% yttria-stabilized zirconia cermet (NI-YSZ), the electrolyte material is yttria-stabilized zirconia (YSZ), and the cathode material is lanthanum strontium manganite (LSM) [40]. The cathode and anode are porous media, which provide space for the diffusion of reactant gases. The porous electrodes are doped with catalysts, which can catalyze the electrochemical reactions. The electrolyte is a solid that separates air from fuel gases and transports oxygen ions. The interconnect is a solid, and its primary function is to separate the gas flow channels and collect the conduction current. The main parameters of the model are shown in Table 1.
On the basis of the traditional channel, in order to enhance the perturbation effect of the channel structure on the reaction gas, gradually expanding channel and gradually reducing channel designs are proposed, as shown in Figure 3a,c. The main parameters of the model are shown in Table 2. The former expands the flow channel outward to a certain area, and the size of the expansion area is shown in Figure 3b. The latter adds a certain number of blocks to the flow channel, and the blocks in the flow channel are interleaved. The detailed geometric dimensions of the blocks are shown in Figure 3d.

2.4. Boundary Conditions

The key boundary conditions and material property parameters in this model are shown in Table 3 and Table 4. In addition to the boundary conditions added in the table, the positive connector is grounded (the potential of the outer surface is 0), and the electrical potential of the outer surface of the negative connector is set to the working electrical pressure (set to 0.9 V in this study). Symmetrical conditions are applied to all outer conditions of the model, while continuous current and potential conditions are adopted by default for inner boundaries. In the heat transfer model, the surfaces and sides of the upper and lower connectors are set as symmetrical conditions, and the walls are set as non-slip walls.

3. Analysis of Classical Channel Structure

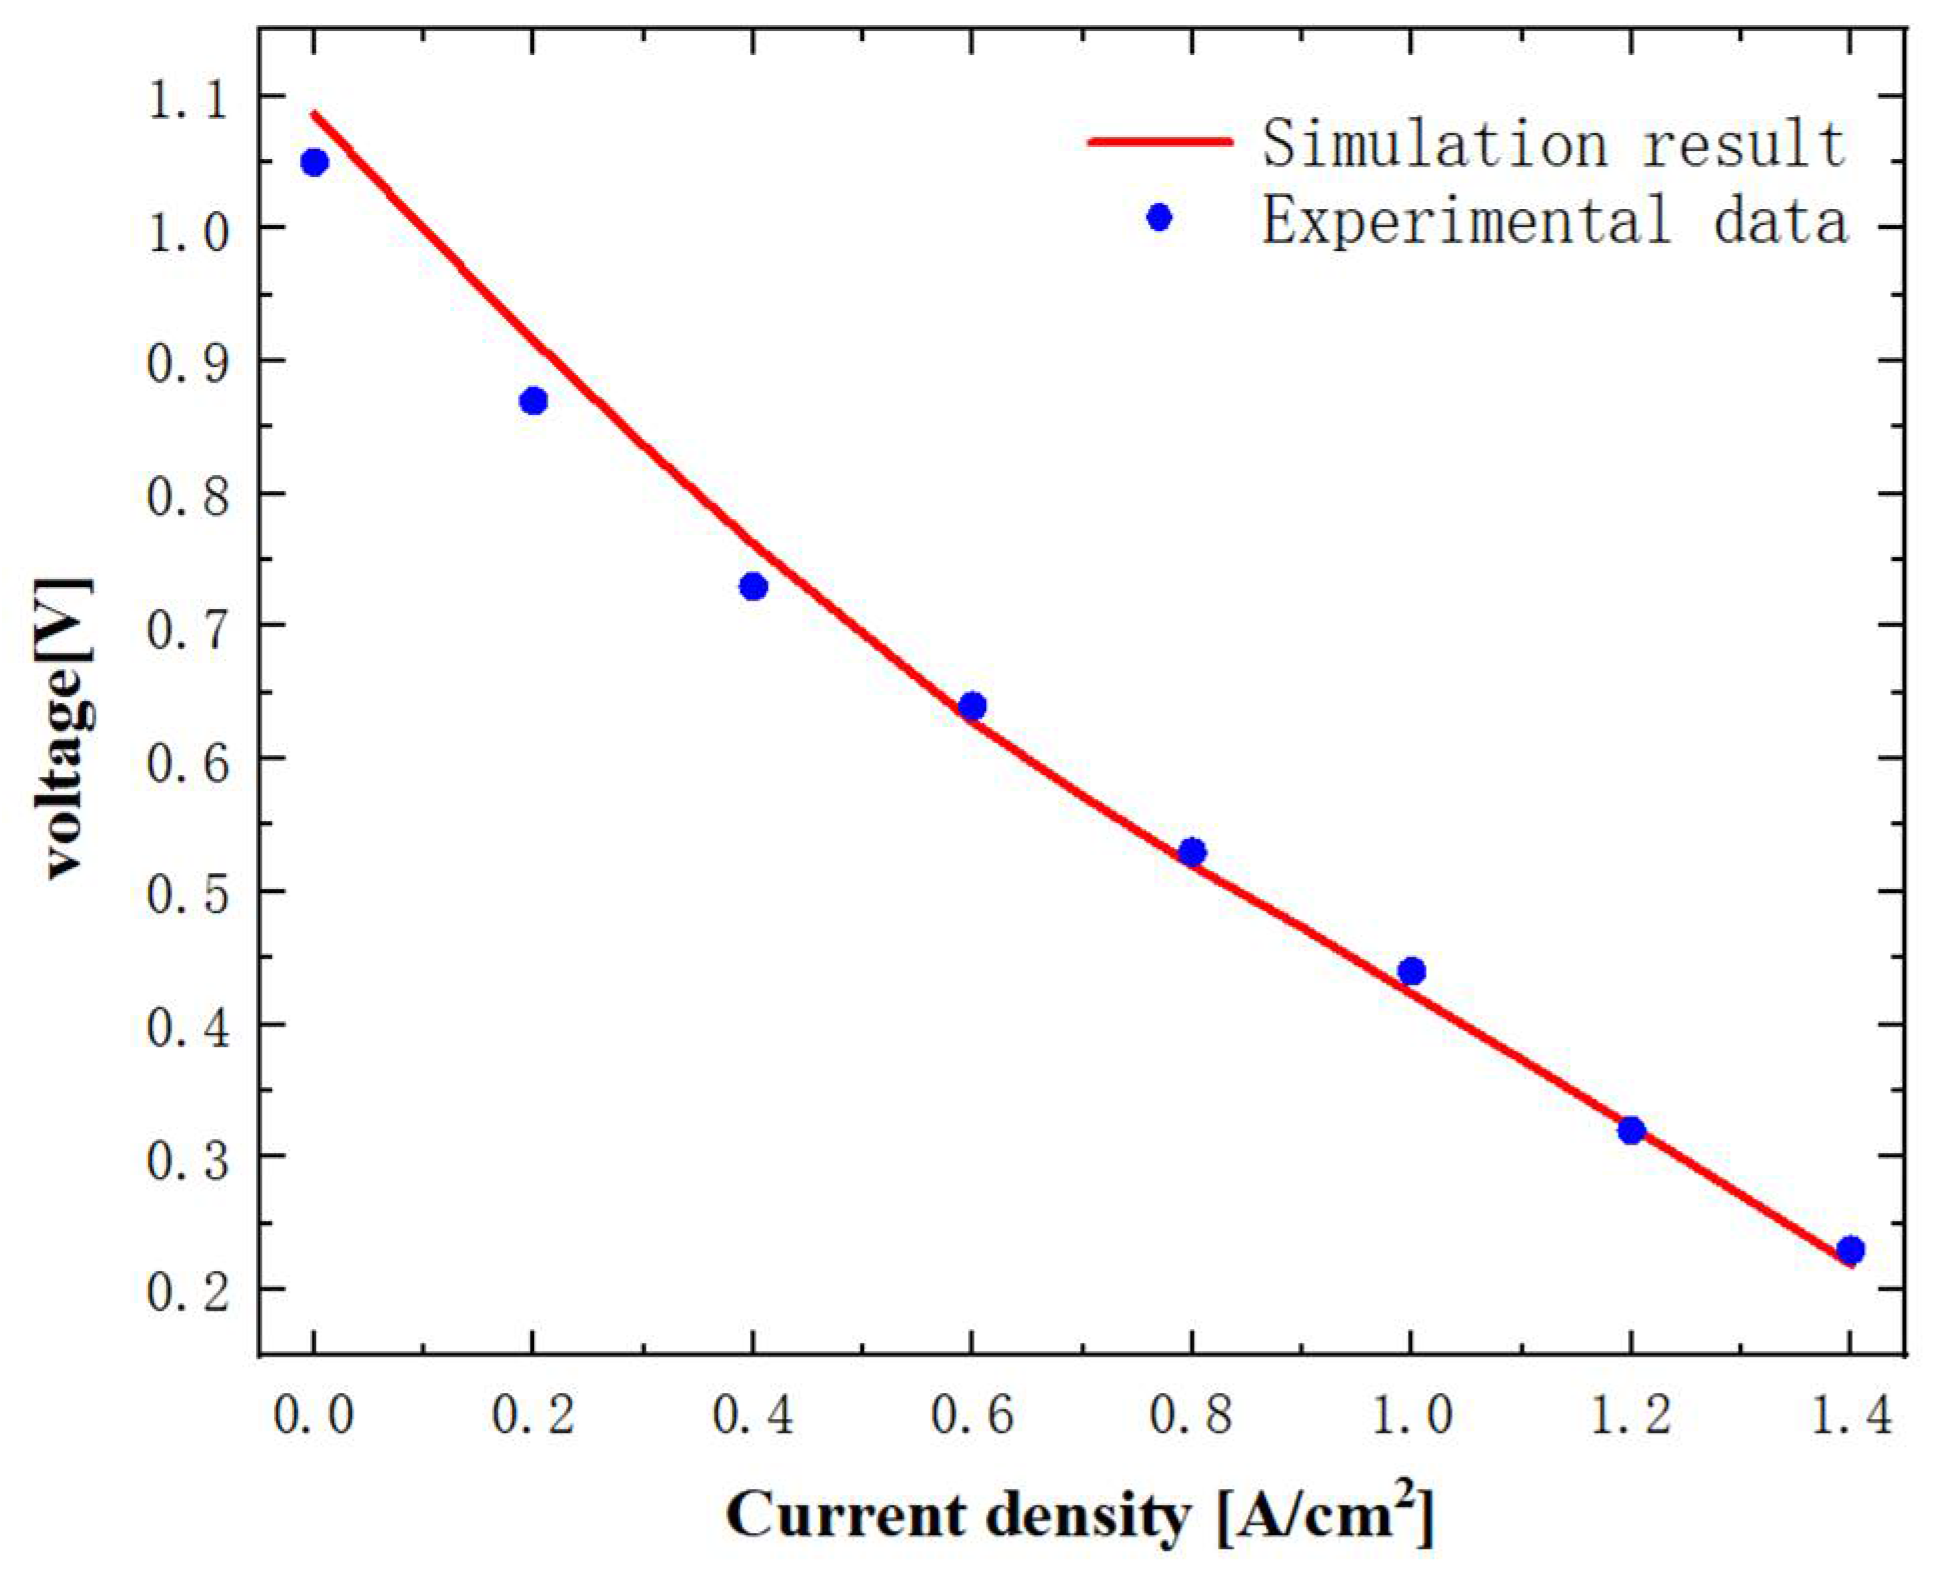
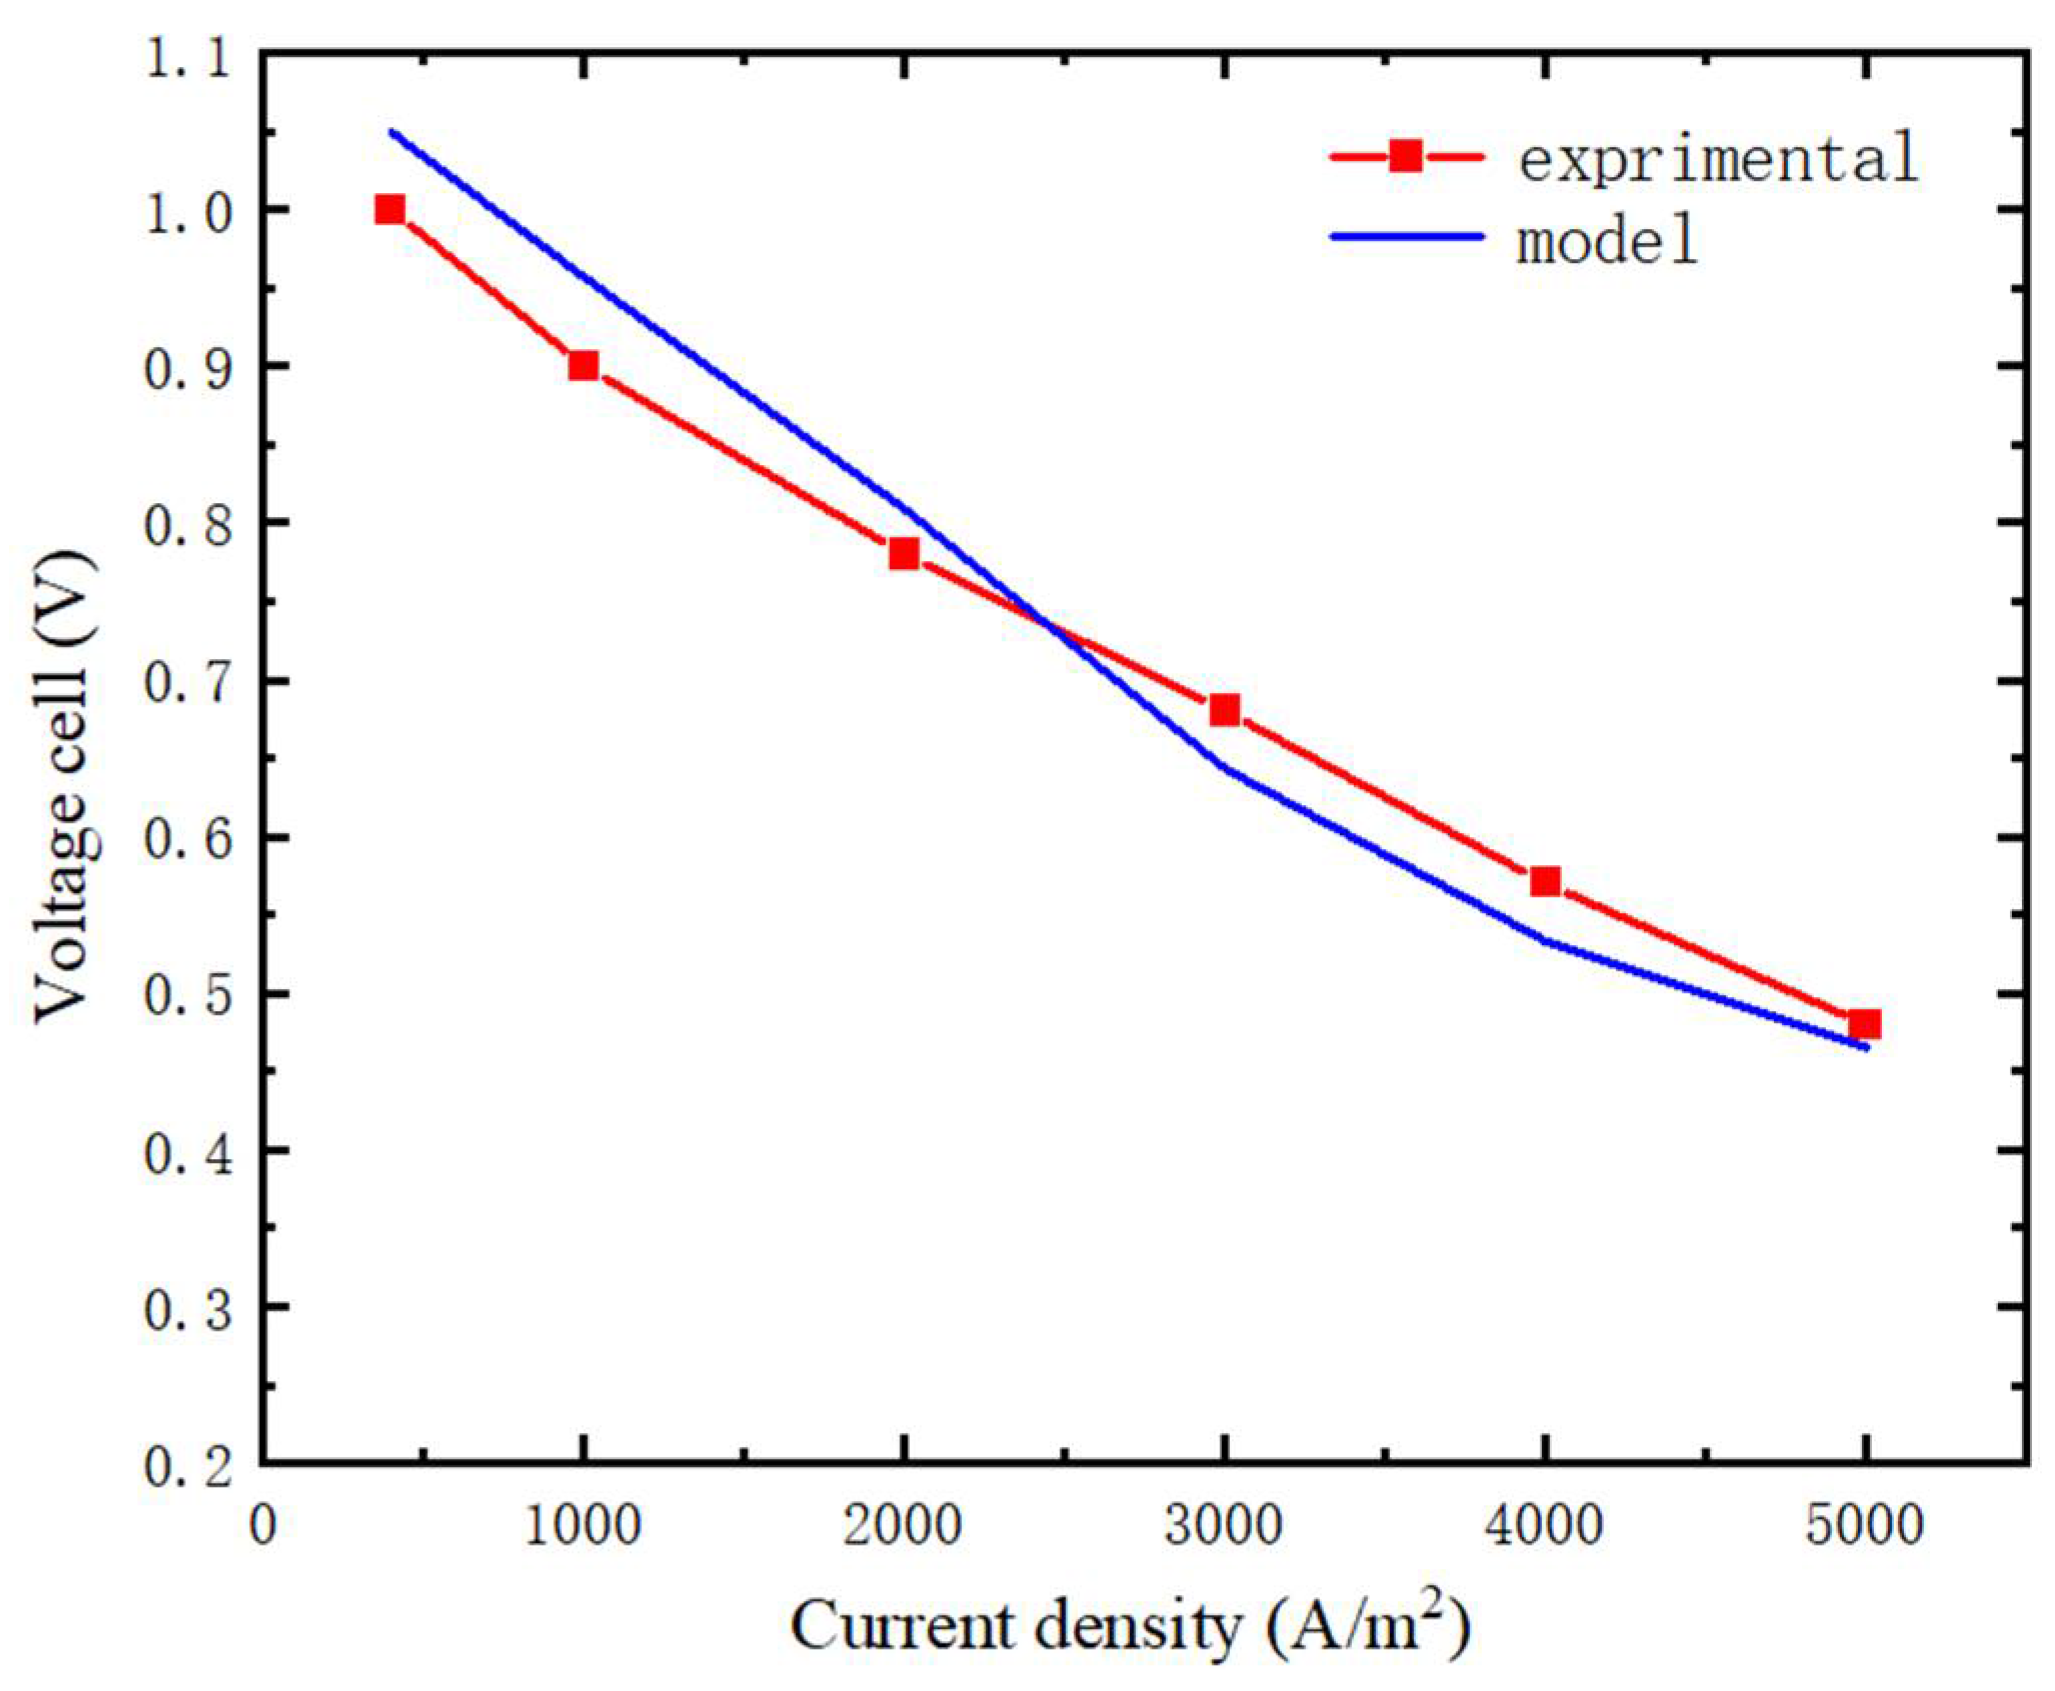
3.1. Model Verification

To ensure the accuracy of this model, we needed to compare the polarization curve predicted by the CFD model with the experimental data from ref. [43]. The boundary conditions in ref. [43] were used to verify the accuracy of the model. The outlet and inlet temperatures were 750 K, anodal flow rate 400 N mL/min, and cathode flow rate 1000 N mL/min. The polarization curve is shown in Figure 4. The results indicate that the error between the numerical results and the experimental results is about 6.8%. The error between the simulation results and the experimental data falls within a reasonable range. Therefore, this model demonstrates sufficient accuracy.
The boundary conditions in Table 4 (from ref. [44]) were set, where the inlet air temperature was 1073 K and inlet fuel temperature was 875 K, and we compared the cell voltages of the experiment and the model as a function of the SOFC current density at 800 °C. The potential range was selected based on the available experimental data. As shown in Figure 5, the maximum error of the experiment and the model was 6.5%, which was within the maximum error range, again verifying the accuracy of the model in this article.

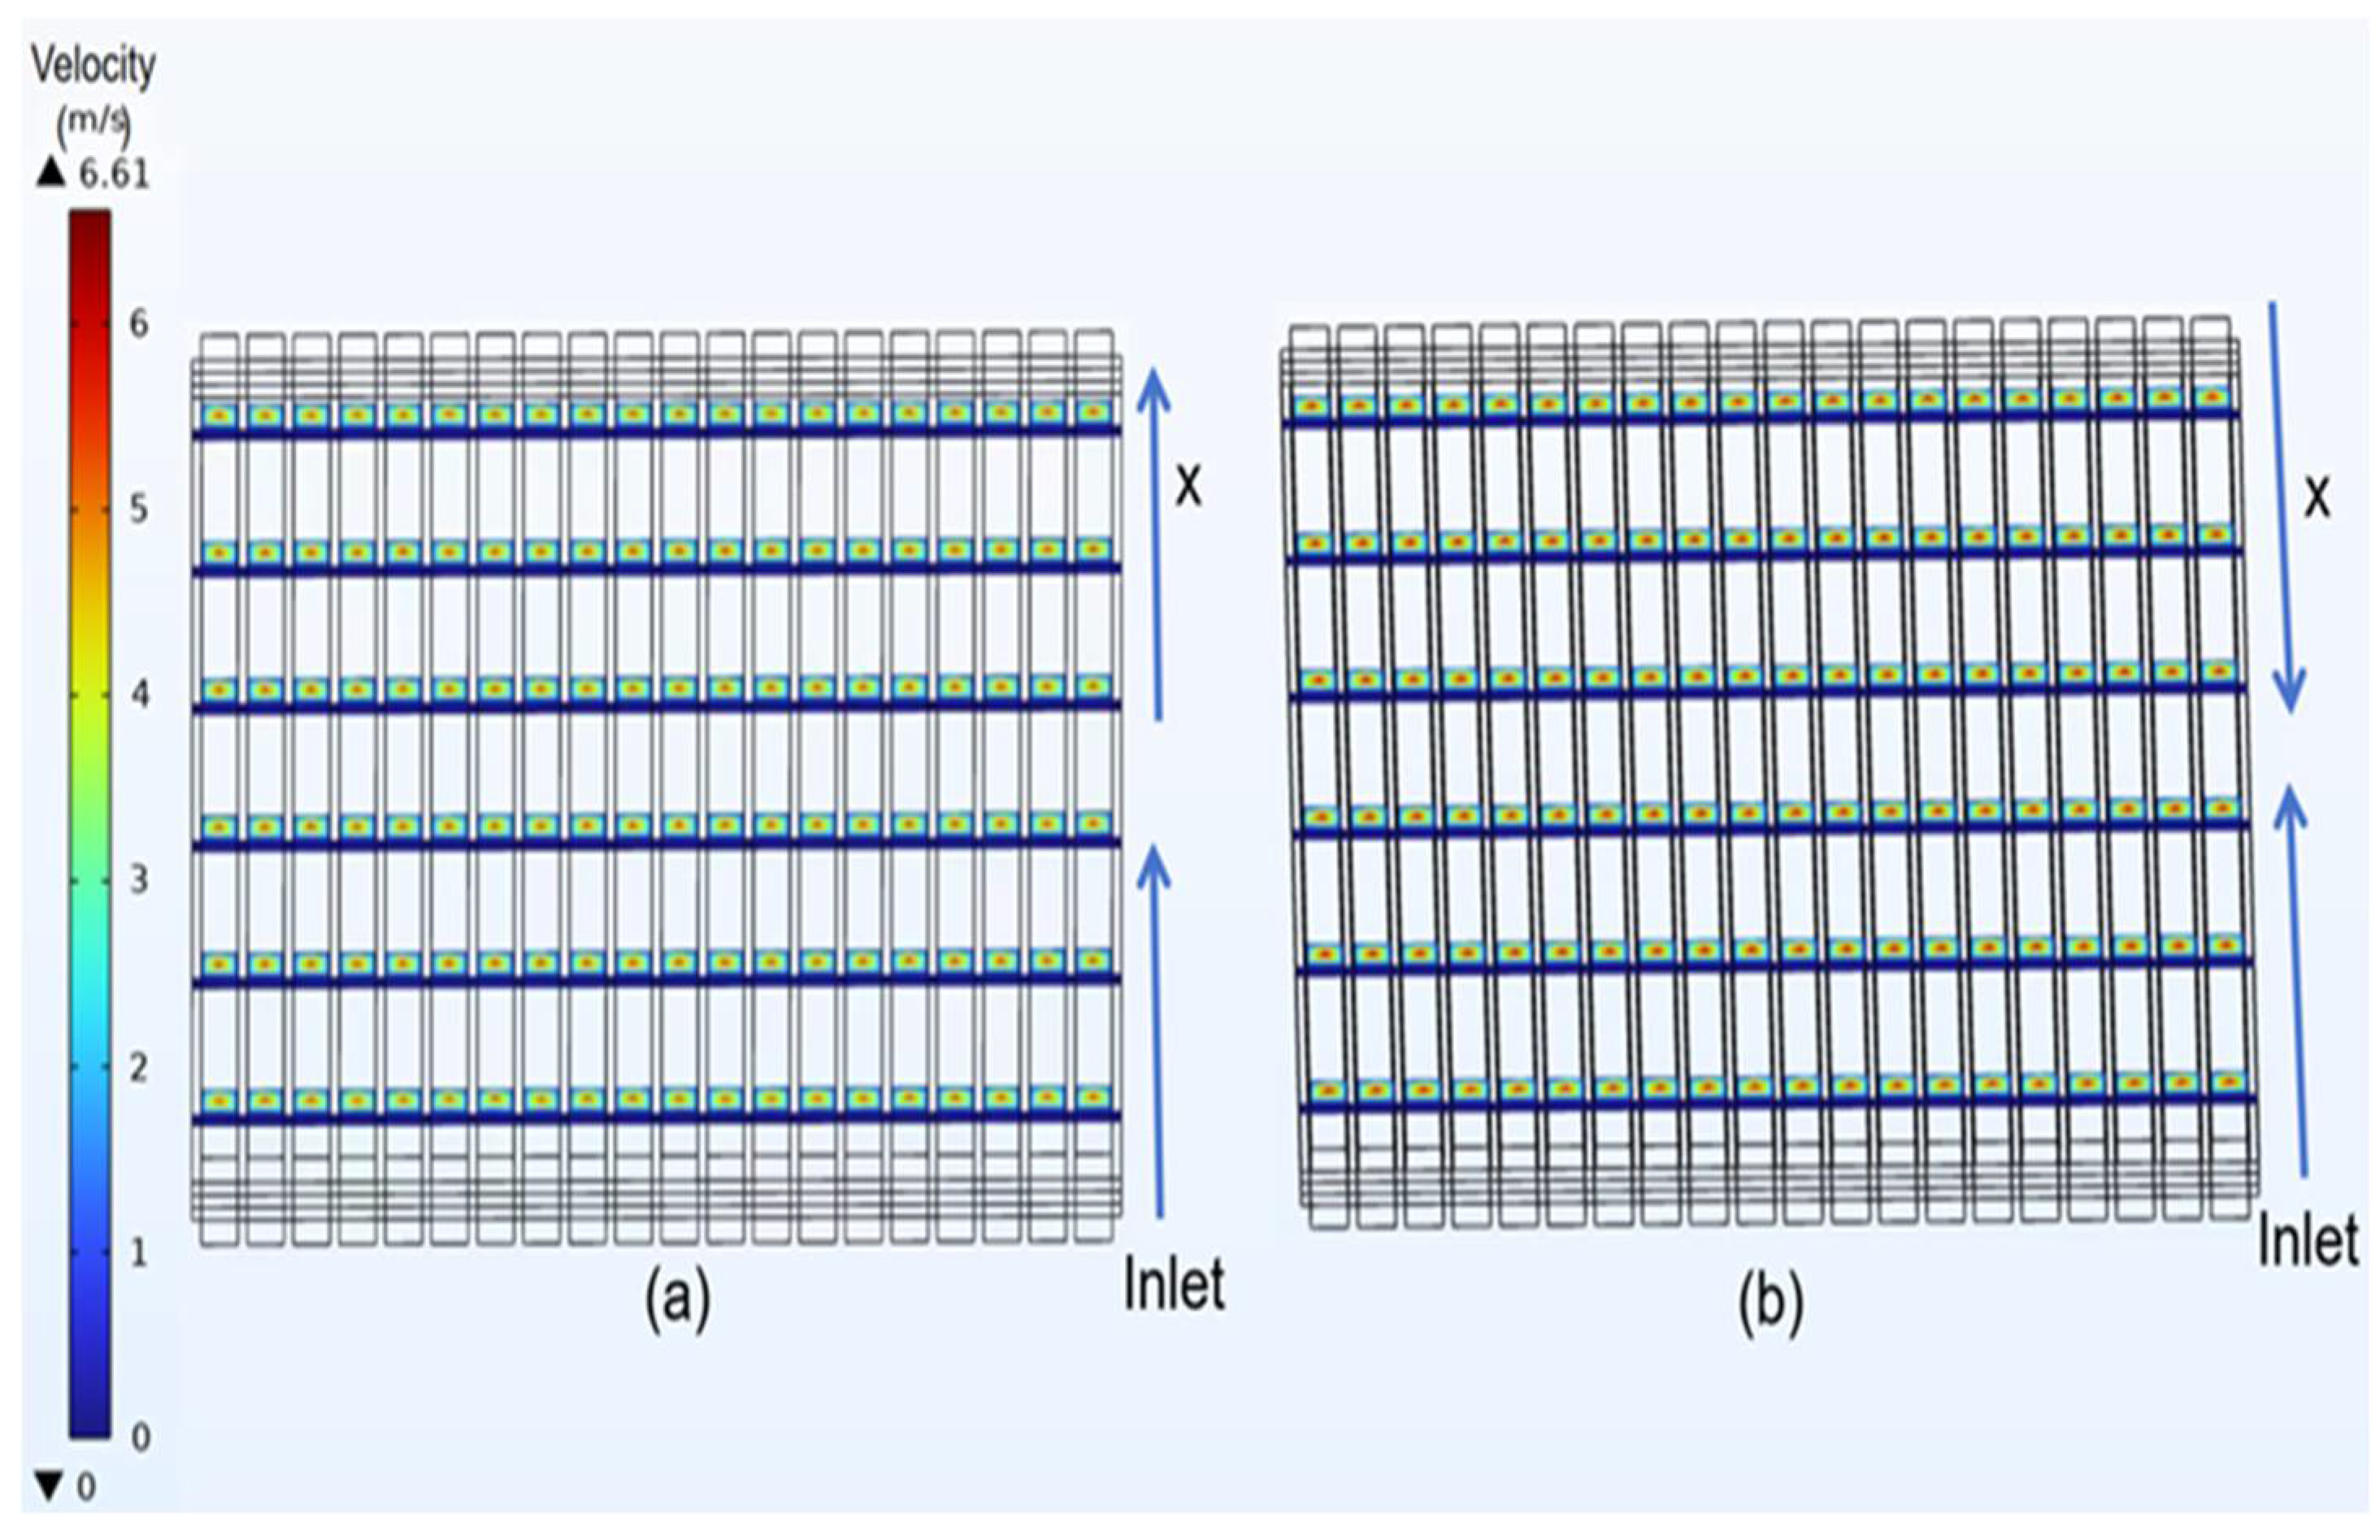
3.2. Velocity Distribution of Classical Model

Figure 6a shows the velocity distribution of the anode co-flow channel. Hydrogen flowed in from the lower inlet and out of the upper outlet. Figure 6b shows the velocity distribution of the anode counter-flow channel, with hydrogen flowing in from the lower inlet and flowing out of the upper outlet. The results showed the velocity distribution in the anode channel, where the anode inlet velocity was set at 2.5 m/s. In the center of the anode channel, the velocity could reach 4.7 m/s. The velocity on the surface of the anode channel was about 0.5 m/s, while the velocity between the flow channel and the AFL was about 1 m/s, which was reduced by 78.7% compared to the center velocity. In addition, the velocity of hydrogen decreased gradually from the center of the flow channel to the wall of the flow channel. Due to the influence of the gas viscosity coefficient, a boundary layer was formed on the surface of the flow channel, which caused the surface velocity to slow and the center velocity to accelerate. When the gas moved toward the AFL, the diffusion of the hydrogen was hindered by the permeability of the AFL, resulting in a decrease in the velocity within the AFL.
Figure 7a shows the velocity distribution of the cathode co-flow channel. Air flowed in from the lower inlet and out of the upper outlet. Figure 7b shows the velocity distribution of the cathode counter-flow channel, with air flowing in from the lower inlet and out of the upper outlet. The results show the velocity distribution within the cathode channel, where the cathode inlet velocity was set to 1.5 m/s. The center of the flow channel was 6.3 m/s. The velocity decreased when approaching the CCCL. The velocity between the cathode channel and the CCCL was reduced to about 1.5 m/s, which was 76.2% lower than the maximum velocity in the cathode channel. The reason for this is the same as for the anode. In general, the velocity of the cathode was higher than that of the anode, and air was chosen as the main cooling method. By controlling the flow rate of air in the cathode flow channel, convection heat transfer was carried out to cool the flow channel. This showed that the counter-flow channel was more favorable to the SOFC reaction and improves the efficiency of the SOFC.

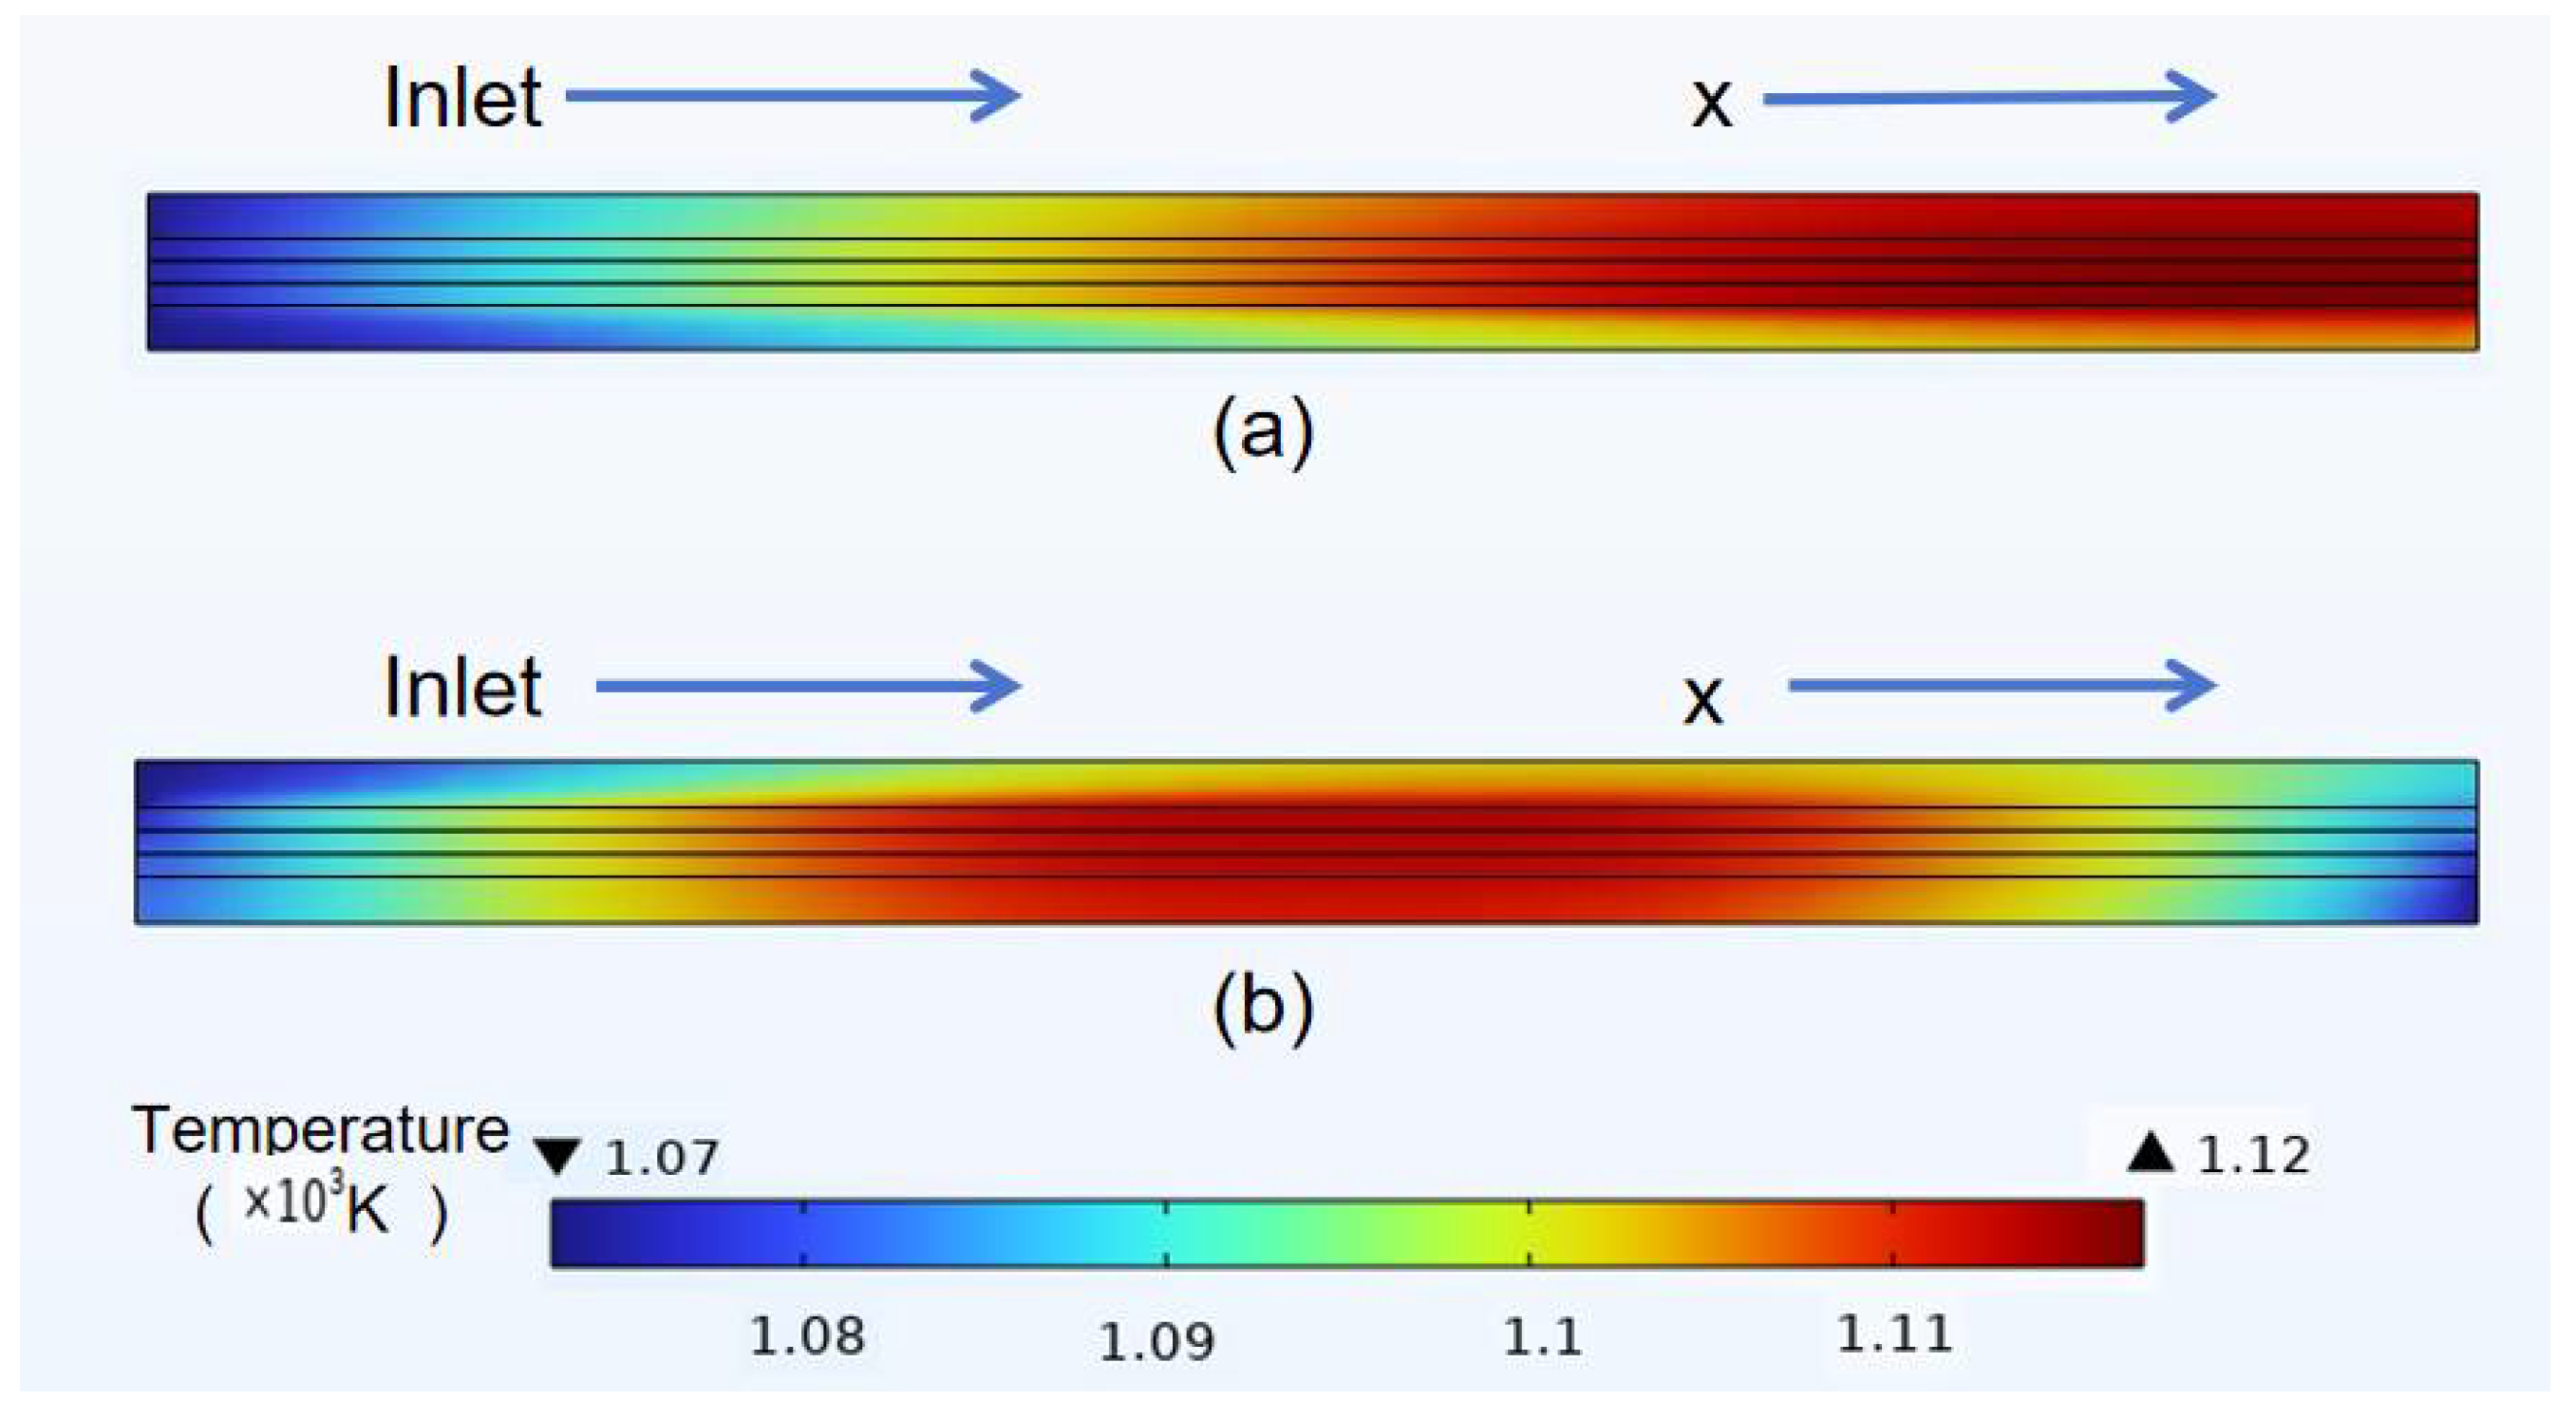
3.3. Temperature Distribution of Classical Model

Figure 8a and Figure 9a give surface temperature diagrams of the anode co-flow channel. Hydrogen flowed in from the left inlet and out of the right outlet. In the co-flow channel, the temperature gradually increased along the fuel flow direction, reaching the highest temperature at the hydrogen outlet. The lowest temperature was 1070 K, and the highest temperature could reach 1120 K. In a counter-flow channel, the temperature gradually increased from the fuel inlet to the center of the channel, then decreased from the center of the channel to the fuel outlet. The inlet temperature of the anode was 1070 K, the outlet temperature of the anode was about 1090 K, and the highest intermediate temperature was 1120 K. The phenomenon of a low temperature on both sides and high temperature in the middle was formed. In a co-flow field, the temperature gradually increased as the chemical reaction proceeded, so the highest temperature was located at the outlet. In a counter-flow field, air entered as a cooling gas, forming convection with the hydrogen and absorbing some of the heat generated by the reaction. Therefore, convection heat transfer between high-temperature hydrogen and low-temperature air reduced the temperature of the hydrogen outlet, resulting in the highest temperature appearing in the middle of the hydrogen channel.
A temperature distribution cloud of the co-flow channel and counter-flow channel is shown in Figure 9a,b. Due to the cooling effect of air in the counter-flow channel, the temperature distribution of the SOFC is more uniform, and the peak temperature is lower than that in the co-flow channel. The results show that the counter-flow channel is more favorable to the SOFC reaction than the co-flow channel, thus improving the SOFC efficiency.

3.4. Species Distribution of Classical Model

Figure 10a shows the distribution of the mole fraction on the surface of the anode co-flow channel. Hydrogen flowed in from the left side and out of the right side. Figure 10b shows the distribution of the mole fraction on the surface of the anode counter-flow channel, with hydrogen flowing in from the left and out of the right. The initial value of the hydrogen mole fraction was set at 0.95. The hydrogen mole fraction was the largest when it flowed in from the inlet, and it gradually decreased with the diffusion and reaction of hydrogen. When hydrogen flowed out of the right outlet, the mole fraction reached the minimum value. According to the comparative analysis of Figure 10a,b, the two hydrogen mole fractions at the inlet end were the same, but the two hydrogen mole fractions at the outlet end differed for the counter-flow channel and the co-flow channel. The hydrogen mole fraction at the outlet of the co-flow channel was about 0.88, while the hydrogen mole fraction at the outlet of the counter-flow channel was approximately 0.875. The lower the hydrogen mole fraction, the more adequate the SOFC reaction.
Figure 11a shows the distribution of the mole fraction on the cathode co-flow channel. Oxygen flowed in from the left and out of the right. Figure 11b shows the distribution of mole fraction on the cathode counter-flow channel. Oxygen flowed in from the right and out of the left. The initial oxygen molar fraction was set to 0.21. The molar fraction of oxygen was the largest when it entered through the inlet, and it gradually decreased as the oxygen diffused and the reaction proceeded. When oxygen flowed out of the outlet, the mole fraction reached its minimum value. In the comparative analysis of Figure 11a,b, the oxygen mole fractions at the inlet were the same, but the oxygen mole fractions of the counter-flow channel and the co-flow channel at the outlet were different. The oxygen molar fraction of the outlet co-flow channel was about 0.19, and the oxygen molar fraction of the counter-flow channel was about 0.186. Due to the more complete SOFC reaction, the molar fraction of oxygen was lower. The counter-flow channel was more conducive to the SOFC reaction and the improvement of SOFC efficiency.

4. Analysis of Curved Channel Structure

4.1. Velocity Distribution of Curved Model

Figure 12a gives the distribution of expanding anode counter-flow velocity, with hydrogen flowing in from the lower inlet and out of the upper outlet. Figure 12b illustrates the distribution of reducing anode counter-flow velocity. Hydrogen flowed in from the lower inlet and out of the upper outlet. This aligned with the trend observed in Figure 6b. When comparing Figure 6b and Figure 12, it can be seen that the central maximum velocity in the optimized models exceeded that of Figure 6. In Figure 12a, the maximum velocity at the center of the expanding anode flow channel reached 4.8 m/s, marking a 2.1% increase from the classical anode flow channel’s central velocity. The center velocity of the reducing anode flow channel peaked at 4.94 m/s, representing a 5% enhancement.
Figure 13a presents the velocity distribution of the expanding cathode counter-flow channel, with oxygen flowing in from the lower inlet and out of the upper outlet. Figure 13b illustrates the velocity distribution of the reduced cathode counter-flow channel. Oxygen flowed in from the upper inlet and out of the lower outlet. These results were consistent with the distribution trend observed in Figure 7b. The flow velocity reached its peak at the center of the channel and gradually decreased around it, approaching zero at CCCL. When compared with Figure 7b and Figure 13, the velocity at the center of the optimized flow channel surpassed that of the classical flow channel, indicating an improved cathode surface velocity and overall performance enhancement for SOFCs. In Figure 13a, the maximum velocity in the expanding cathode flow channel reaches 6.5 m/s, marking a 3.2% increase from the classical cathode flow channel’s central velocity. The maximum velocity in the reducing cathode channel reaches 6.61 m/s, representing a 4.9% improvement.

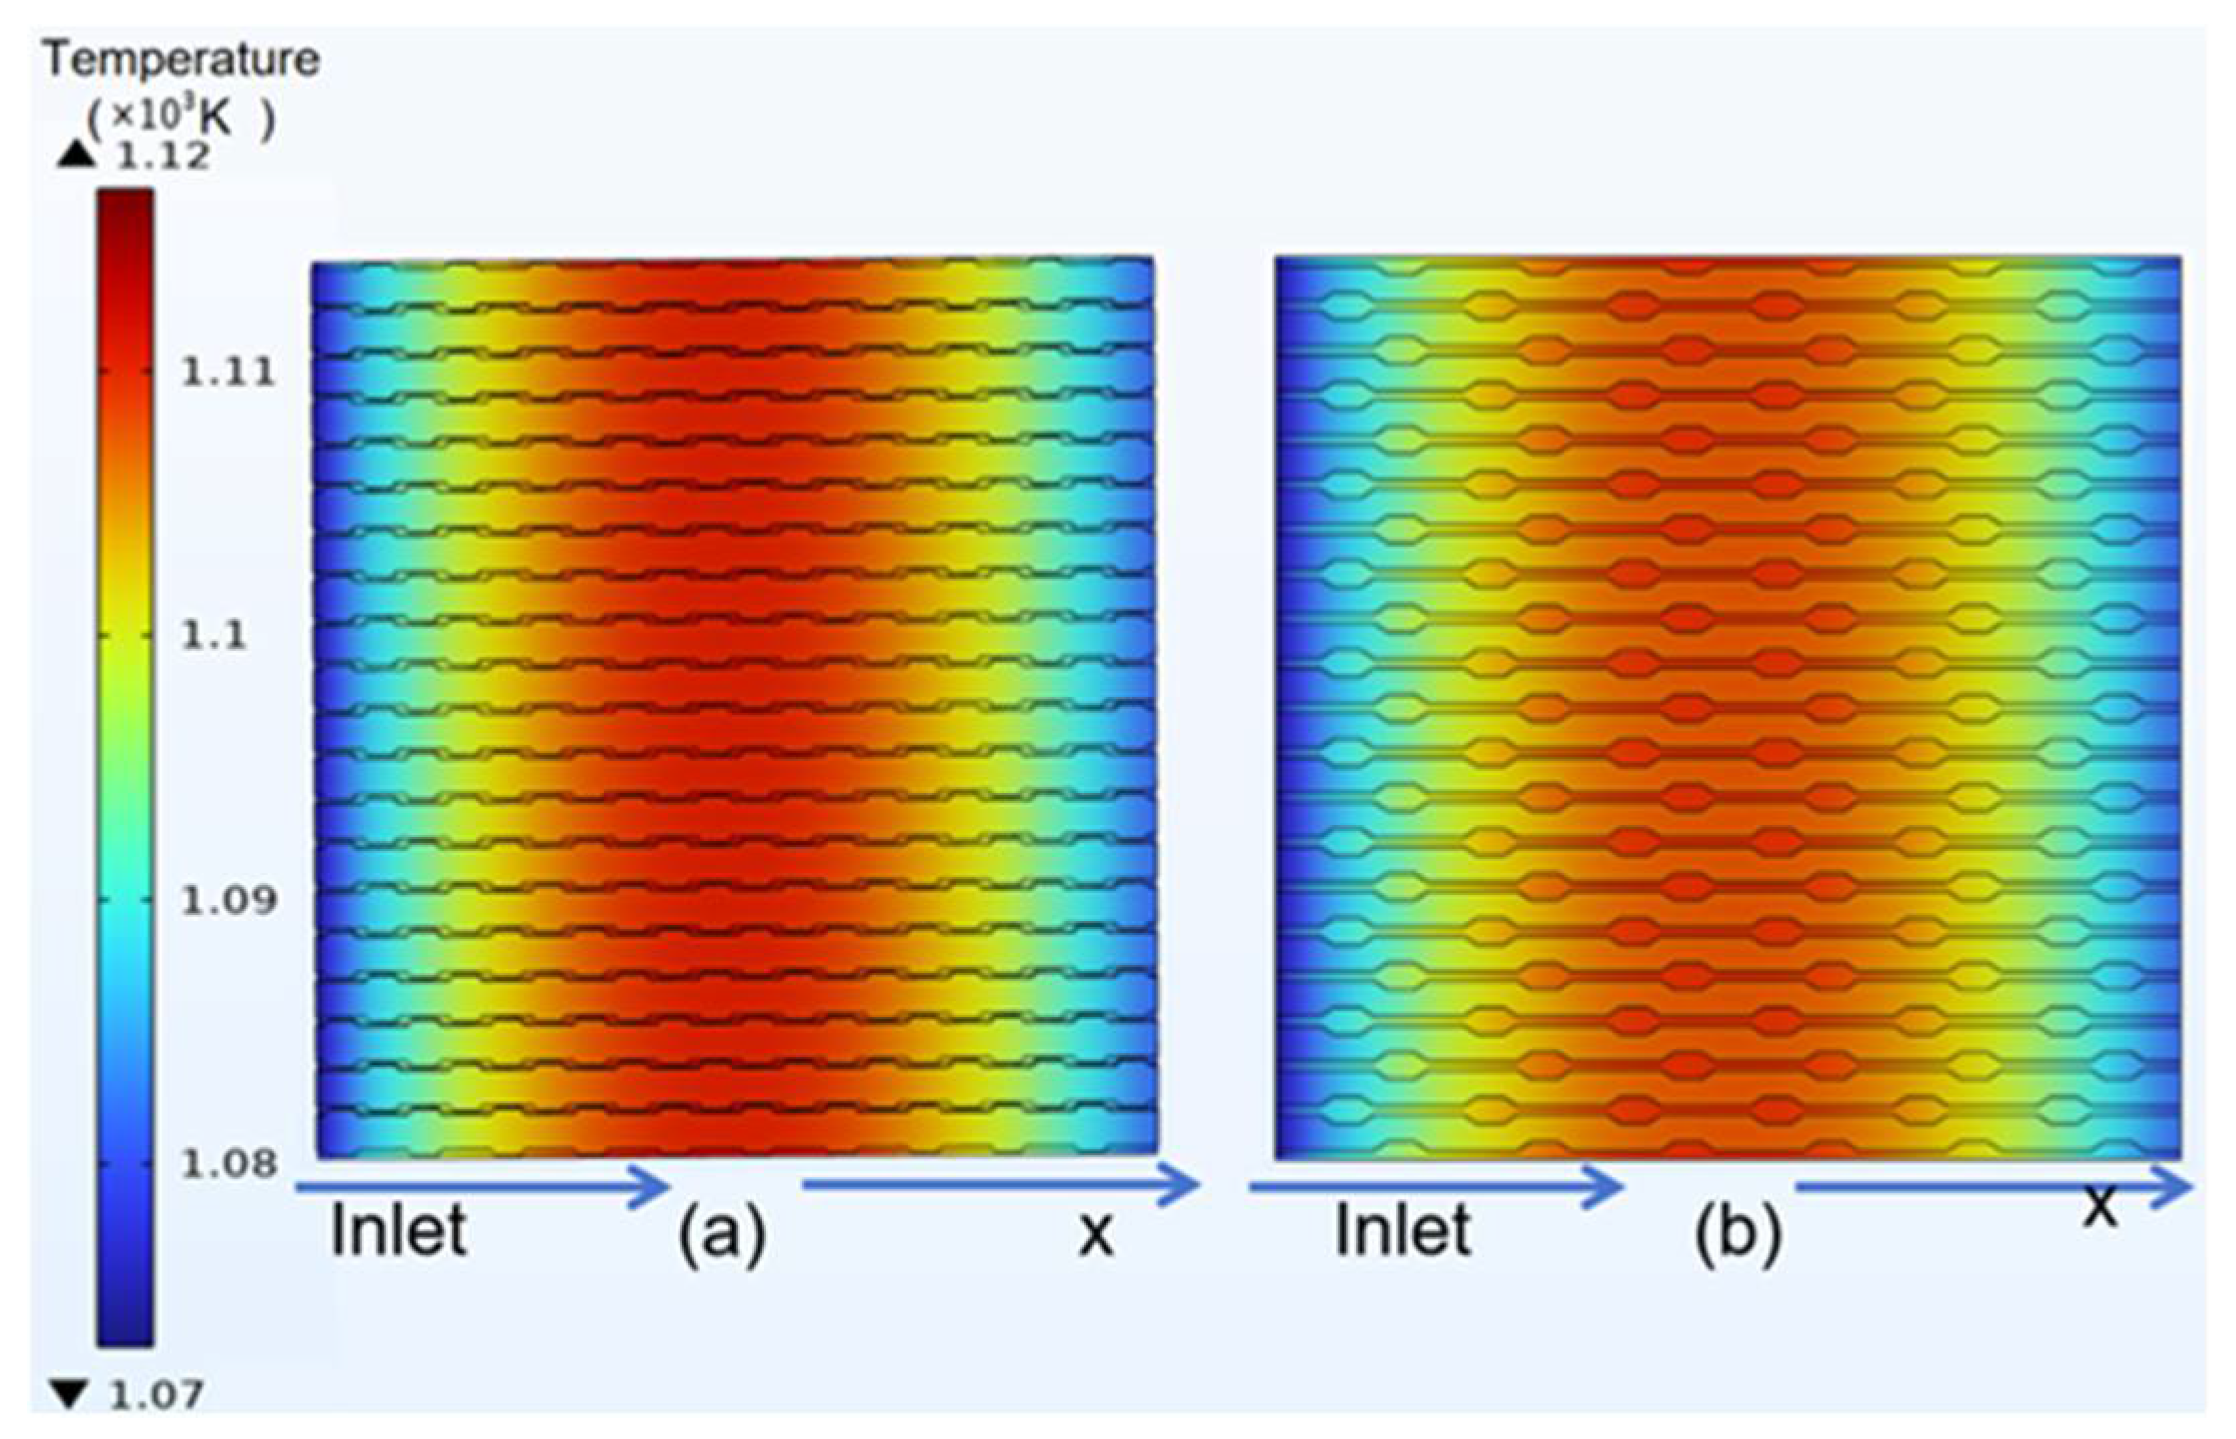
4.2. Temperature Distribution of Curved Model

Figure 14a shows the temperature distribution of the expanding anode counter-flow channel, with hydrogen entering from the left inlet and exiting from the right outlet. Figure 14b illustrates the temperature distribution of the reducing anode counter-flow channel, following the same inlet and outlet direction. Compared to Figure 8b, the temperature distribution of the two optimization models exhibits similarities, with low-temperature regions on both sides and a high-temperature region in the middle. Since air entered as a cooling gas, it absorbed some of the heat generated by the reaction. Consequently, a heat exchange occurred between the high-temperature hydrogen and the low-temperature air at the outlet, resulting in a peak temperature appearing in the middle section of the hydrogen channel. When compared with the classical channel model, the temperatures of the anode channel in the two optimized models were lower, indicating an enhanced adequacy of the hydrogen reaction and improved SOFC efficiency. In Figure 14a, the maximum temperature of the expanded anode channel is 1109 K, which is 0.98% lower than that of the classical channel of 1120 K. The reduced anode channel temperature reached 1106 K, which was 1.3% lower than that of the classical model. The two structures made the fuel cell temperature distribution more uniform.

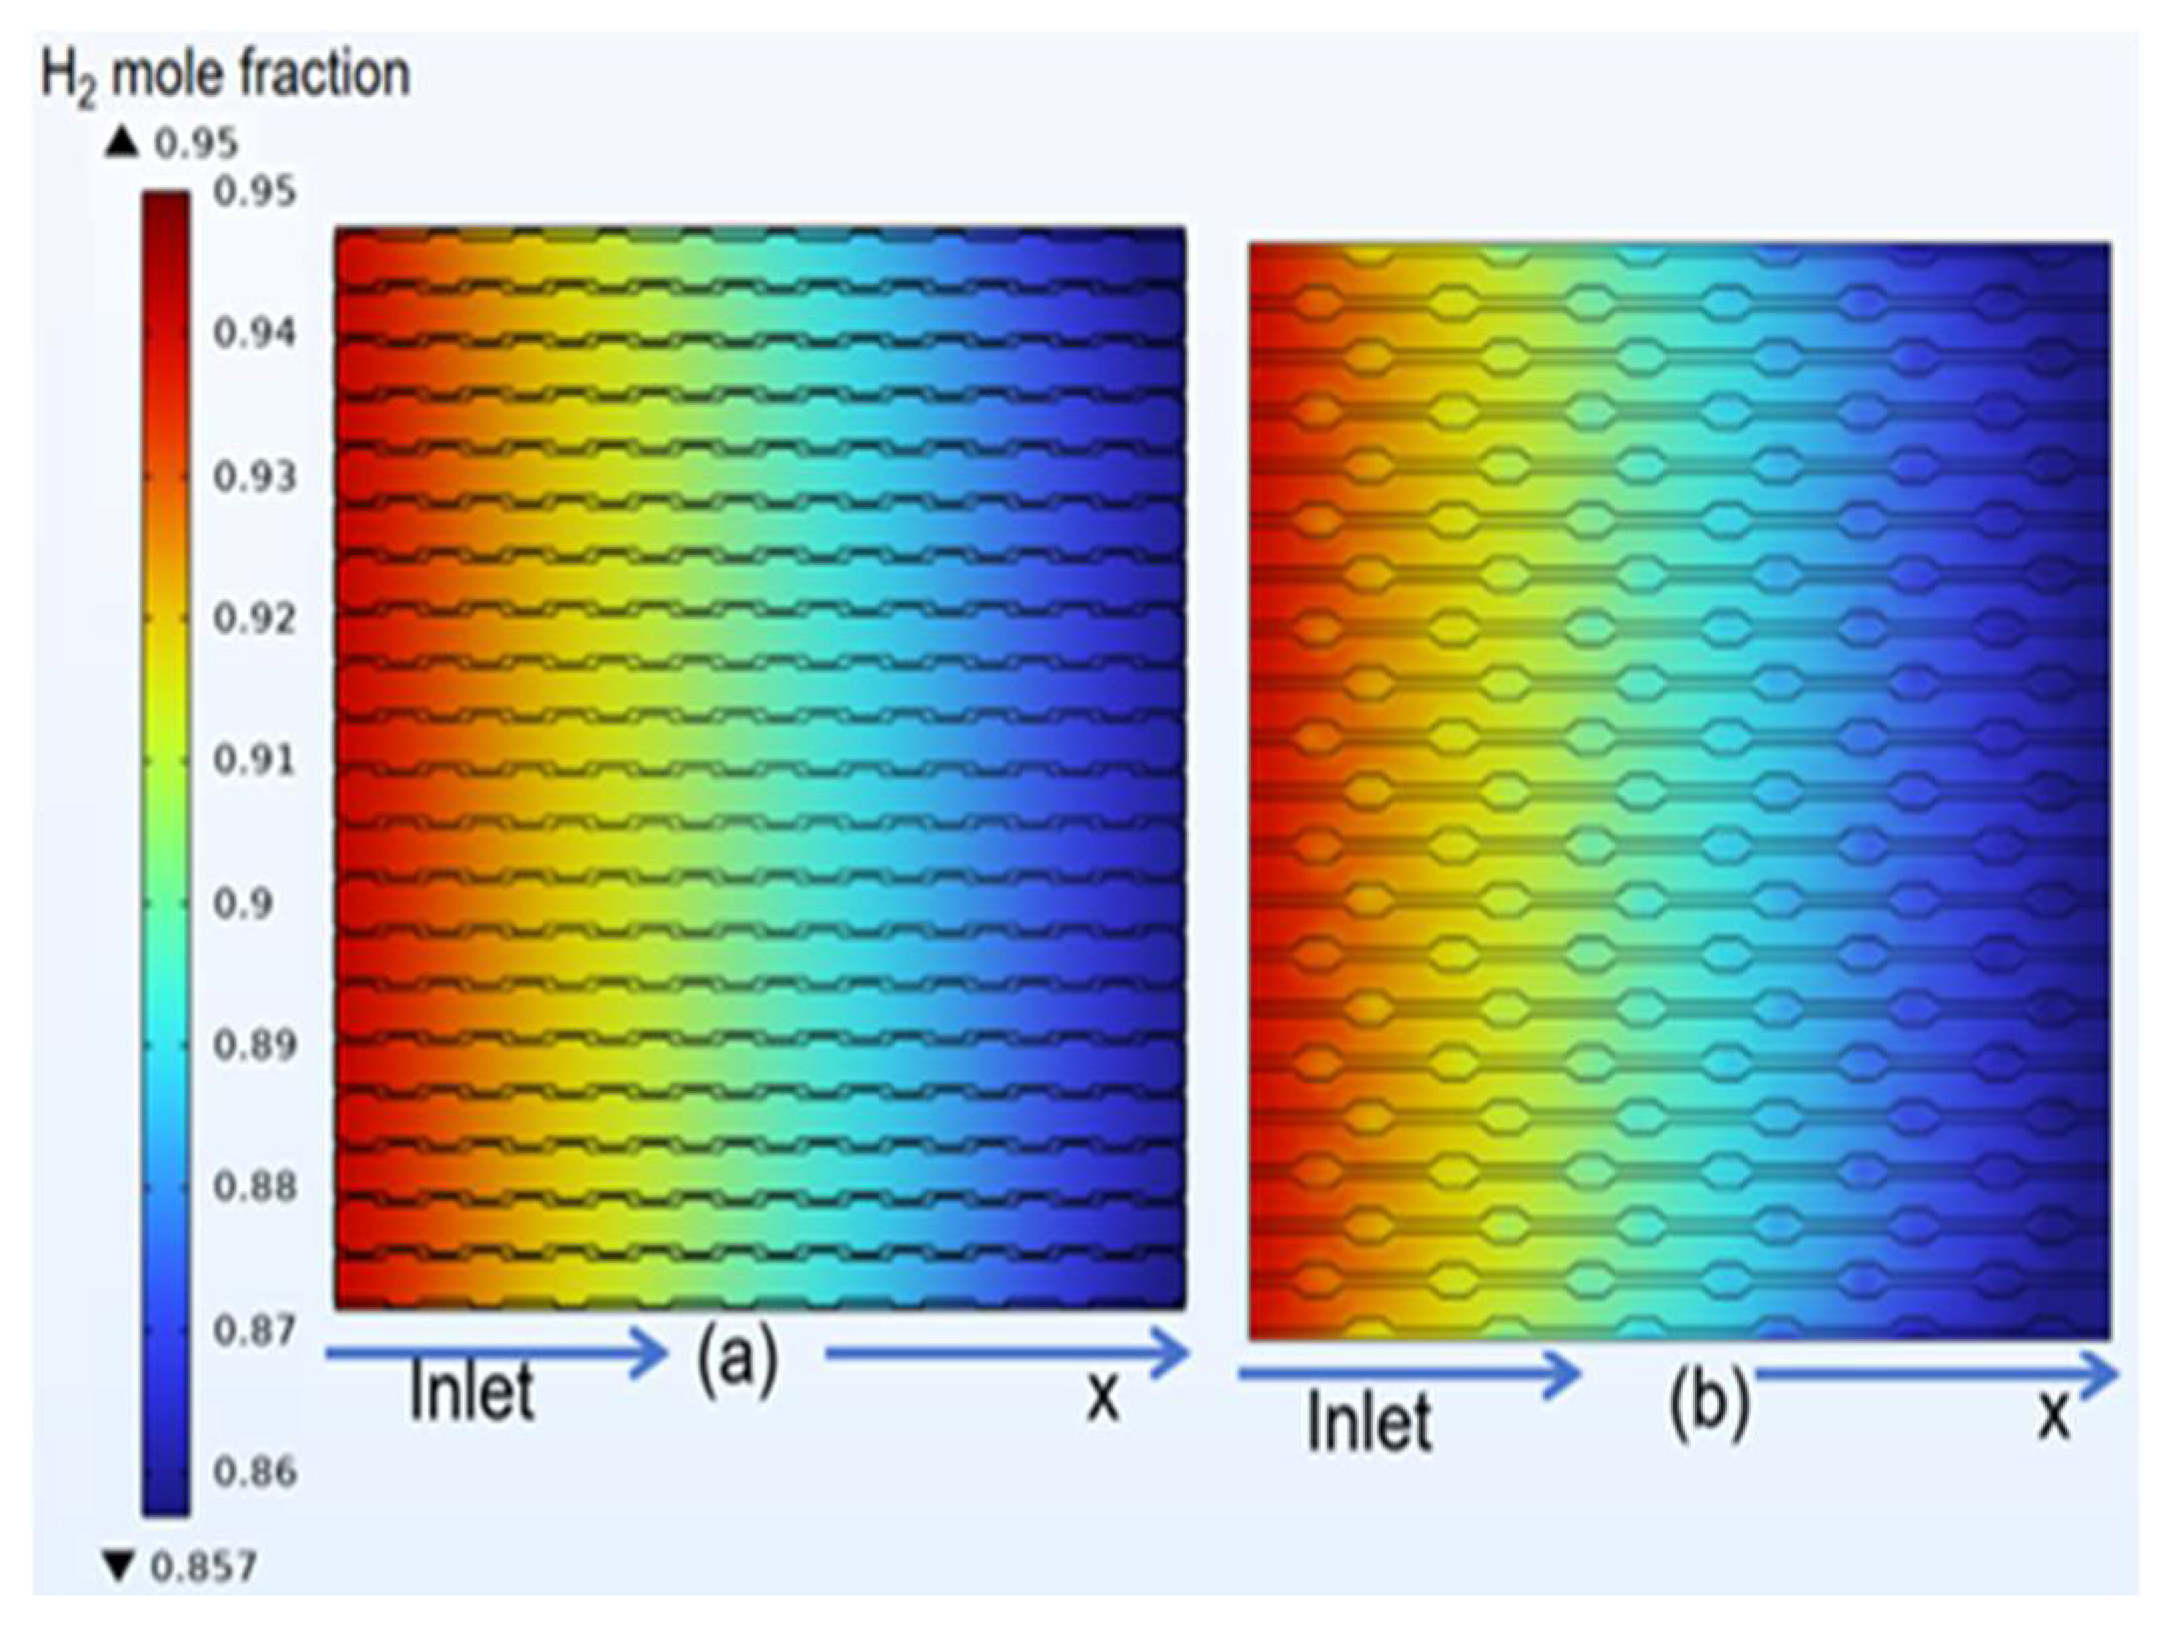
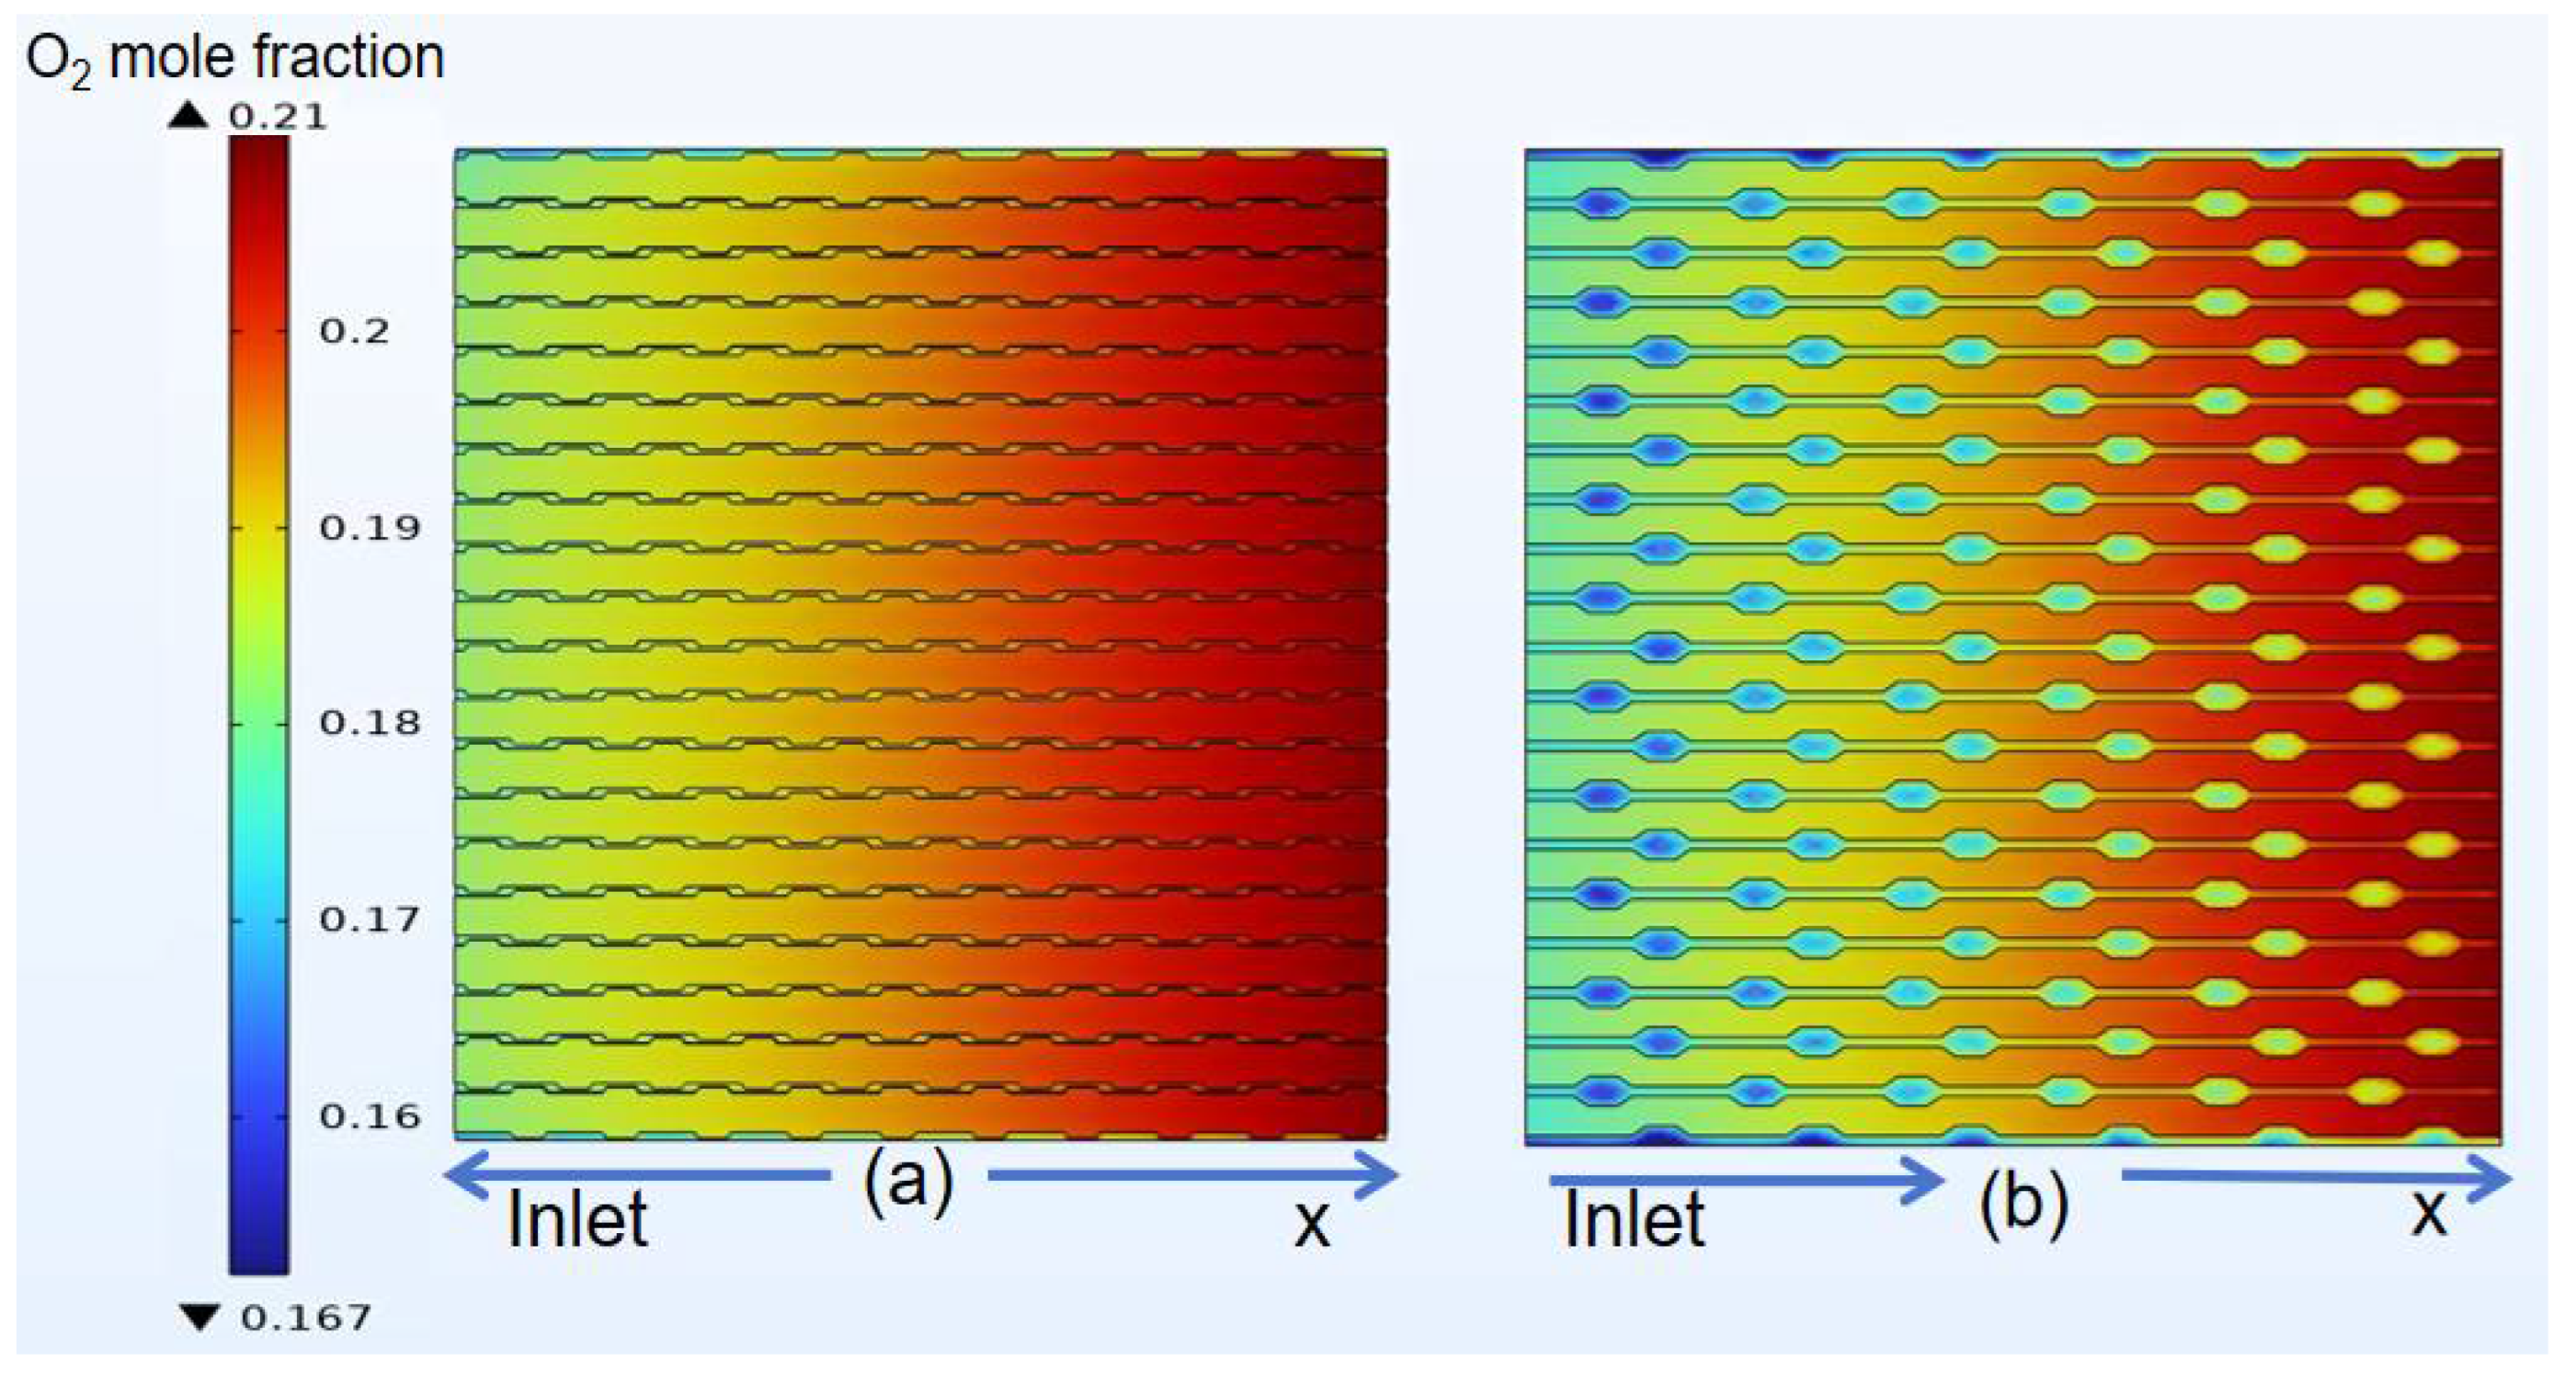
4.3. Species Distribution of Curved Model

Figure 15a illustrates the mole fraction distribution on the expanding anode counter-flow channel, with hydrogen entering from the left inlet and exiting via the right outlet. Figure 15b presents the mole fraction distribution on the reducing anode counter-flow channel, following the same inlet and outlet direction. The initial molar fraction of hydrogen fuel was set to 0.95. The highest molar fraction of hydrogen was observed on the left inlet, consistent with the initial value of 0.95. Conversely, the right outlet exhibited the lowest molar fraction due to the hydrogen flow direction from left to right and subsequent reaction causing a decrease in molar fraction. When compared with Figure 10b, the molar fraction of hydrogen at the left entrance in Figure 15 remained consistent with the initial value, whereas in the outlet, the molar fraction of hydrogen was slightly lower, suggesting that the optimized model was more favorable for improving SOFC performance. In Figure 15a, the minimum molar fraction at the right outlet of the outwardly extending anode flow channel surface is 0.86. This represents a 2.33% increase compared to the classical anode channel’s minimum molar fraction of 0.88. Similarly, the minimum molar fraction at the right outlet of the inward expanding anode flow channel surface is 0.857, indicating a 2.68% improvement over the classical anode channel’s minimum molar fraction of 0.88.
Figure 16a illustrates the mole fraction distribution on the expanding cathode counter-flow channel, with oxygen entering from the right inlet and exiting via the left outlet. Figure 16b displays the mole fraction distribution on the reducing cathode counter-flow channel, where oxygen flowed in from the right inlet and out of the left outlet. The initial molar fraction of hydrogen fuel was set to 0.21. Oxygen on the inlet had the highest molar fraction, consistent with the initial value of 0.21, and gradually decreased due to the continuous reaction of oxygen. Compared to the classical model in Figure 11b, the molar fraction of inlet oxygen in Figure 15 remained consistent with the initial value as in Figure 11b. The molar fraction of oxygen in the optimized model decreased, indicating that the optimized model was more conducive to improving SOFC performance. In Figure 16a, the minimum molar fraction at the left entrance of the expanded cathode channel is 0.18, which is 3.2% lower than the minimum molar fraction of 0.187 in the classical channel. Similarly, in Figure 16b, the minimum mole fraction at the left exit of the reducing cathode channel surface is 0.178. When compared with the minimum mole fraction of the left exit of the classical channel, the reduction is 4.3%.

4.4. Performance Comparison

Figure 17 presents a comparison of the peak power density among the three structural models. The maximum power density of both the expanding counter-flow model and the reducing counter-flow model exceeds that of the classical model. Specifically, the maximum power density of the reducing counter-flow model reaches 3925 W/m2, marking a 1.71% increase over the expanding counter-flow model (3859 W/m2) and a 2.42% increase over the classical counter-flow model (3832 W/m2). The addition of the block reduces the cross-sectional area of the flow channel, leading to an increased gas velocity according to the gas continuity equation. This increased velocity promotes more gas participation in the electrochemical reaction to a certain extent, thereby enhancing the current density.

5. Conclusions

In this study, SOFCs supported by marine multi-channel plate anodes were chosen as the research subject. A three-dimensional steady-state CFD model based on a strongly convergent plane SOFC was utilized to compare the performance of the co-flow model and the counter-flow model, providing a novel flow channel optimization approach. The 3D steady-state SOFC model was established by integrating heat transfer, mass transfer, and momentum transfer models, coupled with the electrochemical reaction equation of the fuel cell, using the COMSOL multi-physics coupling software platform. The classical SOFC and the SOFC with optimized flow channels were analyzed for multi-physical field analysis including temperature, velocity, and mole fraction fields. The simulation results show that the internal temperature distribution of the counter-flow field is more uniform and lower in temperature compared to the downstream flow field. Moreover, in contrast with the classical model, the optimized model exhibited a temperature reduction of 1.3%, and an increase in anode velocity by 4.9% and 5.0%, respectively. The detailed conclusions are as follows:
(1)
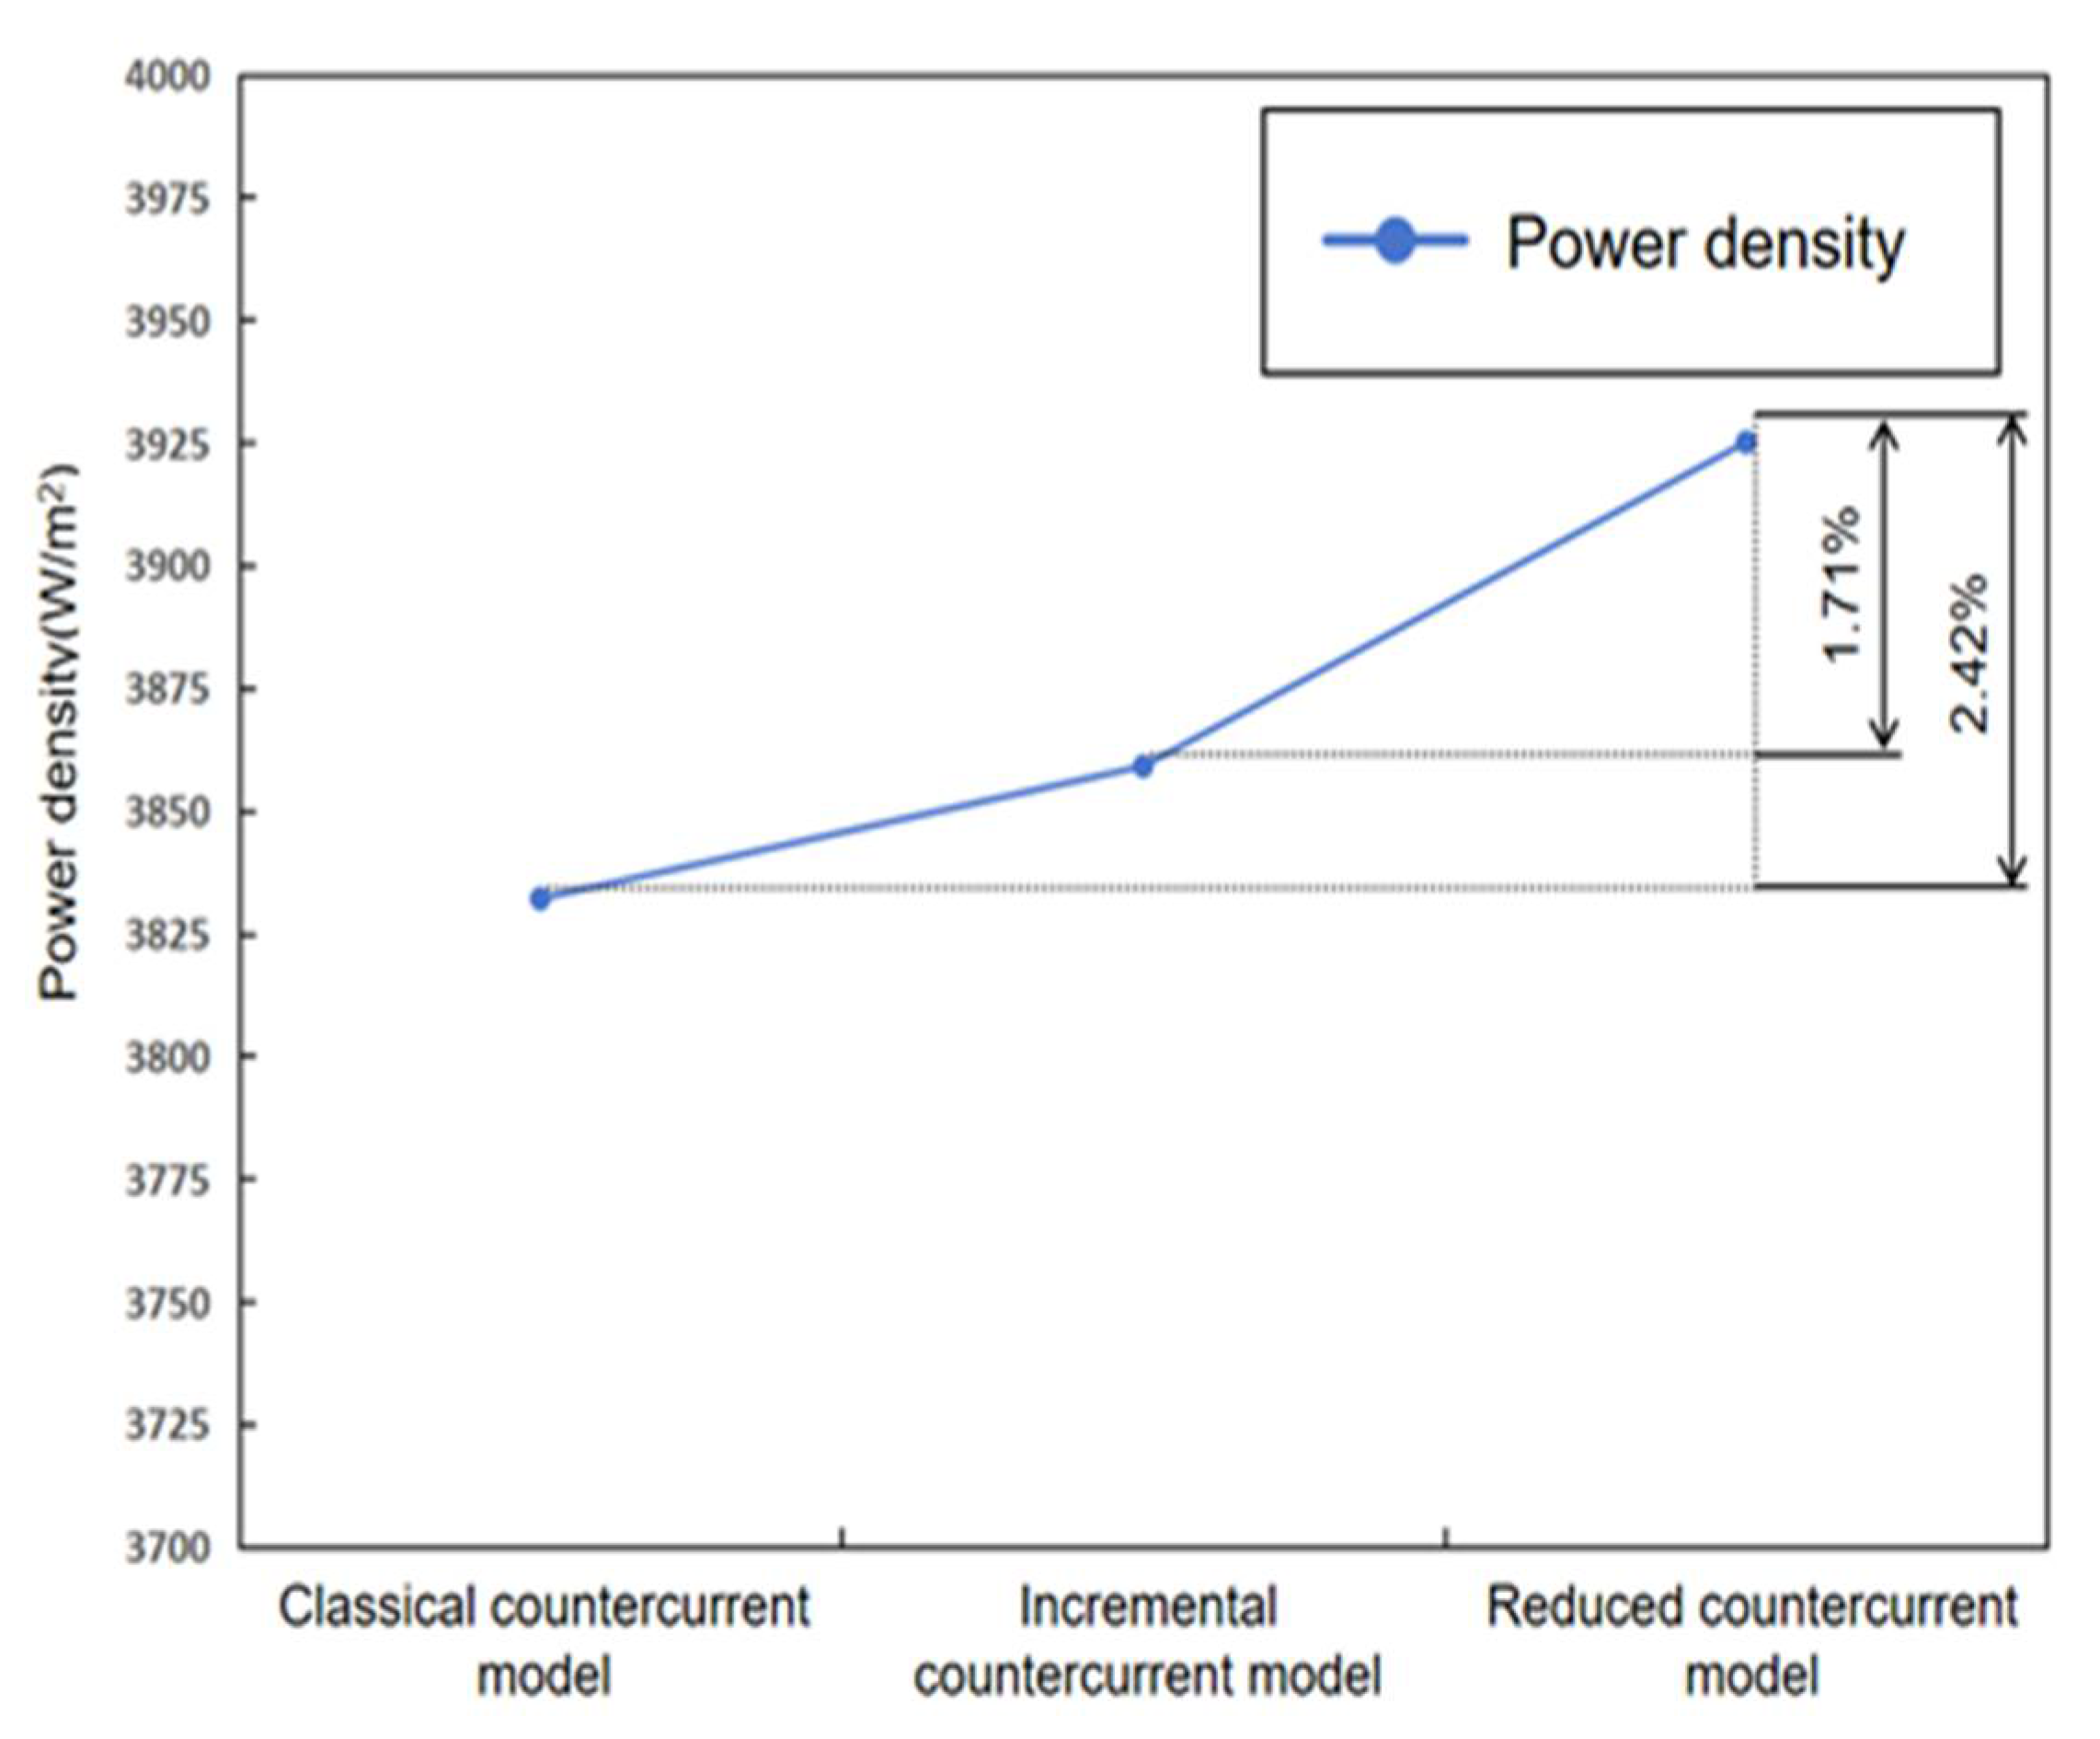
Analysis of the power density curve indicated that the power density of the optimized model was 2.42% higher than that of the classical model and 1.71% higher than that of the asymptotic model.
(2)
In the temperature field, it was observed that the temperature distribution of the counter-flow field was more uniform, with lower maximum temperatures, compared to different flow directions. This shows that the counter-current flow field is more conducive to enhancing SOFC performance than the forward flow field. Additionally, this study identified a gradual temperature increase from the fuel inlet and outlet sides toward the middle of the structure, with overall temperatures at the electrolyte–anode interface greater than those at the electrolyte–cathode interface.
(3)
In the velocity field, the gas velocity is highest at the center of the gas channel. As the gas diffuses toward the diffusion electrode, its velocity gradually decreases, reaching near-zero velocity upon reaching the diffusion-layer wall.
(4)
The gas concentration at the electrode decreases rapidly in the first half of the air inlet, followed by a slower rate of concentration decrease. However, hydrogen exhibits a more uniform distribution on the same horizontal interface compared to oxygen.
Fuel-cell-powered ships are of great significance for energy conservation, emission reduction, and the long-term development of the shipping industry. Solid oxide fuel cells (SOFCs) have obvious advantages such as high power, high efficiency of combined heat and power (CHP), and a wide range of fuel types. They are one of the most promising fuel cells in the field of power generation and also one of the development directions for future ship applications.
This paper optimized the performance of several different SOFC flow field structures using numerical simulation calculations. However, the performance of SOFCs is not solely determined by the flow field structure; there are still several issues that require investigation. Future research can be conducted in the following areas:
(1)
The length of the flow channels and the arrangement of baffle blocks affect the thermal characteristics of the fuel cell.
(2)
This study focused on the internal flow field, and it did not study the influence of the gas flow mode of the external flow field on the SOFC performance. The gas flow mode in the external flow field involves the uniformity of the temperature distribution of the SOFC, which in turn affects the cell life.
(3)
The model established in this study is a steady-state model, and in actual operation, the temperature, flow rate, pressure and electrochemical reaction rate all change with time. It is necessary to establish a transient model for further studies.

Author Contributions

Conceptualization, J.L. (Jiqiang Li), W.N., J.L. (Jichao Li) and J.-T.K.; data curation, Y.D., T.W. and Z.G.; formal analysis, J.L. (Jiqiang Li), Y.D. and Z.G.; funding acquisition, J.-T.K.; investigation, Y.D. and T.W.; methodology, J.L. (Jiqiang Li), J.L. (Jichao Li), W.N. and J.-T.K.; project administration, J.L. (Jiqiang Li) and J.-T.K.; resources, Y.D. and H.M.; software, Y.D., Z.G. and H.M.; supervision, Y.F.; validation, Z.G.; visualization, Y.F.; writing—original draft, Y.D., Y.F. and T.W.; writing—review and editing, J.L. (Jiqiang Li), J.L. (Jichao Li), W.N. and J.-T.K. All authors have read and agreed to the published version of the manuscript.

Funding

This research was supported by the Regional Innovation Strategy (RIS) through the National Research Foundation of Korea (NRF) funded by the Ministry of Education (MOE) (2021RIS-004).

Institutional Review Board Statement

Not applicable.

Informed Consent Statement

Not applicable.

Data Availability Statement

Data are contained within this article.

Acknowledgments

This research is also the result of receiving the support for the 2024 provincial college student’s innovation and entrepreneurship training program project (Project: Liquid circulation cooling system for hydrogen storage tank of hydrogen energy vehicle), China.

Conflicts of Interest

Author Wei-Xin Ni was employed by the company Shandong Kaigeruisen Energy Technology Co., Ltd. The remaining authors declare that the research was conducted in the absence of any commercial or financial relationships that could be construed as a potential conflict of interest.

Appendix A. Symbols’ Meanings

SymbolRepresentative SignificanceUnitSymbolRepresentative SignificanceUnit
AFLAnode functional layer——ASLAnode-supported layer
CCCLCathode current collector layer——CFLCathode functional layer——
C H 2 , r e f / C H 2 O , r e f Reference concentrations of hydrogen and watermol/m3 C p , j / C p , j Specific constant pressure heat capacity of the gas jJ/(kg·K)
C R / C O Molar concentration ratios in the SOFC activation region—— D e f f , i j Effective binary diffusion coefficient (i and j are different substances)m2/s
D i , j Molecular diffusion coefficientm2/s D K n , i Knudsen diffusionm2/s
E 0 Standard electromotive forceV E a c t , a / E a c t , c Activation energiesJ/mol
ELElectrolyte layer—— F Faraday constantC/mol
i Current densityA/m2 I Unit matrix
INInterconnect—— k a / k c Pre-exponential constant——
k e f f Effective heat conductivityW/(m·K) k j / k g Heat conduction coefficient of gasW/(m·K)
k s Heat conduction coefficient of solidW/(m·K) M i Molar amount of each gaskg/mol
P E M F C Proton exchange membrane fuel cell—— p Total pressure of the gasPa
P i Partial pressure of substance iPa Q h Heat source termW/m3
R Gas constantJ/(kg·K) r e Effective pore diameterm
S Change in entropy before and after the electrochemical reactionJ/(mol·K) S a Activated surface area1/m
S O F C Solid-state oxide fuel cells——TTemperature of the gasK
u Speed field vectorm/s V a c t Activation polarization——
V c o n Concentration polarization—— V i , j Volume diffusion coefficientM3
V o h m Ohmic polarization V o h m x j Mole fraction
α a / α c Anodic and cathodic transfer coefficients of the electrodes—— δ Thickness of the anode layermm
ε Porosity—— η a c t Overpotential of activation polarizationV
θ E . C Volume fraction of conductive material—— κ Permeabilitym2
μ ViscosityPa·s ρ Densitykg/m3
σ e l e , a Conductivity of the anodeS/m σ e l e c Effective electronic conductivity——
σ i o n Effective ionic conductivity—— τ Tortuosity of gas transfer in the porous electrode——
ϕ e l e c ,   ϕ i o n PotentialV——————

References

  1. Yang, J.; Yu, Y.; Ma, T.; Zhang, C.; Wang, Q. Evolution of energy and metal demand driven by industrial revolutions and its trend analysis. Chin. J. Popul. Resour. Environ. 2022, 19, 256–264. [Google Scholar] [CrossRef]
  2. Jiang, F.F.; Wei, Z.B.; Zhang, C.Z.; He, H.W.; Song, R.; Gao, F. Cathodic Supply Optimization of PEMFC System Under Variable Altitude. IEEE Trans. Transp. Electrif. 2024, 71, 14298–14307. [Google Scholar] [CrossRef]
  3. Watanabe, M.D.B.; Cherubini, F.; Tisserant, A.; Cavalett, O. Drop-in and hydrogen-based biofuels for maritime transport: Country based assessment of climate change impacts in Europe up to 2050. Energy Convers. Manag. 2022, 273, 116403. [Google Scholar] [CrossRef]
  4. Menon, N.V.; Chan, S.H. Technoeconomic and environmental assessment of HyForce, a hydrogen-fuelled harbour tug. Int. J. Hydrogen Energy 2022, 47, 6924–6935. [Google Scholar] [CrossRef]
  5. Chen, Z.; Lam, J.S. Life cycle assessment of diesel and hydrogen power systems in tugboats. Transp. Res. Part D Transp. Environ. 2022, 103, 103192. [Google Scholar] [CrossRef]
  6. Tomos BA, D.; Stamford, L.; Welfle, A.; Larkin, A. Decarbonising international shipping—A life cycle perspective on alternative fuel options. Energy Convers. Manag. 2024, 299, 117848. [Google Scholar] [CrossRef]
  7. IMO Fuel Cell Power Systems for Marine and Offshore Applications. August 2023. Available online: https://ww2.eagle.org/content/dam/eagle/rules-and-guides/current/other/312_requirements-for-fuel-cell-power-systems-for-marine-and-offshore-applications/312-fuel-cell-reqts-aug23.pdf (accessed on 5 September 2024).
  8. YANMAR Yanmar Develops Hydrogen Fuel Cell System for Maritime Applications. 4 June 2020. Available online: https://www.yanmar.com/global/news/2020/06/04/75041.html (accessed on 5 September 2024).
  9. Alfa Laval. Maritime Industry Players Join Forces to Realize the Decarbonization Potential of Solid Oxide Fuel Cells. 2 January 2021. Available online: https://www.alfalaval.com/industries/marine-transportation/marine/marine-news/maritime-industry-players-join-forces-to-realize-the-decarbonization-potential-of-solid-oxide-fuel-cells/ (accessed on 5 September 2024).
  10. Sheikh, A.A.; Bianchi, F.R.; Bove, D.; Bosio, B. A review on MCFC matrix: State-of-the-art, degradation mechanisms and technological improvements. Heliyon 2024, 10, e25847. [Google Scholar] [CrossRef]
  11. Biebl, M.; Verheyen, J.; Roes, J. Investigation of a Hydrogen Admixture in a Natural Gas Powered Phosphoric Acid Fuel Cell (PAFC). In Proceedings of the 2022 International Conference on Electrical, Computer, Communications and Mechatronics Engineering (ICECCME), Maldives, Maldives, 16–18 November 2022; IEEE: Piscataway, NJ, USA, 2022; pp. 1–6. [Google Scholar]
  12. Kwon, L.; Kang, J.G.; Baik, K.D.; Kim, K.; Ahn, C. Advancement and applications of PEMFC energy systems for large-class unmanned underwater vehicles: A review. Int. J. Hydrogen Energy 2024, 79, 277–294. [Google Scholar] [CrossRef]
  13. Vinchhi, P.; Khandla, M.; Chaudhary, K.; Pati, R. Recent advances on electrolyte materials for SOFC: A review. Inorg. Chem. Commun. 2023, 152, 110724. [Google Scholar] [CrossRef]
  14. Latapí, M.; Davíðsdóttir, B.; Jóhannsdóttir, L. Drivers and barriers for the large-scale adoption of hydrogen fuel cells by Nordic shipping companies. Int. J. Hydrogen Energy 2023, 48, 6099–6119. [Google Scholar] [CrossRef]
  15. IMO Hot Topic—Reducing Greenhouse Gas Emissions from Ships. 2018. Available online: https://cimrc.shmtu.edu.cn/2022/1214/c5091a195998/page.htm (accessed on 5 September 2024).
  16. Li, J.; Wang, J.; Wu, T.; Li, J.; Kwon, J.-T. A Study on the Thermal Behavior of Series and Parallel Connection Methods in the Process of Hydrogenation of Ship-Borne Hydrogen Storage Cylinder. Processes 2024, 12, 366. [Google Scholar] [CrossRef]
  17. Li, J.; Wu, T.; Cheng, C.; Li, J.; Zhou, K. A Review of the Research Progress and Application of Key Components in the Hydrogen Fuel Cell System. Processes 2024, 12, 249. [Google Scholar] [CrossRef]
  18. Venâncio, S.A.; de Miranda, P.E.V. Direct utilization of carbonaceous fuels in multifunctional SOFC anodes for the electrosynthesis of chemicals or the generation of electricity. Int. J. Hydrogen Energy 2017, 42, 13927–13938. [Google Scholar] [CrossRef]
  19. Song, Y.; Zhong, Q.; Tan, W. Synthesis and electrochemical behaviour of ceria-substitution LSCM as a possible symmetric solid oxide fuel cell electrode material exposed to H2 fuel containing H2S. Int. J. Hydrogen Energy 2014, 39, 13694–13700. [Google Scholar] [CrossRef]
  20. Chen, H.; Zhao, Q.T. On the role and development status of solid oxide fuel cells in China’s future energy system. Sci. Technol. Innov. Her. 2010, 56. [Google Scholar]
  21. Kong, W.; Zhang, W.; Huang, H.; Zhang, Y.; Wu, J.; Xu, Y. Analysis of micro-tubular SOFC stability under ambient and operating temperatures. J. Mater. Sci. Technol. 2018, 34, 1436–1440. [Google Scholar] [CrossRef]
  22. Liu, H. Preparation of Cu/Ni-LSCM Anode and Its Performance in Methane Dry Reforming. Master’s Thesis, Kunming University of Science and Technology, Kunming, China, 2020. [Google Scholar] [CrossRef]
  23. Yu, F.Y.; Wang, Y.S.; Xie, Y.J.; Zhang, W.M.; Zhang, J.J.; Meng, X.X.; Xiao, J.; Yang, N.T. A Micro-tubular Direct Carbon Solid Oxide Fuel Cell Operated on the Biochar Derived from Pepper Straw. Energy Technol. 2020, 8, 1901077. [Google Scholar] [CrossRef]
  24. Qiao, J.; Chen, H.; Wang, Z.; Sun, W.; Li, H.; Sun, K. Enhancing the catalytic activity of Y0.08Sr0.92TiO3−δ anodes through in situ Cu exsolution for direct carbon solid oxide fuel cells. Ind. Eng. Chem. Res. 2020, 59, 13105–13112. [Google Scholar] [CrossRef]
  25. Cai, W.; Cao, D.; Zhou, M.; Yan, X.; Li, Y.; Wu, Z.; Wang, H. Sulfur-tolerant Fe-doped La0.3Sr0.7TiO3 perovskite as anode of direct carbon solid oxide fuel cells. Energy 2020, 211, 118958. [Google Scholar] [CrossRef]
  26. Jeon, O.S.; Park, M.G.; Song, R.H.; Ryu, K.H.; Na, C.W.; Shul, Y.G.; Lee, J.G. Effects of Fe2O3 doping on structural and electrical properties of 8 mol% yttria-stabilized zirconia electrolyte for solid oxide fuel cells. J. Mater. Sci. Mater. Electron. 2022, 33, 3208–3214. [Google Scholar] [CrossRef]
  27. Kuterbekov, K.; Nikonov, A.; Bekmyrza, K.; Khrustov, V.; Pavzderin, N.; Kabyshev, A.; Kubenova, M. Co-sintering of gradient anode–electrolyte structure for microtubular SOFC. Ceram. Int. 2024, 50, 17242–17251. [Google Scholar] [CrossRef]
  28. Xu, G.P. Study on Performance Optimization and Flow Field Structure of Solid Oxide Fuel Cells. Master’s Thesis, Shandong University, Jinan, China, 2024. Available online: https://kns.cnki.net/kcms2/article/abstract?v=ad5XPF-Jk6DZ-nWuoMw-_QxccRr3uUXI6EZV45tW7O4u5Ju1La7DQr4fSvQOqsgId-Lj9hjVpYcPjMlvQaaJEXL5P13wV9eoaPdOoXjZakmXBe_E-hOXvkB9wVwTIvEtwZKI8eLznEhc3nHR3eVA16hDTYmzglhw5niFUPk-1Y9dA7Meu2qDGoi6kZ5BqMt1rrCUOB3hb0s=&uniplatform=NZKPT&language=CHS (accessed on 5 September 2024).
  29. Wei, S.; Ni, S.; Ma, W.; Du, Z.; Lu, P. Exergy analysis and parameters optimization for zero-carbon/low-carbon fuels on SOFC-engine hybrid system. Fuel 2024, 364, 131076. [Google Scholar] [CrossRef]
  30. Saberi Mehr, A.; Ilkhani, M.; Sabernia, S.; Nooshmand, S.; Ebrahimpour, A.; Heydari, B. Thermodynamic modelling and optimisation of a green hydrogen-blended syngas-fueled integrated PV-SOFC system. Appl. Therm. Eng. 2024, 236, 121506. [Google Scholar] [CrossRef]
  31. Hussain, J.; Ali, R.; Akhtar, M.N.; Jaffery, M.H.; Shakir, I.; Raza, R. Modeling and simulation of planar SOFC to study the electrochemical properties. Curr. Appl. Phys. 2020, 20, 660–672. [Google Scholar] [CrossRef]
  32. Li, G.; Wu, M.; Zeng, D.; Wu, M.; Zhang, Y.; Tao, Y.; Shao, J. Mass and current uniformity for planar solid oxide fuel cells with discrete landing structured flow fields: A three-dimensional numerical analysis. Int. J. Hydrogen Energy 2022, 47, 33039–33057. [Google Scholar] [CrossRef]
  33. Chen, D.; Zhu, Y.; Han, S.; Anatoly, L.; Andrey, M.; Lu, L. Investigate the effect of a parallel-cylindrical flow field on the solid oxide fuel cell stack performance by 3D multiphysics simulating. J. Energy Storage 2023, 60, 106587. [Google Scholar] [CrossRef]
  34. Gong, C.; Tu, Z.; Chan, S.H. A novel flow field design with flow re-distribution for advanced thermal management in Solid oxide fuel cell. Appl. Energy 2023, 331, 120364. [Google Scholar] [CrossRef]
  35. Guo, M.; He, Q.; Cheng, C.; Zhao, D.; Ni, M. New interconnector designs for electrical performance enhancement of solid oxide fuel cells: A 3D modelling study. J. Power Sources 2022, 533, 231373. [Google Scholar] [CrossRef]
  36. Liu, X.; Sun, S.D.; Dai, Y.; Zhang, H.-Y.; Li, C.-X. Numerical study of temperature distribution in tubular segmented-in-series SOFC with co-flow and counter-flow arrangements. Int. J. Hydrogen Energy 2024, 74, 447–458. [Google Scholar] [CrossRef]
  37. Todd, B.; Young, J.B. Thermodynamic and transport properties of gases for use in solid oxide fuel cell modelling. J. Power Sources 2002, 110, 186–200. [Google Scholar] [CrossRef]
  38. Xiong, X.; Liang, K.; Ma, G.; Ba, L. Three-dimensional multi-physics modelling and structural optimization of SOFC large-scale stack and stack tower. Int. J. Hydrogen Energy 2023, 48, 2742–2761. [Google Scholar] [CrossRef]
  39. Bhattacharya, D.; Mukhopadhyay, J.; Biswas, N.; Basu, R.N.; Das, P.K. Performance evaluation of different bipolar plate designs of 3D planar anode-supported SOFCs. Int. J. Heat. Mass. Transf. 2018, 123, 382–396. [Google Scholar] [CrossRef]
  40. Lu, P.Z.; Wei, S.L.; Du, Z.H.; Ma, W.; NI, S. Analysis and comparison of multi-physics fields for different flow field configurations in SOFC. Int. J. Heat Mass Transf. 2024, 229, 125708. [Google Scholar] [CrossRef]
  41. Chan, S.H.; Khor, K.A.; Xia, Z.T. A complete polarization model of a solid oxide fuel cell and its sensitivity to the change of cell component thickness. J. Power Sources 2001, 93, 130–140. [Google Scholar] [CrossRef]
  42. Nagasawa, T.; Hanamura, K. Prediction of overpotential and effective thickness of Ni/YSZ anode for solid oxide fuel cell by improved species territory adsorption model. J. Power Sources 2017, 353, 115–122. [Google Scholar] [CrossRef]
  43. Fu, Q.; Li, Z.; Wei, W.; Liu, F.; Xu, X.; Liu, Z. Performance enhancement of a beam and slot interconnector for anode-supported SOFC stack. Energy Convers. Manag. 2021, 241, 114277. [Google Scholar] [CrossRef]
  44. Khazaee, I.; Rava, A. Numerical simulation of the performance of solid oxide fuel cell with different flow channel geometries. Energy 2017, 119, 235–244. [Google Scholar] [CrossRef]
Figure 1. Schematic diagram of SOFC working principle [22].
Jmse 12 01779 g001
Figure 2. Classic SOFC model: concurrent flow channel and convective flow channel.
Jmse 12 01779 g002
Figure 3. (a) Expanding SOFC model; (b) dimensions of the expanding area; (c) reducing SOFC model; (d) block size.
Jmse 12 01779 g003aJmse 12 01779 g003b
Figure 4. The comparison of polarization curves between model simulation and experimental data.
Jmse 12 01779 g004
Figure 5. The comparison of polarization curves between model simulation data and those of ref. [44].
Jmse 12 01779 g005
Figure 6. Anode velocity distribution cloud: (a) co-flow channel; (b) counter-flow channel (x represents the X-axis in the Cartesian coordinate system).
Jmse 12 01779 g006
Figure 7. Cathode velocity distribution cloud picture: (a) co-flow channel; (b) counter-flow channel.
Jmse 12 01779 g007
Figure 8. Anode temperature distribution cloud picture: (a) co-flow channel; (b) counter-flow channel.
Jmse 12 01779 g008
Figure 9. Side view of temperature distribution cloud: (a) co-flow channel; (b) counter-flow channel.
Jmse 12 01779 g009
Figure 10. Anode H2 distribution cloud picture: (a) co-flow channel; (b) counter-flow channel.
Jmse 12 01779 g010
Figure 11. Cathode O2 distribution cloud picture: (a) concurrent flow channel; (b) convective flow channel.
Jmse 12 01779 g011
Figure 12. Anode velocity distribution picture: (a) expanding counter-flow channel; (b) reducing counter-flow channel.
Jmse 12 01779 g012
Figure 13. Cathode velocity distribution picture: (a) expanding counter-flow channel; (b) reducing counter-flow channel.
Jmse 12 01779 g013
Figure 14. Anode temperature distribution picture: (a) expanding counter-flow channel; (b) reducing counter-flow channel.
Jmse 12 01779 g014
Figure 15. Anode H2 distribution picture: (a) expanding counter-flow channel; (b) reducing counter-flow channel.
Jmse 12 01779 g015
Figure 16. Cathode O2 distribution picture: (a) expanding counter-flow channel; (b) reducing counter-flow channel.
Jmse 12 01779 g016
Figure 17. Peak power density changes under different countercurrent models.
Jmse 12 01779 g017
Table 1. The main parameters of the classic model.
ParameterValue (mm)
Cell length60
Gas channelWidth2
Height1
Width of the channel2
Height of the interconnect1
AnodeThickness of the ASL0.01
Thickness of the AFL0.3
Thickness of the EL0.01
CathodeThickness of the CFL0.03
Thickness of the CCCL0.08
Table 2. The main parameters of the curved model.
ParameterValue (mm)
Cell length60
Gas channelWidth2
Height1
Width of the channel2
Height of the interconnect1
AnodeThickness of the ASL0.01
Thickness of the AFL0.3
Thickness of the EL0.01
CathodeThickness of the CFL0.03
Thickness of the CCCL0.08
Table 3. The material property parameters of the physical model [33,37].
ParameterValueParameterValue
Thermal conductivity
W / m · K
Anode15Density
k g / m 3
Anode6870
EL2.7EI5900
Cathode20Cathode6570
PorosityAnode0.452Exchange coefficientAnode1
Cathode0.452Cathode1
Pre-exponential constantAnode 6.54 × 10 11 R [J/(kg·K)]8.314
Cathode 2.35 × 10 11 F [C/mol]96,500
Activation energy J / m o l Anode 1.4 × 10 5 ——————
Cathode 1.37 × 10 5
Table 4. Boundary conditions of the SOFC simulation model.
ParameterTemperature (K)SpeciesVelocity (m/s)
FuelInlet1073H2∶H2O = 0.95∶0.052.5
Outlet1073--
AirInlet1073O2∶N2 = 0.21∶0.791.5
Outlet1073--
Top wall of the anode interconnectAdiabaticConvectionWall
Bottom wall of the cathode interconnectAdiabaticConvectionWall
Disclaimer/Publisher’s Note: The statements, opinions and data contained in all publications are solely those of the individual author(s) and contributor(s) and not of MDPI and/or the editor(s). MDPI and/or the editor(s) disclaim responsibility for any injury to people or property resulting from any ideas, methods, instructions or products referred to in the content.

