Numerical Analysis of the Influence of Runoff Input on Salinity Distribution and Its Mechanisms in Laizhou Bay
Abstract
:1. Introduction
2. Models and Methods
2.1. Model Description
2.2. Computational Domain and Parameter Settings
2.3. Model Calibration and Validation
2.3.1. Hydrodynamic Calibration and Validation
2.3.2. Salinity Validation
3. Simulation and Analysis
3.1. Flow Field Analysis
3.2. Salinity Distribution and Residual Current Analysis
3.3. Profile Analysis
4. Discussion
4.1. Scenario 1: Removal of the Yellow River Runoff Input
4.2. Scenario 2: Removal of the Southwest Runoff Input
4.3. Scenario 3: Removal of the Southeast Runoff Input
4.4. Comparative Analysis of Experiment Results
5. Conclusions
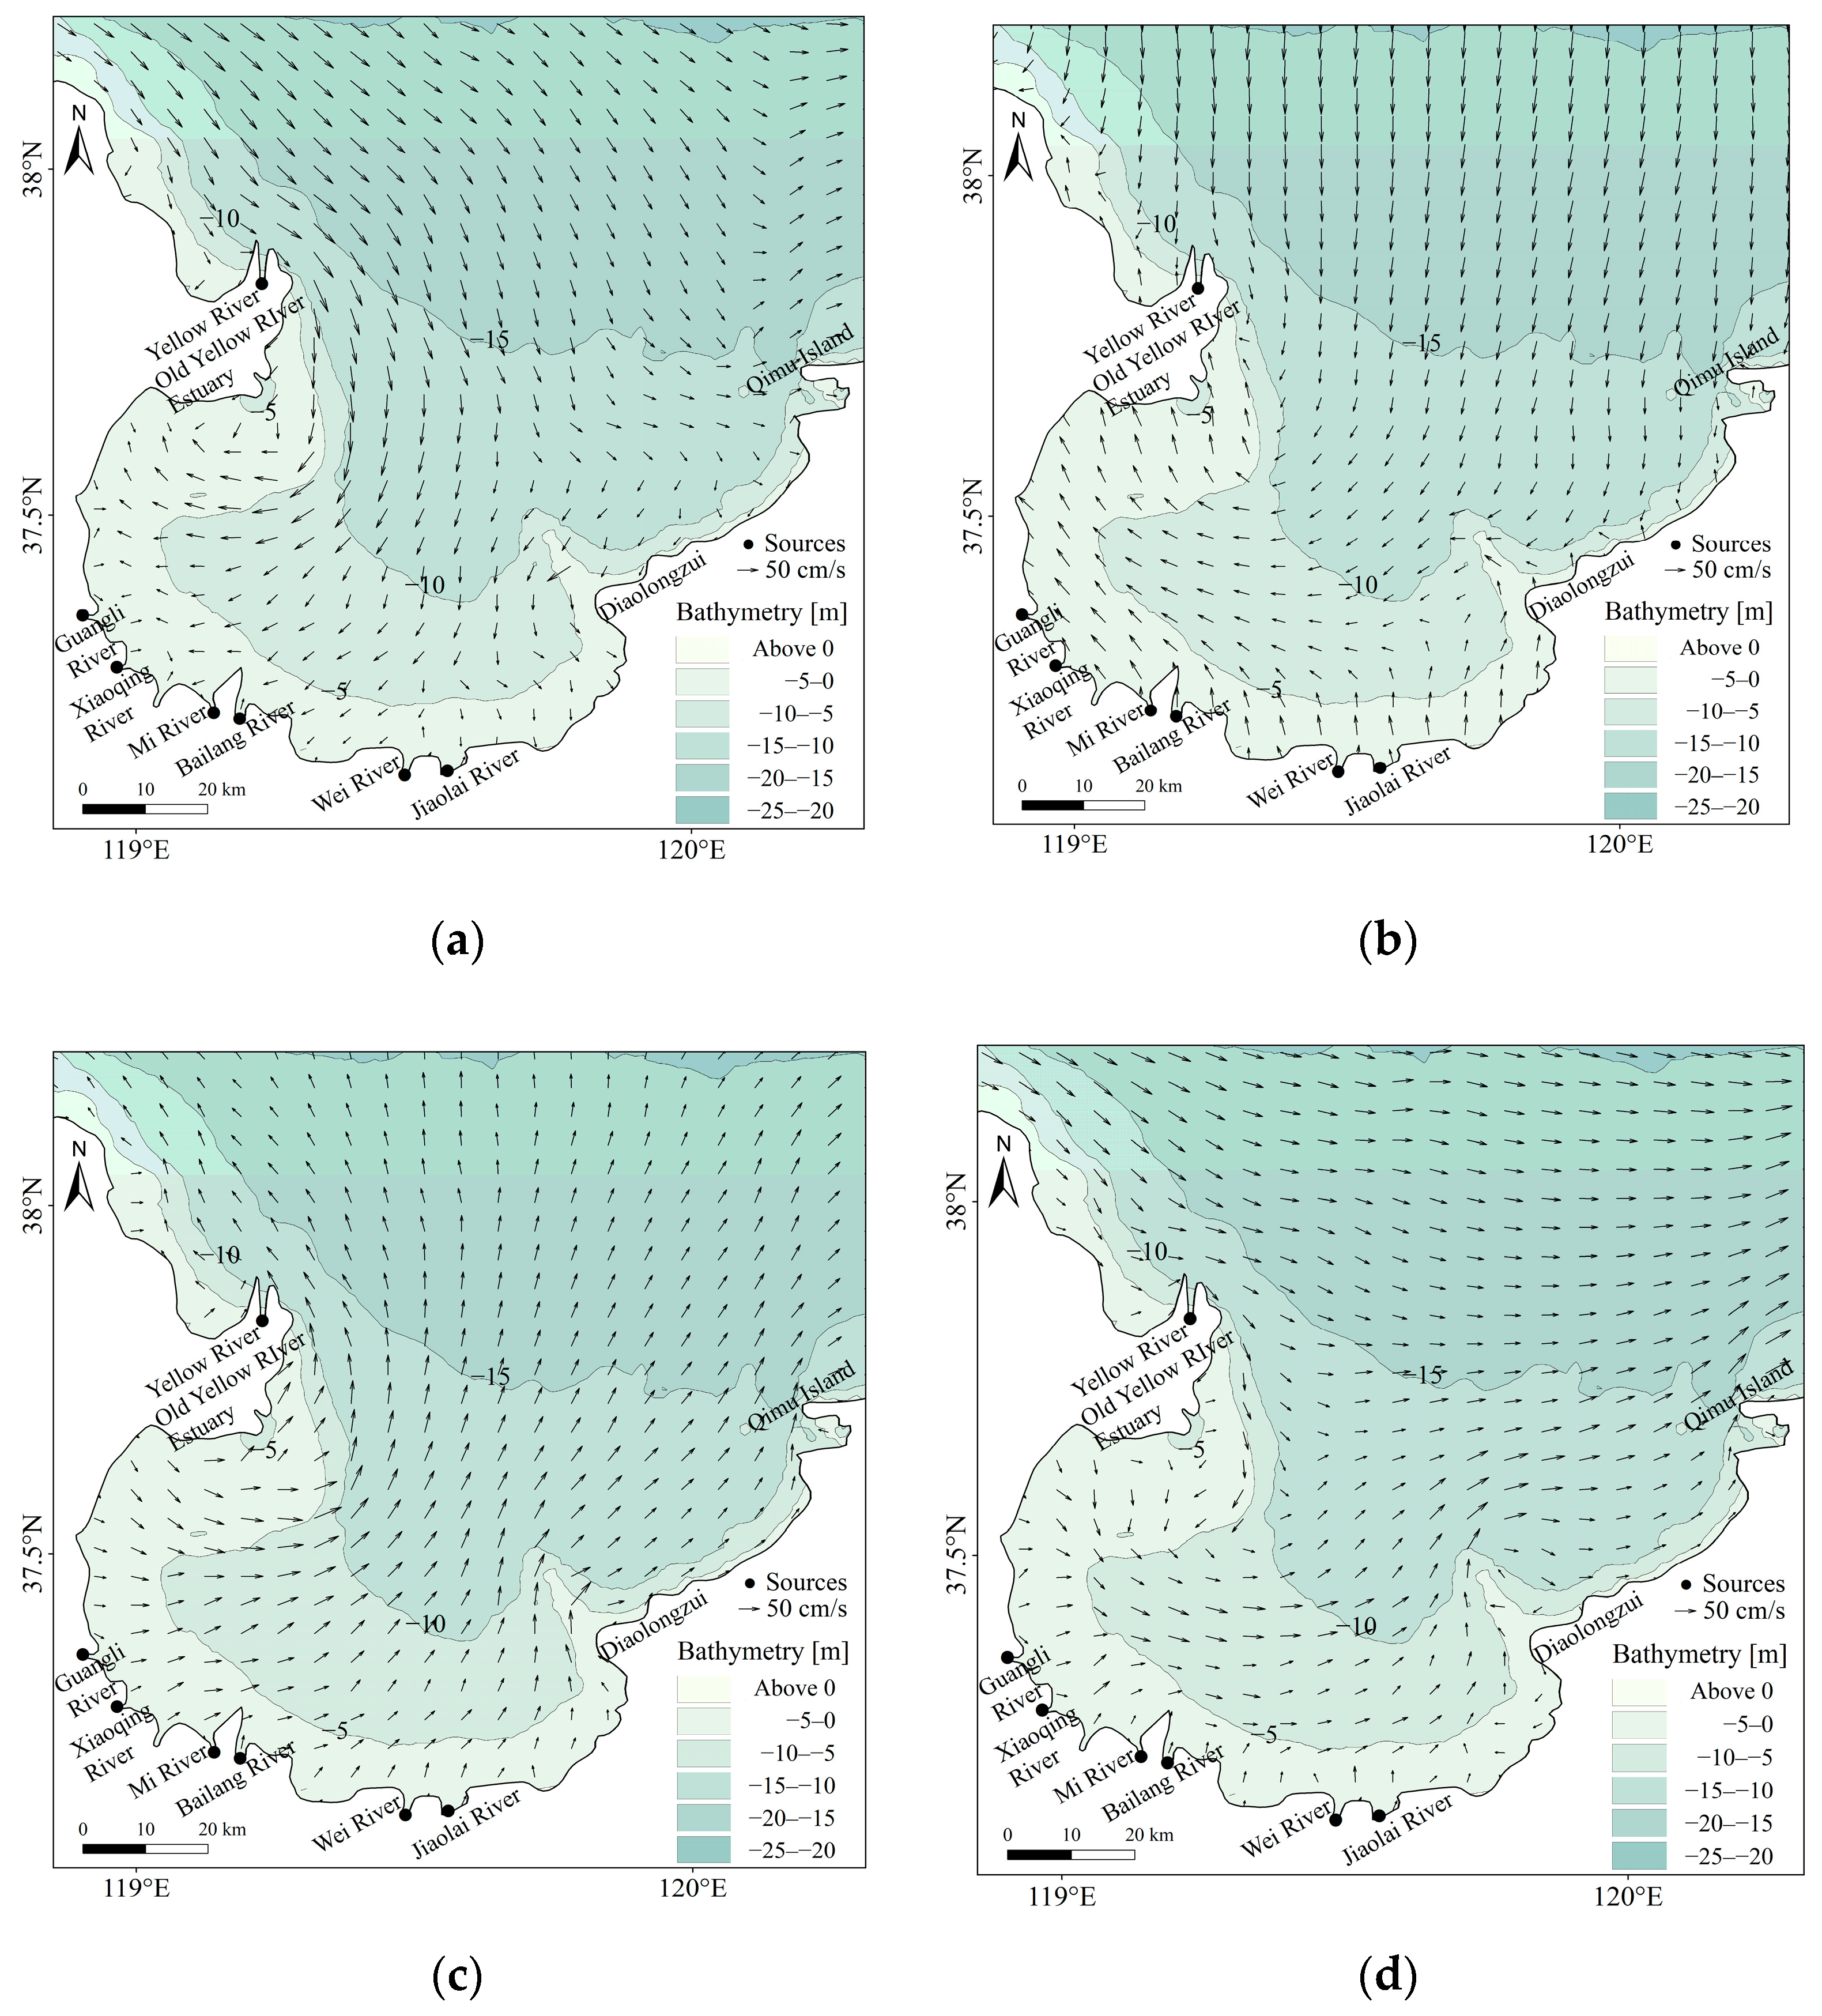
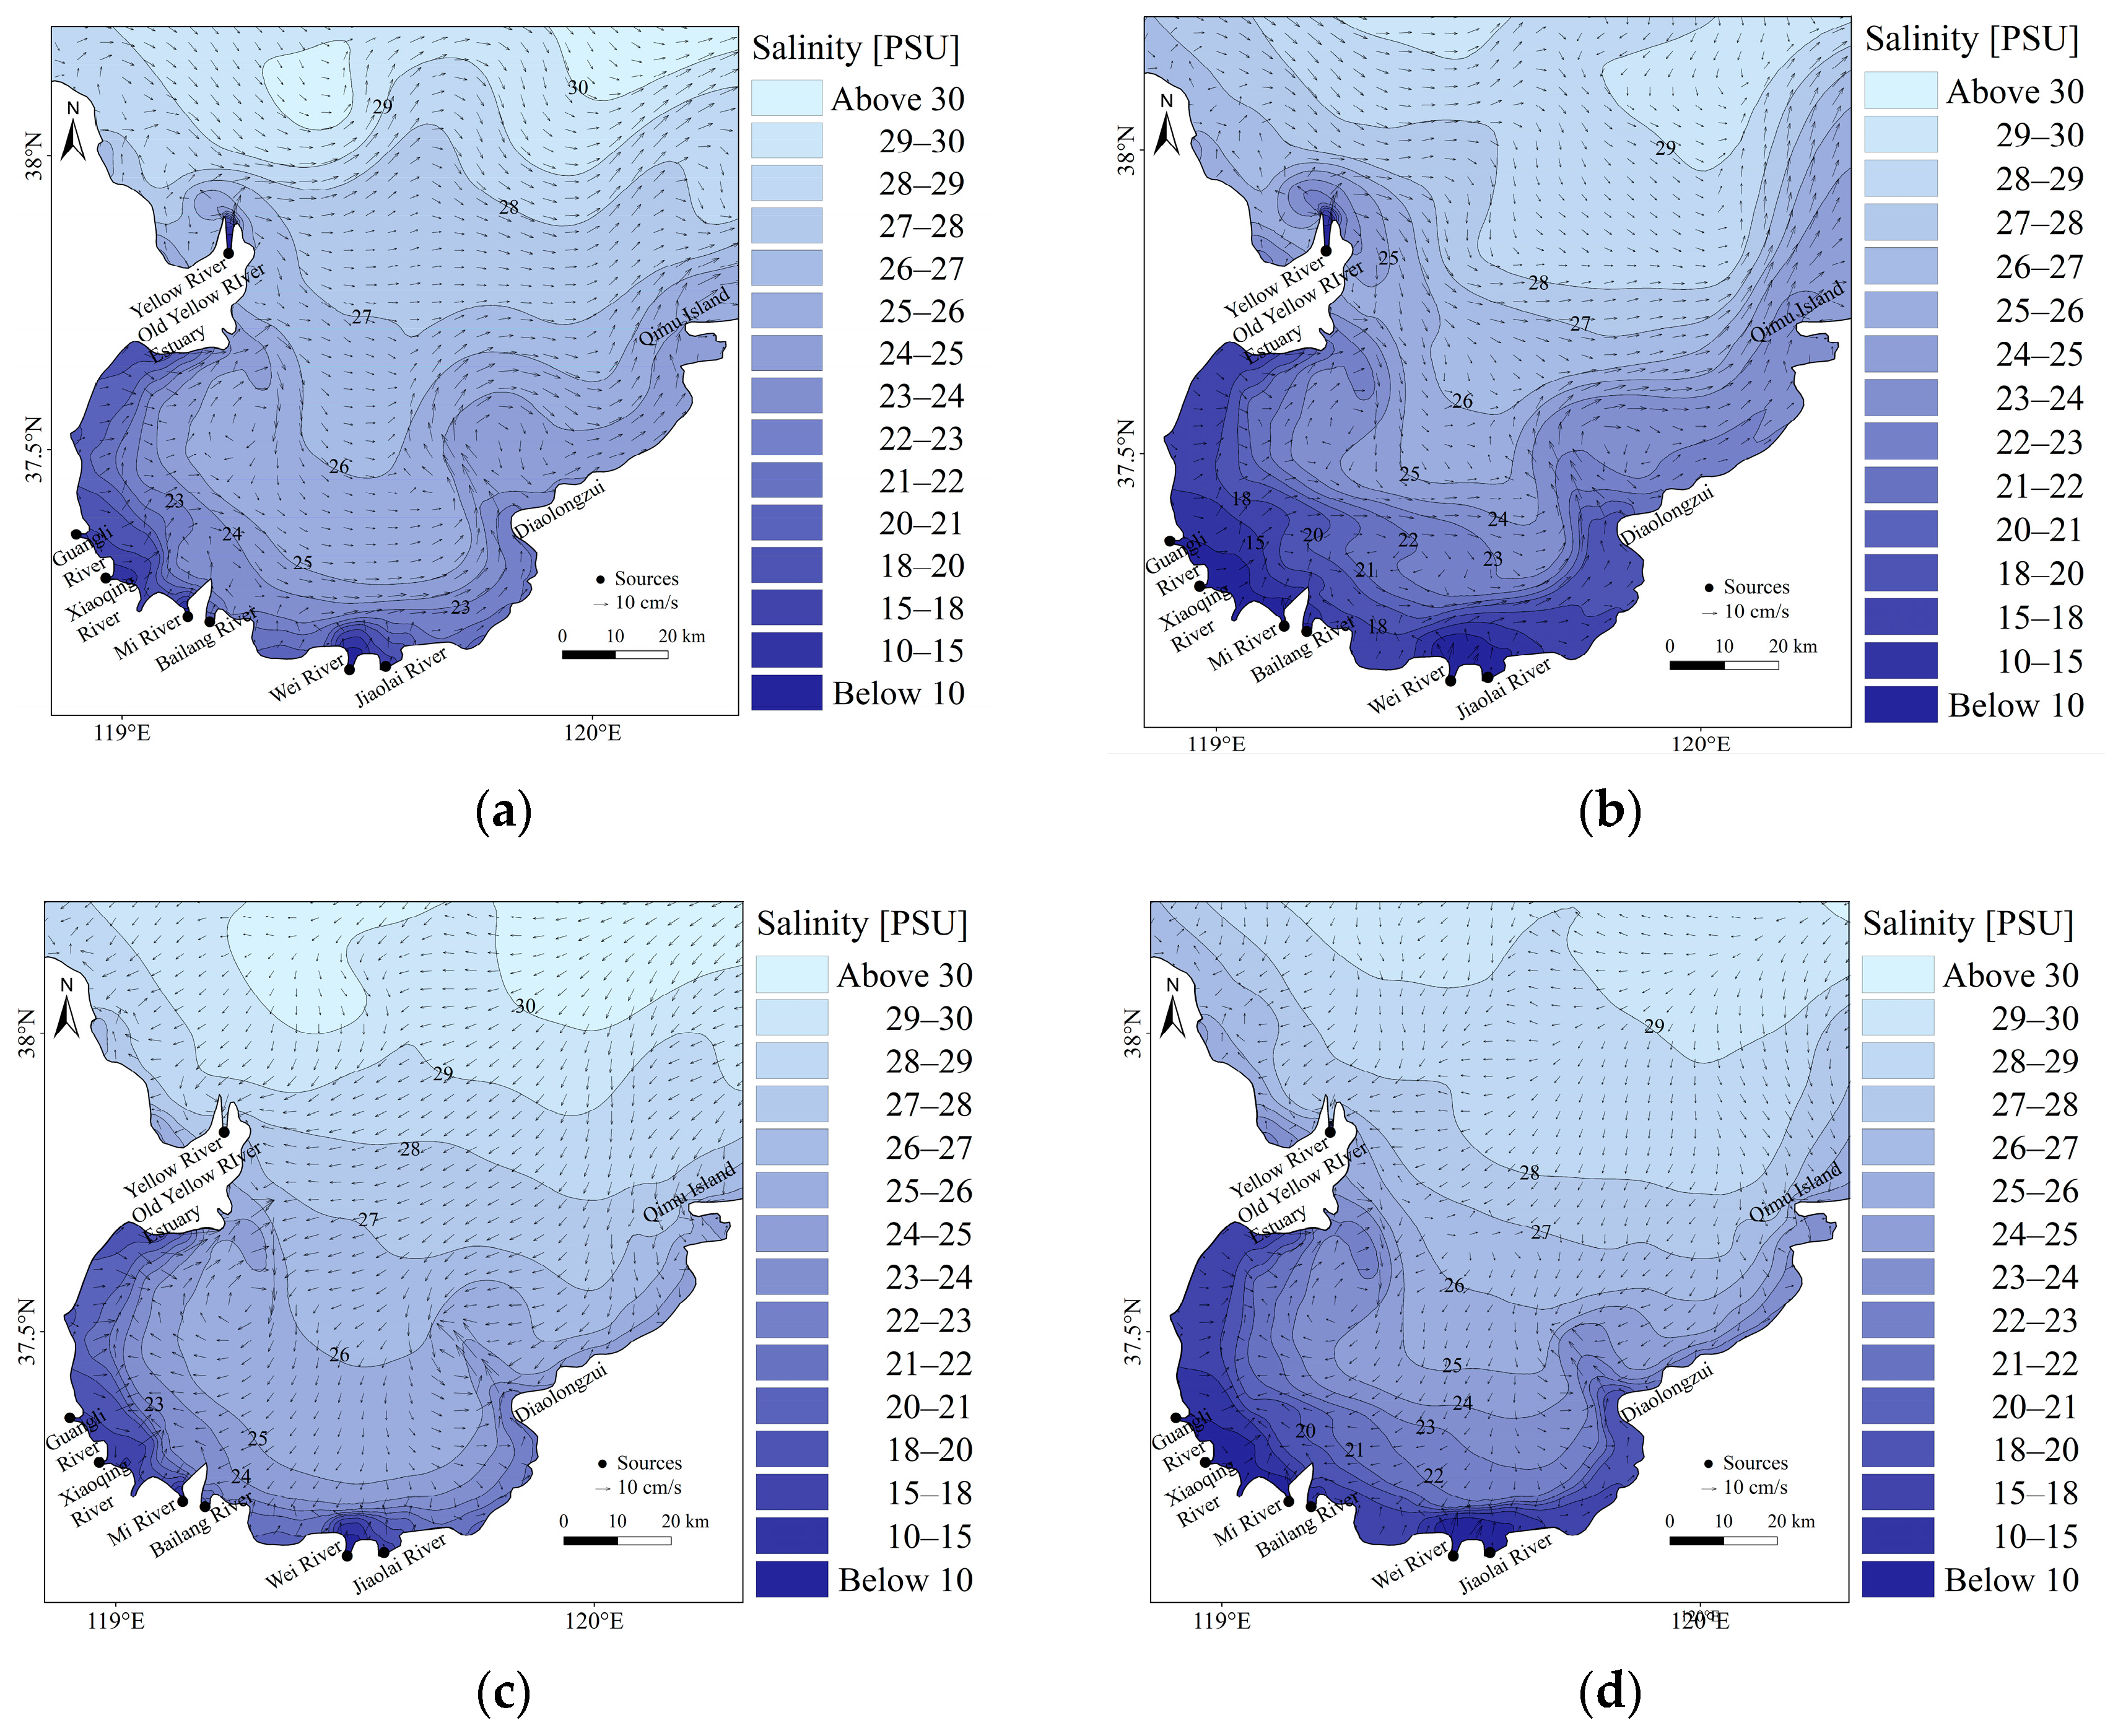
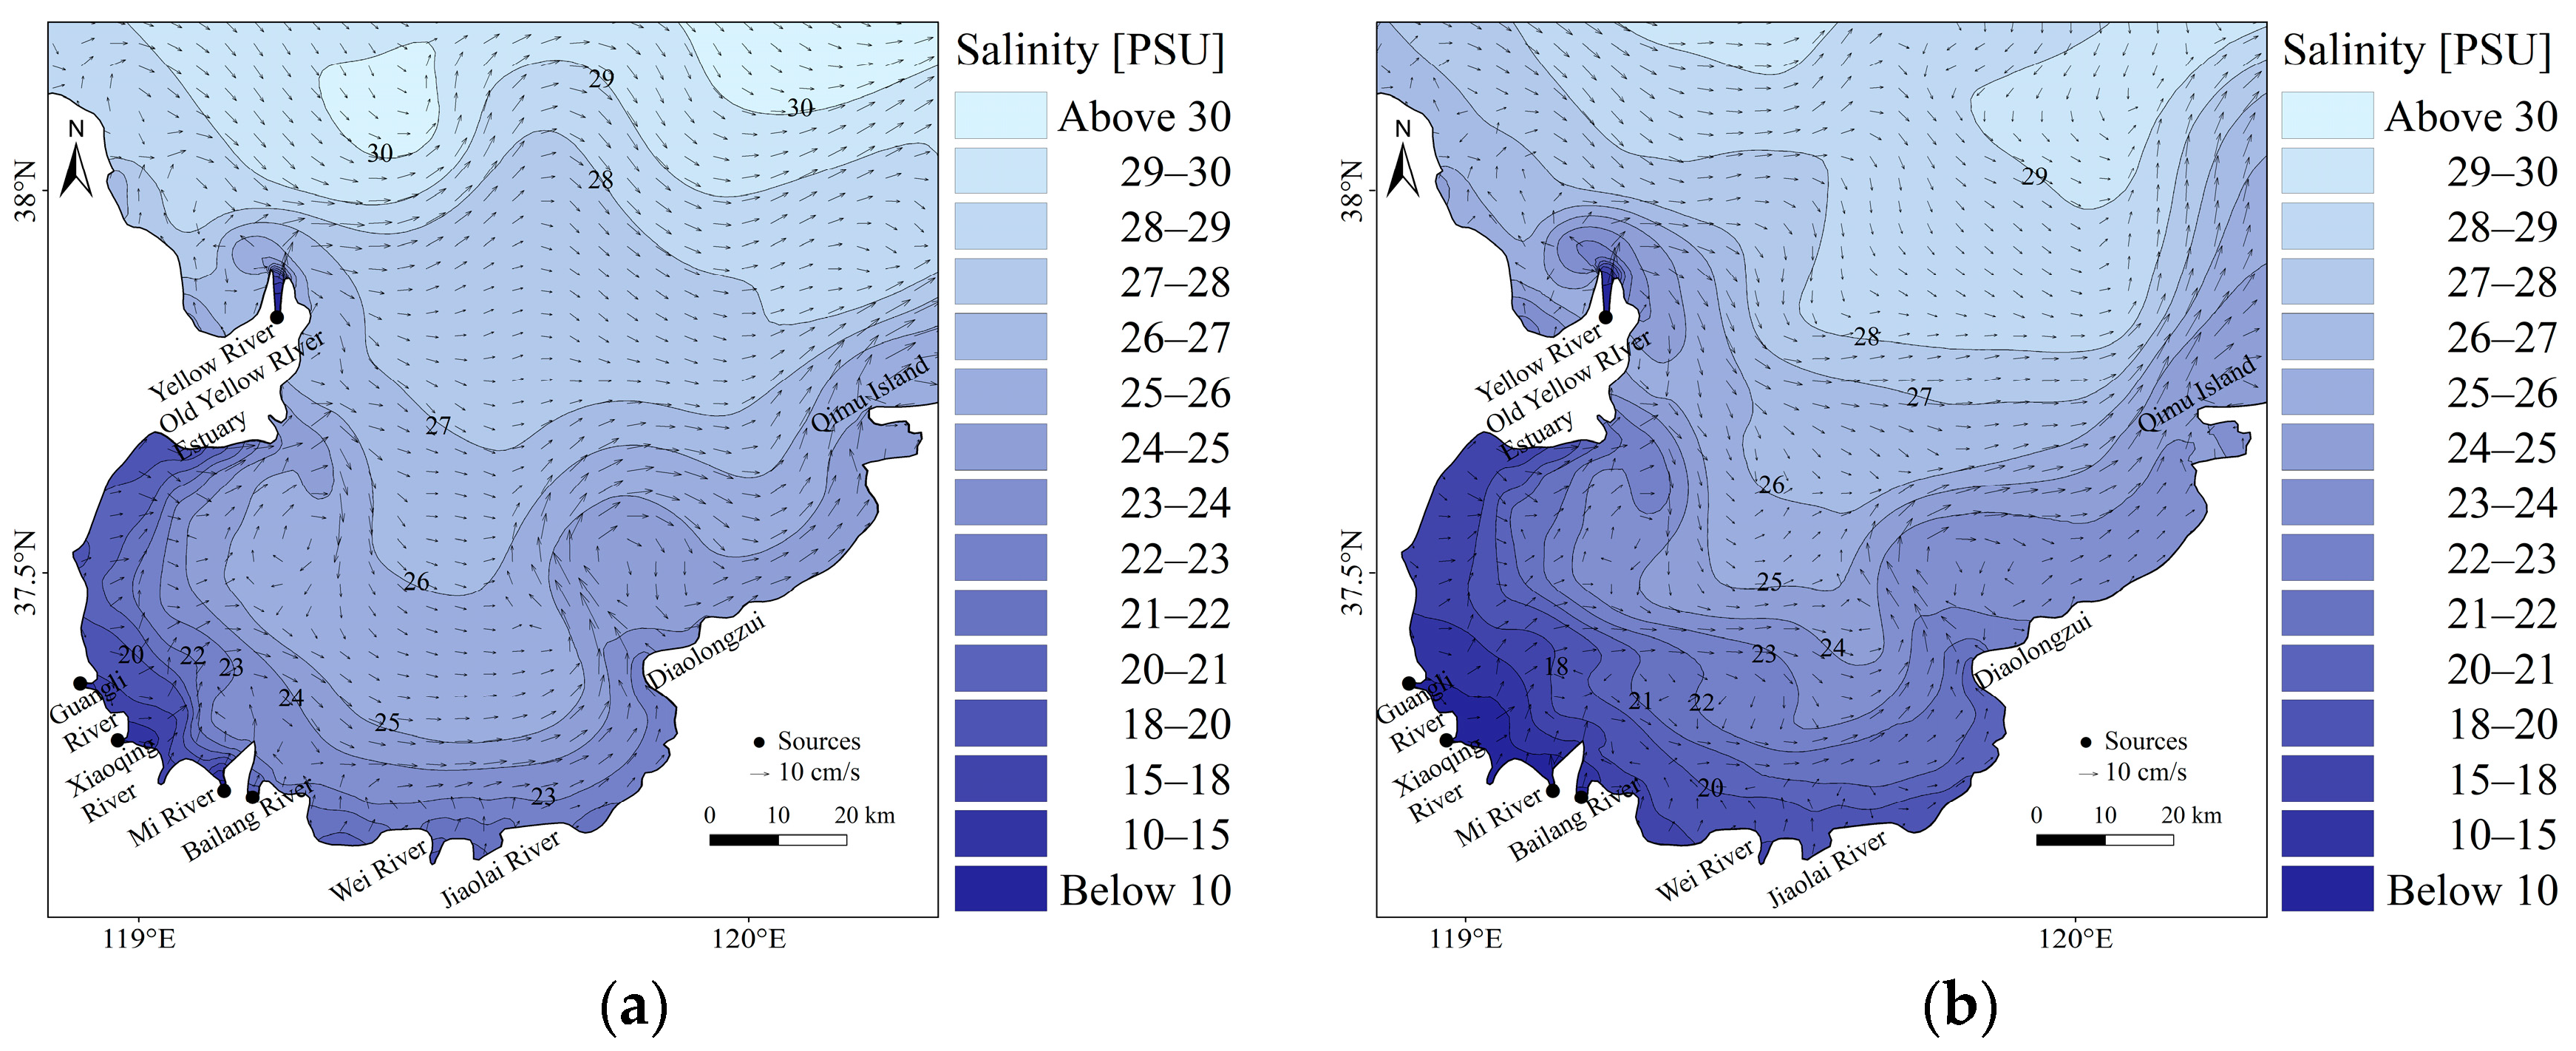
- The surface salinity distribution in Laizhou Bay is significantly influenced by both freshwater runoff and residual currents. The salinity isohalines at the bay’s entrance, southern, and eastern regions generally align with the direction of the residual currents. Within the bay, the residual currents predominantly flow eastward, with a pronounced coastal transport feature in the southern region. Freshwater inputs from various directions converge near the southern coast of Laizhou Bay, creating an extensive low-salinity region. The bottom salinity distribution largely mirrors that of the surface layer. As water depth increases, the influence of runoff gradually weakens, and the isohalines shift shoreward under the influence of high-salinity water transported by the residual currents from the Bohai Sea.
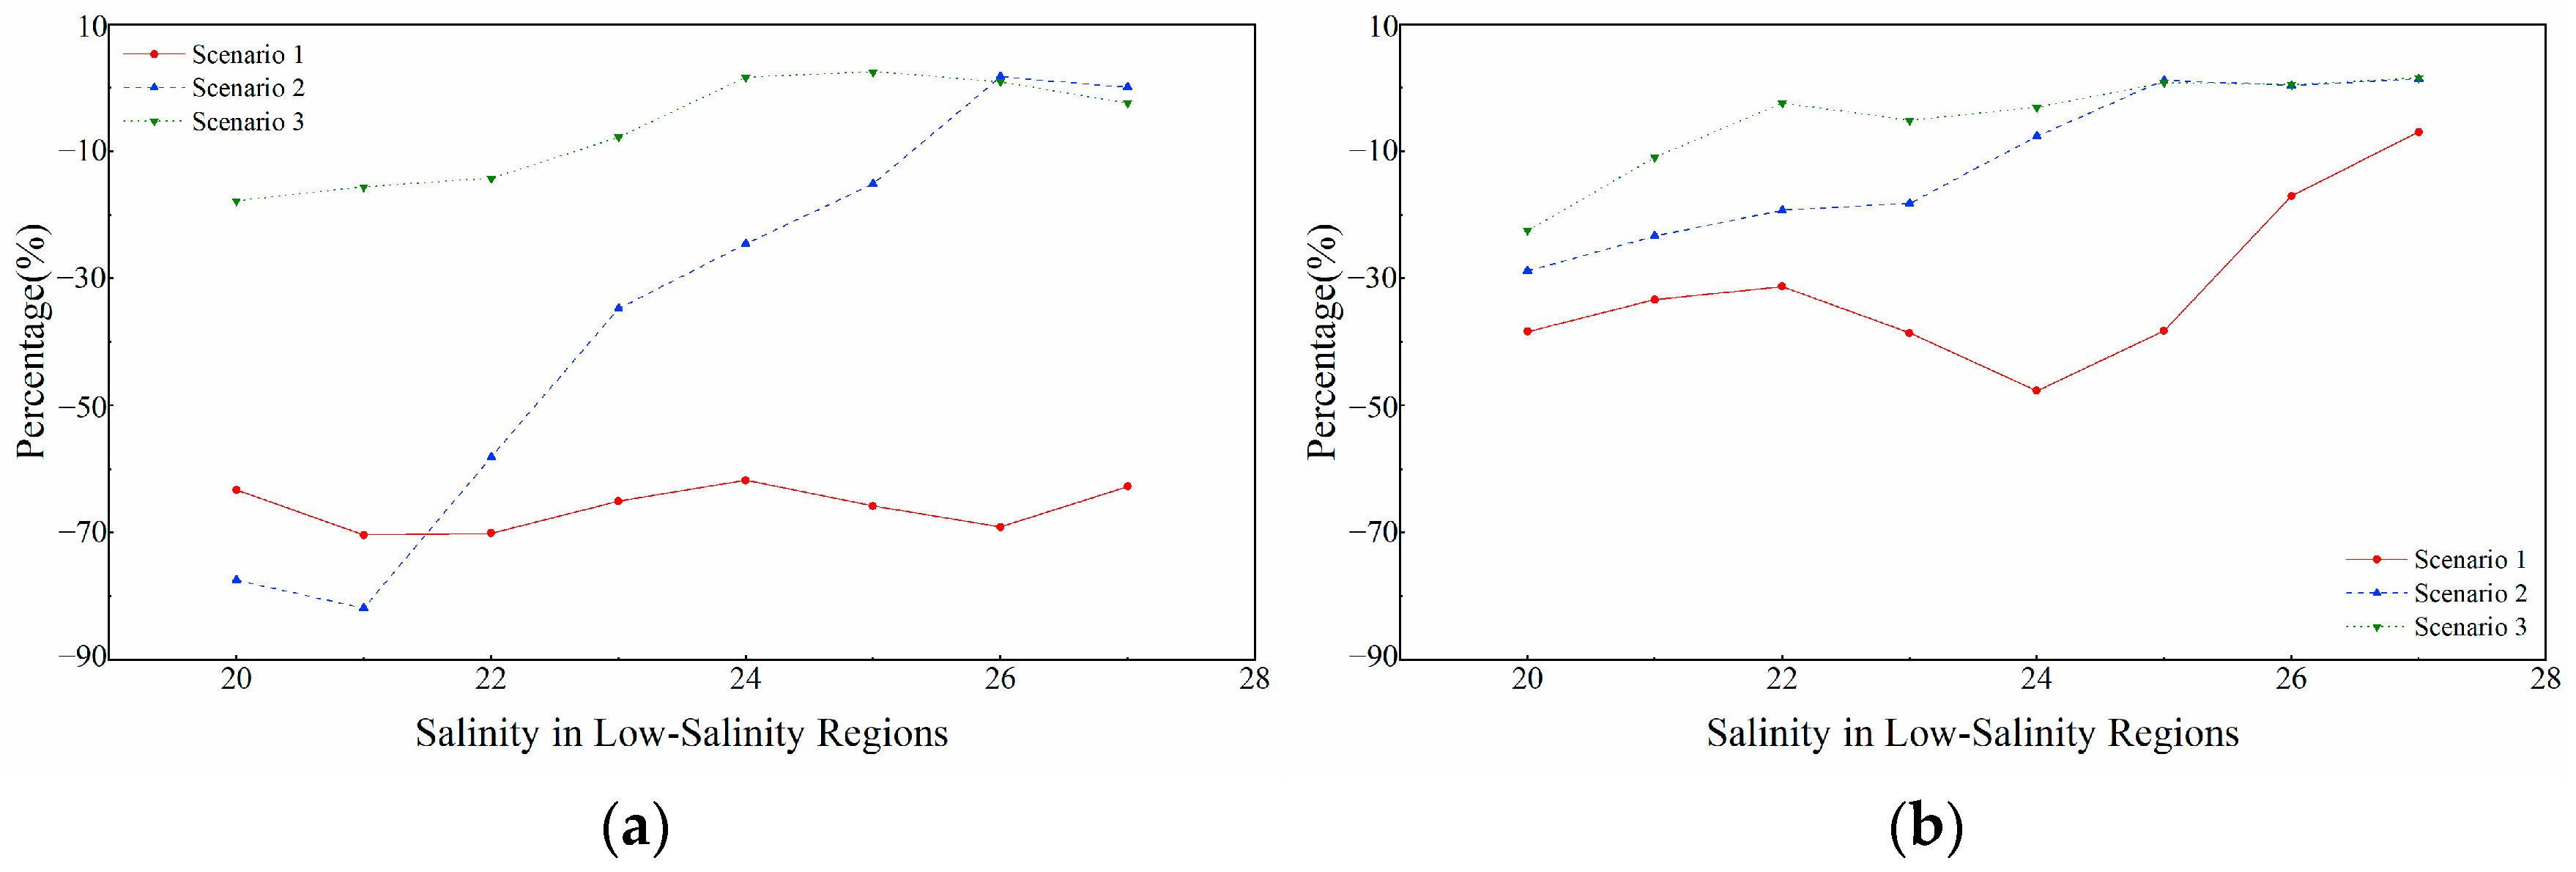
- In 2022, the area surrounding the Bohai Sea experienced either a normal or exceptionally wet year. By comparing the salinity simulation results with historical multi-year salinity distribution data of the Bohai Sea, it was found that the salinity level in Laizhou Bay that year was close to that of historical wet years and showed significant differences compared to dry years. Following the removal of the Yellow River runoff, the surface mean salinity in Laizhou Bay increased by 2.29 PSU during the dry season and 1.78 PSU during the wet season. The removal of southwest runoff resulted in salinity increases of 0.55 PSU and 1.16 PSU for the dry and wet seasons. Similarly, the removal of southeast runoff led to salinity increases of 0.13 PSU and 0.58 PSU for the dry and wet seasons, respectively. The main freshwater input pathways in Laizhou Bay, such as runoff and precipitation, are influenced by seasonal and interannual variations and exhibit relatively sensitive responses in salinity distribution [5,6].
- In this study, the seven major runoffs entering Laizhou Bay are classified into three directional runoff inputs: the Yellow River, the southwest, and the southeast. Their effects on the mean salinity and the extent of low-salinity regions in Laizhou Bay, from most to least significant, are as follows: the Yellow River runoff, the southwest runoff, and the southeast runoff. Changes in the size of low-salinity regions are influenced by runoff volume, residual currents, and the definition of low-salinity boundaries. Under the boundary conditions of the 20 and 21 PSU isohalines, the southwestern runoff affects the change in the area of the low-salinity region by over 10% compared to the Yellow River runoff, even though the Yellow River has a significantly larger runoff volume. Additionally, variations in runoff input can influence nearshore residual currents, potentially causing an expansion rather than a reduction of the low-salinity region with salinity levels above 24 PSU, even when freshwater inflow decreases.
Author Contributions
Funding
Institutional Review Board Statement
Informed Consent Statement
Data Availability Statement
Conflicts of Interest
References
- Xing, Q.; Braga, F.; Tosi, L.; Lou, M.; Zaggia, L.; Teatini, P.; Gao, X.; Yu, L.; Wen, X.; Shi, P. Detection of Low Salinity Groundwater Seeping into the Eastern Laizhou Bay (China) with the Aid of Landsat Thermal Data. J. Coast. Res. 2016, 74, 149–156. [Google Scholar] [CrossRef]
- Xiang, X.; Zhang, X.; Bian, X.; Lou, Q.; Xiong, Y. HSI Model for Early Life Stages of Anchovy Considering Transport Processes in Laizhou Bay. Front. Mar. Sci. 2022, 9, 946114. [Google Scholar] [CrossRef]
- Wang, X.; Li, H.; Jiao, J.J.; Barry, D.A.; Li, L.; Luo, X.; Wang, C.; Wan, L.; Wang, X.; Jiang, X.; et al. Submarine Fresh Groundwater Discharge into Laizhou Bay Comparable to the Yellow River Flux. Sci. Rep. 2015, 5, 8814. [Google Scholar] [CrossRef]
- Zhao, J.; Li, Q.; Ding, Y.; Liu, Y.; Tan, G.; Shen, X.; Wu, Q. Interdecadal increase of summer precipitation in North China in the early 2010s and its association with atmospheric circulation anomalies. Acta Meteorol. Sin. 2023, 81, 764–775. [Google Scholar] [CrossRef]
- Wang, Y.; Liu, Z.; Gao, H.; Ju, L.; Guo, X. Response of Salinity Distribution around the Yellow River Mouth to Abrupt Changes in River Discharge. Cont. Shelf Res. 2011, 31, 685–694. [Google Scholar] [CrossRef]
- Sui, Y.; Shi, H.; You, Z.; Qiao, S.; Sun, J. Long-Term Trend and Change Point Analysis on Runoff and Sediment Flux into the Sea from the Yellow River during the Period of 1950–2018. J. Coast. Res. 2020, 99, 203. [Google Scholar] [CrossRef]
- Su, Z.; Wang, Y.; Dong, Z.; Zhang, Y.; Liu, D.; Wang, Y. Response of phytoplankton assemblages to the water-sediment regulation in the adjacent sea of the Yellow River mouth. Haiyang Xuebao 2015, 37, 62–75. [Google Scholar] [CrossRef]
- Walling, D.E. Human Impact on Land–Ocean Sediment Transfer by the World’s Rivers. Geomorphology 2006, 79, 192–216. [Google Scholar] [CrossRef]
- Pilkaitytë, R.; Schoor, A.; Schubert, H. Response of Phytoplankton Communities to Salinity Changes—A Mesocosm Approach. Hydrobiologia 2004, 513, 27–38. [Google Scholar] [CrossRef]
- Yang, Y.; Zhu, M.; Song, Q.; Wang, X.; Li, F.; Zhang, X.; Pang, Z.; Su, B. The Water-Sediment Regulation Schemem on the Community Structure of Ichthyoplankton in the Yellow River Esturay. Acta Hydrobiol. Sin. 2024, 48, 488–503. [Google Scholar] [CrossRef]
- Islam, M.S.; Hibino, M.; Tanaka, M. Distribution and Diets of Larval and Juvenile Fishes: Influence of Salinity Gradient and Turbidity Maximum in a Temperate Estuary in Upper Ariake Bay, Japan. Estuar. Coast. Shelf Sci. 2006, 68, 62–74. [Google Scholar] [CrossRef]
- Zhao, J.; Shi, C.; Li, S. Low-Salinity Region and the Salinity Characteristics of the Low-Salinity Region in Bohai Sea. Stud. Mar. Sin. 1998, 40, 249–260. [Google Scholar]
- Lin, C.; Su, J.; Xu, B.; Tang, Q. Long-Term Variations of Temperature and Salinity of the Bohai Sea and Their Influence on Its Ecosystem. Prog. Oceanogr. 2001, 49, 7–19. [Google Scholar] [CrossRef]
- Yu, H.; Bao, X.; Lü, C.; Chen, X.; Kuang, L. Analyses of the Long-Term Salinity Variability in the Bohai Sea and the Northern Huanghai(Yellow) Sea. Acta Oceanol. Sin. 2009, 28, 1–8. [Google Scholar]
- Meng, L.; Xing, Q.; Gao, X.; Ji, D.; Qu, F.; Wang, X.; Ji, L. Effects of an Episodic Storm-Induced Flooding Event on the Biogeochemistry of a Shallow, Highly Turbid, Semi-Enclosed Embayment (Laizhou Bay, Bohai Sea). Sustainability 2022, 15, 563. [Google Scholar] [CrossRef]
- Shi, H.; Li, Q.; Sun, J.; Gao, G.; Sui, Y.; Qiao, S.; You, Z. Variation of Yellow River Runoff and Its Influence on Salinity in Laizhou Bay. J. Ocean Univ. China 2020, 19, 1235–1244. [Google Scholar] [CrossRef]
- Li, N.; Lou, A.; Zhang, X.; Liu, Y.; Wang, X. Three Dimensional Numerical Simulation of Temperature and Salinity in the Bohai Sea Based on MIKE3. Trans. Oceanol. Limnol. 2019, 2019, 1–9. [Google Scholar] [CrossRef]
- Qin, H.; Shi, H.; Gai, Y.; Qiao, S.; Li, Q. Sensitivity Analysis of Runoff and Wind with Respect to Yellow River Estuary Salinity Plume Based on FVCOM. Water 2023, 15, 1378. [Google Scholar] [CrossRef]
- Yellow River Conservancy Commission of Ministry of Water Resources. Yellow River Sediment Bulletin 2022; Yellow River Conservancy Commission of Ministry of Water Resources: Zhengzhou, China, 2023; pp. 5–15. [Google Scholar]
- Ministry of Water Resources of the People’s Republic of China. China River Sediment Bulletin 2022, 1st ed.; Water Resources and Hydropower Press: Beijing, China, 2023; pp. 20–43, 51–58. [Google Scholar]
- National Climate Center, China Meteorological Administration. China Climate Bulletin (2022); China Meteorological Administration: Beijing, China, 2023; pp. 11–19, 30–40. [Google Scholar]
- Du, J.; Tao, L.; Xu, C. Interdecadal Variation of Land Precipitation in China and Relative Contributions of Global Warming, IPO and AMO. Acta Meteorol. Sin. 2022, 80, 685–700. [Google Scholar] [CrossRef]
- Hao, L.; He, L.; Ma, N.; Hao, Y. A Study on the Relationship between Interannual Summer Precipitation Anomalies in North China and Atmospheric Dynamics and Water Vapor Conditions in the recent 60 Years. Trans. Atmos. Sci. 2023, 46, 587–599. [Google Scholar] [CrossRef]
- DHI. MIKE 21 & MIKE 3 Flow Model FM Hydrodynamic and Transport Module Scientific Documentation; DHI Software: Hørsholm, Denmark, 2014. [Google Scholar]
- Shang, X. A Numerical Study of the Nutrient Ecosystem Dynamics in Water Layer of Bohai Sea. Master’s Thesis, Ocean University of China, Qingdao, China, 2015. [Google Scholar]
- Morianou, G.G.; Kourgialas, N.N.; Karatzas, G.P. Comparison between Curvilinear and Rectilinear Grid Based Hydraulic Models for River Flow Simulation. Procedia Eng. 2016, 162, 568–575. [Google Scholar] [CrossRef]
- Wang, W.; Hu, Z.; Li, M.; Zhang, H. Assessment of Tidal Current Energy Resources in the Pearl River Estuary Using a Numerical Method. Water 2023, 15, 3990. [Google Scholar] [CrossRef]
- Songliao River Water Resources Commission of Ministry of Water Resources. Songliao River Water Resources Bulletin 2022; Songliao River Water Resources Commission of Ministry of Water Resources: Changchun, China, 2023; pp. 4–7. [Google Scholar]
- Haihe River Water Resources Commission of Ministry of Water Resources. Haihe River Water Resources Bulletin 2022; Haihe River Water Resources Commission of Ministry of Water Resources: Tianjin, China, 2023; pp. 3–13. [Google Scholar]
- Water Resources Department of Shandong Province. Shandong Province Resources Bulletin 2022; Water Resources Department of Shandong Province: Jinan, China, 2023; pp. 3–13. [Google Scholar]
- Weifang City Water Resources Bureau; Weifang Hydrological Center. Weifang City Resources Bulletin 2022; Weifang Hydrological Center: Jinan, China, 2023; pp. 1–9. [Google Scholar]
- Cui, Z. Study on Scheme of Total Emission Control of Main Chemical Pollutants in 13 Cities around Bohai Sea. Ph.D. Thesis, Ocean University of China, Qingdao, China, 2008. [Google Scholar]
- Xu, J.; Yuan, C. Numerical Simulation of Microplastic Distribution and Transport in the Bohai Sea Based on OpenDrift Model. J. Tianjin Univ. Sci. Techonology 2024, 1–12. [Google Scholar] [CrossRef]
- Yu, Q.; Lou, A.; Zhang, X.; Li, N. Numerical Analysis on the Impact of Main River Runoff on the Plain Distribution in the Low-Salinity Area at North Liaodong Bay. Trans. Oceanol. Limnol. 2018, 2018, 88–96. [Google Scholar] [CrossRef]
- Nie, C. Coastline and Bathymetry Changes and its Hydrodynamic Effects Numerical Study in the Bohai Bay-Laizhou Bay. Master’s Thesis, Shanghai Ocean University, Shanghai, China, 2023. [Google Scholar]
- Allen, J.I.; Somerfield, P.J.; Gilbert, F.J. Quantifying Uncertainty in High-Resolution Coupled Hydrodynamic-Ecosystem Models. J. Mar. Syst. 2007, 64, 3–14. [Google Scholar] [CrossRef]
- Zhao, J.; Xu, Z.; Zuo, D.; Zhang, L. Radiation-based Methods to Estimate Potential Evapotranspiration in the Heihe River Basin. J. Arid. Land Resour. Environ. 2013, 27, 107–114. [Google Scholar] [CrossRef]
- Liang, Y. Study on Flood Resource Utilization in Chaobai River Basin by Coupling Hydrodynamics and Reservoir Operation. Master’s Thesis, Xi’an University of Technology, Xi’an, China, 2024. [Google Scholar]
- Legates, D.R.; McCabe, G.J., Jr. Evaluating the Use of “Goodness-of-Fit” Measures in Hydrologic and Hydroclimatic Model Validation. Water Resour. Res. 1999, 35, 233–241. [Google Scholar] [CrossRef]
- Reda, Y.; Moges, A.; Kendie, H. Application of the Modified Universal Soil Loss Equation (MUSLE) for the Prediction of Sediment Yield in Agewmariam Experimental Watershed, Tekeze River Basin, Northern Ethiopia. Heliyon 2024, 10, e35052. [Google Scholar] [CrossRef]
- Derbie, M.; Beyene, A.A.; Asres, S.; Yenesew, M. Modelling Soil Water and Nutrient Dynamics under Different Irrigation Techniques of Onion Production. Water Sci. 2024, 38, 485–500. [Google Scholar] [CrossRef]
- Willmott, C.J. On the Validation of Models. Phys. Geogr. 1981, 2, 184–194. [Google Scholar] [CrossRef]
- Rahim, B.E.A.; Yusoff, I. A Practical Approach for Numerical Modeling of a Complex and Data-Limited Hydrological System. Hydrol. Res. 2023, 54, 1368–1386. [Google Scholar] [CrossRef]
- Tang, Y. An Outline of Researches on Tide-Induced Residual Current. J. Oceanogr. Huanghai Bohai Seas 1987, 5, 73–80. [Google Scholar]
- Zhao, B.; Fang, G.; Cao, D. Characteristics of Tidal Residual Currents and Their Relations with Coastal Current Transports in the Bohai Sea, Yellow Sea and East China Sea. Stud. Mar. Sin. 1995, 36, 1–11. [Google Scholar]
- Li, F. Numerical Simulation of Tidal Currents and Tide-induced Residual Currents in Bohai Sea. Master’s Thesis, Tianjin University, Tianjin, China, 2011. [Google Scholar]
- Longuet-Higgins, M.S. On the Transport of Mass by Time-Varying Ocean Currents. Deep. Sea Res. Oceanogr. Abstr. 1969, 16, 431–447. [Google Scholar] [CrossRef]
- Wei, H.; Hainbucher, D.; Pohlmann, T.; Feng, S.; Suendermann, J. Tidal-Induced Lagrangian and Eulerian Mean Circulation in the Bohai Sea. J. Mar. Syst. 2004, 44, 141–151. [Google Scholar] [CrossRef]
- Shizuo, F. A Three-Dimensional Weakly Nonlinear Dynamics on Tide-Induced Lagrangian Residual Current and Mass-Transport. Chin. J. Ocean. Limnol. 1986, 4, 139–158. [Google Scholar] [CrossRef]
- Yu, X.; Guo, X.; Gao, H. Detachment of Low-Salinity Water from the Yellow River Plume in Summer. J. Geophys. Res. Ocean. 2020, 125, 2020JC016344. [Google Scholar] [CrossRef]
- Wang, X.; Li, H.; Zhang, Y.; Zheng, C.; Gao, M. Investigation of Submarine Groundwater Discharge and Associated Nutrient Inputs into Laizhou Bay (China) Using Radium Quartet. Mar. Pollut. Bull. 2020, 157, 111359. [Google Scholar] [CrossRef]
- Lü, C.; Bao, X.; Wu, D.; Chen, X.; Yu, H. Analysis of Decadal Varialibity and Internalannual Variability of Salinity Field in Bohai and Northern Yellow Sea in Winter. Period. Ocean. Univ. Chian 2009, 39, 267–273. [Google Scholar] [CrossRef]
- Fong, D.A.; Geyer, W.R. The Alongshore Transport of Freshwater in a Surface-Trapped River Plume. J. Phys. Oceanogr. 2002, 32, 957–972. [Google Scholar] [CrossRef]
- Mehrfar, H.; Raeisi, A.; Azad, M.T.; Reisosadat, S.M.R. Numerical Study of the Effects of Coastal Currents and Meso-Scale Eddies on the Spread of Pollution in the Persian Gulf. Int. J. Environ. Sci. Technol. 2023, 20, 7099–7116. [Google Scholar] [CrossRef]
- Xiao, C.; Zhang, L.; Yang, J. Study on the Change of Low-Salinity Area in the Yellow River Estuary and its Coastal Zone from 2004 to 2009. Period. Ocean. Univ. China 2012, 42, 40–46. [Google Scholar] [CrossRef]
- Moon, J.-H.; Kim, T.; Son, Y.B.; Hong, J.-S.; Lee, J.-H.; Chang, P.-H.; Kim, S.-K. Contribution of Low-Salinity Water to Sea Surface Warming of the East China Sea in the Summer of 2016. Prog. Oceanogr. 2019, 175, 68–80. [Google Scholar] [CrossRef]
- Lie, H.; Cho, C.; Lee, J.; Lee, S. Structure and Eastward Extension of the Changjiang River Plume in the East China Sea. J. Geophys. Res. 2003, 108, 2001JC001194. [Google Scholar] [CrossRef]
- Shetye, S.R.; Gouveia, A.D.; Shankar, D.; Shenoi, S.S.C.; Vinayachandran, P.N.; Sundar, D.; Michael, G.S.; Nampoothiri, G. Hydrography and Circulation in the Western Bay of Bengal during the Northeast Monsoon. J. Geophys. Res. 1996, 101, 14011–14025. [Google Scholar] [CrossRef]
- Wu, L.; Wang, F.; Yuan, D.; Cui, M. Evolution of Freshwater Plumes and Salinity Fronts in the Northern Bay of Bengal. J. Geophys. Res. 2007, 112, 2005JC003308. [Google Scholar] [CrossRef]
- Jurisa, J.T.; Chant, R.J. Impact of Offshore Winds on a Buoyant River Plume System. J. Phys. Oceanogr. 2013, 43, 2571–2587. [Google Scholar] [CrossRef]
- Attias, E.; Constable, S.; Sherman, D.; Ismail, K.; Shuler, C.; Dulai, H. Marine Electromagnetic Imaging and Volumetric Estimation of Freshwater Plumes Offshore Hawai’i. Geophys. Res. Lett. 2021, 48, e2020GL091249. [Google Scholar] [CrossRef]
- Fofonova, V.; Danilov, S.; Androsov, A.; Janout, M.; Bauer, M.; Overduin, P.; Itkin, P.; Wiltshire, K.H. Impact of Wind and Tides on the Lena River Freshwater Plume Dynamics in the Summer Season. Ocean. Dyn. 2015, 65, 951–968. [Google Scholar] [CrossRef]
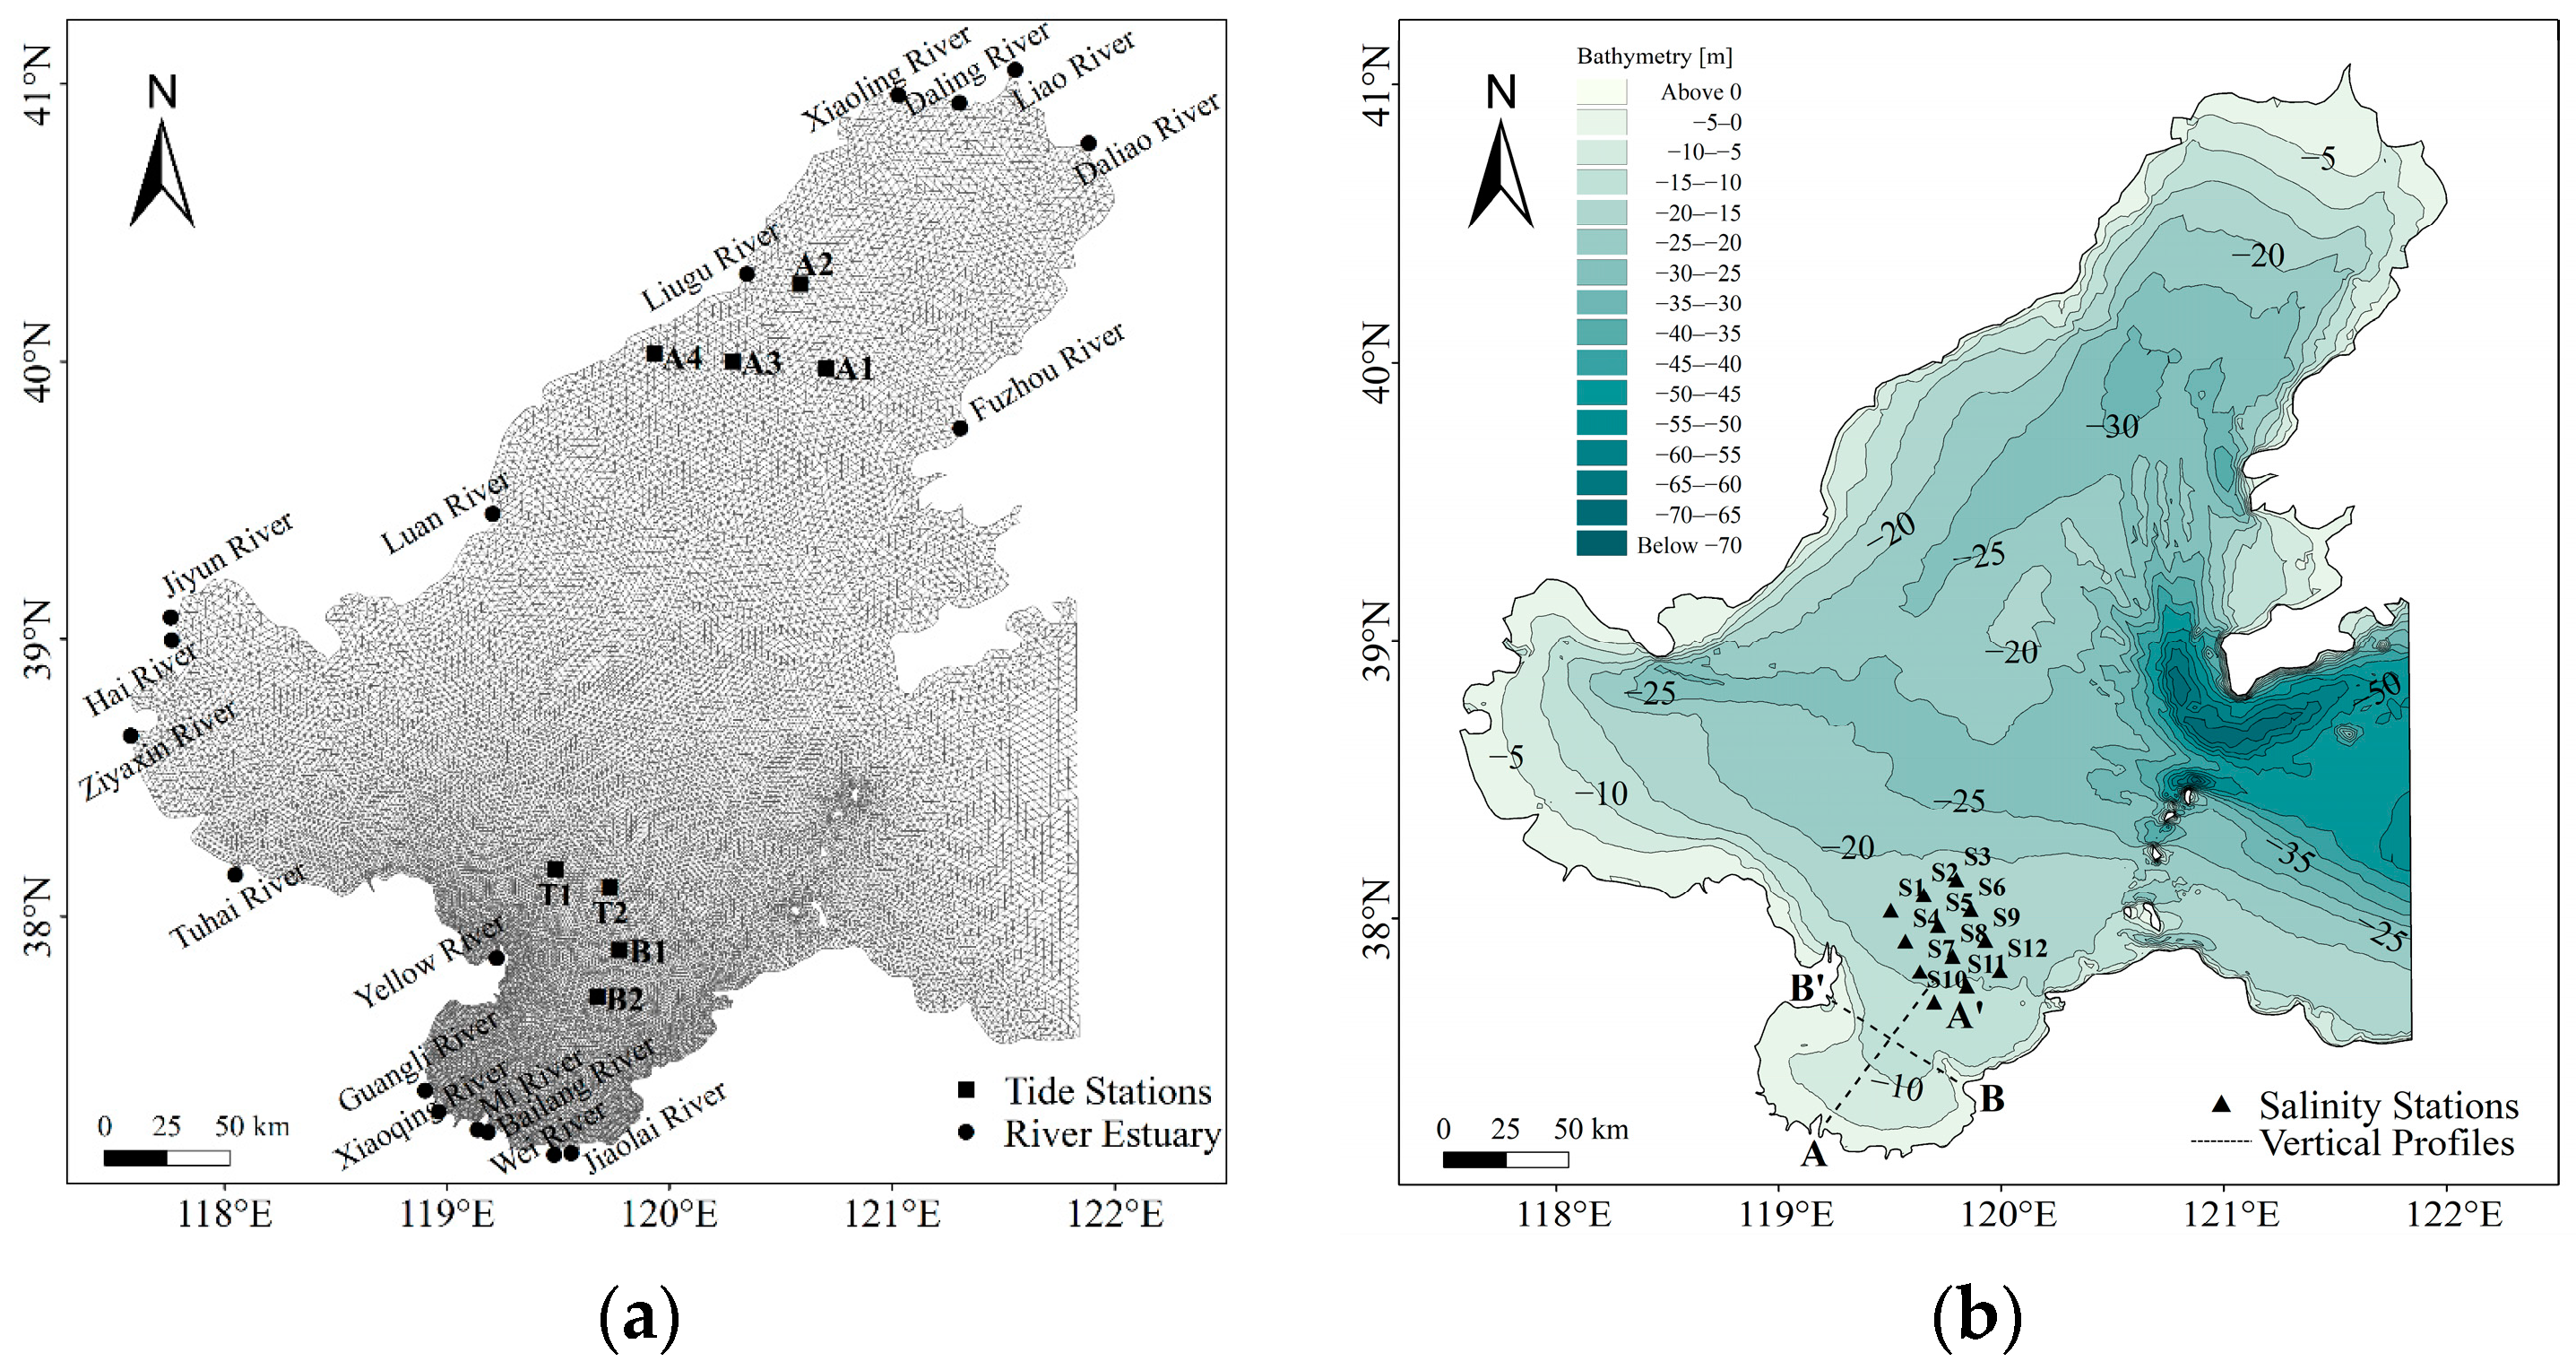



| Station Name | Longitude (°, E) | Latitude (°, N) | Time |
|---|---|---|---|
| A1 | 120.8592 | 39.9093 | 20 April 2021–20 May 2021 |
| A2 | 120.7558 | 40.2174 | 20 April 2021–20 May 2021 |
| A3 | 120.4231 | 39.9501 | 20 April 2021–20 May 2021 |
| A4 | 120.0580 | 39.9886 | 20 April 2021–20 May 2021 |
| T1 | 119.5275 | 38.1407 | 18 April 2022–3 May 2022 |
| T2 | 119.7739 | 38.0718 | 18 April 2022–3 May 2022 |
| B1 | 119.8094 | 37.8439 | 27 November 2023–1 December 2023 |
| B2 | 119.7014 | 37.6763 | 27 November 2023–1 December 2023 |
| Name of Station | Validation Target | MAE | RMSE | NSE | d |
|---|---|---|---|---|---|
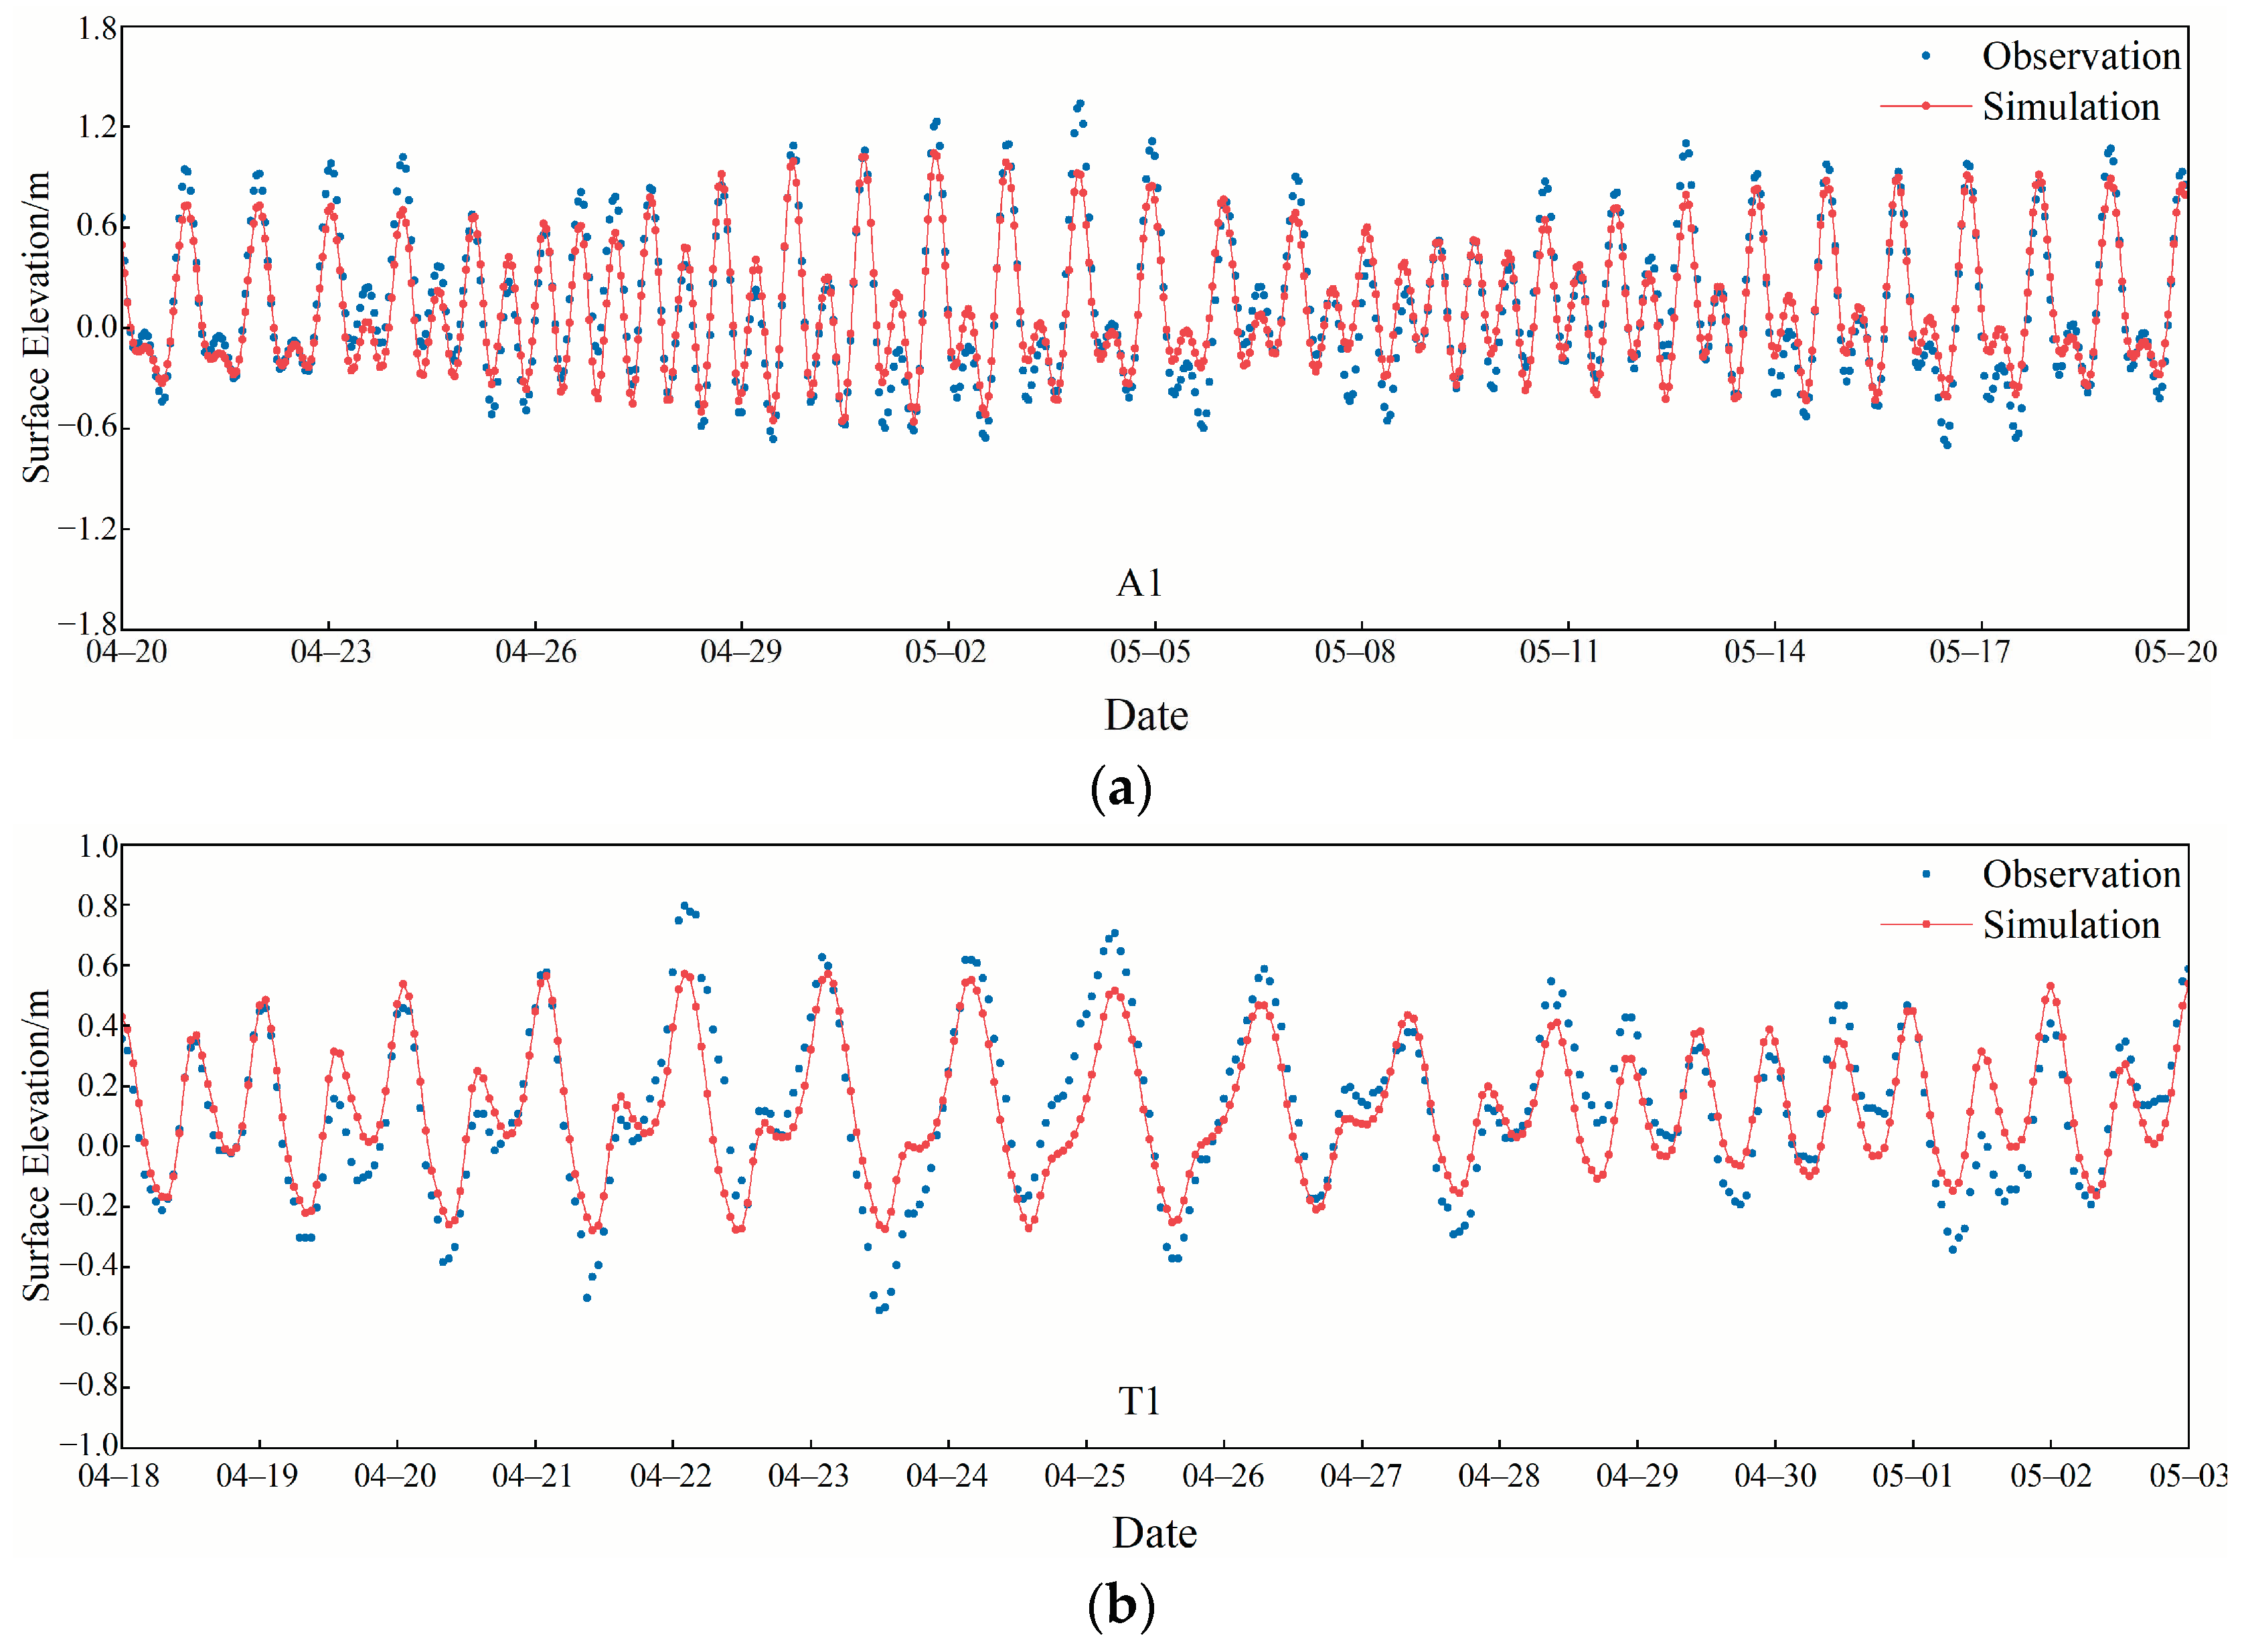
| A1 | Surface Elevation | 0.12 | 0.15 | 0.88 | 0.96 |
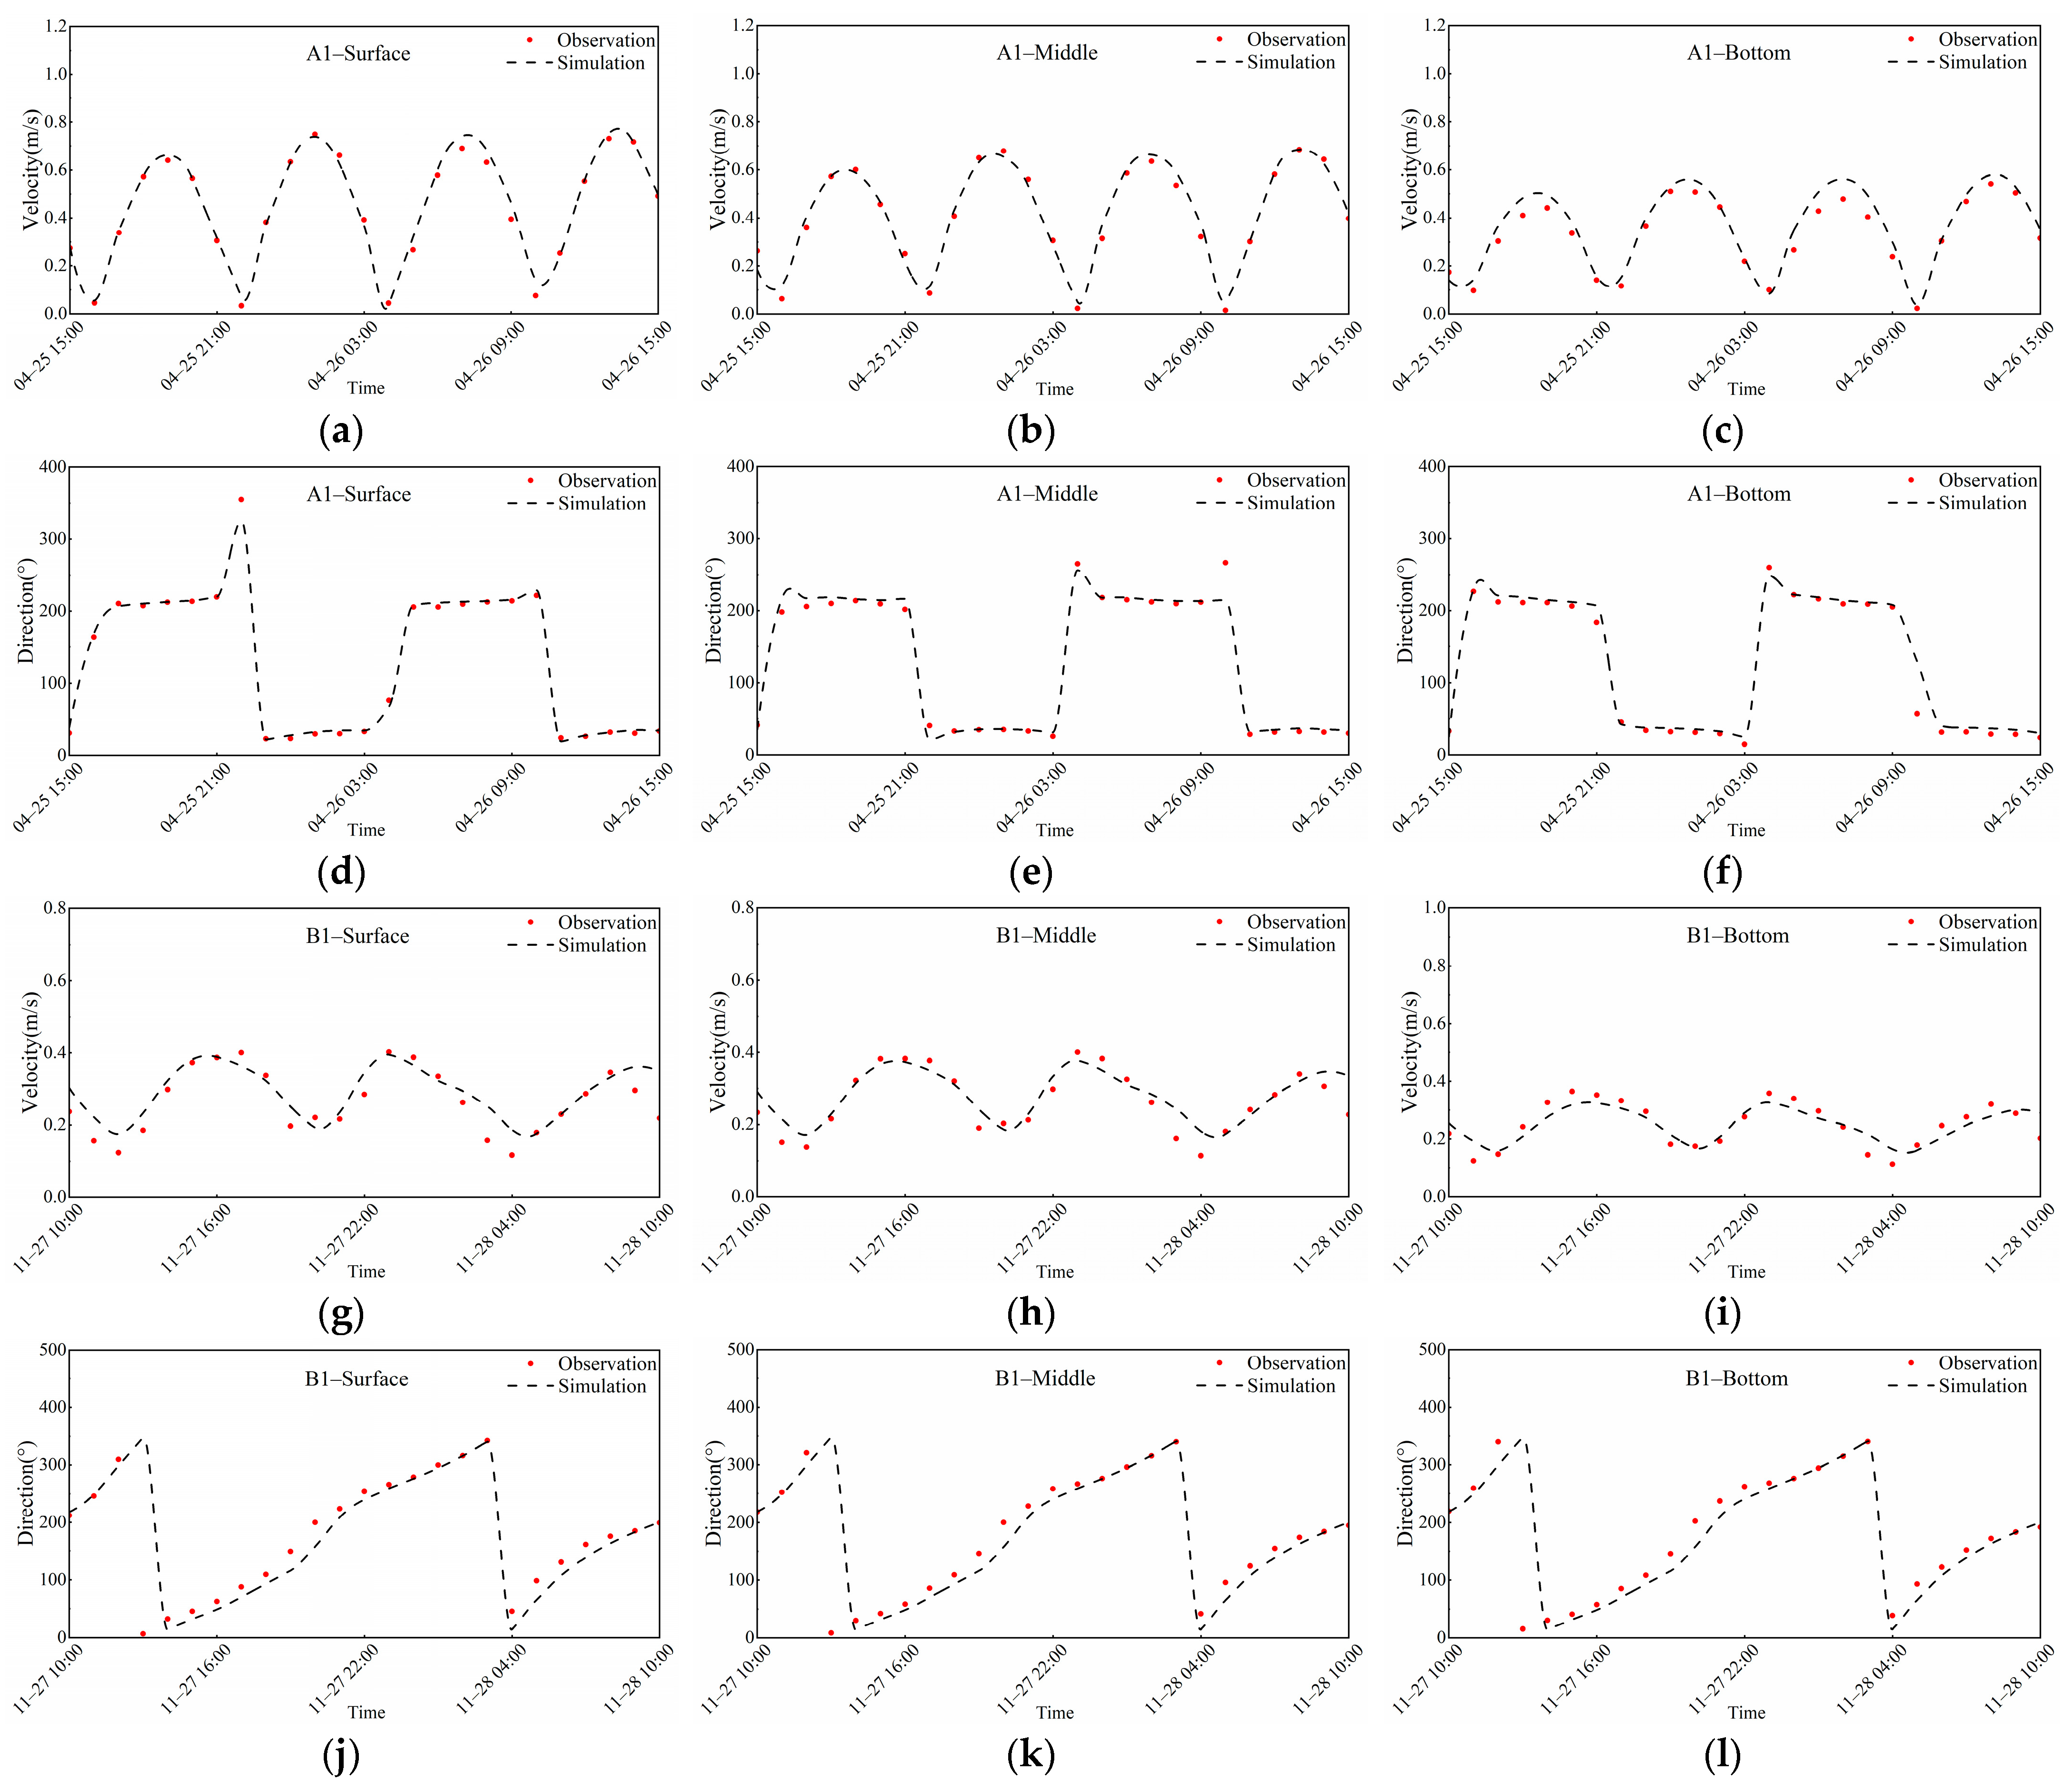
| Surface current speed | 0.02 | 0.03 | 0.98 | 1.00 | |
| Middle current speed | 0.03 | 0.03 | 0.98 | 0.99 | |
| Bottom current speed | 0.04 | 0.05 | 0.89 | 0.98 | |
| Surface current direction | 4.20 | 7.10 | 0.99 | 1.00 | |
| Middle current direction | 7.58 | 13.12 | 0.98 | 1.00 | |
| Bottom current direction | 8.94 | 16.65 | 0.97 | 0.99 | |
| A2 | Surface Elevation | 0.13 | 0.16 | 0.91 | 0.97 |
| Surface current speed | 0.05 | 0.06 | 0.92 | 0.98 | |
| Middle current speed | 0.03 | 0.03 | 0.97 | 0.99 | |
| Bottom current speed | 0.04 | 0.05 | 0.87 | 0.97 | |
| Surface current direction | 13.51 | 18.92 | 0.96 | 0.99 | |
| Middle current direction | 4.20 | 7.10 | 0.99 | 1.00 | |
| Bottom current direction | 15.49 | 18.79 | 0.96 | 0.99 | |
| T1 | Surface Elevation | 0.11 | 0.13 | 0.76 | 0.92 |
| T2 | Surface Elevation | 0.11 | 0.14 | 0.78 | 0.93 |
| B1 | Surface Elevation | 0.05 | 0.06 | 0.96 | 0.99 |
| Surface current speed | 0.04 | 0.05 | 0.71 | 0.91 | |
| Middle current speed | 0.03 | 0.04 | 0.78 | 0.93 | |
| Bottom current speed | 0.03 | 0.04 | 0.74 | 0.91 | |
| Surface current direction | 14.96 | 18.75 | 0.96 | 0.99 | |
| Middle current direction | 14.34 | 17.98 | 0.97 | 0.99 | |
| Bottom current direction | 15.70 | 19.87 | 0.96 | 0.99 | |
| B2 | Surface Elevation | 0.05 | 0.06 | 0.95 | 0.99 |
| Surface current speed | 0.06 | 0.07 | 0.71 | 0.90 | |
| Middle current speed | 0.05 | 0.06 | 0.74 | 0.91 | |
| Bottom current speed | 0.05 | 0.06 | 0.71 | 0.90 | |
| Surface current direction | 22.59 | 25.94 | 0.94 | 0.98 | |
| Middle current direction | 17.94 | 21.55 | 0.96 | 0.99 | |
| Bottom current direction | 15.91 | 19.80 | 0.97 | 0.99 |
| Water Layers-Seasons | MAE (PSU) | RMSE (PSU) | d |
|---|---|---|---|
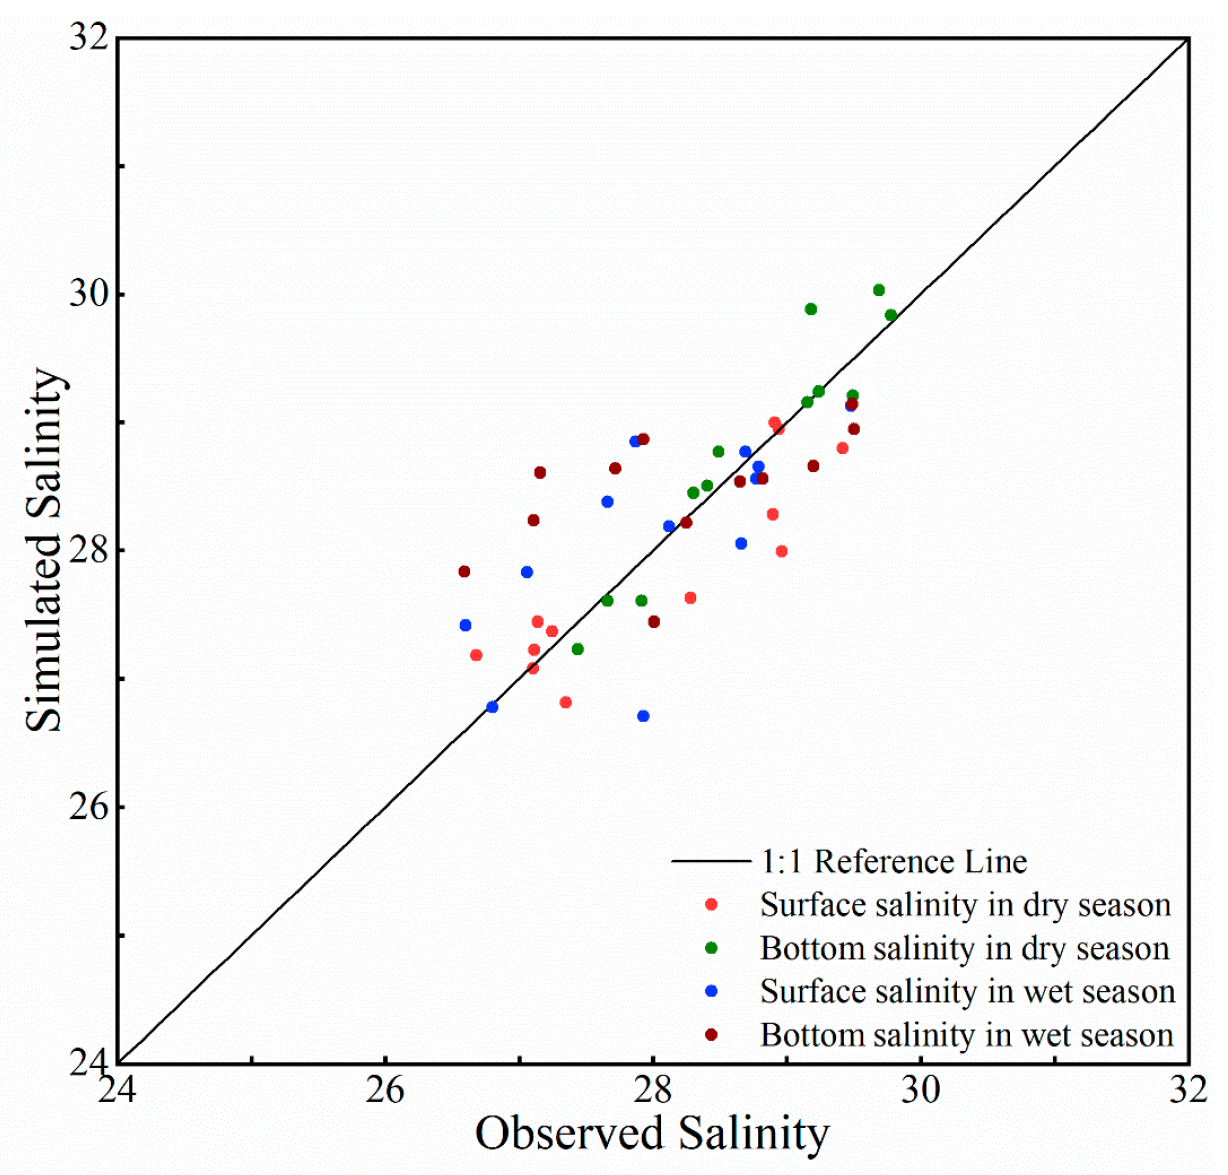
| Surface salinity in dry season | 0.41 | 0.50 | 0.90 |
| Bottom salinity in dry season | 0.16 | 0.20 | 0.99 |
| Surface salinity in wet season | 0.60 | 0.72 | 0.71 |
| Bottom salinity in wet season | 0.54 | 0.66 | 0.77 |
| Runoff Input | Monthly Runoff during the Dry Season/108 m3 | Monthly Runoff during the Wet Season/108 m3 |
|---|---|---|
| Yellow River Runoff Input | 9.85 | 17.95 |
| Southwest Runoff Input | 0.98 | 5.17 |
| Southeast Runoff Input | 0.64 | 5.58 |
| Groups | Seasons | 20 PSU | 21 PSU | 22 PSU | 23 PSU | 24 PSU | 25 PSU | 26 PSU | 27 PSU |
|---|---|---|---|---|---|---|---|---|---|
| Control Group | Dry Season | 292.69 | 514.32 | 772.33 | 1146.69 | 1674.20 | 2833.78 | 4610.77 | 5813.37 |
| Wet Season | 1549.83 | 1795.01 | 2158.74 | 2823.67 | 3973.82 | 4551.92 | 5253.72 | 5908.90 | |
| Scenario 1 | Dry Season | 107.55 | 152.36 | 231.06 | 400.91 | 640.50 | 969.00 | 1425.31 | 2167.95 |
| Wet Season | 955.42 | 1197.27 | 1484.28 | 1734.84 | 2079.28 | 2812.58 | 4360.28 | 5501.16 | |
| Scenario 2 | Dry Season | 65.87 | 93.20 | 323.99 | 748.89 | 1263.72 | 2406.09 | 4693.52 | 5818.40 |
| Wet Season | 1103.46 | 1376.71 | 1743.85 | 2310.91 | 3672.51 | 4609.44 | 5275.11 | 5992.33 | |
| Scenario 3 | Dry Season | 240.69 | 434.32 | 662.82 | 1058.29 | 1702.94 | 2906.68 | 4656.73 | 5675.38 |
| Wet Season | 1201.72 | 1599.45 | 2108.12 | 2679.15 | 3854.17 | 4589.44 | 5280.88 | 6003.17 |
Disclaimer/Publisher’s Note: The statements, opinions and data contained in all publications are solely those of the individual author(s) and contributor(s) and not of MDPI and/or the editor(s). MDPI and/or the editor(s) disclaim responsibility for any injury to people or property resulting from any ideas, methods, instructions or products referred to in the content. |
© 2024 by the authors. Licensee MDPI, Basel, Switzerland. This article is an open access article distributed under the terms and conditions of the Creative Commons Attribution (CC BY) license (https://creativecommons.org/licenses/by/4.0/).
Share and Cite
Ju, K.; Xiong, L.; Liu, T.; Li, Z.; Zhang, M. Numerical Analysis of the Influence of Runoff Input on Salinity Distribution and Its Mechanisms in Laizhou Bay. J. Mar. Sci. Eng. 2024, 12, 1858. https://doi.org/10.3390/jmse12101858
Ju K, Xiong L, Liu T, Li Z, Zhang M. Numerical Analysis of the Influence of Runoff Input on Salinity Distribution and Its Mechanisms in Laizhou Bay. Journal of Marine Science and Engineering. 2024; 12(10):1858. https://doi.org/10.3390/jmse12101858
Chicago/Turabian StyleJu, Kaixuan, Lehang Xiong, Tao Liu, Zilong Li, and Minxia Zhang. 2024. "Numerical Analysis of the Influence of Runoff Input on Salinity Distribution and Its Mechanisms in Laizhou Bay" Journal of Marine Science and Engineering 12, no. 10: 1858. https://doi.org/10.3390/jmse12101858
APA StyleJu, K., Xiong, L., Liu, T., Li, Z., & Zhang, M. (2024). Numerical Analysis of the Influence of Runoff Input on Salinity Distribution and Its Mechanisms in Laizhou Bay. Journal of Marine Science and Engineering, 12(10), 1858. https://doi.org/10.3390/jmse12101858


