Article

Role of Organic Matter Present in the Water Column on Turbidity Flows

1
Section of Offshore and Dredging Engineering, Faculty of Mechanical Engineering, Delft University of Technology, 2628 CD Delft, The Netherlands
2
Section of Environmental Fluid Mechanics, Department of Hydraulic Engineering, Faculty of Civil Engineering and Geosciences, Delft University of Technology, 2628 CD Delft, The Netherlands
*
Author to whom correspondence should be addressed.
J. Mar. Sci. Eng. 2024, 12(10), 1884; https://doi.org/10.3390/jmse12101884
Submission received: 25 August 2024 / Revised: 8 October 2024 / Accepted: 10 October 2024 / Published: 21 October 2024
(This article belongs to the Special Issue Advanced Studies in Marine Geomechanics and Geotechnics)

Abstract

:
Turbidity flows are known to be affected by the density difference between sediment plumes and the surrounding water. However, besides density, other factors could lead to changes in flow propagation. Such a factor is the presence of suspended organic matter. Recently, it was found that flocculation does occur within plumes upon release of a sediment/organic matter mixture in a lock exchange flume. In the present study, mineral sediment (illite clay) was released into the outflow compartment containing water and synthetic organic matter (polyacrylamide flocculant). Even though the density of water was barely affected by the presence of flocculant, flow head velocity was observed to be larger in the presence of flocculant than without. Samples taken at different positions in the flume indicated that flocs were created during the small current propagation time (about 30–60 s) and that their sizes were larger with higher flocculant dosage. The size of flocs depended on their positions in the flow: flocs sampled in the body part of the flow were larger than the ones sampled at the bottom. All these properties are discussed as a function of sediment–flocculant interactions.

1. Introduction

The spreading of sediment plumes and the generation of turbidity currents are a consequence of human interventions, such as dredging or (deep-) sea mining. Dredging is a crucial activity for the construction and maintenance of ports and waterways, land reclamation, and flood and storm protection, to name a few [1,2,3]. Dredging is also carried out to excavate contaminated sediments, thereby improving water quality and aquatic ecosystems [4]. With the global population on the rise, deep-sea mining has appeared in recent years as an alternative source for rare metals. A significant amount of these high-grade metals are present in potato-shaped deposits known as polymetallic nodules at a depth of 4000–6000 m in the Pacific Ocean in an area known as the Clarion Clipperton Fracture Zone (CCFZ/CCZ).
During the process of extracting polymetallic nodules, the dispersion of sediment plumes behind the Sea-floor Mining Tool (SMT) is one of the main concerns that the deep-sea mining industry has to deal with. The excess water along with sediment that is discharged from the SMT travels through different regimes during the course of its release, as it propagates and eventually settles [5].
For any of these dredging or mining activities, the creation of turbidity plumes is an inevitable part. It leads to an increase in suspended solids concentration, which can further propagate. The spread of a turbidity plume depends on the settling velocities of the suspended material, the technology and operation control used for dredging or excavating, and the ambient water characteristics. Sediment plumes can be quite localized, having a minimal direct impact on marine mammals living in a marine environment [6]. However, in certain types of activity, such as deep-sea mining, sediment plume dispersion modeling results showed that the area of influence ranged from 4 to 9 km under normal flow conditions and when an eddy had passed through the study site [7]. The discharge of the sediment plume has a direct influence on the habitat. It can lead to limited light penetration, smothered organisms, reduced visibility and food, and also to a disruption in reproduction patterns. Turbidity currents have a potential impact on the local ecosystem, but the effect is species- and location-specific [6]. In the case of an environment such as the deep sea, any change in the environment could be significantly large [8]. Limiting the spread of turbidity flows is, therefore, a key objective of deep-sea mining activities.
Turbidity currents are a subclass of gravity currents. Their transport mainly takes place due to the difference in densities between the turbidity current and the ambient fluid. It has three main parts, namely, the head, body and the tail. The head of the turbidity current exhibits distinctive properties when compared to its body and tail. The head has significantly different mass and momentum than its body and tail. According to [5,9], the horizontal discharge of sediments can typically be divided into several stages for a near-field scenario. After being discharged from the SMT itself, the flow behaves as a turbulent jet [5,9]. The jet then loses its momentum and the entrainment of ambient fluid takes place. The jet is mainly driven by the density difference and is defined as a plume [9]. The density difference causes the plume to sink. At the impingement area, there is the possibility of seabed erosion and deposition [5]. The last stage is the turbidity current stage, where the flow propagates as a turbidity current, moving along the seabed, away from the SMT’s path [5].
The deep-sea sediments found at the top of the sea floor consist of mineral particles and organic matter. When this material is resuspended, it has been found that there is an occurrence of flocculation [7,10]. Flocculation is the process where organic materials, under various hydrodynamic conditions, bind the sediment particles together, leading to the formation of larger particles, known as flocs. According to [11], it has been seen that the formation of flocs lead to an early settlement of plume, thus reducing its spread. Flocculation has been widely studied in various environments such as in rivers and estuaries [12], where organic matter is the main driver for flocculation, and also in the field of sanitary engineering [13], where synthetic flocculants (usually polyacrylamide-based polyelectrolytes) are used. The mechanisms and the controlling factors involved in these environments are generally well known [13]. However, studies on flocculation in turbidity flows in open water are limited. A model with calibrated flocculation parameters using the existing experimental work of [7] was set up that included flocculation. Although the effect of flocculation is already clearly present in the near field, its effect on the propagation of the turbidity current is likely to take place in the far field [14].
To study the importance of the different variables in the system (clay and organic matter concentration in particular) on the propagation of the turbidity flows, laboratory-scale experiments in the form of lock-exchange experiments are usually performed [15,16,17]. The propagation of flocculated sediment/synthetic organic matter (polyacrylamide flocculant) slurries in lock exchange experiments by [11,18] enabled the study of the changes occurring in floc size and structure during turbidity current propagation. It was, in particular, found that additional flocculation takes place during the turbidity current propagation. In the marine environment, organic matter is found everywhere in the water column. One unanswered research question, targeted in the present article, is whether the presence of this organic matter (unbounded to clay) in the flow compartment of a lock exchange will or will not affect the turbidity current propagation. To mimic the action of organic matter, two synthetic flocculants (polyacrylamide-based) were used [19], as they are well-characterized polyelectrolytes that are representative of the action of polysaccharides (polysaccharides are produced by microorganisms in situ and constitute a large class of natural flocculant).
In this article, Section 2 gives an overview of the materials and methods. In Section 3, the results are presented, followed by discussions and conclusions in Section 4 and Section 5, respectively. The Supplementary Materials are included at the end of this article.

2. Materials and Method

In this section, the materials and methods used in the experiments are outlined. Section 2.1 covers the materials that were utilized, while Section 2.2 details the experimental methods employed.

2.1. Materials

The materials used in these experiments are discussed in detail in the following subsections.

2.1.1. Clay

Illite clay was used in the experiments. It is the dominant mineral component comprising 39–54% [20] of the topmost layer of sediments in the Clarion Clipperton Zone (CCZ) [21]. Illite clay was also used in previous research on this topic [11]. The illite used in these experiments is “Granulated green clay for poultice and plaster” from Argiletz laboratories, Lizy-sur-Ourcq, France. The d50 was found to be 6.4 µm when analyzed by static light scattering using Malvern Mastersizer 2000 from Malvern Panalytical, Malvern, UK.

2.1.2. Flocculant

Sediments in general contain organic matter which is present everywhere in the water column. However, the material used here (illite) is devoid of any organic matter and, therefore, does not form flocs on its own. In order to study the floc behavior, illite flocs were formed using flocculants. Two types of flocculants are used here, anionic and cationic, used one at a time. The anionic flocculant is a polymer referenced Zetag 4120 (from the BASF, purchased in Heerenveen, The Netherlands). It has a medium charge and high molecular weight. The other flocculant used is Zetag 7587 (BASF), which is a cationic polymer. It has a high charge and medium molecular weight. These flocculants are in the form of dry powder and are mixed with water to form a stock solution. Polyacrylamide-based polyelectrolytes such as the ones from the Zetag line are comparable to Exopolysaccharides (EPS), which are high-molecular weight carbohydrate polymers produced by marine bacteria or microalgae [22,23]. These EPS are the building materials for microbial aggregates like biofilms and flocs [24].

2.1.3. Saltwater

The experiments were carried out in saltwater. The salt (NaCl) was purchased from Boom Laboratories, the Netherlands. The saltwater was prepared separately in a drum. The electrical conductivity of the prepared saltwater was 34.7 mS/cm. The saltwater was then pumped to the lock exchange flume.

2.2. Methods

The small-scale experiments (jar tests) were carried out in the Fysisch Laboratorium of Deltares. The lock exchange experiments were carried out in the Offshore and Dredging Laboratory of TU Delft.

2.2.1. Jar Tests

Jar tests were carried out using illite and saltwater, at different flocculant-to-clay ratios as described in the protocol below. The two setups used to measure particle sizes and settling velocity of the flocs created in these jar tests are shown in Figure 1. The first setup consists of a mixing jar apparatus (JLT6 from VELP Scientifica, Usmate Velate, Italy) coupled with a particle size analyzer (Malvern Mastersizer 2000). The Particle Size Distribution (PSD) of sediment is determined by the Static Light Scattering (SLS) technique [25], and particle sizes can be recorded in the range (20 nm–2 mm). The second setup is a homemade video microscopy instrument coupled with a settling column (FlocCAM). Here, particle size (>20 µm) and corresponding settling velocity can be recorded [26,27].
The jar test experiments were carried out using a sediment concentration of 0.5 g/L. The protocol that was adopted for these experiments is as follows.
  • Two samples (one for Malvern analysis and the other for FlocCAM analysis) of the chosen concentration (0.5 g/L) of illite and saltwater were prepared using a volumetric flask.
  • Each of the illite saltwater suspensions was then mixed separately at 800 rpm using an overhead stirrer for 5 min in order to ensure a homogeneous suspension.
  • A stock solution of Zetag 4120 with water was prepared. Four different dosages of Zetag 4120 (milligram per gram of dry mass of clay) (0.35 mg/g, 0.25 mg/g, 0.2 mg/g, and 0.1 mg/g of clay) were chosen for the jar tests.
  • The samples (illite and a chosen dosage of Zetag 4120) were then mixed for 30 s at 75 rpm (which corresponds to a 50/s shear rate) using the JLT6 jar test apparatus setup.
  • One sample was immediately measured in FlocCAM and videos were recorded.
  • For the other sample, a clean jar with saltwater was placed under the JLT6 jar test apparatus and constantly mixed at 75 rpm. The flocs were then scooped from the illite–saltwater suspension containing Zetag 4120 with the help of a pipette and were put into the jar under the JLT6 jar test apparatus.
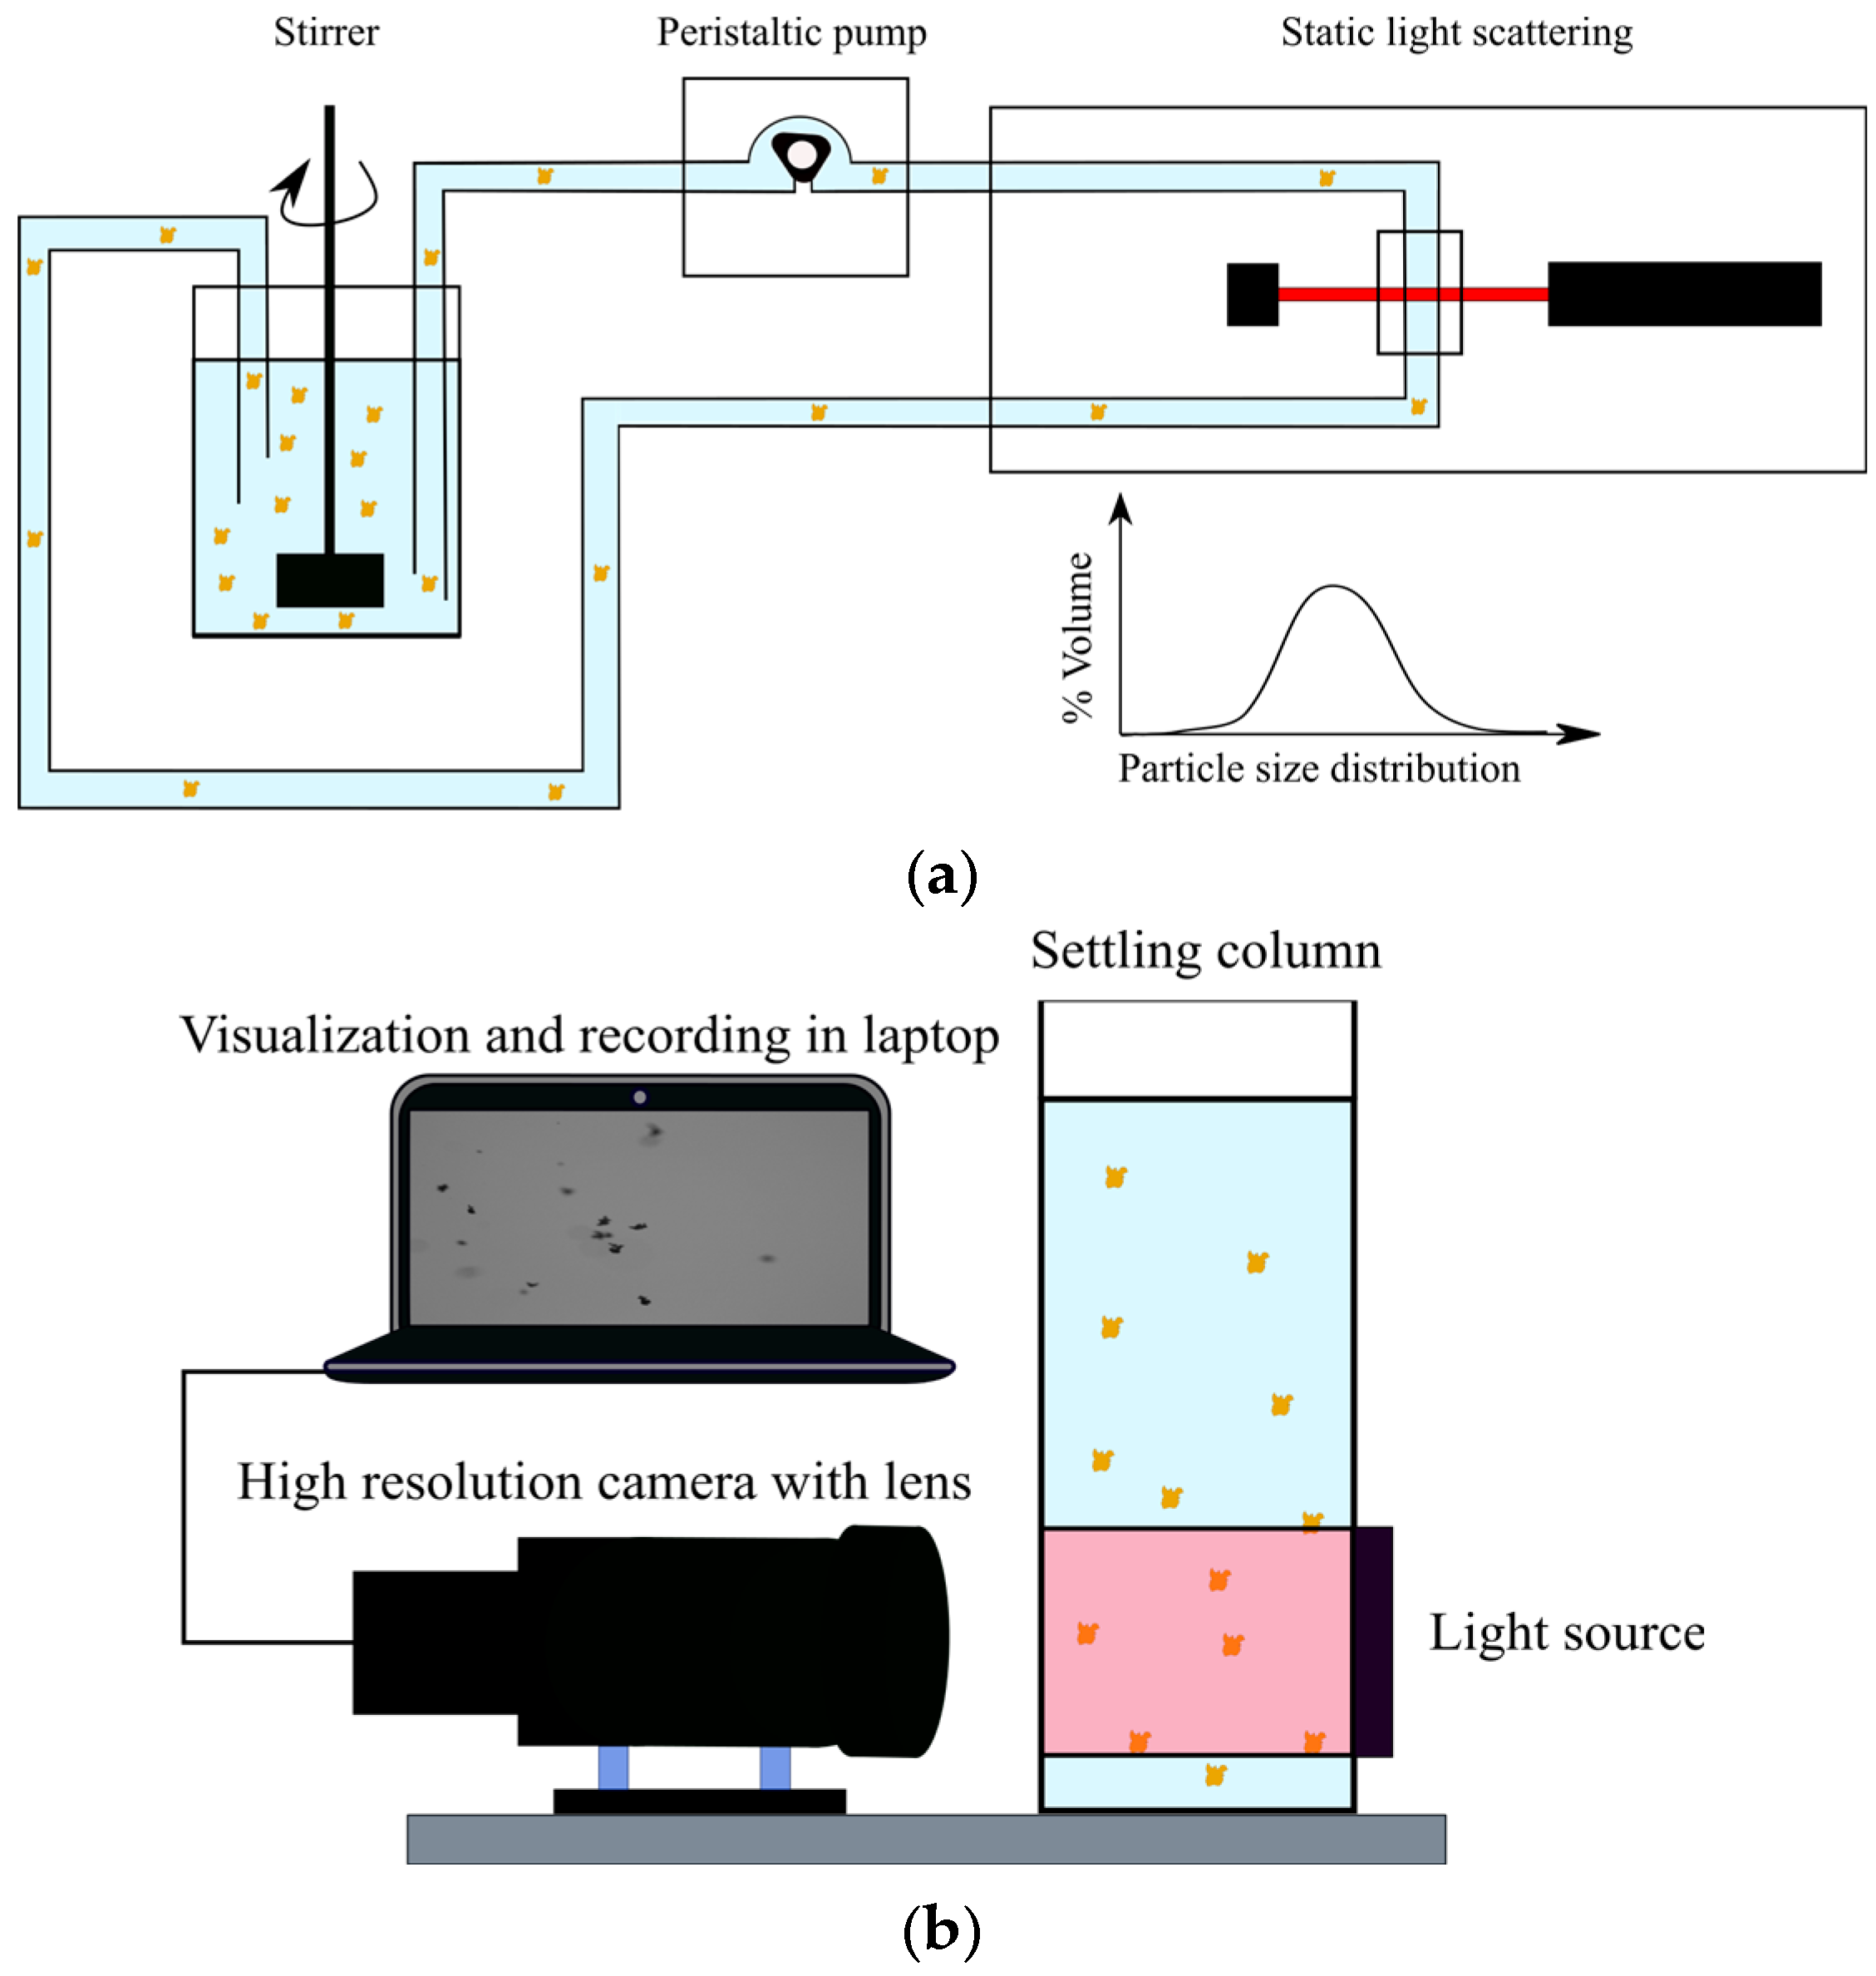
  • The jar was connected through a peristaltic pump to the Malvern Mastersizer 2000. The pumping speed was kept at 88 rpm, which was just sufficient to pump the flocs to and out of Malvern Mastersizer 2000, minimizing the shear that might affect the floc structure.
  • The floc size was then obtained from Malvern Mastersizer 2000. The time difference between adding Zetag 4120 and obtaining the first floc size measurement would be at least 90 s.

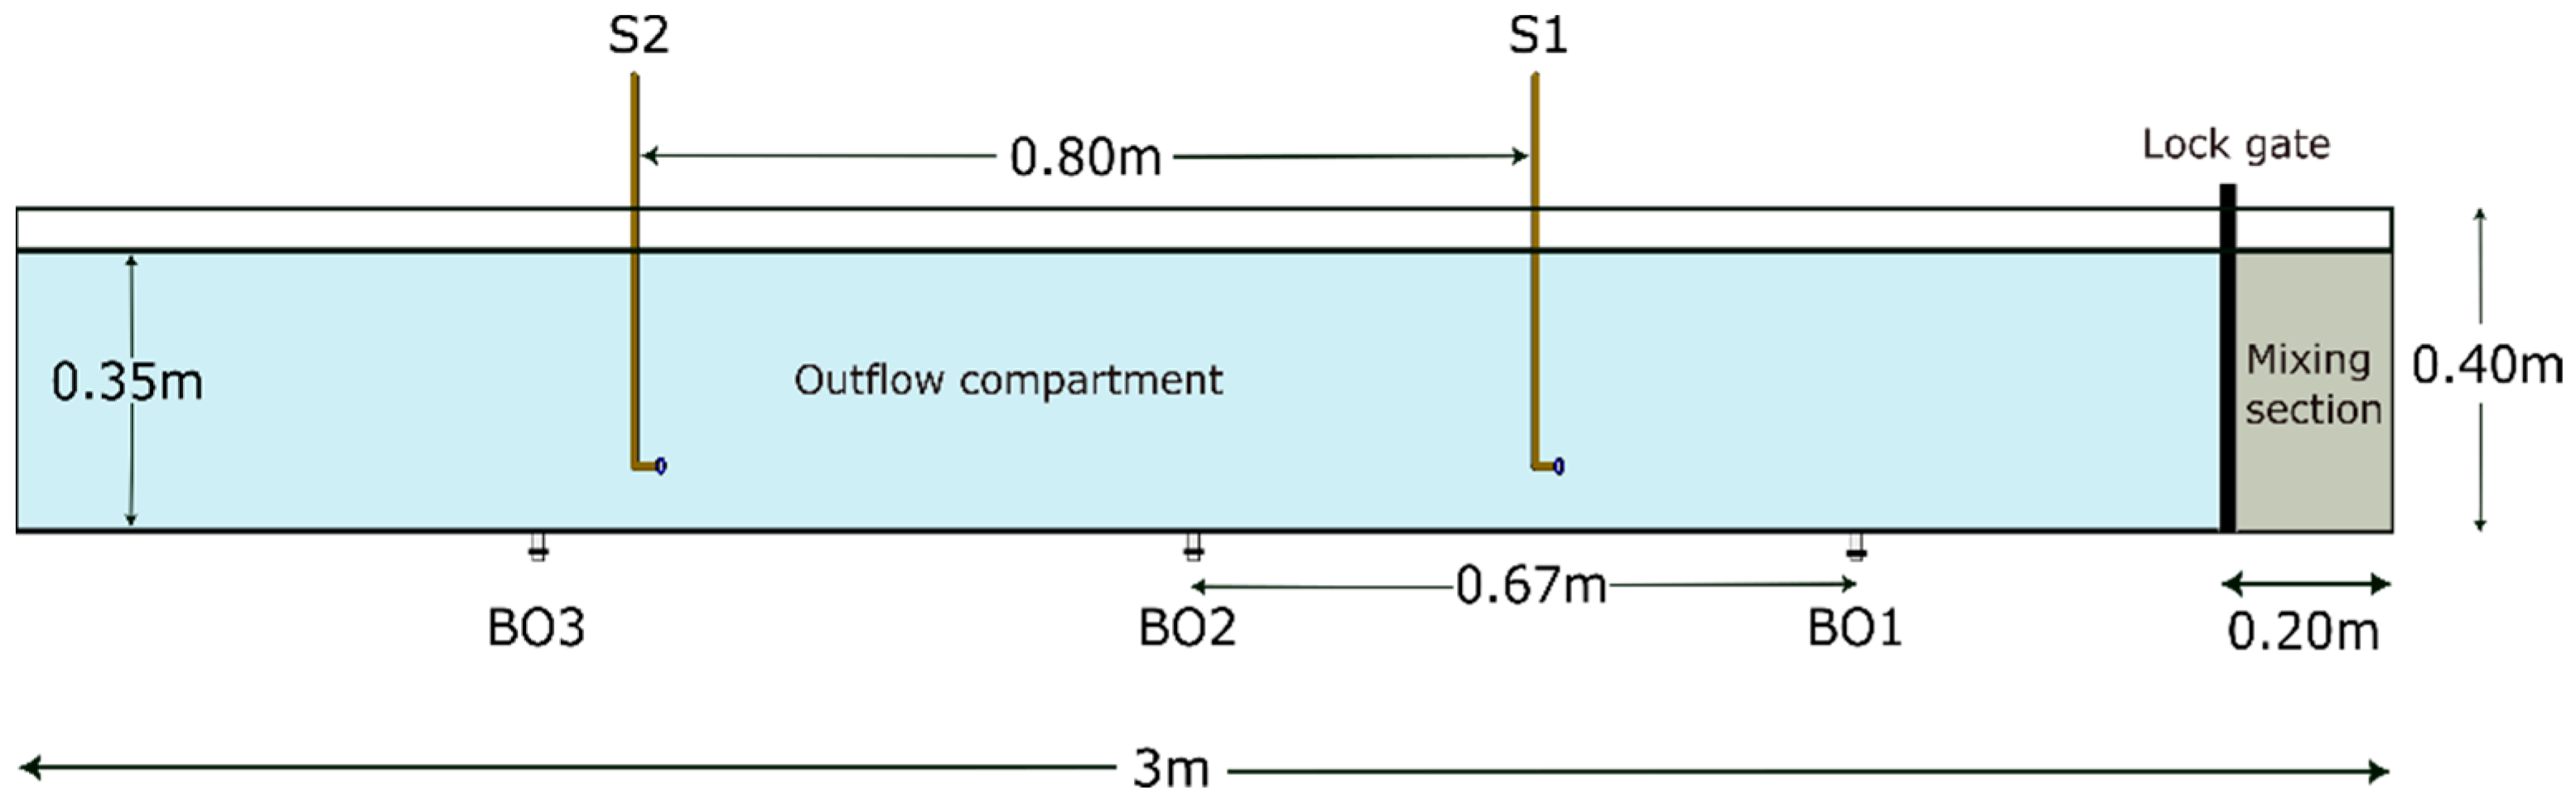
2.2.2. Lock Exchange Setup

The lock exchange flume is 3 m long, 0.4 m high, and 0.2 m wide. The mixing section or the lock section is 0.2 m long. Two siphons S1 and S2 were suspended into the flume with the help of clamps. The flume has three pre-installed bottom outlets (BO1, BO2, and BO3). Sediment samples from inside the turbidity currents were collected through the siphons and bottom outlets for flocculation analysis. Figure 2 shows a schematic diagram of the lock exchange flume. Four different sediment concentrations were used in the experiments: 0.5 g/L, 2.5 g/L, 5 g/L, and 10 g/L.
The protocol that was followed for the lock exchange experiments is as follows:
  • The lock exchange flume was filled with saltwater up to a height of 35 cm, which makes a total of 210 L.
  • A weighed mass of illite (according to the concentration) was added to the lock section, and was then mixed for 20 min.
  • In case of runs with flocculant, a weighed mass of Zetag 4120 or Zetag 7587 (according to the dosage) was added to the outflow section of the flume and mixed with a hand mixer for 30 s. The lock gate was opened after the water level in the outflow compartment was stable.
  • The propagation of turbidity currents was recorded using a GoPro Hero 9 camera for analysis of the front position using Tracker software (Version 6.1.3) [28].
  • To collect samples from the turbidity current, a duplicate experiment was performed in each case, following the above-mentioned steps. The samples were taken from two siphons located at the same height but at two different positions in the flume. Bottom outlets were also used to collect samples at three different positions in the flume.
  • The collected samples were then analyzed using the particle sizer and FlocCAM setup described in Section 2.2.1.

3. Results

The results from the jar tests and lock exchange experiments are presented here.

3.1. Jar Tests

The results obtained from jar test experiments are explained in this section.

3.1.1. Malvern Mastersizer 2000
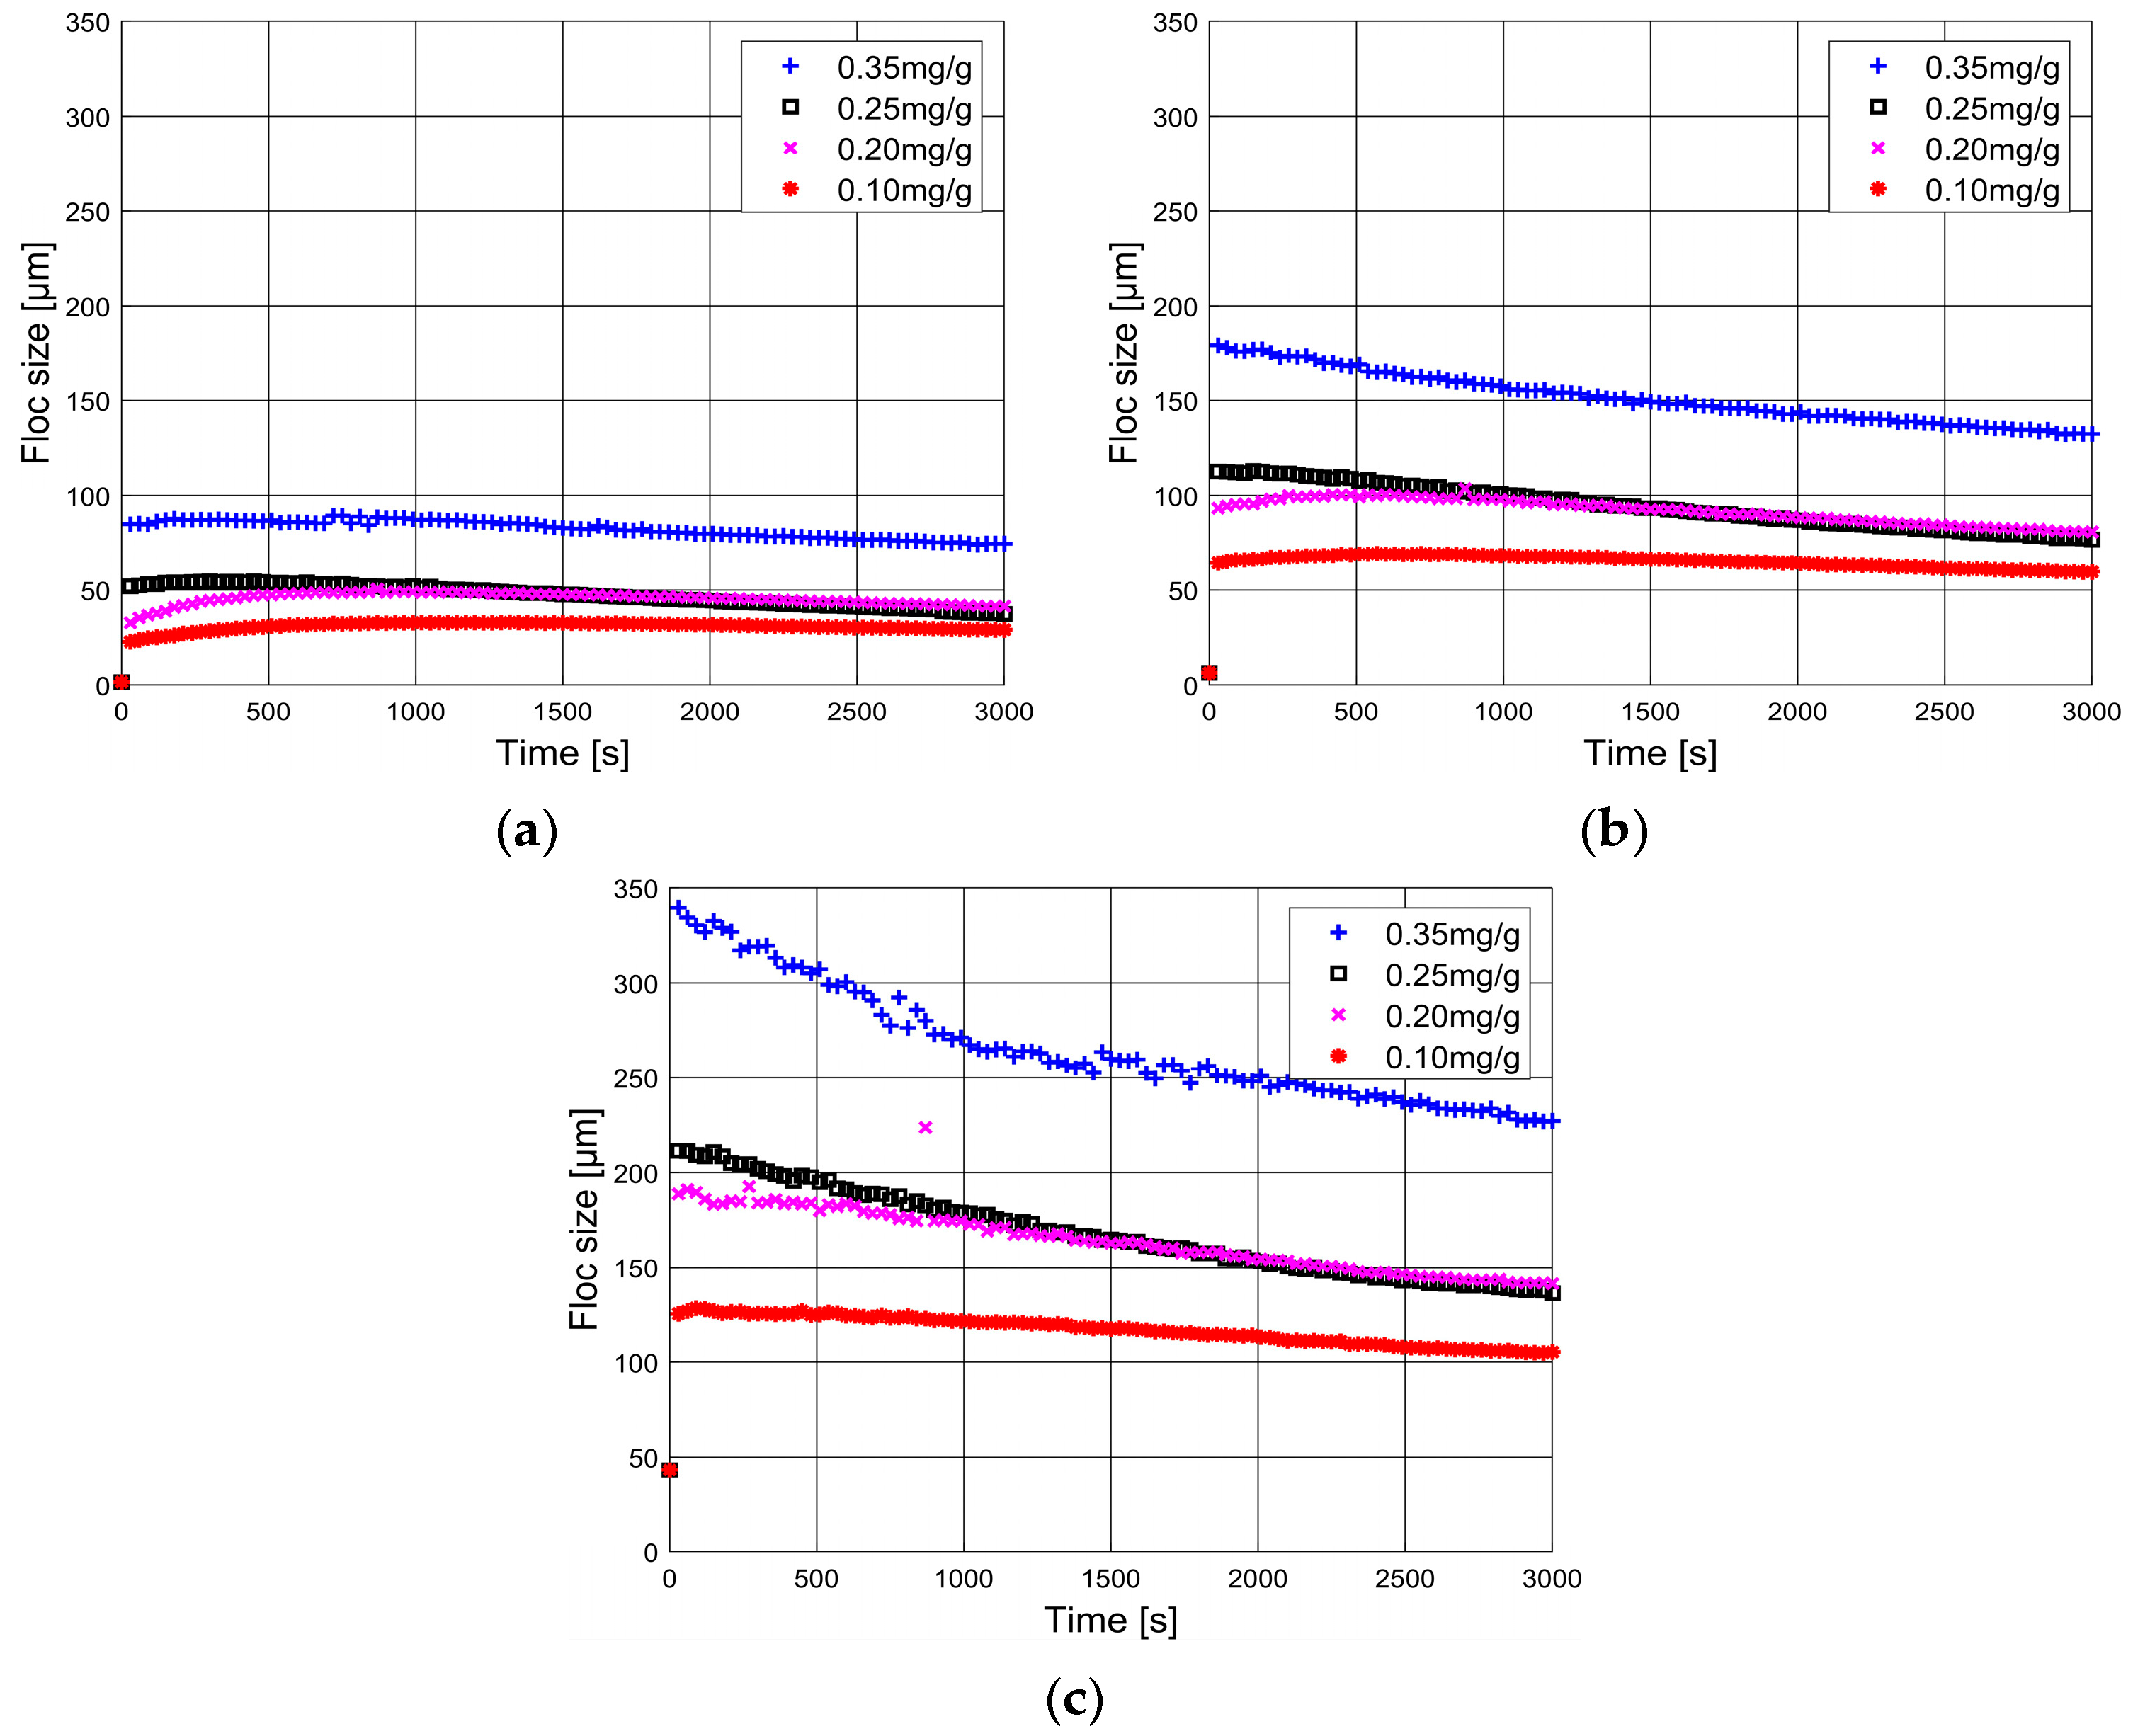
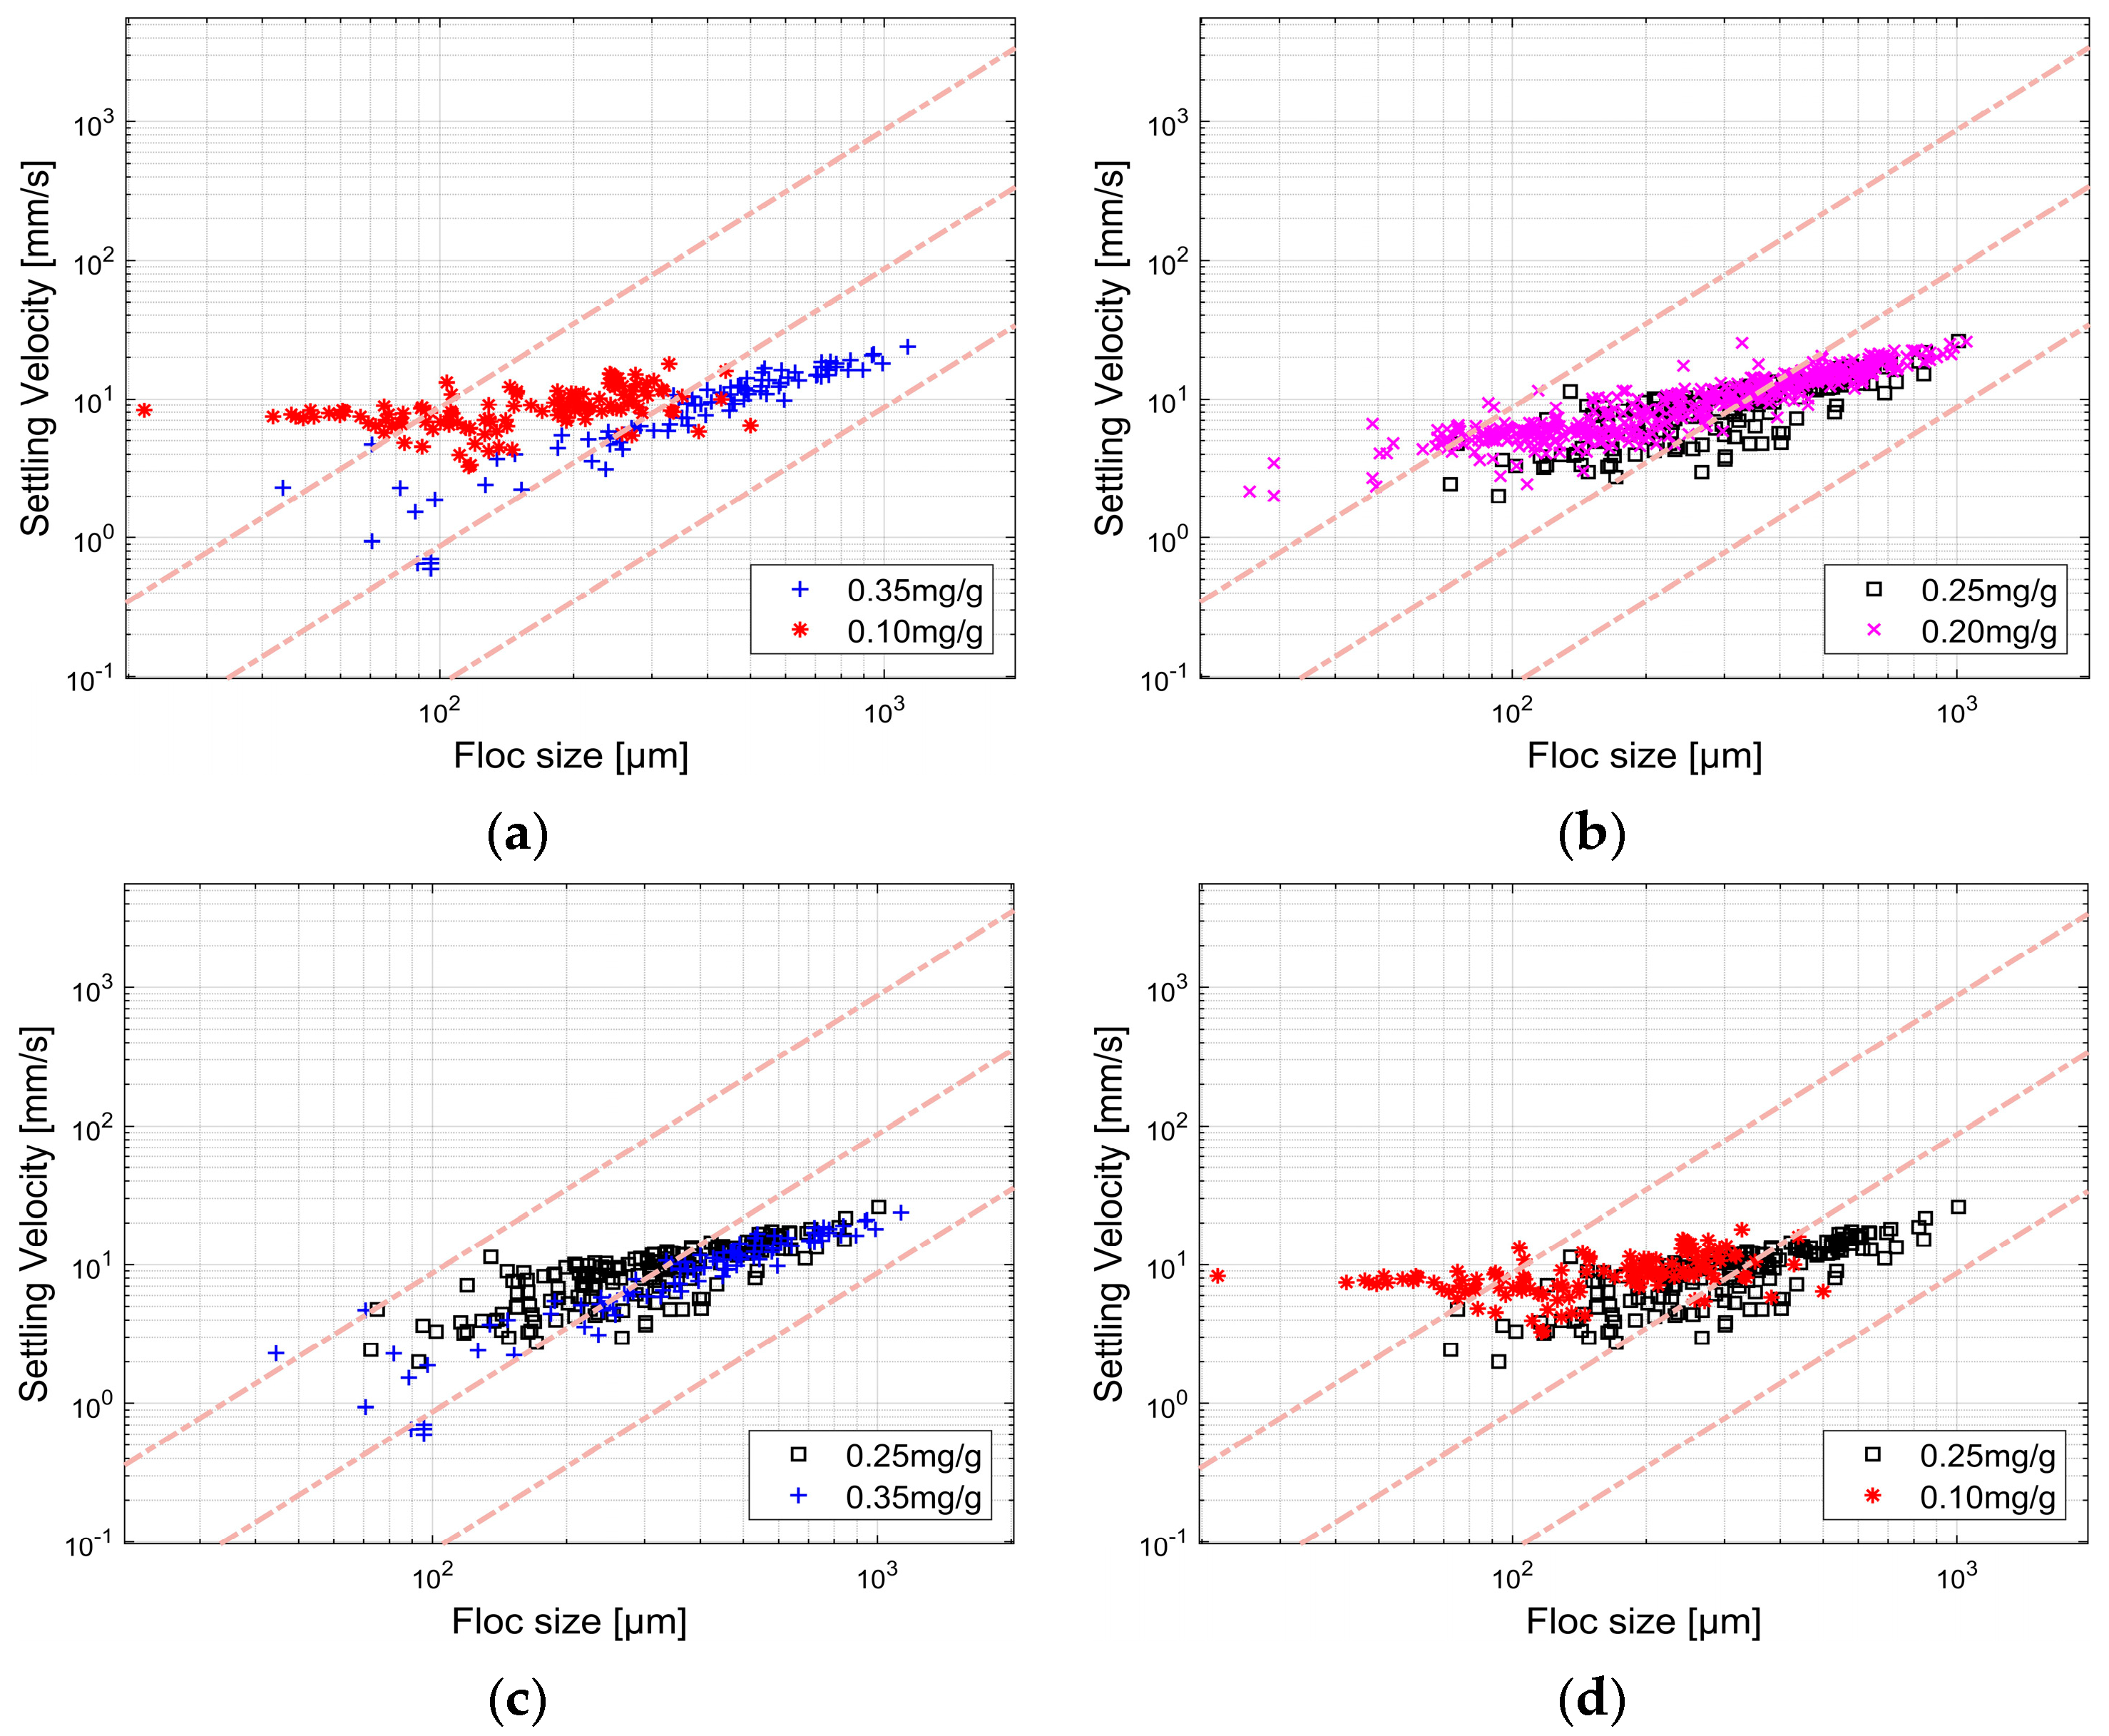
The evolution of floc sizes over time, formed with four different dosages of Zetag 4120 (Section 2.2.1), are shown in Figure 3. Floc sizes were recorded using static light scattering as described in (Section 2.2.1). The d10, d50, and d90 of illite clay (unflocculated) were found to be 1.56 µm, 6.4 µm, and 43 µm, respectively, and are indicated by the red squares in the figures. The flocculant was added just after t = 0. The corresponding particle size distributions are shown in Figure 4. For all measured sizes (d10, d50, and d90), a very rapid increase in particle size occurred (within a few minutes) after the addition of flocculant. This is reflected in the shift of PSD peak towards the right over time (Figure 4). After reaching maximum size, these d10, d50, and d90 floc sizes are observed to decrease as a function of time (Figure 3), and the PSD peak shifts to the left (Figure 4). The position of the maximum floc size shifts to smaller times when increasing the flocculant dosage. This behavior indicates that there is a competition between the aggregation of polyelectrolyte and clay and the action of shear. It is known that flocs, under the action of shear, are prone to reconform and, hence, become denser [19] and rounder in shape. Indeed, the PSD peaks are observed to sharpen over time, indicating that flocs become more monodisperse. At the same time, the d90 of flocs decreases substantially, and the d50 similarly decreases (Figure 3). The d10 does not vary much (Figure 3), and the relative amount of fine particles does not increase in time, see Figure 4, which confirms that flocs are not eroding or breaking. For 0.35 mg/g, at t = 30 s, a small peak was observed between 10 and 50 µm. This peak represents small, unflocculated materials (Zetag and illite). At t = 3000 s, the primary peak sharpened and the smaller peak disappeared, leading to the conclusion that all smaller particles have now been incorporated in flocs. This would imply that 0.35 mg/g is close to the optimal flocculant dosage, which is in line with the fact that flocs at this dosage are the largest.

3.1.2. FlocCAM

Figure 5 shows floc size and settling velocities obtained from FlocCAM video analysis. It is quite striking that the settling velocities obtained in all cases, for all particle sizes, are pretty similar. This behavior can be linked to the influence of hydrodynamics resulting from the collective motion of the sampled flocs [29], whereby flocs are entrained in the wake of the surrounding ones. Nonetheless, some features are apparent when comparing the distributions. In Figure 5a, it is seen that flocs formed with a 0.35 mg/g dosage are larger than that of the lowest dosage of 0.10 mg/g. However, the settling velocities of the flocs (below 300 microns) formed with 0.10 mg/g dosage are (on average) higher. One of the reasons could be that there were more flocs in that size range at 0.10 mg/g, leading to higher settling velocities due to collective motion. It has indeed been found that collective motion can lead to individual settling velocities 10 or 100 times higher than individual settling velocities measured by sampling single flocs [29]. On the other hand, it is not excluded that another reason could be that the flocs formed at 0.10 mg/g contained more sediment particles than flocs formed with 0.35 mg/g. The floc sizes and settling velocities of flocs formed with 0.25 mg/g and 0.20 mg/g (Figure 5b) do not differ much from the ones observed for 0.35 mg/g.
In Supplementary Material Figure S1, snapshots from FlocCAM videos are shown. The size of the formed flocs is governed by the clay to Zetag 4120 concentrations.

3.1.3. Comparison Between Malvern Mastersizer 2000 and FlocCAM

Particle Size Distributions (PSD) obtained from the Malvern and the FlocCAM are compared in Supplementary Material Figure S2, using the bin sizes of the Malvern. In all cases, it is found that the peak in floc size obtained from the FlocCAM measurements is shifted to the right (indicating larger particle sizes) compared to the peak found by Malvern measurements. This implies that the d50 found by the FlocCAM are higher than the ones found using Malvern. There are several reasons for these differences: (1) particles measured by FlocCAM can experience differential settling, and hence aggregate while settling (though this reason is most probably not the main one), (2) flocs measured by Malvern are sheared in the tubes (of diameter 6 mm) in which the samples were pumped from the jars to the measurement chamber, leading to reconformation in the floc structure, and (3) the software producing the PSD found by Malvern, smoothen the data to produce bell-shaped curves, which leads to an underestimation of the larger sizes [30].

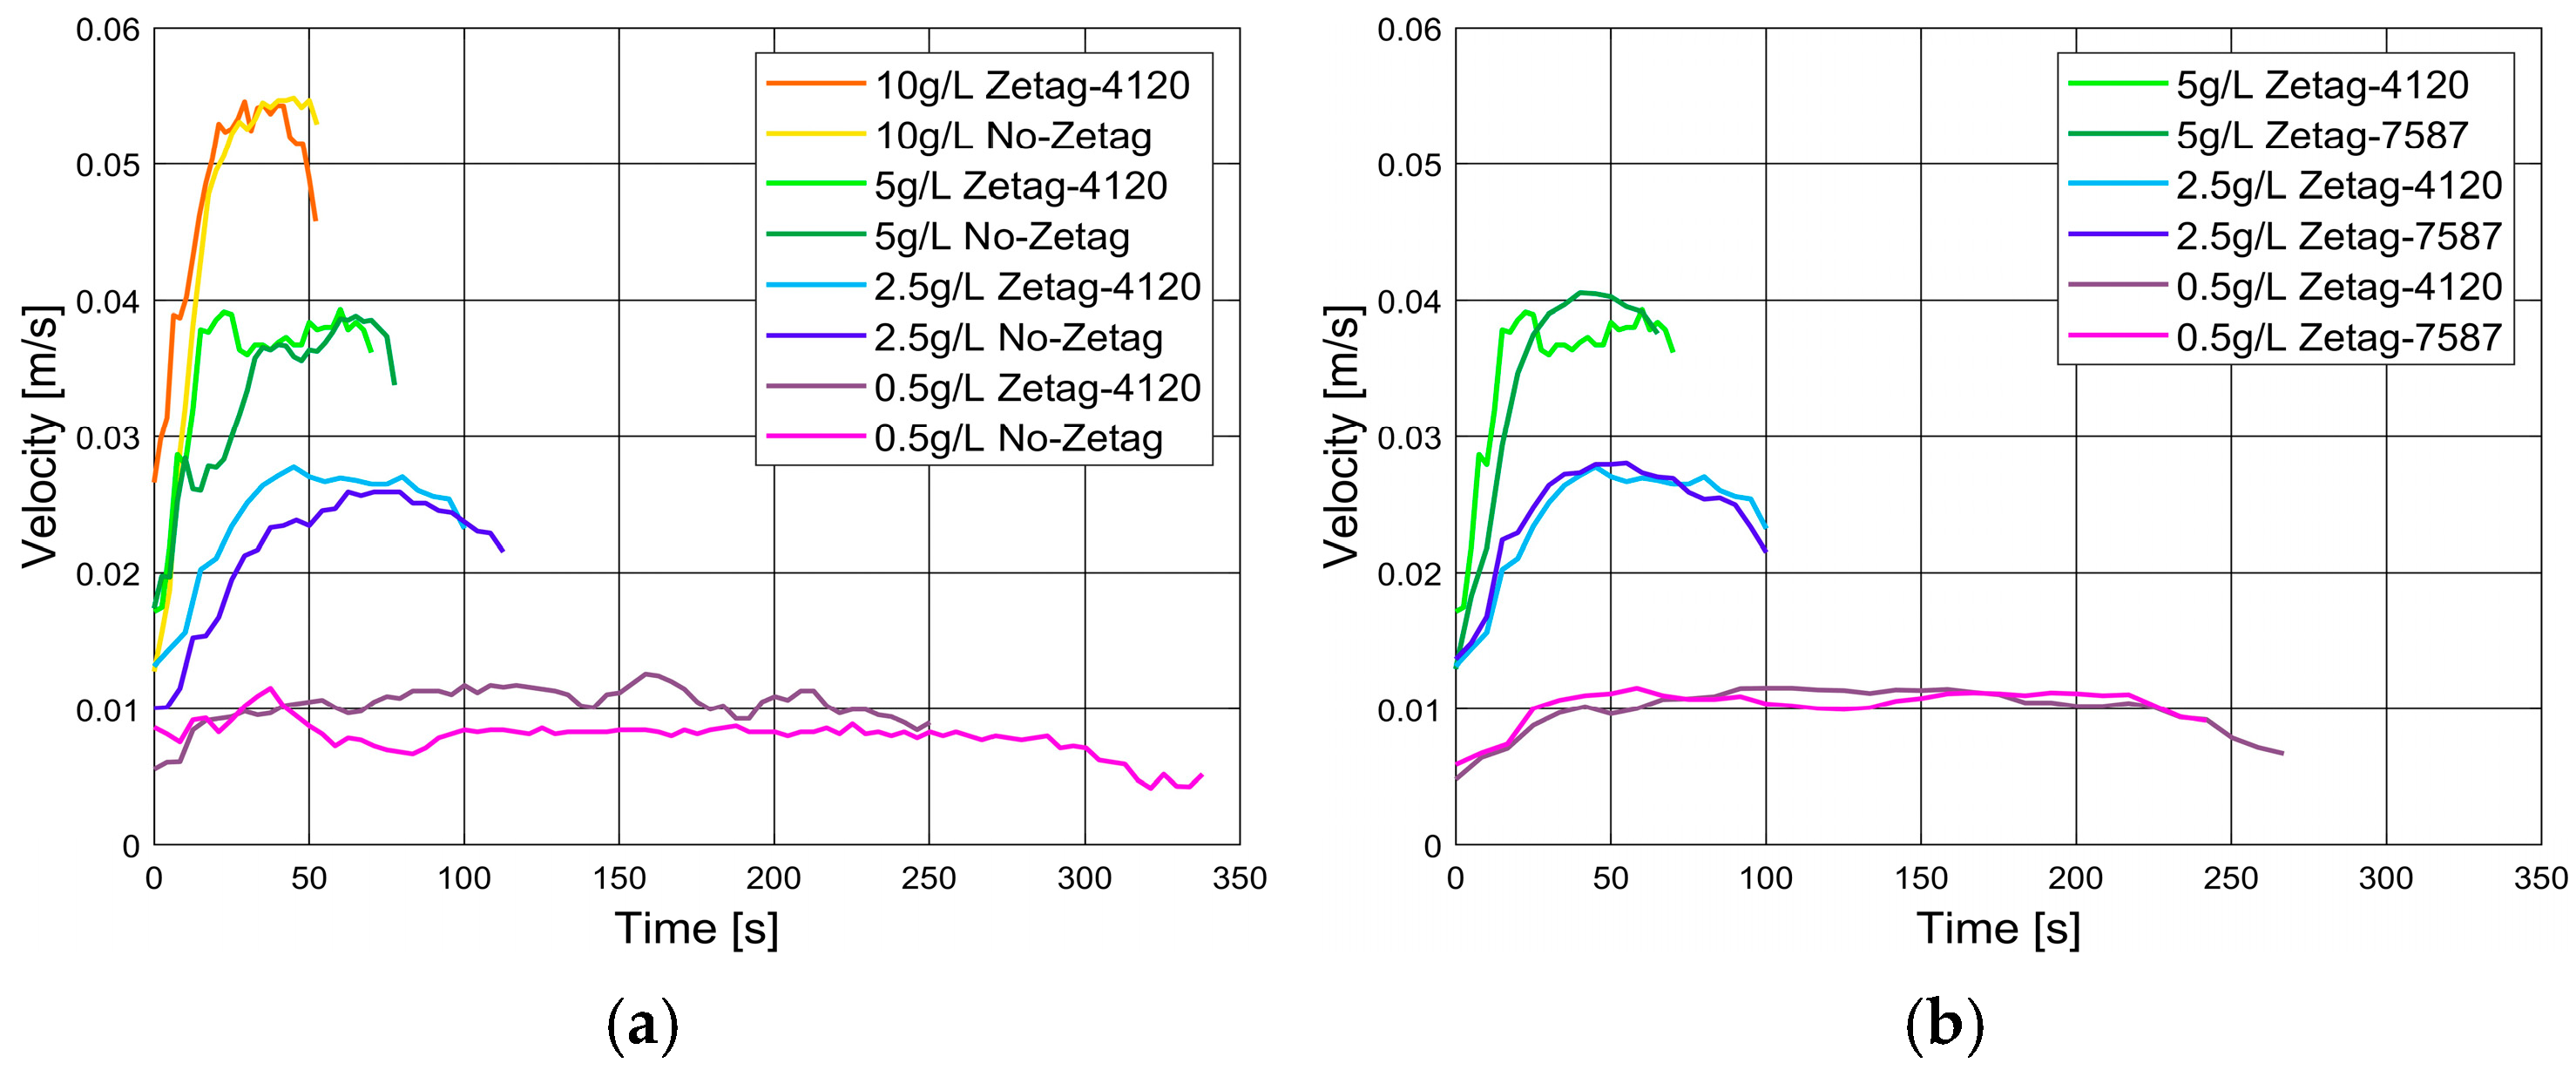
3.2. Lock Exchange Experiments

To study the influence of the presence of (synthetic) organic matter in the flow compartment on the turbidity current, a relatively high dosage of flocculant was chosen (corresponding to a flocculant to clay ratio of 2.5 mg/g). In order to achieve a 2.5 mg/g of clay dosage, it was necessary to use a flocculant concentration of 1.785 g/L. This amount of flocculant changes the water density by a small percent only and is therefore not expected to play a significant role in the propagation of a density-driven flow.

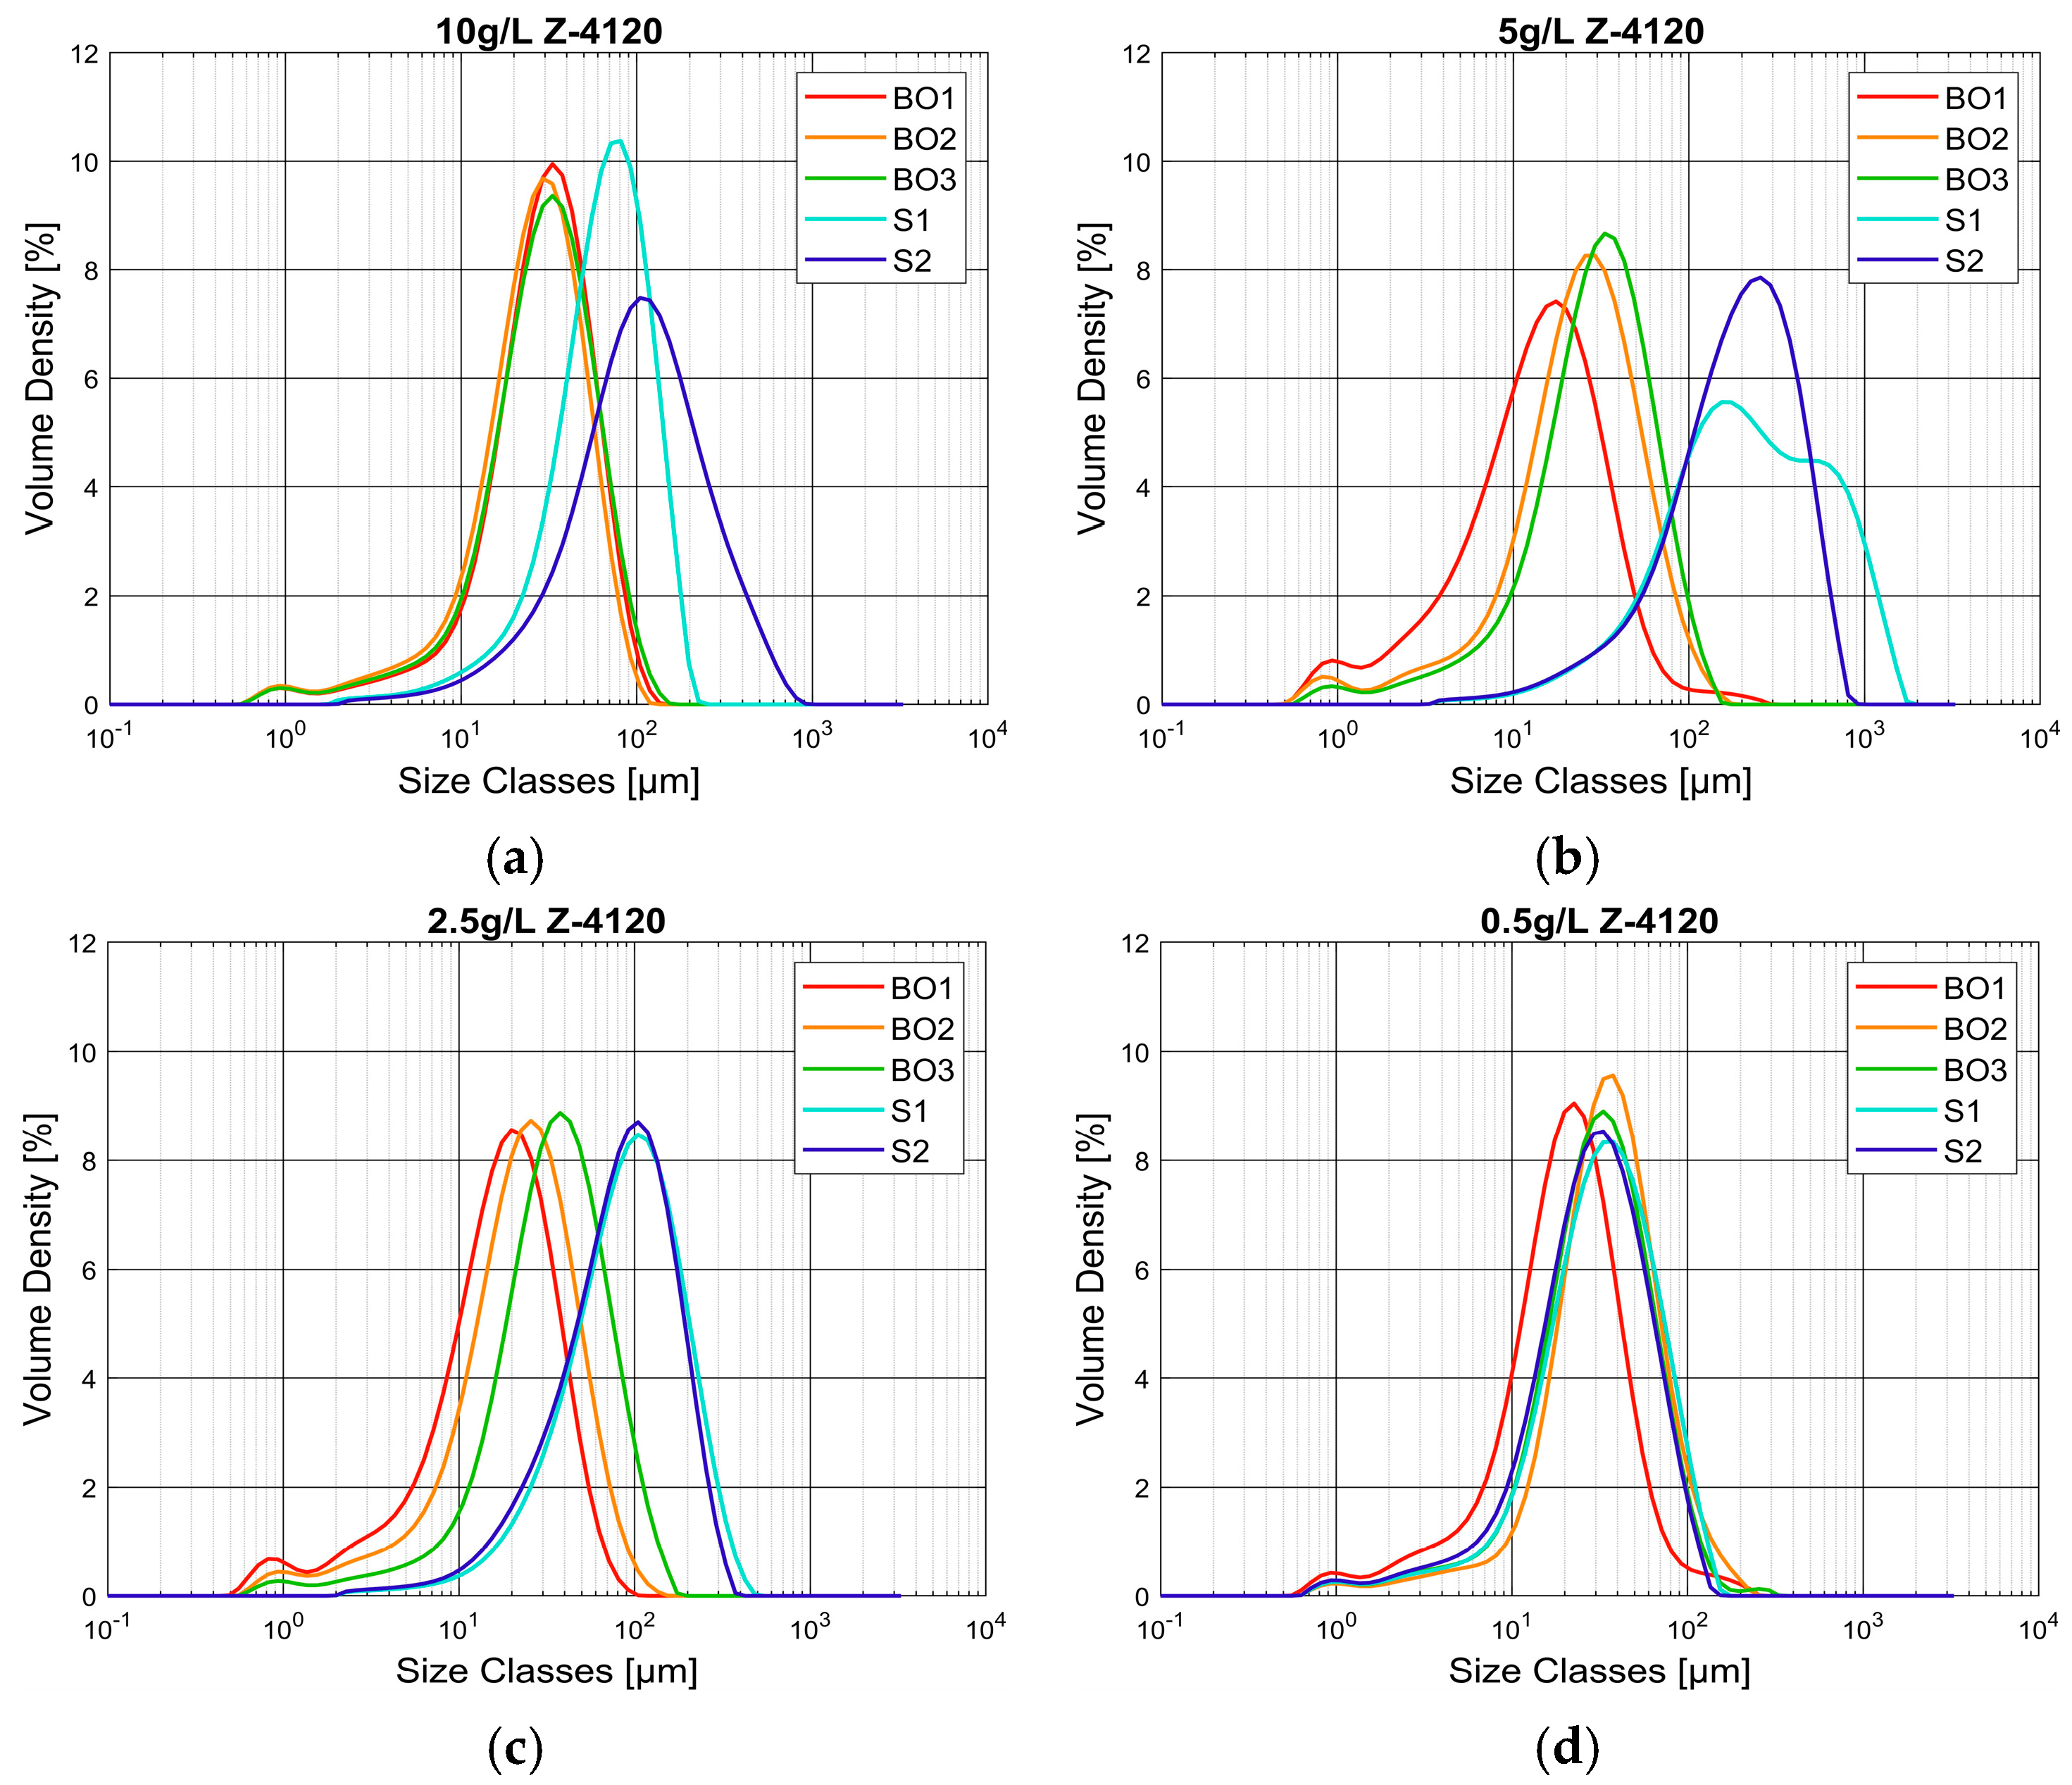
3.2.1. With Anionic Polyelectrolyte Zetag 4120

Front positions of turbidity currents as a function of time for different sediment concentrations with and without Zetag 4120 are compared in Figure 6a.
The associated velocities are shown in Figure 7a. The velocity values were obtained from video recordings (recorded at 24 fps) using a moving average point of 5 to smoothen the velocity fluctuations. The velocities in the Zetag 4120 cases were always higher than in the No-Zetag cases. For the 0.5 g/L case, it is seen that the initial velocity for the No-Zetag case was higher than its Zetag counterpart. From the video recording for 0.5 g/L sediment concentration, it was observed that the materials did not entirely come out of the mixing section of the lock exchange flume. Thus, the momentum and density difference of the turbidity current was reduced. For all sediment concentrations, the front positions of turbidity currents with Zetag 4120 reached the end of the flume faster than their No-Zetag counterpart. The hypothesis behind this is that the polymer (Zetag 4120) acts as a lubricant, lowering the friction between water and the traveling current. In particular, the bottom surface of the flume becomes lubricated by the unflocculated polymer, thus allowing the turbidity current to travel faster.

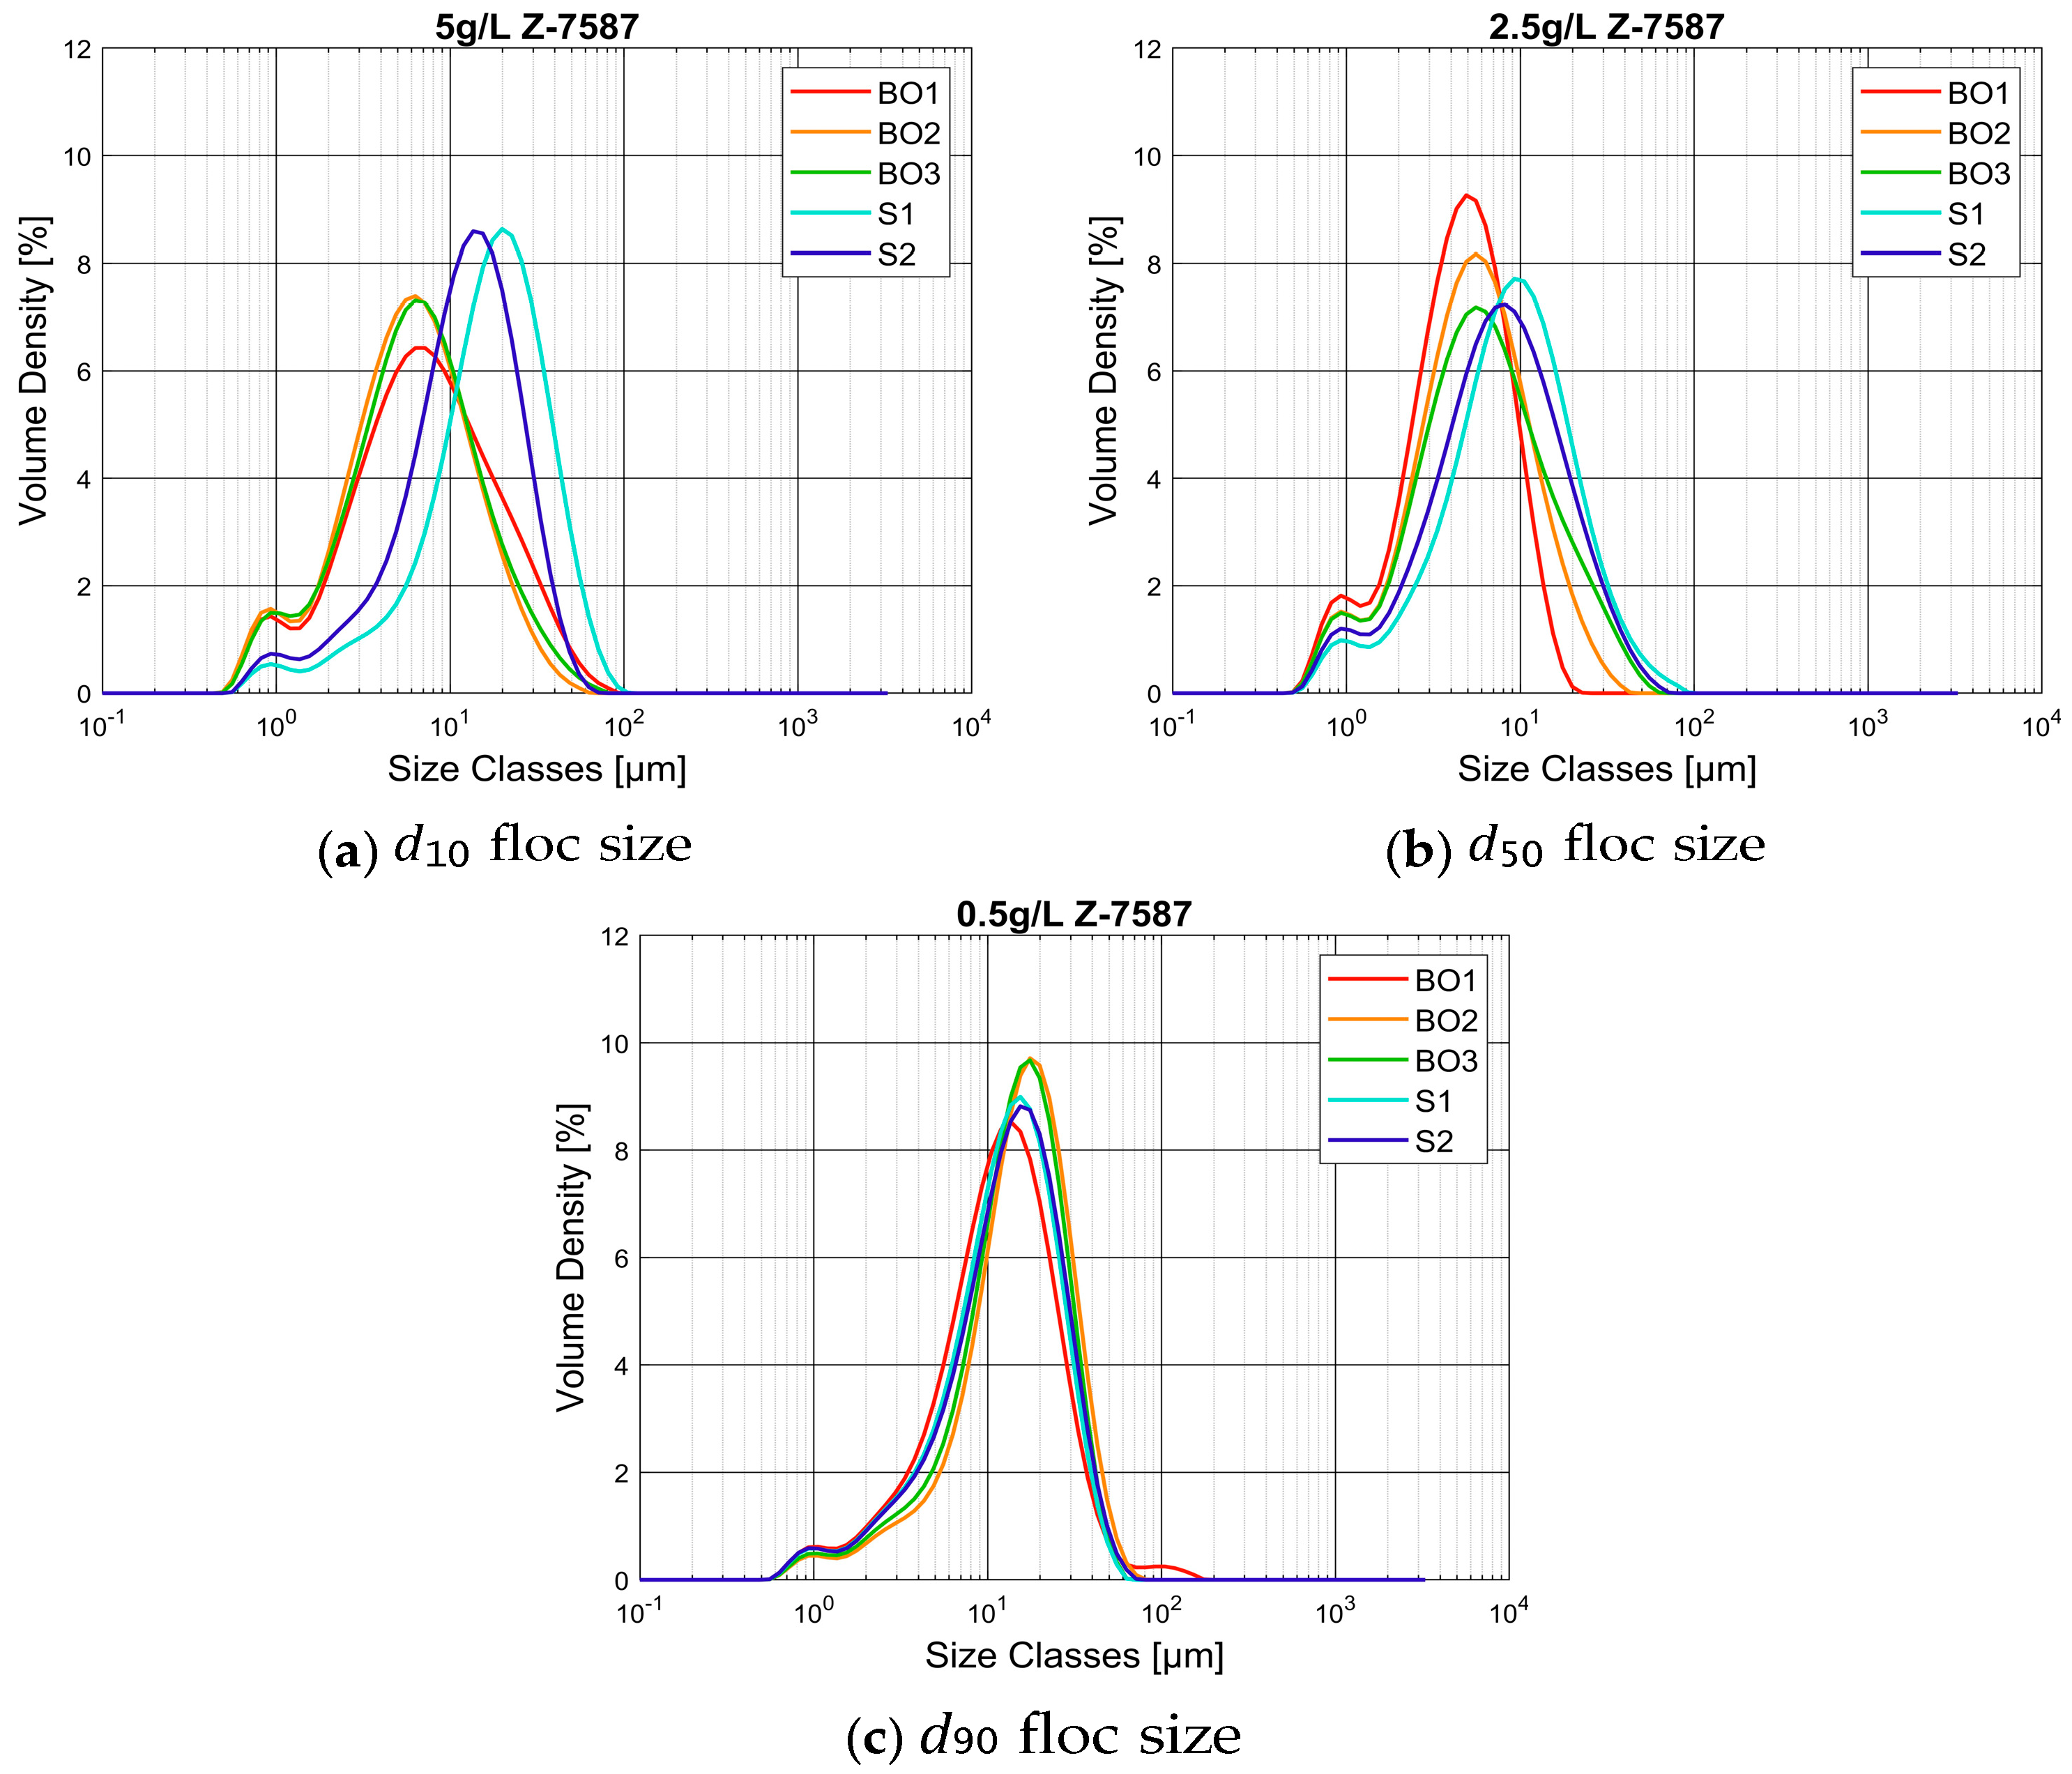
3.2.2. With Cationic Polyelectrolyte Zetag 7587

In Figure 6b and Figure 7b, the front positions of turbidity currents and their corresponding velocities in the presence of cationic polyelectrolyte Zetag 7587 are compared with the fronts created with the anionic flocculant, Zetag 4120. It is clear that the front propagation is not affected by the type of flocculant used, as both the flocculant cases have similar front velocities. However, the floc size varies in both the cases. The flocs formed with cationic flocculant are smaller in size when compared to the ones formed with anionic flocculant, which is due to the difference in the binding mechanism of flocculant to the sediment particle (Figure 8 and Figure 9).

3.2.3. Particle Size Analysis as a Position in the Current

There are in total five samples (three bottom outlets and two siphons) taken from the turbidity current. The first bottom outlet (BO) is located at a distance of 67 cm from the lock gate. The other two BOs are located at a distance of 67 cm from each other. The siphons (S) are placed at a distance of 80 cm from each other and at a height of 3 cm from the flume bottom (Figure 2). The PSDs of these samples were obtained from the particle sizer (Malvern Mastersizer 2000), and the displayed PSDs (Figure 8 and Figure 9) are the ones obtained from the first measurement of the machine (30 s after injection of the sample), to minimize the effect of shearing in the tubes.
From PSD graphs of samples obtained from bottom outlets and siphons (Figure 8 and Figure 9), it is seen that the particle (floc) sizes of samples collected from the siphons are much larger than the sizes of the particles collected at the bottom. Due to the convective motion of particles in the turbidity current, it is expected that open-structure flocs will be formed by contact between clay and flocculant in the water column. Flocs sampled at the bottom of the flume have most probably traveled further in the direction of flow compared to freshly made flocs, and hence reconformation of the polymeric tails might have led to these flocs’ smaller size. The sampled cationic flocs (created with illite clay and Zetag 7587) from the siphons are found to be smaller on average than the anionic flocs (created with illite clay and Zetag 4120) by at least one order of magnitude. In the case of cationic flocs, electrostatic attraction is the main driving mechanism [31]. Here, polymer bridging takes place, which leads to the formation of strong aggregates. The breakage of these flocs is irreversible and flocculation is very sensitive to applied mixing conditions [32,33,34]. In the case of anionic flocs, a cationic agent is required to bind the polymer to the sediment [19,35]. The cations here are the Na+ ions from the dissolved inorganic salt. Due of the high affinity of the cationic polyelectrolyte with the clay, it is assumed that in a turbulent environment, this polymer will lead to more compact aggregates than an anionic polymer, which might be the reason for this large difference in size in suspended flocs (collected from the siphons).
The flocs sampled at the bottom outlets and siphons were further investigated using the setups described in Section 2.2.1, see Figures S3 and S4.
The evolution of d50 of flocs collected from the siphons as a function of clay concentration in the flume is given in Figure S5. One can see that the flocs created using the anionic flocculant (Zetag 4120) are significantly larger than the flocs created by the cationic flocculant (Zetag 7587) (see Figures S3 and S4) and that the d50 sizes for the flocs created using the anionic flocculant are shear sensitive as the anionic flocs are more open-structured and the cationic ones are compact. The anionic flocs collected from the siphons have their d50 size decreased roughly by half in 300 s, after being measured several times in the particle sizer. Flocs collected from the bottom outlets, on the other hand (see Figure S3), do not change significantly in size over that period. This size dependence evolution as a function of time holds for 2.5 g/L, 5 g/L, and 10 g/L. For 0.5 g/L, it is found that the S1 and S2 flocs are quite small compared to the other cases, as flocculation barely occurs in that case. Cationic flocs collected from the siphons, see Figure S5 or collected from the bottom samples (see Figure S4), on the other hand, did not exhibit significant changes upon shear, hereby confirming our hypothesis of these flocs being denser than anionic flocs. Some snapshots of the collected flocs, recorded using the FlocCAM, are given in Figures S8–S11.

4. Discussion

In the present article, the action of two different polyelectrolytes (one anionic and one cationic) on the flocculation ability of illite clay was investigated in a lock exchange environment. In contrast to what has been conducted in previous work [11], in these experiments, unflocculated illite clay was stored in the mixing compartment, whereas the flocculant was added in the outflow section.
  • Influence of flocculation on turbidity current propagation
The study aimed to verify whether flocculation would or would not occur during the turbidity current propagation and whether the velocity of the turbidity current would be affected. All experiments were carried out in saltwater.
According to [36], salt-induced flocculation of mineral clay is in the order of 15 to 20 min. It was already shown in [11] that there is no effect on the propagating turbidity current due to the presence of salt within the short duration of time (<1 min) of the density current propagation in the lock exchange flume. Nevertheless, salt ions do have a significant effect on flocculation when it is conducted in the presence of an anionic polyelectrolyte, as the salt cations are required to bind the polymer to the sediment.
It was found that, indeed, turbidity currents are affected by the presence of flocculant in the water. Sampling at different positions in the lock showed that the illite clay indeed had bound to the flocculant (irrespective of the flocculant charge, i.e., the flocculant being anionic or cationic).
  • Behavior of flocs obtained from different locations of turbidity currents
The size of the flocs was recorded using two setups. The first one, the SLS particle sizer, requires particles to pass through tubes to access the measurement chamber. This results in the fact that floc size was found to decrease as a function of measurement time, due to the continuous shearing in the tubes. This peculiarity of the measurement system was used to our advantage to confirm that flocs created by anionic polyelectrolyte sampled from the siphons were rather open in structure, as their sizes were found to decrease by half in some cases, after shearing for 300 s. Flocs obtained from the BOs, on the other hand, were found to be rather unaffected by shearing due to the shorter length of the sampling tube of the BOs compared to the siphons (1 m). This led us to conclude that flocs collected at the bottom of the flume probably had a longer residence time in the flow, and hence they became denser over time, due to the collapse of the polymeric hairs on the flocs.
  • Behavior of flocs analysed with Malvern Mastersizer 2000 and FlocCAM
The results obtained from the FlocCAM were first compared with the results from the particle sizer. It was found that the mean floc size of flocs obtained from the FlocCAM experiments was always higher than the ones obtained from the particle sizer. Several reasons were given to explain this observation. The two most important ones are, the first, related to the shearing in the tubes already described above, and the second, linked to the software of the particle sizer. It was also shown in the first part of the article that the settling velocities recorded using the FlocCAM are not representative of the individual settling velocity (Stokes settling) of flocs. It would therefore be inadequate to use the settling velocity results to try to estimate the particle density. Nevertheless, the FlocCAM provided some visual confirmation of the creation of flocs in the flume.
  • Behavior of flocs created with two different types of flocculant
Although flocs created by anionic flocculant and cationic flocculant were found to be very different in size, it was found that the turbidity currents in both cases propagated with the same velocity. It was also found that their front velocity was larger compared to the case where no flocculant was present in the outflow compartment. The hypothesis for this difference is due to the lubrification action of the (unflocculated) polymer, especially at the bottom of the flume.
By varying sediment concentration and flocculant concentration (using Zetag 4120), it was also found, by performing jar tests, that a higher dosage (mg/g of clay) of flocculant leads to the formation of larger flocs. In the lock exchange experiments, presented in the article, only one (high) flocculant dosage was used to verify whether flocculation would or not impact the turbidity current propagation. In future studies, it would be interesting to check the dependence of the front on the dosage of flocculant. In this study, particular attention should be paid to the interaction between the bed of the flume and the turbidity current. In natural systems, as in the CCZ region, but also most marine environments, the seabed floor is composed of organic matter in the form of biofilms or flocculated debris. It would interesting to know how the composition of such a bed influences plume propagation as seen in the work of (7) and (10), where there was occurrence of flocculation.

5. Conclusions

Based on the findings of this experimental study, the behavior of flocs was observed to vary with different flocculant dosages and types. A higher dosage led to the formation of larger flocs. The flocs formed with anionic Zetag were larger in size than the ones formed with cationic Zetag. Additionally, changes in floc size were analyzed depending on the sampling location with more compact flocs obtained from bottom outlets when compared to those from siphons. The role of flocculants within the water column was also understood, as well as how flocculation takes places inside of the turbidity current when it propagates. This knowledge can be useful in understanding floc characteristics for controlling sediment plume dispersion in case of dredging activities and as well as in mining operations.

Supplementary Materials

The following supporting information can be downloaded at: https://www.mdpi.com/article/10.3390/jmse12101884/s1.

Author Contributions

S.A.W. performed the jar test and lock exchange experiments and formulated the first draft. W.A., C.C. and R.H. contributed to data analysis and interpretation. C.C. and R.H. contributed to the manuscript’s revision, and reviewed and approved the submitted version. All authors have read and agreed to the published version of the manuscript.

Funding

This research was conducted as a part of the PlumeFloc project and has received funding from NWO (NWO: TWM.BL.019.004).

Institutional Review Board Statement

Not applicable for this study as it did not involve humans or animals.

Informed Consent Statement

Not applicable for this study as it did not involve humans or animals.

Data Availability Statement

The data used in this study is included in the article itself and in the Supplementary Materials. Further inquiries can be directed to the corresponding author.

Acknowledgments

Deltares is gratefully acknowledged for the use of their facilities. This work is performed in the framework of PlumeFloc (NWO: TMW.BL.019.004, Topsector Water and Maritiem: Blauwe route) within the MUDNET academic network (https://www.tudelft.nl/mudnet/) accessed on 18 January 2024.

Conflicts of Interest

The authors declare no conflict of interest.

Correction Statement

This article has been republished with a minor correction to the Document Type, Institutional Review Board Statement, Informed Consent Statement and Data Availability Statement. This change does not affect the scientific content of the article.

References

  1. CEDA. Ceda Position Paper: Underwater Sound in Relation to Dredging; Terra Et Aqua, International Association of Dredging Companies. December 2011. Available online: https://www.iadc-dredging.com/wp-content/uploads/2017/02/article-ceda-position-paper-underwater-sound-in-relation-to-dredging-125-4.pdf (accessed on 1 November 2023).
  2. Erftemeijer, P.L.A.; Riegl, B.; Hoeksema, B.W.; Todd, P.A. Environmental impacts of dredging and other sediment disturbances on corals: A review. Mar. Pollut. Bull. 2012, 64, 1737–1765. [Google Scholar] [CrossRef] [PubMed]
  3. Victor, O.; Ikenna, O.C.; Ndubuisi, I.G. Environmental effect of dredging and geochemical fractionation of heavy metals in sediments removed from river. Mod. Chem. 2018, 7, 44–49. [Google Scholar]
  4. Bruun, P.; Gayes, P.; Schwab, W.; Eiser, W. Dredging. In Port and Coastal Engineering Developments in Science and Technology; Journal of Coastal Research, Special Issue No. 46; Coastal Education and Research Foundation, Inc.: Hilton Head Island, SC, USA, 2005; pp. 453–525. [Google Scholar]
  5. Elerian, M.; Alhaddad, S.; Helmons, R.; van Rhee, C. Near-field analysis of turbidity flows generated by polymetallic nodule mining tools. Mining 2021, 1, 251–278. [Google Scholar] [CrossRef]
  6. Todd, V.L.; Todd, I.B.; Gardiner, J.C.; Morrin, E.C.; MacPherson, N.A.; DiMarzio, N.A.; Thomsen, F. A review of impacts of marine dredging activities on marine mammals. ICES J. Mar. Sci. 2014, 72, 328–340. [Google Scholar] [CrossRef]
  7. Gillard, B.; Purkiani, K.; Chatzievangelou, D.; Vink, A.; Iversen, M.H.; Thomsen, L. Physical and hydrodynamic properties of deep sea mining-generated, abyssal sediment plumes in the clarion clipperton fracture zone (eastern-central pacific). Elem. Sci. Anthr. 2019, 7, 5. [Google Scholar] [CrossRef]
  8. Gausepohl, F.; Hennke, A.; Schoening, T.; Köser, K.; Greinert, J. Scars in the abyss: Reconstructing sequence, location and temporal change of the 78 plough tracks of the 1989 discol deep-sea disturbance experiment in the peru basin. Biogeosciences 2020, 17, 1463–1493. [Google Scholar] [CrossRef]
  9. van Grunsven, F.; Keetels, G.; van Rhee, C. The initial spreading of turbidity plumes–dedicated laboratory experiments for model validation. In Proceedings of the 48th Underwater Mining Conference (UMC), Bergen, Norway, 10–14 September 2018. [Google Scholar]
  10. Spearman, J.; Taylor, J.; Crossouard, N.; Cooper, A.; Turnbull, M.; Manning, A.; Lee, M.; Murton, B. Measurement and modelling of deep sea sediment plumes and implications for deep sea mining. Sci. Rep. 2020, 10, 5075. [Google Scholar] [CrossRef]
  11. Ali, W.; Enthoven, D.; Kirichek, A.; Chassagne, C.; Helmons, R. Effect of flocculation on turbidity currents. Front. Earth Sci. 2022, 10, 1014170. [Google Scholar] [CrossRef]
  12. Eisma, D. Flocculation and de-flocculation of suspended matter in estuaries. Neth. J. Sea Res. 1986, 20, 183–199. [Google Scholar] [CrossRef]
  13. Droppo, I.G.; Ongley, E.D. Flocculation of suspended sediment in rivers of southeastern canada. Water Res. 1994, 28, 1799–1809. [Google Scholar] [CrossRef]
  14. Elerian, M.; Huang, Z.; van Rhee, C.; Helmons, R. Flocculation effect on turbidity flows generated by deep-sea mining: A numerical study. Ocean. Eng. 2023, 277, 114250. [Google Scholar] [CrossRef]
  15. Nogueira, H.I.; Adduce, C.; Alves, E.; Franca, M.J. Analysis of lock-exchange gravity currents over smooth and rough beds. J. Hydraul. Res. 2013, 51, 417–431. [Google Scholar] [CrossRef]
  16. Baker, M.L.; Baas, J.H.; Malarkey, J.; Jacinto, R.S.; Craig, M.J.; Kane, I.A.; Barker, S. The effect of clay type on the properties of cohesive sediment gravity flows and their deposits. J. Sediment. Res. 2017, 87, 1176–1195. [Google Scholar] [CrossRef]
  17. Craig, M.J.; Baas, J.H.; Amos, K.J.; Strachan, L.J.; Manning, A.J.; Paterson, D.M.; Hope, J.A.; Nodder, S.D.; Baker, M.L. Biomediation of submarine sediment gravity flow dynamics. Geology 2019, 48, 72–76. [Google Scholar] [CrossRef]
  18. Ali, W.; Enthoven, D.; Kirichek, A.; Helmons, R.; Chassagne, C. Can flocculation reduce the dispersion of deep sea sediment plumes? In Proceedings of the WODCON XXIII, Copenhagen, Denmark, 16–20 May 2022. [Google Scholar]
  19. Shakeel, A.; Safar, Z.; Ibanez, M.; van Paassen, L.; Chassagne, C. Flocculation of clay suspensions by anionic and cationic polyelectrolytes: A systematic analysis. Minerals 2020, 10, 999. [Google Scholar] [CrossRef]
  20. International Seabed Authority. A Geological Model of Polymetallic Nodule Deposits in the Clarion Clipperton Fracture Zone; Technical Report; International Seabed Authority: Kingston, Jamaica, 2018. [Google Scholar]
  21. Helmons, R.; de Wit, L.; de Stigter, H.; Spearman, J. Dispersion of benthic plumes in deep-sea mining: What lessons can be learned from dredging? Front. Earth Sci. 2022, 10, 868701. [Google Scholar] [CrossRef]
  22. Nichols, C.A.M.; Guezennec, J.; Bowman, J.P. Bacterial exopolysaccharides from extreme marine environments with special consideration of the southern ocean, sea ice, and deep-sea hydrothermal vents: A review. Mar. Biotechnol. 2005, 7, 253–271. [Google Scholar] [CrossRef]
  23. Deng, Z.; He, Q.; Safar, Z.; Chassagne, C. The role of algae in fine sediment flocculation: In-situ and laboratory measurements. Mar. Geol. 2019, 413, 71–84. [Google Scholar] [CrossRef]
  24. Flemming, H.-C.; Wingender, J. Relevance of microbial extracellular polymeric substances (epss)—Part i: Structural and ecological aspects. Water Sci. Technol. 2001, 43, 1–8. [Google Scholar] [CrossRef]
  25. Mietta, F.; Chassagne, C.; Manning, A.J.; Winterwerp, J.C. Influence of shear rate, organic matter content, pH and salinity on mud flocculation. Ocean. Dyn. 2009, 59, 751–763. [Google Scholar] [CrossRef]
  26. Manning, A.J.; Friend, P.L.; Prowse, N.; Amos, C.L. Estuarine mud flocculation properties determined using an annular mini-flume and the labsfloc system. Cont. Shelf Res. 2007, 27, 1080–1095. [Google Scholar] [CrossRef]
  27. Ye, L.; Manning, A.J.; Hsu, T.-J. Oil-mineral flocculation and settling velocity in saline water. Water Res. 2020, 173, 115569. [Google Scholar] [CrossRef] [PubMed]
  28. Brown, D.; Christian, W.; Hanson, R. Tracker Video Analysis and Modeling Tool. Available online: https://physlets.org/tracker/ (accessed on 1 August 2023).
  29. Ali, W.; Kirichek, A.; Chassagne, C. Collective effects on the settling of clay flocs. Appl. Clay Sci. 2024, 254, 107399. [Google Scholar] [CrossRef]
  30. Sanz, M.I. Flocculation and Consolidation of Cohesive Sediments under the Influence of Coagulant and Flocculant. Ph.D. Thesis, Delft University of Technology, Delft, The Netherlands, 2018. [Google Scholar]
  31. Goodwin, J.W. Colloids and Interfaces with Surfactants and Polymers, 2nd ed.; John Wiley & Sons: Hoboken, NJ, USA, 2009; pp. 1–10. [Google Scholar]
  32. Barany, S.; Meszaros, R.; Kozakova, I.; Skvarla, I. Kinetics and mechanism of flocculation of bentonite and kaolin suspensions with polyelectrolytes and the strength of floccs. Colloid J. 2009, 71, 285–292. [Google Scholar] [CrossRef]
  33. Barany, S.; Kozakova, I.; Marcinova, L.; Skvarla, J. Electrokinetic potential of bentonite and kaolin particles in the presence of polymer mixtures. Colloid J. 2010, 72, 595–601. [Google Scholar] [CrossRef]
  34. Bárány, S.; Meszaros, R.; Marcinova, L.; Skvarla, J. Effect of polyelectrolyte mixtures on the electrokinetic potential and kinetics of flocculation of clay mineral particles. Colloids Surf. A Physicochem. Eng. Asp. 2011, 383, 48–55. [Google Scholar] [CrossRef]
  35. Lee, B.J.; Schlautman, M.A.; Toorman, E.; Fettweis, M. Competition between kaolinite flocculation and stabilization in divalent cation solutions dosed with anionic polyacrylamides. Water Res. 2012, 46, 5696–5706. [Google Scholar] [CrossRef]
  36. Francesca, M. Evolution of the Floc Size Distribution of Cohesive Sediments. Ph.D. Thesis, Delft University of Technology, Delft, The Netherlands, 2010. [Google Scholar]
Figure 1. Particle size and settling velocity measurements; (a) mixing jar coupled with a particle size analyzer [11]; (b) FlocCAM setup that enables to measure both size and settling velocity of particles [11].
Jmse 12 01884 g001
Figure 2. Lock exchange flume with siphons S1 and S2 and bottom outlets BO1, BO2, and BO3.
Jmse 12 01884 g002
Figure 3. Comparison of floc sizes obtained from static light scattering measurements using different dosages (mg of added flocculant per gram of clay) of Zetag 4120 as indicated in the legends. The red square at t = 0 indicates the size of unflocculated illite clay. (a) d10 floc size. (b) d50 floc size. (c) d90 floc size.
Jmse 12 01884 g003
Figure 4. Particle size distribution obtained from the Malvern Mastersizer 2000 for different dosages of Zetag 4120 (a) 0.35 mg/g (b) 0.25 mg/g (c) 0.20 mg/g and (d) 0.10 mg/g.
Jmse 12 01884 g004
Figure 5. Comparison of floc size and settling velocity using different dosages of Zetag 4120. (a) 0.35 mg/g and 0.10 mg/g (b) 0.25 mg/g and 0.20 mg/g (c) 0.25 mg/g and 0.35 mg/g and (d) 0.25 mg/g and 0.10 mg/g. The lines represent isodensity lines 1600, 160, and 16 kg/m3 ratio used.
Jmse 12 01884 g005
Figure 6. Comparison of front positions of turbidity currents with different sediment concentrations (a) Zetag 4120 and No-Zetag cases (b) Zetag 4120 and Zetag 7587 cases.
Jmse 12 01884 g006
Figure 7. Comparison of velocity of turbidity currents as a function of time: (a) Zetag 4120 and No-Zetag cases, (b) Zetag 4120 and Zetag 7587 cases.
Jmse 12 01884 g007
Figure 8. PSD of samples obtained from turbidity currents using Zetag 4120 for different sediment concentrations: (a) 10 g/L, (b) 5 g/L, (c) 2.5 g/L, and (d) 0.5 g/L.
Jmse 12 01884 g008
Figure 9. PSD of samples obtained from turbidity currents using Zetag 7587 for different sediment concentrations: (a) 5 g/L, (b) 2.5 g/L, and (c) 0.5 g/L.
Jmse 12 01884 g009
Disclaimer/Publisher’s Note: The statements, opinions and data contained in all publications are solely those of the individual author(s) and contributor(s) and not of MDPI and/or the editor(s). MDPI and/or the editor(s) disclaim responsibility for any injury to people or property resulting from any ideas, methods, instructions or products referred to in the content.

