Article

Multiparameter Collaborative Optimization and Analysis of the Non-Penetrating Tunnel Thruster

1
State Key Laboratory of Robotics, Shenyang Institute of Automation, Chinese Academy of Sciences, Shenyang 110016, China
2
Institutes for Robotics and Intelligent Manufacturing, Chinese Academy of Sciences, Shenyang 110169, China
3
University of Chinese Academy of Sciences, Beijing 100049, China
*
Author to whom correspondence should be addressed.
J. Mar. Sci. Eng. 2024, 12(11), 1960; https://doi.org/10.3390/jmse12111960
Submission received: 14 September 2024 / Revised: 13 October 2024 / Accepted: 23 October 2024 / Published: 1 November 2024
(This article belongs to the Section Ocean Engineering)

Abstract

:
A brand new non-penetrating tunnel thruster (short for NPT thruster) is proposed in this paper. The tunnel structural parameters of the thruster are optimized, and the performance and optimization effect are verified by experiments. First, the design and function of the NPT thruster are introduced. Second, the computational fluid dynamics method is used to calculate the hydrodynamic performance of the NPT thruster and to analyze the static mooring thrust performance. Third, the tunnel structural parameters of the NPT thruster are optimized with the method of the response surface methodology. The pressure distributions and the flow fields on the tunnel surface of the NPT thrusters before and after optimization are compared with simulations. Finally, the mooring static thrust of the NPT thrusters is tested with experiments. The results show that the average increase in the mooring static thrust for the optimized thruster is 12.4%, and the maximum increase can reach 21.79% when the rotational speed is from 3000 rpm to 6500 rpm.

1. Introduction

The tunnel thruster is a maneuvering propulsion device that is commonly used for underwater vehicles, and it is usually categorized as a type of side thruster. It takes an important part in the dynamic positioning system of the underwater vehicles, which can enhance the underwater maneuverability of the underwater vehicles by generating lateral force or obtaining turning torque at a low navigation speed [1,2,3,4,5]. It is often employed in scenarios such as docking, undocking, or navigating through pipelines, where low speed and good maneuverability are required [6]. The structural characteristics of the tunnel thrusters are so different from the conventional propellers that the research conclusions or analysis methods of the latter cannot be directly used on the tunnel thrusters. Also, the research in the tunnel thrusters is much less than the conventional propellers.
The performance of tunnel thrusters has been studied mainly with experiments and numerical calculations. Taniguchi et al. [7] conducted model tests to investigate the rotation speed, the tunnel length, the tunnel lip, and others that affect the thrust. M. S. Chislett et al. [8] conducted a real ship test to analyze the relationship between thrust, torque, and the speed of the ship. Ralph Norrby et al. [9] conducted a full-scale ship experiment for the first time using bow thrusters to replace rudders to study the maneuvering performance of the side thruster. The experimental results demonstrated that under low speed, bow thrusters can significantly enhance the maneuverability of ships. D. E. Ridley et al. [10,11] explored the influence of ship speed on side thrusters by combining the sailing data of different types of real ships and ship model tests. Their research elucidated that the resistance of the thruster is correlated with the position and shape of the tunnel lip, and a series of measures to reduce resistance are proposed. Katsuro and Furukawa Yoshitaka et al. [12,13] conducted research to investigate the impact of ship speed on side thrusters based on ship model experiments and analyzed the correlation of ship speed changes to the thrust and torque of the side thrusters. Ping Lu et al. [14] studied the hydrodynamic performance of a ship consisting of a tunnel thruster and multiple propellers by solving the RANS (Reynolds-averaged Navier-Stokes) equation of viscous flow. The experimental results demonstrate that the presence of water flow leads to significant changes in the flow velocity, distribution of pressure in the tunnel outflow area, and significant deflection of the propeller jet emitting from the tunnel. YU Cheng et al. [15] used a numerical method based on RANS with the SST turbulence model to study the hydrodynamic performance of the tunnel thrusters. The study also demonstrates the thrust mechanism of the impeller hub and how the impeller generates force for the ship hull. Kinnas et al. [16] proposed a method for analyzing unsteady flow fields that combines the vortex lattice method with the RANS approach and used it for the numerical prediction of the effective wake of rim-driven tunnel thrusters. Terry et al. [17] used the agitated disk theory to discuss the problem of hydrodynamic interference between multiple side thrusters.
The performance of tunnel thrusters is closely related to the tunnel structure. Beveridge et al. [18] noted that the tunnel lip is beneficial in reducing flow separation at the tunnel entrance, but it has an adverse effect on the outflow at the tunnel exit. Taniguchi et al. [7] found out that the thrust hardly varies with the tunnel length by using model testing methods. Z. Yao [2] pointed out that the propeller torque and ship hull thrust decreased slightly with increasing tunnel length and the propeller efficiency. And the efficiency is relatively high when the tunnel length is twice the tunnel diameter. Mohan [19] conducted a numerical simulation to compare the lateral forces on the ship between a straight-tube tunnel thruster and a tunnel thruster with bent ends at the tunnel inlet and outlet. The results show that at low speed, the tunnel with bent ends exhibits significant advantages. Feng et al. [20] pointed out that with the increase in the radius of the tunnel lip, the flow field velocity within the tunnel and the pressure distribution on the propeller blades become more uniform, which could improve the efficiency of the thrusters. Baniela SI et al. [21] noted that to avoid propeller overload, the tunnel thrust should be perpendicular to the tunnel axis.
In summary, traditional tunnel thrusters occupy a high percentage of space in the vehicle due to the tunnel through the vehicle body. In this paper, a brand new non-penetrating tunnel thruster (short for NPT thruster) is proposed, with both the inlet and outlet tunnels located on the same side of the vehicle. This new thruster can achieve the same functions as the traditional tunnel thrusters while significantly enhancing the integration and the modularity of the vehicle. The main research contributions of this paper are as follows:
  • This paper takes the mooring static thrust as the optimization index and establishes a relationship model between multiple tunnel structural parameters and thrust based on the RSM (Response Surface Methodology) model. The contributions of different tunnel structural parameters to the thrust are evaluated. Then the optimal value of the model function is found, and the results of the optimization variables are obtained.
  • The characteristics of the pressure distributions and flow fields on the tunnel surface of the NPT thruster before and after optimization are compared with the simulation method. Experiments are conducted to test the mooring static thrust of the NPT thrusters, and the deviations are analyzed to ensure the accuracy and reliability of the study.
The subsequent sections of this paper are organized as follows: Section 2 compares the traditional tunnel thrusters with the NPT thrusters. The structural design and operational principle of the NPT thruster are described in detail. Section 3 uses the method of CFD (computational fluid dynamics) to calculate the NPT thruster’s hydrodynamic performance. Section 4 uses the RSM model to optimize the structural parameters of the tunnel. Section 5 analyzes the surface pressure distributions and the wake flow fields before and after optimization. Section 6 conducts experiments and analyzes the deviation of the experimental results.

2. Non-Penetrating Tunnel Thruster

The traditional tunnel thruster calls for a tunnel through the underwater vehicle body and generates lateral thrust by forming a pressure difference on each side of the tunnel, as shown in Figure 1a. With the increase in the volume of the underwater vehicle, the volume of the tunnel throughout the vehicle will also increase. In contrast, the volume of the NPT thruster remains the same size. Therefore, the NPT thruster has better space utilization. The underwater vehicles with two NPT thrusters can have better lateral thrust response than the traditional tunnel thrusters, which makes them better at attitude adjustment and position maintenance.
The NPT thruster operates in the following way: the fluid enters the inlet tunnel, converges at the end of the tunnel, and exits the outlet tunnel. The rim-driven motor powers the propeller, which creates a pressure difference at the outlet tunnel. As a result, the fluid ejects at high speed from the outlet tunnel. The working diagram is shown in Figure 1b.
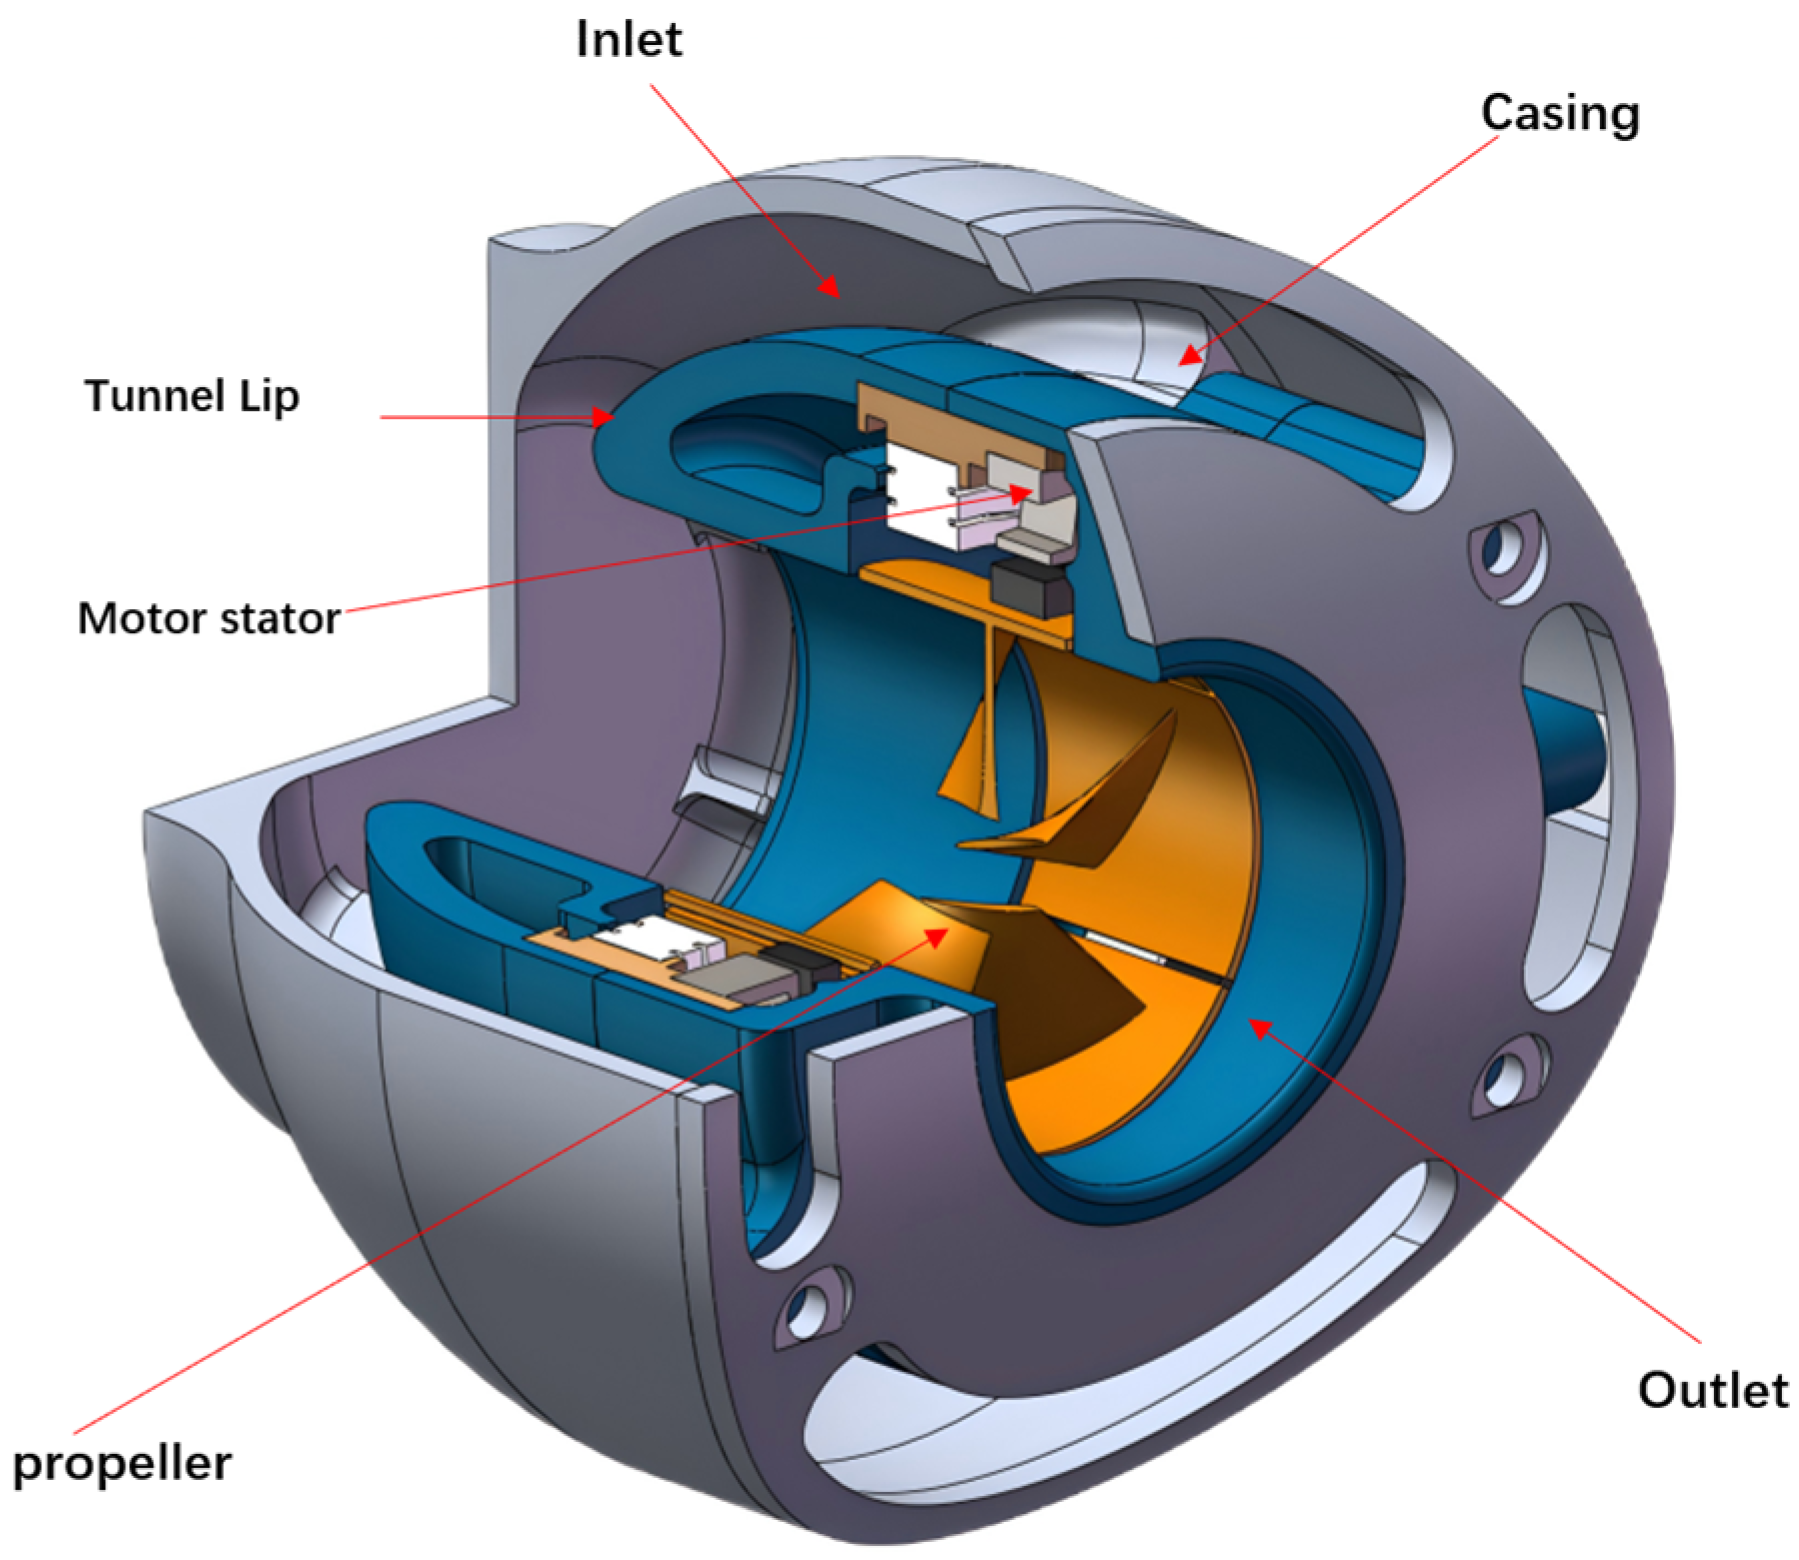
The NPT thruster proposed in this paper is composed of a rim motor, a propeller, a casing, and inlet and outlet tunnels, as shown in Figure 2. The parameters of the NPT thruster in this paper are compatible with “TS-MINI” AUV, which is designed and manufactured by Shenyang Institute of Automation, Chinese Academy of Sciences [22]. The parameters of the vehicle are shown in Table 1. Considering the size of the NPT thruster, we chose to use a rim motor with higher integration and a smaller volume. The rim motor and propeller are designed in an integrated way, with the rim motor being an outer rotor brushless DC motor placed within the casing. The casing connects the thruster to the underwater vehicle, and the inlet and outlet tunnels are located on the same side of the thruster. When fluid enters, a low-pressure zone is created between the propeller and vehicle that generates the pulling force.

3. Simulation of the Thruster Performance

3.1. Equations and Models

In this study, the CFD solution is based on the Reynolds-averaged Navier-Stokes equations, which are composed of the continuity equation and the momentum conservation equation. The Simcenter STAR-CCM+ 2206 (17.04.007-R8) software is used as the solver to solve the equations as follows [23]:
ρ t + ρ u i x i = 0
ρ u i u j x j + ρ u i t = p x i + x j u 0 u i x j + u j x i 2 3 u 0 u i x i δ i j ρ u i u j ¯
where  u i   a n d   u j  ( i j  = 1, 2, 3) are the velocity time average components,  ρ  is the density of water,  p  is the average pressure,  u 0  is the dynamic viscosity,  δ i j  is the Kronecker constant, and − p u i u j ¯  is the Reynolds stress.
Considering the similarity between the RDT thruster and rim motor in this study, the turbulence model is selected as the RNG k-ε model. For all governing equations, a second-order upwind scheme is used to discretize the convection term, and a steady-state double-precision pressure solver is used [24]. This paper uses the rotating reference frame method, which takes the additional terms in the momentum equation into account. It can avoid the physical motion of the computational grid and accelerate computational convergence [25].

3.2. Research Objects and Preprocessing

The NPT thruster model is placed in the flow field. To speed up the calculation convergence, the structure gaps are sutured. The flow field calculation domain is divided into a static domain and a rotating domain. The static domain has a diameter of 6D and a length of 14D. A symmetry plane condition was used on a distant field boundary. The velocity inlet is positioned 4D away from the center of the propeller blade with an inflow velocity of 0. The pressure outlet is located 10D from the center of the propeller. The rotating domain is basically the propeller blade, with a diameter of 0.4D and a length of 1.5D. No-slip wall condition on the propeller, hub, and shaft. The computational domain model is shown in Figure 3.
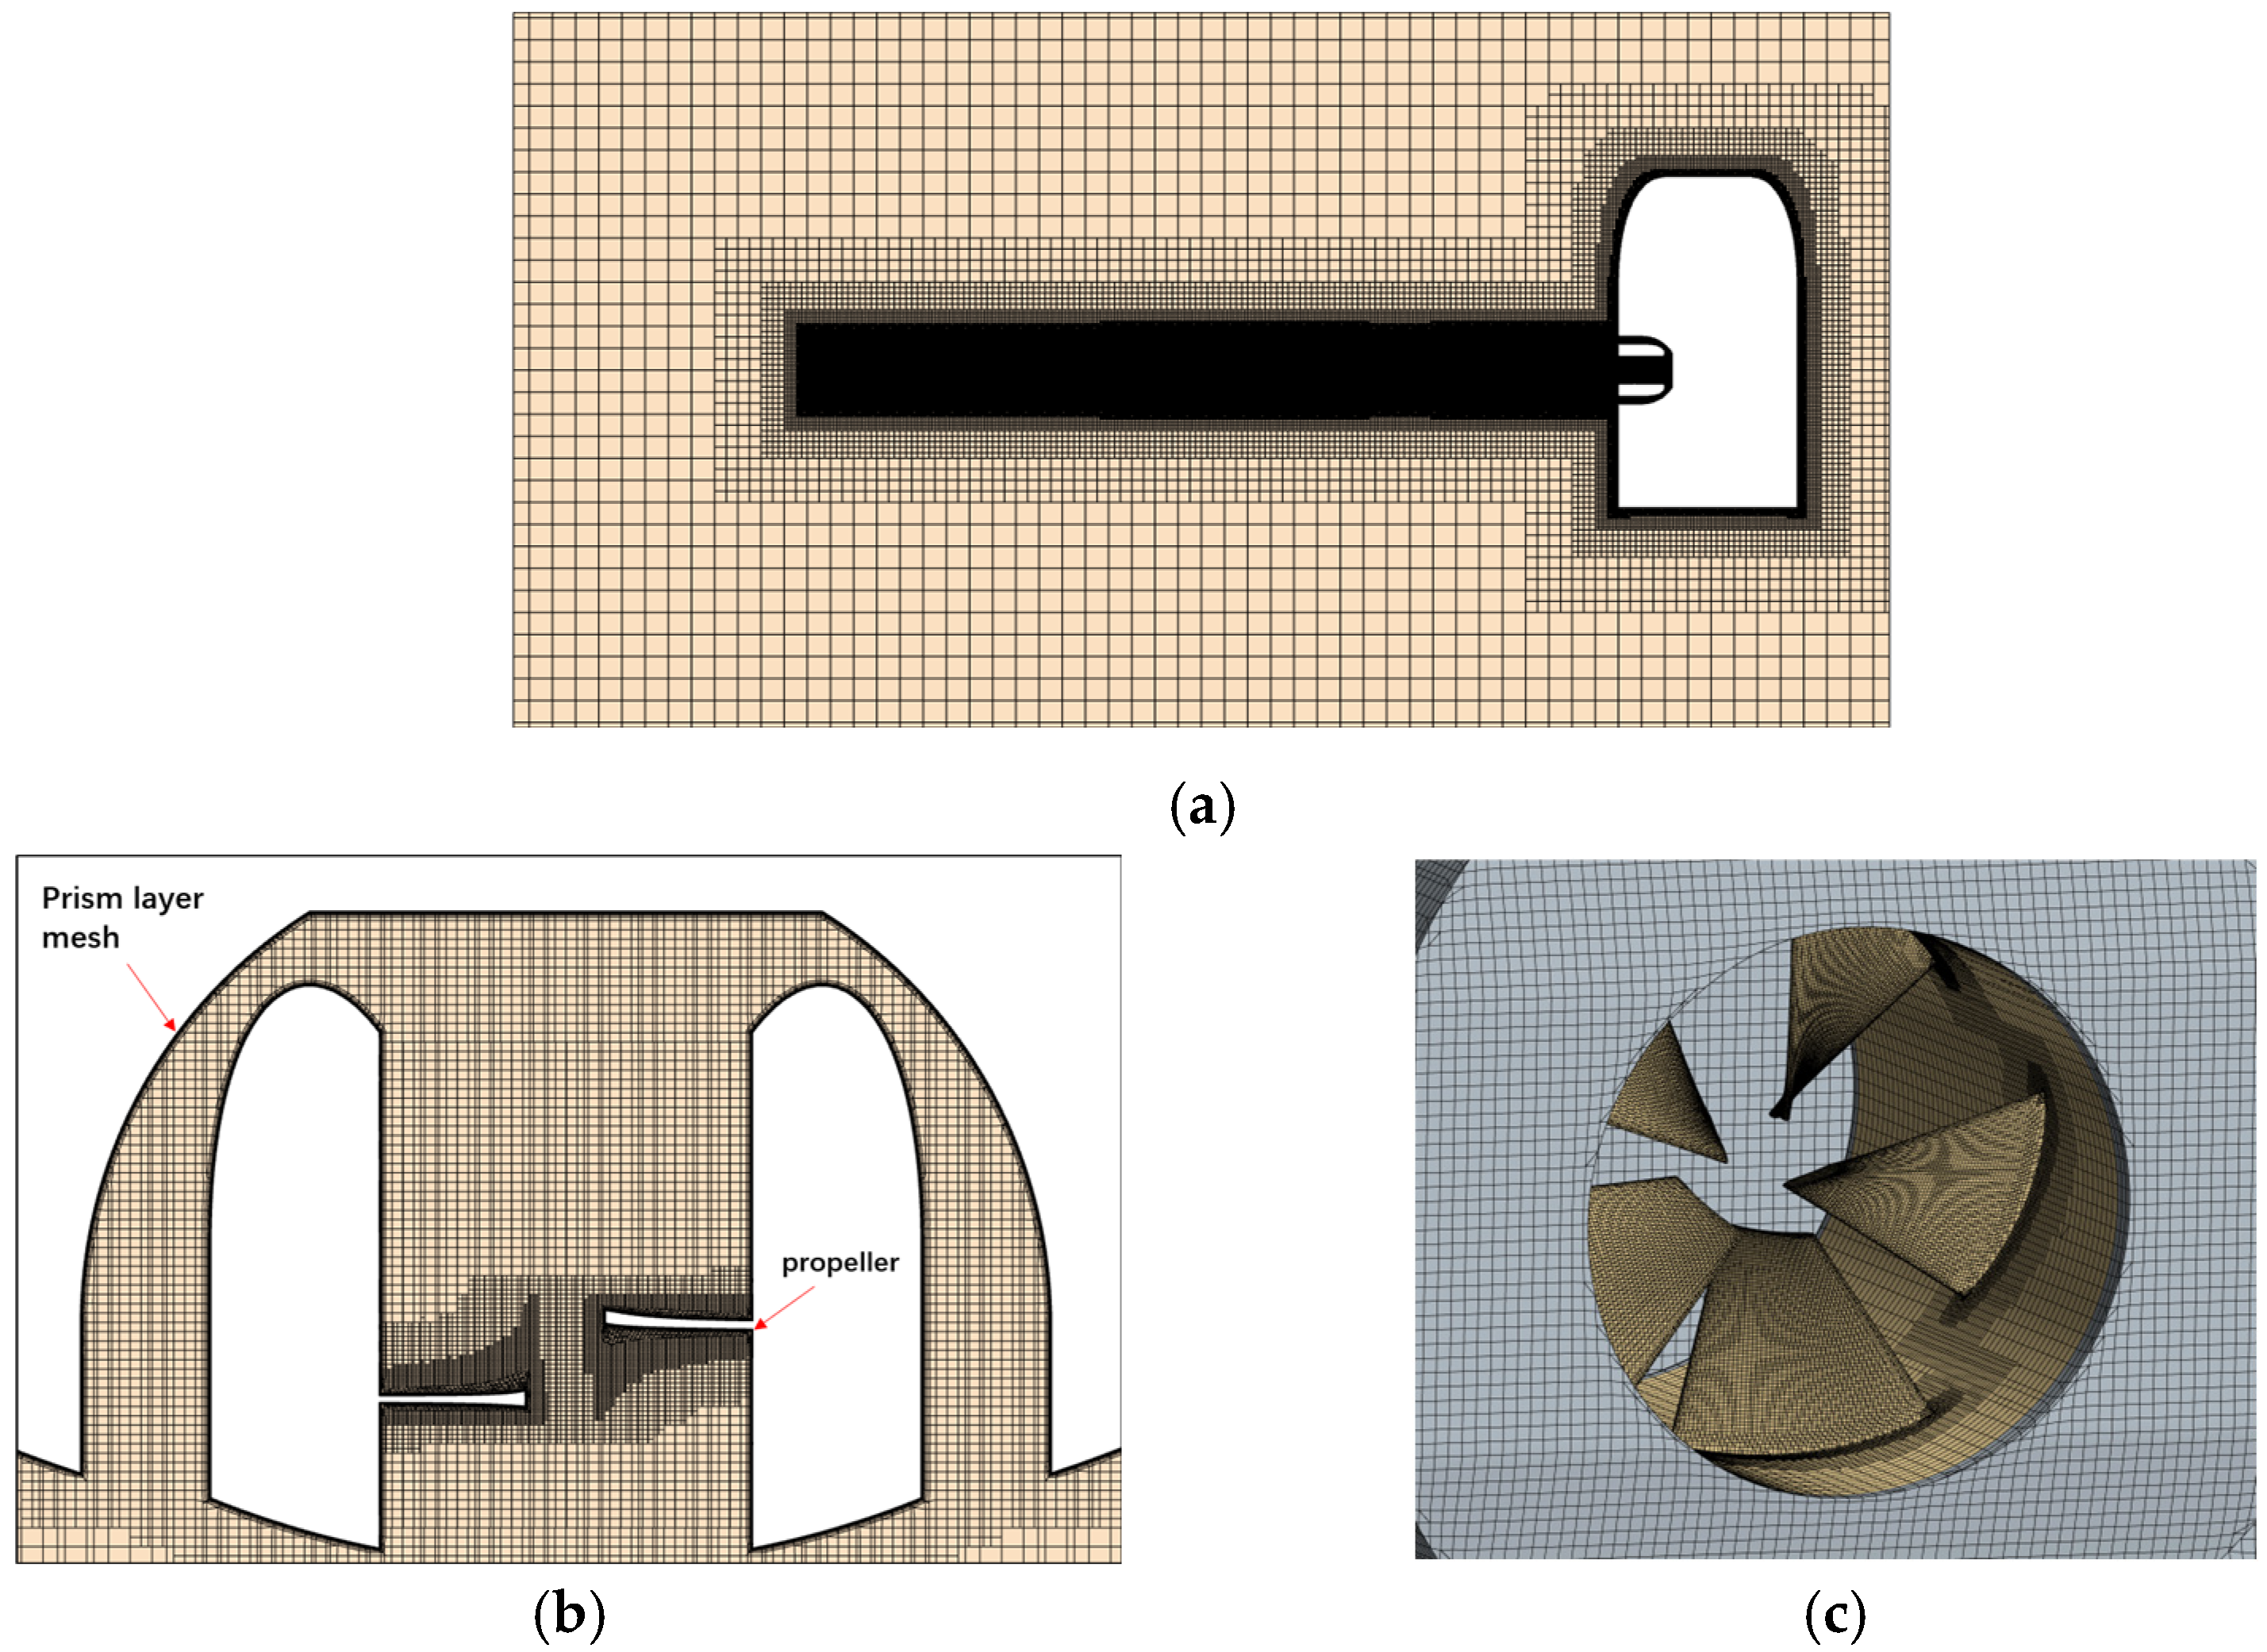
Polyhedral mesh and prism layer mesh are used to divide the computational domain. Polyhedral meshes are generated as volumetric meshes, which feature high mesh quality and generate a relatively small number of volumetric elements for the same volume. In this way, the simulation computation speed is accelerated. Prism layer meshes are utilized as boundary layer meshes, distributed on the surfaces of the tunnels and propeller blades. It is crucial to avoid generating prism layer meshes at the interface between the rotating domain and the static domain. In order to ensure reasonable computational accuracy, the mesh configuration with a 753W mesh count is selected.
The computational domain mesh is refined with volumetric and prism layer meshes in areas where the flow is more complex to get more details of the wake flow. The volumetric meshes refinement regions include the propeller, wake field, inlet tunnels, and outlet tunnels. The prism layer meshes near the tunnels are subjected to y+ wall treatment; the number of prism layer meshes is controlled to be more than 5 layers, and the y+ wall is controlled within the range of 30~150. The final grid divisions are shown in Figure 4. The parameter settings for the simulation model are shown in Table 2.

3.3. Simulation Results

3.3.1. Pressure and Flow Field Analysis

With the above meshing method, the iterative calculation is carried out until the residual value of all physical variables converged to less than 10−3 and the residual value of energy converged to less than 10−6. When the calculation can be deemed as converged [14].
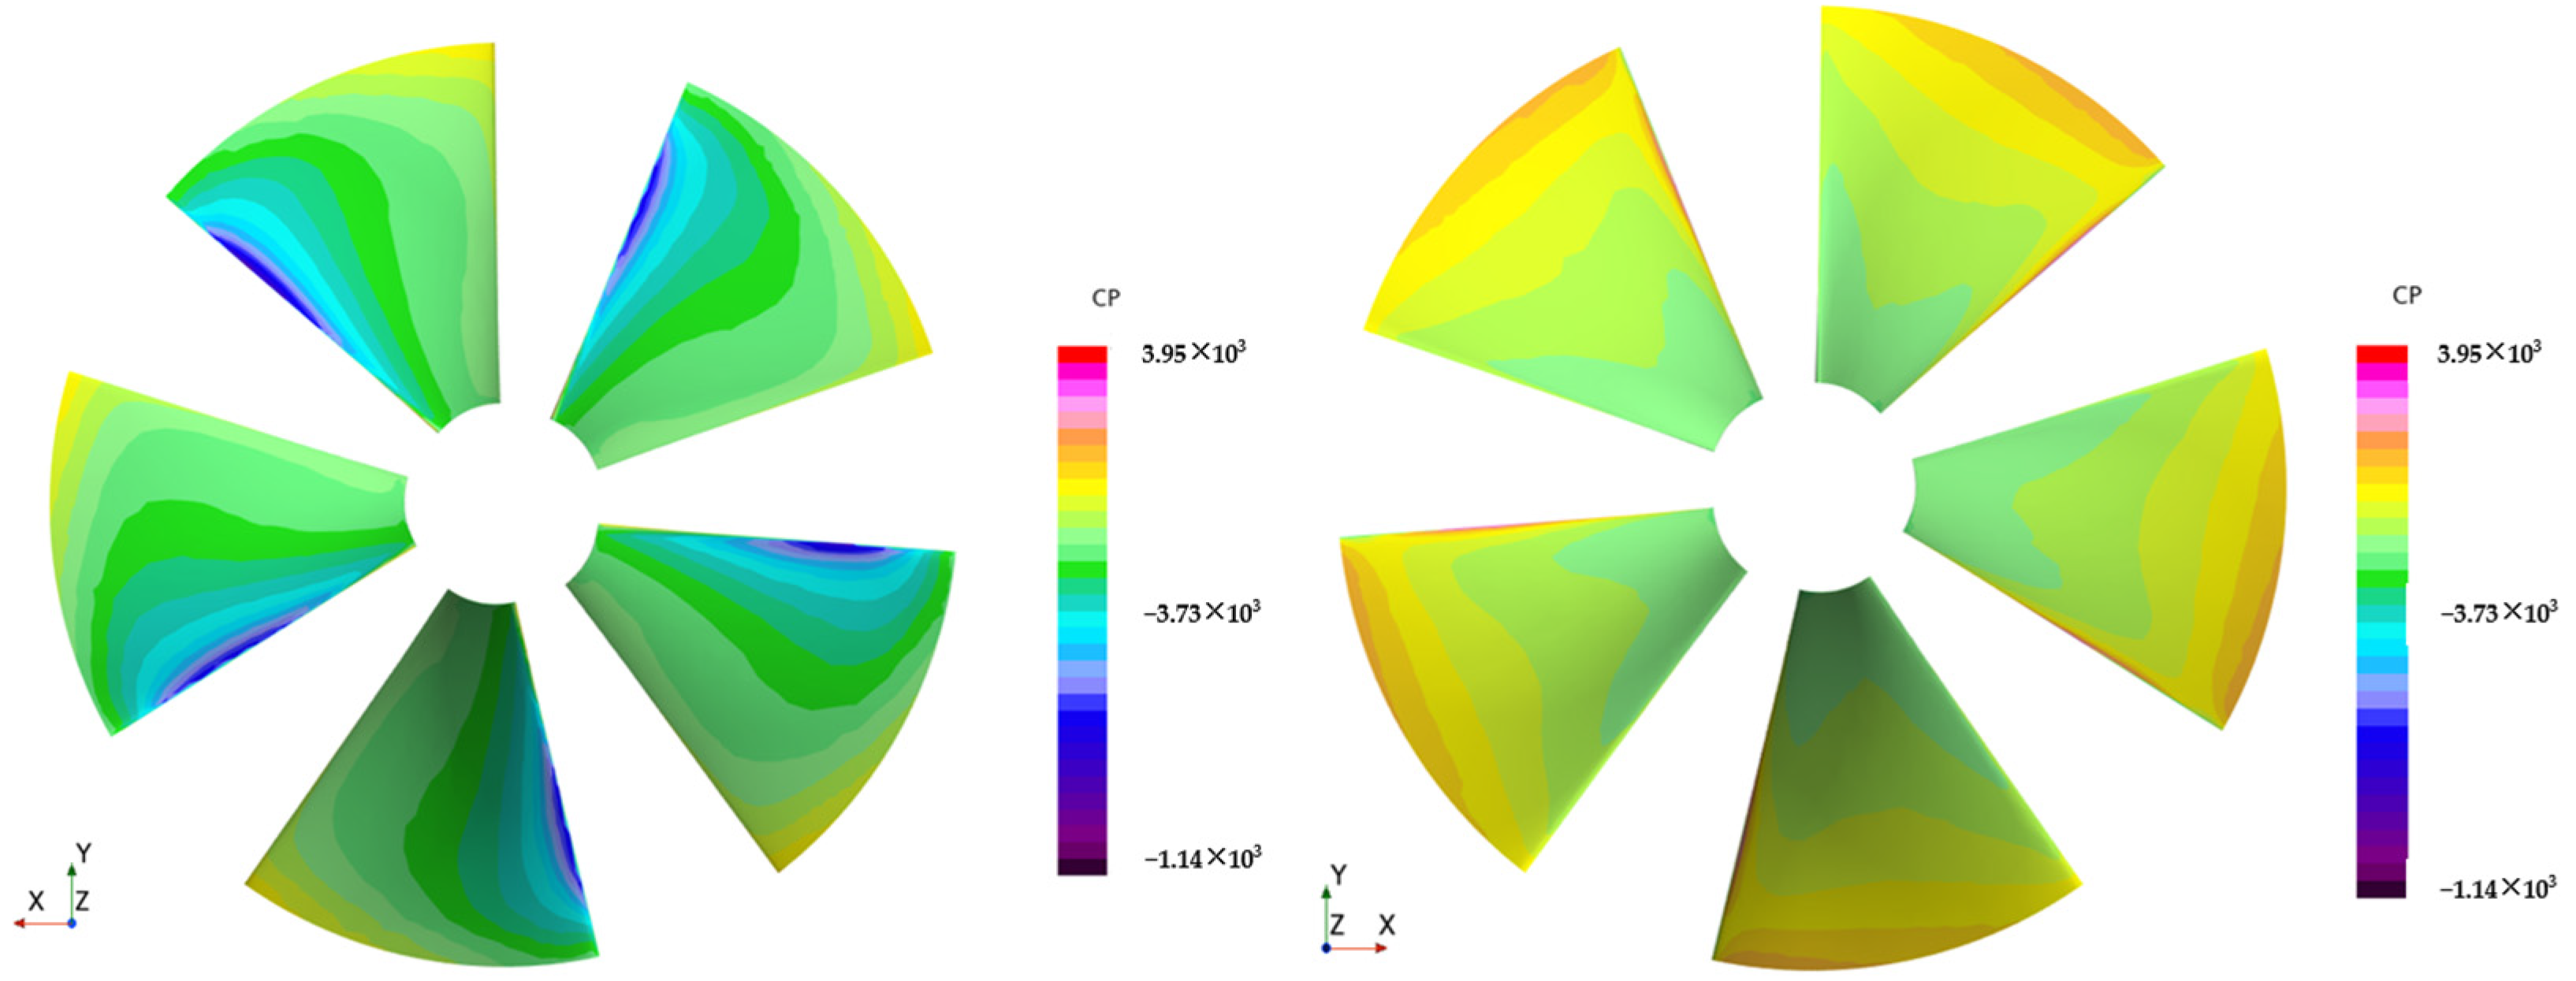
The NPT thruster blade pressure diagram under the XOY plane map is established as shown in Figure 5. There is a negative pressure area near the leading edge on the pressure side and a positive pressure area near the leading edge and the trailing edge on the suction side. The NPT thruster flow field pressure diagram under the XOZ plane map is also established, as shown in Figure 6. A large low-pressure zone is formed in the outlet tunnel area in the front of the propeller, where the pressure is lower than that of the external free fluid. This pressure difference between the two sides creates the thrust. The low-pressure area spreads along the tunnel lip toward the inlet tunnel area, which can increase the area of the low-pressure zone and cause more thrust.

3.3.2. Thrust Characteristic Calculation Results

The hydrodynamic performance of the NPT thruster, including the thruster thrust coefficient  K T , thruster torque coefficient  K Q , and thruster efficiency  η  [26,27,28] defined as follows:
K T = T ρ n 2 d 4
K Q = Q ρ n 2 d 5
η = T Q n
Table 3 provides a detailed description of the meanings of each parameter in Equations (3)–(5). The statistics of the mooring static thrust T, thruster thrust coefficient  K T , thruster torque coefficient  K Q , and thruster efficiency  η  are obtained in the range of rotational speed from 3000 rpm to 6500 rpm. Each parameter is sampled once every 500 rpm increase in speed.
The simulation results are shown in Figure 7. The torque coefficient  K Q  is numerically at the same level as the thrust coefficient  K T . The thrust value increases with the increasing speed from 0.204 N at 3000 rpm to 0.799 N at 6500 rpm. The thrust coefficient  K T  and the thruster efficiency  η  first increase but then decrease. The thrust coefficient  K T  reaches its maximum at 3500 rpm, which is 0.578. The minimum is 0.416 at the speed of 5500 rpm. The maximum thruster efficiency  η  is 0.0372 N/W at the speed of 3500 rpm, and the minimum is 0.0165 N/W at 6500 rpm. The torque coefficient  K Q  slightly decreases and then increases. The maximum value is 0.222 at the speed of 3000 rpm, and the minimum value is 0.181 at 4500 rpm.

4. Optimization of the Thruster

4.1. Parameter Selection

Response surface model (RSM) obtains certain numbers of experimental results with appropriate experimental design methods [29] and uses multiple high-order regression equations to fit the mathematical functional relationship between multiple influencing factors and response targets [30]. The purpose is to optimize the response target affected by multiple independent variables [31].
S = a 0 + i = 1 k a i x i + I ˙ = 1 k a i i x i 2 + i , j = 1 , j i k a i j x i x j
where  S  is the trial output;  a 0  is the average of responses; and  a i a i i , and  a i j  are response coefficients.
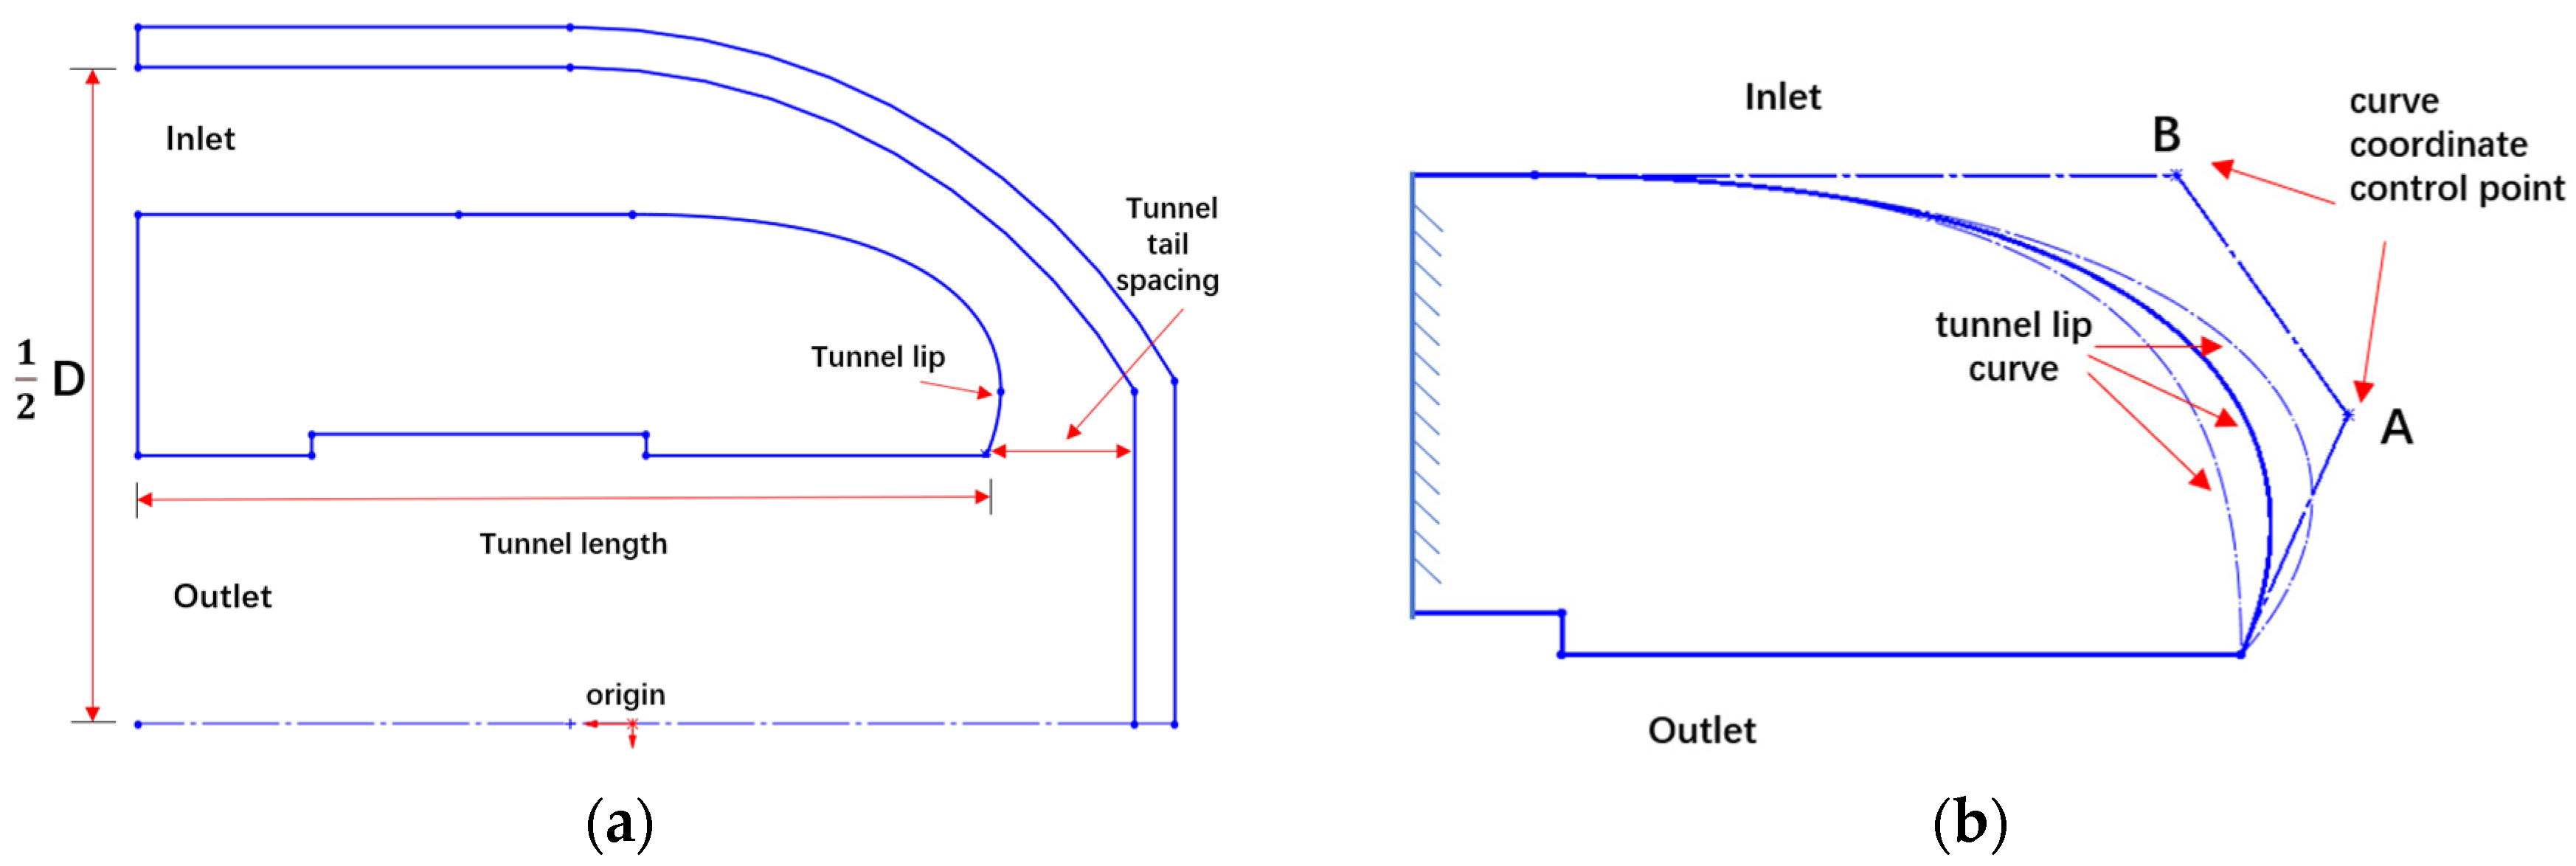
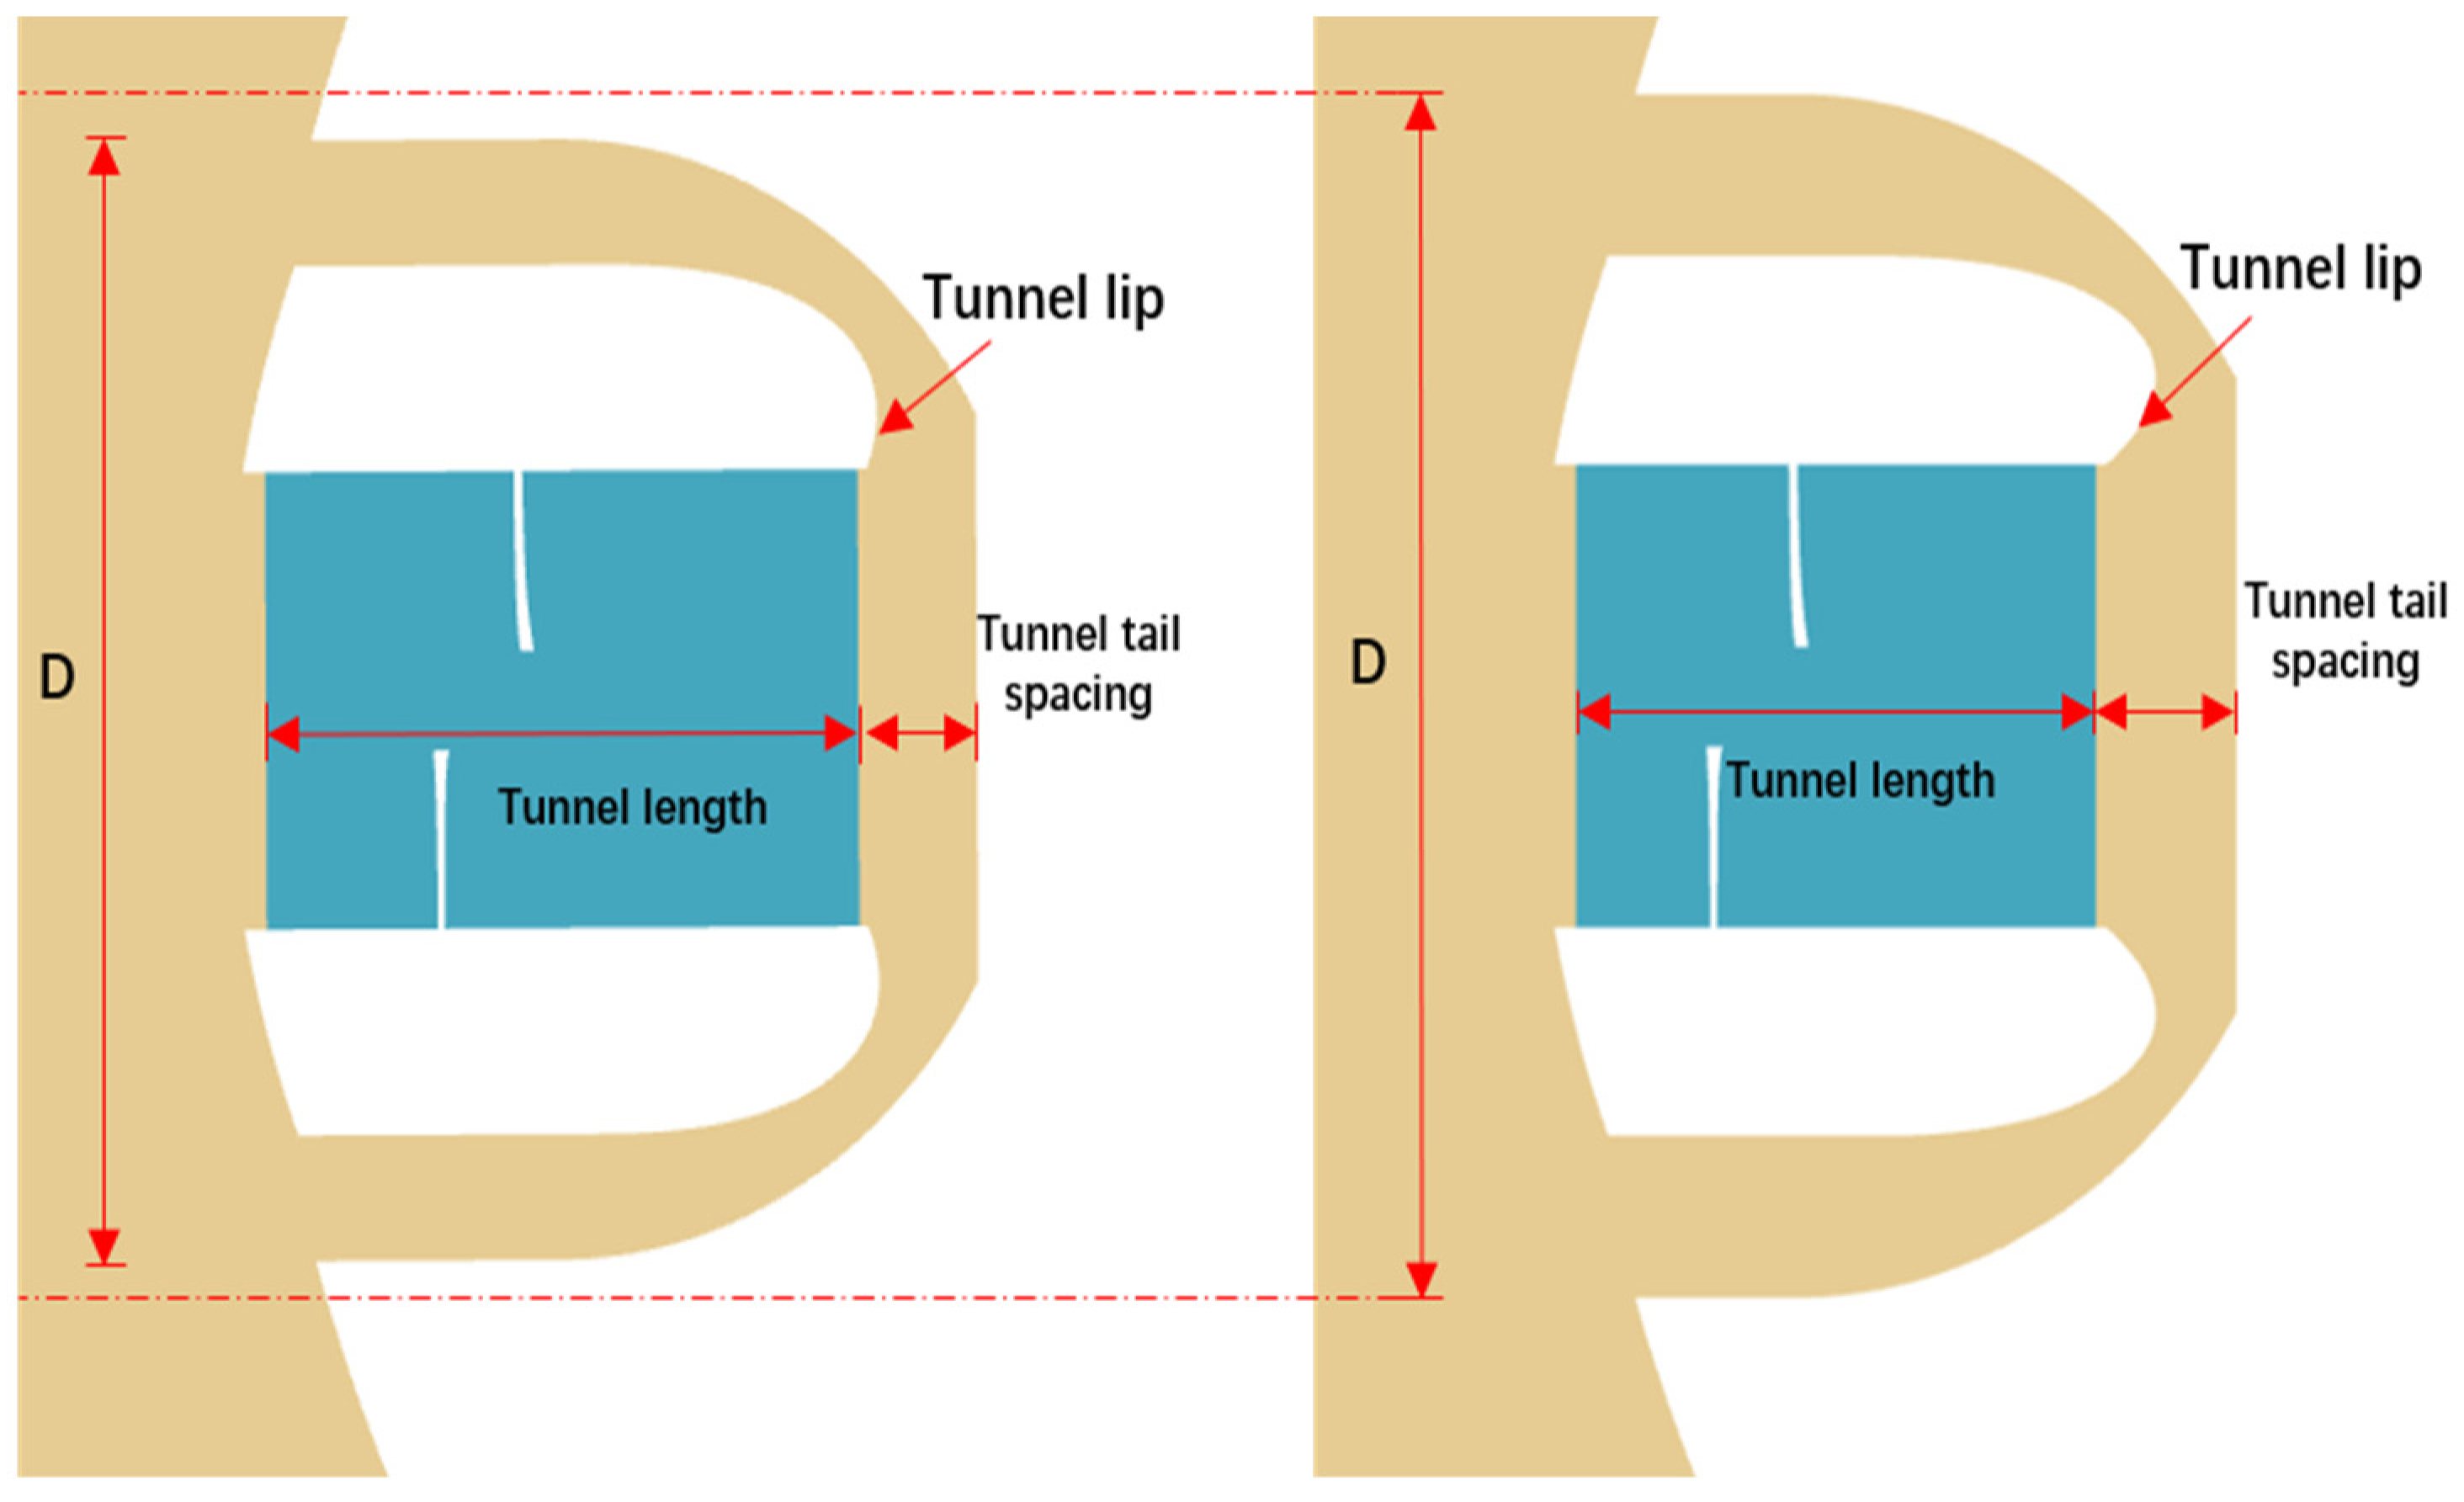
The geometric parameters of the different design variables are shown in Figure 8. The tunnel length has a certain effect on the thrust. A shorter tunnel will reduce the effect of the wake, leading to more energy loss. On the other hand, a longer tunnel will increase the friction between the wake and the tunnel wall and diminish the thruster efficiency. The tunnel total diameter D includes the space of the inlet tunnel and outlet tunnel. The outlet channel diameter is the same as the propeller diameter d, so changing D is equivalent to changing the inlet tunnel diameter.
The tunnel lip curve is a Bezier spline curve controlled by two curve coordinate control points. By adjusting the y-coordinate of the control point A, the shape of the tunnel lip curve can be modified to obtain a series of different curves. The tunnel lip curve has an impact on the distributions of velocity and pressure of the tunnel flow field. As a unique parameter of the NPT thruster structure, the tunnel tail spacing may affect the flow separation at the inlet tunnels. These four parameters are used as design variables to achieve the collaborative optimization of the NPT thruster.
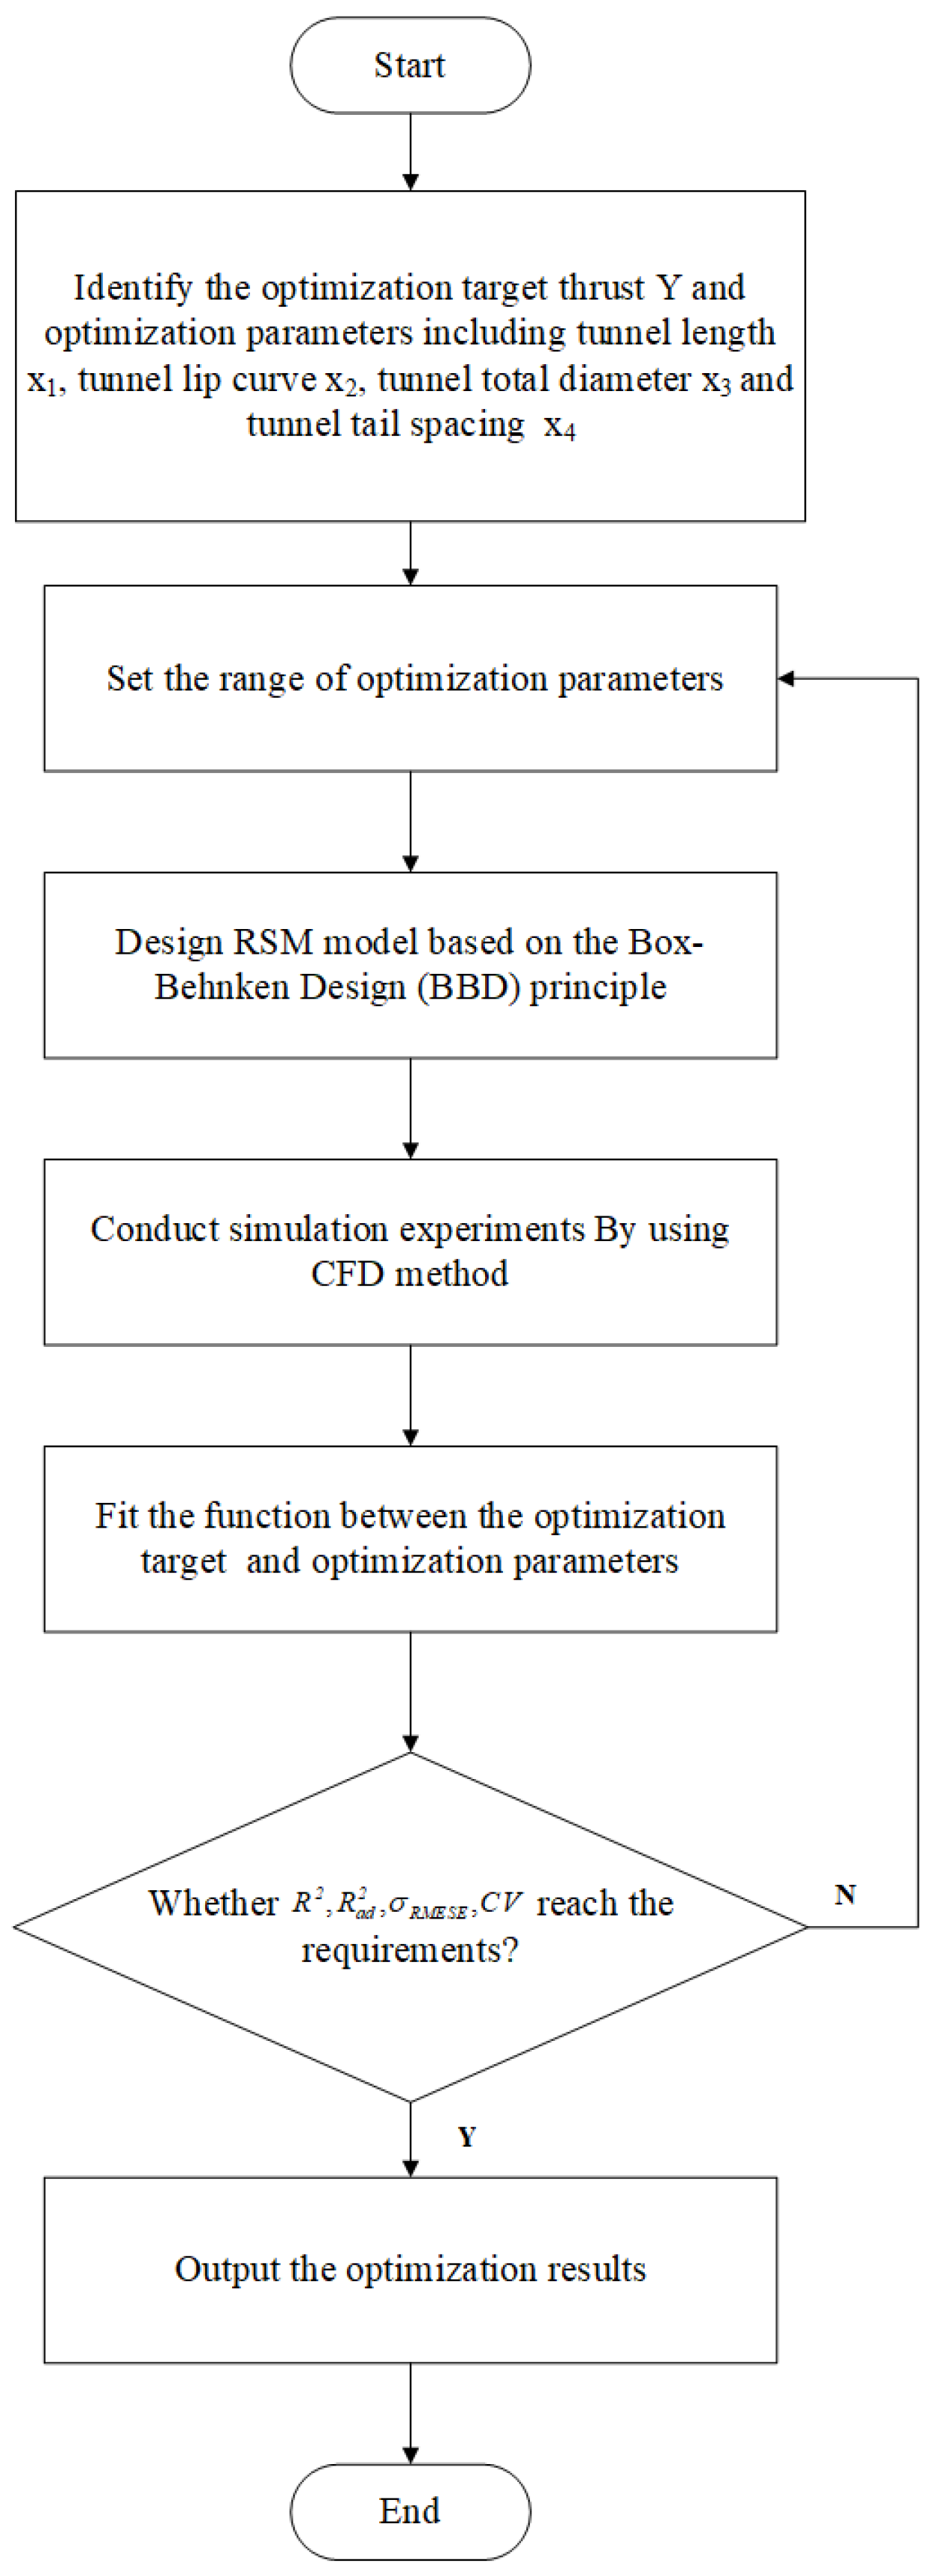
The procedure of the RSM is shown in Figure 9.

4.2. Model Establishment

The influences of the tunnel length  X 1 , tunnel lip curve  X 2 , tunnel total diameter  X 3  and tunnel tail spacing  X 4  of the NPT thruster on mooring static thrust are analyzed and designed in this paper. The factor levels based on the BBD (Box–Behnken design) principle are shown in Table 4.
Based on Table 4, the ultimate experimental data are twenty-nine groups, including five validation experiments, which can improve accurate estimation of experimental errors. Thrust simulation values are conducted with these experimental data, which is obtained by the same CFD simulations as for the model in Section 3. The experimental plan and results are shown in Table 5.

4.3. Response Surface Model Analysis

The simulation data presented in Table 3 is analyzed with regression fitting. The multiple quadratic regression equation among the thrust  Y , tunnel length  X 1 , tunnel lip curve  X 2 , tunnel total diameter  X 3 , and tunnel tail spacing  X 4 , as shown in Table 6:
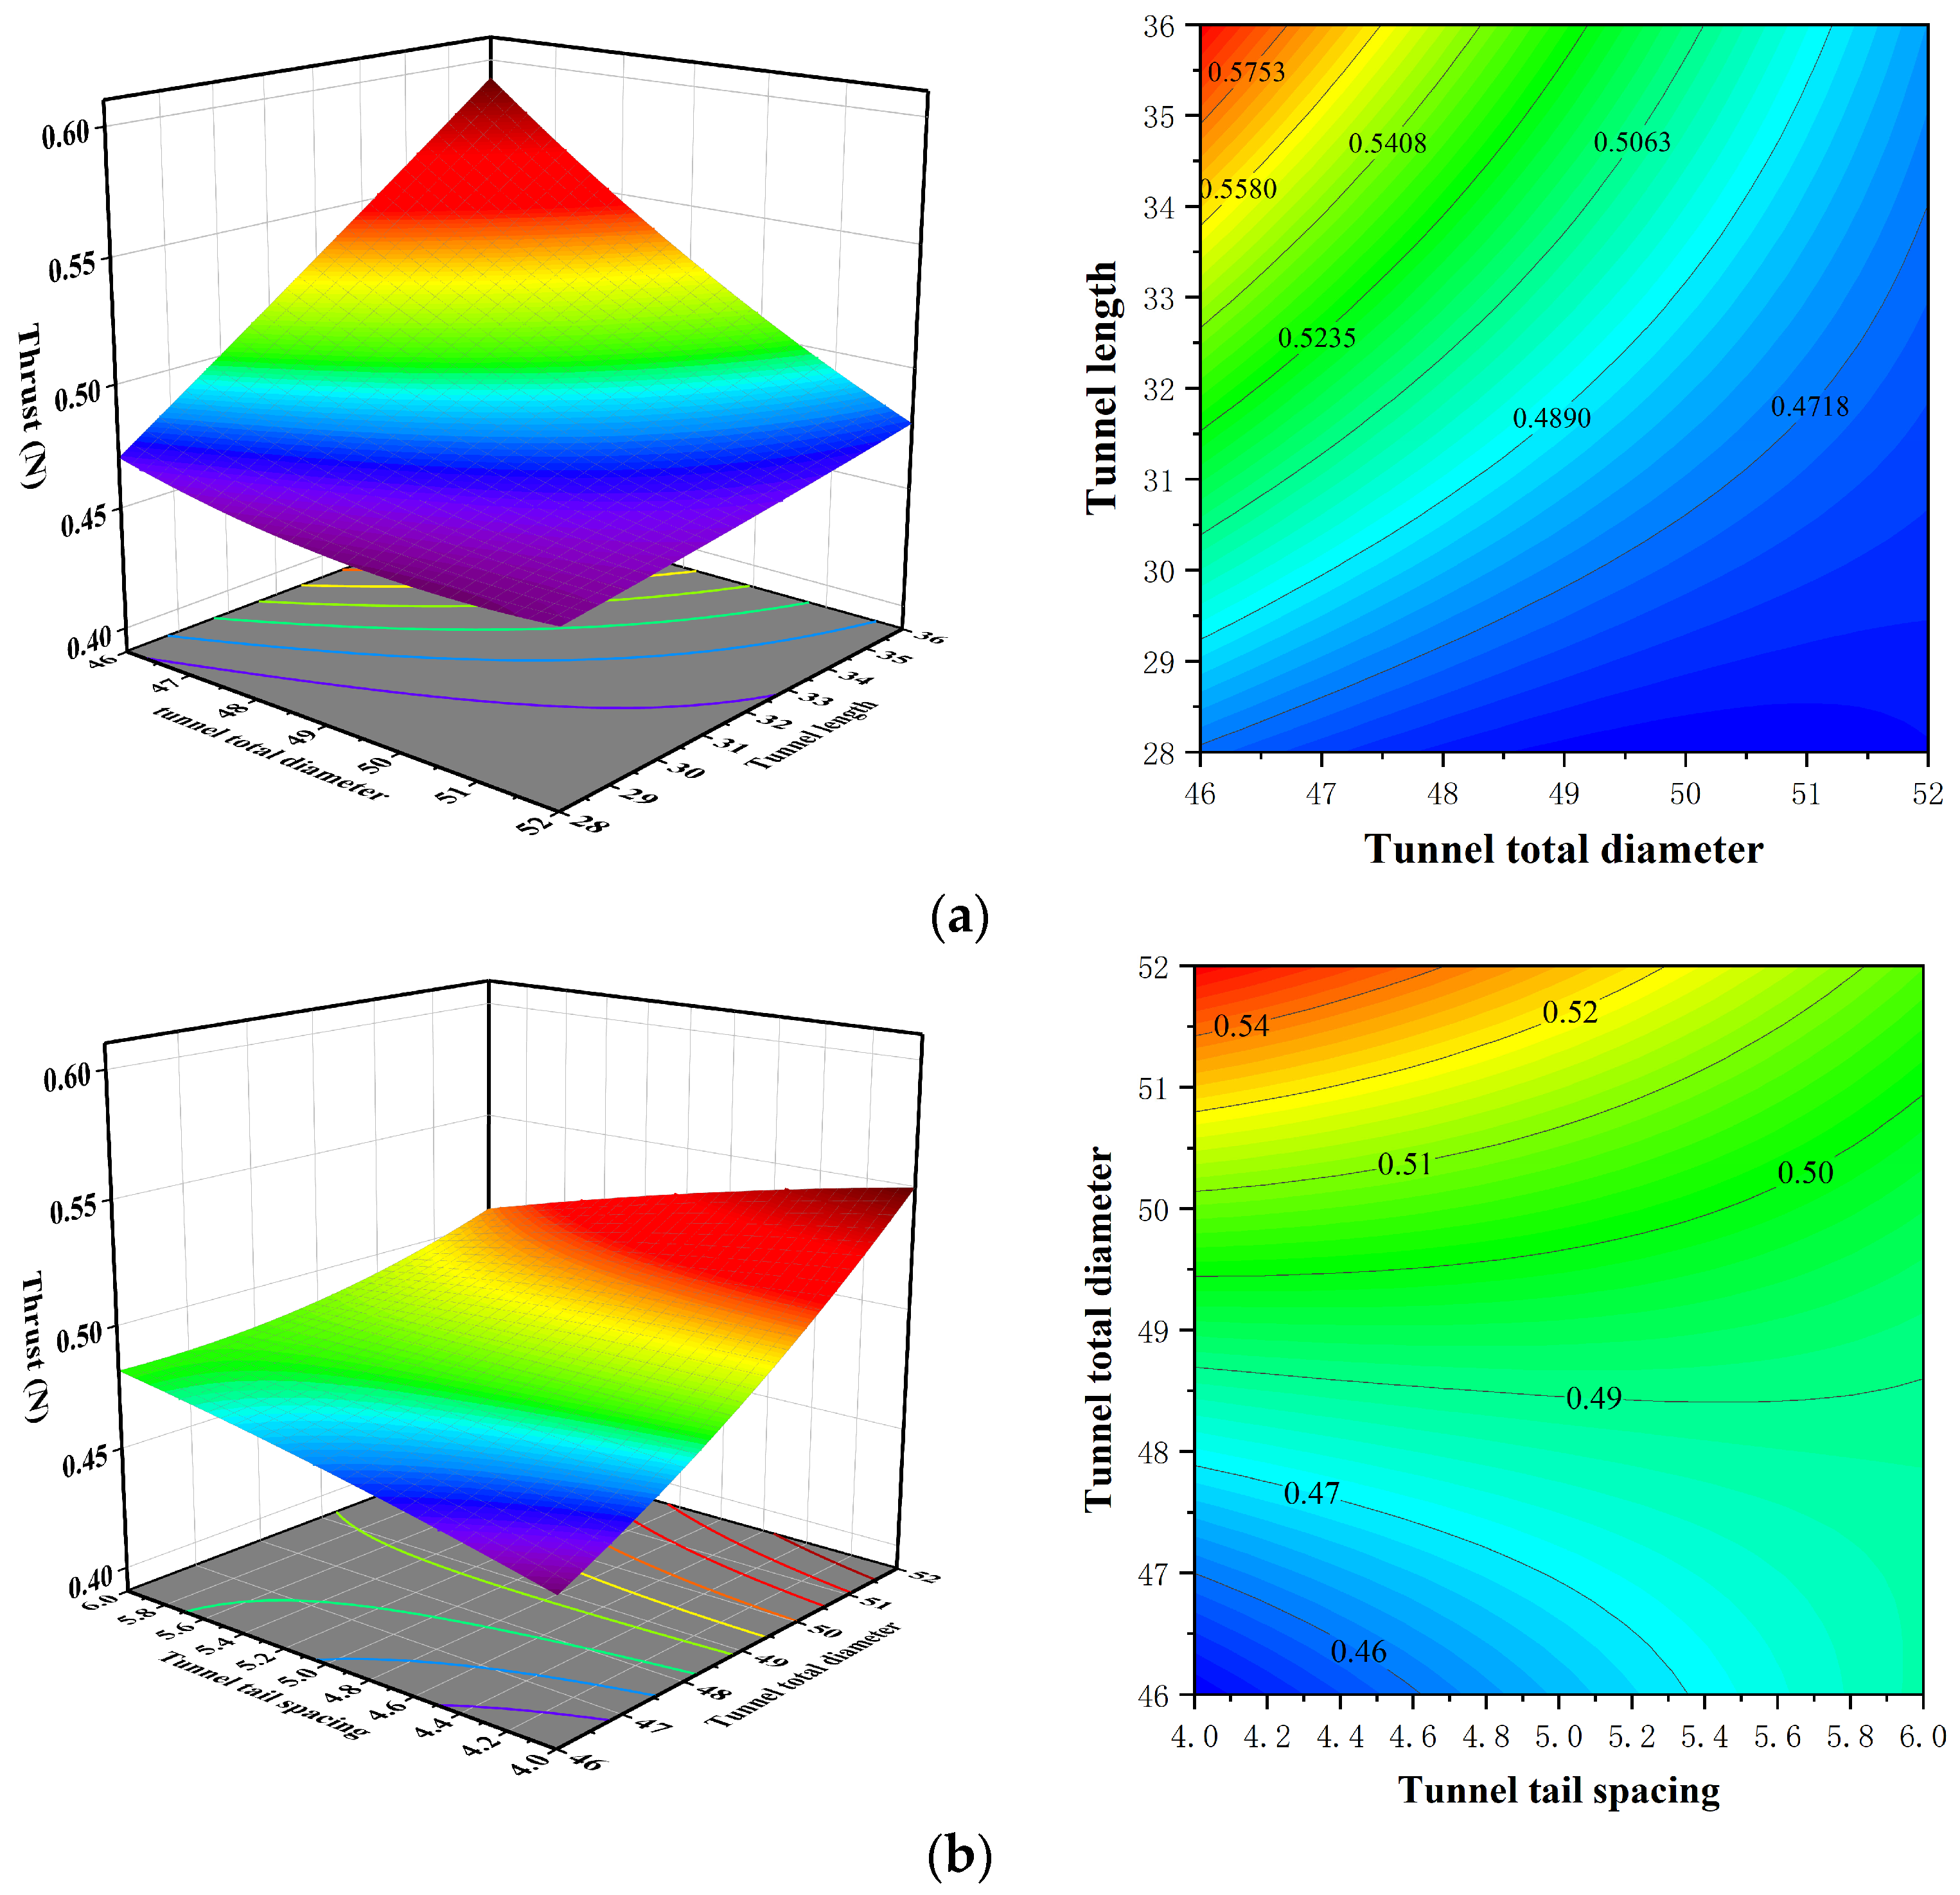
Table 7 presents the results of the variance analysis based on the fitted simulation data, where the significance of the model terms is determined by the p-value or Prob > F value associated with the variance. A p-value less than 0.0001 or a Prob > F value less than 0.05 indicates that the model term is significant. The variables  X 1 , X 2 , X 3  and  X 1 X 3 , X 3 X 4  are significant model terms. According to the significance of each parameter, the order of influence of each structural parameter on the thrust is as follows: tunnel total diameter > tunnel length > tunnel lip curve > tunnel tail spacing.
As shown in Table 4, the correlation coefficient  R 2  of the regression model is 0.9628, indicating that the observed values and the fitted values of the target variable are strongly correlated. The prediction coefficient  R 2  is 0.7965, and the adjusted coefficient  R 2  is 0.9255. The difference between the two indices is less than 0.2, indicating that the change in the response value is 92.55% from the tunnel length  X 1 , tunnel lip curve  X 2 , tunnel total diameter  X 3 , and tunnel tail spacing  X 4 . The coefficient of variation (CV) is 2.05% < 10%, indicating that the model has good repeatability and little variation. The “Adeq precision” is 21.31 > 4, indicating that the model has strong anti-interference ability and could be used to predict the maximum value in subsequent models [32].
The response surface plots and contour plots of the pairwise interactions of each design variable are plotted in Figure 10. Among the six combination factors, the combination of tunnel length and the tunnel total diameter, the combination of tunnel total diameter, and tunnel tail spacing influence the thrust significantly, whereas the influences of other combinations are little. The thrust can be improved significantly by increasing the Y-coordinate value of the tunnel lip curve, increasing the diameter of the tunnel total diameter, and reducing the tunnel length appropriately. By searching for the optimal value of the fitting function, the final optimization values are obtained as follows: the tunnel length  X 1  is 27.701, the tunnel lip curve  X 2  is 17.186, the tunnel total diameter  X 3  is 51.989, and the tunnel tail spacing  X 4  is 4.613. As a result, the optimal predicted value of the response value (mooring static thrust) is 0.631 N.

4.4. Optimized Simulation Results

To verify the effectiveness of the response surface method, the optimized simulation results are compared with the ones before optimization. Based on the optimal parameters recommended by the response surface optimization method, the model is modified and simulated. The comparison of the thruster models before and after optimization is shown in Figure 11.
The simulation settings are the same as Section 3.2. The simulated thrust and the hydrodynamic characteristics of the optimized NPT thruster with the rotational speed are shown in Figure 12. The optimized thrust is 0.594 N at 5000 rpm. The error between the optimized value and the optimal predicted value of the RSM is 5.73%, which proves that the RSM fitted equations can accurately reflect the effect of multiparameter collaborative optimization for the thrust. After optimization, the maximum thrust simulation value is 1.02 N at 6500 rpm. The maximum increase in the thrust simulation value before and after optimization is 30.7% at 6500 rpm, and the average increase is 17.8%. This indicates that RSM optimization has an obvious effect on the NPT thruster.
As shown in Figure 13, in the speed range from 3000 rpm to 6500 rpm, the thrust coefficient  K T  performance after optimization is significantly better than that before optimization, and the maximum value is 0.621 at 3000 rpm. The torque coefficient  K Q  is similar to that before optimization. Owing to the remarkable performance of the thrust coefficient  K T  after optimization, the thruster efficiency  η  is higher than that before optimization. The maximum efficiency  η  improvement is approximately 34.9% at 5500 rpm. The average improvement rate after optimization is 25%.

5. Propulsion Performance Improvement Mechanism Analysis

5.1. Pressure Analysis

To analyze the optimization of the NPT thruster with multiparameter collaborative optimization, a surface pressure distribution diagram of the thruster outlet tunnel is drawn. As shown in Figure 14, the low-pressure regions near the suction surface of the propeller blade increase, and the fluid pressure distribution is improved after optimization. It increases the difference in pressures on each side of the propeller, which furthermore increases the thrust.
A comparison diagram of the fluid pressure distribution in the thruster tunnel in the XOY cross-section is drawn, as shown in Figure 15. An additional low fluid pressure area is observed at the tunnel lip after optimization, which means that the thruster can gain more thrust.
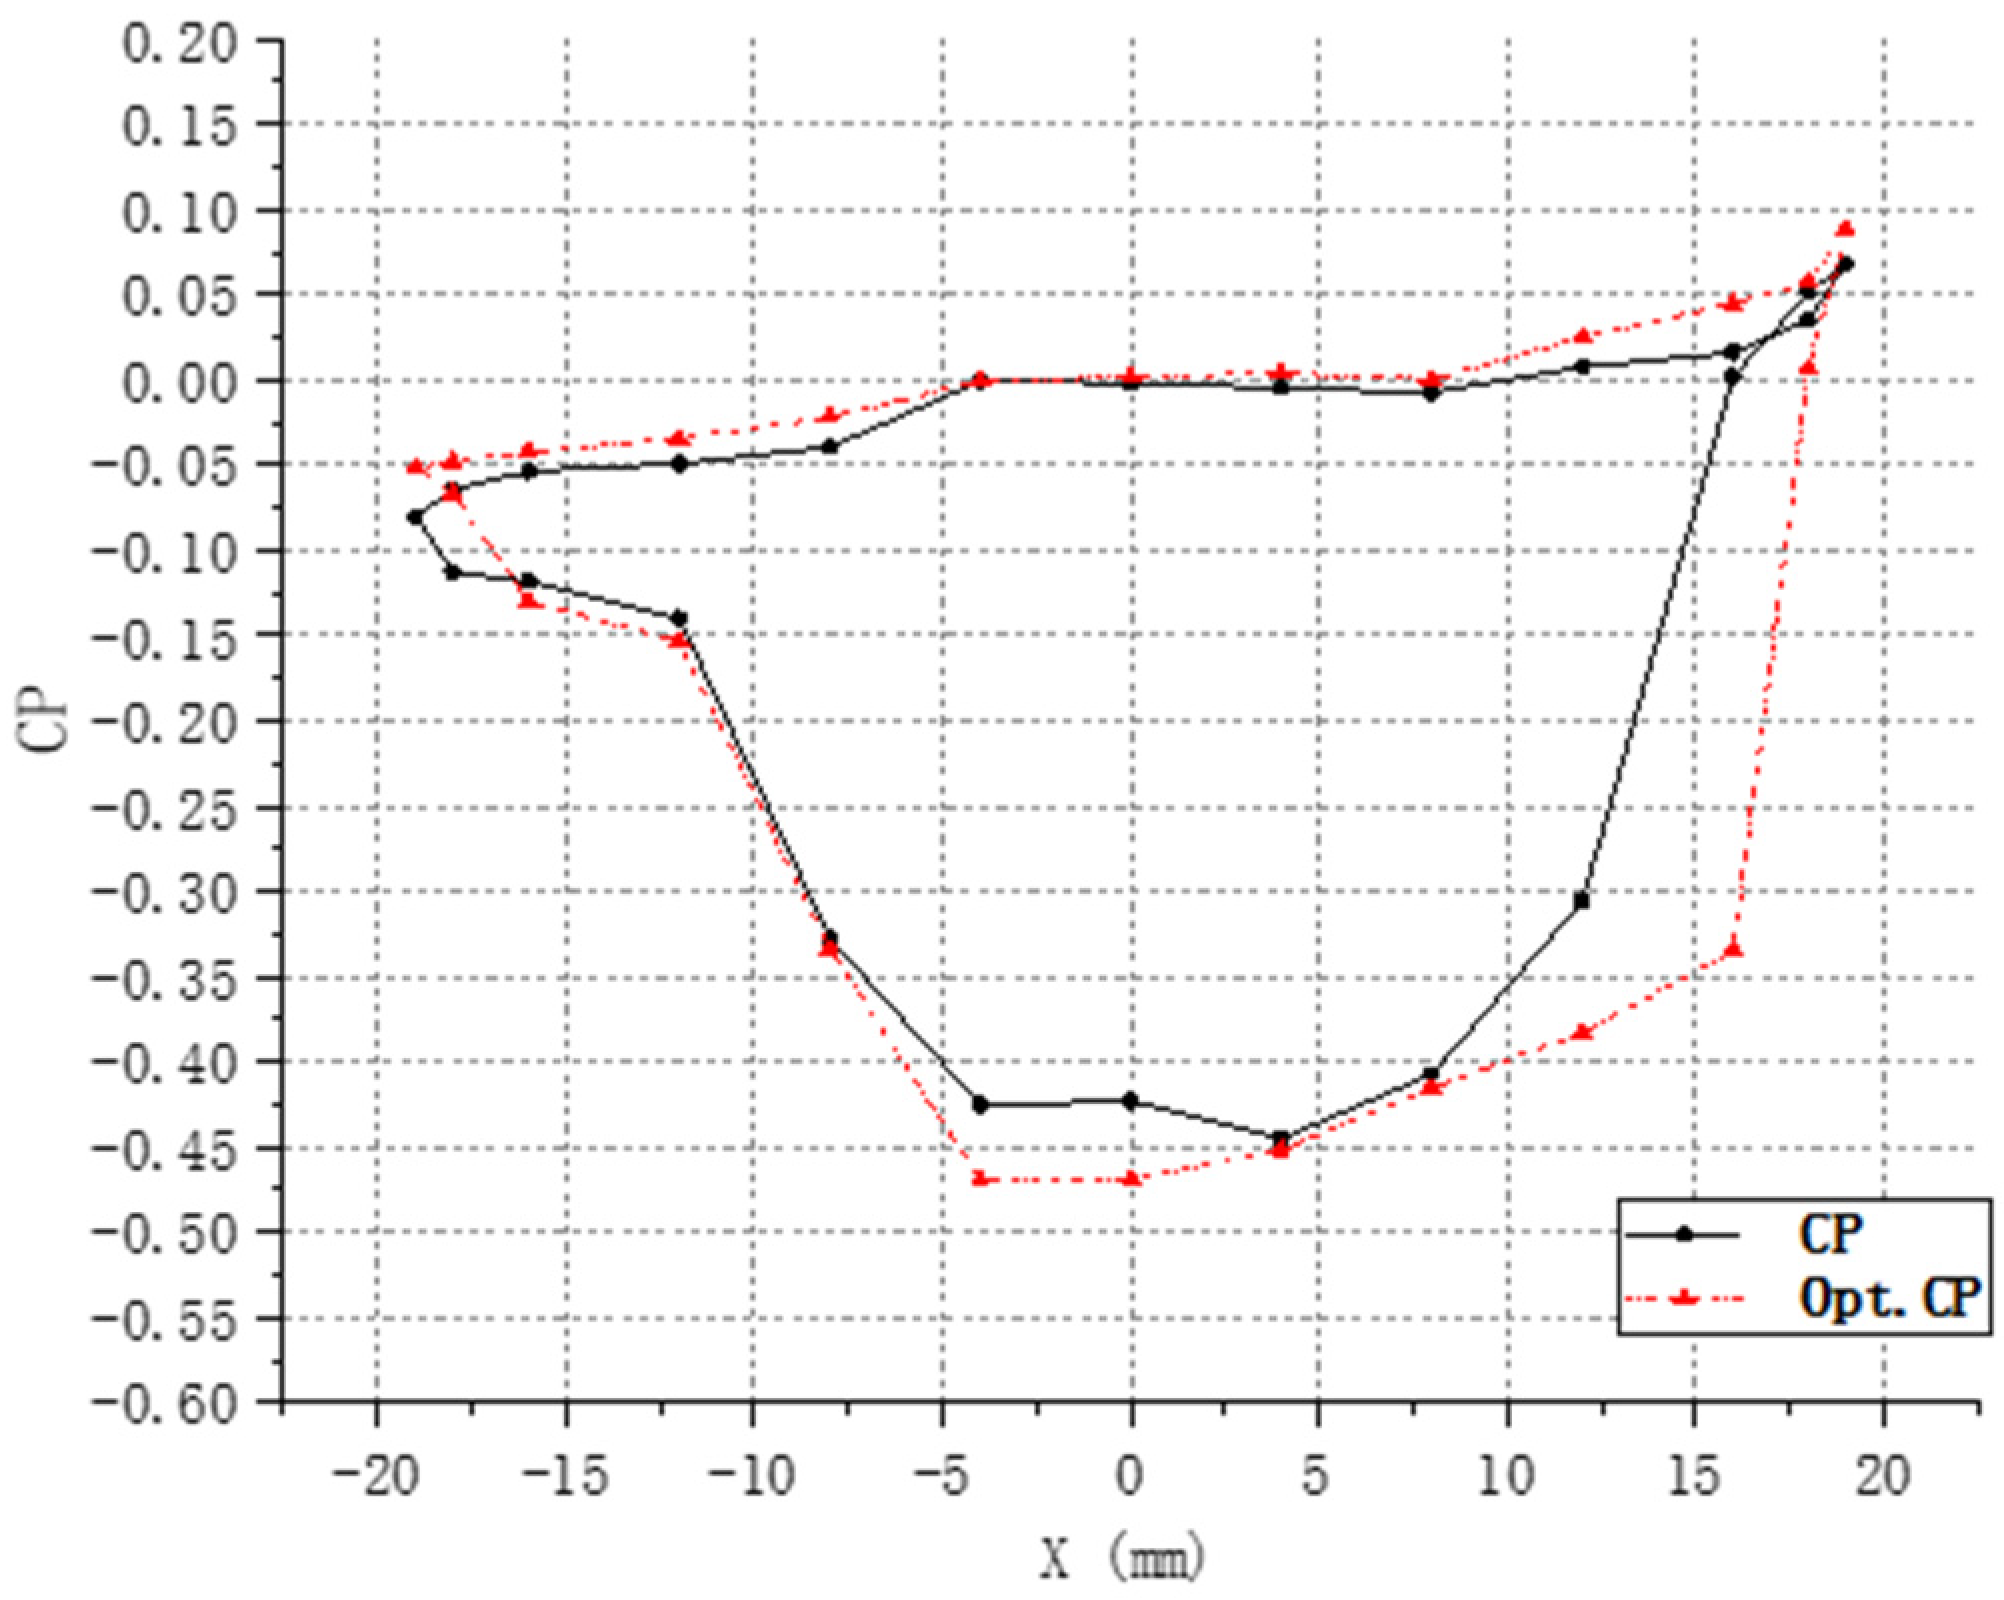
On the basis of the CP sample origin in Figure 14, to sample the wall pressure of the tunnel. The pressure coefficient  C P  [33] can be defined as follows:
C P = P P 1 2 ρ n 2 d 2
P  represents the pressure of the free flow field at infinity. The distribution curve of the pressure coefficient is plotted to observe the optimization of the pressure. As shown in Figure 16, the optimized curve completely covers the preoptimized curve, which indicates that the pressure difference is improved after optimization.
In order to observe the fluid pressure distribution at the tunnel lip, intercept the XOZ plane at the entrance of the inlet tunnel, as shown in Figure 14. The value of the low-pressure region at the tunnel lip decreases, and the low-pressure region is more evenly distributed, as shown in Figure 17. This shows that the optimization of the tunnel lip curve significantly improves the low-pressure region at that area.

5.2. Flow Field Analysis

The LIC (line integral convolution) map of the wake flow at the YOZ cross-section in the speed range of 3000 rpm to 6500 rpm is plotted [34]. The wake fields are compared to analyze the mechanism of the NPT thruster optimization. As shown in Figure 18, the flow fields of the thruster before optimization exhibit a fan-shaped diffusion on both sides of the jet at the low speed of 3000–5000 rpm and exhibit the irregular diffusion at the speed higher than 5500 rpm. The flow fields of the thruster after optimization exhibit an orderly band-like shape at the speed of 4000–6500 rpm and exhibit secondary branches at the low speed of 3000–4000 rpm. It results in the attenuation of the effective flow field length and the expansion of the flow field range. This indicates that the energy loss in the wake is reduced and the thrust transmission efficiency is improved after optimization.

6. Experiment

6.1. Experimental System Introduction

An experimental platform is established to verify the validity of the research methods and the simulations. The experimental platform uses an NPT thruster installed in the underwater vehicle, the parameters of which are shown in Table 8.
The experimental platform uses a sealing hose to transfer power and signal. The experimental platform is directly placed above the force sensor, which is fixed on the working table, as shown in Figure 19. It makes the thrust direction vertically downward. In the experiment, an ATI six-component force sensor (Qin He Yuan Technologies, Shenzhen, China) was used with a maximum sensing range of 200 N. The natural frequency of the sensor is 5000 Hz, the maximum sampling accuracy is 1%FS, and the nonlinear error is less than 0.2%.
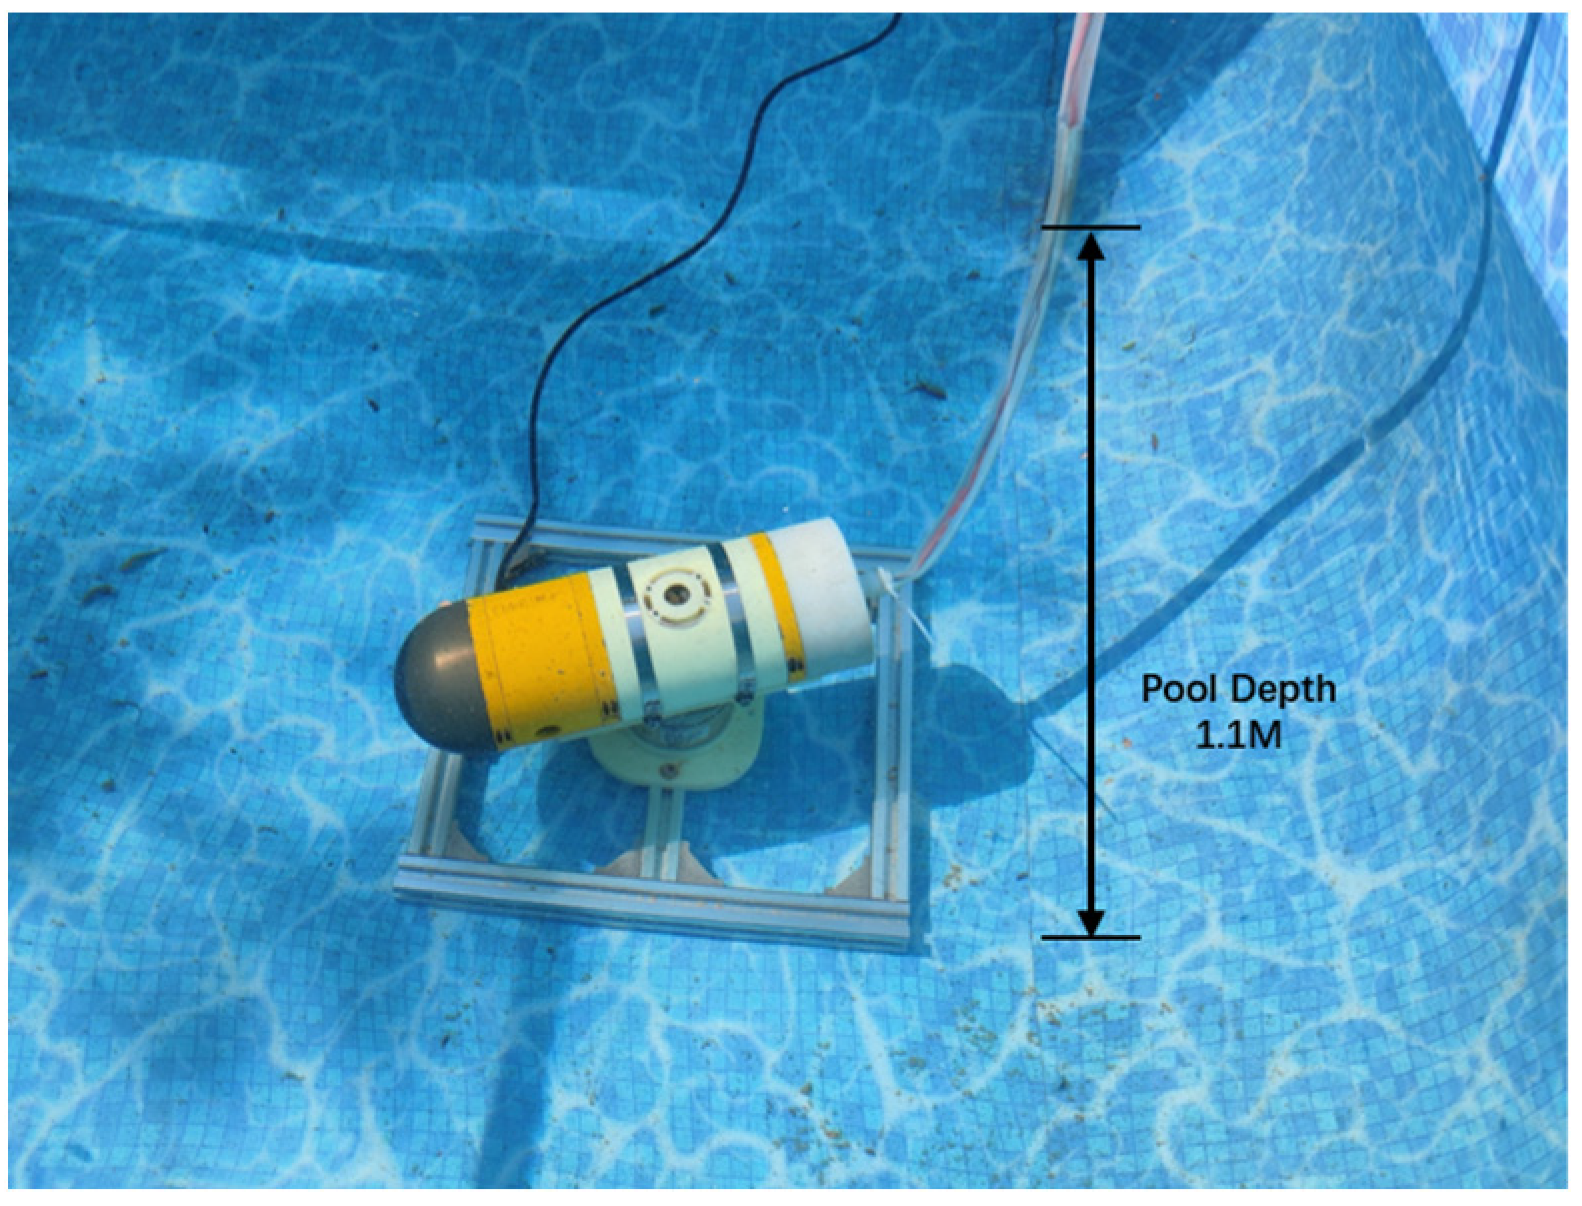
Before the experiment begins, the buoyancy of the experimental platform is balanced by adjusting the weight load inside the underwater vehicle. Then the mooring static thrust experiments are taken in the open water, and the water depth is 1.1 m, as shown in Figure 20.
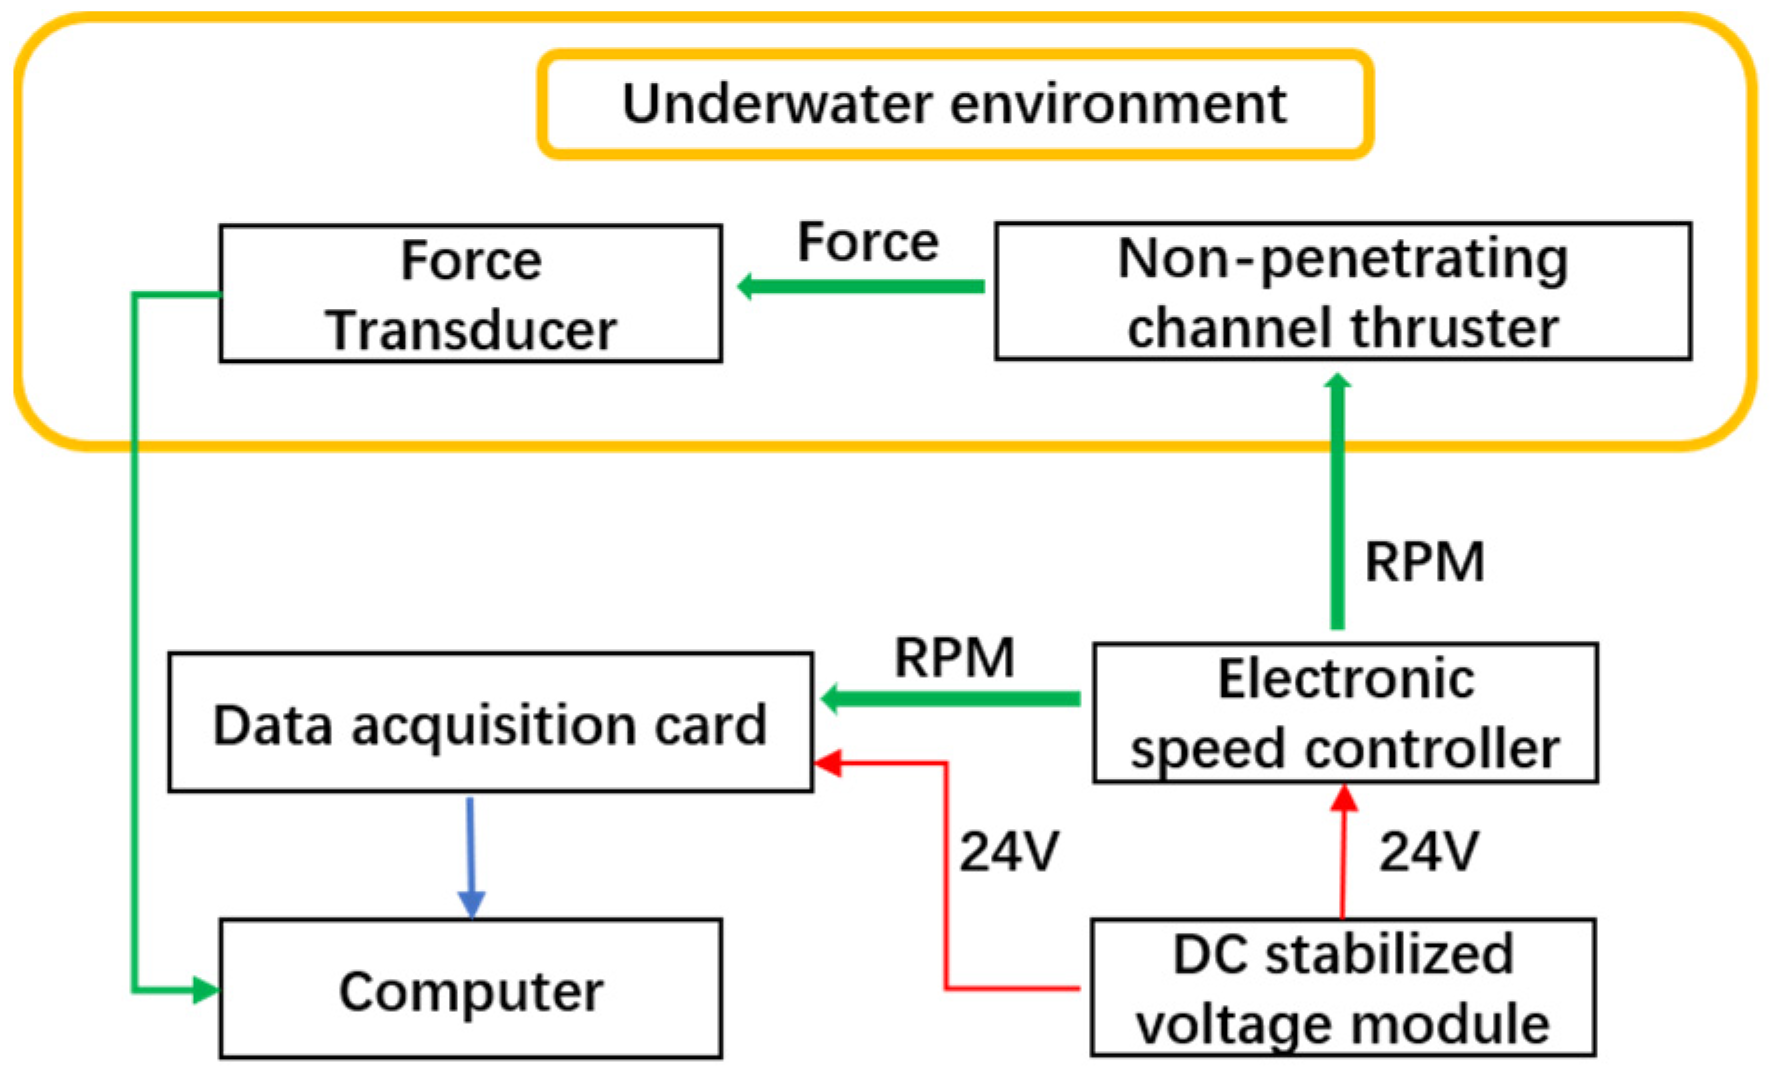
The propeller speed data of the NPT thruster is collected with a data acquisition card, which can obtain the phase switching frequency of the electronic speed controller. The motor speed is calculated by using the relationship between the number of motor poles and the frequency. The data acquisition card uses the CAN bus to communicate with the computer, which can monitor the real-time speed and adjust the motor speed so that the speed can be stable. Power is provided by a regulated DC power supply with adjustable voltage. The thrust is sampled with the force sensor in real time. The principle of the thrust test is shown in Figure 21.
The speed of the thruster is gradually increased from 3000 rpm to 6500 rpm, with the step of 500 rpm. And every speed step lasts for about 20–40 s. After every experiment, the motor stops for 60 s to cool down the temperature.

6.2. Experimental Results

6.2.1. Thrust Analysis

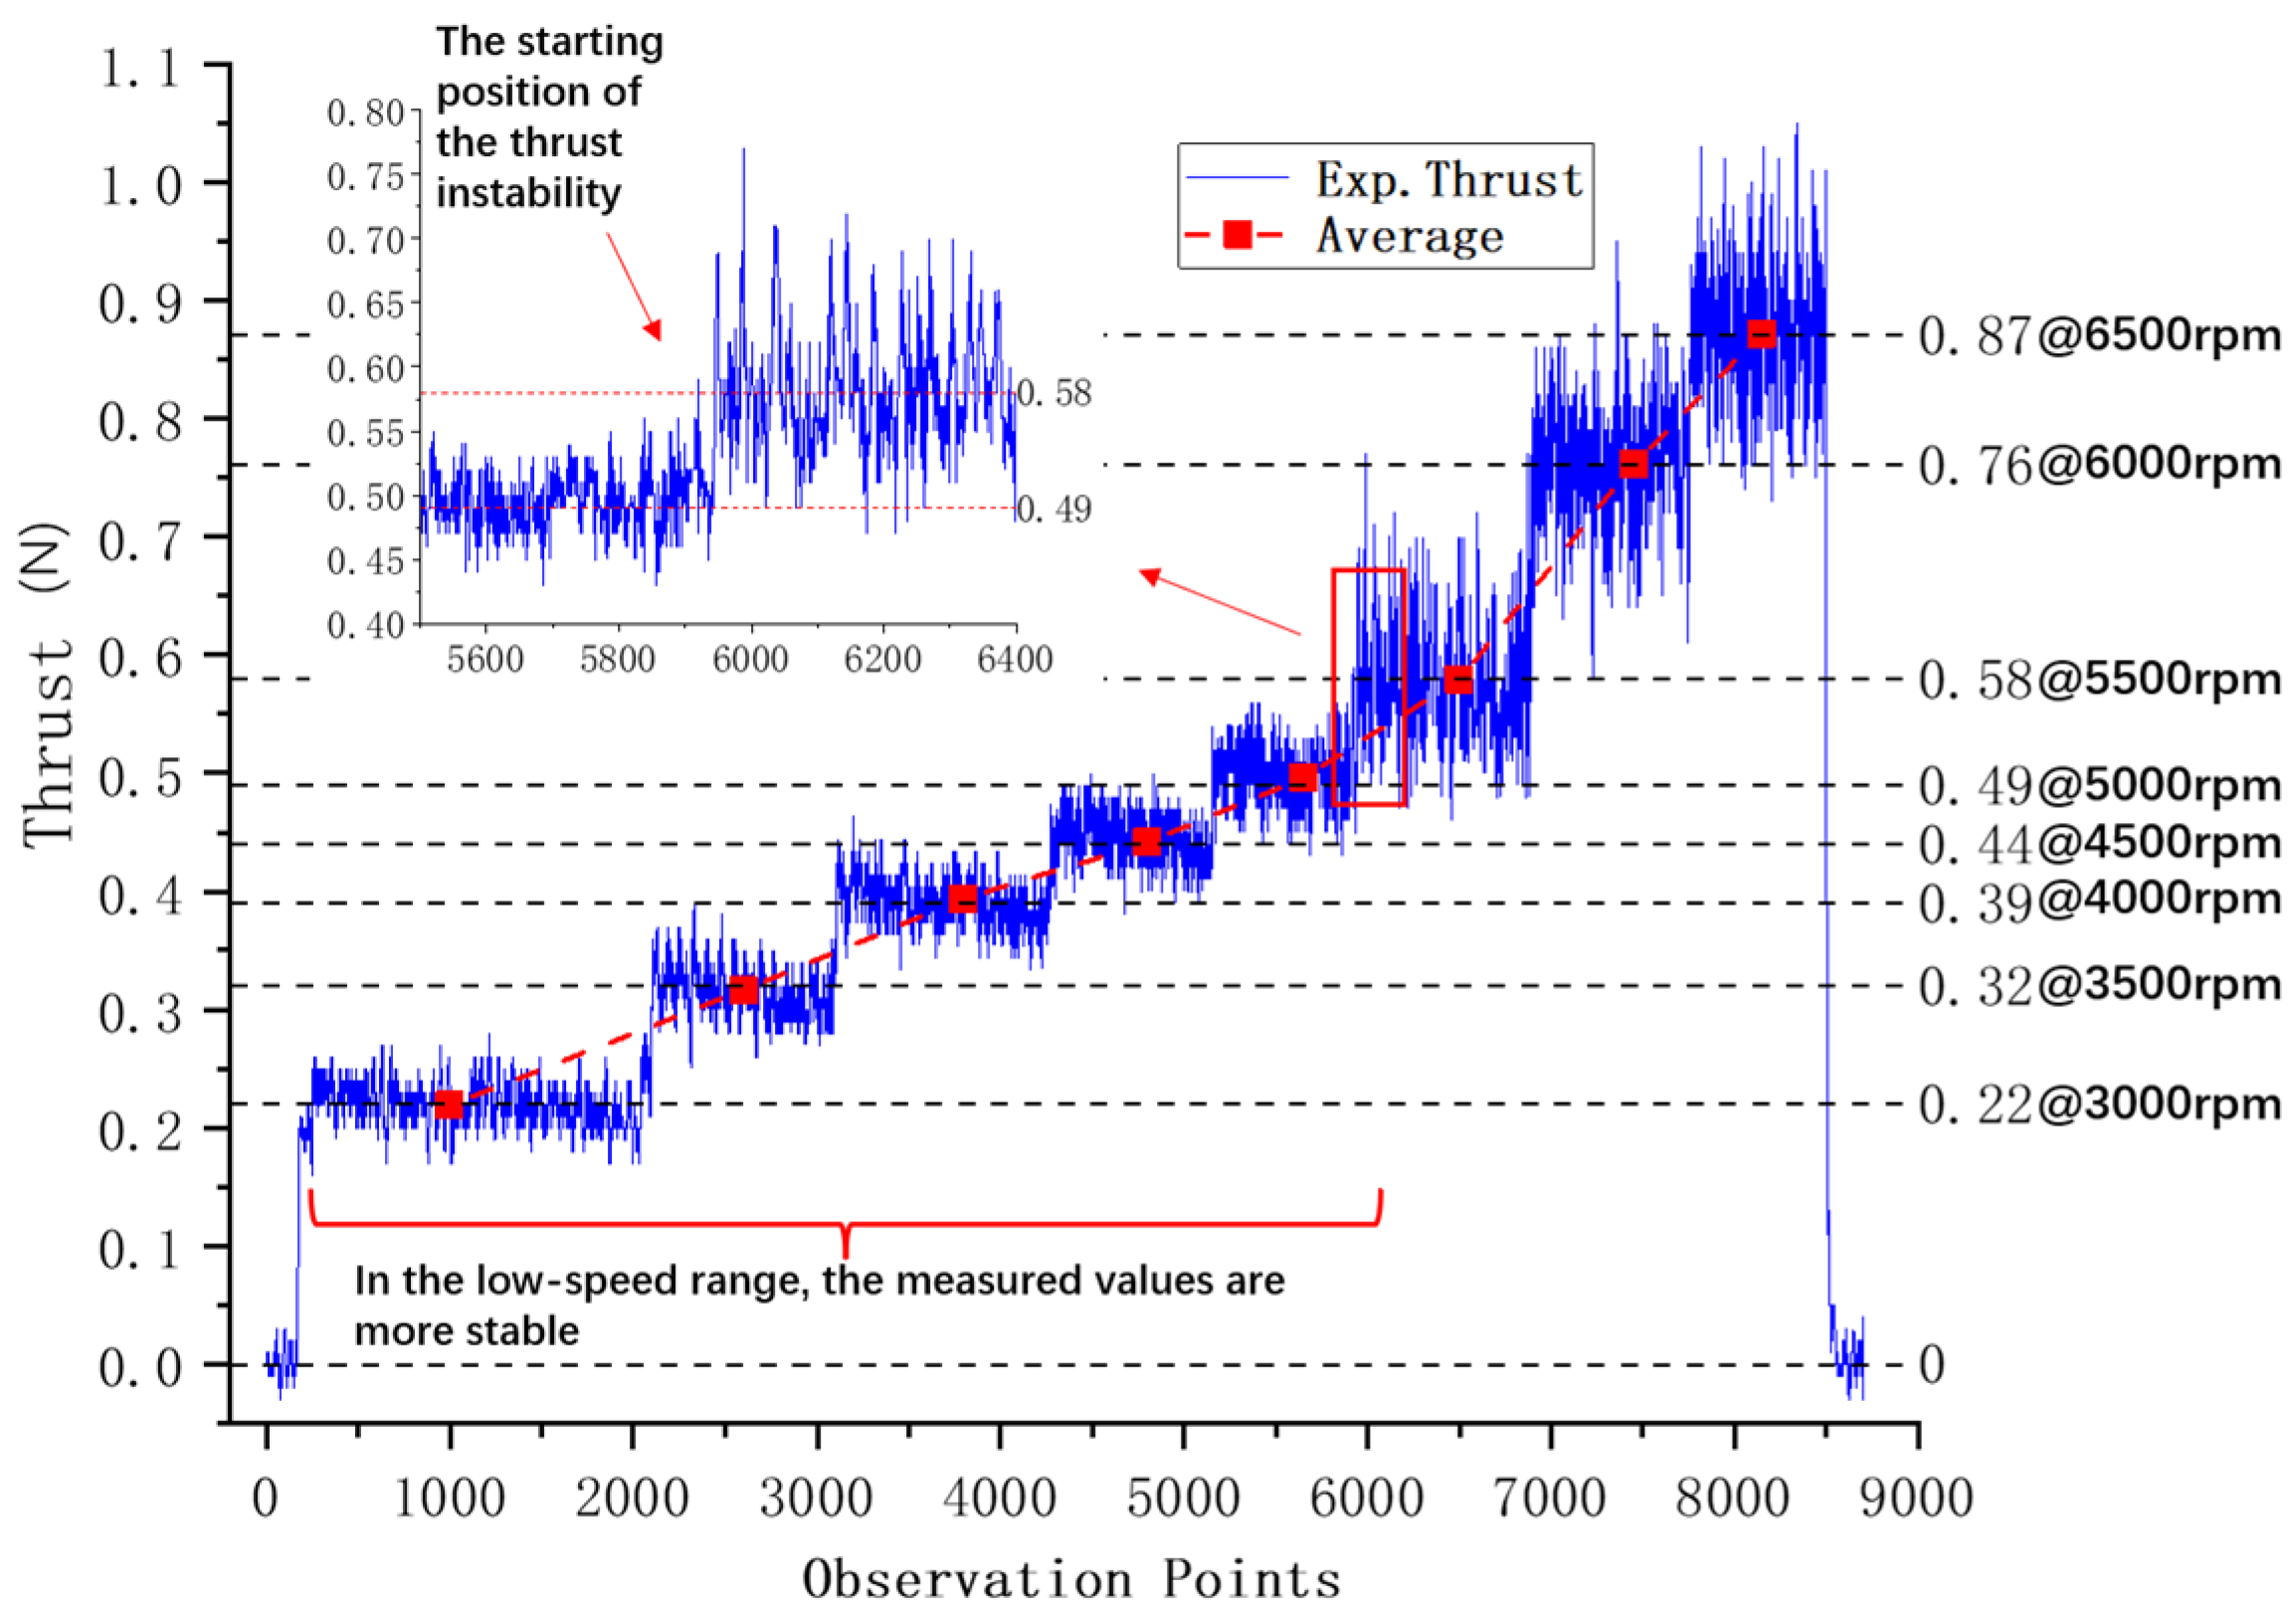
Figure 22 and Figure 23 show the mooring static thrust of the NPT thruster. As the rotational speed of the thruster increases in steps, the thrust also shows a step-up trend. When the speed is 0, the sensor data slightly drift. The measured values before optimization are stable in speed from 3000 rpm to 5000 rpm and significantly oscillate in high speed range from 5500 rpm to 6500 rpm. By comparison, the optimized NPT thruster is more stable. Especially, the thrust of the speed from 4000 rpm to 6500 rpm is significantly improved.
The experimental values of the thruster are summarized in Figure 24a. The experimental value after optimization increases the most at 5500 rpm, which is 21.79%. The average increase in the experimental values is 12.4%. According to Figure 24b, by comparing the mean square error of the thrust in the speed range of 5500 rpm–6500 rpm, the maximum mean square error before optimization is 0.0567 at 6500 rpm, while the maximum mean square error after optimization is 0.0269 at 6500 rpm, which is 52.59% lower than that before optimization. The minimum mean square error deviation before and after optimization is at 6000 rpm, where the mean square error is reduced by 49.19% after optimization. The results show that the oscillation of the thrust after optimization is significantly less than that before optimization, which means the optimized thruster works more stable at the high-speed range.

6.2.2. Simulation Effectiveness Analysis

As shown in Figure 25a, the simulated value is close to the experimental value. As shown in Figure 25b, before optimization, the maximum error of the simulation and experiment is 8.26% at the 6500 rpm, and the minimum error is 0.82% at the 3500 rpm. The average absolute error before optimization is 5.01%. After optimization, the error fluctuates around 0%. The maximum error is 4.73% at the 6500 rpm, and the minimum error is 0.81% at 4000 rpm. The average absolute error after optimization is 3.19%.
The maximum error before and after optimization is less than 10%. This shows that the numerical calculation method used in this paper is relevantly accurate, and the study process is reasonable and feasible.

7. Conclusions

A brand new non-penetrating tunnel thruster is proposed in this paper, and the tunnel structural parameters of the thruster are optimized via the RSM method. The main conclusions are as follows:
(1)
A brand-new NPT thruster is designed based on shaftless hub propulsion technology. The main characteristic of the NPT thruster is that the inlet and outlet tunnels are located on the same side. This approach can improve the space utilization of the underwater vehicle while achieving the same thrust effect as the traditional tunnel thruster.
(2)
The structures of the NPT thruster are optimized with the response surface method. The relationship models between tunnel structure parameters and thrust are established on the basis of the RSM model, and the contribution of tunnel structure parameters is evaluated. Then the optimal value of the model function is found, and the results of the optimization variables are obtained. The order of the influence of the tunnel structural parameters on efficiency is the tunnel total diameter, the tunnel length, the tunnel lip curve, and the tunnel tail spacing.
(3)
The optimized NPT thruster shows a maximum thrust enhancement of 21.79% at the 5500 rpm. The average increase in thrust is 12.4% in the speed range, which proves the feasibility of the tunnel structural optimization. In the speed range of 5500 rpm–6500 rpm, the mean square deviation of the optimized thruster is reduced by at least 49.19% compared with the value before optimization. It proves that the optimized thruster is more stable at high speed.
(4)
The errors between the experimental and simulation values of the mooring static thrust are less than 8.26%. The average simulation error before optimization is 4.99%, and the average simulation error after optimization is 6.17%. It proves that the CFD simulation and analysis of the NPT thruster are reliable and reasonable.
There are still more works to do to study this new type of thrusters:
(1)
The comparison between the NPT thrusters and the traditional tunnel thrusters should be conducted with the methods of simulations or experiments in order to analyze the differences in their performances and find more advantages or disadvantages of the NPT thrusters compared with the traditional thrusters.
(2)
The performances under different operating conditions should be analyzed, such as examining the flow field distribution and hydrodynamic performance of NPT when it is close to a wall.
(3)
The impact of the NPT thrusters on the underwater vehicles should be analyzed, like its influence on the navigational resistance of the vehicles, and further compared with the impact of the traditional tunnel thrusters.
In summary, this paper has introduced a novel propulsion method for underwater vehicles, and we believe that future research on the NPT thrusters will yield more valuable discoveries.

Author Contributions

Conceptualization, J.G. and Y.Y.; methodology, J.G.; software, J.G.; validation, J.G., Y.Y. and Q.Z.; formal analysis, J.G.; investigation, J.G.; resources, Y.Y.; data curation, J.G.; writing—original draft preparation, J.G.; writing—review and editing, Y.Y., C.W., Z.H. and C.F.; visualization, J.G.; supervision, C.W.; project administration, Y.Y.; funding acquisition, Y.Y. All authors have read and agreed to the published version of the manuscript.

Funding

This study was funded by the Strategic Priority Research Program of the Chinese Academy of Sciences (XDC03060201).

Institutional Review Board Statement

Not applicable.

Informed Consent Statement

Not applicable.

Data Availability Statement

The original contributions presented in the study are included in the article, further inquiries can be directed to the corresponding author.

Conflicts of Interest

The authors declare no conflicts of interest.

References

  1. Liu, C.; Hong, B.; Teng, Y.; Li, T. Study on mathematical model for simulating ship berthing or unberthing with lateral thruster in harbor. J. Dalian Marit. Univ. 2007, 33, 29–32. [Google Scholar]
  2. Yao, Z.; Yan, Z. Hydrodynamic performance analysis and verification of transverse thrusters. J. Ship Mech. 2012, 16, 236–245. [Google Scholar]
  3. Pehrsson, L.; Mende, R.G. Design, model testing and application of controllable pitch bow thrusters. J. Am. Soc. Nav. Eng. 1961, 73, 787–796. [Google Scholar] [CrossRef]
  4. Sharma, R. Computer-aided Design of Bow Thrusters for Marine Vehicles. Tech. J. Mar. Eng. 2006, 86, 33–41. [Google Scholar]
  5. Carlton, J. Marine Propellers and Propulsion; Butterworth-Heinemann: Oxford, UK, 2018. [Google Scholar]
  6. Xiao, Z.; He, W.; Huang, W.; Li, Z. Progress and Prospect of Hydrodynamic Performance for Tunnel Thruster. J. Propuls. Technol. 2022, 43, 210102. [Google Scholar]
  7. Taniguchi, K. Investigations into Fundamental Characteristics and Operating Performances of Side Thruster; Mitsubishi Technical Bulletin No. 35; Mitsubishi Heavy Industries Ltd.: Tokyo, Japan, 1966. [Google Scholar]
  8. Chislett, M.; Bjorheden, O. Influence of Ship Speed on the Effectiveness of a Lateral-Thrust Unit; Hydrodynamics Section, Lyngby, Denmark, Report No. Hy-8; Hydro-and Aerodynamics Laboratory: Lyngby, Denmark, 1966. [Google Scholar]
  9. Norrby, R. The effectiveness of a bow thruster at low and medium ship speeds. Int. Shipbuild. Prog. 1967, 14, 315–318. [Google Scholar] [CrossRef]
  10. Ridley, D.E. Effect of Tunnel Entrance Configuration on Thruster Performance. Mar. Technol. SNAME News 1969, 6, 60–65. [Google Scholar] [CrossRef]
  11. Ridley, D.E. Observations on the effect of vessel speed on bow thruster performance. Mar. Technol. SNAME News 1971, 8, 93–96. [Google Scholar] [CrossRef]
  12. Furukawa, Y.; Kijima, K. Influence of Forward Speed on the Thruster Performance Used on Dynamic Positioning System of Offshore Platform. 1993. Available online: https://trid.trb.org/View/443901 (accessed on 19 May 2024).
  13. Kijima, K.; Furukawa, Y.; Hirakawa, T.; Maekawa, K. Theoretical estimation of influence of forward speed on the performance of bow thruster; Bow thruster seino ni oyobosu zenshin sokudo eikyo no rironteki suitei. Seibu Zosenkai Kaiho Trans. West-Jpn. Soc. Nav. Archit. 1998, 69–79. [Google Scholar] [CrossRef]
  14. Lu, P.; Wang, S. CFD Simulation of Propeller and Tunnel Thruster Performance. In Proceedings of the 33rd ASME International Conference on Ocean, Offshore and Arctic Engineering, San Francisco, CA, USA, 8–13 June 2014. [Google Scholar]
  15. Yu, C.; Yang, C. Study of tunnel thruster performance and flow by quasi-steady Reynolds-averaged Navier-Stokes simulation. J. Shanghai Jiaotong Univ. Sci. 2016, 21, 662–671. [Google Scholar] [CrossRef]
  16. Kinnas, S.A.; Chang, S.-H.; He, L.; Johannessen, J.T. Performance prediction of a cavitating RIM driven tunnel thruster. In Proceedings of the First International Symposium on Marine Propulsors SMP, Trondheim, Norway, 22–24 June 2009; pp. 435–442. [Google Scholar]
  17. Terry, S. A Study of the Hydrodynamic Interactions Between Bow Thrusters. Catal. Sci. Technol. 2015, 6, 677–680. [Google Scholar]
  18. Beveridge, J.L. Design and Performance of Bow Thrusters. Mar. Technol. SNAME News 1972, 9, 439–453. [Google Scholar] [CrossRef]
  19. Mohan, A. Numerical Analysis of Bow Tunnel Thruster Performance. 2017. Available online: https://www.semanticscholar.org/paper/Numerical-Analysis-of-Bow-Tunnel-Thruster-Mohan/0980a7d12f899d36b64f3979ac6693823c4fe5c0 (accessed on 19 May 2024).
  20. Feng, Y.; Chen, Z.; Dai, Y.; Zhang, Z.; Wang, P. An experimental and numerical investigation on hydrodynamic characteristics of the bow thruster. Ocean Eng. 2020, 209, 107348. [Google Scholar]
  21. Baniela, S.I. The Performance of a Tunnel Bow Thruster with Slow Speed Ahead: A Revisited Issue. J. Navig. 2009, 62, 631–642. [Google Scholar] [CrossRef]
  22. Wei, Q.; Yang, Y.; Zhou, X.; Hu, Z.; Li, Y.; Fan, C.; Zheng, Q.; Wang, Z. Enhancing Inter-AUV Perception: Adaptive 6-DOF Pose Estimation with Synthetic Images for AUV Swarm Sensing. Drones 2024, 8, 486. [Google Scholar] [CrossRef]
  23. Jiang, H.; Ouyang, W.; Sheng, C.; Lan, J.; Bucknall, R. Numerical investigation on hydrodynamic performance of a novel shaftless rim-driven counter-rotating thruster considering gap fluid. Appl. Ocean Res. 2022, 118, 102967. [Google Scholar] [CrossRef]
  24. Felicjancik, J.; Kowalczyk, S.; Felicjancik, K.; Kawecki, K. Numerical simulations of hydrodynamic open-water characteristics of a ship propeller. Pol. Marit. Res. 2016, 23, 16–22. [Google Scholar] [CrossRef]
  25. Tu, T.N. Numerical simulation of propeller open water characteristics using RANSE method. Alex. Eng. J. 2019, 58, 531–537. [Google Scholar] [CrossRef]
  26. Piskur, P.; Szymak, P.; Przybylski, M.; Naus, K.; Jaskólski, K.; Żokowski, M. Innovative energy-saving propulsion system for low-speed biomimetic underwater vehicles. Energies 2021, 14, 8418. [Google Scholar] [CrossRef]
  27. Gough, W.T.; Smith, H.J.; Savoca, M.S.; Czapanskiy, M.F.; Fish, F.E.; Potvin, J.; Bierlich, K.; Cade, D.E.; Di Clemente, J.; Kennedy, J. Scaling of oscillatory kinematics and Froude efficiency in baleen whales. J. Exp. Biol. 2021, 224, jeb237586. [Google Scholar] [CrossRef]
  28. Heller, V. Development of wave devices from initial conception to commercial demonstration. In Comprehensive Renewable Energy; Elsevier: Amsterdam, The Netherlands, 2012. [Google Scholar]
  29. Bian, T.; Liu, L.; Cai, W.; Jiang, W.; Liu, Z. Multi-objective optimization design of shaftless rim-driven thruster. Proc. Inst. Mech. Eng. Part M-J. Eng. Marit. Environ. 2023, 238, 633–639. [Google Scholar] [CrossRef]
  30. Jones, D.R. A taxonomy of global optimization methods based on response surfaces. J. Glob. Optim. 2001, 21, 345–383. [Google Scholar] [CrossRef]
  31. Chelladurai, S.J.S.; Murugan, K.; Ray, A.P.; Upadhyaya, M.; Narasimharaj, V.; Gnanasekaran, S. Optimization of process parameters using response surface methodology: A review. Mater. Today Proc. 2021, 37, 1301–1304. [Google Scholar] [CrossRef]
  32. Nie, Y.; Ouyang, W.; Zhang, Z.; Li, G.; Zheng, R. Multi-Parameter Optimization Analysis of Hydrodynamic Performance for Rim-Driven Thruster. Energies 2023, 16, 891. [Google Scholar] [CrossRef]
  33. Zhao, Y.; Geng, L.; Yang, Y.; Hu, Z. Research on Aerodynamic Characteristics of a Ducted Propeller Hovering near the Water Surface Based on a Lattice Boltzmann Method. J. Mar. Sci. Eng. 2023, 11, 1708. [Google Scholar] [CrossRef]
  34. Cabral, B.; Leedom, L.C. Imaging vector fields using line integral convolution. In Proceedings of the 20th Annual Conference on Computer Graphics and Interactive Techniques, Anaheim, CA, USA, 2–6 August 1993; pp. 263–270. [Google Scholar]
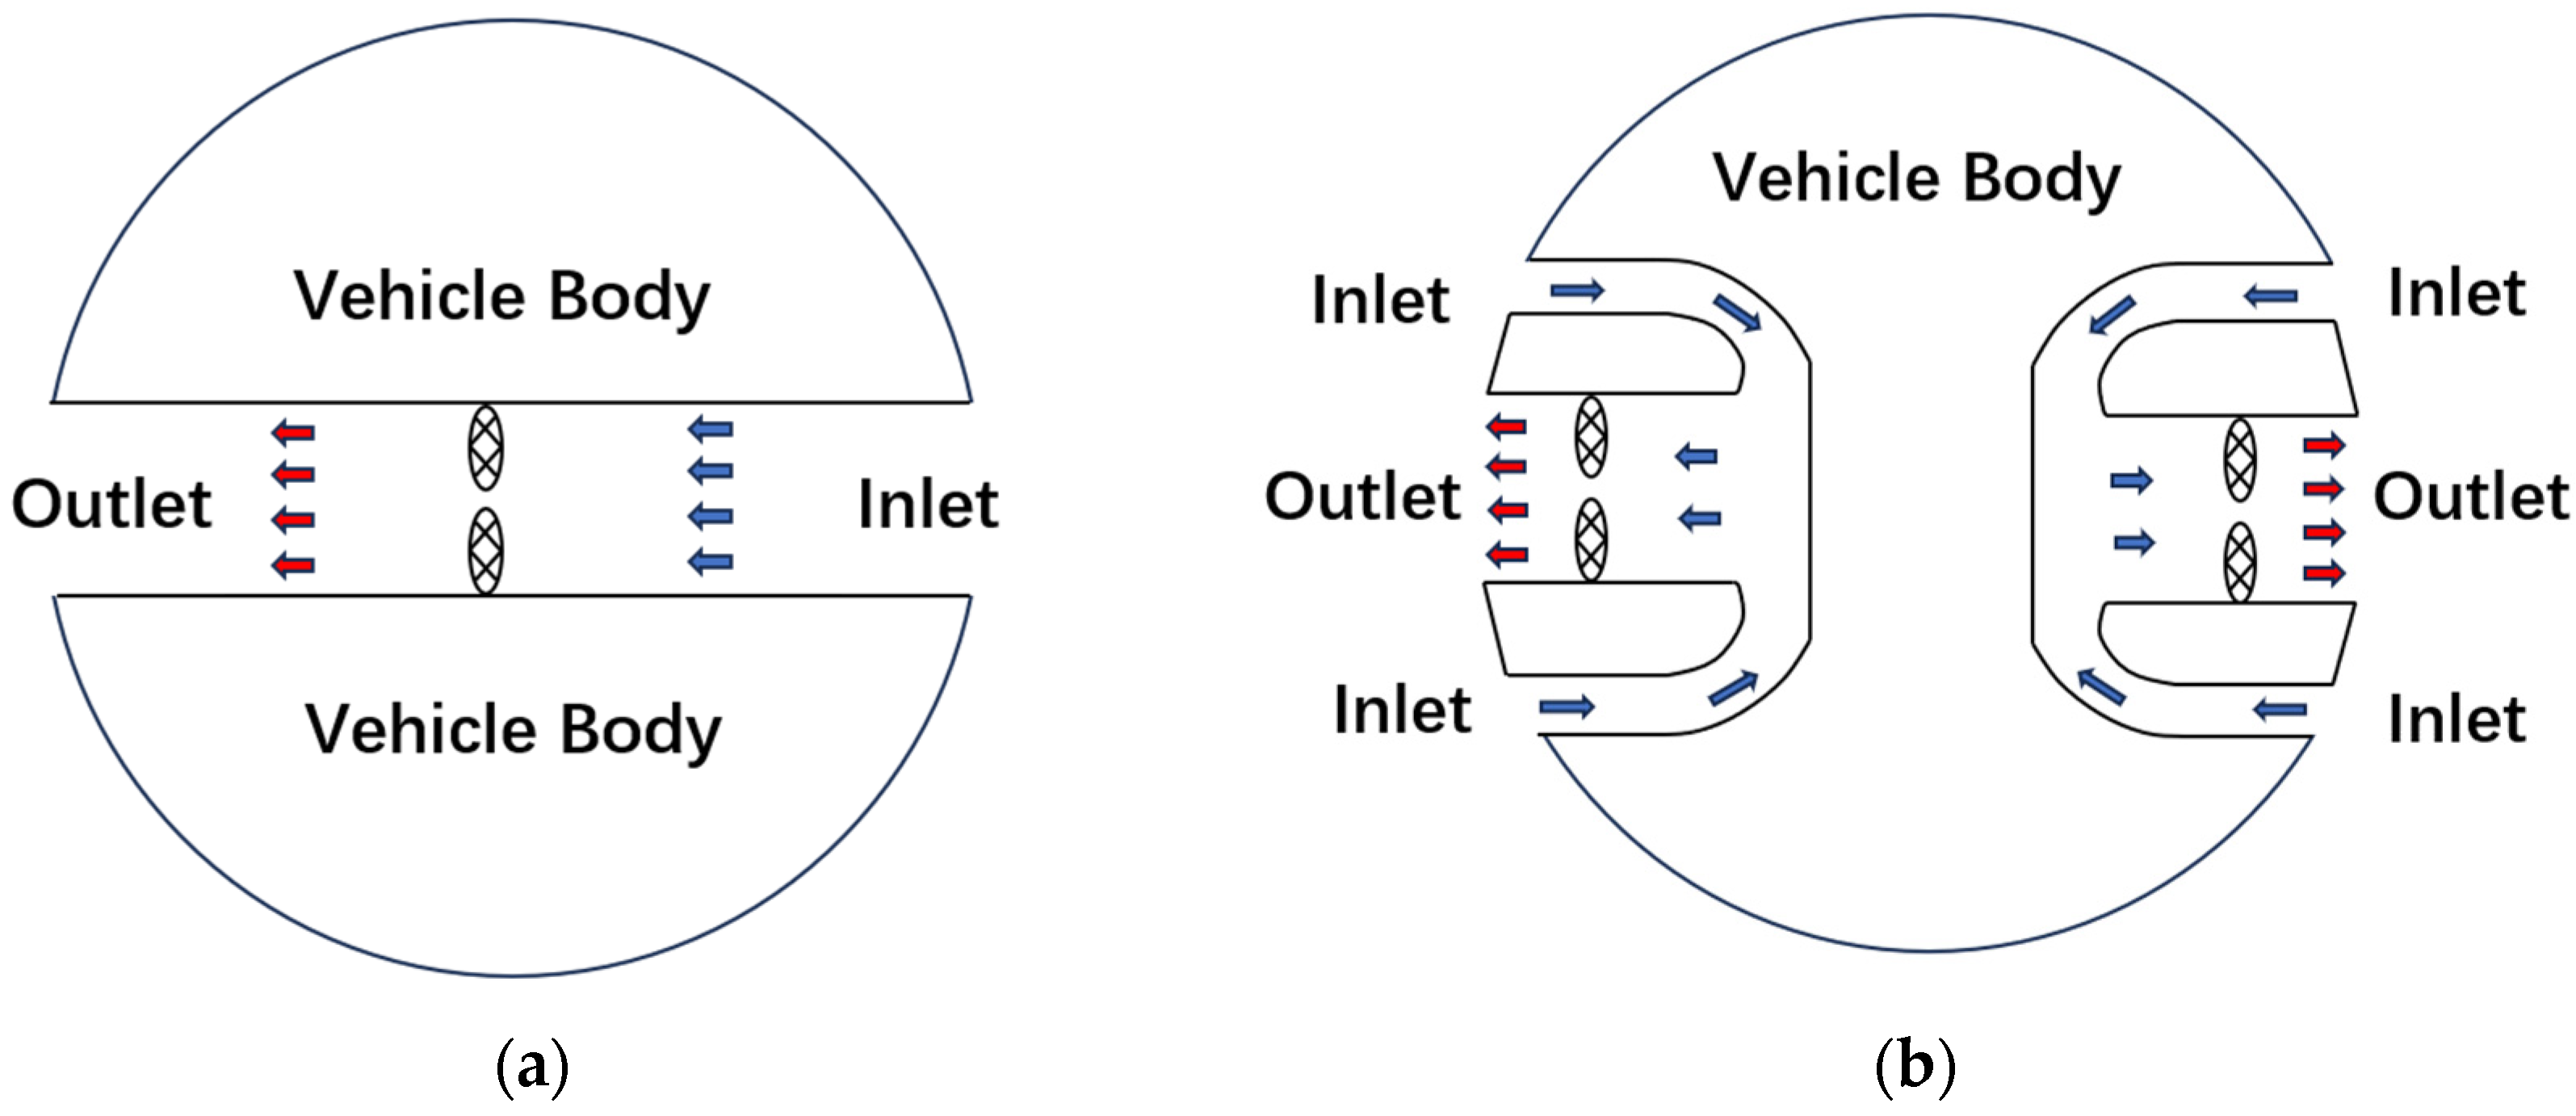
Figure 1. Thruster working diagram:(a) traditional tunnel thruster, (b) NPT thruster.
Jmse 12 01960 g001
Figure 2. NPT thruster structure.
Jmse 12 01960 g002
Figure 3. Computational domain model.
Jmse 12 01960 g003
Figure 4. Computational domain meshing: (a) static domain meshing, (b) rotating domain meshing, and (c) blade meshing.
Jmse 12 01960 g004
Figure 5. Pressure diagram of the propeller blade.
Jmse 12 01960 g005
Figure 6. Pressure distribution of the flow field.
Jmse 12 01960 g006
Figure 7. The hydrodynamic characteristics vary with the rotating speed: (a) thrust and (b) KT KQ η.
Jmse 12 01960 g007
Figure 8. Geometric parameters of the different design variables: (a) XOY cross-sectional parameters of tunnel and (b) tunnel lip curve control.
Jmse 12 01960 g008
Figure 9. The procedure of the RSM.
Jmse 12 01960 g009
Figure 10. Response surface plots and contour plots of the significant variable: (a) tunnel length and tunnel lip curve and (b) tunnel total diameter and tunnel tail spacing.
Jmse 12 01960 g010
Figure 11. Comparison of the thruster models before and after optimization.
Jmse 12 01960 g011
Figure 12. Simulation values of thrust before and after optimization.
Jmse 12 01960 g012
Figure 13. Hydrodynamic characteristics before and after optimization: (a) KT KQ η and (b) optimization ratios of the thruster efficiency.
Jmse 12 01960 g013
Figure 14. Outlet tunnel pressure distribution: (a) before optimization and (b) after optimization.
Jmse 12 01960 g014
Figure 15. Fluid pressure distributions comparison: (a) before optimization and (b) after optimization.
Jmse 12 01960 g015
Figure 16. Pressure coefficient of the tunnel.
Jmse 12 01960 g016
Figure 17. Fluid pressure distributions on the tunnel lip: (a) before optimization and (b) after optimization.
Jmse 12 01960 g017
Figure 18. LIC comparison: (a) before optimization and (b) after optimization.
Jmse 12 01960 g018
Figure 19. Experimental setup schematic.
Jmse 12 01960 g019
Figure 20. Experiment setup.
Jmse 12 01960 g020
Figure 21. Thrust test diagram.
Jmse 12 01960 g021
Figure 22. Thrust before optimization.
Jmse 12 01960 g022
Figure 23. Thrust after optimization.
Jmse 12 01960 g023
Figure 24. Experimental value comparison: (a) thrust and the increase in thrust and (b) mean square error of the thrust from the speed of 5500 rpm to 6500 rpm.
Jmse 12 01960 g024
Figure 25. Simulation effectiveness analysis: (a) experimental values of the thruster and (b) mean square error of the experimental comparison.
Jmse 12 01960 g025
Table 1. Parameters of the NPT thruster.
Propeller Diameter d/mmTunnel Total Diameter D/mmStandard Speed
n/rpm
Number of Blades
206050005
Table 2. The parameter settings for the simulation model.
Parameter
TimeSteady
SpaceThree dimensional
FlowSegregated flow
Gradient metricsGradient
Equation stateConstant density
Viscous regimeTurbulent
Turbulent modelRNG k-ε model
Table 3. The parameters for the hydrodynamic performance.
Parameter
TMooring static thrust
QTorque
ρ Density of water
dPropeller diameter
η Thruster efficiency, N/W
Table 4. Factors and levels affecting thrust.
Factor−1Level
0
1
X 1 —tunnel length283236
X 2 —tunnel lip curve131517
X 3 —tunnel total diameter464952
X 4 —tunnel tail spacing456
Table 5. Box–Behnken test protocol.
Case X 1
Tunnel Length
X 2
Tunnel Lip Curve
X 3
Tunnel Total Diameter
X 4
Tunnel Tail Spacing
Y
Thrust/N
1−1−1000.5332
21−1000.4483
3−11000.5492
411000.5075
500−1−10.4610
6001−10.5578
700−110.4959
800110.5149
9−100−10.5477
10100−10.4584
11−10010.5128
1210010.4472
130−1−100.4591
1401−100.4789
150−1100.5243
1601100.5671
17−10−100.4707
1810−100.4546
19−10100.5948
2010100.4773
210−1−1−10.4666
2201−1−10.5172
230−1−110.4945
2401−110.5038
2500000.4967
2600000.4917
2700000.4960
2800000.4943
2900000.4960
Table 6. Multiple quadratic regression equation.
Thrust   Y Constant X 1 X 2 X 3 X 4 X 1   X 2 X 1   X 3
−1.15450.063897−0.1071480.01350.3680650.00135−0.002113
X 1   X 4 X 2   X 3 X 2   X 4 X 3   X 4 X 1 2 X 2 2 X 3 2 X 4 2
0.0014890.000962−0.005166−0.0064840.0000480.0016880.000845−0.002232
Table 7. Variance analysis of the thrust.
SourceSum of SquareDegrees of FreedomMean Squared ErrorF-Valuep-Value Prob > F
Model0.0381140.002725.85<0.0001
X 1 0.014310.0143136.18<0.0001
X 2 0.003310.003330.92<0.0001
X 3 0.014410.0144136.91<0.0001
X 4 0.000110.00011.230.2857
X 1 X 2 0.000510.00054.430.0539
X 1 X 3 0.002610.002624.410.0002
X 1 X 4 0.000110.00011.350.2652
X 2 X 3 0.000110.00011.260.2797
X 2 X 4 0.000410.00044.050.0637
X 3 X 4 0.001510.001514.370.0020
X 1 2 0.0000310.0000040.03620.8518
X 2 2 0.000310.00032.810.1161
X 3 2 0.000410.00043.560.0800
X 4 2 0.000010.00000.30660.5885
Residual0.0015140.0001
Lack of fit0.0014100.00015.290.0614
Error0.00014
Cor total0.039628
Table 8. Parameters of the experimental platform.
Diameter
mm
Boat Length
mm
Head Length
mm
Thruster Distance from the Head of the Platform
mm
123.860080360
Disclaimer/Publisher’s Note: The statements, opinions and data contained in all publications are solely those of the individual author(s) and contributor(s) and not of MDPI and/or the editor(s). MDPI and/or the editor(s) disclaim responsibility for any injury to people or property resulting from any ideas, methods, instructions or products referred to in the content.