Article

Shore-Side Downfall Pressures Due to Waves Impacting a Vertical Seawall: An Experimental Study

by
Annelie Baines
1,2,*,
Lee S. Cunningham
2,* and
Benedict D. Rogers
2
1
Department of Civil Engineering, Ghent University, Technologiepark-Zwijnaarde 60, 5052 Gent, Belgium
2
School of Engineering, University of Manchester, Oxford Rd, Manchester M13 9PL, UK
*
Authors to whom correspondence should be addressed.
J. Mar. Sci. Eng. 2024, 12(12), 2149; https://doi.org/10.3390/jmse12122149
Submission received: 6 October 2024 / Revised: 11 November 2024 / Accepted: 19 November 2024 / Published: 25 November 2024
(This article belongs to the Section Coastal Engineering)

Abstract

:
As part of an investigation into downfall impacts from violent overtopping waves, experimental data are presented for the impact pressures and forces generated by regular and focused waves breaking onto a vertical wall and impacting a landward horizontal deck at a scale of 1:38. Particular attention is given to the wave-by-wave uprush and impact downfall events. By selecting regular and focused wave conditions that produce impacts, new trends are identified for violent downfall phenomena that could easily be underestimated in current practice. The characteristics of the downfall impacts are investigated and three different types of downfall impact are identified and discussed. Using a Wavelet Filter to denoise the signal from pressure probes without losing the peak impact pressures or introducing a phase shift, the distinctive features and dynamic behaviours of the white-water impacts are considered, and it is shown that downfall pressure magnitudes of 30 40   ρ g H are regularly achieved. Dynamic impulse times of the events are also presented with higher-impact events generally relating to shorter impulse times, highlighting the dynamic character of these impacts. The largest downfall pressures are found to occur further from the vertical wall than previously measured. Importantly, the spray travelling furthest from the point of the initial wave impact on the vertical wall causes some of the largest downfall pressures on the deck. The paper concludes that, while the dataset is small, there are strong indications that the effects of these types of impacts are structurally significant and present a risk to infrastructure located landward of seawalls.

1. Introduction

Accurate prediction of wave impacts on structures located immediately landward of the shore is crucial to their design. It is well known that the horizontal impact pressures resulting from waves breaking on a vertical wall can be several times greater than the associated quasi-hydrostatic pressure [1], with spikes and pulsating loads now understood in more detail after multiple experimental investigations [2]. Violent wave overtopping, often referred to as white-water overtopping has been comprehensively studied and is now included in the design recommendations of the EurOtop manual [3]. However, the focus is on overtopping flows rather than quantification of vertical pressures generated by wave downfall impacts.
Recent events have demonstrated that downfall impacts from violent breaking waves can result in serious structural damage to infrastructure located immediately behind the coastal defences. During a storm on 4 February 2014, breaking wave downfall impacts on the landward side of the seawall contributed to significant structural damage to the Dawlish railway line on England’s south coast, with resulting repair costs in the region of £80 million [4]. There is currently limited understanding of the hydrodynamic mechanisms that cause these events. Standard design practice for coastal defences considers forces due to unbroken, lightly aerated, overtopping flows, termed green-water overtopping. Forces due to white-water overtopping, particularly where highly aerated “plumes” of spray dominate, are not currently included in the British Standard for Maritime Engineering, BS6349 [5], EurOtop [3], or the US equivalent, the Coastal Engineering Manual (CEM) [6]. Specifically, forces landward of the coastal defences are considered negligible when resulting from these types of flows [7].
In this paper, the focus is on highly aerated overtopping events, referred to as spray-dominated overtopping events, such as the example shown in Figure 1, in which white-water downfall extending across an approximately 7   m wide promenade behind the vertical seawall can be clearly observed.
Spray-dominated impact events are not generally considered in design due to a focus on the more damaging green-water overtopping [3,8]. Where violent, or impulsive overtopping events are considered, they are only discussed in terms of the overtopping flow rate, q , or overtopping volumes, values which are typically only reported once they exceed a threshold defined by standard practice (e.g., EurOtop [3] recommends values above 0.1   L / m / s be considered). In the present paper, the focus is on the impact pressures generated by the impinging spray-plumes.
Within the context of naval hydrodynamics, Bodaghkhani et al. [9] investigated the effects of spray resulting from wave–structure interactions of the bow of a vessel, and subsequently identified the following 5 stages of spray formation: (1) wave impact, (2) sheet formation, (3) sheet breakup, (4) droplet breakup, and (5) droplet dispersion. It is the droplets of spray created during droplet dispersion that typically impact a ship’s deck or superstructure, making it the primary interest in naval engineering. Recent research has concentrated on predicting the generation and formation of the spray as well as the velocity and trajectory of individual droplets [9,10,11]. The experiments reported in the present paper captured such spray formation and evolution for waves impacting a coastal vertical wall (see Figure 2). Viewed from onshore of the vertical wall and deck structure with the wave having already impacted the wall, (a) corresponds to the sheet formation, (b) corresponds to sheet breakup, and (c) and (d) correspond to the droplet dispersion and impact. These images and their corresponding analysis are further corroborated by the related work of Watanabe and Ingram [12].
To date, there has been limited investigation of the behaviour of the droplets impacting on superstructures, or of quantification of associated deck pressures from downfall impacts on the deck landward of coastal structures. The damage to structures located adjacent to coastal defences in the UK, such as the Blackpool North pier in December 2013 [13] or the Aberystwyth promenade in January 2014 [14] cannot be explained simply by green-water overtopping, suggesting that the spray overtopping observed during these storms, must have played a role in the structural damage.
Wolters et al. [15] and Bruce et al. [16] (velocities discussed in [17]) conducted experiments investigating deck pressures on a vertical seawall (at 1:4 and 1:100 scale, respectively). In 2018, a newer third set of 2-D physical tests were undertaken at the University College Cork, Ireland [18], within the design framework for a novel coastal protection scheme, using a rubble mound breakwater instead of a vertical wall, and including a crown wall atop the rubble mound [18]. Pressure distributions landward of the wall were recorded at multiple locations. The present authors also carried out numerical simulations based on the Watson et al. experiments [19]. It should be noted that Watson et al. [18] had a has a freeboard value, R c , greater than the crown wall height unlike Wolters et al. [15] and Bruce et al. [16]. This significant deviation in geometry likely explains the notable differences in reported results and overall hydrodynamic behaviour. Table 1 below summarizes the key parameters of the different schemes and their key results.
Identifying a predictive equation for downfall pressures has proven difficult in previous work. Bruce et al. [16] proposed an equation using a Weibull distribution to statistically link uprush velocities and vertical impact pressures from the waves to downfall impact loading. Wolters et al. [15] only identified a connection between the highest downfall pressures and the lower face impact pressures of ( 30 50   k P a and 2 3   ρ g H s , respectively). Similarly, the higher impact pressures tended to result in low downfall pressures. Unlike the Weibull distribution, this does correlate well with the data obtained from [16]. Additionally, the highest downfall pressures seemed to be associated to waves of a near-breaking type and not the more violent breaking waves. Scaling issues and the large difference in scale between the two experiments could be significant in explaining the variance in results [20]. This also highlights the need for more experimental data.
From the experiments of Wolters et al. [15], it was inferred that the higher uprush velocities resulting from breaking waves caused the plumes to disintegrate further, resulting in lower downfall pressures. This was supported by the ratio of uprush velocities, v u p , to wave celerity, c , that resulted in the larger recorded downfall pressures of 2.0 3.5 for the stated water depths. This indicates a correlation might exist between downfall impact loads and uprush velocities, despite not being able to verify the Weibull distribution of Bruce et al. [16]. Combining these observations strongly suggests that the overtopping process is more important in driving the downfall mechanism than the impacting wave pressures.
Once the fluid in the wave runup loses contact with the structure, the motion of the fluid droplets can be inferred using Newtonian mechanics as projectile motion. This flow phase would be the sheet formation phase, following the terminology defined by Bodaghkhani et al. [9], and involves the fluid droplets moving separately to the main fluid body. By considering the flow as a projectile under gravity, it is obvious that the maximum uprush velocities will be measured directly after the initial impact. Therefore, Wolters et al. [15] inferred that the uprush velocities, calculated by measuring the time between initialization of sheet formation and recorded deck impact, were the same as the impact velocities of the spray droplets. The rise time, defined as the time from start of impact seen in the deck pressure probe signal, to maxima, averaged around 2   m s , which corresponds well to the estimate of Bruce et al. [16], and the recorded time between vertical and horizontal impacts correlated to maximum uprush velocities. Thus, it can be concluded that the significant impacts resulted from the impact of the droplets in the spray plume that reached maximum height.
More recently, de Almeida and Hofland [21] pointed out that there are issues with the definition of rise time as used by [15,16], specifically the lack of a consistent method to determine the pressure-impulse and timings of different wave impacts. In the results of the experiments discussed in the present paper, the more consistent ‘dynamic impact times’ suggested by de Almeida and Hofland [21] will be used.
The difference in scale between previous experiments can impact the results. Bruce et al. [16] and Wolters et al. [15] both used the traditional Froude scaling. Bredmose et al. [22,23] showed that Froude scaling may no longer hold for highly aerated waves with significant air-entrainment for face impact measurements, although these results are dependent on the full-scale pressures measured. Building on the work by Bagnold [24], Cuomo et al. [25] proposed a modified scaling approach based on the Bagnold Number, B g , combined with experimental results of Bullock et al. [26]. The Cuomo et al. [25] scaling method does however require significant information to be known about the overtopping behaviour, which makes it harder to implement. Bullock and Bredmose [27] present a comparison between Froude scaling and the scaling approach proposed by Bredmose et al. [22,23], called the Bagnold–Mitsuyasu (B–M) scaling law, which can be used at the post processing stage to more accurately predict the pressures measured during highly aerated wave impacts from breaking waves. This law can be used for experiments that have been scaled geometrically (Froude scaling) and, therefore, does not impact the choice of scaling used to determine the initial set up of the experiments. Froude scaling was used to determine the experimental geometry and set-up for the work presented here. The implications and scaling laws are discussed in depth in Section 2.4, and the limitations in Section 4.1.
The previously discussed literature focuses on experimental studies with direct similarities in scope and aims to the ones that are the subject of the present paper. However, other recent work has been conducted using numerical models that focus on wave-on-deck loads [28,29]. Although the application differs from the one of interest in this paper, the models consider similar impact types with both entrained air and trapped air pockets. The results showed similar trends in the pressure–time traces during impact for both cases with trapped air and entrained air as those observed by Bullock et al. [26], further reinforcing the conclusions that entrained air plays a significant role in these impacts.
In conclusion, there are few published experimental investigations with the specific aim of investigating wave-by-wave impacts on coastal infrastructure, particularly where spray-dominated overtopping occurs. The term “wave-by-wave” is used throughout this paper to refer to the process of associating each recorded impact event with the properties of the specific wave that generated the impact. This paper presents a set of new experiments conducted at The University of Manchester that aim to address some of the gaps in the aforementioned published work, specifically, the wave-by-wave analysis of breaking, spray formation and downfall impact pressures. The results can be used to improve the current understanding of violent wave events.
This paper is structured in the following way. First, a detailed description of the physical model is given. Then, the time domain analysis methods are discussed, with the relatively novel application of Wavelet Transforms for the analysis. The hydrostatic and hydrodynamic properties are then described and the wave conditions of the test matrix are given. Finally, the wave generation and measurement protocols are given, followed by the discussion and conclusions.

2. Experimental Arrangements

2.1. The Physical Model

Physical model experiments took place in the wave flume at The University of Manchester, UK. The wave flume is 15   m long, 1   m wide, 1   m high with a water depth of 0.5   m in the flat region and is equipped with a single piston-type wave paddle produced by Edinburgh Designs [30] with force/position feedback to dampen reflected waves at the paddle thus absorbing reflections reaching the paddle. An energy absorbing beach is located approximately 13.5   m from the paddle. As the tests discussed here have a vertical seawall in place, the energy absorbing beach was not used.
The combined beach, vertical wall and deck structure was set on the flat bottom of the flume, see Figure 3. The coordinate system is defined as follows: the vertical elevation, z , is defined as positive upwards from the bottom of the tank, the cross-shore direction, x , is defined with its origin at the face of the paddle and is positive in the onshore direction of the beach. The model consists of a shallow sloping beach foreshore (1:10) leading up to a vertical seawall shown in Figure 3. The structure was constructed without a back panel as it was not needed for the purpose of the tests. The toe of the beach slope was located at x = 6.5   m and the top of the beach foreshore with vertical wall at x = 9.78   m .
The model seawall structure had dimensions of 640 × 640 × 1000   m m (height × depth × width), shown schematically in Figure 4, and was made from square hollow steel sections, with Perspex sides. To ensure that the corners between the sheets did not impact on the fluid flow, they were sealed with silicone. The structure was then placed into the tank.
A Canon DSLR camera with a frame rate of 60   f p s was placed at the end of the flume to capture the behaviour of the water post-impact as well as provide visual confirmation that the impacts seen on the pressure probes’ signals were in fact caused by the overtopping spray such as can be seen in Figure 2.

2.2. Experimental Instrumentation

Figure 3 shows the position of the two parallel wire capacitance-type wave gauges used at WG1 and WG2. The gauges were placed along the tank centreline. The output voltage from capacitance-type wave gauges is linearly proportional to the water level, although some minimal hysteresis is inevitable in these types of gauges. Two gantries were used to fix the gauges in place. The first wave gauge, WG1, termed the offshore wave gauge, is located at x = 3   m while the second gauge, WG2, termed the nearshore wave gauge, was positioned at the toe ( x = 6.5   m ).
Eight pressure probes of two types were used in the tests, with their properties and specifications given in Table 2. Impact pressures are measured using three pressure probes positioned on the front of the structure towards the incident waves (PF1, PF2, PF3). Deck impact pressures are recorded using five pressure probes located on the top of the structure (see Figure 4). Figure 4c shows nine possible probe positions on the deck of the structure. As only five probes could be used concurrently, only five locations were used at any one time. The probe positions were pre-formed within the Perspex sheet with unused positions plugged by a Perspex plug sealed with silicone. The probes located on the front of the structure record positive relative pressures only (range: 0 4000   h P a ) and, therefore, no negative impacts are recorded. As the measurements from these probes are only for comparison with previously reported data, this configuration was considered suitable. Additionally, it is sufficient to obtain the wave-by-wave data for comparison with the subsequent deck pressures. The probes positioned on the top have a range of 20   t o + 20   k P a . The methodology used to determine the position of the probes shown on Figure 4 is given in Section 2.3.1.
To ensure that the signals from the wave gauges and pressure probes could be correlated, synchronisation of the pressure probes and wave gauges was achieved by simultaneous activation using the LABView 2017 software.

2.3. Wave Conditions

The experimental programme was divided into the following two series: (i) regular waves and (ii) focused waves.

2.3.1. Regular Wave Properties

The key elements of the model parameters were determined based on the existing experiments discussed in the previous section that used vertical walls [15,16]. Crucial parameters considered were relative freeboard, wave height, and breaking type. Importantly, the combination of structure geometry and wave properties are designed specifically to generate impacts that result in spray generation and subsequent spray impinging on the deck. The minimum offshore water depth of the tank is set to d = 0.5   m as this is dictated by The University of Manchester flume’s operational limitations. As this dictates the value of the freeboard R c , the model size was derived from this water depth. The wave heights and periods were not directly scaled to replicate those of Wolters et al. [15], but were instead calculated such that they have an Iribarren number that falls into the same plunging wave breaking-type used in previous experiments. The selection of the wave periods was restricted by the operational limitations of the wavemaker ( 0.5 3.5   s ) . The wave heights were calculated subsequently based on the selected periods. The parameter used to calculate the scale relative to prototype is the structure height, which is taken from Wolters et al. [15] to be 12   m at prototype scale.
Using the above considerations, the scale factor of the experiments presented herein, based on Froude scaling, is given as S = 38.5 relative to prototype, giving an R c = 0.17   m and a height of the vertical wall above the beach of 0.312   m . The chosen scale falls within the 1:30 to 1:60 scale typically used for medium sized 2-D wave flume experiments such as those presented here [31,32,33,34]. The conditions of the experiment are such that they are above the minimum Reynolds value, water depth, and wave period recommended by EurOtop for breaking wave experiments. Although EurOtop focuses on overtopping predictions, the methodological recommendations also consider forces, throw velocities, and overall scalability of the flow phenomena based on existing literature. However, scale effects must be carefully considered and treated; therefore, a full discussion of scale considerations and limitations due to the scale of the experiments is given in Section 2.4.
A series of numerical models, using Smoothed Particle Hydrodynamics, were carried out during the design stage of the experiments to give further confidence that the chosen wave heights would result in sufficient overtopping following the methodology used in Baines et al. [35]. Table 3 shows the test matrix defined for the tests, with wave properties (wave height and period) and associated identification code, a combination of the wave period, and wave height numbers. These will be used herein to denote the corresponding test results. Figure 5 shows the test flume at The University of Manchester with the structure in situ.
The wave conditions tested in the regular wave sets can be classed as at intermediate water depth, as 0.05 < d / L < 0.5 , for d = 0.5   m , in all cases.
Determining the locations to be used for the deck pressure probes requires careful consideration to capture the downfall phenomena as fully as possible. Previous work had probes located at maximum distances of 0.5   H s [15] and 1.5   H s [16], where H s is the significant wave height. Probe distances are all measured from the front, seaward, edge of the deck. Bruce et al. [16] reported that the largest deck pressures measured occurred at their furthest position. The plan view of Figure 4 shows the pressure probe locations chosen for these experiments. Three rows are used, with the first row being located such as to match the Wolters et al. [15] location; the second row is placed 1.2   H , where H is the wave height of the monochromatic regular wave used here. This distance is chosen to ensure that the probes are sufficiently spaced and avoid interference between the rows. The third row was added further from the edge than investigated in previous work, 2.5   H , to investigate if violent wave downfall events can result in structurally significant effects further than previously measured. As only five positions are used at any one time, emphasis was made on the probe positions located furthest from the edge of the seawall.
As 7 wave heights are used across all tests, the H value used in the above calculations was taken as the median value 0.08   m , resulting in the 3 locations being, at model scale, 0.04 ,   0.102 ,   a n d   0.204   m , measured from the seaward edge of the structure. As well as the three rows, the pressure probes were positioned at equal intervals of 0.25   m along the width of the structure. The probes were located 0.25   m from the sides of the tank to avoid picking up boundary effects. Therefore, the experiments presented were able to capture the spatial variability of the spray-dominated wave impacts on the deck, despite the 2-D nature of the flume and the incident wave.
The distance between the paddle and the beach toe, equal to 6.5   m in this experiment, is typically recommended to be equal to at least two wavelengths [36]. This is required for the waves to set up and reduce reflections at the paddle. The maximum wavelength in the current experiments is L m a x = 6.07   m and, thus, a minimum of one wavelength instead of two is provided. To counter this issue, the wave-by-wave analysis carried out as part of this work uses the measured offshore wave height of each incident wave. Additionally, the duration of each test was carefully defined to account for this limitation. A complete discussion of the reflections, along with choice for the test durations, is given in more detail in Section 2.6.1.
Linear wave theory is used to determine the motion of the paddle. During the wave generation, secondary waves are produced in addition to the intended wave. These are termed free second-order and bound waves [37,38]. The first type are long waves that have wave speeds greater than the principal wave group. They tend to result in a varying of the measured free-surface elevation. Wave transformations, such as those expected as the wave travels up the beach to the structure, are more responsive to these variations in the free surface [39]. Therefore, the effect of free second-order waves is more noticeable close to the structure. Bound waves, generated from the reflections between the structure and the paddle, can be limited by using second-order wave generation [40,41]. While it can be difficult to prevent them from existing entirely, bound waves have longer periods than the generated waves (an order of magnitude larger). Hence, by limiting the run time of the experiments to less than 30 s or 5 waves, the effect of bound waves can be minimised such that there is insufficient time for them to develop.

2.3.2. Focused Wave Properties

Properties for the focused wave tests are shown in Table 3, along with the name code for the test. Results will be reported using the codes. Peak wave period, T p , is stated as the characteristic period for each test. The wave height is defined using the peak wave height, H p , which is defined as the maximum wave height of the JONSWAP spectrum.

2.4. Scale Considerations

To be of engineering value at prototype scale, multiple scaling laws exist that are suitable for consideration in model experiments depending on the wave characteristics. As mentioned in the model description, the scale of the experiments is based on geometric scaling. The most important forces in coastal wave–structure impacts are inertia (gravity driven), surface tension, and friction, leading to the following three types of similarity being important: geometric, kinematic, and dynamic. As the focus of this paper is impact forces and pressures, dynamic similarity is important as it describes the conservation of the relative forces. To conserve dynamic similarity, the following three scale laws, and associated dimensionless numbers, are of interest: Froude, Weber, and Reynolds. The Froude number, defined as the ratio between inertial and gravitational forces F r = U / g d , where d is water depth and U is a characteristic velocity, is often used where the gravity is the main restoring force. By taking the ratio between inertia and viscous forces, the Reynolds number is obtained, R e = U d / ν , where ν is the kinematic viscosity, is necessary when considering drag forces or turbulent flow regimes, neither of which are the focus of the experiments reported here. The Weber number, W e = ρ ν 2 l / σ s , where ρ is the density of water, l is a characteristic length, and σ s is the surface tension, relates inertia to surface tension for a specific fluid. Flows such as those driven by droplets or where mixing between phases occurs tend to have a Weber dependency.
For the experiments included here, there are three phases of flow that need separate consideration. In the flat bed region, gravity effects dominate as the waves propagate along the flume. In the region of the wave breaking, aeration effects could imply surface tension effects as well as the influence of the volume of entrained air, which is gravity and momentum driven. Finally, on the top of the structure, the impinging water is in droplet or “packet” form; therefore, the influence of surface tension effects must be considered. It can, therefore, be seen that the choice of scaling approach is non-trivial in this case.
Prior to the “spray formation”, the types of waves that result in spray generation during overtopping are heavily dependent on gravitational forces. For the wave conditions considered in this paper, shown in Table 3, and taking the properties of fresh water, in the flat-bed region, the minimum and maximum values of R e are 899553 and 1061722 , using d = 0.5   m and U as the lowest and highest wave celerity, respectively. For the same region, the maximum and minimum Weber numbers are 22478 and 31313 , where l is the minimum and maximum wave height. The high values of both of the Reynolds and Weber numbers indicate that inertia forces dominate over both the viscous (Reynolds) and surface tension (Weber) forces demonstrating that Froude scaling is the more critical number to maintain in that zone.
As mentioned previously, Bredmose et al. [22,23] and Cuomo et al. [25] proposed alternative scaling approaches based on the Bagnold number combined with the Bagnold–Mitsuyasu compression law. The Bagnold number is defined as the ratio of particle impact stress to viscous fluid stress in granular flows containing interstitial Newtonian fluids, such as air bubbles entrained in water, and is given by the following equation:
B g = ρ d 2 λ 1 / 2 γ ˙ μ
where ρ is density, d is the grain diameter, μ is the dynamic viscosity, and γ ˙ is the shear rate. The parameter λ is the linear concentration and is given by 1 ( ϕ 0 / ϕ ) 1 / 3 1 , where ϕ is the solids fluid fraction and ϕ 0 is the maximum possible concentration.
The Cuomo et al. [25] method does not have many examples of having been applied in coastal engineering problems and the Bagnold number requires estimates of aeration and impact loads, making its application difficult. Therefore, neither of these approaches will be applied here.
Although the experiments focus on violent wave impacts, the waves generated are predominantly near-breaking. This is for the following two reasons: (i) to ensure the spray effects are observed, and (ii) it implies that there is limited air entrainment in the flow. Instead, large pockets of air are trapped between the water free surface and the structure as the plunging wave starts to form. Bullock et al. [26] found that these cases have minimal scale effects and can be Froude scaled with minimal overestimation when considering pressures; however, some error will remain and should be considered when interpreting the data presented. Further work by Bredmose et al. and Bullock et al. [23,27] present and apply an alternative scaling law, modified based on the Bagnold number similar to Cuomo et al. [25], referred to as the Bagnold–Mitsuyasu (B–M) scaling law. The B–M law is not proposed to be used during the geometric scaling of the experimental set up, but is intended to be applied to the measured pressures or forces based on the geometric scale used. It can, therefore, be interpolated from the recorded experimental measurements, at model scale, as a post-processing step. Indeed, the B–M law approach proposed extrapolates the full-scale values based on the results obtained once measured results are scaled to prototype scale according to the Froude scaling law. The results from the aforementioned papers indicated that applying Froude scaling typically overpredicted the impact pressures at the vertical face of the structure compared to field measurements. However, applying the B–M scaling law only improved the prediction for a limited range of the results recorded. Specifically, although it reduces the overpredictions for pressures below 375   k P a , it results in an amplification of the pressures compared to Froude scaling for pressures above that value. Bredmose et al. [23] also ran a set of numerical models that confirmed that the expected cushioning effect from the aerated waves does seem to occur, and correlates to a reduction in the maximum pressures. However, Bullock and Bredmose [27] concluded that although Froude scaling does not appropriately account for the effects of aeration in medium or large-scale experiments, the proposed B–M scaling law is not appropriate to account for these effects. In fact, [27] conclude that there is currently no scaling approach or scaling law that is rational and physics-based that can account for the effects of aeration during wave impacts.
The following approach is, therefore, used in the following experiments presented in this paper: Froude scaling in the experimental design due to being well understood and accepted, and the ability to ensure scalability of the gravitational forces which dominate for the majority of the flow generated in the flume [42]. The analysis presented in Section 3 will non-dimensionalise the pressures both on the vertical face and the horizontal deck using the Froude scaling approach below where:
P = P ρ g H
where P is the measured pressure in P a , ρ is the density, and H is the associated offshore wave height, measured at WG1 in the present experiment. The choice to non-dimensionalise using Equation (2), is to enable comparison with previous published data for which the exact wave heights are not given. In Section 4, the effects and implications of the scale effects will be discussed in detail and B–M scaling will be applied to some of the results presented in Section 3 for comparison.
The W e values calculated for these experiments indicate that surface tension effects play a minor role when generating waves. However, improper W e scaling may have some effect on the observed overtopping flow characteristics in the sheet breakup and droplet formation phases. The implications of this, as well as other potential scale effects, will be further discussed in Section 4 of the paper.

2.5. Data Processing

The sampling rate of the pressure probes was determined based on previous reported work and the Nyquist sampling limit [43]. Wolters et al. [15] reported typical rise times of impacts of 2 6   m s . Using the Nyquist limit, which dictates that sampling must be performed at a minimum rate of half the impact duration, the necessary minimum would be 1000   H z . It was chosen to sample at a higher rate of 7000   H z , which is the maximum for the signal box used in the experiments, for the work presented here. This was performed as deck impact pressures do not tend to have a linear rise or decay [1]. Therefore, to capture the phenomena fully and map its characteristics, a higher sampling rate is necessary. For the present work, the sampling rate was set to 7000   H z . This is the maximum sampling rate for the probes used.
The wave gauges were calibrated before each set of experiments due to their sensitivity to small changes in position or temperature. The pressure probes were calibrated weekly as they are inherently more stable than the wave gauges due to their fixed position on the structure. A regular wave of H = 0.02   m was used to perform a daily calibration for the pressure probes. This wave height enables sufficient variation on the measured pressure sensors without generating any overtopping, thereby avoiding the need to remove the structure during calibration.

2.6. Wave Generation

As mentioned, the tests consist of both regular and focused waves. Linear wave theory with an appropriate transfer function was used to generate the regular waves [44].
To investigate spray from irregular waves (and their extremes), focused waves have been used instead of a long irregular wave series. Focused waves are highly repeatable and do not require considerations for reflections reaching the paddle. The focused waves were generated using a standard JONSWAP spectrum following the NewWave approach [36,37]. NewWave has been used in multiple experiments investigating coastal wave impacts. The transformation of the focused group over the beach has been quantified for similar geometries to the experiments presented here [37,45]. It is, therefore, highly suited to being used in the present work. As focused waves are short sets of waves, the experimental measurements from the waves are recorded before the reflections reach the paddle and can, therefore, be ignored without further correction or analysis. Additionally, focused wave groups have the advantage that they guarantee a capture of the extremes in the desired sea-state.

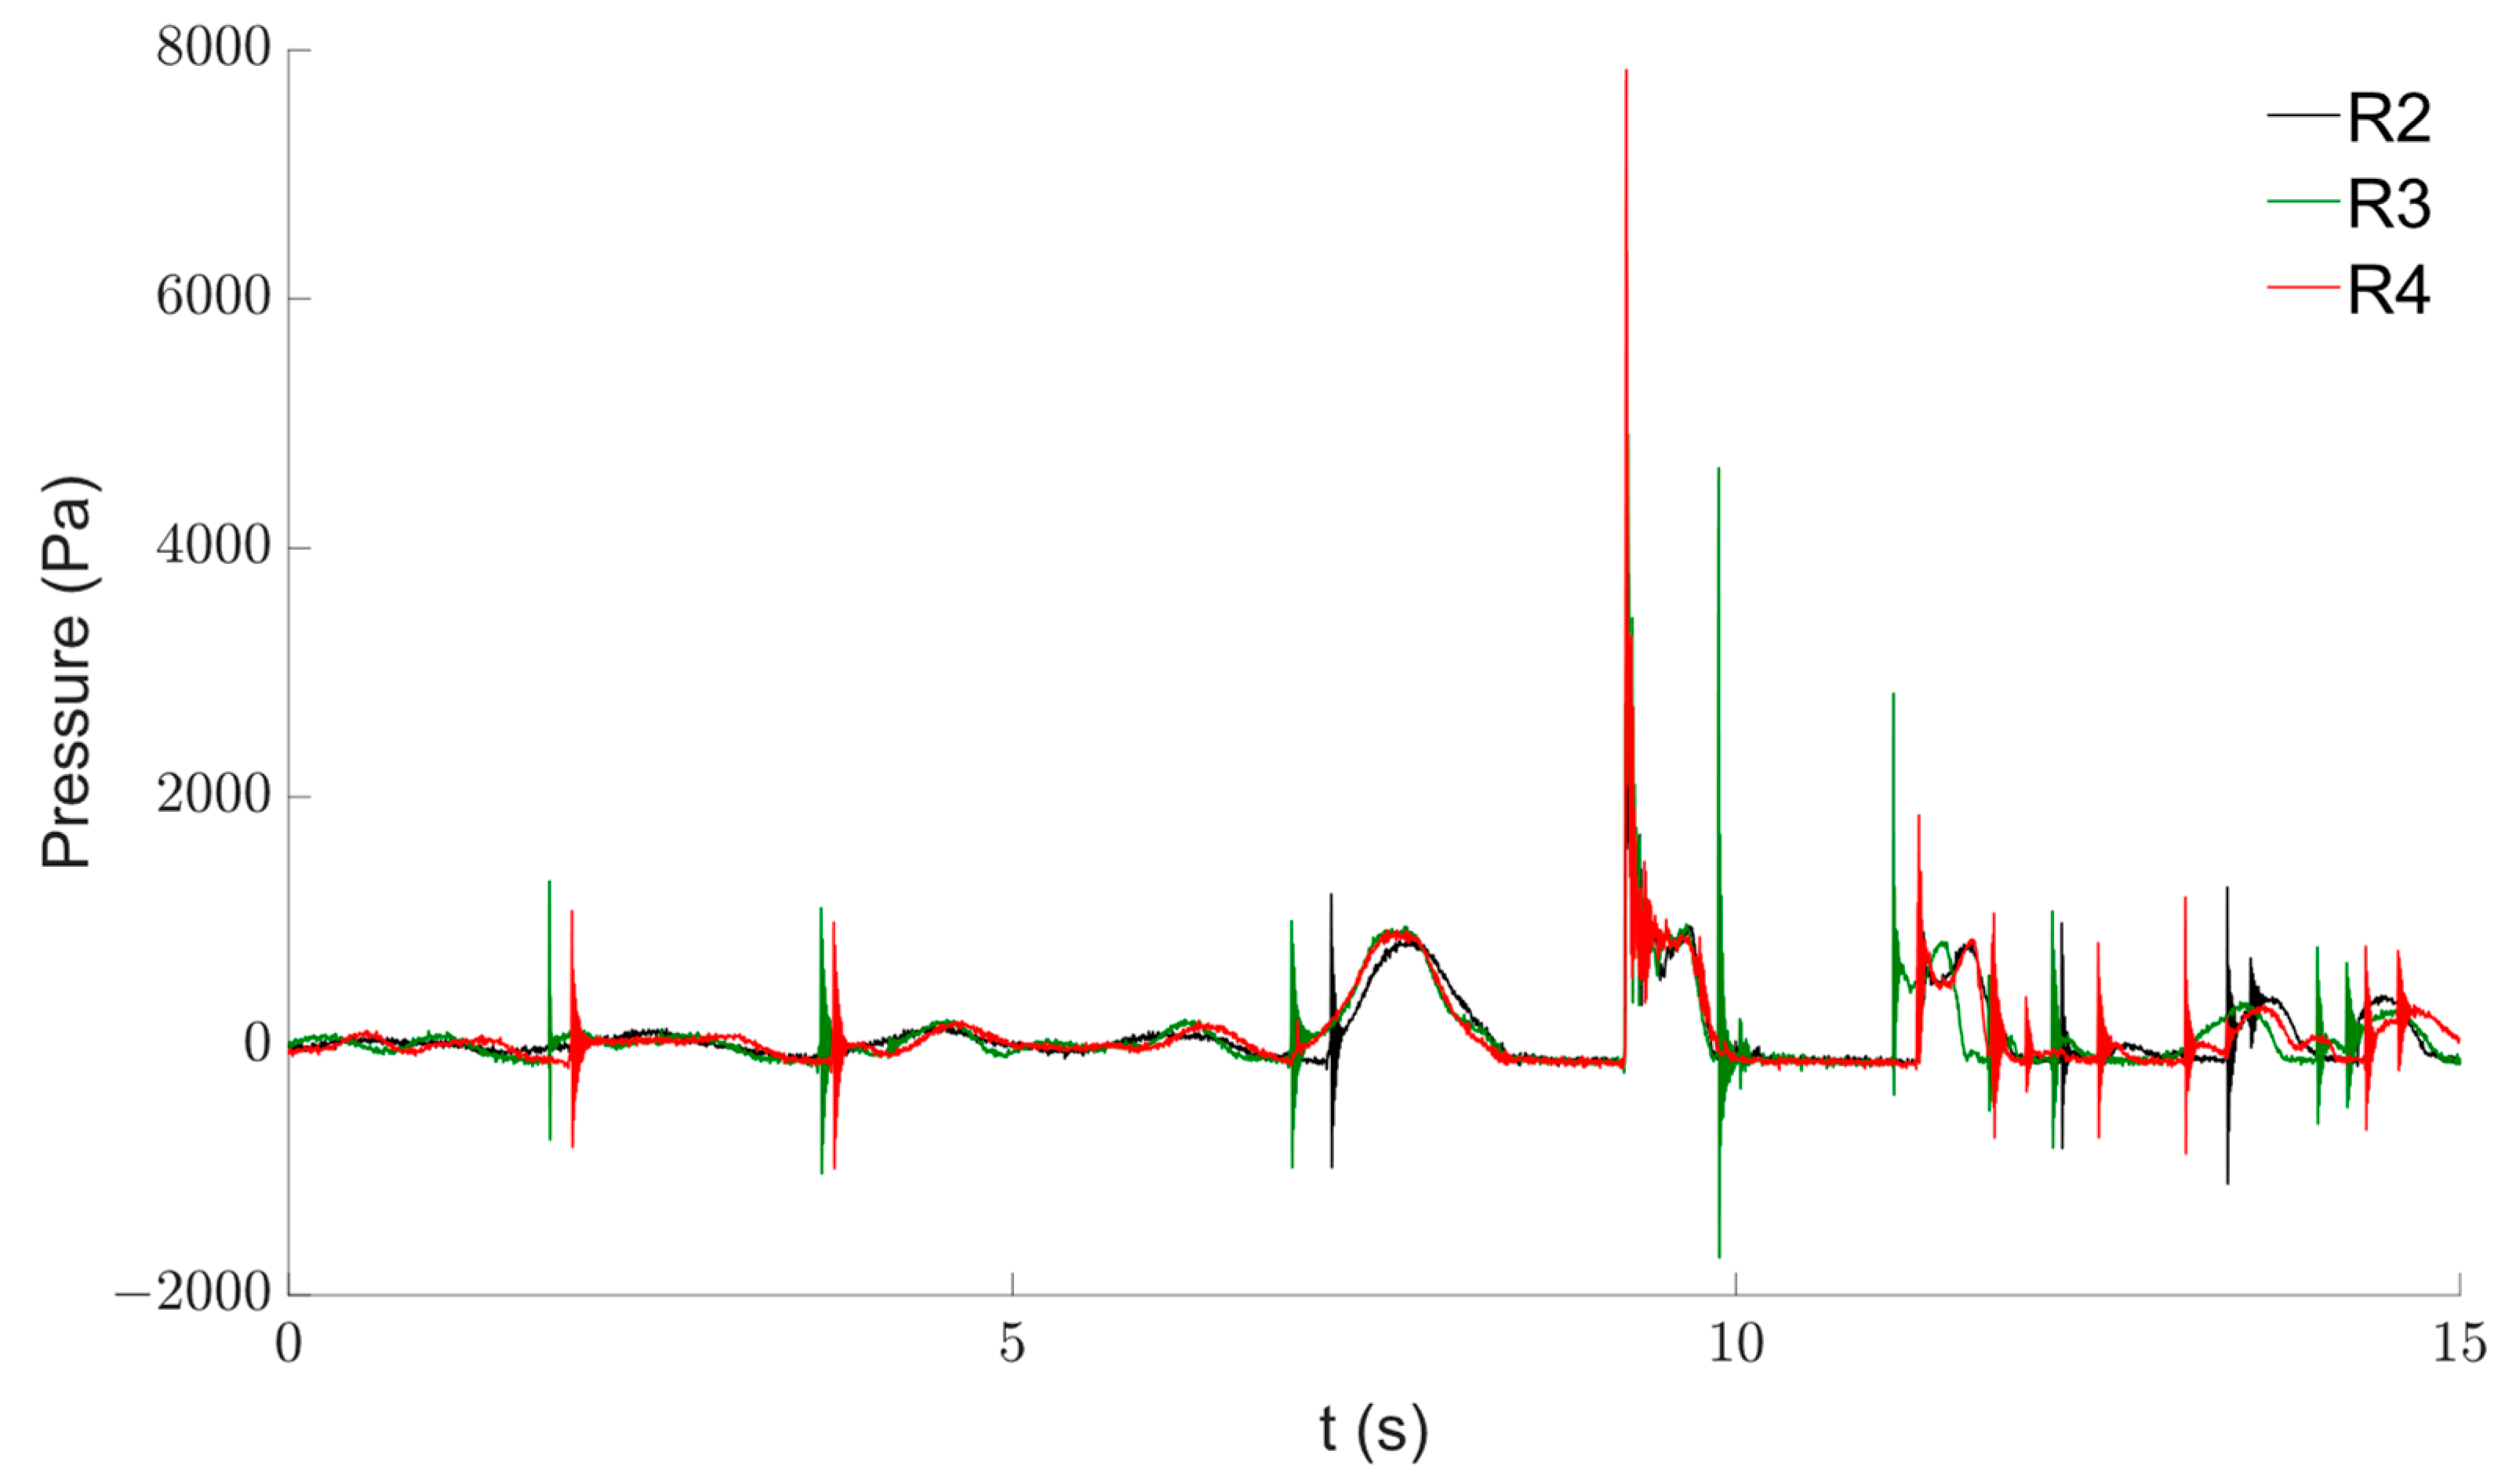
2.6.1. Accuracy and Reflection Analysis

Given the nature of the seawall being used and the type of wave impacts being investigated, reflections could easily build-up at the paddle during the regular wave experiments. To limit this having a negative effect on the results, the duration of the tests was carefully defined. An interval of t = 30   s [46] for the shorter waves was used, and an interval defined as representing five stable waves was used for longer waves f 0.45   H z . Two intervals were used to accommodate the limitations in the accuracy of the force feedback paddle correction. Due to limitations in the length of the measurement area of the flume, a 3 wave-gauge reflection analysis was not used; instead, the surface elevation time history, recorded at WG1 and WG2, was used to determine when the reflections became significant. As the incident conditions are known, reflections can be identified by subtracting the incident wave conditions from the measured signal at WG1. This can be used to identify when the reflections from the structure become non-negligible. The reflection coefficient can be estimated by calculating the percentage error between the resulting time series and the target incident wave conditions. The amplification of the wave heights was between 10   a n d   30 % . For T4 and T5, only 5 stable waves are used as per the test interval defined above. Due to the high reflection coefficient inherently associated with the vertical structure, the generated waves were not corrected to account for the reflections. Instead, the results were non-dimensionalised against the measured wave heights measured at WG1, not the theoretical input.
The errors in the measured frequencies compared to expected were minimal ( a p p o r o x i m a t e l y   1 % of the input frequency) and, therefore, ignored. For each wave set, frequency decomposition was used to quantify the impact of the second-order free-waves as well as noise from the reflected waves. For the complete analysis, the reader is referred to Baines (2020) [47]. It should be noted, however, that the 0.55   H z waves (T3) were excluded from further analysis as the results indicated that they resulted in standing waves with reflections reaching 50 % of measured wave amplitude.
To quantify the accuracy of the focused wave groups, the measured surface-elevation at WG2, which is collocated with the focal point, is compared to the theoretical solution. To reduce the error, the spectral amplitude, a n , was slightly changed from the theoretical solution. This accounts for the error between the computer inputs and the actualised paddle motion. The measured wave field was also compared to results from Hunt-Raby et al. and Orszaghova et al. [36,48]. The measured wave-field showed a close agreement (less than 10 % error after the peak wave) with previous work and was, therefore, judged to be acceptable [47].

2.7. Signal Filtering

The wave gauge signal was filtered using a standard moving-mean filter. The signal-to-noise ratio (SNR) of the signal, calculated over 30   s using the static calibration data, was 0.146 for the wave gauges. This approach was not possible for the pressure probes due to the impulse durations of 1 10   m s being short relative to the total test duration. Additionally, the type of noise recorded was not suitable to be analysed using a moving mean. The natural frequency of the structure was also measured using a hammer test and was found to be 37   H z with a water depth of 0.5   m . This frequency is sufficiently far from the anticipated typical frequency range of wave impacts ( 1 10   H z ) such that resonance effects are expected to be minimal. This assumption was further confirmed by checking the frequency decomposition of the signal and checking for any spikes at 37   H z .

Wavelet Filtering

A custom Fast Fourier Transform (FFT) is generally used to filter noisy force or pressure signals in these types of experiments [20]. However, for FFT-filtering approaches to work, the signal needs to have a consistent range of frequencies that need to be removed over the entire signal. In the experiments presented here, accurately recording and analysing maximum values of pressure is the main aim. Thus, accurately maintaining true peaks in the signal, and not removing them during filtering, is essential.
Due to the highly transitory nature of the wave impact events in these experiments, it became clear that an alternative approach was needed. Frequency decomposition techniques such as those used by Dassanayake et al. [49] could be applied; however, they require significant levels of post-processing analysis. Hence, a simpler approach was proposed as an alternative.
As with a Fourier Transform-based filter, Wavelet filters convert the signal to the frequency domain. However, a different equation, called the Wavelet Transform, is used instead of the Fourier transform [50]. The filtering was performed with a MATLAB (v2023b) wavelet function where the degree of Wavelet Transform is specified as an integer between 2 and 10. Higher-order equations are more accurate at maintaining any rapid variations in signal, conversely, they may return noisier under-filtered results [50].
By looking through the raw signal for rapid variations, the filter creates a cut-off point that divides the signal up into sub-sets to be treated independently, similar to a discreet Fourier Transform. The filtering is then applied to each sub-set. This outcome makes Wavelet filters ideal for raw signals where many spurious variations, such as the example shown in Figure 6, are present. Unlike the discreet Fourier Transform, the Wavelet Filter only requires ten data points to define a sub-set. However, larger sample sizes and sub-sets increases accuracy, as with an FFT. Wavelet equations are polynomials and, therefore, non-periodic. Therefore, Wavelet Transforms are ideal to maintain transient signals. It should also be noted that this filtering is well-suited to pressure measurements [20], such as those used in this study, as, unlike load cells, they are rigidly embedded into the structure. This removes any relative motion between the sensors and the structure, thereby removing the risk of the structure’s motion being included within the measurements. This removes the need to eliminate the natural frequency of the structure from the signal, which would pose a challenge to the Wavelet Filter.
Wavelet filters are widely used in fields including the following: data storage, image editing, numerical analysis, and communications [50]. Their use in wave structure impact, such as the subject of this paper is, however, still very rare. It has been used by Cuomo et al. [20] for wave-filtering loads on a floating jetty. More broadly, its applicability has been demonstrated for ocean surface wave recording by Massel [50]. However, to the authors’ knowledge, the technique is applied for the first time to the violent wave impacts the present work investigates.
To demonstrate the contrast between an FFT and Wavelet Filter, a low-pass filter was compared to a fifth-order Wavelet Filter. Figure 6a shows the raw signal, Figure 6b shows the result using the low pass FFT, and Figure 6c shows the result using the Wavelet Filter. The signal has been clearly denoised with the peak pressure of   a p p r o x i m a t e l y   9700   P a slightly reduced, but maintained within the range of the SNR. Additionally, one further advantage of the Wavelet Filter is the lack of a phase lag due to its polynomial nature, further simplifying its use. As this work aims to focus on the measurement of peak pressures as well as the analysis of the overall time histories, the Wavelet Filter was selected for this work. A fifth-order filter is used for the deck probes and a fourth-order filter was used for the front pressure probes. These are selected to balance the differences in the rate of variation in the signal with the SNR to avoid overfitting which can occur when using a higher-order filter.

3. Results and Discussion

In this section, the results of the experiments are presented, with the regular waves in Section 3.1 and the focussed wave results discussed in Section 3.2.

3.1. Regular Waves

To identify significant observations from the results, three approaches were used. In the first instance, the complete pressure–time history is discussed, with each wave in the series taken individually. Secondly, a comparison of the maximum horizontal and downfall pressures of the whole regular wave train is conducted for each test. Finally, a wave-by-wave comparison of the maximum vertical impact pressure and maximum horizontal impact pressure is carried out. The reported pressures are non-dimensionalised following the Froude scaling Law, ρ g H , using H as the offshore incident wave height measured at WG1 of the impacting wave. It should be noted that results were reported relative to H , not H s , as was performed by [15] and [16] since they utilised irregular waves. It should also be noted that no correlation analysis is shown here, as no correlation was identified during the analysis. The correlation analysis and complete datasets can be found in [47].

3.1.1. Wave-by-Wave Analysis

The time-series results for each wave series were plotted as shown in Figure 7 for Case H4T2. The pressure plots shown indicate relative pressure, where 0   P a is the pressure at still water conditions, at the free surface. Therefore, although the vertical pressure probes (FP1, FP2, FP3) measured absolute pressure, the recorded signal has been shifted and, therefore, negative pressures can occur where the water depth at the structure’s face drops below the initial condition. The vertical impact pressures (Figure 7a) follow the theoretical form of the non-aerated wave pressure profile presented by Bullock et al. [1]. This is characterised by the short duration of the principal pressure peak resulting in a typical cathedral shape, with the rapid initial variation being defined as the dynamic impulse, being seen in the pressure–time history (discussed in detail in the next section). The hydrostatic part follows the rapid variation and is characterised by the stabilisation of the pressure. Bullock et al. proposed that the pressure value at which the signal stabilises is equivalent to the hydrostatic pressure of the impacting column of water. The hydrostatic component showed little or no variation between waves in a series, whereas the magnitude of the dynamic component showed identifiable variations. The face impacts at PF1 and PF3 tended to be similar in magnitude and trend. This showed the consistency of the impacts along the width of the structure, and thus its expected 2-D nature. As the flume uses a single paddle to generate the waves, the lack of variation between PF1 and PF3 is indicative that side effects from the tank sides are not affecting the area of the flow where measurements are being taken. The PF2 had comparatively larger values due to its higher position up the structure (Figure 7a).
Unlike the comparatively small variation in the vertical face pressures recorded and wave heights at WG2, the time history of the horizontal deck pressures (Figure 7b) shows a larger variation in the pressures both in magnitude and profile. This is expected as previous work [15,16] found no obvious direct relationship or correlation between the magnitude of a vertical impact and its subsequent deck impact. Even when wave-by-wave face-to-deck histories are considered as shown here, the results discussed still indicate that no obvious direct correlation between these two parameters can be inferred. This variability highlights the fact that there are still elements of the wave impact and downfall process that have yet to be fully characterised; therefore, a correlation cannot be posited at this juncture.
It can be seen from the downfall pressures shown (Figure 7b) that the higher pressures are not necessarily caused by the larger vertical impact pressures (see examples at approximately 15.5   s and 17.5   s ). The face pressures in both cases have minimal variation. The first impact results in a deck pressure of smaller magnitude to the face pressure, whereas the second case has a larger magnitude deck pressure ( 10   k P a ) than the face pressure ( 3   k P a ). This observation holds logically in terms of energy conservation if the system is considered for the wave impact to overtopping to downfall event [51]. If significant energy from the wave is dissipated during impact with the vertical wall, then it holds that there will be less energy in the system remaining when impact with the deck occurs. It is, therefore, plausible to consider that total energy in the incident wave system, prior to impact but considering dissipated energy from wave breaking, would be a better indicator of expected deck pressures compared to the vertical wave impact pressures [51]. Bullock and Bredmose [27] and de Almeida and Hofland [21] both suggest that impulse was a more suitable way to quantify the impacts, which would further validate this hypothesis.
When comparing the results across the whole test range, the relationship between horizontal pressures and vertical pressures seems to evolve following a trend with increasing wave heights. Table 4 shows the range of peak face pressures and deck pressures measured for each wave of period T2. The smaller wave heights (H1T2 and H2T2) tended to result in near-breaking waves with no plunging behaviour. As can be seen from Table 4, the range of peak pressures measured on the deck were similar to those measured on the face. The deck pressures were also lower for H1T2 and H2T2 than for the other wave heights of the same period as would be expected following the EurOtop equations [3].
The middle range of wave heights (H3T2, H4T2, H5T2) generally had steep wave fronts and were near-breaking just before impact with the structure. Multiple deck pressures were measured at significantly higher magnitude than the preceding face impact pressures recorded. From Table 4, it can be observed that the range of measured pressures is higher on the deck than on the face in the first 2 cases, but the peak face pressure of H5T2 is higher than the peak deck pressure. The larger waves (H6T2 and H7T2) followed a similar trend to the one discussed for H1T2 and H2T2 where the deck and face pressures measured were similar in magnitude. However, in H6T2 and parts of H7T2, the highest peak face pressures significantly exceed the associated peak downfall pressures. Generally, in these cases, fully broken waves with higher degrees of aeration were observed just prior to impact, potentially explaining this discrepancy. This hypothesis is further supported by the focus wave tests discussed later in Section 3.2.

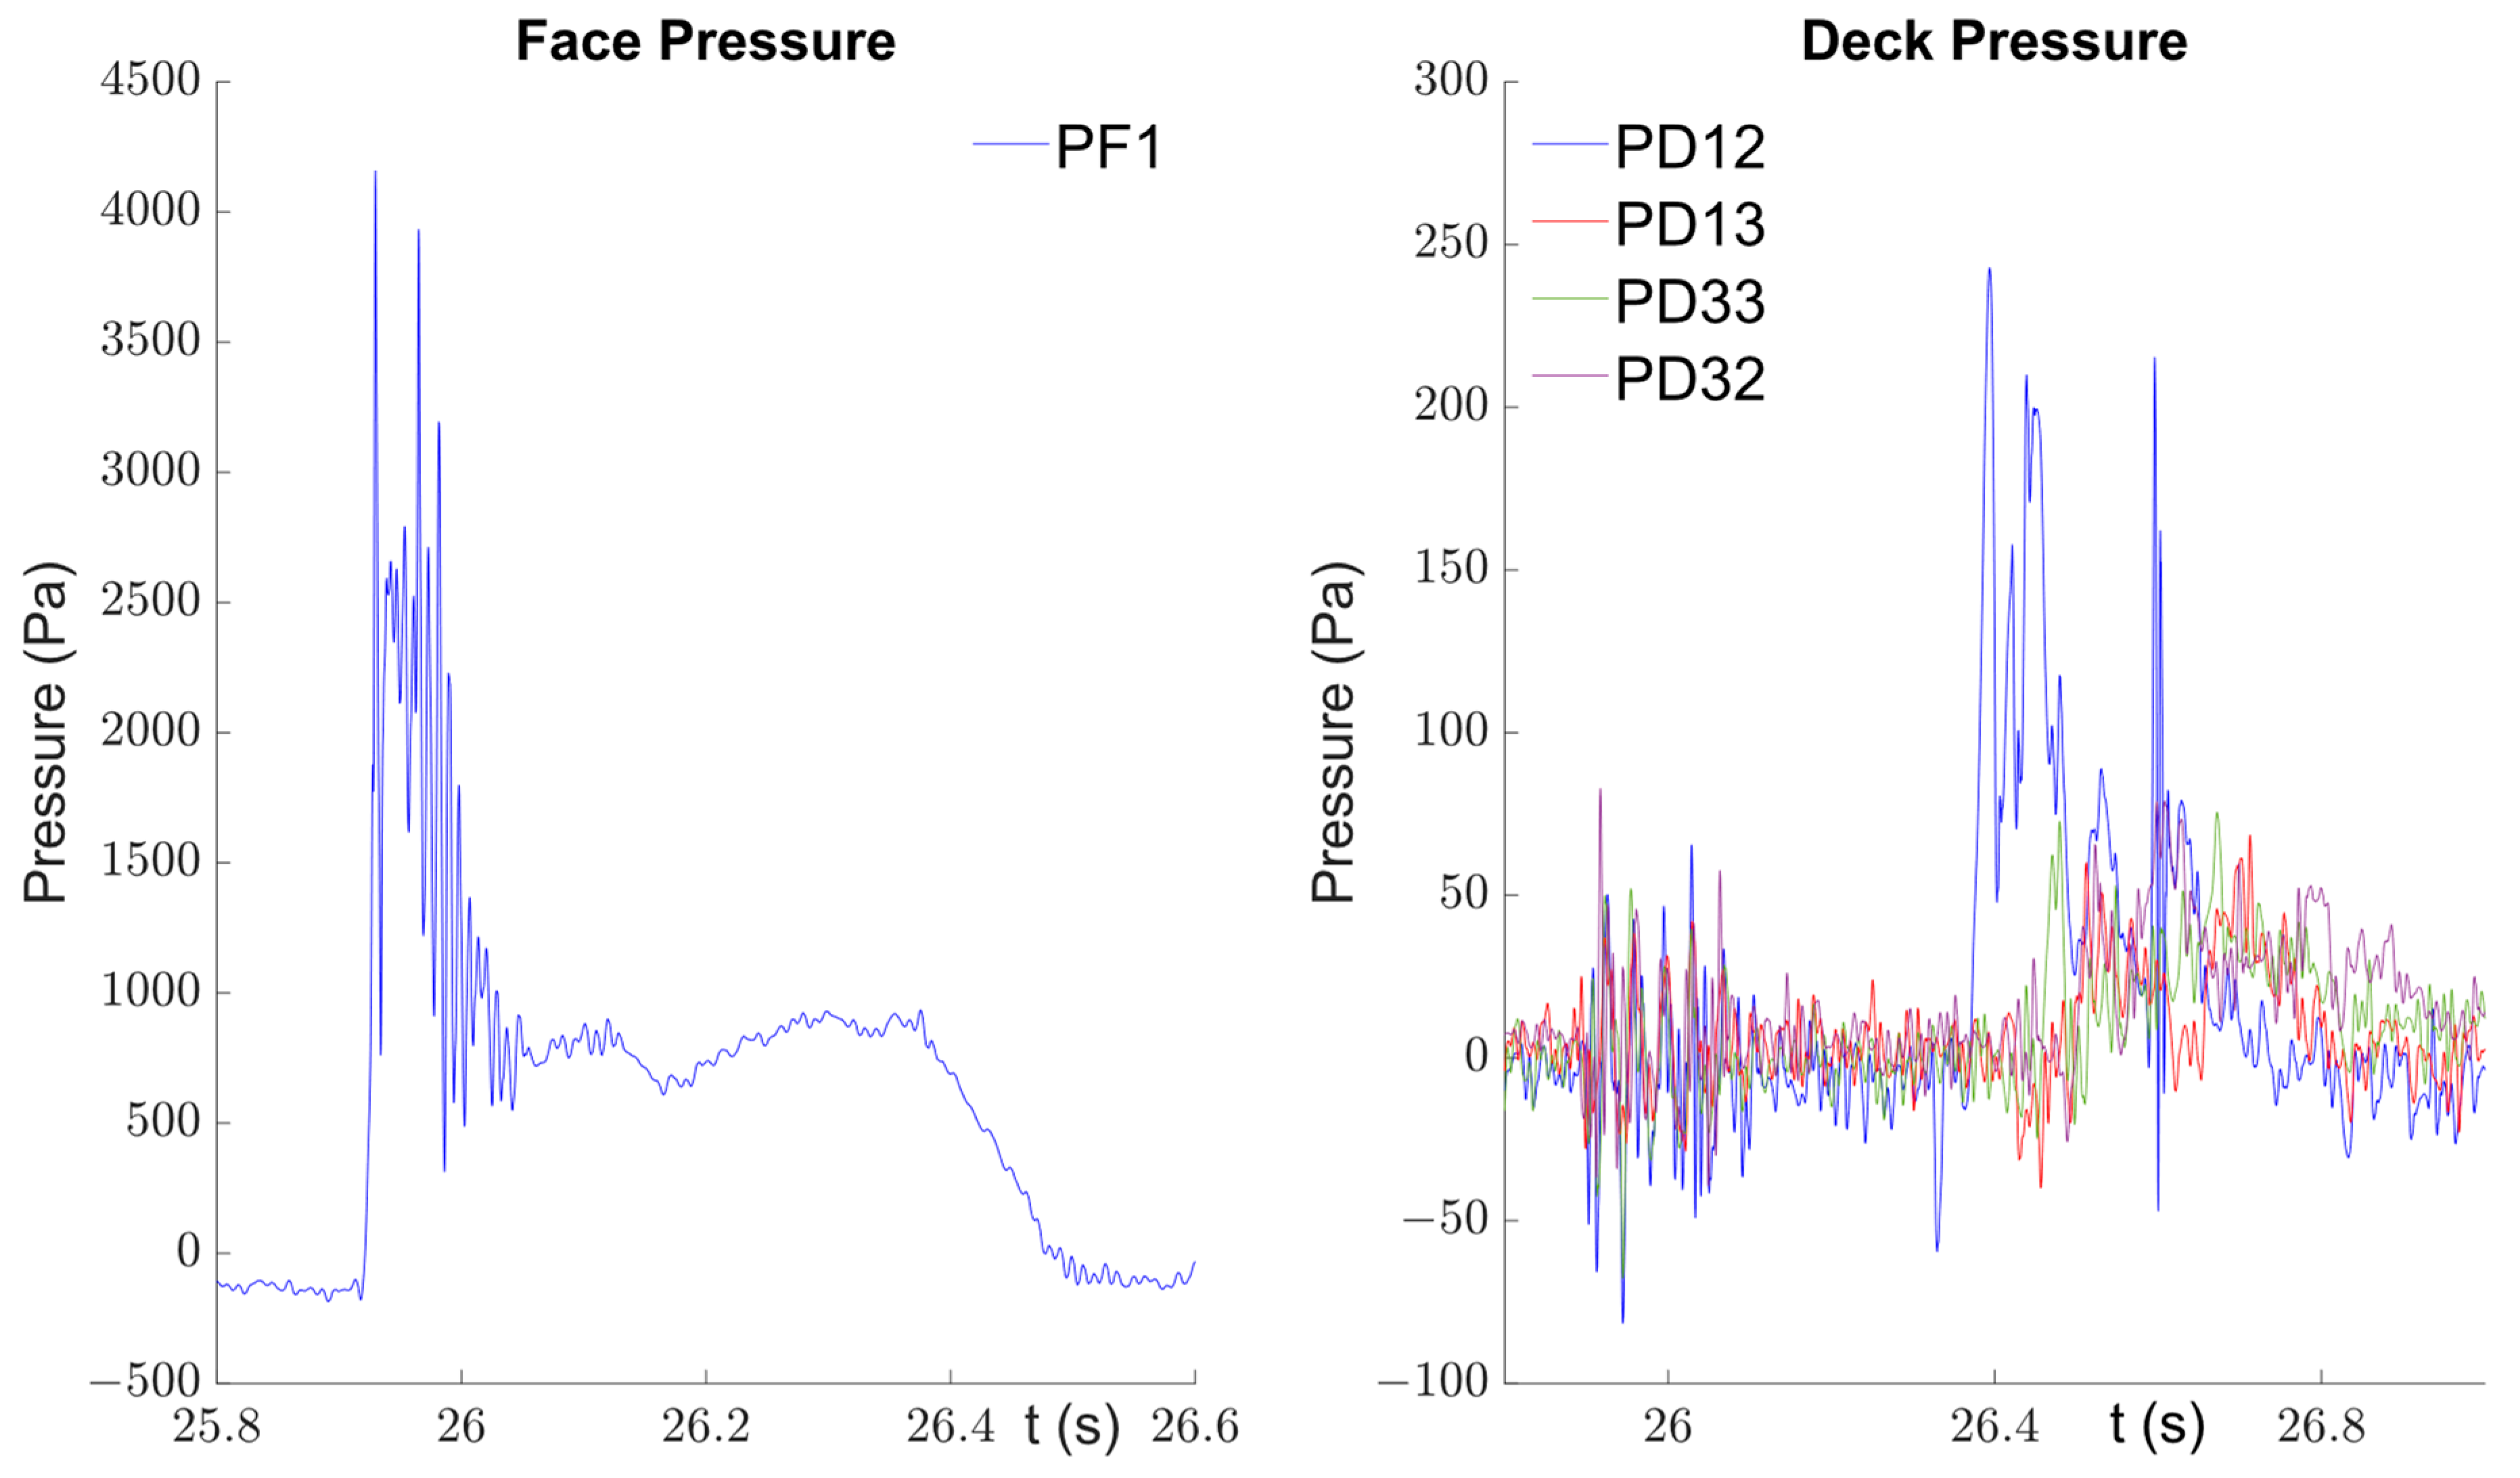
3.1.2. Characterisation of Individual Impact Events

As can be seen in the pressure–time histories, a range of different types of pressure profiles were recorded for each wave series. This means predictions of expected pressure profiles are difficult to make for a specific incident wave condition measured offshore. Some trends, however, were identified. Three representative pressure profiles that have been observed as repeating across multiple tests are shown in Figure 8, Figure 9 and Figure 10. The pressure–time plots have been isolated to show a single impact event with the face pressure profile and the deck pressures shown side by side. Analysing the profile characteristics can be used to indicate of the type of process being used. As mentioned previously, lower horizontal pressures and minimal overtopping were typically caused by the larger vertical pressures. Figure 8 shows the pressure profiles for one event for case H4T2, with the face pressures shown in the left plot and the deck pressures plotted on the right. The plots show the deck and face pressures over the same time interval, but the pressure scales are different. This was performed to be able to isolate particular characteristics of these typical downfall pressure–time profiles through direct comparison to the typical face impact pressure–time profile.
The characteristic cathedral-shaped profile for low-aerated waves observed by Bullock et al. [1] is clear in the face pressure. The maximum deck pressure of   2.75   k P a is approximately 1 / 3 of the face pressure of 9   k P a and measured at PD23 value. It occurred approximately 0.6   s after the peak impact on the front face. The duration of the dynamic impact time is approximately 200   m s , (rise time approximately 0.5 times the total impulse period). The spatial localisation can be clearly seen by the notably lower magnitude and shorter time scale of the measurements seen at PD13 and PD33.
In contrast, profile 2, taken from the same case, has a clearly different pressure–time profile for the deck impact (Figure 9). It is characterised by a low vertical impact ( 4.5   k P a ) associated with a subsequently larger horizontal impact ( 13   k P a ). The location of the deck impact was recorded in the second row (PD23) in this case, with minimal response in the probes in the third row. The dynamic impact time of the deck pressure is approximately 20   m s , the rise time here can be easily identified and is similar to the previously reported values at approximately 2   m s [15,16]. An oscillating response was recorded after the initial impulse. This was recorded for a range of impacts throughout the experiments with different values and durations. Again, these responses are similar to those reported by previous studies [52,53]. Both studies proposed that the recorded response could be explained by the entrainment within the aerated water of smaller air bubbles, despite the different applications investigated (wave impact pressures on the face of a vertical seawall [52], or slam wave loading on structures [53]). Following a similar approach, the higher frequency fluctuations in the pressure signal could be due to the impact of water droplets on the thin layer of standing green water on the top of the structure from previous overtopping. The impact of the droplets on the standing water would result in capillary wave generation, which tends to be characterised by high frequency, low amplitude waves, resulting in high frequency variations in pressure. It should be noted that the event, although having a large deck pressure, is less structurally significant as the impulse, defined as the multiplication of the force and the duration of impact, is small as the duration is short.
The final typical profile identified is shown in Figure 10. The typical characteristic of this deck pressure–time profile is the roughly equal corresponding peak deck and face impacts, 6.5   k P a for both in this case. This is associated with longer impulse durations in excess of 100   m s . For the example shown, the pressure probes surrounding the point of measured impact have profiles similar to Figure 9. The overall dynamic impulse duration of 250   m s is particularly notable. In general, for all cases, the timescale of the impulses is approximately 100 times the durations reported in previous work [15,16]. This could be explained by the relative locations on the structure of the pressure probes themselves. As has been indicated, the recorded pressures shown here are recorded on the third row (PD23) which is located at double the distance from the edge, in relation to wave height, than the furthest distance reported by Wolters et al. [15].
As has been mentioned, the pressure–time profiles discussed follow the idealised profiles proposed by Bullock et al. [1]. In particular, the low aerated wave profile is observed. This was confirmed by the visual observations of near-breaking wave types impacting the structure during the experiments. Overall, wave-by-wave time histories have been used in this work and are shown to provide some insight into the variation of the pressure loads on the seawall with each wave impact. However, no insight was gained that could be used to identify and propose a correlation between the type of deck event occurring and the incident wave conditions.

3.1.3. Deck Impact Pressure and Incident Wave Conditions

As mentioned previously, for the following sections, the pressures have been non-dimensionalised via Froude scaling using the wave height at WG1. Each impact is non- dimensionalised against the recorded wave height of the associated impacting wave. In this fashion, the effects of interaction between the reflected and incident waves are taken into account. Peak pressures also refer to the maximum pressure measured for each wave impact.
Typically, the focus of this type of experiment is on relating the offshore incident wave conditions. However, as has been mentioned in the previous section, this is not likely to be suitable in this case as there are gaps in the current knowledge and characterisation of these impacts, making identifying a correlation difficult. This is evidenced in previous work [15,16], where relationships between downfall pressures and the vertical impact forces were proposed. Notably, they differed significantly from each other, highlighting the issue. However, this was performed without focusing on wave-by-wave analysis. The maximum vertical pressures of every impacting wave were, therefore, plotted against the horizontal (deck) pressures associated with that impact, and separated by wave period, in order to verify if a correlation could be identified. An example for T2 is shown in Figure 11a–g, with results separated by wave heights (H1–H7) and coloured by deck probe position. The full procedure leading to this point, along with a complete set of plots, can be found in [47].
As is expected, following the observations of the significant variability of the pressure–time series, there is no obvious relationship or correlation between two associated impacts (face impact to deck). As H increases, a weak relationship of P d e c k / ρ g H and P f a c e / ρ g H could potentially be identified, with an increase in P d e c k p e a k / P f a c e m e a n from approximately 2 to approximately 20 . Additionally, no clear predictive relationship between the maximum recorded pressures and wave height can be identified. Throughout the dataset, the peak deck pressures, P d e c k , tended to be associated with relatively consistent values, in terms of magnitude, of P f a c e regardless of the incident wave height. However, the range of values did increase with the wave height.
Previous results of [15,16] placed the highest downfall pressure measurements on the deck at values ranging between 12 15   ρ g H s . In the results presented here, a systematic exceedance of this range was observed with peak deck pressures achieving values of approximately 40   ρ g H across multiple tests at a range of probe locations.
As no correlation exists, other parameters were considered. Looking at the locations on the deck (PD12-PD33) at which the maximum horizontal pressures are recorded, some interesting observations can be made, despite the substantial variability. The PD23 was associated with a significant number of these peaks, and although PD13 and PD33 were associated with fewer impacts, they still recorded a number of maxima. Notably, these locations correspond to the row of pressure probes located at twice the distance from the edge of the structure as the furthest locations reported in previous work, in proportion to wave height. They are also the furthest distance in these experiments. As explained in Section 2, this was deliberately performed to extend from previous experiments [15]. The further point of impact with the deck could explain the regular exceedance of the deck pressures reported herein compared to previous work. Additionally, it would indicate that the overtopping spray causing the largest horizontal pressures is also travelling furthest from the point of wave impact. This observation agrees with Bodaghkhani et al. [10] and Dehghani-Sanij et al. [11] who both suggested that naval vessels were at larger risk from the spray droplets that travelled the furthest without being picked up by the wind.

3.1.4. Further Characterisation of the Impacts

To further understand the processes involved in the experimental observations, the results were analysed in terms of two other parameters. The first is the impulse duration. This follows previous work by de Almeida and Hofland [21] who suggest that impulse is a more reliable approach to characterizing and predicting wave impacts. Similarly, this approach follows from the hypothesis that considering the system in terms of energy transformations will provide clearer insights into the processes involved. The second parameter considered was the distance from the edge of the seawall at which the deck impacts were recorded for each wave. This follows from the observations made in Section 3.1.3.

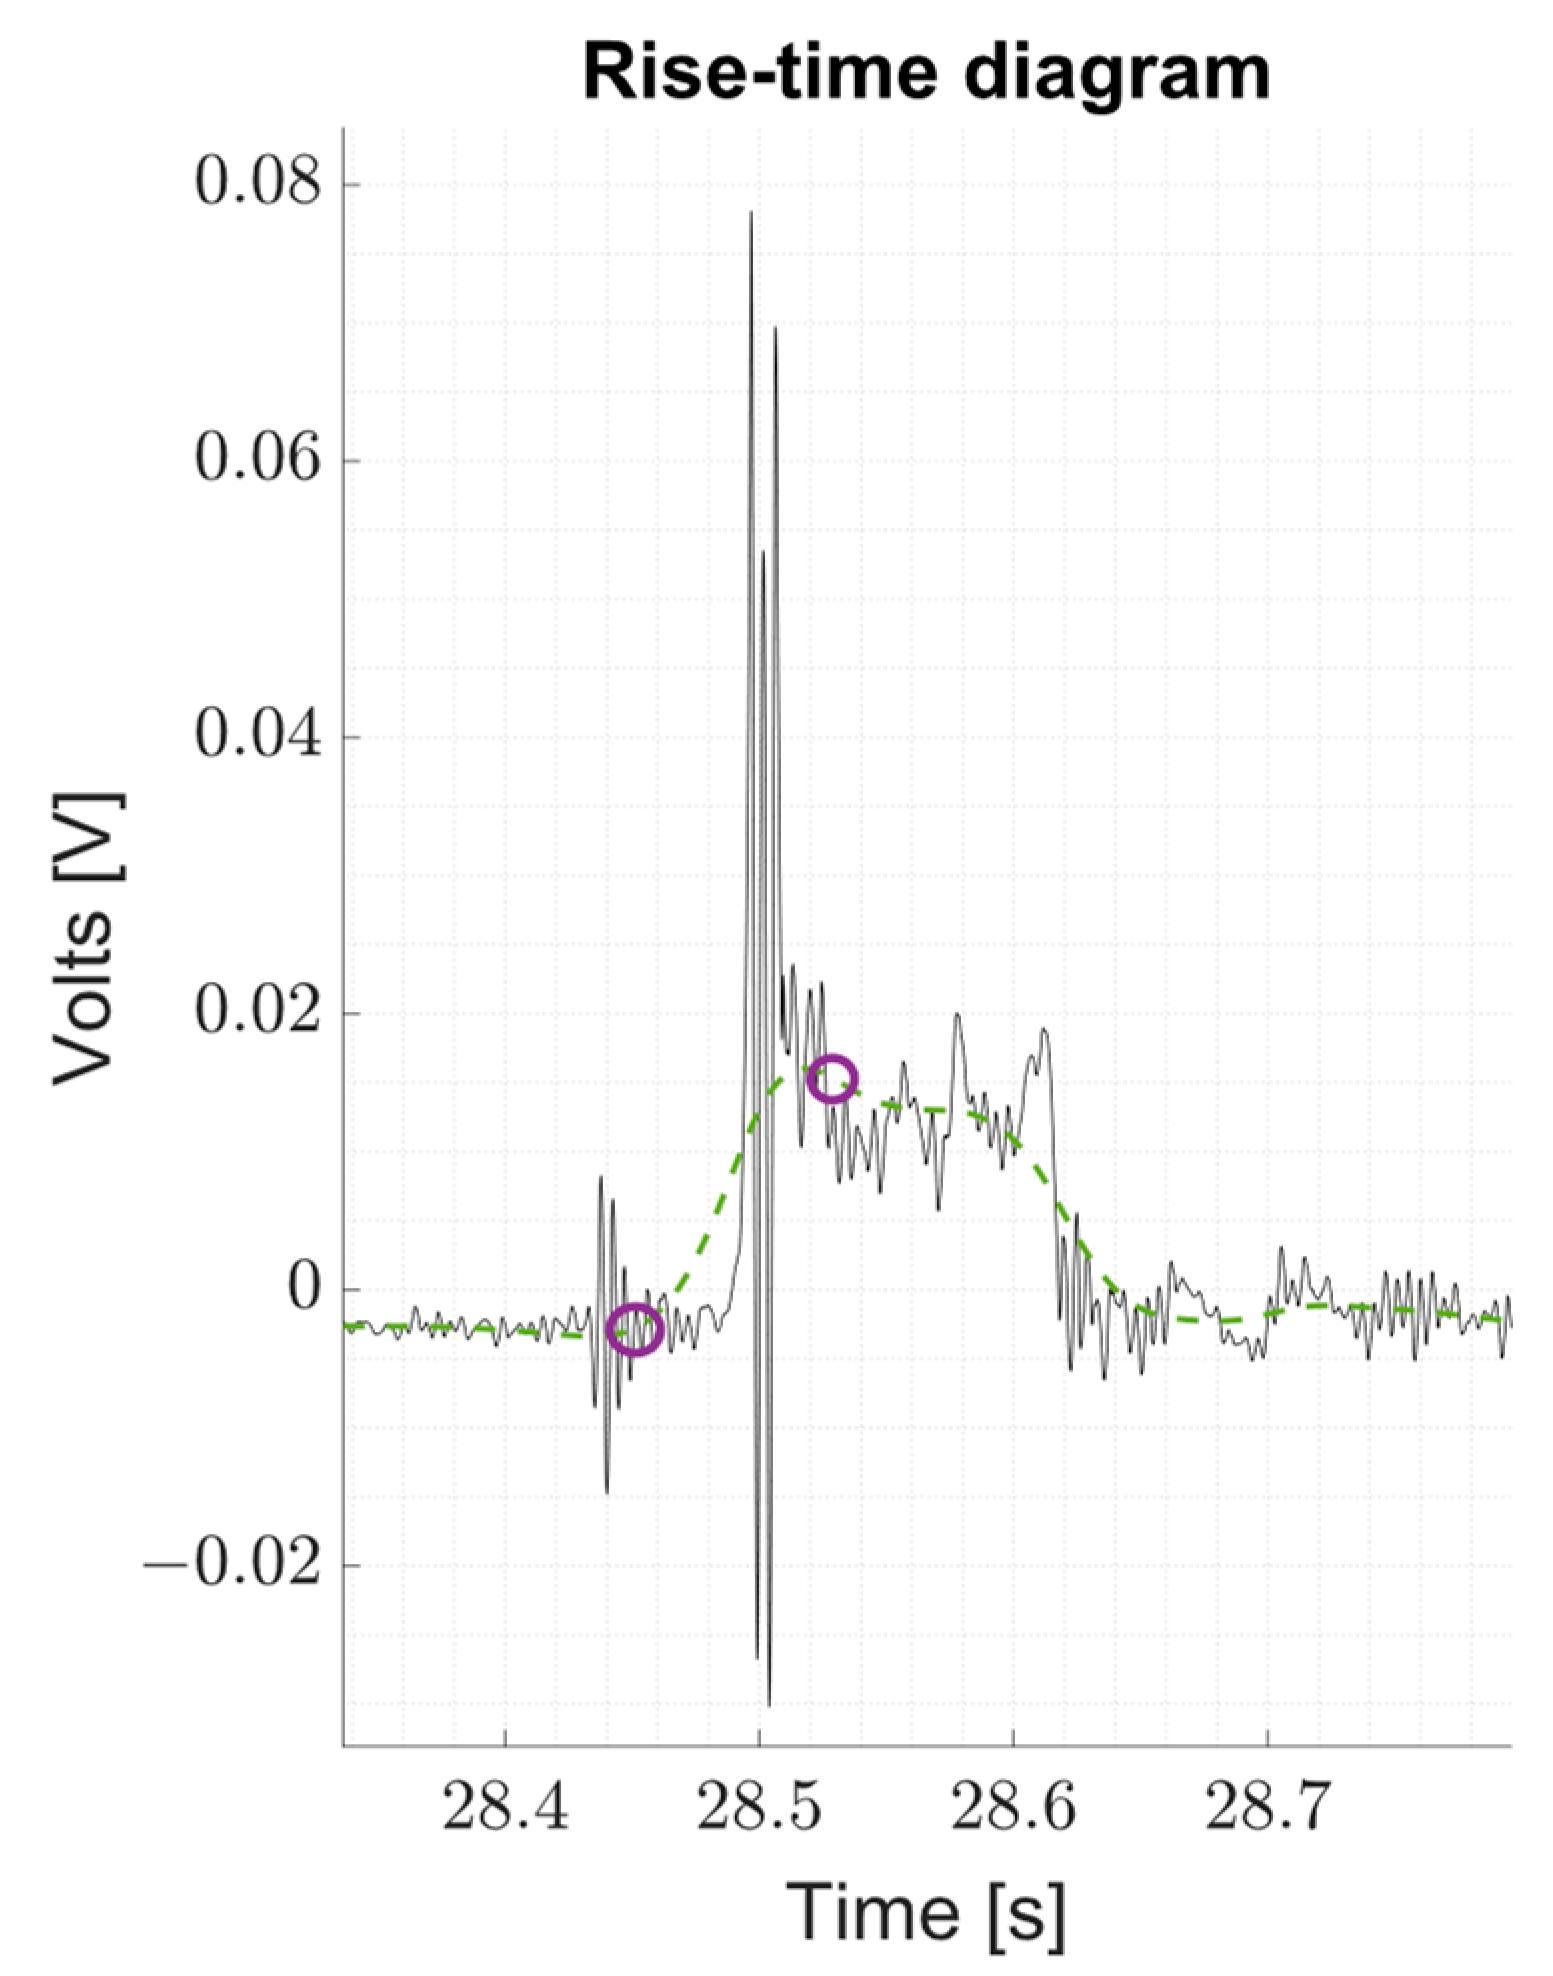
Relationship of Impact Times and Peak Pressures

As mentioned previously, due to the range of individual impact types, and associated pressure–time series, identifying the rise time of each impact in a uniform fashion presents a challenge. The method used herein follows the approach of de Almeida and Hofland [21] where instead of rise time, the dynamic impact time is measured. The dynamic impact time is defined as the duration of the impulsive portion of the wave impact. By using a low-pass FFT filter at 20   H z applied to the filtered pressure signal, the impulsive, more transient, part of the impact is removed. The dynamic impulse time is then calculated by finding the intercept between the original Wavelet filtered signal and the new filtered signal. Figure 12 shows an example of the procedure used, with the Wavelet filtered data, the FFT re-filtered plot, and the identified intercepts. The dynamic impulse times shown are all for the deck impacts and not the impacts on the front of the structure.
Figure 13 shows the dynamic impact time calculated for each wave impact event for the T4 period, plotted against the associated non-dimensionalised deck pressure. The plot indicates that the majority of the impacts had dynamic impulse times below 50   m s ; however, no clear predictive correlation between the value of the impact and the dynamic impulse times can be seen in the plot. The plot also does not indicate any direct correlation linking the wave height at WG1 (offshore) and the dynamic impulse times of the event. The dynamic impulse times measured here are significantly longer than previously reported by [15,16]. However, a direct comparison is hard to make as the exact methodology used by both experiments to measure the plotted time is not given.
In Figure 13, the longer dynamic impulse times ( > 50   m s ) typically relate only to lower deck impacts. This could indicate that the impacts with the longer, more quasi-static, impulse times, were likely dominated by hydro-static effects or green-water overtopping behaviour, resulting in lower deck impact pressures but also the longer duration as the overtopping fluid flows over the deck. Similarly, the higher deck impacts tend to be associated only with the more impulsive, more dynamic impacts ( < 50   m s ). From a design perspective, considering wave loading on the top of a coastal structure as a dynamic load case with associated structural response would be important to understanding the full implications of this analysis.

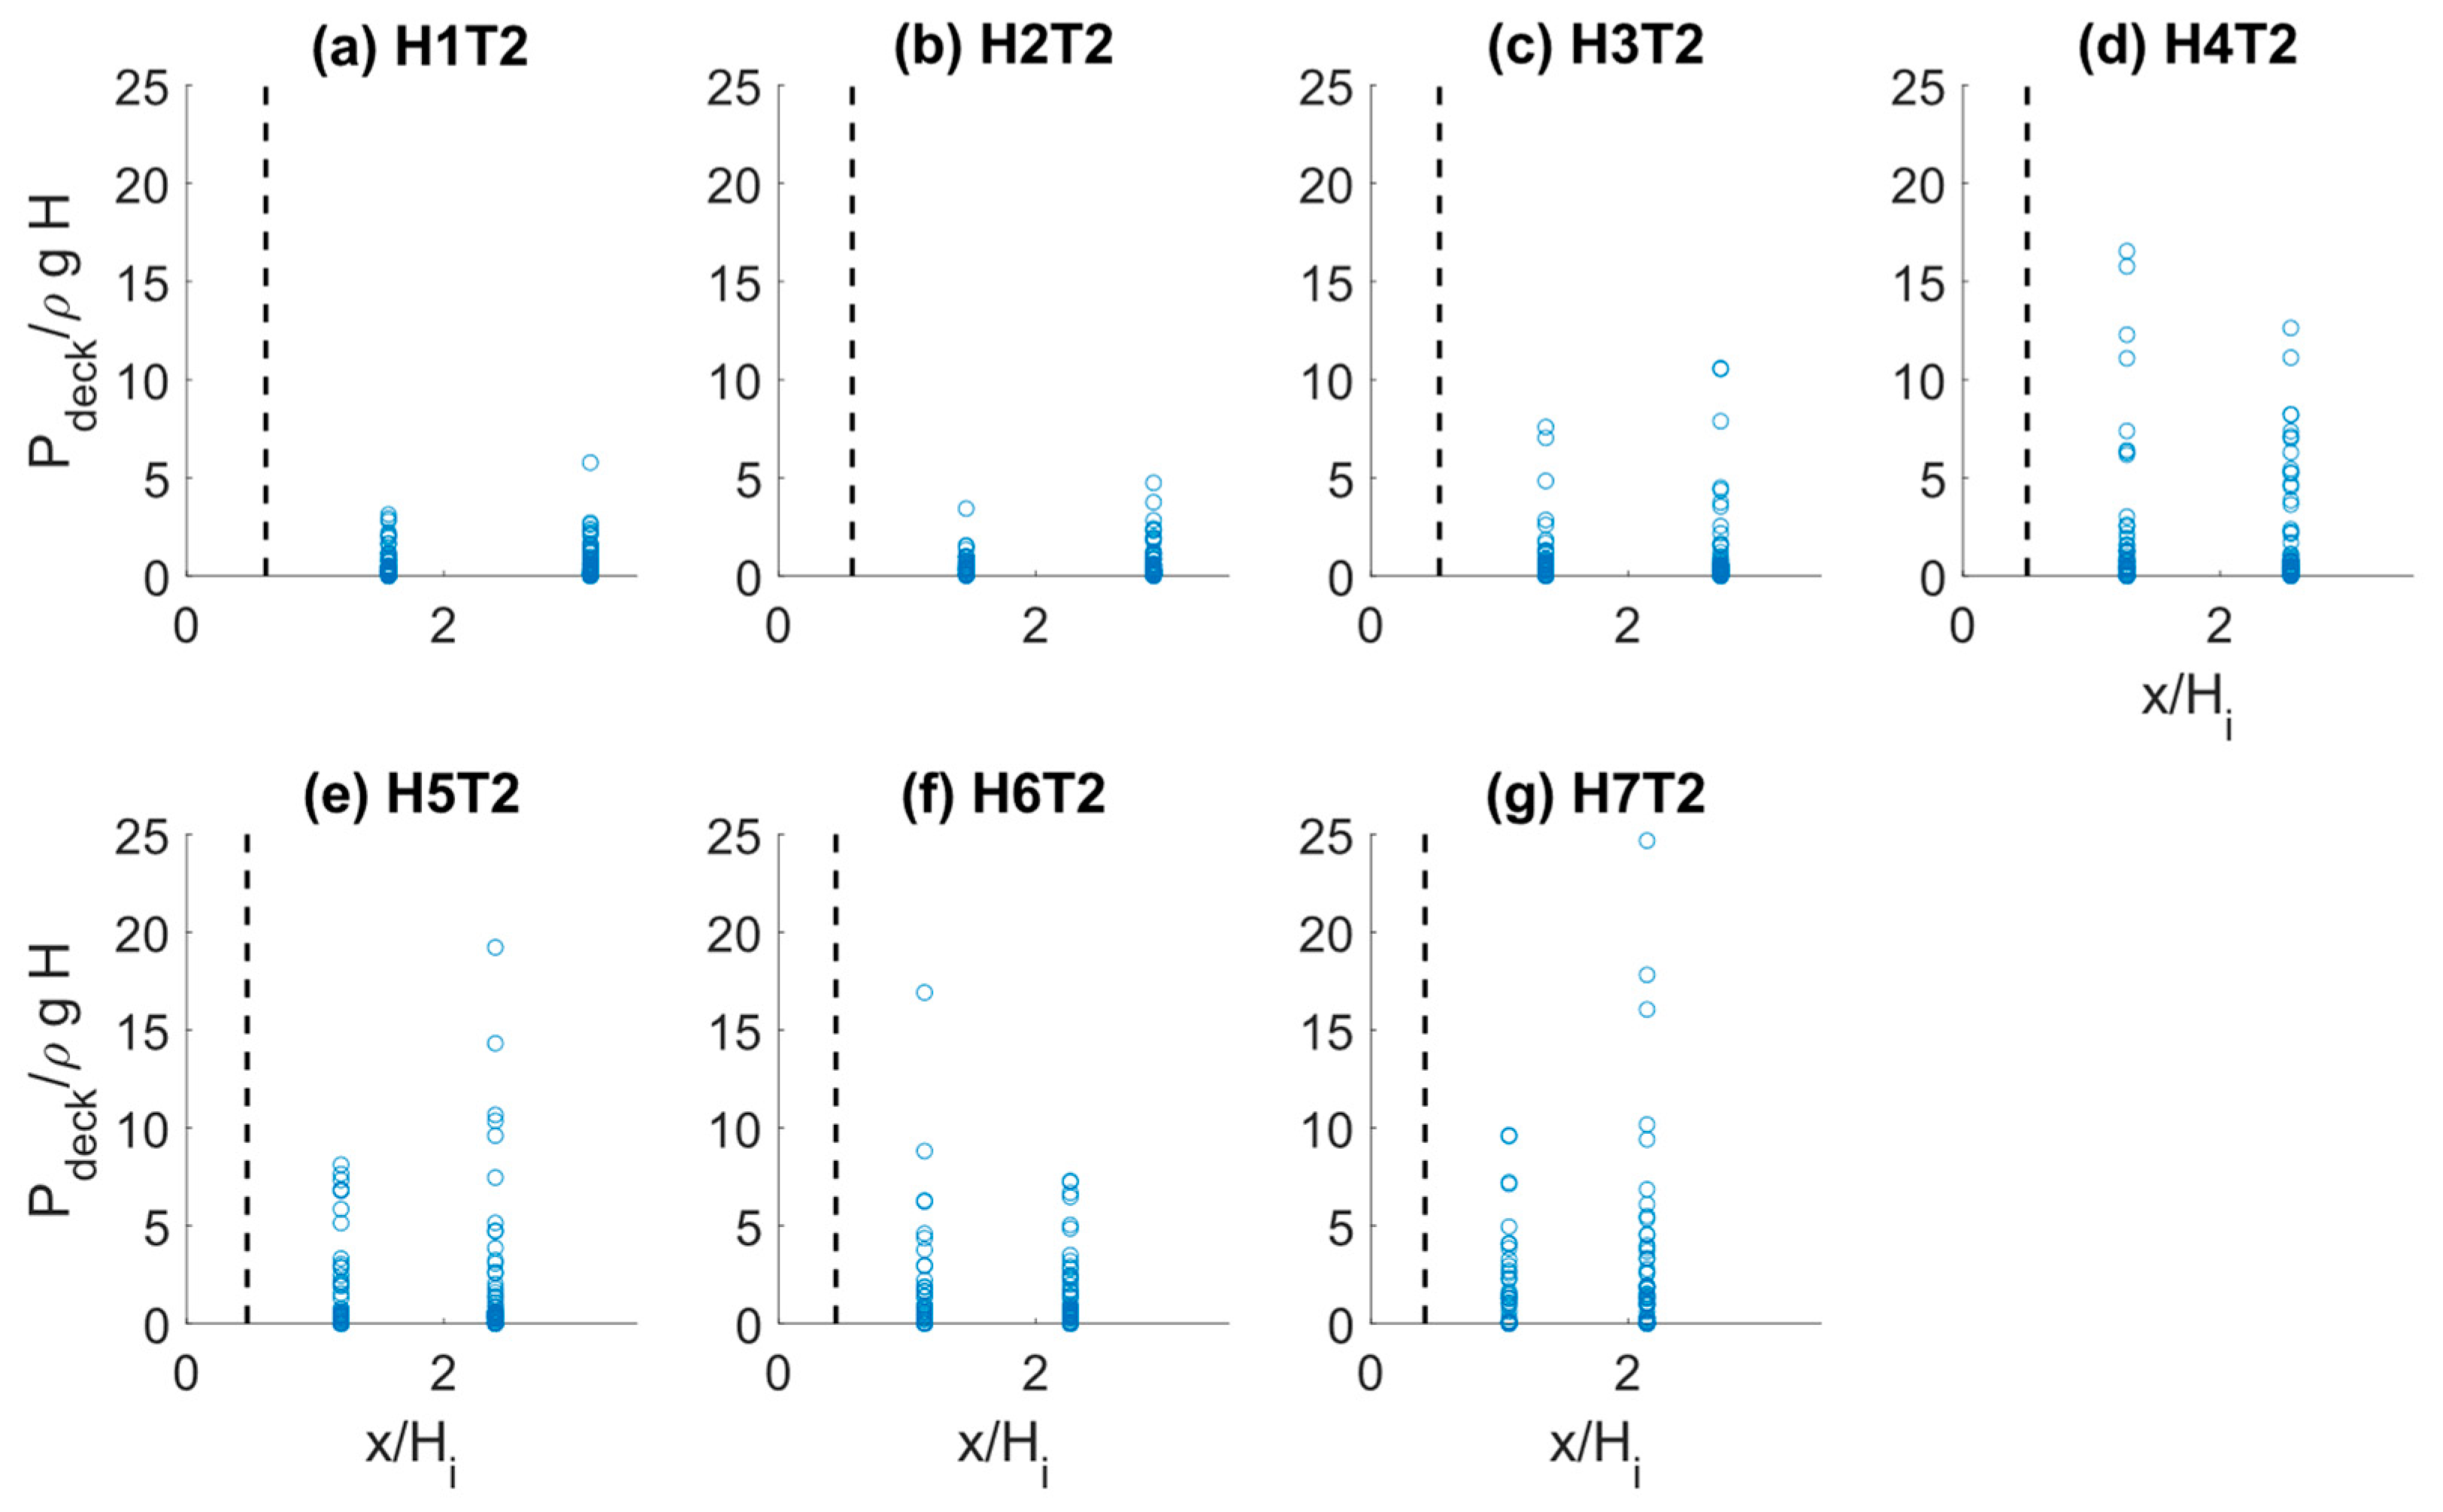
Spatial Distribution of Pressure on the Deck

Figure 14 plots the normalised deck pressures against the probe location, normalised by the wave height that was originally defined in Table 3, defined as H i . This was performed for convenience as the probe location did not change throughout the experiment. The plot shows all the recorded impacts, not just those with the highest deck impacts, as in Figure 11. The highest pressures are measured at different distances depending on the incident wave with (d) H4T2 and (f) H6T2 showing higher pressures at the closer position; (a) H1T2, (b) H2T2, (c) H3T2, (e) H5T2, and (g) H7T2 showed higher pressures at the further position. Similarly, there is no significant difference in the number of impacts measured at each location. This trend replicates throughout all 4 wave periods used in the analysis. As has been highlighted in Section 3.1.3, the furthest location plotted in Figure 14 is further from the seawall edge than previously reported by [15,16], as they only measured waves up to 1.2   H s from the edge of the seawall.
These results reinforce the hypothesis that significant impacts are measured at larger distances from the coastal defences than has been previously reported in the literature [15,16]. The distances reported here are not unexpected as EurOtop also states that 90% of the overtopping white-water from impulsive waves land 0.2   L from the edge of the seawall. However, the presented results differ from current design guidance which typically ignores downfall pressures at these distances [3].

3.2. Focused Waves

Each focused wave group was repeated five times with repetitions 1 to 5 denoted as R1 to R5. Each repetition is expected to result in similar recorded measurements due to the high repeatability of focused waves. Figure 15 shows the free-surface elevations superimposed for all repetitions of FG1 measured at WG1. It can be clearly seen that the focused groups had high repeatability and maintained consistency.
The plots discussed in this section are all from results for focused waves FG1 and FG3, all additional results can be found in Baines (2020) [47]. Due to a failure of some of the pressure probes on the face of the structure while conducting these experiments, only the results from a single face pressure probe are shown. The middle three focused group runs were isolated and their results were plotted superimposed on each other; these are denoted as runs R2, R3, and R4. The aim of the superposition is to try to quantify the degree of similarity and identify the variations in the results for each repetition. As focused waves are highly repeatable, investigating potential variability can highlight aspects that change independent of the incident wave form. Vertical impact pressures for PF1 only are shown in Figure 16 with the horizontal pressures given in Figure 17 as follows: PD12 in Figure 17a, PD13 in Figure 17b, PD32 in Figure 17c, and PD33 in Figure 17d.
Relative to the face pressures shown in Figure 16, the measured deck pressure is insignificant, ranging from 500   P a to 500   P a . This deviates significantly from the regular wave experiments. Like the regular wave experiments of wave height H2, FG3 is generated with a peak wave height of 0.07   m . However, the pressures recorded on the deck are lower by an order of magnitude. A drop in magnitude was expected as the peak wave height, H p , used in the experiments, does not correspond to the significant wave height, H s , derived from the irregular wave series and instead corresponds to a lower H s . However, a change in the order of 10 20 times cannot be explained by this.
A similar trend can be observed for each impact, although R4 has a higher dynamic impulse peak value than R2 and R3. Table 5 shows the vertical, P f a c e , and horizontal, P d e c k , pressure values for the peak wave for R1–R5 of FG3; also included are the standard deviation and mean. There is some variation in the measured values, σ = 23 %   of the mean, μ , despite the clear repeatability of the wave train shown in Figure 15. Although focused waves are highly repeatable, the reflections from the structure will create some interference due to the reflection of the peak wave in the group. The aim of using the focused group is to limit these effects prior to the peak wave impacting the structure, the results shown indicate that it has been achieved.
The variability in the pressures seen after the peak event further supports the supposition that the energy dissipated by the impact with the seawall varies even for similar incident wave profiles. Additionally, it should be noted that the deck pressures show a higher degree of variability with σ = 30 50 % of the mean, μ . However, the lowest deck pressure occurred when the highest face pressure was measured, further supporting the energy dissipation explanation. The wider range of deck pressures supports the previously stated hypothesis that exact effects of the spray impacts after initial impact with the front of the seawall is stochastic and not directly related to the impact on the front of the structure, making it hard to predict. As previously stated, there is an order of magnitude difference even with the smaller pressures measured in the regular waves. This will be discussed further at the end of this section.
As with the regular waves, the impact events were isolated with face and deck impacts plotted side-by-side for comparison. The face and deck impact pressures are shown in Figure 18, Figure 19 and Figure 20. These are the same waves plotted in Figure 16 and Figure 17 as there is only one impact per focused group. With the waves having already broken before reaching the structure, the front face impacts clearly show the typical cathedral-shape time-trace and are near identical to the regular wave experiments in all three cases. The dynamic impact times of the events show noticeable variations between the three plots, whereas the peak deck pressures have similar magnitudes of around 250   P a (Table 6).
The first case (Figure 18) has a dynamic impact time for the deck pressure of 240   m s and has a decay shape following the trend seen in the face impact without the quasi-static part. At 0.3   s after the principal impact, a secondary impact can be seen on the plot. It is possible that the secondary impact is a result of water impacting the sides of the flume before impacting the deck, but it could not be verified from video footage.
The third event (Figure 20) follows a similar trend to Figure 19 in that the deck impact reaches peak value rapidly ( < 50   m s ), it has a shorter dynamic impact time of 120   m s . The similar overall impact duration with a higher peak means it poses a higher risk to structures due to the resulting higher impulse value, even though it appears to be a shorter, more instantaneous event.
The second event (Figure 19) has a dynamic impact time of 200   m s . Unlike the previous example, the peak value is achieved almost instantaneously and then decays. Although this was caused by spray droplets impinging on the deck, it does show a similar trend to the highly aerated face impacts of Bullock et al. [1].
Generally, the vertical impacts tend to have the cathedral-like time-trace. However, as with the regular waves, the horizontal impacts on the deck present a much broader set of time histories. Whilst the duration of the impacts on the deck in the focused wave cases were highly variable, the dynamic impact times are generally shorter than those reported in the regular wave cases.
The focused wave groups did not produce the downfall pressures as recorded for the regular wave cases with the wave height equivalent to the wave height at the peak frequency of the focused waves. To understand why this was the case, inspection of the video images similar to that shown in Figure 2 was repeated post-experiment for the focused waves. Figure 21 shows the stages of the peak wave of the focussed wave group FG1 as it breaks and then impacts the structure. The stages of spray formation, as defined previously, are also captured. Unlike the regular waves that were typically impacting as steepened, spilling waves, the wave shown in the figures forms a plunging breaker at the focal point above the beach toe (Figure 21a,b). This results in the fluid (Figure 21c) that is noticeably more aerated impacting the structure. This can be seen in the whiter less transparent uprushing fluid in the sheet formation stage shown in Figure 21d where the breaking process has clearly dissipated some of the wave energy. Correspondingly, the maximum height of the uprushing fluid prior to sheet breakup and droplet formation (Figure 21e,f) is also lower than the images shown for the regular waves in Figure 2.
The wave-breaking process results in significant dissipation of the incident wave energy due to the turbulent losses. This results in slower peak particle velocities which would account for the lower maximum height. Similarly, the loss of energy to the breaking process means that there is less energy in the wave when impacting the structure. The combination of these effects would account for the reduction in the spray generation and subsequent impact pressures.

4. Discussion and Limitations

Infrastructure built near the coastline is at an increasing risk of extreme overtopping events resulting in spray-dominated overtopping events. While previous research has focused on green-water overtopping, there has been limited research focusing on the effects of spray-dominated overtopping. As a result, existing design guidelines do not consider this type of overtopping, particularly in terms of structural loading from the spray impacts. The existing research focusing on quantifying these impact forces is limited and, therefore, further investigation is needed to inform design guidelines. To help address this knowledge gap and provide more data and insights into these spray-dominated overtopping events, a set of experiments at a 1:38 scale was conducted. Although the number of tests conducted is insufficient to determine a predictive equation, the additional insights gained are valuable.

4.1. Limitations

4.1.1. Implications of Scale Effects on the Reported Deck Pressures

As with any experimental program conducted in a wave flume, there are limitations due to methodological choices and restrictions, as well as the idealisations and simplifications of the system compared to reality. The key limitation in the work presented here comes from scale effects, due to the choice of scaling approach and the medium scale used. As has been discussed in Section 2, the experimental set up was designed based on conserving geometric properties through the Froude scaling law. This implies that certain aspects of the hydrodynamics and flow characteristics will not be conserved at full-scale. The experiments discussed here use near-breaking, steep waves that entrain large pockets of air during impact with the structure. Subsequently, the post-impact fluid is aerated with smaller air pockets. As a general rule, it is considered that the air pocket entrained prior to impact will cushion the impacts, reducing the maximum pressure [23,27]. Alternatively, the compression of the air could result in pressure waves impinging on the structure, this has been primarily observed in the context of cracks within a coastal structure by De Finis et al. and Wolters and Müller [54,55]. As a result, improper scaling of the air bubbles and air entrainment percentages can result in errors in pressure measurements reported. It should, however, be noted that the post-impact fluid phenomena are likely to be minimally affected by improper aeration scaling issues as, once sheet breakup occurs, the distinction is between green-water and white-water overtopping. Green water can be effectively compared to a low-aerated flow, dominated by hydrostatics whereas white water is comparable to “water droplets entrained in air” as the volume fraction of water to air is small. Therefore, it should be noted that the choice of Froude scaling for the work presented here will likely have resulted in an overprediction of the vertical face pressures reported in Section 3. However, the primary focus of the experiments presented here is not the vertical face pressures but the subsequent downfall pressures after the impact on the vertical face. Therefore, the phenomena being considered are likely to scale in terms of hydrodynamic characteristics, even if the forces recorded required careful analysis and consideration before extrapolation to full scale. The comparison analysis presented by Bullock and Bredmose [27] only considered the impact on the vertical wall, and, therefore, the applicability of the B–M scaling law is untested for post-impact, downfall pressures due to spray-dominated overtopping events.
For completeness, and to illustrate how the B–M scaling law would apply to the downfall pressures reported in this paper, a selection of values corresponding to the top 2 values for each wave height for period T2, were rescaled using the B–M scaling law (see Figure 11 for the reported results). The rescaling was only performed for a limited dataset due to the significant challenges associated with this process. The equations given by Bredmose et al. [23] require an estimation of a reference velocity, u 0 , and a scale-independent factor C . However, no method is given on how to determine these parameters. Therefore, the rescaling was performed using the graphical method and graph given in Bullock and Bredmose [27], and, therefore, only a selection was used. As expected, due to the low values of the impacts measured at model scale, this results in prototype pressures 3 5 times lower than if rescaled using Froude scaling. When scaling up the maximum recorded face impact pressure for H4T2, for example, the Froude scaling law gives the top 2 pressures as 489   k P a and 349.5   k P a , whereas applying the B–M scaling law gives 120   k P a and 75   k P a , respectively. These values are estimates due to the graphical approach used; however, it clearly shows an overprediction of 4 times using Froude scaling, if the B–M scale law is taken as correct. Due to the limited applications of this scaling law currently in the literature, more data and analysis specifically investigating this issue is required before a clear conclusion can be drawn. Nevertheless, it is evident that the potential error from scale effects cannot be ignored. However, this does not detract from the conclusion of the experiments presented, that there are significant pressures involved in these events that should be considered which is corroborated by observations from real events, such as the Dawlish Seawall failure discussed in the introduction [4]. The scaling law was only applied to face pressures as the entrained air bubbles cushioning effect is not relevant in the downfall impacts where large packets of non-aerated fluid impinge on the surface.
Additionally, Bullock and Bredmose [27] observed that although the maximum impact measured at medium scale was higher than the field measurements, two factors should be noted. The first is that the experiments are designed to create the most extreme impacts and, therefore, could exceed field measurements in part due to them being simply larger and more violent events. The second observation was that the impulse duration of the impacts was notably shorter. This would potentially indicate that the difference in the observed physics between the medium scale and full-scale events is linked to a difference in the response to the momentum flux of the incoming waves. Therefore, analysing both impulse duration and maximum pressures together would potentially provide a more holistic and accurate method to address the issues in the scale effects. This observation would also imply that the energy from the wave dissipated during the impact in the medium scale experiments is similar to the total energy dissipated during the impacts in the full-scale cases. This is significant to the work presented here, as the post-impact behaviour is what the experiments aimed to quantify and analyse. Therefore, although there are some significant outstanding questions regarding the limitations in the scalability of the vertical face pressures, the recorded deck pressures are less affected by this scale effect error. Further analysis of a range of datasets at different scales measuring the deck impacts, similar to that already carried out for face pressures, would be needed in order to assess the exact nature of the error due to aeration effects.
From the dynamic impact times presented in Section 3, the highest impact pressures recorded are associated with dynamic impact durations that are structurally significant even for the shortest durations. Following the conclusions of Bullock and Bredmose [27], if the dynamic impulse durations are increased, the conclusions drawn in the present paper, that the impacts should be included and considered in the design of nearshore infrastructure, would still hold even if the specific impact pressure magnitudes are assumed to be overpredictions.
Additionally, if the vertical face impacts measured in the medium scale experiments discussed here are significantly overpredicted compared to the full-scale values, this would imply that more energy has been dissipated from the incident wave during the impact than would be expected at full-scale. This would in turn imply that the associated downfall pressures would necessarily be underpredicted as the reduction in available energy in the fluid post-impact would result in a reduction in the uprush velocity, peak height of the sheet and, thus, droplets, and, therefore, less kinetic energy in the droplets on impact with the deck. It should also be noted that EurOtop (2018) indicates that although overtopping volumes are likely slightly overpredicted at medium scale, throw velocities post-impact scale up well between medium- and large-scale tests. This would indicate that any errors in the scaling of the kinetic energy in the spray generated by breaking wave impacts would come from improper scaling of the droplet sizes, as this impacts on the mass of the spray droplets and total volume of the spray plume. Therefore, further investigation of the droplet sizes would be required to fully quantify this error. However, given the expected droplet sizes, it is reasonable to infer that the kinetic energy is dominated by the velocity term in the kinetic energy equation instead of the mass of the moving fluid, unlike for green water overtopping flows.

4.1.2. Implications of Improper Weber Scaling

As previously mentioned, the characteristics of the overtopping flow such as the droplet size would not be suitable for extrapolation to full-scale conditions due to the improper Weber scaling and will, therefore, not be discussed in this paper. However, previous analysis of spray-dominated overtopping in terms of energy transformation has indicated that the post-impact behaviour can be decomposed almost entirely into kinetic and potential energy terms [51]. This would indicate that non-conservation of surface tension effects is likely to have minimal effect on the accuracy of the pressures measured of the droplet impacts in the present experiments when extrapolated to full scale. This is further supported by the experiments of Horriche et al. [56] who demonstrated that, similar to the conclusions of previous work, impact forces, impulses, and pressures are Weber scale independent for W e 60 . In the experiments presented here, this would correlate to impact from droplets of size D 4   m m . From the work of Bodaghkhani et al. [57] and the video analysis of the experiments presented here, it is considered highly probable that the high deck pressures presented in Section 3 are linked to significantly larger droplets of sizes D 10   m m , and, therefore, associated with much larger Weber numbers. This conclusion is also supported by the EurOtop manual’s analysis that “fine spray” is not associated with significant impacts. Therefore, although the authors are aware that the exact droplet distribution and trajectory measured in the experiments discussed here cannot be extrapolated accurately to full-scale, the impacts recorded are likely not notably affected by the improper Weber scaling of the experiments. It should be noted that the droplet sizes for the experiment were not measured to high accuracy but extrapolated from images such as those shown in Figure 2. Therefore, more detailed particle tracking would be recommended in any future experiments investigating these phenomena to exactly quantify the droplet sizes.

4.2. Design Implications and Recommendations for Further Study

Civil engineering design codes [5,6,7] do not currently account for the downfall pressures due to spray-dominated overtopping. The results from these experiments show that the spray-dominated downfall impact pressures are larger and extend further behind the impact point than previously reported. The results presented do not follow either of the previously proposed equations, and no obvious trend could be identified for use in design. Due to the limited size of the dataset as well as uncertainties around quantifying scale effects, further data, from field measurements, large scale experiments and other experimental and numerical sources is required before a predictive equation can be proposed.
Further investigation into these phenomena is also needed to fully capture the spatial distribution of the impacts, as the experiments presented here have a limited set of discrete locations at which these pressures could be recorded due to the nature of the pressure probes used. Numerical models, and novel experimental techniques are needed to fully address this issue. Additionally, the use of high-speed cameras to capture in more detail the hydrodynamic phenomena resulting in the different impact types would enable a more in-depth understanding of the observations presented here. One element of particular interest would be capturing the development of the flow formation on top of the structure during the overtopping event to confirm the presence of the capillary waves, proposed in this paper, formed after impact. In the present work, combining visual observations during testing with the recorded pressure–time histories indicated that an alternative analysis route, where energy in the system and energy transformations during the wave impact and downfall process, could yield a more reliable predictive relationship. The recommended use of high-speed imagery could further investigate this approach.
Nevertheless, these initial results already suggest that there are multiple implications for design. A major feature of the presented experiments was the increased relative distance from the edge of the structure at which relatively high pressures have been recorded. With significant impacts measured 2.5   H from the edge of the seawall, this has clear implications for existing coastal communities where critical infrastructure could potentially be located within this distance. Based on the current findings, structures immediately landward of vertical seawalls need to be designed to withstand downfall impact pressures on the order of 30 40   ρ g H . As the frequency and intensity of storms increase both offshore and at the coast, more instances of damaging downfall impact pressures from spray-dominated overtopping are likely. It is, therefore, imperative that the design of coastal structures accounts for downfall impact pressures, either by retrofitting/protecting existing structures, or using appropriate precautionary designs for new structures.

5. Conclusions

This paper has presented the first experimental investigation of wave-by-wave downfall impact pressures due to spray-dominated overtopping of a coastal structure conducted at medium scale. The experiments investigated both breaking regular waves and focused waves impacting the vertical wall of the structure. The experiments showed typical sheet formation and sheet breakup with the uprush of fluid followed by droplet breakup and droplet dispersion as the spray travels downward towards the deck. The Wavelet Filter, used for the first time in this context, denoises the signal without losing wave peak impact pressures or phase shift, demonstrating its key advantages for wave impact investigations. This enabled significant wave downfall impact pressures on the order of 30 40   ρ g H to be observed. The analysis of the full pressure–time histories of each experiment clearly showed the lack of a relationship between the vertical impact force on the face of the structure and the subsequent downfall pressures. This highlights the fact that there are gaps in the characterisation of the spray dominated overtopping process. As a result, the wave-by-wave analysis gave no clear relationship between the face impact pressure and the downfall impact pressures. A larger dataset is needed to confirm this conclusion, which will be the focus of future investigations. Three distinct downfall impact histories for regular waves were identified and presented, while less distinct impacts of a much lower magnitude were identified for focused waves, likely due to the differences in wave breaking processes. These observations combined would suggest that the system should be considered from an energy transformation perspective, as energy dissipated in breaking and impacts with the seawall face could account for the variability in deck pressures recorded.
Nevertheless, the experiments reveal that design of coastal structures needs to take into account spray downfall impact pressures. In particular, this consideration needs to be applied to structures located a significant distance further from the coastal defences than is currently considered in standard practice, as the results presented clearly showed the impacts being recorded significantly further from the edge of the seawall than has been previously reported in literature.

Author Contributions

Conceptualization, A.B.; methodology, A.B. and L.S.C.; data curation, A.B.; writing—original draft preparation, A.B.; writing—review and editing, L.S.C. and B.D.R.; visualization, A.B.; supervision, L.S.C. and B.D.R.; funding acquisition, L.S.C. and B.D.R. All authors have read and agreed to the published version of the manuscript.

Funding

The authors wish to thank the EPSRC Grant 1643722 and The University of Manchester’s Research Impact Scholarship for supporting and funding this research.

Institutional Review Board Statement

Not applicable.

Informed Consent Statement

Not applicable.

Data Availability Statement

Some or all data, models, or code that support the findings of this study are available from the corresponding author upon reasonable request.

Conflicts of Interest

The authors declare no conflicts of interest. The funders had no role in the design of the study; in the collection, analyses, or interpretation of data; in the writing of the manuscript; or in the decision to publish the results.

References

  1. Bullock, G.N.; Obhrai, C.; Peregrine, D.H.; Bredmose, H. Violent Breaking Wave Impacts. Part 1: Results from Large-Scale Regular Wave Tests on Vertical and Sloping Walls. Coast. Eng. 2007, 54, 602–617. [Google Scholar] [CrossRef]
  2. Ravindar, R.; Sriram, V. Impact Pressure and Forces on a Vertical Wall with Different Types of Parapet. J. Waterw. Port Coast. Ocean. Eng. 2021, 147, 04021007. [Google Scholar] [CrossRef]
  3. van der Meer, J.W.; Allsop, W.; Bruce, T.; De Rouck, J.; Kortenhaus, A.; Pullen, T.; Zanuttigh, B.; Schuttrumpf, H.; Troch, P. EurOtop-Manual on Wave Overtopping of Sea Defences and Related Structures. An Overtopping Manual Largely Based on European Research, but for Worldwide Application. 2018. Available online: https://www.overtopping-manual.com/assets/downloads/EurOtop_II_2018_Final_version.pdf (accessed on 18 November 2024).
  4. BBC Dawlish’s Storm-Damaged Railway Line Reopens. Available online: https://www.bbc.co.uk/news/uk-england-devon-26874503 (accessed on 22 June 2021).
  5. The British Standards Institution. BS 6349-1-2:2016+A1:2017: Maritime Works; British Standards Institute: London, UK, 2017; ISBN 9780580988318. [Google Scholar]
  6. U.S. Army Corps of Engineers. Coastal Engineering Manual Part VI, 1st ed.; U.S. Army Corps of Engineers: Los Angeles, CA, USA, 2012; ISBN 1782661980. [Google Scholar]
  7. FEMA. FEMA-55: Coastal Construction Manual-Principles and Practices of Planning, Siting, Designing, Constructing, and Maintaining Residential Buildings in Coastal Areas, 4th ed.; Federal Emergency Management Agency (FEMA): Washington, DC, USA, 2005; Volume I, ISBN 1482079291. [Google Scholar]
  8. Allsop, W.; Franco, L.; Bellotti, G.; Bruce, T.; Geeraerts, J. Hazards to People and Property from Wave Overtopping at Coastal Structures. In Proceedings of the Coastlines, Structures and Breakwaters 2005, London, UK, 20–22 April 2005; pp. 153–165. [Google Scholar]
  9. Bodaghkhani, A.; Dehghani, S.R.; Muzychka, Y.S.; Colbourne, B. Understanding Spray Cloud Formation by Wave Impact on Marine Objects. Cold Reg. Sci. Technol. 2016, 129, 114–136. [Google Scholar] [CrossRef]
  10. Bodaghkhani, A.; Muzychka, Y.S.; Colbourne, B. An Analytical Model of Final Average Droplet Size Prediction of Wave Spray Cloud. Int. J. Heat Fluid Flow 2018, 74, 110–117. [Google Scholar] [CrossRef]
  11. Dehghani-Sanij, A.R.; Muzychka, Y.S.; Naterer, G.F. Droplet Trajectory and Thermal Analysis of Impinging Saline Spray Flow on Marine Platforms in Cold Seas and Ocean Regions. Ocean. Eng. 2018, 148, 538–547. [Google Scholar] [CrossRef]
  12. Watanabe, Y.; Ingram, D.M. Size Distributions of Sprays Produced by Violent Wave Impacts on Vertical Sea Walls. Proc. R. Soc. A Math. Phys. Eng. Sci. 2016, 472, 20160423. [Google Scholar] [CrossRef]
  13. BBC Blackpool North Pier to Reopen after £1m Storm Damage Repairs. Available online: https://www.bbc.co.uk/news/uk-england-lancashire-26704975 (accessed on 22 June 2021).
  14. BBC Aberystwyth Seafront Storm Damage Clean-Up Attracts 200. Available online: https://www.bbc.co.uk/news/uk-wales-mid-wales-25682802 (accessed on 18 June 2021).
  15. Wolters, G.; Müller, G.; Bruce, T.; Obhrai, C. Large-Scale Experiments on Wave Downfall Pressures. Marit. Eng. 2005, 158, 137–145. [Google Scholar] [CrossRef]
  16. Bruce, T.; Pearson, J.; Allsop, W. Violent Overtopping of Seawalls-Extended Prediction Methods. In Proceedings of the Breakwaters, Coastal Structures and Coastlines; Allsop, W.H., Ed.; Institute of Civil Engineers: London, UK, 2002; pp. 245–255. [Google Scholar]
  17. Bruce, T.; Franco, L.; Alberti, P.; Pearson, J.; Allsop, W. Violent Wave Overtopping: Discharge Throw Velocities, Trajectories and Resulting Crown Deck Loading. In Ocean Wave Measurement and Analysis (2001); American Society of Civil Engineers: Reston, VA, USA, 2001; pp. 1783–1796. ISBN 9780784406045. [Google Scholar]
  18. Watson, P.J.; Nuyts, S.; Murphy, J.; Lizondo, S.; Avgeris, I. Wave Overtopping Pressures and Spatial Distribution behind Rubble Mound Breakwaters. In Proceedings of the 3rd International Conference on Protection against Overtopping, Grange-over-Sands, UK, 6–8 June 2018; HR Wallingford: Grange-over-Sands, UK, 2018. [Google Scholar]
  19. Baines, A.; Watson, P.; Cunningham, L.S.; Rogers, B.D.; Murphy, J.; Lizondo, S. Modelling Shore-Side Pressure Distributions from Violent Wave Breaking at a Seawall. Proc. Inst. Civ. Eng.-Eng. Comput. Mech. 2019, 172, 118–123. [Google Scholar] [CrossRef]
  20. Cuomo, G.; Tirindelli, M.; Allsop, W. Wave-in-Deck Loads on Exposed Jetties. Coast. Eng. 2007, 54, 657–679. [Google Scholar] [CrossRef]
  21. de Almeida, E.; Hofland, B. Validation of Pressure-Impulse Theory for Standing Wave Impact Loading on Vertical Hydraulic Structures with Short Overhangs. Coast. Eng. 2020, 159, 103702. [Google Scholar] [CrossRef]
  22. Bredmose, H.; Peregrine, D.H.; Bullock, G.N. Violent Breaking Wave Impacts. Part 2: Modelling the Effect of Air. J. Fluid Mech. 2009, 641, 389–430. [Google Scholar] [CrossRef]
  23. Bredmose, H.; Bullock, G.N.; Hogg, A.J. Violent Breaking Wave Impacts. Part 3. Effects of Scale and Aeration. J. Fluid Mech. 2015, 765, 82–113. [Google Scholar] [CrossRef]
  24. Bagnold, R.A. Interim Report on Wave-Pressure Research; Institute of Civil Engineers: London, UK, 1939. [Google Scholar]
  25. Cuomo, G.; Allsop, W.; Takahashi, S. Scaling Wave Impact Pressures on Vertical Walls. Coast. Eng. 2010, 57, 604–609. [Google Scholar] [CrossRef]
  26. Bullock, G.N.; Crawford, A.R.; Hewson, P.J.; Walkden, M.J.A.; Bird, P.A.D. The Influence of Air and Scale on Wave Impact Pressures. Coast. Eng. 2001, 42, 291–312. [Google Scholar] [CrossRef]
  27. Bullock, G.N.; Bredmose, H. Violent Breaking-Wave Impacts. Part 4: A Detailed Analysis and Comparison of Field and 1:4 Scale Measurements on Sloping and Vertical Walls Including the Influence of Air and Scale Effects. Coast. Eng. 2024, 191, 104520. [Google Scholar] [CrossRef]
  28. Zhou, T.; Ma, Z.; Chen, J.; Zhai, G. Multiscale Air Entrainment in Wave-in-Deck Loads. Coast. Eng. 2024, 188, 104431. [Google Scholar] [CrossRef]
  29. Zhou, T.; Ma, Z.; Zhai, G.; Chen, J. Wave-in-Deck Loads Induced by Regular Wave Impact: The Role of Compressible Air Entrainment. J. Fluids Struct. 2023, 122, 103974. [Google Scholar] [CrossRef]
  30. Edinburgh Designs Piston Coastal Wave Generators. Available online: http://www4.edesign.co.uk/product/piston-wave-generators/ (accessed on 10 July 2021).
  31. Pepi, Y.; Streicher, M.; Ricci, C.; Franco, L.; Bellotti, G.; Hughes, S.; Troch, P. The Effect of Variations in Water Level on Wave Overtopping Discharge over a Dike: An Experimental Model Study. Coast. Eng. 2022, 178, 104199. [Google Scholar] [CrossRef]
  32. Altomare, C.; Gironella, X. Characterization of Overtopping Volumes from Focused Wave Groups over Smooth Dikes with an Emerged Toe: Insights from Physical Model Tests. J. Mar. Sci. Eng. 2024, 12, 1143. [Google Scholar] [CrossRef]
  33. Kerpen, N.B.; Daemrich, K.F.; Lojek, O.; Schlurmann, T. Effect of Variations Inwater Level and Wave Steepness on the Robustness Ofwave Overtopping Estimation. J. Mar. Sci. Eng. 2020, 8, 63. [Google Scholar] [CrossRef]
  34. Van Gent, M.R.A.; Zwanenburg, S.A.A.; Kramer, J. Effects of Water Level Variations on the Stability of Rock Armoured Slopes. Coast. Eng. Proc. 2018, 1, 44. [Google Scholar] [CrossRef]
  35. Baines, A.; Cunningham, L.S.; Rogers, B.D. Numerical Modelling of Wave Downfall Pressures on the Deck Landward of a Vertical Breakwater. In Proceedings of the Coasts, Marine Structures and Breakwaters 2017; ICE Publishing: Manchester, England, 2018; pp. 1051–1061. [Google Scholar]
  36. Hunt-Raby, A.C.; Borthwick, A.G.L.; Stansby, P.K.; Taylor, P.H. Experimental Measurement of Focused Wave Group and Solitary Wave Overtopping. J. Hydraul. Res. 2011, 49, 450–464. [Google Scholar] [CrossRef]
  37. Whittaker, C.N.; Fitzgerald, C.J.; Raby, A.C.; Taylor, P.H.; Borthwick, A.G.L. Extreme Coastal Responses Using Focused Wave Groups: Overtopping and Horizontal Forces Exerted on an Inclined Seawall. Coast. Eng. 2018, 140, 292–305. [Google Scholar] [CrossRef]
  38. Schäffer, H.A. Accurate Determination of Internal Kinematics from Numerical Wave Model Results. Coast. Eng. 2004, 50, 199–211. [Google Scholar] [CrossRef]
  39. Raby, A.; Jayaratne, R.; Bredmose, H.; Bullock, G. Individual Violent Wave-Overtopping Events: Behaviour and Estimation. J. Hydraul. Res. 2019, 58, 34–46. [Google Scholar] [CrossRef]
  40. Katsardi, V.; Swan, C. The Evolution of Large Non-Breaking Waves in Intermediate and Shallow Water. I. Numerical Calculations of Uni-Directional Seas. Proc. R. Soc. A: Math. Phys. Eng. Sci. 2011, 467, 778–805. [Google Scholar] [CrossRef]
  41. Schaffer, H.A. Second-order wavemaker theory for irregular waves. Ocean. Eng. 1995, 23, 47–88. [Google Scholar] [CrossRef]
  42. McCormick, M.E. Ocean Engineering Mechanics: With Applications; Cambridge University Press: Cambridge, UK, 2009; ISBN 0521859522. [Google Scholar]
  43. Oshana, R. Overview of Digital Signal Processing Algorithms. In DSP Software Development Techniques for Embedded and Real-Time Systems; Elsevier: Oxford, UK, 2006; pp. 59–121. [Google Scholar] [CrossRef]
  44. McCabe, M.V.; Stansby, P.K.; Apsley, D.D. Random Wave Runup and Overtopping a Steep Sea Wall: Shallow-Water and Boussinesq Modelling with Generalised Breaking and Wall Impact Algorithms Validated against Laboratory and Field Measurements. Coast. Eng. 2013, 74, 33–49. [Google Scholar] [CrossRef]
  45. Whittaker, C.N.; Fitzgerald, C.J.; Raby, A.C.; Taylor, P.H.; Orszaghova, J.; Borthwick, A.G.L. Optimisation of Focused Wave Group Runup on a Plane Beach. Coast. Eng. 2017, 121, 44–55. [Google Scholar] [CrossRef]
  46. Weller, S. Wave Energy Extraction from Device Arrays Experimental Investigation in a Large Wave Facility. Ph.D Thesis, University of Manchester, Manchester, UK, 2010. [Google Scholar]
  47. Baines, A.S. Resilience of Coastal Structures to Spray Dominated Wave Impacts: An Experimental and Numerical Investigation. Ph.D. Thesis, University of Manchester, Manchester, UK, 2020. [Google Scholar]
  48. Orszaghova, J.; Taylor, P.H.; Borthwick, A.G.L.; Raby, A.C. Importance of Second-Order Wave Generation for Focused Wave Group Run-up and Overtopping. Coast. Eng. 2014, 94, 63–79. [Google Scholar] [CrossRef]
  49. Dassanayake, D.T.; Raby, A.; Antonini, A. Efficacy of Analysis Techniques in Assessing Broken Wave Loading on a Cylinder upon a Shoal. Proc. Int. Conf. Offshore Mech. Arct. Eng.-OMAE 2019, 7A-2019, 1–10. [Google Scholar] [CrossRef]
  50. Massel, S.R. Wavelet Analysis for Processing of Ocean Surface Wave Records. Ocean Eng. 2001, 28, 957–987. [Google Scholar] [CrossRef]
  51. Baines, A.; Cunningham, L.S.; Rogers, B.D. Simulation of Wave Downfall Pressures on Coastal Protection Structures: Energy Considerations. In Proceedings of the 2017 MACE PGR Conference, Manchester, UK, 6 September 2017; pp. 26–28. [Google Scholar]
  52. Hattori, M.; Arami, A.; Yui, T. Wave Impact Pressure on Vertical Walls under Breaking Waves of Various Types. Coast. Eng. 1994, 22, 79–114. [Google Scholar] [CrossRef]
  53. Yan, B.; Luo, M.; Bai, W. An Experimental and Numerical Study of Plunging Wave Impact on a Box-Shape Structure. Mar. Struct. 2019, 66, 272–287. [Google Scholar] [CrossRef]
  54. De Finis, S.; Lugni, C.; Bellotti, G.; Brocchini, M. Filling Flows by Wave Impacts on Walls: Laboratory and Numerical Experiments. Phys. Fluids 2022, 34. [Google Scholar] [CrossRef]
  55. Wolters, G.; Müller, G. The Propagation of Wave Impact Induced Pressures into Cracks and Fissures. Eng. Geol. Spec. Publ. 2007, 20, 121–130. [Google Scholar] [CrossRef]
  56. Horriche, Z.; Etienne, S.; Béguin, C.; Brosset, L. Numerical Study of the Influence of Weber and Reynolds Numbers on Global Wave Shapes before Impact. In Proceedings of the 33rd International Ocean and Polar Engineering Conference, Ottawa, ON, Canada, 18–23 June 2023; pp. 2542–2551. [Google Scholar]
  57. Bodaghkhani, A.; Colbourne, B.; Muzychka, Y.S. Prediction of Droplet Size and Velocity Distribution for Spray Formation Due to Wave-Body Interactions. Ocean Eng. 2018, 155, 106–114. [Google Scholar] [CrossRef]
Figure 1. Breaking waves at a vertical seawall, Norbreck, Blackpool, UK, 13 November 2020: plume formation (top), resulting downfall on landward deck (bottom). Droplet dispersal is clearly evident.
Jmse 12 02149 g001
Figure 2. Stages of spray formation (from Case H4T2 introduced later): (a) Sheet formation directly after wave impact. (b) Sheet breakup, with the heavier elements starting to fall back towards the structure. (c) Droplet breakup: separation of the droplets from the remaining sheet. (d) Droplet downfall and impact on deck.
Jmse 12 02149 g002
Figure 3. Schematic of Experimental Set-up, Plan (top), Section (bottom).
Jmse 12 02149 g003
Figure 4. Sketch of the model (not to scale): (a) side view, (b) front of structure viewed from offshore showing probes PF1, PF2, PF3, and (c) plan view of deck probes. Pressure probes in use are shown in green. Locations in red denote probe locations that were sealed using PVC stoppers.
Jmse 12 02149 g004
Figure 5. The University of Manchester wave flume. (a) Side view with beach in situ. (b) View of flume from wavemaker. (c) Model structure with pressure probes arrangement.
Jmse 12 02149 g005
Figure 6. Wavelet Filter vs. Fourier Transform filter. (a) Raw measured signal. (b) Low Pass FFT filter at 20 Hz. (c) Fifth order Wavelet Filter. Forces are unscaled.
Jmse 12 02149 g006
Figure 7. Three consecutive waves’ time-histories from H4T2 (a) Vertical wall impact pressures (PF1, PF2, PF3); (b) Horizontal deck impact pressures (PD12, PD13, PD23, PD33, PD32); and (c) Measured surface-elevation.
Jmse 12 02149 g007
Figure 8. Typical profile type 1 from H4T2. Higher impact pressure associated with a lower downfall pressure. Left: vertical pressure–time profile, right: deck pressure–time profile.
Jmse 12 02149 g008
Figure 9. Typical profile type 2 from H4T2. Low impact pressure associated with higher downfall pressure. Left: vertical pressure–time profile, right: deck pressure–time profile.
Jmse 12 02149 g009
Figure 10. Typical profile type 3 from H4T2. Long dynamic impulse on deck (PD23). Left: vertical pressure–time profile, right: deck pressure–time profile.
Jmse 12 02149 g010
Figure 11. Peak recorded Face Pressures (FP1, FP2 and FP3) for each wave plotted with the corresponding Peak recorded Deck Pressures for PD12, PD13, PD23, PD33, and PD32 separated by wave height for T2, coloured by deck pressure probes. (a) H1T2, (b) H2T2, (c) H3T2, (d) H4T2, (e) H5T2, (f) H6T2, (g) H7T2.
Jmse 12 02149 g011
Figure 12. Diagram of the identification of the dynamic rise time. Solid line: Filtered pressure using Wavelet Filter Dashed: 20 Hz Fourier Filter applied to the Wavelet filtered results. Circles: intercepts identified as start and end of dynamic impulse.
Jmse 12 02149 g012
Figure 13. Normalised pressures on the deck plotted against the time of the dynamic impact in ms for T4 cases.
Jmse 12 02149 g013
Figure 14. Normalised pressures on the deck plotted against the normalised pressure probe position, x / H i , for each wave height. Dashed line on each plot represents the location of the first row of probes, which were not used in the final tests shown here. Separated by wave height (T2) (a) H1T2, (b) H2T2, (c) H3T2, (d) H4T2, (e) H5T2, (f) H6T2, and (g) H7T2.
Jmse 12 02149 g014
Figure 15. Free-surface elevation for R1 to R5 (test series FG1), superimposed for WG1.
Jmse 12 02149 g015
Figure 16. Pressure–time plots for face pressures for R2, R3, R4 (repetition 2, 3, and 4) of FG3, superimposed for PF1.
Jmse 12 02149 g016
Figure 17. Pressure–time plots for deck pressures for R2, R3, and R4 of FG3, superimposed and separated by pressure probe: (a) PD12, (b) PD13, (c) PD32, and (d) PD33.
Jmse 12 02149 g017
Figure 18. Typical profile type 1 (FG1) at T = 26.5 s Left: Face pressure at PF1, Right: Deck impact pressure profile showing PD12, PD13, PD33, and PD32.
Jmse 12 02149 g018
Figure 19. Typical profile type 2 (FG1) at T = 217.2 s Left: Face pressure at PF1, Right: Deck impact pressure profile showing PD12, PD13, PD33, and PD32.
Jmse 12 02149 g019
Figure 20. Typical profile type 3 (FG1) at T = 153.4 s. Left: Face pressure at PF1, Right: Deck impact pressure profile showing PD12, PD13, PD33, and PD32.
Jmse 12 02149 g020
Figure 21. Images captured of the peak wave of the focused group FG1 (a,b) plunging wave breaking at the focal point (toe of beach). (c) plunging wave toe impacting with structure. (df) Stages of spray formation: (d) Sheet formation directly after wave impact. (e) Sheet breakup, with the heavier elements starting to fall back towards the structure. (f) Droplet breakup: separation of the droplets from the remaining sheet.
Jmse 12 02149 g021
Table 1. Summary of parameters for previous experimental work.
ParameterWolters et al. [15]Bruce et al. [16]Watson et al. [18]
Scale1:41:1001:25
Wave   Height   ( H s ) 1.2 1.7 m 0.06 0.113   m 0.092 0.144   m
Wave   Period   ( T p ) 4 10 s 3 5 s 0.24 0.436 s
Toe depth (d) 1.2 1.7 m 0.085 0.24   m 7.5   m (toe of rubble mound)
Spectrum typeJoint North Sea Wave Project (JONSWAP)JONSWAPJONSWAP
Model Seawall typeVerticalVerticalRubble mound with crown
Probe positionsFace and deckFace and deckFace and 4 elevations above deck
Peak Downfall Pressures 220   k P a
12   ρ g H s
25   k P a
15   ρ g H s
10   k P a
Rise time of impact ~ 2   m s ~ 2   m s N/A
Table 2. Pressure probe properties.
MakeModelTypeRangeOutputAccuracy
FaceGE UNIK 5000PMP5074-TBA1-CAH1PARelative 0 400   k P a 0 5   V Industrial
DeckPMP5074-TBA1-CAH1PA 20 20   k P a 4 20   m A Premium
Table 3. Regular waves: properties and identifier.
Test NameT (s)H (m)Wave Length (m)Iribarren NumberTest NameT (s)H (m)Wave Length (m)Iribarren Number
T1H11.330.0652.3990.65T4H12.220.0654.5861.09
H20.070.63H20.071.05
H30.0750.61H30.0751.02
H40.080.59H40.081.02
H50.0850.57H50.0850.98
H60.090.56H60.090.95
H70.0950.54H70.0950.93
T2H11.540.0652.9240.75T5H12.860.0656.0671.41
H20.070.73H20.071.36
H30.0750.70H30.0751.31
H40.080.68H40.081.27
H50.0850.66H50.0851.23
H60.090.64H60.091.20
H70.0950.63H70.0951.16
T3H11.820.0653.6160.75New wave focused wave groups
H20.070.72FG11.820.0653.6160.75
H30.0750.69FG21.540.072.9240.65
H40.080.67FG32.860.0756.0670.90
H50.0850.65
H60.090.63
H70.0950.62
Table 4. Range of peak face and deck pressures (in kPa) for all waves of period T2.
Test Name H   ( m ) P f a c e   ( k P a ) P d e c k   ( k P a )
H1T20.0651.5–2.01.0–3.0
H2T20.071.5–4.01.0–3.5
H3T20.0752.5–6.0 4.0–8.0
H4T20.085.0–12.0 6.0–14.0
H5T20.0857.5–20.05.0–11.0
H6T20.0910.0–20.05.0–7.0
H7T20.09510.0–22.08.0–18.0
Table 5. Focused wave groups: Variability of the pressure measurements for FG3.
Test P f a c e   ( P a ) P d e c k   ( P a )
PF1PD12PD13PD23PD32PD33
R16379.37292.46174.23177.55181.52111.04
R24915.41232.3366.0660.05399.7555.71
R37839.1796.9298.04199.5053.9923.11
R44849.62269.6887.3687.53106.0589.94
R54070.35408.99131.05176.2599.4457.06
μ 5610.78260.08111.35140.18168.1567.37
σ 1341.07100.7137.8155.51122.8230.39
Table 6. Dynamic impact times for R2, R3, and R4 of FG1.
TestR2R3R4
Dynamic impulse time (ms) ~ 240 ~ 200 ~ 120
Disclaimer/Publisher’s Note: The statements, opinions and data contained in all publications are solely those of the individual author(s) and contributor(s) and not of MDPI and/or the editor(s). MDPI and/or the editor(s) disclaim responsibility for any injury to people or property resulting from any ideas, methods, instructions or products referred to in the content.

