Article

Dynamic Response Mechanism of Thin-Walled Plate under Confined and Unconfined Blast Loads

1
Frontier Science Center for Extreme Mechanics and Energy, Central South University, Changsha 410075, China
2
School of Traffic & Transportation Engineering, Central South University, Changsha 410075, China
3
Key Laboratory of Traffic Safety on Track, Ministry of Education, Changsha 410075, China
4
College of Science, National University of Defense Technology, Changsha 410073, China
*
Author to whom correspondence should be addressed.
J. Mar. Sci. Eng. 2024, 12(2), 224; https://doi.org/10.3390/jmse12020224
Submission received: 24 December 2023 / Revised: 18 January 2024 / Accepted: 22 January 2024 / Published: 26 January 2024
(This article belongs to the Special Issue Ship Design and Structure Dynamics)

Abstract

:
Thin-walled metal plates and cabin structures are widely found in ships and cargos which are susceptible to attacks or accidental explosions. The present work focuses on the dynamic response mechanism of steel plates under unconfined and confined blast loads. In the experiment, digital image correlation (DIC) technique was applied to record and analyze the dynamic response process of a large-scale field blast test. The DIC measured curve and the numerically calculated curves agree well in both trends and peak values. Then, the dynamic response mechanisms of steel plates under an unconfined blast (UB) load and confined blast (CB) load were compared and discussed. The results show that the dynamic response of plates can be divided into three phases under both UB and CB loads, with different mechanisms. In phase I, plastic hinges start from the center and move to the boundary in the UB condition, while in the case of CB, plastic hinges occur close to the boundary and move in the opposite direction. In phase II, two plastic hinge lines propagate towards each other, a platform exists between the boundary, and the central area remains undeformed in the UB condition, while in the CB condition, larger deformation occurs in the peripheral region rather than the central area.

1. Introduction

Safety is the eternal theme of engineering. In recent years, frequently serious disasters related to explosions have happened around the world in different kinds of transportation equipment such as ships, vessels, warcrafts, and offshore platforms. Some are caused by deflagration content unintentionally carried by passengers, others are caused by fuel or cargo deflagration inside the ship, and some are even caused by terrorist activities. To shield against such attacks, defense technology or infrastructures (see Figure 1), particularly with multi-cabin defensive structures, should be developed [1,2,3]. In addition, some particular reinforcement design should also be considered for ship cabins and ocean-going vessels.
Thin-walled metal plates and cabin structures are widely found in ships and cargos. Such structures in specific locations may be susceptible to attacks or accidental explosions. For this purpose, the vulnerability of side cabin structures needed to be adequately investigated first. As the existing findings show, structures subjected to unconfined and confined explosions bear different blast loads and their dynamic responses are different [4,5]. Under an unconfined blast, the structure performs a different dynamic response which hugely depends on the explosive source distance (i.e., close-in airblast [6] and faraway airblast), shield materials (i.e., thin aluminum, steel plates [7], composite sandwich plates [8]), as well as the structure patterns. More studies have focused on the failure of shield plates and effect of stand-off distance, as performed by Nurick et al. [9], Bonorchis et al. [10], Chung et al. [11,12], and Jacob et al. [13], respectively. It was found in these studies that the whole process can be categorized into three distinct phases, consisting the following: (a) phase I, the expansion of explosion from the time of detonation to its interaction with the structure; (b) phase II, interaction of the detonation products and the plate; and (c) phase III, reflection of the shock wave off the plate and the oscillation of the plate beginning in response [14,15]. In addition, to further explain the dynamic mechanical behaviors and effectively predict response modes, some theoretical analyses were also developed [16] and analytical solutions [17] were obtained in good agreement with numerical and experimental observations. These constructive methodologies were also extended to analyzing underwater shock wave loading [18]. As aforementioned, flexural waves emanate from the plate boundary and propagate towards the plate center [19]. Thanks to the development of innovative material technologies, different kinds of composite lightweight structures have also been investigated [20,21,22,23] under impact loads.
Unlike the previous unconfined blast situation, a confined blast (CB) means that an explosion occurs within a cabin structure, which limits the propagation of the blast wave. Existing research has shown that CB waves are more complicated and more destructive than those of an unconfined blast (UB) with an equivalent explosive charge [24,25,26,27]. However, the dynamic response mechanism of structures under CB loads and the differences between CB and UB loads have been less investigated.
In order to investigate this dynamic response mechanism, it was necessary to effectively measure the dynamic response process. However, traditional measurement methods are difficult to use for measuring 3D dynamic responses and obtaining the full-field data of a blast loaded plate [28,29,30]. Fortunately, an advanced method using digital image correlation (DIC) technique [31,32] is adept in measuring the 3D dynamic response of structures under impact loading, and it has been proven to be a reliable tool for full-field transient plate deformation measurements during blast loading, with high accuracy and efficiency [33]. Rigby et al. [34] studied the transient deformation of plates subjected to near-field explosive blasts by using DIC technique, and flexural waves were observed. Spranghers et al. [35] and Kumar et al. [36] employed the DIC technique in the study of the dynamic response of aluminum panels. In summary, there have been several 3D-DIC test reports including small-scale tests and simulated explosion tests, while the application of the 3D-DIC technique in large-scale field tests of confined blasts is inadequate.
At present, there is much research on the dynamic response of plates under a UB load, but the response mechanism of structures under a CB load is still not very clear. The present work aims to investigate the dynamic response mechanisms of typical steel plates of ship structures under both CB and UB loads. A field blast test on a ship cabin model was conducted and 3D-DIC technique was employed together with elaborate numerical simulations. This could pave the way for the crashworthiness design of different kinds of defensive structures in ships and warships.

2. Experimental Approaches

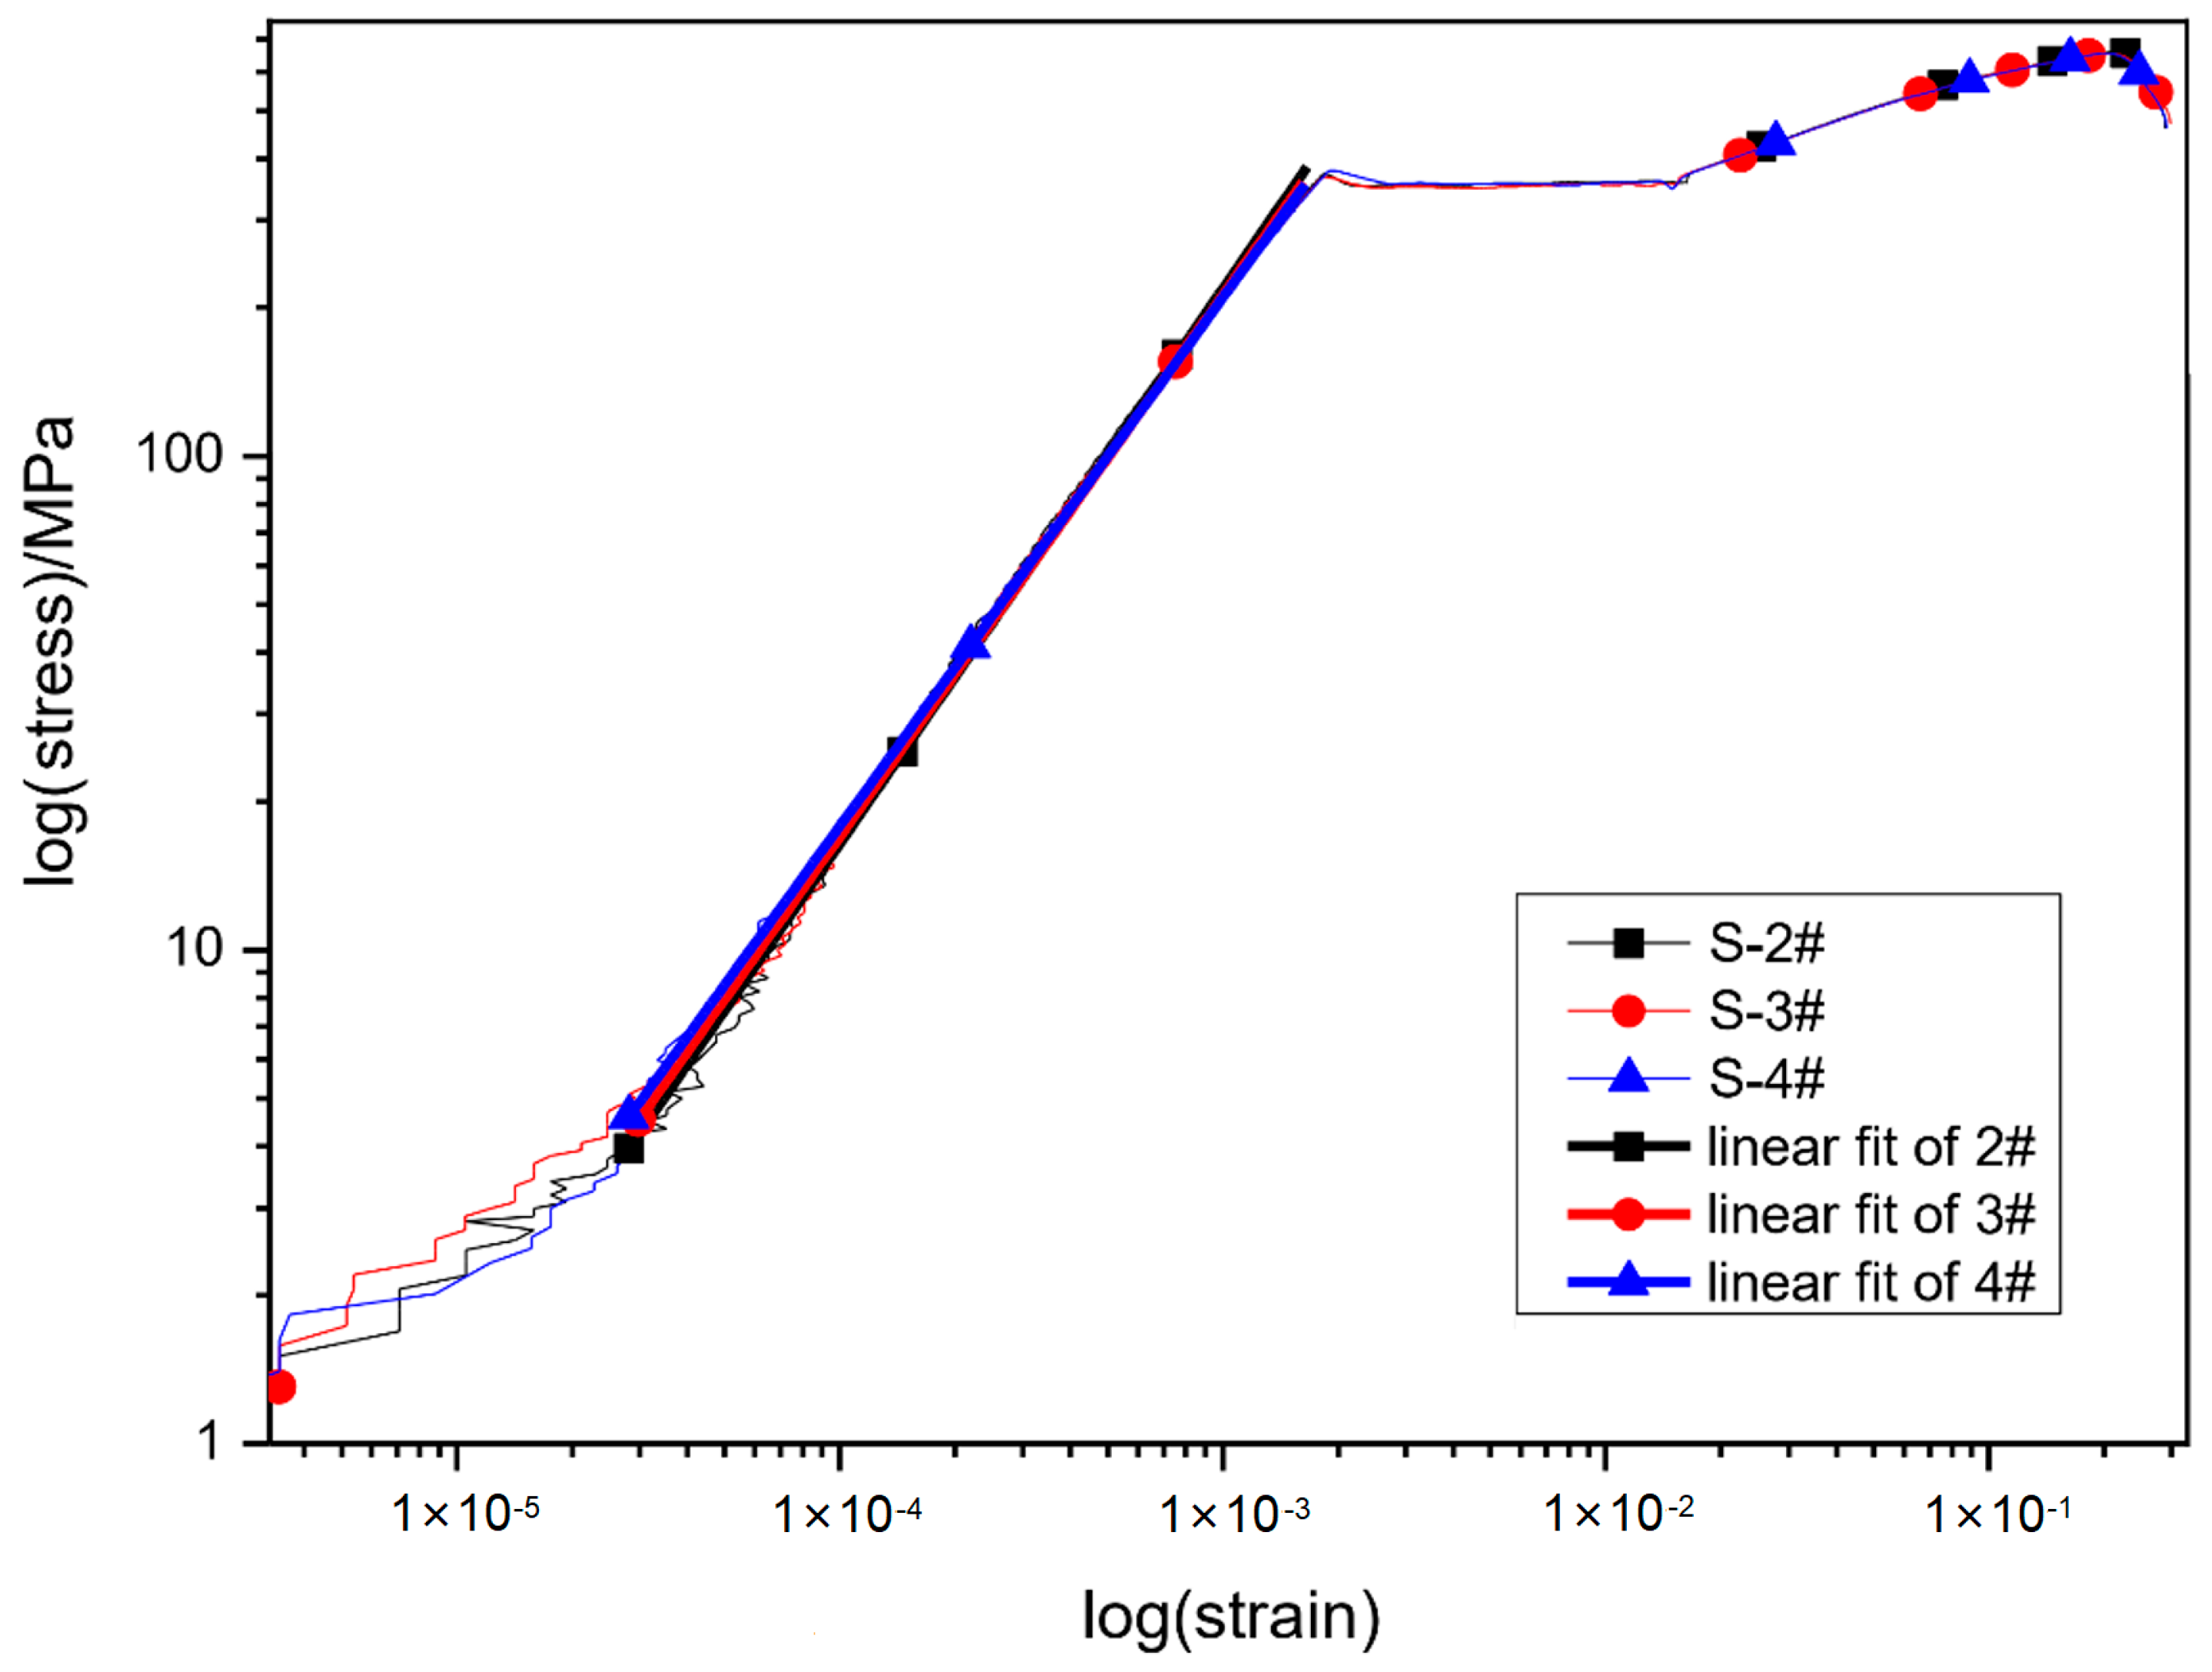
2.1. Material Properties

The commonly used material of low carbon steel was prepared for the field blast experiment. In order to better analyze and understand the test results, it was necessary to master the material properties of the experiments. Three quasi-static tensile tests with standard specimens of 120 mm long and 4 mm thick were conducted through the material test system. The test results of the stress–strain curves are presented in Figure 2, in which there are three specimens noted S-2#, S-3#, and S-4#. The yield strength of 355 MPa was obtained directly from the curves, and Young’s modulus is the ratio of stress to strain, which was 211 GPa.

2.2. Setup and DIC Technique

To create a confined blast loading condition, a ship cabin model using the previously introduced steel was designed and manufactured, as shown in Figure 3. The side length (L, see Figure 3a) of 600 mm was considered in the test. One-fifth extra length (120 mm, L/5) of the cabin side length was welded to every side plate as boundary plates for the purpose of constraint. The plate thickness was 4 mm and the final dimension of the chamber was 840 mm × 840 mm × 840 mm, as shown in Figure 3. In the present study, TNT was casted into a cube with a density of 1.5 g/cm3 and weight of 98.4 g. And the TNT explosive was suspended in the inside center of the chamber (see Figure 3).
DIC technique can record full-field and 3D surface deformation with high spatial resolution and excellent accuracy [33,34]. In this experiment, 3D-DIC technique was applied to record the dynamic response process of the target steel plate. Before the test, two high-speed digital cameras were placed in the front of the target plate arranged at a specific angle to record synchronized images (see Figure 4).
The DIC workflow is depicted in Figure 5. The outside surface of the target plate was painted with a white background and stochastic black speckle patterns to obtain high-contrast images, and the area ratio of black to white was about half and half. At the same time, a calibration panel with a white background and black spots was designed and manufactured for the purpose of obtaining calibration images, and the panel used in the calibration process consisted of a series of circular dots arranged in a specific form. Then, two high-speed digital cameras (Photron FASTCAM, see Figure 4) were used in a stereo configuration to record synchronized images. These two high-speed cameras were placed in suitable positions with a reasonable distance and view angle. And then, synchronized calibration images were recorded. During the calibration process, the panel was moved in a disorderly fashion around the setup position of the target side plate and about 20 synchronized calibration images were acquired by both cameras. After that, the field blast test was conducted and the dynamic response images of the target plate were recorded synchronously. Post data analysis processing was performed with the standard image correlation software, VIC-3D. It matched common pixel subsets of the random speckle patterns between the deformed and undeformed images. The matching of pixel sets was used to calculate the three-dimensional location of the target plate throughout time. Finally, the full-field shape and deformation were obtained by mapping all the speckle patterns.

2.3. Dynamic Response Process Obtained through 3D-DIC

The dynamic deformation processes of the fully confined blast inside the cabin model obtained through DIC technique are shown in Figure 6, in which the value is an absolute result considering the bending displacement (the original value was negative according to the location in Figure 3). With the detonation of the TNT explosive, deformation occurred within a very short time in the central area. The plate center deflection increased to 7 mm at t = 0.52 ms (see Figure 6a). Then, the shock wave propagated to the box corner, and the corner area of the side plate was deformed (as shown in Figure 6b). As time went on, the deformation further developed, and the corner deformation mode was replaced by the center deformation mode (see Figure 6c). The maximum displacement appeared at t = 2.27 ms, of up to 48.30 mm, as shown in Figure 6d.

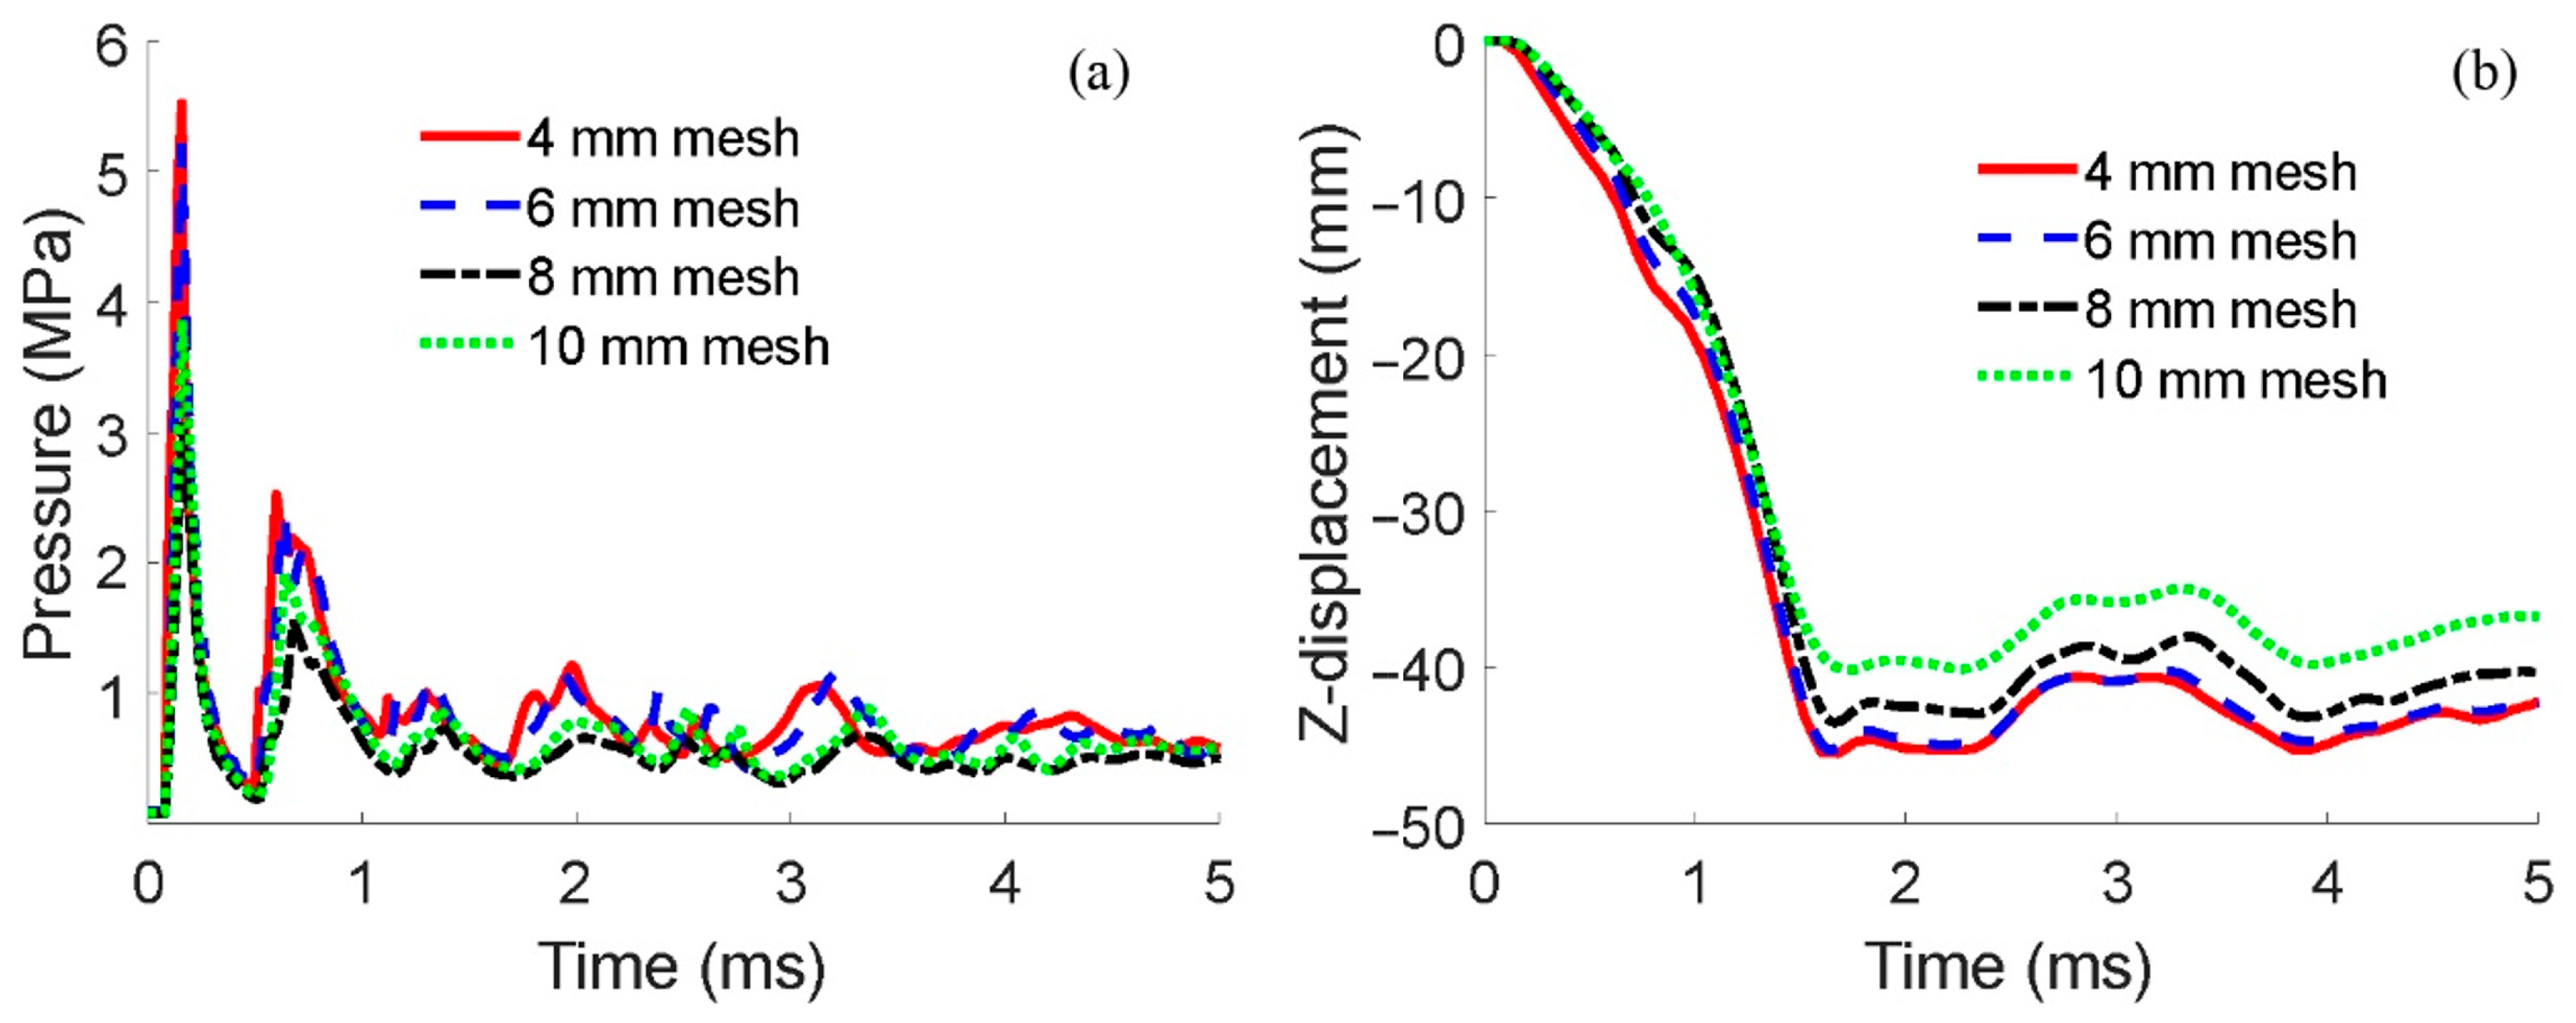
3. Numerical Simulations

3.1. Finite Element Model

Finite element (FE) models of the steel plate under a UB and CB load were built by using ANSYS 19.0 software® [37]. The model for the UB load is shown in Figure 7a, in which the plate was fixed in both directions with a side length of 600 mm and thickness of 4 mm, and the explosive was placed above the plate center with 300 mm. The model for the CB load is shown in Figure 7b. A steel box model with a clear side length of 600 mm (as shown in the right picture of Figure 7b) was built to simulate a fully confined blast condition. The explosive was placed in the center of the box model.
Both in the UB model and the CB model, the explosive shapes and dimensions were defined in the region of air by using the keyword *INITIAL_VOLUME_FRACTION_GEOMETRY [37]. The coupling of the blast wave and structure was considered by adopting the fluid–structure interaction (FSI) algorithm. Artificial bulk viscosity q was applied to avoid numerical oscillations in the practically discontinuous rise of blast waves, and q could be calculated as in [37].
q = ρ l c 0 l ε ˙ k k 2 c 1 α ε ˙ k k ε ˙ k k < 0 q = 0 ε ˙ k k > 0
where c 0 and c 1 are the dimensionless constant, and they meet c 0 = 1.50 , c 1 = 0.06 . ρ is the present density, l = V 3 ( V is the volume) is the characteristic length, α is the localized sound velocity, and ε ˙ k k is the tensor of the strain rate. With the artificial bulk viscosity, q , the calculation of stress σ i j was the following:
σ i j = S i j + P + q δ i j  
where P is the pressure and S i j is the deviant stress tensor.
In the FE model, the explosive and air were meshed with the eight-node Eulerian element SOLID164, while the structures were meshed with the four-node element SHELL163. The arbitrary Lagrange–Euler (ALE) algorithm was applied to model the air and TNT explosive, while the Lagrange algorithm was used for the steel plate and box model. Since the calculation accuracy of the shock wave state parameters was highly dependent on the mesh size of the Eulerian element, analysis of the mesh size sensitivity was conducted as shown in Figure 8. As can be seen in Figure 8, the calculated results converged gradually at a 6 mm mesh size to 4 mm in both blast wave pressure (see Figure 8a) and structural response (see Figure 8b). In addition, the calculation results of this model were compared and verified with the test results in a figure of the following Section 3.3. Hence, the mesh size of the Eulerian element was designed as 4 mm, and the mesh size for the structure was 5 mm. The total element number in the CB model for the shell and solid were 169,740 and 12,167,000, respectively. The air model for the UB load was the same with the CB load, and the element number for the plate in the UB model was 28,224.

3.2. Material Model and Parameters

The numerical method, using finite element method (FEM) programs, has become a common tool in the investigation of structural impact [7,26]. LS-DYNA has been widely applied for its ability to solve problems with large plastic deformation and to consider the strain rate effect [38]. In numerical models, air is assumed to be the ideal gas that is modeled by linear–polynomial EOS and linear in internal energy [39]. The explosive was viewed as a highly explosive burning material and the Jones–Wilkins–Lee (JWL) equation of state (EOS) was selected to simulate the pressure of the explosive explosion. It can be expressed as the following:
P = A 1 ω R 1 V e R 1 V + B 1 ω R 2 V e R 2 V + ω E V  
where A, B are the linear blast parameters; ω, R 1 , and R 2 are the nonlinear parameters; V is the relative volume; and E is the specific internal energy. TNT was selected for the explosive charge in the current tests, and the parameters of the material model and EOS are listed in Table 1.
Table 1. Parameters of the explosive material model and JWL state equation.
Property ρ  (kg/m3)VCJ (m/s)PCJ (GPa)A (GPa)B (GPa)R1R2ω
Value1500693021373.773.754.150.90.35
SourceField experiments[37,40][37,40][37,40][37,40][37,40][37,40][37,40]
The steel material was modeled by the Johnson and Cook (J–C) model [41,42], which has been shown to make accurate predictions of steel structures subjected to blast loads. The general equation of the J–C model is presented as Equation (4):
σ y = A + B ε ¯ p n 1 + C ln ε ˙ 1 T m  
The J–C model consists of three terms which are shown as three brackets in Equation (4), considering the strain hardening, strain rate hardening, and effect of temperature on the yield stress, respectively. The parameters for steel are listed in Table 2 [14,40,41,43], in which the strain hardening parameters were obtained as follows using the material tests results in Section 2.1.
The three terms in Equation (4) are multiplicative and can be considered uncoupled. In order to study the effect of strain hardening, Equation (4) was simplified by considering only the first bracket, as follows [37,41,43],
σ y = A + B ε ¯ p n  
where the constant A is the yield stress under quasi-static loading, and B and n are the work-hardening parameters. A is the yield strength which was introduced in Section 2.1. The values of B and n were obtained from the tensile test results shown in Figure 2, by taking the logarithm on both sides of Equation (5), making the relationship a logarithmic linear relationship:
l o g σ y = l o g B + n l o g ε ¯ p  
This relationship was derived from Figure 2 as shown in Figure 9. The values of lnB and n are the intercept and slope of the linear fit curves in Figure 9, and hence the average values of B and n were 414 and 1.09, respectively.
The Gruneisen equation of state for steel as compressed materials is presented as the following [37]:
p = ρ 0 c 2 μ 1 + 1 γ 0 2 μ a 2 μ 2 1 s 1 1 μ s 2 μ 2 μ + 1 s 3 μ 3 μ + 1 2 + γ 0 + a μ e t  
And the equation for expanded materials is the following:
p = ρ 0 c 2 μ + γ 0 + a μ e t  
where s 1 , s 2 , and s 3 are the coefficients of the slope of the v s v p curve; γ 0 is the Gruneisen gamma; a is the first order volume correction to γ 0 ; and μ = ρ / ρ 0 1 .

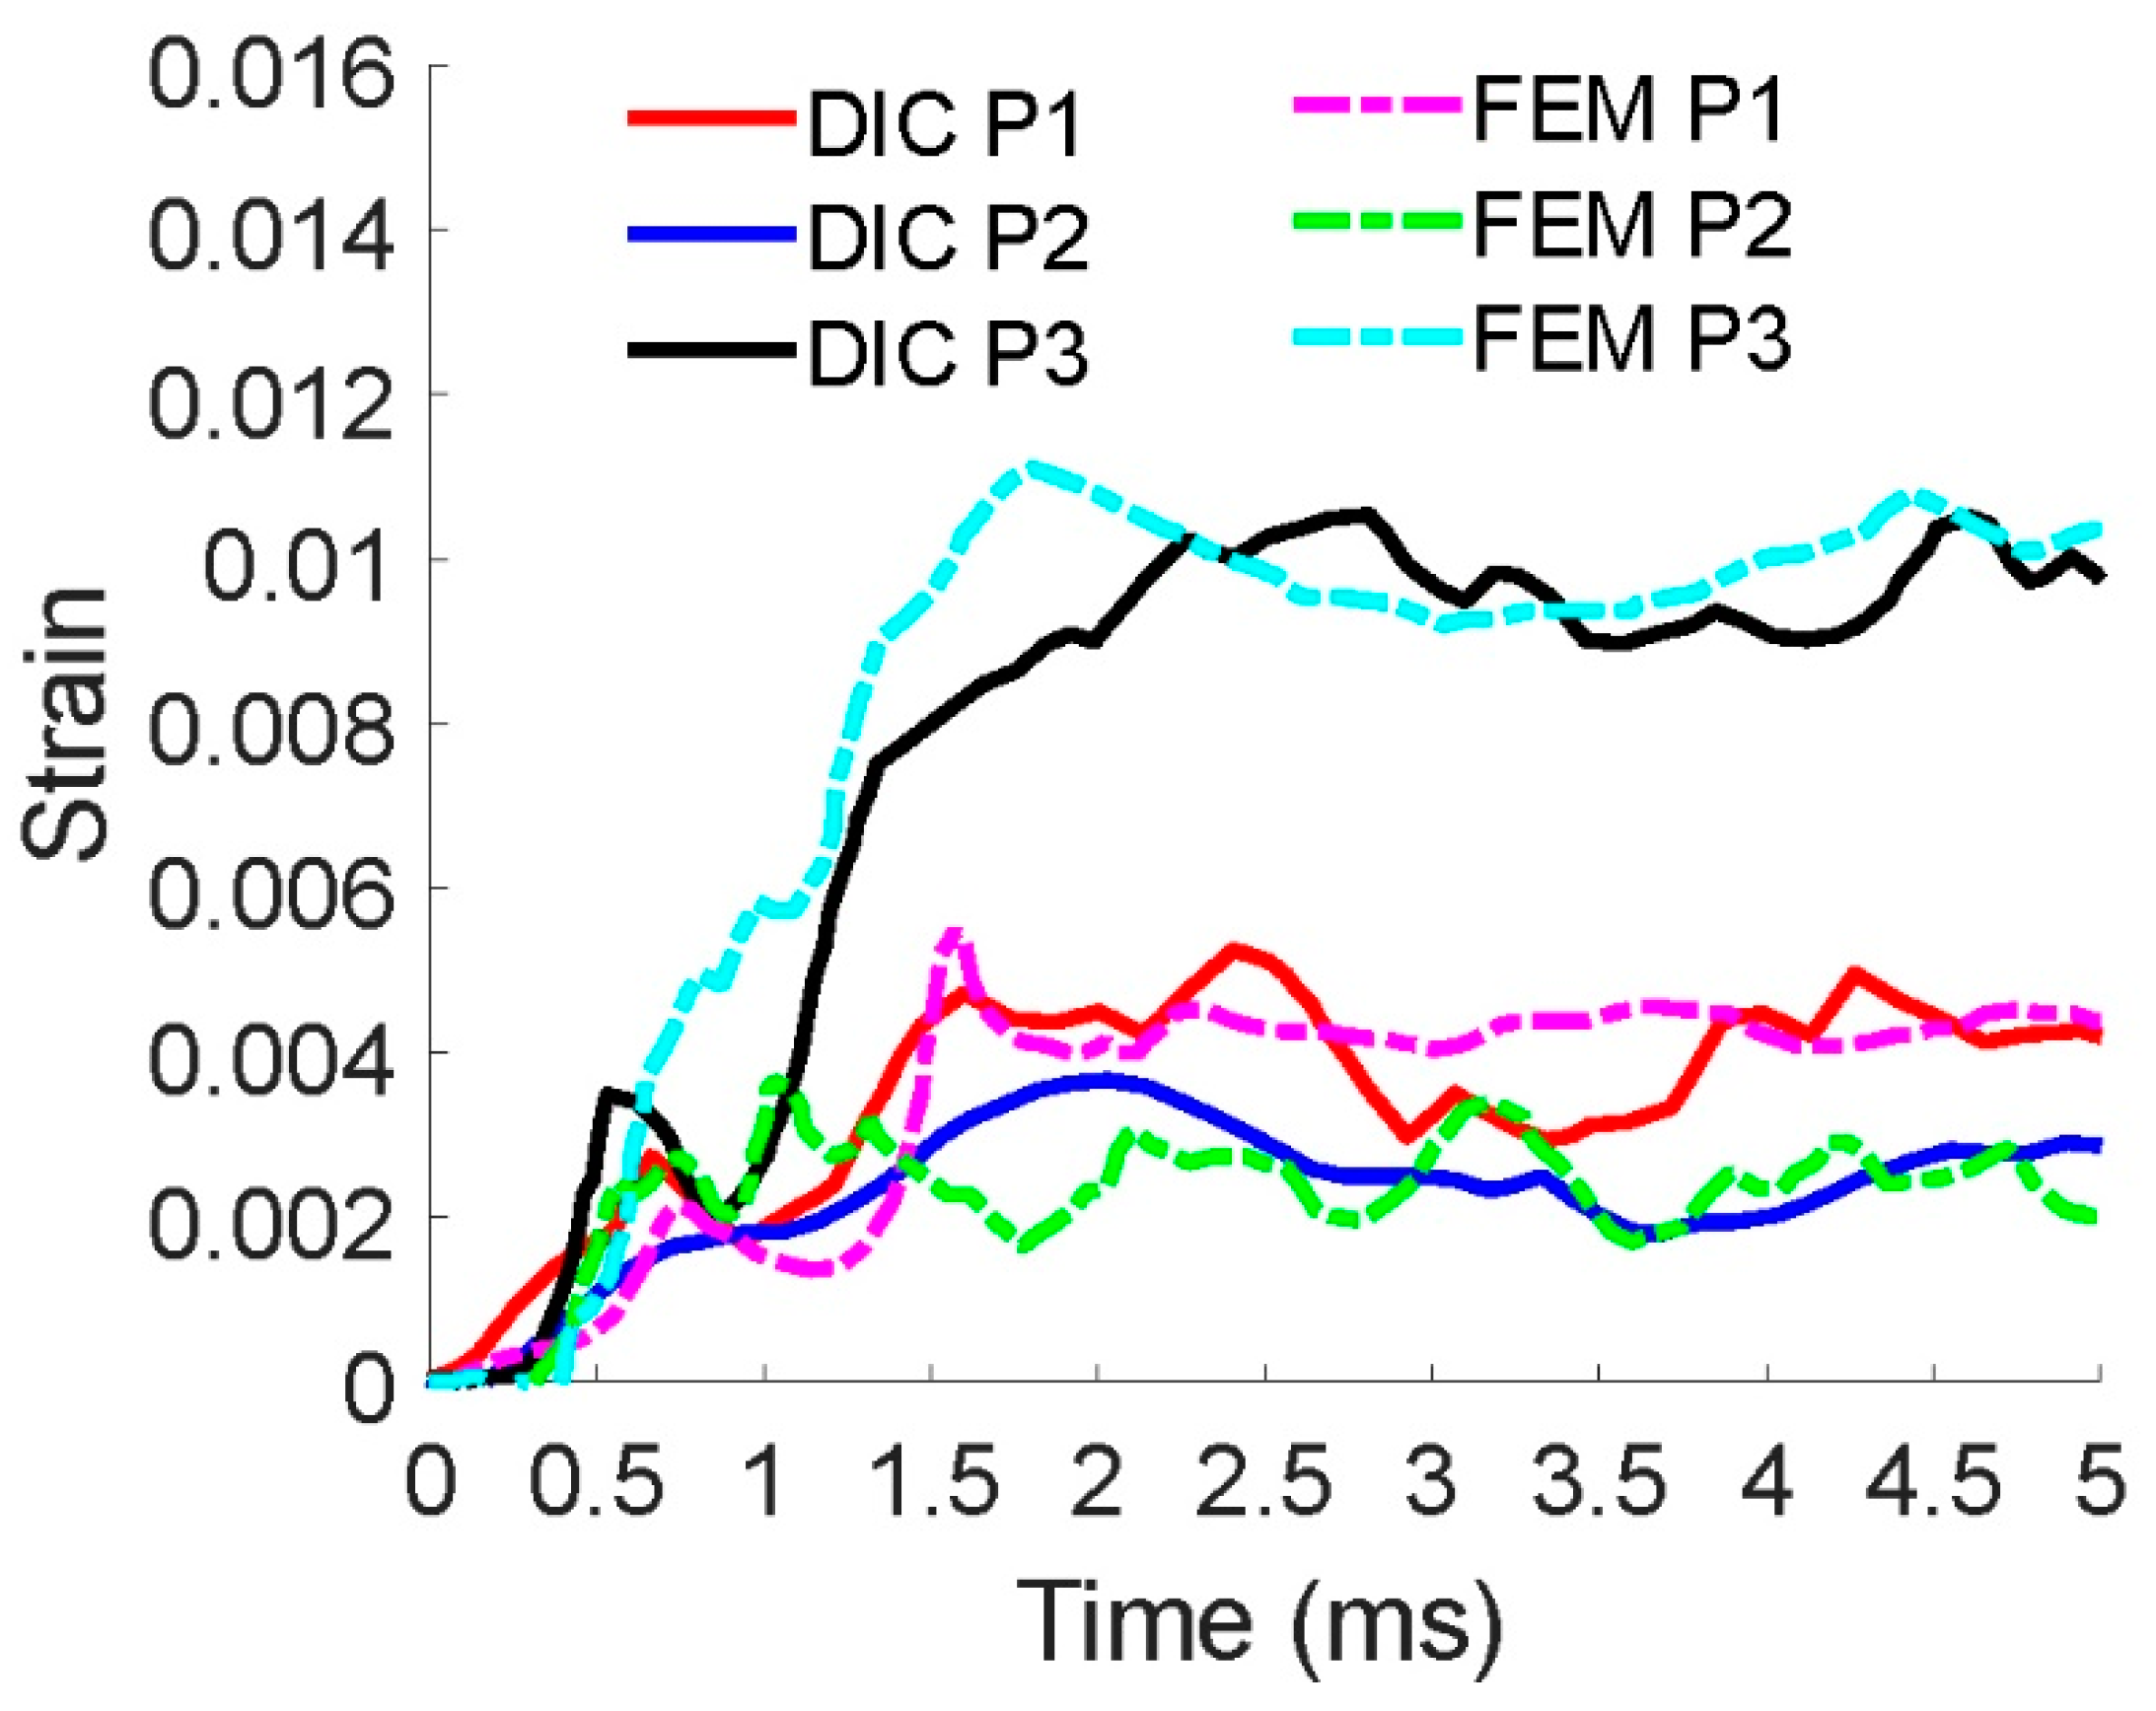
3.3. Experimental Validation

The deformation features of the steel plate under a CB load obtained from both the experimental and numerical results are shown in Figure 10. Outward bulging in the central area of the side plates and in-plane buckling in the middle position of the boundary plates were found for both blasts tested and in the simulated results. The comparison results indicate that the numerical model simulated the deformation features of the steel plates subjected to blast loads well.
Through the post-processing of the deformed and undeformed image pairs obtained from the two high-speed cameras, the deformation value of the considered side plate in every time step was calculated through DIC technique. Hence, the deflection–time curves of the studied side plate were obtained. Figure 11 shows a comparison of the deflection–time curve in the side plate center between the measured DIC (the red curve) and numerical calculation (the blue curve). The measured DIC curve and the numerically calculated curves are similar in both their shape and extreme value. In addition, the period of oscillation of the numerical result fits well with the DIC result. Moreover, the maximum deflection of CB model (the blue curve) was much larger than that of UB model (the black curves) since the detonation product was confined in the cabin and intensified the blast loading.
Based on the 3D displacement data of the target plate obtained, the strain–time data were calculated by least squares fitting of a quadratic function to each component through the post process of the DIC technique. Figure 12 shows a comparison of the strain–time curves of the typical positions between measured DIC (the solid line curves) and calculated FEM (the dash line curves), in which P1 lies at the center of the target plate, P2 is near the side length, and P3 lies at one of the diagonals of the rectangular side plate, with the detailed positions of P1–P3 introduced in Figure 10b. Additionally, for convenience of finding the points of P1, P2, and P3, in Figure 10b, P1′, P2′, and P3′ are also marked to show their relative positions with each other. The strain results show that the curves of the FEM results agreed well with the DIC results. The approximate strain in the z-direction (see Figure 3) for the plate center was about 0.0045 (see P1 curves in Figure 12). The strain of P3 was much larger than those of P1 and P2 which is because P3 was located on the diagonal of the plate, and the diagonal was the plastic hinge formation zone of the deformation of the square plate. In conclusion, the numerical model built in the present study is capable of simulating the dynamic response of a plate under blast loads well and shows adequate accuracy.

4. Discussion

4.1. Dynamic Response Processes

The dynamic responses of a steel plate under a UB load and CB load (the models are shown in Figure 7) were calculated based on the previously introduced numerical method. The pressure–time curves of the UB model and CB model at the target plate center are given in the Figure 13. There was only one impulse load in the UB model with a peak value of 5.4 MPa. Meanwhile, in the CB model, several smaller peaks following the first impulse were observed due to the reflection of shock waves in the confined model. The plate center deflection–time curves of the two finite element models are compared in Figure 11. The maximum deflection of 25 mm in the UB model (the black curve in Figure 11) was much smaller than that of 47 mm in the CB model (the blue and red curves in Figure 11), and the springback response occurred after maximum deflection in the UB loading. The springback phenomenon is called “counter-intuitive behavior” and has been studied by several scholars [44,45]; their works show that plates or shells can reach a final deflection in a direction opposite to the direction of the pulsive loads under specific loading conditions. The results in Figure 11 and Figure 13 show that the dynamic response of the steel plate under the UB load was very different from the CB load.
Figure 14 shows the propagation process of the internal shock wave in the CB simulation. The blast shock wave first reached the center of the side plate at 0.1 ms. At 0.3 ms, the shock wave converged in the corner, and the pressure in the corner was much higher than that in the center area of the plate. After complex propagation, the shock waves converged at the center of the cabin at 0.9 ms and 2.0 ms, respectively.
Figure 15 and Figure 16 show the dynamic response process of the plate under unconfined and confined blast loads, respectively. And the cross-sectional deformation profiles of the UB model at different typical times are depicted in Figure 17, in which the arrows indicate the move direction of the plastic hinge. As shown in Figure 15, when subjected to the unconfined blast load, the central area of the plate was firstly deformed, and the response spread along the radial direction with the central deformation increasing (as shown at t = 0.24 ms in Figure 15). And then, plastic deformations were observed both in the central area and around the boundaries as shown at t = 0.40 ms in Figure 15). Meanwhile, the area between the center and the boundaries remained undeformed (see the platform in the cross-sectional deformation profiles of Figure 15). After that, the plastic deformation along the boundaries developed towards the center while central deformation occurred towards the boundaries (as shown in Figure 15, the length of the platform got shorter from t = 0.24 ms to t = 0.40 ms). At t = 0.64 ms, the plastic deformation spread to all undeformed regions (the platform disappeared in Figure 17). As time went by, the deformation developed in the central area, and the maximum deflection was reached of 25 mm at t = 1.20 ms.
The dynamic response process of the plate under a confined blast load is shown in Figure 16, and the cross-sectional deformation profiles are depicted in Figure 18. As shown in Figure 16, when subjected to the unconfined blast load, slight deformation occurred in the central area of the plate firstly. The dynamic response of the whole plate was observed in a very short time after the central area deformation (as shown at t = 0.48 ms in Figure 16). And then, larger plastic deformations were observed close to the boundaries, then in the central area, as shown at t = 1.12 ms in Figure 16 and Figure 19, which was also observed in the experimental results as shown in Figure 6b. This phenomenon was caused by the converged, superimposed, and intensified blast load in the corner of the box [22,34]. As time went by, the plastic deformation along the boundaries developed towards the center (as shown in Figure 15 from t = 0.88 ms to t = 1.44 ms). At about t = 2.24 ms, the deflection reached a maximum value of about 46 mm. The deformation process in the diagonal section of the plate was very similar to that of the cross section. It can be seen from Figure 10b that the displacement fringe distribution changed along a regular gradient.

4.2. Response Mechanism

From the study of the dynamic response process for both the FEM and DIC results, the dynamic response of the plate under UB load was very different from the CB load. The response mechanisms of the plate under UB load and CB load are shown in Figure 20, in which the arrows indicate the move direction of the plastic hinge. The dynamic response of the plate under UB load can be divided into three phases as shown in Figure 20a. In phase I, the central region was deformed, a plastic hinge circle formed around the deformed region, and the deformed region increased with the plastic hinge circle propagating radially. In phase II, a new plastic hinge line occurred around the boundaries and propagated in the opposite direction to the central plastic hinge, and a platform remained undeformed between the boundary and the center. In phase III, the whole plate was deformed, and deformation in the central area increased to the maximum value. The dynamic response of the plate under the CB load can be also divided into three phases as shown in Figure 20b. In phase I, the plastic hinge line happened in the boundaries and propagated towards the plate center. A larger deformation in the peripheral region than the central area occurred in phase II. As with the UB load, maximum deformation lastly happened in the central area, which was phase III. In addition, in the design of a cabin structure subject to a confined blast, more attention should be paid to the strength of the connections at the edges, as confined blast loading may lead to tearing or shear failure at the corners and the edges due to earlier and higher loads than an unconfined load.

5. Conclusions

Thin-walled metal plates and cabin structures are widely found in ships and cargos. Such structures in specific locations may be susceptible to attack or accidental explosions. Based on the cabin model blast tests and simulation analyses mentioned above, some major conclusions can be drawn as the following:
(a)
The deformation features and dynamic response of typical ship steel plates under confined blast loads were analyzed through both experimental and numerical results. The results showed that outward bulging in the side plate center and in-plane buckling in the middle position of the boundary plates were observed in both the numerical and experimental results. The measured DIC curve and the numerically calculated curves are similar in both shape and peak value, and the period of oscillation of the numerical result fits well with the DIC result.
(b)
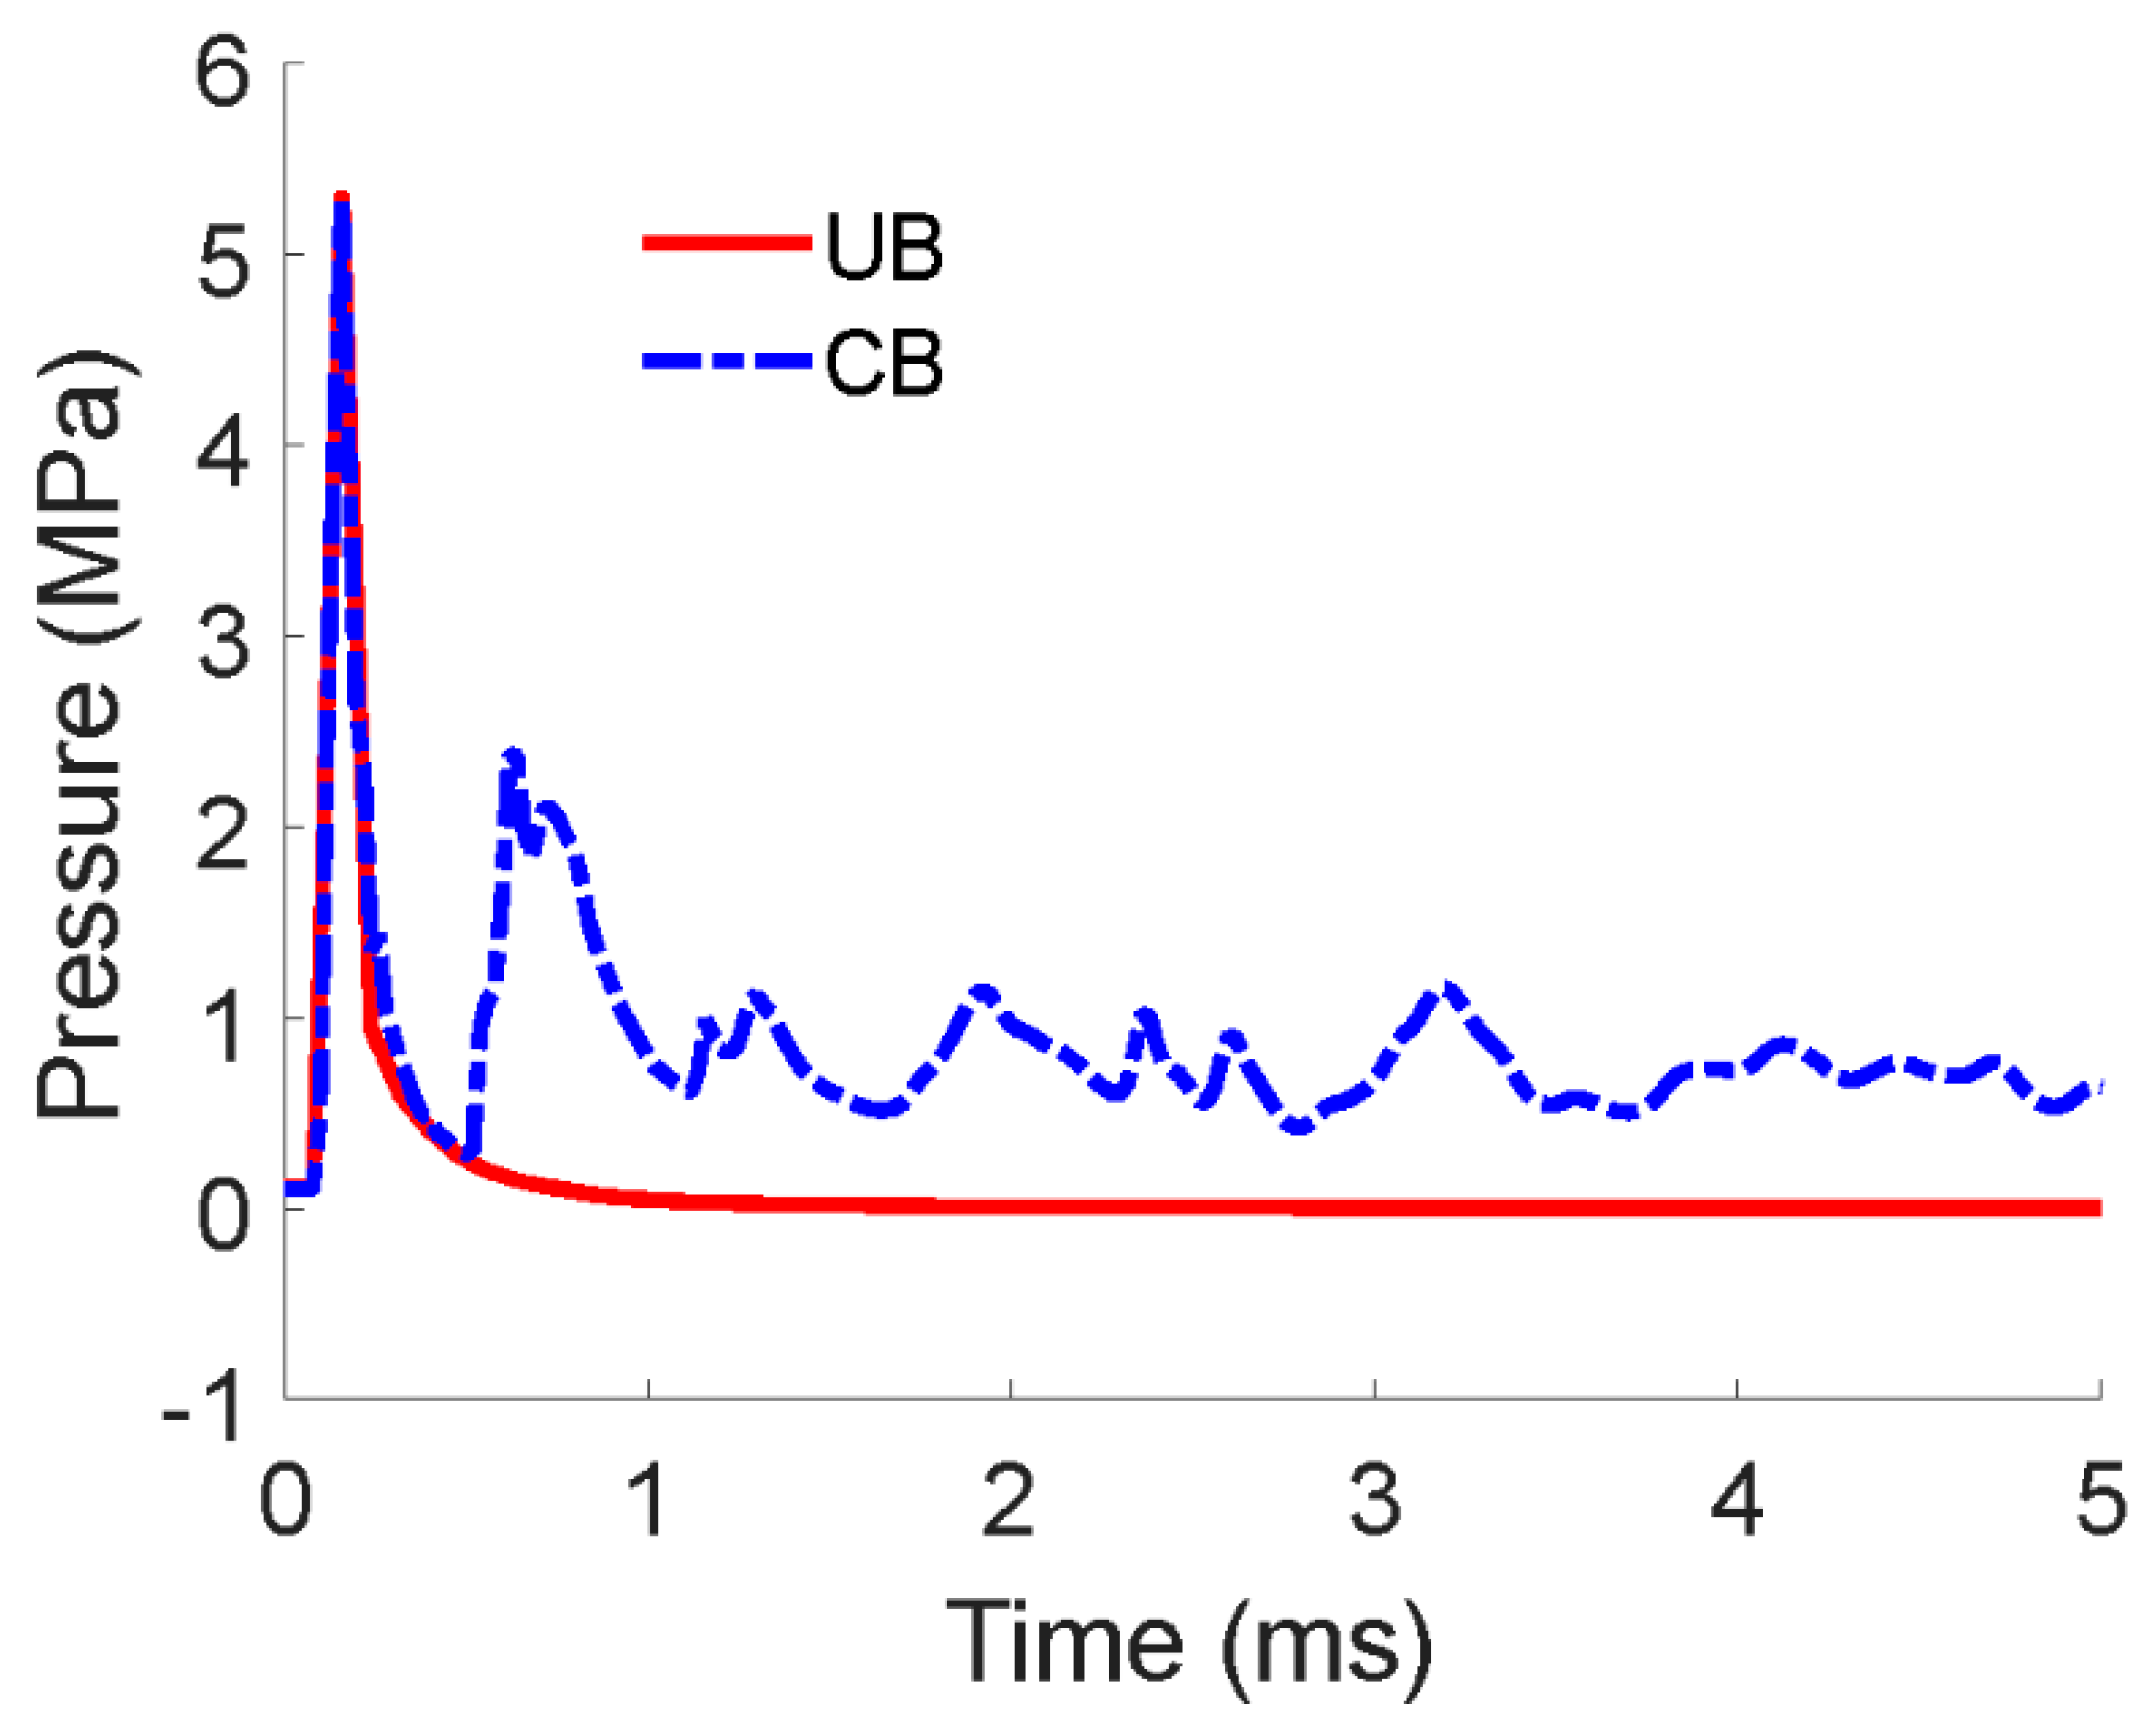
The dynamic responses of the steel plate under UB load and CB load were compared. The results showed that the dynamic response of the plate could be divided into three phases under both the UB and CB loads, while only the dynamic response in phases I and II were different.
(c)
Differing from starting at the center and propagating to the boundary in the case of the UB condition, in phase I, a plastic hinge in the CB condition occurred close to the boundary and propagated in the opposite direction. In phase II, two plastic hinge lines propagated towards each other, and a platform existed between the boundary while the center remained undeformed in the UB condition. While in the CB condition, a unique phenomenon of larger deformation in the peripheral region than the central area was produced. All these achievements can provide guidelines for the crashworthiness design of different kinds of defensive structures in ships and warships.

Author Contributions

Conceptualization, S.Y. and D.Z.; methodology, N.Z. and S.Y.; software, Y.C. and N.Z.; validation, N.Z.; investigation, N.Z. and S.Y.; resources, C.S.; writing—original draft preparation, Y.C. and S.Y.; writing—review and editing, Z.W.; supervision, D.Z.; funding acquisition, S.Y. and D.Z. All authors have read and agreed to the published version of the manuscript.

Funding

This paper was funded by the National Natural Science Foundation of China (Project Nos. 12272414, and 11972371, 11902369), the Natural Science Foundation of Hunan Province (Project No. 2021JJ30786), and the Science and Technology Innovation Plan of Hunan Province (No. 2023RC3045).

Institutional Review Board Statement

Not applicable.

Informed Consent Statement

Not applicable.

Data Availability Statement

Data are available upon request due to restrictions, e.g., privacy and/or ethical.

Acknowledgments

This work was supported in part by the High-Performance Computing Center of Central South University. The authors would like to express their thanks.

Conflicts of Interest

The authors declare no conflicts of interest.

References

  1. Li, Y.; Ren, X.; Zhao, T.; Xiao, D.; Liu, K.; Fang, D. Dynamic response of stiffened plate under internal blast: Experimental and numerical investigation. Mar. Struct. 2021, 77, 102957. [Google Scholar] [CrossRef]
  2. Zhang, D.; Yao, S.; Lu, F.; Song, J.; Ding, Y. Dynamic response and damage analysis of steel box wall under internal blast loading. Adv. Mech. Eng. 2019, 11, 1687814018822601. [Google Scholar] [CrossRef]
  3. Zhang, P.; Liu, J.; Cheng, Y.; Hou, H.; Wang, C.; Li, Y. Dynamic response of metallic trapezoidal corrugated-core sandwich panels subjected to air blast loading—An Experimental study. Mater. Des. 2015, 65, 221–230. [Google Scholar] [CrossRef]
  4. Zhao, N.; Yao, S.J.; Zhang, D.; Lu, F.Y.; Sun, C.M. Experimental and numerical studies on the dynamic response of stiffened plates under confined blast loads. Thin-Walled Struct. 2020, 154, 106839. [Google Scholar] [CrossRef]
  5. Li, H.; Shen, C.; Lu, G.; Wang, Z. Response of cylindrical tubes subjected to internal blast loading. Eng. Struct. 2022, 272, 115004. [Google Scholar] [CrossRef]
  6. Liu, J.; An, F.J.; Niu, Z.Y.; Zhang, L.; Feng, B.; Li, Y.; Wu, C. Study on the blast-resistance of polyurea-steel plates subjected to underwater explosion. Ocean Eng. 2022, 260, 111814. [Google Scholar] [CrossRef]
  7. Nurick, G.N.; Olson, M.D.; Fagnan, J.R.; Levin, A. Deformation and tearing of blast–loaded stiffened square plates. Int. J. Impact Eng. 1995, 16, 273–291. [Google Scholar] [CrossRef]
  8. Hoo Fatt, M.S.; Sirivolu, D. Marine composite sandwich plates under air and water blasts. Mar. Struct. 2017, 56, 163–185. [Google Scholar] [CrossRef]
  9. Nurick, G.N.; Shave, G.C. The deformation and tearing of thin square plates subjected to impulsive loads—An experimental study. Int. J. Impact Eng. 1996, 18, 99–116. [Google Scholar] [CrossRef]
  10. Bonorchis, D.; Nurick, G.N. The analysis and simulation of welded stiffener plates subjected to localised blast loading. Int. J. Impact Eng. 2010, 37, 260–273. [Google Scholar] [CrossRef]
  11. Chung Kim Yuen, S.; Butler, A.; Bornstein, H.; Cholet, A. The influence of orientation of blast loading on quadrangular plates. Thin-Walled Struct. 2018, 131, 827–837. [Google Scholar] [CrossRef]
  12. Yuen, S.C.K.; Nurick, G.N. Experimental and numerical studies on the response of quadrangular stiffened plates. Part I: Subjected to uniform blast load. Int. J. Impact Eng. 2005, 31, 55–83. [Google Scholar] [CrossRef]
  13. Jacob, N.; Nurick, G.N.; Langdon, G.S. The effect of stand-off distance on the failure of fully clamped circular mild steel plates subjected to blast loads. Eng. Struct. 2007, 29, 2723–2736. [Google Scholar] [CrossRef]
  14. Mehreganian, N.; Louca, L.A.; Langdon, G.S.; Curry, R.J.; Abdul-Karim, N. The response of mild steel and armour steel plates to localised air-blast loading-comparison of numerical modelling techniques. Int. J. Impact Eng. 2018, 115, 81–93. [Google Scholar] [CrossRef]
  15. Yuan, Y.; Tan, P.J. Deformation and failure of rectangular plates subjected to impulsive loadings. Int. J. Impact Eng. 2013, 59, 46–59. [Google Scholar] [CrossRef]
  16. Mohammadzadeh, B.; Noh, H.C. An analytical and numerical investigation on the dynamic responses of steel plates considering the blast loads. Int. J. Steel Struct. 2019, 19, 603–617. [Google Scholar] [CrossRef]
  17. Shi, S.Y.; Zhu, L.; Yu, T.X. Elastic-Plastic Response of Clamped Square Plates Subjected to Repeated Quasi-Static Uniform Pressure. Int. J. Appl. Mech. 2018, 10, 1850067. [Google Scholar] [CrossRef]
  18. Schiffer, A.; Tagarielli, V.L. The dynamic response of composite plates to underwater blast: Theoretical and numerical modelling. Int. J. Impact. Eng. 2014, 70, 1–13. [Google Scholar] [CrossRef]
  19. Latourte, F.; Gregoire, D.; Zenkert, D.; Wei, X.; Espinosa, H.D. Failure mechanisms in composite panels subjected to underwater impulsive loads. J. Mech. Phys. Solids 2011, 59, 1623–1646. [Google Scholar] [CrossRef]
  20. Jones, N. Note on the impact behaviour of fibre-metal laminates. Int. J. Impact Eng. 2017, 108, 147–152. [Google Scholar] [CrossRef]
  21. Lin, H.; Han, C.; Yang, L.; Zhang, L.; Luan, H.; Han, P.; Xu, H.; Zhang, S. Numerical Investigation on Performance Optimization of Offshore Sandwich Blast Walls with Different Honeycomb Cores Subjected to Blast Loading. J. Mar. Sci. Eng. 2022, 10, 1743. [Google Scholar] [CrossRef]
  22. Liu, F.; Zhang, M.T.; Wang, Z.Y. Experimental and simulation research on falling weight impact damage of carbon fiber unidirectional laminates. J. Ordnance Equip. Eng. 2022, 43, 16–24. [Google Scholar]
  23. Kim, J.M.; Varma, A.H.; Lee, K.; Kim, K. Steel-Plate Composite Walls Subjected to Missile Impact: Numerical Evaluation of Local Damage. J. Struct. Eng. 2022, 148, 04022153. [Google Scholar] [CrossRef]
  24. Zheng, C.; Wang, Y.W.; Kong, X.S.; Zhou, H.; Liu, H.; Wu, W. Predicting the Deflection of Square Plates Subjected to Fully Confined Blast Loading. J. Mar. Sci. Eng. 2020, 8, 1031. [Google Scholar] [CrossRef]
  25. Qin, Y.Z.; Yao, X.L.; Wang, Z.; Wang, Y. Experimental investigation on damage features of stiffened cabin structures subjected to internal blast loading. Ocean Eng. 2022, 265, 112639. [Google Scholar] [CrossRef]
  26. Langdon, G.S.; Kriek, S.; Nurick, G.N. Influence of venting on the response of scaled aircraft luggage containers subjected to internal blast loading. Int. J. Impact Eng. 2020, 141, 103567. [Google Scholar] [CrossRef]
  27. Yue, X.S.; Zhou, H.; Kong, X.S.; Zheng, C.; Wu, W.G. Experimental and simulation study of afterburning effect for blast load in confined cabin. Zhongguo Jianchuan Yanjiu 2023, 18, 223–232. [Google Scholar] [CrossRef]
  28. Fay, S.D.; Rigby, S.E.; Tyas, A.; Clarke, S.D.; Reay, J.J.; Warren, J.; Brown, R. Displacement timer pins: An experimental method for measuring the dynamic deformation of explosively loaded plates. Int. J. Impact Eng. 2015, 86, 124–130. [Google Scholar] [CrossRef]
  29. Yao, S.J.; Zhang, D.; Lu, F.Y.; Wang, W.; Chen, X.G. Damage features and dynamic response of RC beams under blast. Eng. Fail. Anal. 2016, 62, 103–111. [Google Scholar] [CrossRef]
  30. Yao, S.J.; Zhang, D.; Chen, X.G.; Lu, F.Y.; Wang, W. Experimental and numerical study on the dynamic response of RC slabs under blast loading. Eng. Fail. Anal. 2016, 66, 120–129. [Google Scholar] [CrossRef]
  31. Helm, J.D.; McNeill, S.R.; Sutton, M.A. Improved 3D image correlation for surface displacement measurement. Opt. Eng. 1996, 35, 1911–1920. [Google Scholar] [CrossRef]
  32. Sutton, M.A.; Orteu, J.; Schreier, H.W. Image Correlation for Shape, Motion and Deformation Measurements; Springer: Greer, SC, USA, 2009. [Google Scholar]
  33. Tiwari, V.; Sutton, M.A.; McNeill, S.R.; Xu, S.; Deng, X.; Fourney, W.L.; Bretall, D. Application of 3D image correlation for full-field transient plate deformation measurements during blast loading. Int. J. Impact Eng. 2009, 36, 862–874. [Google Scholar] [CrossRef]
  34. Rigby, S.E.; Tyas, A.; Curry, R.J.; Langdon, G.S. Experimental Measurement of Specific Impulse Distribution and Transient Deformation of Plates Subjected to Near-Field Explosive Blasts. Exp. Mech. 2019, 59, 163–178. [Google Scholar] [CrossRef]
  35. Spranghers, K.; Vasilakos, I.; Lecompte, D.; Sol, H.; Vantomme, J. Numerical simulation and experimental validation of the dynamic response of aluminum plates under free air explosions. Int. J. Impact Eng. 2013, 54, 83–95. [Google Scholar] [CrossRef]
  36. Kumar, P.; LeBlanc, J.; Stargel, D.S.; Shukla, A. Effect of plate curvature on blast response of aluminum panels. Int. J. Impact Eng. 2012, 46, 74–85. [Google Scholar] [CrossRef]
  37. LS-DYNA Keyword User’s Manual; Livermore Software Technology Corporation: Livermore, CA, USA, 2012.
  38. Li, S.Q.; Lu, G.X.; Wang, Z.H.; Zhao, L.M.; Wu, G.Y. Finite element simulation of metallic cylindrical sandwich shells with graded aluminum tubular cores subjected to internal blast loading. Int. J. Mech. Sci. 2015, 96–97, 1–12. [Google Scholar] [CrossRef]
  39. Yuan, Y.; Zhang, C.J.; Xu, Y.X. Influence of standoff distance on the deformation of square steel plates subjected to internal blast loadings. Thin-Walled Struct. 2021, 164, 107914. [Google Scholar] [CrossRef]
  40. Yao, S.J.; Zhang, D.; Lu, Z.J.; Lin, Y.; Lu, F. Experimental and numerical investigation on the dynamic response of steel chamber under internal blast. Eng. Struct. 2018, 168, 877–888. [Google Scholar] [CrossRef]
  41. Dey, S.; Børvik, T.; Hopperstad, O.S.; Langseth, M. On the influence of constitutive relation in projectile impact of steel plates. Int. J. Impact Eng. 2007, 34, 464–486. [Google Scholar] [CrossRef]
  42. Fan, Z.Q.; Li, X.B.; Huang, T.; Chen, W. An Investigation of the Damage Mechanism of Multilayer Liquid-Containing Protective Structure under Combined Blast Wave and Fragment Loading. J. Mar. Sci. Eng. 2023, 11, 2327. [Google Scholar] [CrossRef]
  43. Yao, S.J.; Wang, Z.F.; Zhang, D.; Lu, F.; Zhao, N.; Wang, Y. Damage evaluation and prediction of steel box structures under internal blast. J. Mech. Sci. Technol. 2022, 36, 5125–5133. [Google Scholar] [CrossRef]
  44. Ma, J.; Fan, F.; Zhi, X. Counter-intuitive collapse of single-layer reticulated domes subject to interior blast loading. Thin-Walled Struct. 2015, 96, 130–138. [Google Scholar] [CrossRef]
  45. Flores-Johnson, E.A.; Li, Q.M. A brief note on the counter-intuitive region of a square plate. Int. J. Impact Eng. 2010, 38, 136–142. [Google Scholar] [CrossRef]
Figure 1. Defensive technique applied in ocean engineering; [2]—Zhang et al., 2019; [3]—Zhang et al., 2015.
Jmse 12 00224 g001
Figure 2. Stress–strain curves of quasi-static tensile tests.
Jmse 12 00224 g002
Figure 3. (a) Schematic experiment setup of the cabin model and (b) TNT suspension.
Jmse 12 00224 g003
Figure 4. The layout of the high-speed digital cameras.
Jmse 12 00224 g004
Figure 5. Diagram of the DIC workflow.
Jmse 12 00224 g005
Figure 6. DIC results of the dynamic response process of the CB plate.
Jmse 12 00224 g006
Figure 7. Finite element models of (a) UB and (b) CB.
Jmse 12 00224 g007
Figure 8. Mesh size sensitivity analysis: (a) pressure near the inner face of the plate center; (b) resulting displacement of the plate center.
Jmse 12 00224 g008
Figure 9. Logarithmic relationship between stress and strain.
Jmse 12 00224 g009
Figure 10. Deformation features of the experimental and numerical results: (a) experimental result; (b) simulated result.
Jmse 12 00224 g010
Figure 11. Comparison of the plate center deflection–time curves.
Jmse 12 00224 g011
Figure 12. Comparison of the z-direction strain in typical positions.
Jmse 12 00224 g012
Figure 13. Pressure–time curves of the UB and CB models at the target plate center.
Jmse 12 00224 g013
Figure 14. The pressure contours of the shock wave propagation of the CB simulation.
Jmse 12 00224 g014
Figure 15. Resultant displacement of the middle section under UB.
Jmse 12 00224 g015
Figure 16. Resultant displacement of the middle section under CB.
Jmse 12 00224 g016
Figure 17. Cross-sectional deformation profiles of the UB model at different typical times.
Jmse 12 00224 g017
Figure 18. Cross-sectional deformation profiles of the CB model at different times.
Jmse 12 00224 g018
Figure 19. Deformation features of the CB model at t = 1.12 ms.
Jmse 12 00224 g019
Figure 20. Response mechanism comparison between (a) UB and (b) CB.
Jmse 12 00224 g020
Table 2. Parameters of the J–C material model and Gruneisen state equation for steel.
J–C Model ρ  (kg/m3)E (GPa)G (GPa) v A (MPa)B (MPa)ncm
783021180.80.33554141.090.010.669
SourceTestTest[14,40][14,40]TestTestTest[41,43][41,43]
Gruneisen EOSC (m/s)S1S2S3 γ 0 a
45691.49002.170.46
Source[40,41][40,41] [40,41][40,41]
Disclaimer/Publisher’s Note: The statements, opinions and data contained in all publications are solely those of the individual author(s) and contributor(s) and not of MDPI and/or the editor(s). MDPI and/or the editor(s) disclaim responsibility for any injury to people or property resulting from any ideas, methods, instructions or products referred to in the content.

