Article

Simulated Testing of the Characteristics and Environmental Impacts of Disinfection By-Products Generated by Ballast Water Management Systems in Ports during Phytoplankton Blooms

1
Department of Ballast Water Research Center, Korea Institute of Ocean Science Technology, Geoje 656-830, Republic of Korea
2
Department of Oceanography and Ocean Environmental Sciences, Chungnam National University, 99 Daehak-ro, Yusung-gu, Daejeon 305-764, Republic of Korea
*
Author to whom correspondence should be addressed.
J. Mar. Sci. Eng. 2024, 12(2), 238; https://doi.org/10.3390/jmse12020238
Submission received: 29 December 2023 / Revised: 24 January 2024 / Accepted: 25 January 2024 / Published: 29 January 2024
(This article belongs to the Section Marine Environmental Science)

Abstract

:
Ballast water management systems (BWMSs) using active substances (AS) have been subjected to land-based tests with artificially increased dissolved organic matter (DOM) and cultured species according to the International Maritime Organization G9 guidelines before the BWMS Code revision. Therefore, data on the environment risk assessment (ERA) of disinfection by-products (DBPs) for actual port DOM and natural species are limited. This study was conducted using seawater from Jangmok Bay, South Korea, during a phytoplankton bloom. In treated water with a high biological content (Group A), the DBPs concentration increased as the initial AS concentration increased. However, in treated water with a low biological content (Group B), the DBPs concentration did not increase as the initial AS concentrations. The higher the residual AS concentration on day 5, the more the DBPs concentration increased, and the composition ratio of the DBPs was also affected. The ERA to individual DBP was evaluated as low given <1 for the ratio of the predicted environmental concentration to the predicted no-effect concentration in port environments exposed to DBPs in discharged ballast water. This result may suggest that the ERA of IMO G9 performed with cultured species and additives could substitute the outcome obtained with natural plankton assemblages.

1. Introduction

Research on disinfection by-products (DBPs) in drinking water treated with active substances (AS) has been conducted since the 1970s; however, interest in AS in seawater has increased since the 2000s because of developments in seawater desalination and ship ballast water management systems (BWMSs) [1,2,3]. In particular, a ship’s ballast water is a pathway for the transfer of invasive species, which led the International Maritime Organization (IMO) to establish the Ballast Water Management Convention in 2004. With its enforcement, all ships traveling in international waters have been required to install BWMSs from 2017 for new ships and from 2019 to 2024 for existing ships to treat and discharge their ballast water.
To verify the biological efficacy of the BWMSs, both land-based and shipboard tests must be passed per the BWMS Code of the IMO or the environmental technology verification (ETV) protocol of the United States Coast Guard (USCG) to obtain type approval by the government. BWMSs employ various technologies (e.g., electrolysis, UV, ozone, heat treatment, and filtration), with an emphasis on devices utilizing AS [4]. BWMS that utilize AS must undergo an analysis of relevant chemicals and whole effluent toxicity (WET) tests following IMO G9 regulations in line with the methodology for information gathering and the conduct of work by the Group of Experts on the Scientific Aspects of Marine Environmental Protection (GESAMP)-Ballast Water Working Group (BWWG) to assess their environmental impact. Equipment using UV does not form DBPs, so it does not undergo G9. The GESAMP-BWWG developed the Methodology for the basic and final approval of these BWMS [5]. The range of total residual oxidants (TRO) in type-approved BWMS using AS varies from 2.0 to 20 mg/L, but most are in the range of 6–10 mg/L. According to IMO G9 regulations, ballast water treated with AS is neutralized to a TRO concentration of less than 0.1 mg/L when discharged [1,6].
According to previous studies, the generation of disinfection by-products (DBPs) by sterilization devices using AS is influenced by the form and concentration of oxidants, contact time, organic matter concentration and characteristics, and water quality conditions such as salinity, pH, and temperature [7,8,9,10,11,12]. Shah et al. reported that trihalomethanes (THMs) and haloacetic acids (HAAs) are influenced by the degree of salinity (especially the bromide concentration), the concentration and form of the dissolved organic matter (DOM), and the type/dose of oxidants [8]. Kim et al. also reported that the high concentration of bromide and iodide ions in seawater could make DBP toxicity a serious issue in marine environments, with water temperature and pH having a notable impact [2]. Woo et al. reviewed 209 types of DBPs formed in drinking water treatment systems, and Gonsior reported the detection of 462 distinct brominated DBPs in seawater [13,14]. The types of DBPs formed can vary depending on the characteristics of DOM, and the toxicity of these DBPs can vary depending on the individual substances. Generally, the toxicity of Br-DBPs is higher than that of C-DBPs, and among Br-DBPs, Br-halonitromethanes (Br-HANs) are highly toxic even at low concentrations [1,3,7,8,14,15,16,17]. Therefore, environmental hazards could increase when ballast water is treated with BWMS using AS in seawater with high bromide concentrations. In addition, the efficiency of BWMS using electrolytic devices is influenced by factors such as the salinity, pH, and water temperature of ship ballast water [3,8,11,17]. Cha et al. reported that when the pH drops to around 6, the proportion of HOCl or HOBr increases by about 7%, and these compounds have stronger sterilizing powers than OCl- and/or OBr- [10]. Therefore, lowering the pH of ship ballast water could be a way to enhance biocidal effectiveness at lower TRO concentrations.
Phytoplankton blooms correspond to the highest concentration of organic matter in the marine environment. In particular, the concentration of organic matter increases during the growth and death of phytoplankton [18,19,20,21]. The characteristics of the DOM produced vary depending on the type of phytoplankton and the growth stage. Most international ports are located along estuaries and rivers. Where water flow is weak and nutrient concentrations are high, making these areas prone to frequent massive outbreaks of phytoplankton [22,23,24].
After 2024, all international vessels operating in ports will be required to treat ballast water; thus, the use of AS for this purpose is expected to increase. Therefore, BWMS using AS must undergo environmental risk assessments according to IMO G9 [25]. Currently, most of them have been tested under the 2008 G8 guidelines [26] with artificially increased DOM using additives (e.g., glucose or lignin) and cultured species (e.g., Tetraselmis sp.) for land-based tests. The 2008 IMO G8 revised the BWMS Code [27], and the U.S. government also recommended operating only BWMSs validated through the ETV protocol of 2016. Consequently, the biological efficacy testing of most BWMSs was also conducted using wild phytoplankton species following the BWMS Code and ETV protocol. However, environmental risk assessments were not reevaluated and were acknowledged by the GESAMP without further assessment. Since 2008, the IMO G8 has only considered tests conducted in two salinities (seawater and brackish water) as well as land-based tests for biological efficacy in freshwater for the environmental risk assessment of BWMS using AS. Therefore, the information on DBPs generated when treating wild phytoplankton species with AS in saltwater is limited.
Therefore, this study aimed to identify the characteristics of DBPs based on TRO concentrations when treating seawater during phytoplankton blooms in the natural marine environment. The focus was on understanding how DBPs are influenced by naturally occurring DOM concentrations. This work is expected to provide relevant data for evaluating the environmental impact of DBPs, which could become an important issue as the use of AS for BWMS in ports is expected to intensify starting in 2024. Additionally, we sought to examine the effect of pH changes on DBP formation to improve the treatment efficiency of BWMS and DBP formation.

2. Materials and Methods

2.1. Testing Method

Seawater was collected from Jangmok Bay, South Korea, during a massive phytoplankton bloom in November 2016 (Figure 1). The study focused on the formation of DBPs according to the concentration of AS and DOM. The total population of phytoplankton in the test water was 3010 cells/mL, and the dinoflagellate Akashiwo sanguinea was predominant at 2160 cells/mL (Table 1). In this, we simulated the BWMS by direct injection of an AS, which was not produced by a BWMS. Seawater was treated by directly injecting AS into a Nalgene 10 L bottle. The experiment was conducted with eight water samples divided into three groups. Group A had different concentrations of AS in the raw water (5 mg/L (TH5), 10 mg/L (TH10), and 15 mg/L (TH15)). In Group B, the raw water was diluted five times and the TRO concentration was adjusted at 5 mg/L (TL5), 10 mg/L (TL10), and 15 mg/L (TL15). In Group C, the pH was adjusted with CO2 gas, and then 10 mg/L of TRO was injected into the raw water (TH10-pH) and diluted water (TL10-pH). The TRO concentration was adjusted by injecting a certain amount of sodium dichloroisocyanurate (NaDCC) into the test water. The treated samples were kept in an incubator at 20 °C in the dark. This study was conducted once each with gradients of phytoplankton and NaDCC concentrations.

2.2. Environmental Analysis

General environmental parameters, such as the water temperature, salinity, and turbidity, were measured using an YSI Exo II Sonde (YSI Co., Yellow Springs, OH, USA). Samples for measuring dissolved organic nitrogen (DON) were filtered through a glass microfiber filter paper (GF/F, Whatman Co., Maidstone, UK), stored in a freezer below −20 °C, and analyzed within 28 days. DON was calculated by subtracting the dissolved inorganic nitrogen (DIN) from the total dissolved nitrogen (TDN) measured using a nutrient analyzer (QuAAtro, Seal Analytical Co, King’s Lynn, UK). TRO measurements were conducted using the DPD (N,N′-diethyl-p-phenylenediamine) method, which involves measuring the absorbance of a red solution, using a Pocket ColorimeterTMII (Hach Co., Loveland, CO, USA). Samples for measuring dissolved organic carbon (DOC) were gravity-filtered using a GF/F filter baked at 450 °C and a glass syringe and then acidified to 1 ≤ pH ≤ 2 by adding 50% phosphoric acid (H3PO4). After acidification, the samples were stored in a freezer below −20 °C and analyzed within 28 days. DOC analysis was performed using a TOC analyzer (TOC-VCPH, Shimadzu Co., Kyoto, Japan). Samples for chlorophyll a and active chlorophyll a were stored in a dark room for more than 10 min before measurement with a PHYTO-PAM (Walz Co., Heinz, Germany). The analysis in the laboratory, excluding field measurements, was performed in triplicate.

2.3. Analysis and Risk Assessment of Disinfection By-Products

In this study, 41 potential DBPs associated with BWMS, as outlined in the Marine Environment Protection Committee (MEPC) document MEPC 67/INF.17 of the IMO, were analyzed (Table 2) [28]. The concentrations of trihalomethanes (THMs) were measured utilizing a headspace (HS) method coupled with gas chromatography (GC) and a mass spectrometry (MS), per the United States Environmental Protection Agency (USEPA) method 8260C (Agilent Inc., Santa Clara, CA, USA). The concentrations of HAAs and HANs were assessed using a GC system equipped with an electron-capture detector, following the guidelines of US EPA 552.2:2003 and US EPA 551.1:1995. For THM analysis, a DB-624 column (60 m length, 0.25 mm inner diameter, 14 µm stationary phase) was employed, whereas for HAAs, a DB-1701 column (30 m length, 0.32 mm inner diameter, 0.25 µm stationary phase) was used, and for HANs, a DB-5 column (30 m length, 0.25 mm inner diameter, 0.25 µm stationary phase) was used. The standard solutions for THMs, HAAs, and HANs were obtained from AccuStandard (New Haven, CT, USA). The samples were quantified using calibration standards, adhering to protocols for both external and internal calibration methods or as otherwise detailed in the specific method. All extraction reagents were of high-performance liquid chromatography (HPLC) grade or superior. The method detection limit (MDL = t × sd, where sd represents the standard deviation of the dataset and t is the critical value from a Student’s t-test with n − 1 degrees of freedom at a 95% confidence interval) and the method quantification limit (MQL = 10 × sd) were determined using the lower-concentration spiked samples. The relative standard deviations (RSDs) of the laboratory control samples (LCSs) used for constructing the calibration curves complied with the criterion |RSD| < 15%.

2.4. Environmental Risk Assessment

The Marine Anti-Foulant Model to Predict Environmental Concentrations (MAMPEC) was used to calculate the predicted environmental concentrations (PECs) of relevant chemicals in GESAMP-BWWG Model Harbors (MAMPEC-BW Model 3.1.0.3). This model can be modified to calculate the concentrations of substances released into water by specific processes, such as ballast water treatment, making it a useful tool for environmental impact studies. In calculating the PECs using the MAMPEC-BW model, the worst-case scenario was assumed, in which 100,000 m3 of ballast water is discharged and the chemicals in this discharge do not subsequently decay in the water of the harbor. The PECs under general conditions for all of the relevant chemicals were taken to be the highest concentration (i.e., the maximum discharge) observed on Days 1 and 5 of water treatment after neutralization. The PECs were calculated for fresh, brackish, and marine water. The predicted no-effect concentration (PNEC) values are normally derived from acute and/or chronic aquatic toxicity results for relevant aquatic species by dividing the lowest available effect concentration with an appropriate assessment factor [5]. The values of the assessment factors (AF) depend on the composition of the ecotoxicity data for the PNEC derivation. If the ecotoxicity dataset is properly constructed considering the tropic level, the lower value of AF is considered; otherwise, the higher value of AF is considered. The factors are inversely proportional to the availability and quality of toxicity data. Due to their simplicity and minimal data requirements, methods that use AFs are globally used in preliminary ecological risk assessments [29]. For the predicted no-effect concentration (PNEC), we used the values provided by IMO’s Global Integrated Shipping Information System (GISIS) to establish the ecotoxicity for each chemical (https://gisis.imo.org, assessed on 11 November 2023). If the PEC/PNEC ratio under general conditions was 1 or higher for those DBPs present above the detection limit, then they were considered potentially harmful to the environment.

3. Results

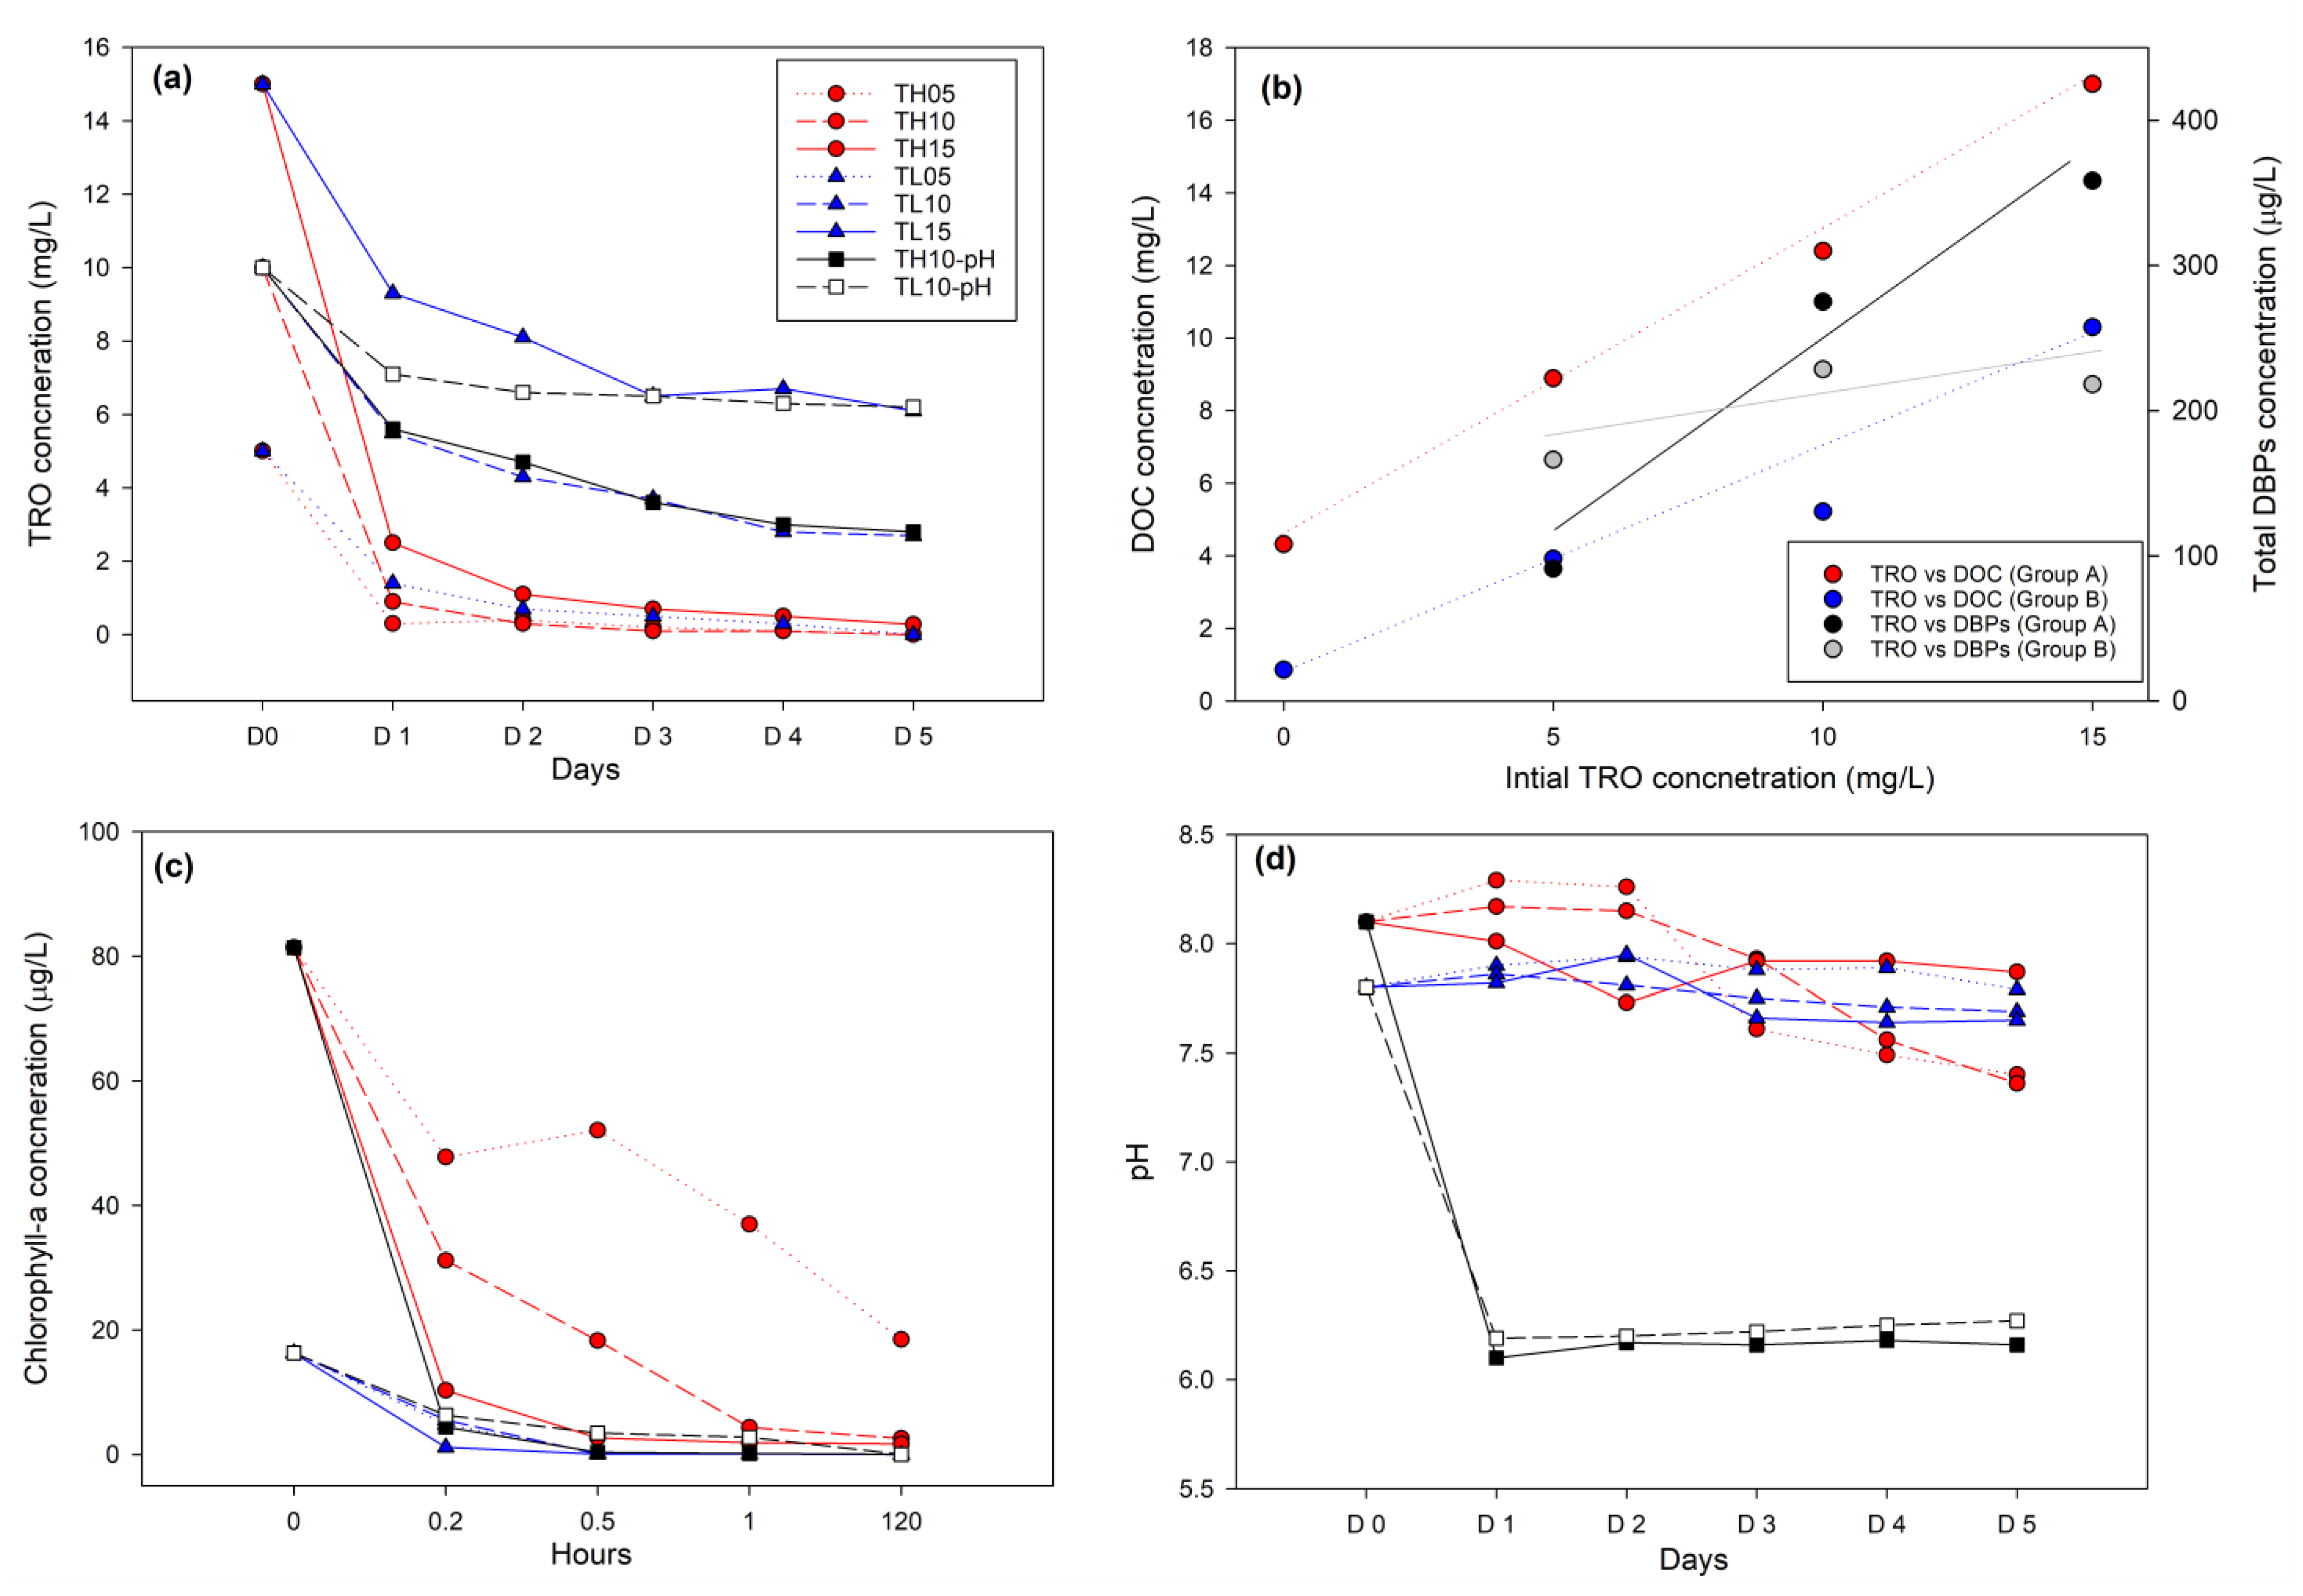
3.1. Environmental Parameters

One day after treatment with AS, Group A showed TRO concentrations ranging from 0.30 to 2.50 mg/L, whereas Group B displayed higher concentrations ranging from 1.40 to 9.30 mg/L (Figure 2a). The initial DOC concentration of the test water was 4.32 mg/L, and after treatment with AS (Day 1), it ranged from 3.92 to 17.0 mg/L, with an increase in the initial DOC concentration observed in all test groups (Table 3). The DOC concentrations in Groups A and B increased with an increasing TRO concentration (Figure 2b). Group C exhibited similar or higher values compared to the TH10 and TL10 samples under the same biological and TRO conditions (Table 3). On Day 5, the DOC concentration in Group A decreased, whereas Groups B and C showed an increase (Table 3), except for the TL15 sample. Initially, the pHs of Group A and Group B were 8.10 and 7.80, respectively. After exposure to AS, the concentration of chlorophyll a tended to decrease after 60 min, but in the case of TH05, the concentration of chlorophyll a remained high even after that period and continued to show high values on Day 5 (Figure 2c). However, the concentration of active chlorophyll decreased to <0.01 μg/L within 10 min after treatment with AS, suggesting that almost all phytoplankton were killed after the treatment. However, on Day 5, a somewhat lower value of active chlorophyll a was detected in Group A, particularly in TH05, indicating the possibility of phytoplankton regrowth (Table S1). On Day 1, the pH of Group A ranged from 8.01 to 8.29 and that of Group B from 7.82 to 7.90. Within the same group, the pH was lower when the TRO concentration was higher (Table 3). In both Groups A and B, the pH decreased on Day 5, and Group A exhibited a greater decrease in pH than Group B (Figure 2d). The decrease in pH was particularly notable in TH05 and TH10. Nevertheless, the pH of the test waters treated with CO2 injection did not show any significant differences between Days 1 and 5.

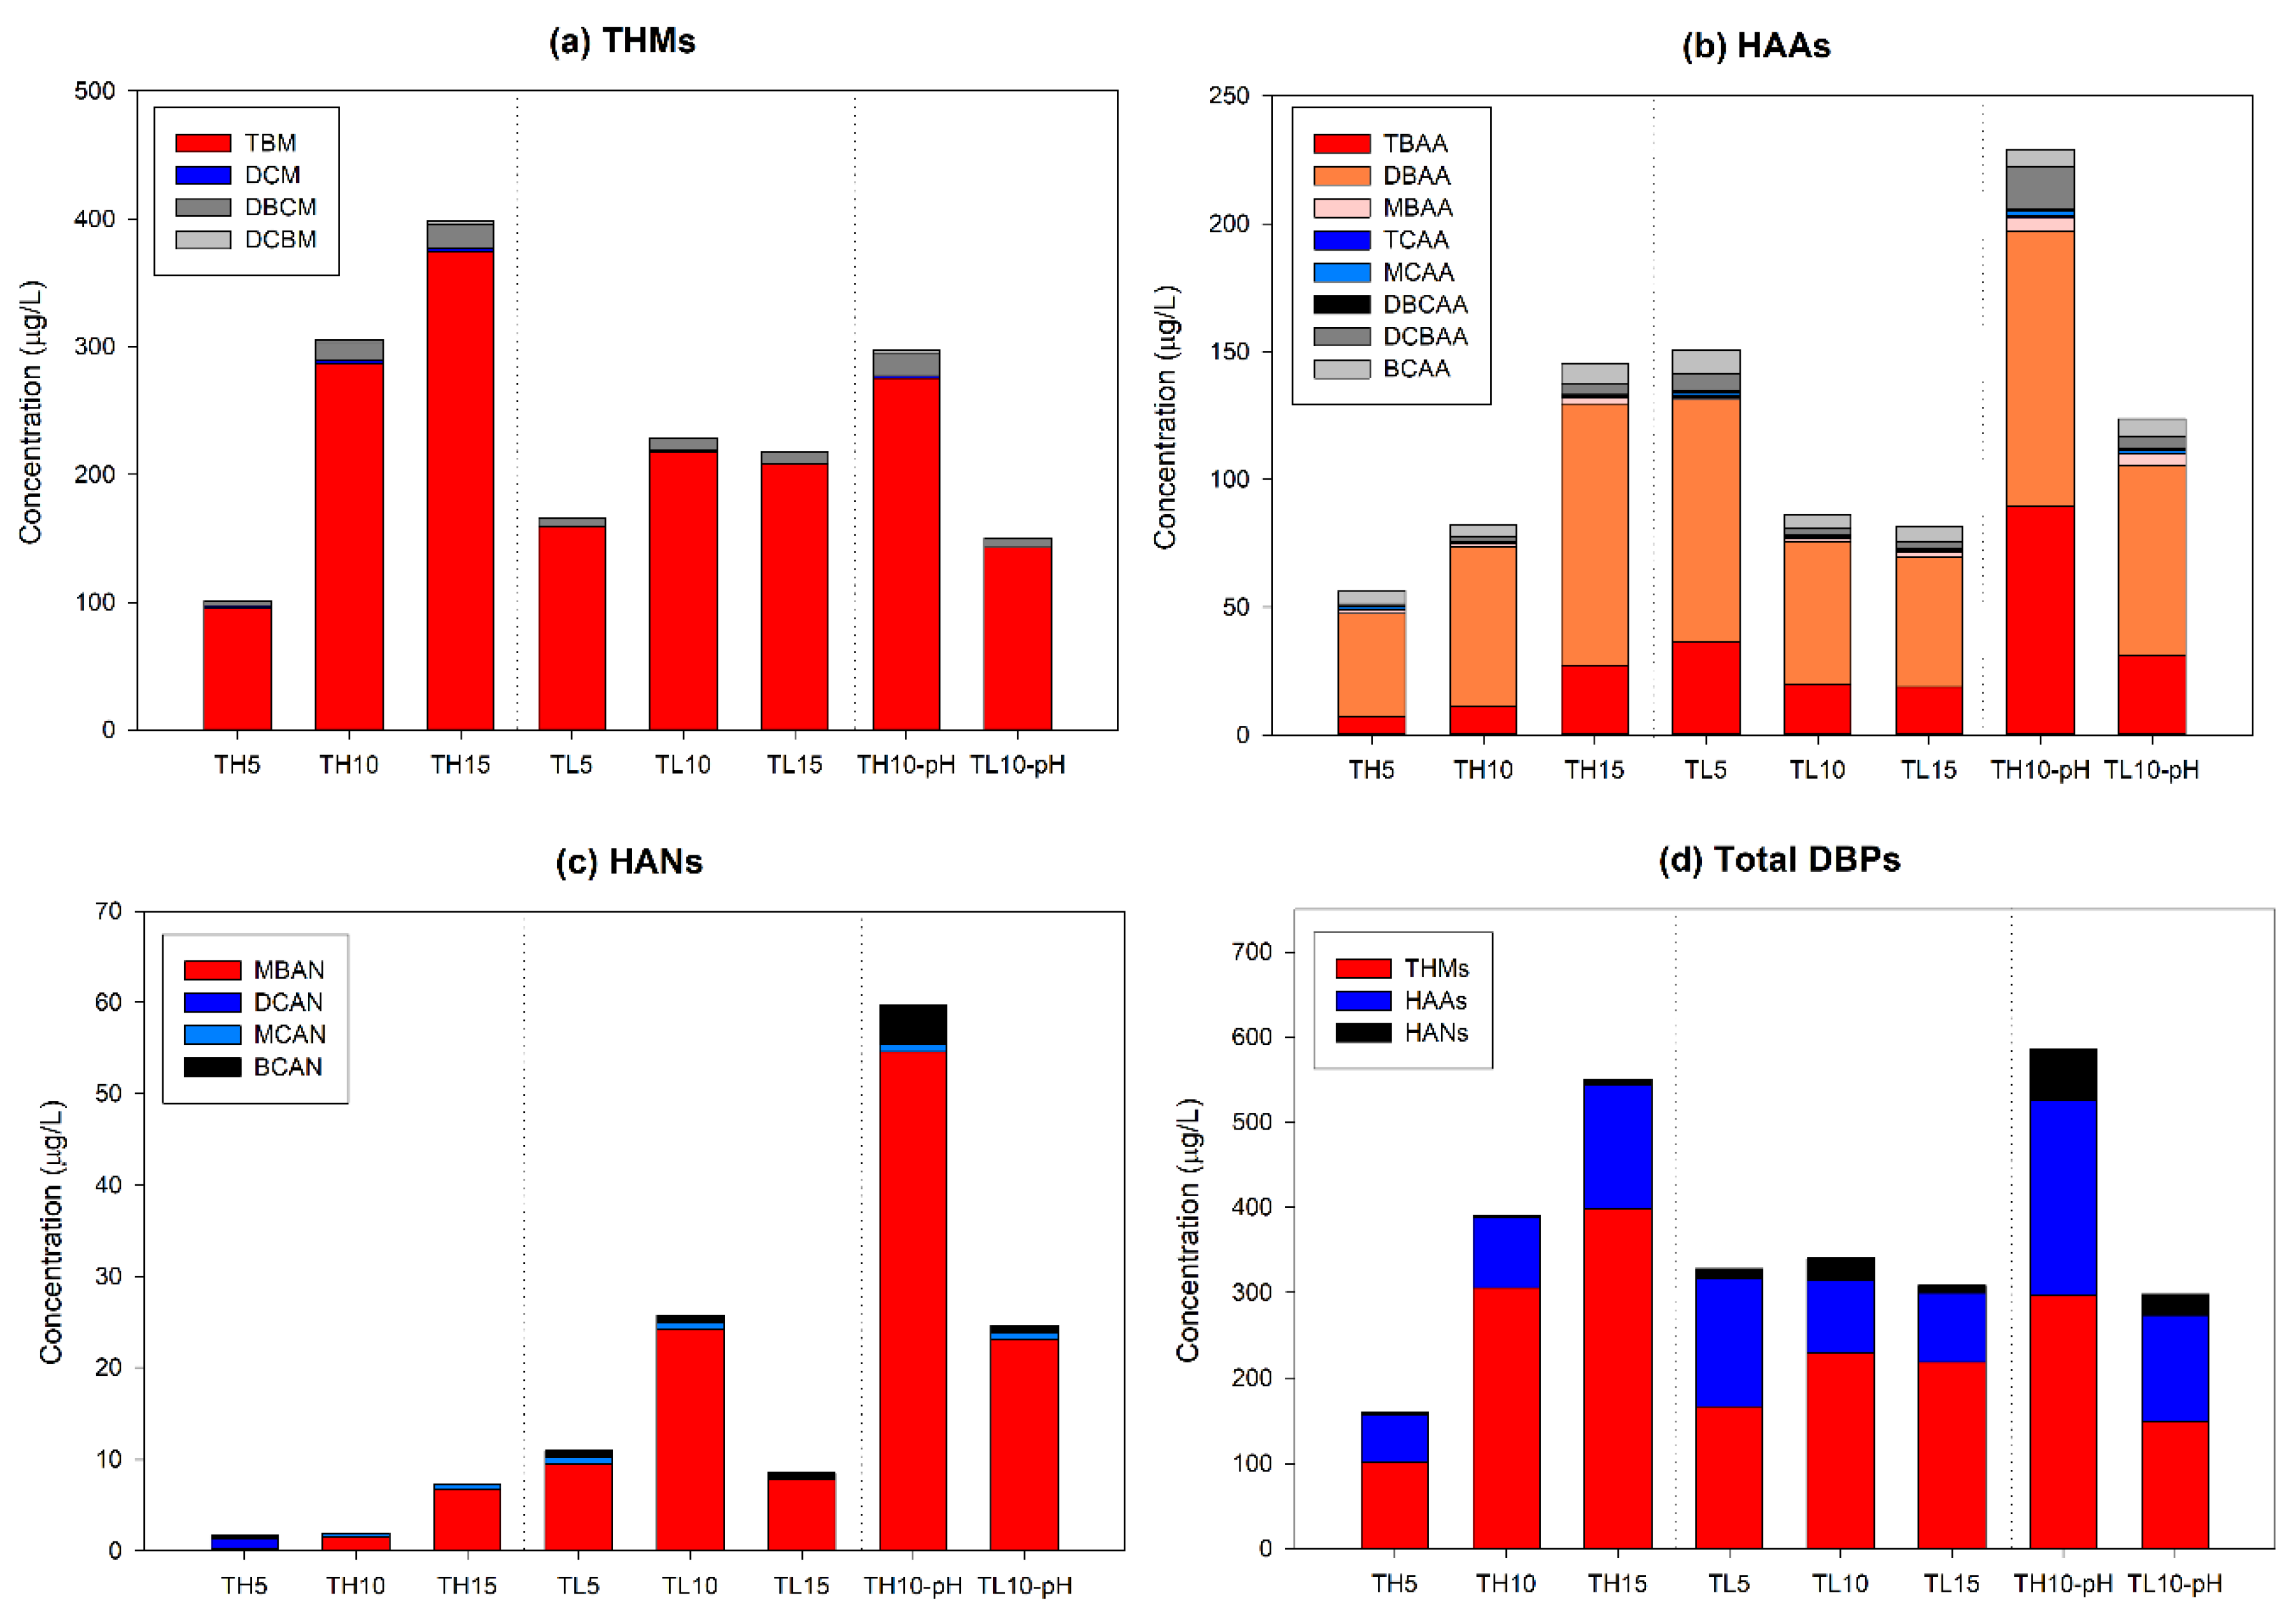
3.2. Changes of the DBP Concentration on Day 1 and Day 5

The concentrations of individual and total DBPs for each group on Day 1 are presented in Figure 3. The concentration of total DBPs in Group A tended to increase as the TRO concentration increased, with this trend being particularly evident in the main DBP groups (THMs and HAAs) (Figure 3). By contrast, in Group B, although the DOC concentration increased with the increase in TRO, there were no significant differences in the concentrations of the total DBPs in the test waters (Figure 2b). The concentration of HANs also showed an increasing trend in groups with a higher TRO (Figure 3). In Groups A and B, the highest values were observed in the TL10, whereas in Group C, the TH10-pH sample exhibited the highest values. The test waters with high HAN concentrations were TH15, TL10, and TH10-pH. When looking at the composition ratio of DBPs in each group, Group A showed THM, HAA, and HAN ratios of 71.4%, 27.6%, and 1.0%, respectively; Group B showed 62.9%, 32.6%, and 4.6%, respectively; and Group C showed 54.6%, 37.7%, and 7.7%, respectively (Figure S1). The predominant types of DBPs were similar among the groups: TBM among THMs, DBAA and TBAA among HAAs, and MBAN among HANs.
On Day 5, the concentrations of individual and total DBPs were analyzed only in Group A (Figure 4). The total DBP concentration decreased by 12% in TH05 but increased by 40% and 28% in TH10 and TH15, respectively. The increased total DBP concentrations in TH15 and TH10 were similar, at 156.7% and 155.6%, respectively. However, while the increase in THM concentration was more marked in TH15, the increase in HAA concentration was more pronounced in TH10. From the perspective of the composition ratio of DBPs, TH05 showed a 13.8% increase in THMs but a 56.6% decrease in HAAs, whereas TH10 exhibited a 0.5% increase in THMs and a 176% increase in HAAs, and TH15 showed a 21% increase in THMs and a 51.1% increase in HAAs. When the TRO concentration was high, the composition ratio and concentration of THMs increased, and when the TRO concentration was low, the concentration and composition ratio of HAAs increased, which was similar to the results of TH15 and TH05 on Day 1.
When comparing the test waters of Groups A and B under the same biological and TRO conditions as those of Group C (TH10 vs. TH10-pH, TL10 vs. TL10-pH), we observed that the total DBP concentration was higher in the test waters of Group C. The concentration of HAAs and HANs in TH10-pH was higher as the biological content was higher (TH10 vs. TH10-pH) while maintaining a similar THM concentration (Figure 3). In the test water with a lower biological content (TL10 vs. TL10-pH), the THM concentration decreased, whereas HAAs increased and HANs remained similar.

3.3. MEPC Results of Type Approved BWMSs by Applying 2008 G8 Guideline

The TRO range for BWMSs using AS with type approval (34 BWMSs) varies from 1 to 20 mg/L, with equipment with a target TRO of 8–10 mg/L accounting for the highest proportion (15 BWMSs) [30]. The environmental information for BWMSs approved by the MEPC with a maximum allowable concentration of AS of 9–11 mg/L is summarized in Table 4. The land-based tests submitted to MEPC used the cultured species Tetraselmis sp. to represent phytoplankton sized ≥10 and <50 μm, and most used glucose to increase the DOM in the test water. The phytoplankton content was between 1195 and 2691 cells/mL (an average of 1803 cells/mL). The DOC concentration ranged from 1.99 to 3.34 mg/L. The types of DBPs detected in the G9 tests ranged from 12 to 16 (an average of 13). To compare the DBP concentrations from type-approved BWMSs with those from the TH10 in this study, the DBP concentrations were divided by the initial DOC concentrations and then visualized (Figure 4, Table S2 and S3).

4. Discussion

4.1. Changes of Organic Matter Concentration According to Environmental Conditions

Within the same group, the higher the initial TRO concentration, the higher the TRO concentration, indicating that the biological content plays a major role in the consumption of TRO (Figure 2a). Also, the higher the TRO concentration, the lower the chlorophyll concentration, indicating that the degree of cell destruction varies depending on the initial TRO intensity, which affects the amount of DOM released from the cells (Figure 2b,c). This is also reflected in DON, which shows a similar trend, indicating an increase in DOM and DON when biological mortality occurs (Table 3). Additionally, Group C showed TRO concentrations of 2.80 mg/L (TH10-pH) and 6.20 mg/L (TL10-pH), which were approximately 5-fold higher, and a higher DOC concentration than the test water of the other groups under the same conditions of TRO concentration and phytoplankton abundance (Table 3). This implies that biological mortality increased as a result of the pH adjustment.
The DOC concentration in ballast water may increase due to the input of new DOM because of the enhanced organic matter decomposition by the TRO, or it may decrease as a carbon source for the growth of heterotrophic bacteria. Furthermore, when the TRO is high, the growth of heterotrophic bacteria is inhibited, which means that a decrease in DOM concentration by microbial consumption is inhibited [3,31,32]. Therefore, we speculate that, in Group A, the consumption of DOC by heterotrophic bacteria was high on Day 1 because of the lower TRO concentration compared to Group B. On the other hand, in Group B, except for TL15, new DOM continued to be supplied due to the higher TRO concentration. In TL15, despite the high TRO concentration, the DOC concentration did not increase, but the decrease was less marked than in Group A. In addition, Group C also had a continued DOM supply because of the high TRO concentration, particularly in TH10-pH, where the highest amount of DOM was released as a result of the high organic matter content. Consequently, in waters with a high TRO concentration, DOM supply continues, whereas in cases with low TRO, consumption by heterotrophic bacteria predominates, leading to a decrease in the DOM concentration.

4.2. Changes in the DBP Characteristics According to the Organic Matter Concentration

Generally, the decrease in TRO can be due to consumption by the DOM and the organisms, as well as environmental factors such as the water temperature [1,8]. But, as only the biological content and TRO concentration varied in this study, the biological content was considered to be the only different factor in the TRO consumption among the test waters. On day 1, in Groups A, as the initial TRO concentration increased, the DOM concentration also increased. This phenomenon is associated with the decrease in the chlorophyll concentration as the TRO concentration increases (Figure 2b). In other words, a higher TRO concentration suggests greater biological mortality, leading to an increase in DOM derived from the organisms. Assuming that the consumed TRO concentrations for biological decay are the same in Group A, the higher the concentration of TRO, the higher the concentration of total DBPs resulting from the reaction with DOM, a precursor of DBPs. However, in Group B, despite the increase in both initial TRO and DOC concentrations, the total concentration of DBPs did not increase. This is because not all the formed DOC reacts with the AS; instead, only a portion of the DOC reacts with the AS to form DBPs [30]. Therefore, Group A, which had a higher biological content, exhibited an increase in the precursors of DBPs with the increase in TRO concentration. By contrast, in Group B, despite the increase in TRO concentration, the increase in DBP precursors was limited because of the lower biological content.
THMs are formed in greater quantities compared to HAAs, which can be attributed to the structural propensity of DOM precursors to more readily bond with THMs and their more stable formation in reactions with oxidants. Studies on BWMS using AS also predominantly showed that the predominant compounds were in the order of THMs > HAAs > HANs [3,7,15,17]. The proportion of HAAs tended to increase with higher average TRO concentrations in each group (Figure S1). Shah et al. reported that TBM and TBAA are formed from similar DOM pools, whereas DBAA is likely from a different DOM pool [8]. Our results suggest that, in cases where TBM and TBAA compete in the same DOM pool, the concentration and proportion of TBAA increase when the TRO concentration is high, as seen in the TH10-pH sample (Figure S1). The HAN concentrations also tended to increase with higher TRO concentrations in each group (Table 3). Although TL15 showed the highest TRO concentration among all test groups and the highest DOM concentration in Group B, it had the lowest DON concentration among all test groups. This shows that when the DON and TRO concentrations are high, the concentration of the precursor of N-DBPs can also be high [1,33].
Various factors (e.g., water temperature, DOM characteristics, pH, and amount of oxidant) determine the group-specific concentration of DBPs while ballast water is stored in tanks [12,34]. Especially, the TRO concentration during storage can lead to changes in the concentration and composition of DBPs in ballast water because of the regeneration of DOM and the introduction of new DOM. The results of this study on Day 5 suggest that when the remaining TRO concentration is high, DOM acting as a precursor to DBPs rapidly forms THMs, and when the oxidizing power is weak, the formation of HAAs is prioritized (Figure 4). Therefore, considering various ballasting and de-ballasting scenarios, the composition and concentration of DBPs in discharged ballast water can change, highlighting the need for further research to monitor DBPs in ports.
Following type approval, the BWMS are only checked for compliance with biological discharge standards through commissioning tests required by the IMO [35], whereas DBPs are monitored only to the extent of total THMs and HAAs according to the Vessel General Permit (VGP) in USCG. Our study shows that the total DBP concentration and composition ratio can be affected depending on the biological content and TRO concentration. BWMSs using AS have specific operating ranges (maximum and minimum doses) for TRO, but they do not adjust TRO concentrations based on biological contents or organic matter quantities because a target TRO is set for operation. Therefore, if the organic matter and biological content can be checked before ballasting or obtained through port monitoring, the total concentration of DBPs discharged to the port can be controlled by managing the target TRO differently depending on the biological content and DOM concentration in the port. This could help regulate the total DBP concentration discharged into the harbor. However, implementing such methods may face issues related to sensor accuracy and maintenance, the costs of port monitoring, and the increased potential for ecological disturbances due to invasive species. After September 2024, when all international ships will have BWMSs installed and operational, more DBPs could be introduced into ports, potentially increasing the environmental risk. Currently, the focus is on the invasion of non-indigenous species, but as the use of AS for ballast water treatment increases, environmental concerns related to DBPs may become more prominent.
Overall, when the pH decreases in seawater, THMs tend to decrease and HAAs and HANs tend to increase (Figure 3). Kim et al. reported that in the seawater desalination process, the higher the pH, the more THMs tend to increase [2,36]. Hansen et al. reported that in the chlorination of swimming pool water, a decrease in pH leads to a decrease in THMs but an increase in HANs and no effect on HAAs [36]. Cha et al. reported that increasing the pH to enhance the efficiency of ballast water treatment systems in brackish water leads to a 2- to 3-fold increase in THMs and HAAs but a decrease in HANs [10]. In a review paper on the chlorination of fresh water, Kali et al. mentioned that a high pH is conducive to the formation of THMs, whereas a low pH is conducive to the formation of HAAs [34]. Zhang et al. reported that an increase in pH generally leads to an increase in THMs and a decrease in HAAs, although the outcome varies according to the types of DBPs [37]. Although lowering the pH of ballast water in ships can enhance the efficiency of BWMS in terms of biological decay, this may lead to an increase in the total DBP concentration with a higher proportion of toxic HAAs and HANs, which could potentially raise the environmental risk in the port.

4.3. Comparison with MEPC Results

On Day 1, most types of DBPs were within the range of MEPC, but the concentrations of DBAA, BCAA, and MCAN were higher than the median values of MEPC. However, on Day 5, although individual DBP concentrations were within MEPC ranges, most were higher than the median values of MEPCs (Tables S2 and S3). This could be due to differences in the internal and external DOM concentrations and composition ratios as a result of the size differences between the cultured species Tetraselmis sp. and A. sanguinea. Considering the larger size of A. sanguinea (50–60 μm) compared to Tetraselmis sp. (10–20 μm), the concentration of DOM available for binding with DBPs is expected to be higher than that of Tetraselims sp. [38,39]. Furthermore, while the TRO concentration on Day 5 in the MEPC cases was >1 mg/L, it was completely depleted in this study. This suggests that higher levels of DBPs might occur in actual ports during phytoplankton bloom events compared to type-approval land-based tests.
Dibromoacetonitrile (DBAN) is an AS known to be highly toxic even at low concentrations; hence, its monitoring in ports is necessary [1,40]. Jang et al. reported that DBAN was detected in test waters (full-scale) injected with glucose to match the DOM test conditions, but it was not detected in test waters (lab-scale) using algal organic matter (AOM) [3]. Furthermore, although DBAN was detected in all test groups using glucose as per the MEPC, it was not detected in this study using wild phytoplankton species. N-DBPs are more likely formed from low SUVA (Specific UV absorbance), and N-rich precursors [41,42,43]. Because glucose has a lower SUVA value than DOM derived from wild phytoplankton species, conditions for the formation of DBAN could be more favorable in land-based tests. Therefore, when ballasting is performed in actual ports, there may not be a need for monitoring the DBAN, although the occurrence of DBPs from BWMSs using AS still needs to be monitored.

4.4. Environmental Risk Assessment on DBPs among Groups

No individual DBP exceeded a PEC/PNEC ratio of 1, suggesting a low environmental risk for the individual substances (Table 5 and Table 6). Even if natural organisms are used and CO2 is added to lower pH, the PEC/PNEC ratio of individual DBP is less than 1 under “general” conditions, indicating that the potential risk of individual DBP in the port environment is low. In addition, IMO G9 before the revision of the BWMS Code, which was evaluated for potential environmental risk by testing with a single culture species rather than natural assemblages of plankton, is also considered to be valid.
However, the sum of PEC/PNEC in discharged water exceeded 1 in the TH15 and TH10-pH samples on Day 1, and in the TH10 and TH15 samples on Day 5 under “near-ship” conditions, indicating potential risk (Table 5 and Table 6). These were the test waters with high total DBP concentrations, particularly high concentrations of TBM and MCAA. Moreover, the number of substances with PEC/PNEC values > 0.1 increased on Day 5 (Table 6), suggesting that the risk may increase when ballast water is stored for a longer period. Among these substances, TBM and MCAA exhibited fairly high PEC/PNEC values. Although the concentration of MCAA was low in this study, the PEC/PNEC ratio was high because of the low PNEC value. The PNEC in GISIS is quite low when there is a lack of toxicity data for specific biological groups. MCAA might also exhibit a low PNEC because of the limited toxicity data, indicating the need for further toxicity assessment in the future.

5. Conclusions

In ports where phytoplankton blooms occur frequently, BWMSs using AS can form more DBPs, and the environmental risk due to DBPs may increase with TRO concentrations. While preventing the invasion of alien species is important, efforts to reduce the environmental risk of DBPs are necessary because all international ships will install and operate BWMS after September 2024. The following conclusions can be drawn from this study:
  • When ballasting with BWMS using AS during massive phytoplankton blooms, the concentration of DBPs can increase, potentially raising the environmental risk in ports.
  • The environmental risk assessment of IMO G9 performed with cultured species may substitute the outcome with a natural plankton community.
  • DBAN, which can be problematic because of its high toxicity in land-based tests, might be affected by the addition of glucose to artificially increase the dissolved organic matter.
  • According to the results of the environmental risk assessment, MCAA may cause toxicity in ports, thus necessitating port monitoring.
  • The initial TRO concentration and final TRO concentration play a crucial role in determining the concentration and composition ratio of DBPs.
  • By obtaining information on the biological quantity and DOM concentration using a calibrated sensor in ports before ballasting, it is possible to treat ballast water with an appropriate TRO concentration to increase the energy efficiency of BWMS operations and reduce the environmental risk of DBPs.

Supplementary Materials

The following are available online at https://www.mdpi.com/article/10.3390/jmse12020238/s1, Table S1: Active chlorophyll a in the test water of Groups A, B, and C, Table S2: The table summarizes the DBP concentrations of treated water on Day 1 for equipment with a maximum dose of active substances of 9–11 ppm among those reported in IMO MEPC (types of BWMS: C, chemical injection; D, directed injection on the main pipe; S, side-stream injection on the main pipe); Table S3: The table summarizes the DBP concentrations of treated water on Day 5 for equipment with a maximum dose of active substances of 9–11 ppm among those reported in IMO MEPC (types of BWMS: C: chemical injection; D, directed injection on the main pipe; S, side-stream injection on the main pipe), Figure S1: Composition percentages of (a) THMs, (b) HAAs, (c) HANs, and (d) total DBPs on Day 1 for Groups A, B, and C.

Author Contributions

Conceptualization, H.-G.C., K.-H.C. and P.-G.J.; methodology, H.-G.C., B.H., M.-C.J., J.-Y.S. and P.-G.J.; software, H.-G.C. and P.-G.J.; validation, H.-G.C., B.H., M.-C.J., K.-H.C., J.-Y.S. and P.-G.J.; formal analysis, H.-G.C., K.-H.C. and P.-G.J.; investigation, H.-G.C., B.H., M.-C.J. and J.-Y.S.; resources, K.S.; data curation, H.-G.C. and P.-G.J.; writing—original draft preparation, H.-G.C. and P.-G.J.; writing—review and editing, H.-G.C., B.H., M.-C.J., K.-H.C. and P.-G.J.; visualization, H.-G.C. and P.-G.J.; supervision, K.S. and P.-G.J.; project administration, K.S. All authors have read and agreed to the published version of the manuscript.

Funding

This research was supported by the Korea Institute of Marine Science and Technology Promotion (KIMST) funded by the Ministry of Oceans and Fisheries, Republic of Korea (20210651; Techniques development for the management and evaluation of biofouling on ship hulls). This research was also funded by the Korea Institute of Ocean Science and Technology (grant number PEA0205).

Institutional Review Board Statement

Not applicable.

Informed Consent Statement

Not applicable.

Data Availability Statement

All data used to support the findings of this study are included within the article.

Acknowledgments

The authors would like to thank the Ballast Water Research Center staff of the Korea Institute of Ocean Science and Technology, the Environmental Protection and the Environment Division staff of Eurofins Korea for their help with sampling and analysis.

Conflicts of Interest

The authors declare that they have no known competing financial interests or personal relationships that could have appeared to influence the work reported in this paper.

References

  1. Jang, P.G.; Cha, H.G. Long-term changes of disinfection byproducts in treatment of simulated ballast water. Ocean Sci. J. 2020, 55, 265–277. [Google Scholar] [CrossRef]
  2. Kim, D.; Amy, G.L.; Karanfil, T. Disinfection by-product formation during seawater desalination: A review. Water Res. 2015, 81, 343–355. [Google Scholar] [CrossRef]
  3. Jang, P.G.; Cha, H.G.; Jang, M.C.; Hyun, B.; Choi, T.S.; Kang, Y.; Shin, K. Characteristic and relative environmental risk of disinfection by products associated with simple glucose or naturally occurring algal organic matter as tested in ballast water treatment system. J. Mar. Sci. Eng. 2022, 10, 1928. [Google Scholar] [CrossRef]
  4. Lakshmi, E.; Priya, M.; Achari, V.S. An overview on the treatment of ballast water in ships. Ocean Coast. Manag. 2021, 199, 105296. [Google Scholar] [CrossRef]
  5. International Maritime Organization (IMO). Methodology for Information Gathering and Conduct of Work of GESAMP-BWWG (BWM.2/Circ.13/Rev.5). 8 September 2022. Available online: https://docs.imo.org/Shared/Download.aspx?did=138301 (accessed on 18 January 2024).
  6. International Maritime Organization (IMO). List of Ballast Water Management Systems That Make Use of Active Substances Which Received Basic and Final Approval (BWM.2/Circ.34/Rev.10). 14 December 2021. Available online: https://docs.imo.org/Search.aspx?keywords=BWM.2%2FCirc.34%2FRev.10 (accessed on 12 December 2023).
  7. Delacroix, S.; Vogelsang, C.; Tobiesen, A.; Liltved, H. Disinfection by-products and ecotoxicity of ballast water after oxidative treatment–results and experiences from seven years of full-scale testing of ballast water management systems. Mar. Pollut. Bull. 2013, 73, 24–36. [Google Scholar] [CrossRef] [PubMed]
  8. Shah, A.D.; Liu, Z.Q.; Salhi, E.; Hoefer, T.; Werschkun, B.; Von Gunten, U. Formation of disinfection by-products during ballast water treatment with ozone, chlorine, and peracetic acid: Influence of water quality parameters. Environ. Sci. Water Res. Technol. 2015, 1, 465–480. [Google Scholar] [CrossRef]
  9. Yu, H.W.; Oh, S.G.; Kim, I.S.; Pepper, I.; Snyder, S.; Jang, A. Formation and speciation of haloacetic acids in seawater desalination using chlorine dioxide as disinfectant. J. Ind. Eng. Chem. 2015, 26, 193–201. [Google Scholar] [CrossRef]
  10. Cha, H.G.; Seo, M.H.; Lee, H.Y.; Lee, J.H.; Lee, D.S.; Shin, K.; Choi, K.H. Enhancing the efficacy of electrolytic chlorination for ballast water treatment by adding carbon dioxide. Mar. Pollut. Bull. 2015, 95, 315–323. [Google Scholar] [CrossRef] [PubMed]
  11. Zhang, H.; Xue, J.; Wang, Q.; Yuan, L.; Wu, H. Formation of halogenated disinfection by-products during ballast water chlorination. Environ. Sci. Water Res. Technol. 2022, 8, 648–656. [Google Scholar] [CrossRef]
  12. Yu, Y.; Reckhow, D.A. Kinetic analysis of haloacetonitrile stability in drinking waters. Environ. Sci. Technol. 2015, 49, 11028–11036. [Google Scholar] [CrossRef] [PubMed]
  13. Woo, Y.T.; Lai, D.; McLain, J.L.; Manibusan, M.K.; Dellarco, V. Use of mechanism-based structure-activity relationships analysis in carcinogenic potential ranking for drinking water disinfection by-products. Environ. Health Perspect. 2002, 110, 75–87. [Google Scholar] [CrossRef]
  14. Gonsior, M.; Mitchelmore, C.; Heyes, A.; Harir, M.; Richardson, S.D.; Petty, W.T.; Wright, D.A.; Schmitt-Kopplin, P. Bromination of marine dissolved organic matter following full scale electrochemical ballast water disinfection. Environ. Sci. Technol. 2015, 49, 9048–9055. [Google Scholar] [CrossRef]
  15. Moreno-Andrés, J.; Peperzak, L. Operational and environmental factors affecting disinfection byproducts formation in ballast water treatment systems. Chemosphere 2019, 232, 496–505. [Google Scholar] [CrossRef]
  16. Yang, X.; Guo, W.; Zhang, X.; Chen, F.; Ye, T.; Liu, W. Formation of disinfection by-products after pre-oxidation with chlorine dioxide or ferrate. Water Res. 2013, 47, 5856–5864. [Google Scholar] [CrossRef]
  17. Lee, J.H.; Choi, K.H.; Yang, J.H. Effects of physicochemical parameters of water on byproduct formation during electrolysis of ballast water. Front. Environ. Sci. 2023, 11, 1114353. [Google Scholar] [CrossRef]
  18. Jung, S.W.; Kang, J.; Park, J.S.; Joo, H.M.; Suh, S.S.; Kang, D.; Lee, T.K.; Kim, H.J. Dynamic bacterial community response to Akashiwo sanguinea (Dinophyceae) bloom in indoor marine microcosms. Sci. Rep. 2021, 11, 6983. [Google Scholar] [CrossRef] [PubMed]
  19. Biddanda, B.; Benner, R. Carbon, nitrogen, and carbohydrate fluxes during the production of particulate and dissolved organic matter by marine phytoplankton. Limnol. Oceanogr. 1997, 42, 506–518. [Google Scholar] [CrossRef]
  20. Chrost, R.H.; Faust, M.A. Organic carbon release by phytoplankton: Its composition and utilization by bacterioplankton. J. Plankton Res. 1983, 5, 477–493. [Google Scholar] [CrossRef]
  21. Thornton, D.C. Dissolved organic matter (DOM) release by phytoplankton in the contemporary and future ocean. Eur. J. Phycol. 2014, 49, 20–46. [Google Scholar] [CrossRef]
  22. Myklestad, S.M. Dissolved organic carbon from phytoplankton. Mar. Chem. 2000, 5, 111–148. [Google Scholar] [CrossRef]
  23. Liu, C.; Ersan, M.S.; Plewa, M.J.; Amy, G.; Karanfil, T. Formation of regulated and unregulated disinfection byproducts during chlorination of algal organic matter extracted from freshwater and marine algae. Water Res. 2018, 142, 313–324. [Google Scholar] [CrossRef]
  24. Huang, J.; Graham, N.; Templeton, M.R.; Zhang, Y.; Collins, C.; Nieuwenhuijsen, M. A comparison of the role of two blue-green algae in THM and HAA formation. Water Res. 2009, 43, 3009–3018. [Google Scholar] [CrossRef]
  25. International Maritime Organization (IMO). Procedure for Approval of Ballast Water Management System that Make Use of Active Substance (G9), MEPC 57/21. 2008. Available online: https://www.imorules.com/MEPCRES_169.57.html (accessed on 15 December 2023).
  26. International Maritime Organization (IMO). Guidelines for Approval of Ballast Water Management Systems (G8), MEPC 58/23. 2008. Available online: https://docs.imo.org/Shared/Download.aspx?did=51243 (accessed on 15 December 2023).
  27. Marine Environmental Protection Committee (MEPC). Code for Approval of Ballast Water Management System (BWMS CODE). MEPC 72/17/Add.1/Annex 5. 2018. Available online: https://docs.imo.org/Shared/Download.aspx?did=110918 (accessed on 15 December 2023).
  28. Marine Environmental Protection Committee (MEPC). Information on the GESAMP-BWWG Database of Chemicals Most Commonly Associated with Treated Ballast Water, MEPC 67/INF17. 2014. Available online: https://docs.imo.org/Documents/Detail.aspx?did=88063 (accessed on 15 December 2023).
  29. Jin, X.; Zha, J.; Xu, Y.; Giesy, J.P.; Richardson, K.L.; Wang, Z. Derivation of predicted no effect concentrations (PNEC) for 2,4,6trichlorophenol based on Chines resident species. Chemosphere 2012, 86, 17–23. [Google Scholar] [CrossRef]
  30. Jang, P.G.; Hyun, B.; Shin, K. Ballast water treatment performance evaluation under real changing conditions. J. Mar. Sci. Eng. 2020, 8, 817. [Google Scholar] [CrossRef]
  31. Biswas, H.; Jie, J.; Li, Y.; Zhang, G.; Zhu, Z.Y.; Wu, Y.; Zhang, G.L.; Li, Y.W.; Lil, S.M.; Zhang, J. Response of a natural phytoplankton community from the Qingdao coast (Yellow Sea, China) to variable CO2 levels over a short-term incubation experiment. Curr. Sci. 2015, 108, 1901–1909. [Google Scholar]
  32. Smith Jr, W.O.; Barber, R.T.; Huntsman, S.A. Primary production off the coast of northwest Africa: Excretion of dissolved organic matter and its heterotrophic uptake. Deep-Sea Res. 1977, 24, 35–47. [Google Scholar] [CrossRef]
  33. Lee, W.; Westerhoff, P.; Croué, J.P. Dissolved organic nitrogen as a precursor for chloroform, dichloroacetonitrile, N-nitrosodimethylamine, and trichloronitromethane. Environ. Sci. Technol. 2007, 41, 5485–5490. [Google Scholar] [CrossRef]
  34. Kali, S.; Khan, M.; Ghaffar, M.S.; Rasheed, S.; Waseem, A.; Iqbal, M.M.; Niazi, M.B.K.; Zafar, M.I. Occurrence, influencing factors, toxicity, regulations, and abatement approaches for disinfection by-products in chlorinated drinking water: A comprehensive review. Environ. Pollut. 2021, 281, 116950. [Google Scholar] [CrossRef] [PubMed]
  35. International Maritime Organization (IMO). Guidance for the Commissioning Testing of Ballast Water Management Systems, BWM.2/Circ.70. 2018. Available online: https://docs.imo.org/Shared/Download.aspx?did=113378 (accessed on 15 December 2023).
  36. Hansen, K.M.; Willach, S.; Antoniou, M.G.; Mosbæk, H.; Albrechtsen, H.J.; Andersen, H.R. Effect of pH on the formation of disinfection byproducts in swimming pool water–is less THM better? Water Res. 2012, 46, 6399–6409. [Google Scholar] [CrossRef] [PubMed]
  37. Zhang, N.; Ma, B.; Li, J.; Zhang, Z. Factors affecting formation of chemical by-products during ballast water treatment based on an advanced oxidation process. Chem. Eng. J. 2013, 231, 427–433. [Google Scholar] [CrossRef]
  38. Han, K.H.; Li, Z.; Youn, J.Y.; Kang, B.J.; Kim, H.J.; Seo, M.H.; Soh, H.Y.; Shin, H.H. Bloom-forming dinoflagellate Akashiwo sanguinea (Dinophyceae) in Jangmok Harbour of Geoje Island, Korea: Morphology, phylogeny and effects of temperature and salinity on growth. Korean J. Environ. Biol. 2019, 37, 119–128. [Google Scholar] [CrossRef]
  39. Goswami, R.K.; Agrawal, K.; Mehariya, S.; Verma, P. Current perspective on wastewater treatment using photobioreactor for Tetraselmis sp.: An emerging and foreseeable sustainable approach. Environ. Sci. Pollut. Res. 2022, 29, 61905–61937. [Google Scholar] [CrossRef] [PubMed]
  40. Summerson, R.; Bloomfield, N.; Arthur, T. Treated ballast water and its impact on port water quality. ABARES Canberra 2019, 1–84. [Google Scholar] [CrossRef]
  41. Liu, J.L.; Li, X.Y. Biodegradation and biotransformation of wastewater organics as precursors of disinfection byproducts in water. Chemosphere 2010, 81, 1075–1083. [Google Scholar] [CrossRef]
  42. Liu, J.L.; Li, X.Y.; Xie, Y.F.; Tang, H. Characterization of soluble microbial products as precursors of disinfection byproducts in drinking water supply. Sci. Total Environ. 2014, 472, 818–824. [Google Scholar] [CrossRef]
  43. Hua, L.C.; Chao, S.J.; Huang, K.; Huang, C. Characteristics of low and high SUVA precursors: Relationships among molecular weight, fluorescence, and chemical composition with DBP formation. Sci. Total Environ. 2020, 727, 138638. [Google Scholar] [CrossRef]
Figure 1. Seawater collection location: Jangmok Bay, Republic of Korea.
Jmse 12 00238 g001
Figure 2. Changes in the concentrations of (a) total residual oxidants (TRO) and (c) chlorophyll a; (d) changes in the pH; (b) relationship between the DOC concentration and total DBP concentration according to the TRO concentration in Groups A and B. (1) TH5; raw water + 5 mg/L as Cl2, (2) TH10; raw water + 10 mg/L as Cl2, (3) TH15; raw water + 15 mg/L as Cl2, (4) TL5; diluted water + 5 mg/L as Cl2, (5) TL10; diluted water + 10 mg/L as Cl2, (6) TL15; diluted water + 15 mg/L as Cl2, (7) TH10-pH; raw water + 10 mg/L as Cl2 + CO2 gas, (8) TL10-pH; diluted water + 10 mg/L as Cl2 + CO2 gas.
Jmse 12 00238 g002
Figure 3. Concentrations of (a) THMs, (b) HAAs, (c) HANs, and (d) total DBPs on day 1 for Groups A, B, and C.
Jmse 12 00238 g003
Figure 4. Concentrations of (a) THMs, (b) HAAs, (c) HANs, and (d) total DBPs on day 5 for Group A.
Jmse 12 00238 g004
Table 1. List of phytoplankton species in the test water sampled from Jangmok Bay.
Raw Water
(Cells/mL)
Diluted Water
(Cells/mL)
Bacillariophyceae
Pseudo-nitzschia spp.200
Rhizosolenia spp.100
Thalassiosira spp.100
Dinophyceae
Akashiwo sanguinea2160420
Alexandrium spp.500
Unidentified dinoflagellate1010
Euglenophyceae
Eutreptiella gymnastica3010
Small flagellates (<5 µm)72070
<20 µm Ciliates3010
Table 2. Abbreviations of the relevant chemicals.
CompoundsAbbreviationsCompoundsAbbreviations
Active substanceASTribromoacetic acidTBAA
Total residual oxidantsTRODibromoacetic acidDBAA
Dissolved organic matterDOMMonobromoacetic acidMBAA
Dissolved organic carbonDOCTrichloroacetic acidTCAA
Dissolved organic nitrogenDONDichloroacetic acidDCAA
TrihalomethanesTHMsMonochloroacetic acidMCAA
Haloacetic acidsHAAsDibromochloroacetic acidDBCAA
HaloacetonitrilesHANsDichlorobromoacetic acidDCBAA
BromoformTBMBromochloroacetic acidBCAA
DibromomethaneDBMDibromoacetonitrileDBAN
ChloroformTCMMonobromoacetonitrileMBAN
DichloromethaneDCMDichloroacetonitrileDCAN
DibromochloromethaneDBCMMonochloroacetonitrileMCAN
DichlorobromomethaneDCBMTribromoacetic acidBCAN
BromodichloromethaneBDCM
Table 3. Conditions of the test waters on Day 0 and environmental parameters measured for the test waters of Groups A, B, and C on Days 1 and 5. (1) TH5; raw water + 5 mg/L as Cl2, (2) TH10; raw water + 10 mg/L as Cl2, (3) TH15; raw water + 15 mg/L as Cl2, (4) TL5; diluted water + 5 mg/L as Cl2, (5) TL10; diluted water + 10 mg/L as Cl2, (6) TL15; diluted water + 15 mg/L as Cl2, (7) TH10-pH; raw water + 10 mg/L as Cl2 + CO2 gas, (8) TL10-pH; diluted water + 10 mg/L as Cl2 + CO2 gas.
Conditions of the Test Water on Day 0Conditions of the Treated Water on Day 1Conditions of the Treated Water on Day 5
Group BiomassTROpHA. Chl a (1)DOCTROpHDOC DONTROpHDOC DON
(cells/mL)(mg/L) (μg/L)(mg/L)(mg/L) (mg/L)(μM)(mg/L) (mg/L)(μM)
ATH053100 58.130.24.320.308.298.8927.940.007.407.1227.27
TH10100.908.1712.430.770.007.369.1721.75
TH15152.508.0117.036.420.287.8715.436.64
BTL551057.86.10.861.407.903.9212.920.007.795.0515.9
TL10105.507.865.2218.682.707.697.5915.3
TL15159.307.8210.39.636.107.649.3122.7
CTH10-pH (2)3100108.130.24.325.606.1012.721.312.806.1617.546.7
TL10-pH500107.86.10.867.106.198.4416.536.206.2711.221.3
(1) Active chlorophyll a. (2) CO2 injection to control pH.
Table 4. This table summarizes the test water conditions for equipment using active substances reported by the International Maritime Organization, Marine Environment Protection Committee (IMO MEPC), with a maximum dose of active substances between 9 and 11 ppm (Types of BWMS: C, chemical injection; D, directed injection on the main pipe; S, side-stream injection on the main pipe); DOM and Abundance are initial test water conditions.
Type of BWMSTemp.TROTRO on Day 5Predominant Species (2)Abundance DOMDOM TypeNumber of DBPs (D1/D5)
CThis study (1)20100.00Akashiwo sanguinea30104.31Natural13/15
C2 (1) N.I.10N.I.Tetraselmis sp. (3)N.I.N.I.MethylcelluloseN.I/13
C3 (1)169.51.12Tetraselmis sp.23933.34Glucose9/9
DD1 18.6114.23Tetraselmis sp.11952.81Glucose11/12
D220103.40Tetraselmis sp.15503.04Glucose15/12
SS119.4103.15N.I. (4)N.I.2.42N.I.16/17
S214.19.51.88Tetraselmis sp.26912.87Glucose13/11
S314.894.33Tetraselmis sp.17271.99Glucose15/15
(1) Test using NaDCC as the active substance. (2) The species represent more than 90% of the total. (3) Tetraselmis sp. are all cultured species. (4) N.I: no information.
Table 5. PEC/PNEC ratio of THMs, HAAs, and HANs detected on Day 1 of the test waters. Predictive environmental concentration (PEC) for the general and near-ship (NS) conditions on Day 1, calculated using MAMPEC 3.1. To obtain the PEC, the predictive no-effect concentration (PNEC) was calculated using the lowest toxicity data and the assessment factor (AF) from the IMO, GISIS.
TH5TH10TH15TL5TL10TL15TH10-pHTL10-pH
DBPsGeneralNSGeneralNSGeneralNSGeneralNSGeneralNSGeneralNSGeneralNSGeneralNS
DCBM 2.6 × 10−45.3 × 10³2.7 × 10−45.4 × 10³ 2.6 × 10−45.3 × 10³
DBCM6.9 × 10³3.0 × 10³2.4 × 10−21.0 × 10−23.4 × 10−21.5 × 10−21.3 × 10−25.5 × 10³1.6 × 10−26.9 × 10³1.7 × 10−27.5 × 10³3.2 × 10−21.4 × 10−21.3 × 10−25.5 × 10³
TBM1.2 × 10−22.0 × 10−13.6 × 10−26.1 × 10−14.7 × 10−28.0 × 10−12.0 × 10−23.4 × 10−12.7 × 10−24.6 × 10−12.6 × 10−24.4 × 10−13.4 × 10−25.9 × 10−11.8 × 10−23.0 × 10⁻¹
MCAA3.0 × 10−23.7 × 10⁻¹ 3.2 × 10−23.9 × 10−1 5.1 × 10−26.2 × 10−12.8 × 10−23.5 × 10−1
MBAA1.5 × 10³1.8 × 10−21.6 × 10³1.9 × 10−22.6 × 10³3.2 × 10−21.2 × 10−31.4 × 10−21.7 × 10³2.1 × 10−22.3 × 10³2.8 × 10−25.2 × 10³6.4 × 10−24.6 × 10³5.6 × 10⁻²
TCAA9.6 × 10−61.2 × 10−42.5 × 10−53.1 × 10−42.7 × 10−53.3 × 10−42.2 × 10−52.7 × 10−42.1 × 10−52.6 × 10−41.7 × 10−52.1 × 10−44.4 × 10−55.4 × 10−42.3 × 10−52.8 × 10⁻⁴
BCAA5.0 × 10³6.2 × 10d24.9 × 10³6.0 × 10−28.1 × 10³9.9 × 10−29.6 × 10³1.2 × 10−15.7 × 10³6.9 × 10−26.4 × 10³7.9 × 10−27.3 × 10³9.0 × 10−27.1 × 10³8.7 × 10⁻²
DBCAA2.1 × 10−52.5 × 10−42.7 × 10−53.3 × 10−43.0 × 10−53.7 × 10d47.8 × 10−59.5 × 10−44.9 × 10−56.0 × 10d45.4 × 10−56.6 × 10−45.8 × 10−57.1 × 10−44.5 × 10−55.5 × 10⁻⁴
DBAA9.8 × 10−51.2 × 10³1.5 × 10−41.9 × 10³2.5 × 10−43.1 × 10³2.3 × 10−42.8 × 10³1.4 × 10−41.7 × 10³1.2 × 10−41.5 × 10³2.6 × 10−43.2 × 10³1.8 × 10−42.2 × 10³
DCBAA3.0 × 10−42.2 × 10³5.3 × 10−43.9 × 10³1.3 × 10³9.4 × 10³1.8 × 10³1.3 × 10−27.0 × 10−45.1 × 10³7.4 × 10−45.5 × 10³4.6 × 10³3.4 × 10−21.4 × 10³1.0 × 10⁻²
TBAA9.1 × 10−67.1 × 10−51.4 × 10−51.1 × 10−43.3 × 10−52.6 × 10−44.4 × 10−53.4 × 10−42.4 × 10−51.9 × 10−42.3 × 10−51.8 × 10−41.1 × 10−48.4 × 10−43.7 × 10−52.9 × 10⁻⁴
MCAN 1.7 × 10−23.4 × 10−22.8 × 10−25.5 × 10−23.7 × 10−27.3 × 10−24.0 × 10−27.8 × 10−28.1 × 10³1.6 × 10−24.3 × 10−28.4 × 10−24.0 × 10−27.9 × 10⁻²
DCAN7.3 × 10−48.9 × 10⁻⁴
MBAN1.6 × 10−42.0 × 10−41.1 × 10³1.4 × 10³4.9 × 10³6.1 × 10³6.9 × 10³8.5 × 10³1.8 × 10−22.2 × 10−25.7 × 10³7.1 × 10³4.0 × 10−24.9 × 10−21.7 × 10−22.1 × 10−2
BCAN5.1 × 10³1.4 × 10⁻² 8.2 × 10³2.2 × 10−28.3 × 10³2.3 × 10−25.6 × 10³1.5 × 10−24.6 × 10−21.3 × 10−17.8 × 10³2.1 × 10⁻²
DCM1.1 × 10−51.6 × 10³1.4 × 10−52.2 × 10³1.2 × 10−51.8 × 10³ 8.2 × 10−61.3 × 10³ 7.7 × 10−61.2 × 10³
SUM0.060.670.090.750.131.020.130.990.120.690.070.600.261.690.140.93
Table 6. PEC/PNEC ratio of THMs, HAAs, and HANs detected on Day 5 of the test waters. Predictive environmental concentration (PEC) for the general and near-ship (NS) conditions on Day 1, calculated using MAMPEC 3.1. To obtain the PEC, the predictive no-effect concentration (PNEC) was calculated using the lowest toxicity data and the assessment factor (AF) from the IMO, GISIS.
TH5TH10TH15
DBPsGeneralNSGeneralNSGeneralNS
DCBM3.6 × 10−45.5 × 10−32.9 × 10−45.9 × 10−33.6 × 10−47.1 × 10⁻³
DBCM7.4 × 10−33.2 × 10−32.6 × 10−21.1 × 10−25.4 × 10−22.3 × 10⁻²
TBM1.4 × 10−22.3 × 10−13.6 × 10−26.2 × 10−15.6 × 10−29.6 × 10⁻¹
MCAA3.0 × 10−23.7 × 10−17.9 × 10−29.7 × 10−13.6 × 10−24.3 × 10⁻¹
MBAA1.5 × 10−31.8 × 10−28.8 × 10−31.1 × 10−16.6 × 10−38.1 × 10⁻²
TCAA9.6 × 10−61.2 × 10−42.5 × 10−53.1 × 10−42.7 × 10−53.3 × 10⁻⁴
BCAA5.6 × 10−36.8 × 10−21.1 × 10−21.4 × 10−11.6 × 10−21.9 × 10⁻¹
DBCAA5.0 × 10−56.2 × 10−42.3 × 10−32.9 × 10−26.9 × 10−58.5 × 10⁻⁴
DBAA9.8 × 10−51.2 × 10−32.6 × 10−43.2 × 10−33.3 × 10−44.1 × 10⁻³
DCBAA4.3 × 10−53.1 × 10−32.2 × 10−41.6 × 10−22.2 × 10−41.6 × 10⁻²
TBAA1.0 × 10−58.0 × 10−55.9 × 10−54.6 × 10−46.2 × 10−54.9 × 10⁻⁴
MCAN0.00.06.0 × 10−21.2 × 10−19.8 × 10−21.9 × 10⁻¹
DCAN1.9 × 10−58.6 × 10−49.5 × 10−64.4 × 10−41.6 × 10−57.2 × 10⁻⁴
MBAN1.6 × 10−42.0 × 10−46.7 × 10−38.3 × 10−34.9 × 10−36.1 × 10⁻³
BCAN5.6 × 10−31.5 × 10−21.0 × 10−22.8 × 10−20.00.0
DCM1.1 × 10−51.6 × 10−31.4 × 10−52.2 × 10−31.2 × 10−51.8 × 10⁻³
SUM0.060.720.242.060.271.92
Disclaimer/Publisher’s Note: The statements, opinions and data contained in all publications are solely those of the individual author(s) and contributor(s) and not of MDPI and/or the editor(s). MDPI and/or the editor(s) disclaim responsibility for any injury to people or property resulting from any ideas, methods, instructions or products referred to in the content.

