Article

A Data-Driven Approach to Identify Major Air Pollutants in Shanghai Port Area and Their Contributing Factors

1
School of Naval Architecture, Ocean and Civil Engineering, Shanghai Jiao Tong University, Shanghai 200240, China
2
International Center for Adaptation Planning and Design, College of Design, Construction and Planning, University of Florida, Florida, FL 32611-5706, USA
3
Healthy Building Research Center, Ajman University, Ajman 346, United Arab Emirates
4
Shanghai Environment Monitor Center, Shanghai 200235, China
*
Authors to whom correspondence should be addressed.
J. Mar. Sci. Eng. 2024, 12(2), 288; https://doi.org/10.3390/jmse12020288
Submission received: 13 January 2024 / Revised: 31 January 2024 / Accepted: 2 February 2024 / Published: 5 February 2024
(This article belongs to the Section Marine Pollution)

Abstract

:
Air pollution is a growing concern in metropolitan areas worldwide, and Shanghai, as one of the world’s busiest ports, faces significant challenges in local air pollution control. Assessing the contribution of a specific port to air pollution is essential for effective environmental management and public health improvement, making the analysis of air pollution contributions at a selected port in Shanghai a pertinent research focus. This study aims to delve into the distribution patterns of atmospheric pollutants in port areas and their influencing factors, utilizing a data-driven approach to unveil the relationship between pollution sources and dispersion. Through a comparative analysis of pollution levels in the port’s interior, surrounding regions, and urban area concentrations, we ascertain that carbon monoxide (CO) and nitric oxide (NO) are the primary pollutants in the port, with concentrations significantly exceeding those of the surrounding areas and urban area levels. These two pollutants exhibit an hourly pattern, with lower levels during the day and higher concentrations at night. Employing a random forest model, this study quantitatively analyzes the contribution rates of different factors to pollutant concentrations. The results indicate that NO concentration is primarily influenced by operational intensity and wind speed, while CO concentration is mainly affected by meteorological factors. Further, an orthogonal experiment reveals that maintaining daily operational vehicle numbers within 5000 effectively controls NO pollution, especially at low wind speeds. Additionally, humidity and temperature exhibit similar trends in influencing NO and CO, with heightened pollution occurring within the range of 75% to 90% humidity and 6 °C to 10 °C temperature. Severe pollution accumulates under stagnant wind conditions with wind speeds below 0.2 m/s. The results help to explore the underlying mechanisms of port pollution further and use machine learning for early pollution prediction, aiding timely warnings and emission reduction strategy formulation.

1. Introduction

Ports, as pivotal nodes in global trade, play an indispensable role in fostering international economic cooperation and development. However, as global trade continues to surge, the economic prosperity brought by ports is accompanied by serious environmental challenges, one of which is port air pollution [1]. Port air pollution not only directly impacts the health of residents in surrounding areas but also has the potential to inflict long-term damage on ecosystems and exert complex influences on climate change [2,3]. In recent years, with the rapid acceleration of industrialization and urbanization, the issue of port air pollution has become increasingly prominent, necessitating effective measures to mitigate its adverse effects [4].
Port air pollution primarily originates from activities such as shipping, land transportation, and cargo handling. Emissions from these activities encompass a significant amount of nitrogen oxides (NOx), sulfur compounds (SOx), particulate matter, and volatile organic compounds, among other harmful components [3,5]. These pollutants not only endanger human health but also give rise to environmental problems such as acid rain and photochemical smog [6,7]. While certain countries and regions have implemented a series of measures to reduce port air pollution, addressing this issue remains challenging due to the complexity of port environments and the characteristics of transboundary pollution.
The research methods for assessing the contribution of atmospheric pollution in ports encompass several fields, providing essential scientific insights into the diverse impacts of different pollution sources on the environment. Firstly, a meteorological analysis is conducted to understand factors such as wind speed, direction, and stability in the port area, as well as how these conditions influence the transport of pollutants [8,9]. Secondly, pollution-concentration monitoring stations are established to collect data on pollutants like particulate matter, nitrogen oxides, and sulfur compounds, enabling a quantitative assessment of various pollution sources [10]. Thirdly, simulation models are employed to estimate the emission characteristics, meteorological conditions, and chemical reactions of distinct pollution sources, predicting pollutant concentration distribution and the contributions of different sources [11,12]. Fourthly, compiling emission inventories for pollutants involves collating and analyzing data from sources such as ships and transportation for a comprehensive view [13,14]. Fifthly, source apportionment techniques help differentiate the impacts of different pollution sources, utilizing methods like chemical mass balance and positive matrix factorization [15,16,17,18]. Sixthly, remote sensing technologies are harnessed to monitor atmospheric pollution status in port areas, providing pollutant concentration data [19,20]. Seventhly, field observations and experiments conducted within the port area gather data on direct emissions from pollution sources and atmospheric chemical processes, facilitating a comprehensive evaluation of source impacts [5,21]. These integrated methodologies contribute to a scientific assessment of port atmospheric pollution contribution, furnishing a reliable foundation for formulating effective pollution control strategies.
Traditional methods for assessing pollution in port areas often face limitations due to the complexity of environmental variables and the interactions between them. These methods might not effectively capture the non-linear relationships between multiple influencing factors or handle large datasets or missing/noisy data efficiently. In this context, the emergence of data-driven methods offers a novel avenue for tackling the problem of port air pollution. Using data-driven methods like the random forest model for analyzing port pollution monitoring data offers several advantages over traditional approaches. These methods excel at handling large and complex datasets, capturing non-linear relationships between variables, and handling missing or noisy data more effectively. Additionally, they are capable of providing insights into the relative contribution of different pollutants, offering a more nuanced understanding of their impact compared to conventional methods. The flexibility and robustness of data-driven models make them valuable tools for accurately assessing and addressing pollution concerns in port environments. Innovations such as data science, artificial intelligence, and advanced sensing technologies provide us with the capability to collect, analyze, and apply vast amounts of environmental data, thereby enhancing our understanding of the sources, propagation, and mechanisms of port air pollution [22,23]. This paper aims to delve into the issue of port air pollution based on data-driven approaches, offering effective solutions and contributing to the improvement in port environments and sustainable development. Data-driven solutions rely on analyzing large volumes of information to derive patterns, correlations, and trends. By understanding these insights, organizations can make informed decisions rather than relying solely on intuition or past practices.

2. Study Site and Data Description

2.1. Study Site

Waigaoqiao Port is situated in Shanghai, China, forming part of the Shanghai Port and standing as one of China’s largest comprehensive ports. Its strategic geographical location at the mouth of the Yangtze River has endowed it with unique advantages, making it a crucial international trade and logistics hub [24,25]. The port’s extensive use, coupled with its proximity to industrial zones and heavy traffic arteries, introduces a mix of pollutants from ship emissions, vehicular exhaust, and industrial discharges. The diversity of these sources makes it a representative site for studying complex pollution dynamics in port regions. The port’s location is subject to a range of meteorological conditions, including varying wind patterns, temperature fluctuations, and humidity levels, all of which significantly influence the dispersion and concentration of pollutants. The port’s coastal position also means it is affected by land–sea breezes that can alter pollution distribution patterns. The significance of Waigaoqiao Port’s location is underscored by its impact on the densely populated center of Shanghai and adjacent areas. Studying this site offers insights into the health and environmental implications of port pollution for a large urban population.
As depicted in Figure 1, the internal region of the port utilizes data obtained from air quality monitoring microstations situated within the dock area. Additionally, data collected from the Pudong Gaoqiao station, situated adjacent to an elevated highway, are employed to represent the atmospheric conditions surrounding the port. The urban area concentration site, strategically chosen at Yangpu Xinjiangwan City, is positioned to the southwest of the Huangpu River, with a river expanse separating it from the port. The selection of this site is attributed to the presence of well-established greenery in its vicinity and residential area, making it a suitable reference for urban concentrations.

2.2. Data Description

The Shanghai Environmental Monitoring Center has monitoring stations in the port area, collecting data every minute. These data encompass the concentrations of six common pollutants (PM10, PM2.5, CO, SO2, NO2, and NO), as well as five common meteorological parameters (temperature, humidity, wind speed, wind direction, and atmospheric pressure). Observations from the Shanghai Environmental Monitoring Center and studies from other organizations [26,27] indicate that winter (December to February of the following year) is a peak period for severe port pollution. However, constrained by factors like confidentiality policies, the researchers only obtained one month’s worth of data for this study. Consequently, this article selected December 2021′s data as the research source, aiming to analyze the distribution patterns of pollutants in the port area and calculate the contribution rates of pollutants. This analysis seeks to propose a data-driven method for analyzing port pollution and to conduct an empirical test with Waigaoqiao Port.

2.3. Data Preprocessing

The pollution concentration data from the port monitoring stations occasionally suffer from missing values due to equipment-related issues or technical faults. To address this problem, interpolation methods were employed to handle the missing data. Interpolation relies on mathematical inference using surrounding temporal or spatial data points to estimate missing values, ensuring the continuity and integrity of the dataset. During the interpolation process, suitable methods were selected based on the data patterns and the nature of the missing values, ensuring accuracy and reliability after filling in the gaps. This data-cleaning process aimed to ensure the completeness and reliability of the dataset used for subsequent analysis and modeling, ensuring accurate assessment and prediction of port pollution conditions.
To process the wind direction and speed data represented in angles in the raw dataset, a method called one-hot encoding was employed [28,29]. This process converted the angle values of wind direction into eight different cardinal directions, each represented by a binary code. The rationale behind this approach was to retain the directional relationship of the wind while offering a more comprehensible and manageable data format for the model. Specifically, the 360-degree wind direction was divided into eight cardinal directions (such as north, northeast, east, southeast, and so on), and a corresponding binary code was created for each direction. This transformation allowed the data to be utilized by machine learning models, enabling a better understanding and utilization of the wind direction’s correlations to enhance the accuracy and effectiveness of the model.

3. Methodology

3.1. Random Forest

Random forest, a powerful ensemble learning algorithm, has gained significant attention in various fields for its versatility and robustness [30]. One of its promising applications is the calculation of contribution rates, where it offers a valuable tool for assessing the importance of features in predictive models. Random forests are a widely employed statistical technique for estimating contributing factors across a multitude of domains in academic research and practical applications [31,32].
Random forest, a combination of decision trees, is designed to address overfitting and enhance prediction accuracy. It creates an ensemble of decision trees by using bootstrapped datasets and random feature subsets [33]. The concept of contribution rates centers around understanding the impact of individual features on the overall model’s prediction. By evaluating the contribution of each feature in the ensemble, practitioners can gain insights into feature importance, variable relationships, and model stability [34].
While random forest offers numerous advantages, such as handling high-dimensional data and providing feature importance scores, there are certain challenges and considerations [35]. The choice of hyperparameters, dataset characteristics, and interpretation of contribution rates require careful attention. Additionally, exploring alternative ensemble methods and comparing their performance with random forest can provide valuable insights into contribution rate calculations.
The selection of the random forest method for studying the contributing factors to atmospheric pollution in port regions is motivated by several key advantages. First and foremost, random forests offer a high degree of flexibility, making them well suited to tackle complex data structures and a variety of problem types, including non-linear relationships and high-dimensional data [36]. Additionally, as a non-parametric technique, random forests do not require strict assumptions about data distribution, rendering them particularly appropriate for addressing the complexity and variability inherent in real-world data. Moreover, the robustness and accuracy of the model are enhanced through the powerful ensemble technique of combining multiple decision trees, reducing the risk of overfitting [37]. This ensemble approach also facilitates the assessment of feature importance, helping researchers identify which factors significantly contribute to pollution levels. Given that the analysis of port atmospheric pollution typically involves multiple factors and features, such as temperature, humidity, wind direction, wind speed, and emission sources, random forests excel at handling multidimensional data and capturing complex interactions among these variables. Furthermore, random forests exhibit high performance, especially in dealing with large-scale datasets, and their inherent parallelism is advantageous for effective data processing [38], which is particularly beneficial in the complex and data-rich environment of port regions.

3.2. Orthogonal Experimental Design

This study employs an orthogonal experimental design (OED) to systematically investigate the effects of multiple factors on nitrogen oxide (NO) concentration in port areas. OED, a statistical method, is instrumental in understanding the interactions between various variables while optimizing the number of experiments required. It allows for the efficient and comprehensive exploration of multifactorial influences on a dependent variable [39,40].
The key advantage of using OED in this context is its ability to decompose the overall effect of multiple variables into individual and interactive components [41]. This design facilitates the identification of the most significant factors affecting NO concentration and the extent of their impact. In our study, factors such as operational intensity, meteorological conditions, and traffic volume are considered. Each factor is assigned different levels, and their combinations are arranged orthogonally to ensure minimal overlap and maximum coverage of the experimental space.
The use of OED in this research not only enhances the reliability of our findings by reducing the potential for confounding effects but also improves the efficiency of the experimental process. By systematically varying the levels of each factor, we can identify optimal conditions for NO emission and dispersion. The insights gained from this experimental design will be pivotal in formulating strategies for effective pollution management in port areas.

4. Results and Analysis

In this section, the authors first conduct a statistical analysis of the monitoring station data, comparing the types of air pollutants in the port area with those in the surrounding regions. Subsequently, this study will employ a random forest model to analyze the contribution rates of atmospheric pollutants. Finally, an individual discussion will be presented for each influencing factor’s impact on atmospheric pollutants.

4.1. Major Pollutants in the Port Area

In Figure 2, box plots and line charts are employed to illustrate the disparities in air pollution levels across the three locations. The box plot provides a multidimensional representation, offering insights into the distribution patterns and variability of the overall December data. On the other hand, the line chart portrays the average daily variations in different pollutants over a 24 h period. Each data point represents the average value of the respective pollutant at that specific time of day throughout the month of December.

4.1.1. NO and CO

From an overall perspective, the concentrations of NO and CO in the port area are notably higher than those in the surrounding vicinity and the urban area levels. Evidently, these two pollutants emanate from the port, rendering them focal points for the subsequent investigations in this study. The temporal distribution patterns of these two pollutants differ between the port area and other locations. Typically, within a day, their concentrations reach a nadir between 11 a.m. and 2 p.m. in the port area, followed by a rapid increase, peaking between 11 p.m. and 3 a.m., and subsequently experiencing a swift decline until returning to the nadir. This pattern persists throughout the year. Pollution in the port areas is not significant in other seasons; hence, the concentration changes are not markedly different from the surrounding areas. Conversely, in the periphery of the port and at urban area concentrations, NO concentration remains relatively stable, while CO exhibits a minor peak around 7 a.m.
These observed discrepancies underscore the distinct hourly behavior of NO and CO in the port area, warranting a more detailed investigation to uncover the underlying factors influencing their temporal variations. The unique concentration patterns of these pollutants highlight their intricate interactions with local emission sources, meteorological conditions, and atmospheric dispersion dynamics within the port environment. Such insights are pivotal for comprehending the intricacies of air pollution in the port area and formulating effective mitigation strategies.

4.1.2. NO2

The concentration of NO2 exhibits a similar hourly pattern across all three locations, characterized by lower levels during the daytime and elevated concentrations at night. The minimum concentration is observed around noon, between 11 a.m. and 12 p.m., while the maximum concentration occurs around 11 p.m. during the nighttime hours. However, it is important to highlight a notable distinction: NO2 concentration is highest at the urban point, followed by the interior of the port, and lowest in the vicinity of the port.

4.1.3. SO2

The concentration of SO2 in the vicinity of the port area is significantly higher than both within the port area and the urban area levels. SO2 concentration in the surrounding vicinity experiences a continuous increase from 11 p.m. to 8 a.m. This phenomenon can be attributed to the influence of Shanghai’s traffic control measures, where trucks typically queue up for entry and unloading in the port area after the evening rush hour, departing before the morning rush hour of the following day. Meanwhile, trucks waiting outside the port gates often engage in idling or slow-moving operations, and their numbers surpass the count of vehicles within the port area. Consequently, SO2 accumulates during this period. At the same time, ship emissions are also an important source of sulfur dioxide. When ships are docked at the port and are not using shore power, they need to continue running their engines to maintain basic operations onboard, such as electricity supply and cooling systems. During this time, the burning of fuel by their engines produces sulfur dioxide. However, in recent years, due to the mandate for the use of low-sulfur fuels, SO2 emissions have shown a declining trend.

4.1.4. PM10 and PM2.5

For particulate matter, specifically larger-sized PM10, the urban area concentration experiences morning and evening peaks, reaching their highest levels at 8 a.m. and 7 p.m. Similarly, a similar hourly pattern of morning and evening peaks is observed within the port area, akin to the urban area concentration. However, in the surrounding vicinity of the port, the highest PM10 values emerge around 2 a.m. Conversely, for smaller-sized PM2.5, concentrations within the port area remain consistently lower than those in the surrounding vicinity and the urban area levels throughout the day. External to the port area, the concentration of PM2.5 exhibits a peak around 2 a.m.
The lower levels of PM2.5 and PM10 concentrations in the port area compared to urban concentrations can be attributed to several factors. Firstly, the geographical location of Waigaoqiao Port in eastern Shanghai, situated near the coastline, subjects the region to maritime influences. This geographic placement allows sea breezes to effectively disperse pollutants, reducing particulate matter concentrations in the atmosphere, given the easier dispersion of particulates compared to other pollutants. Secondly, stringent environmental regulations within port zones enforce strict controls on emissions from port facilities, ships, and related industrial activities. These regulations, like vehicle emission standards China V and China VI, require vehicles to install catalytic converters and particulate filters, thereby curbing particulate emissions. Lastly, the comparatively lower population density in port areas, in contrast to urban zones, contributes to reduced vehicular and industrial activities, limiting particulate matter generation from reduced traffic and industrial operations, as well as minimizing construction and road dust.

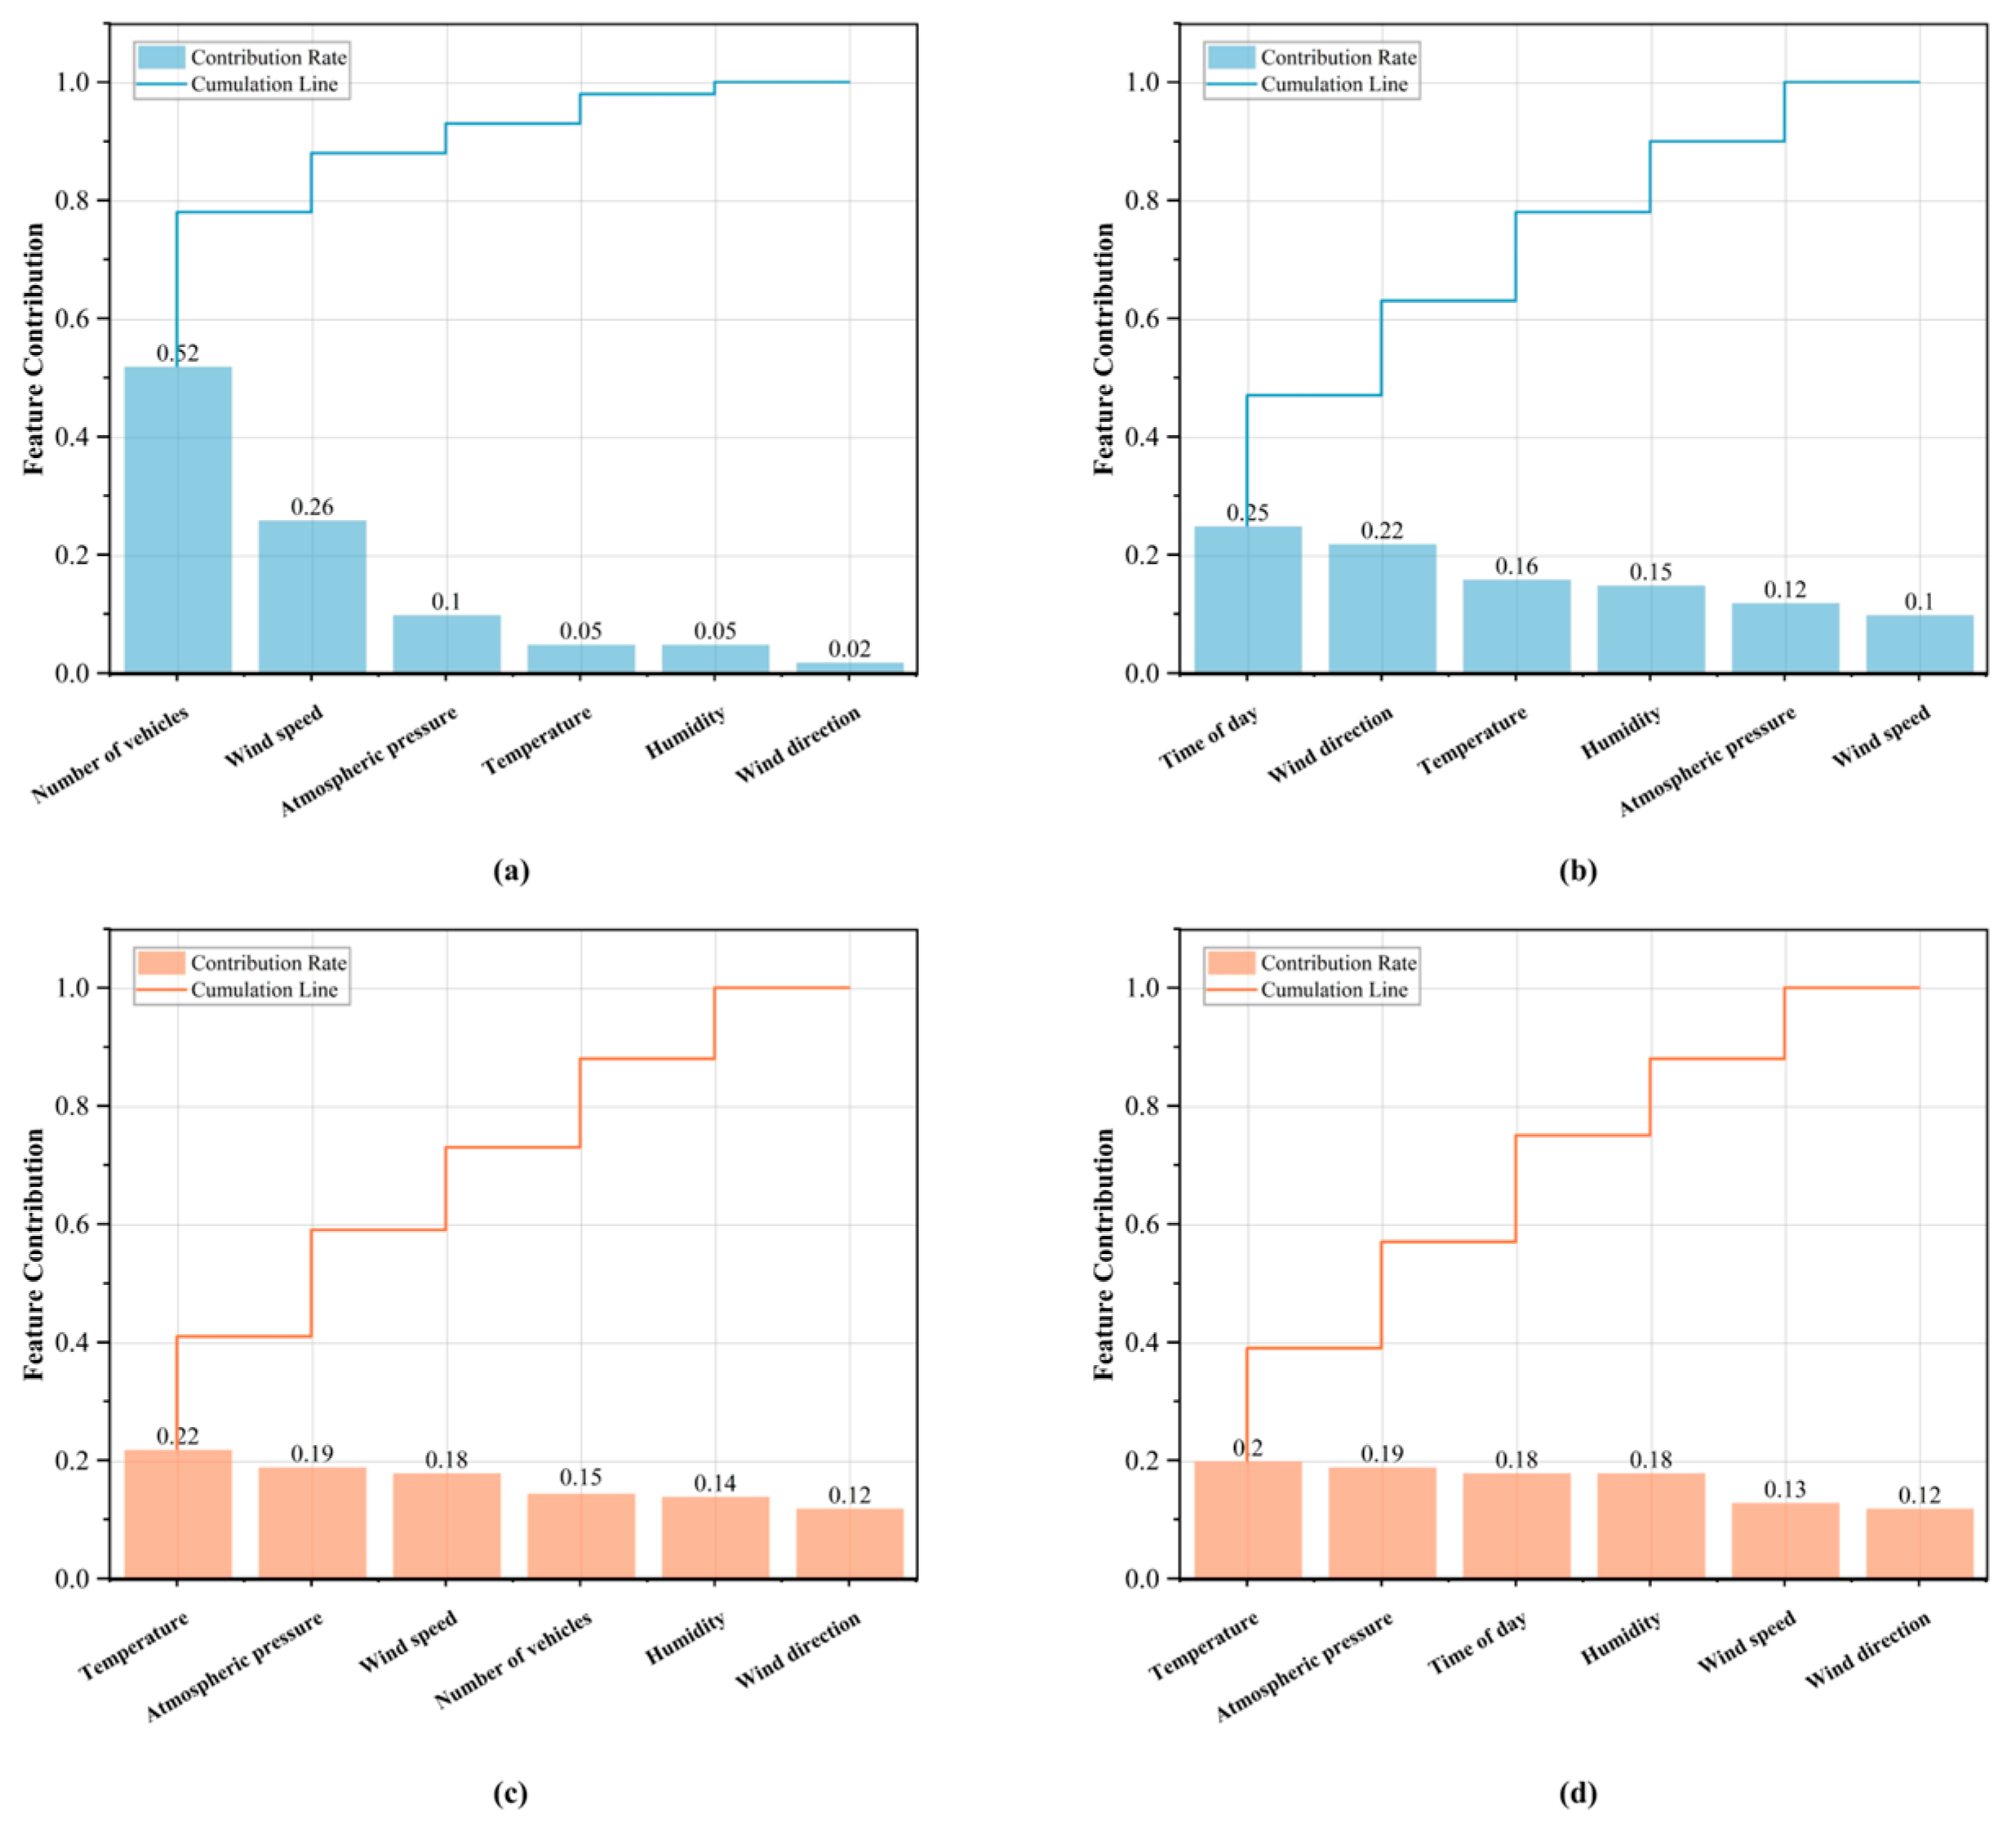
4.2. Source Contribution Analysis

As previously mentioned, NO and CO are the primary pollutants in the port area. Therefore, this section employs a random forest analysis to quantitatively assess the contribution rates of these two pollutants. The model performance and specific contribution results are illustrated in Table 1 and Figure 3.
According to the random forest model’s results, for the daily variation in NO, vehicle emissions contribute the most, accounting for 52% of the total variation. This is followed by wind speed (26%), atmospheric pressure (10%), temperature (5%), humidity (5%), and wind direction (2%). The intensity of daily operations plays a crucial role in determining NO concentrations, which indicated by the number of container trucks operating in the port per day. Regarding the hourly variation in NO, the influence of the time of day accounts for 25%, followed by wind direction (22%), temperature (16%), humidity (15%), atmospheric pressure (12%), and wind speed (10%). The hourly pattern of NO exhibits significant time regularity, and meteorological conditions have a strong impact on pollutant dispersion.
In the case of CO daily variation, temperature contributes the most at 22%, followed by atmospheric pressure (19%), wind speed (18%), vehicle emission (15%), humidity (14%), and wind direction (12%). However, the ranking of contributions changes for the hourly variation, with temperature (20%) leading, followed by atmospheric pressure (19%), time of day (18%), humidity (18%), wind speed (13%), and wind direction (12%). CO is not particularly sensitive to the intensity of operations, but it is more responsive to meteorological conditions such as temperature and atmospheric pressure.

4.3. Impact Analysis of Important Factors

This section delves into the intricate dynamics of the identified pollutants, focusing on the significance of various contributory factors and their implications for port pollution levels.

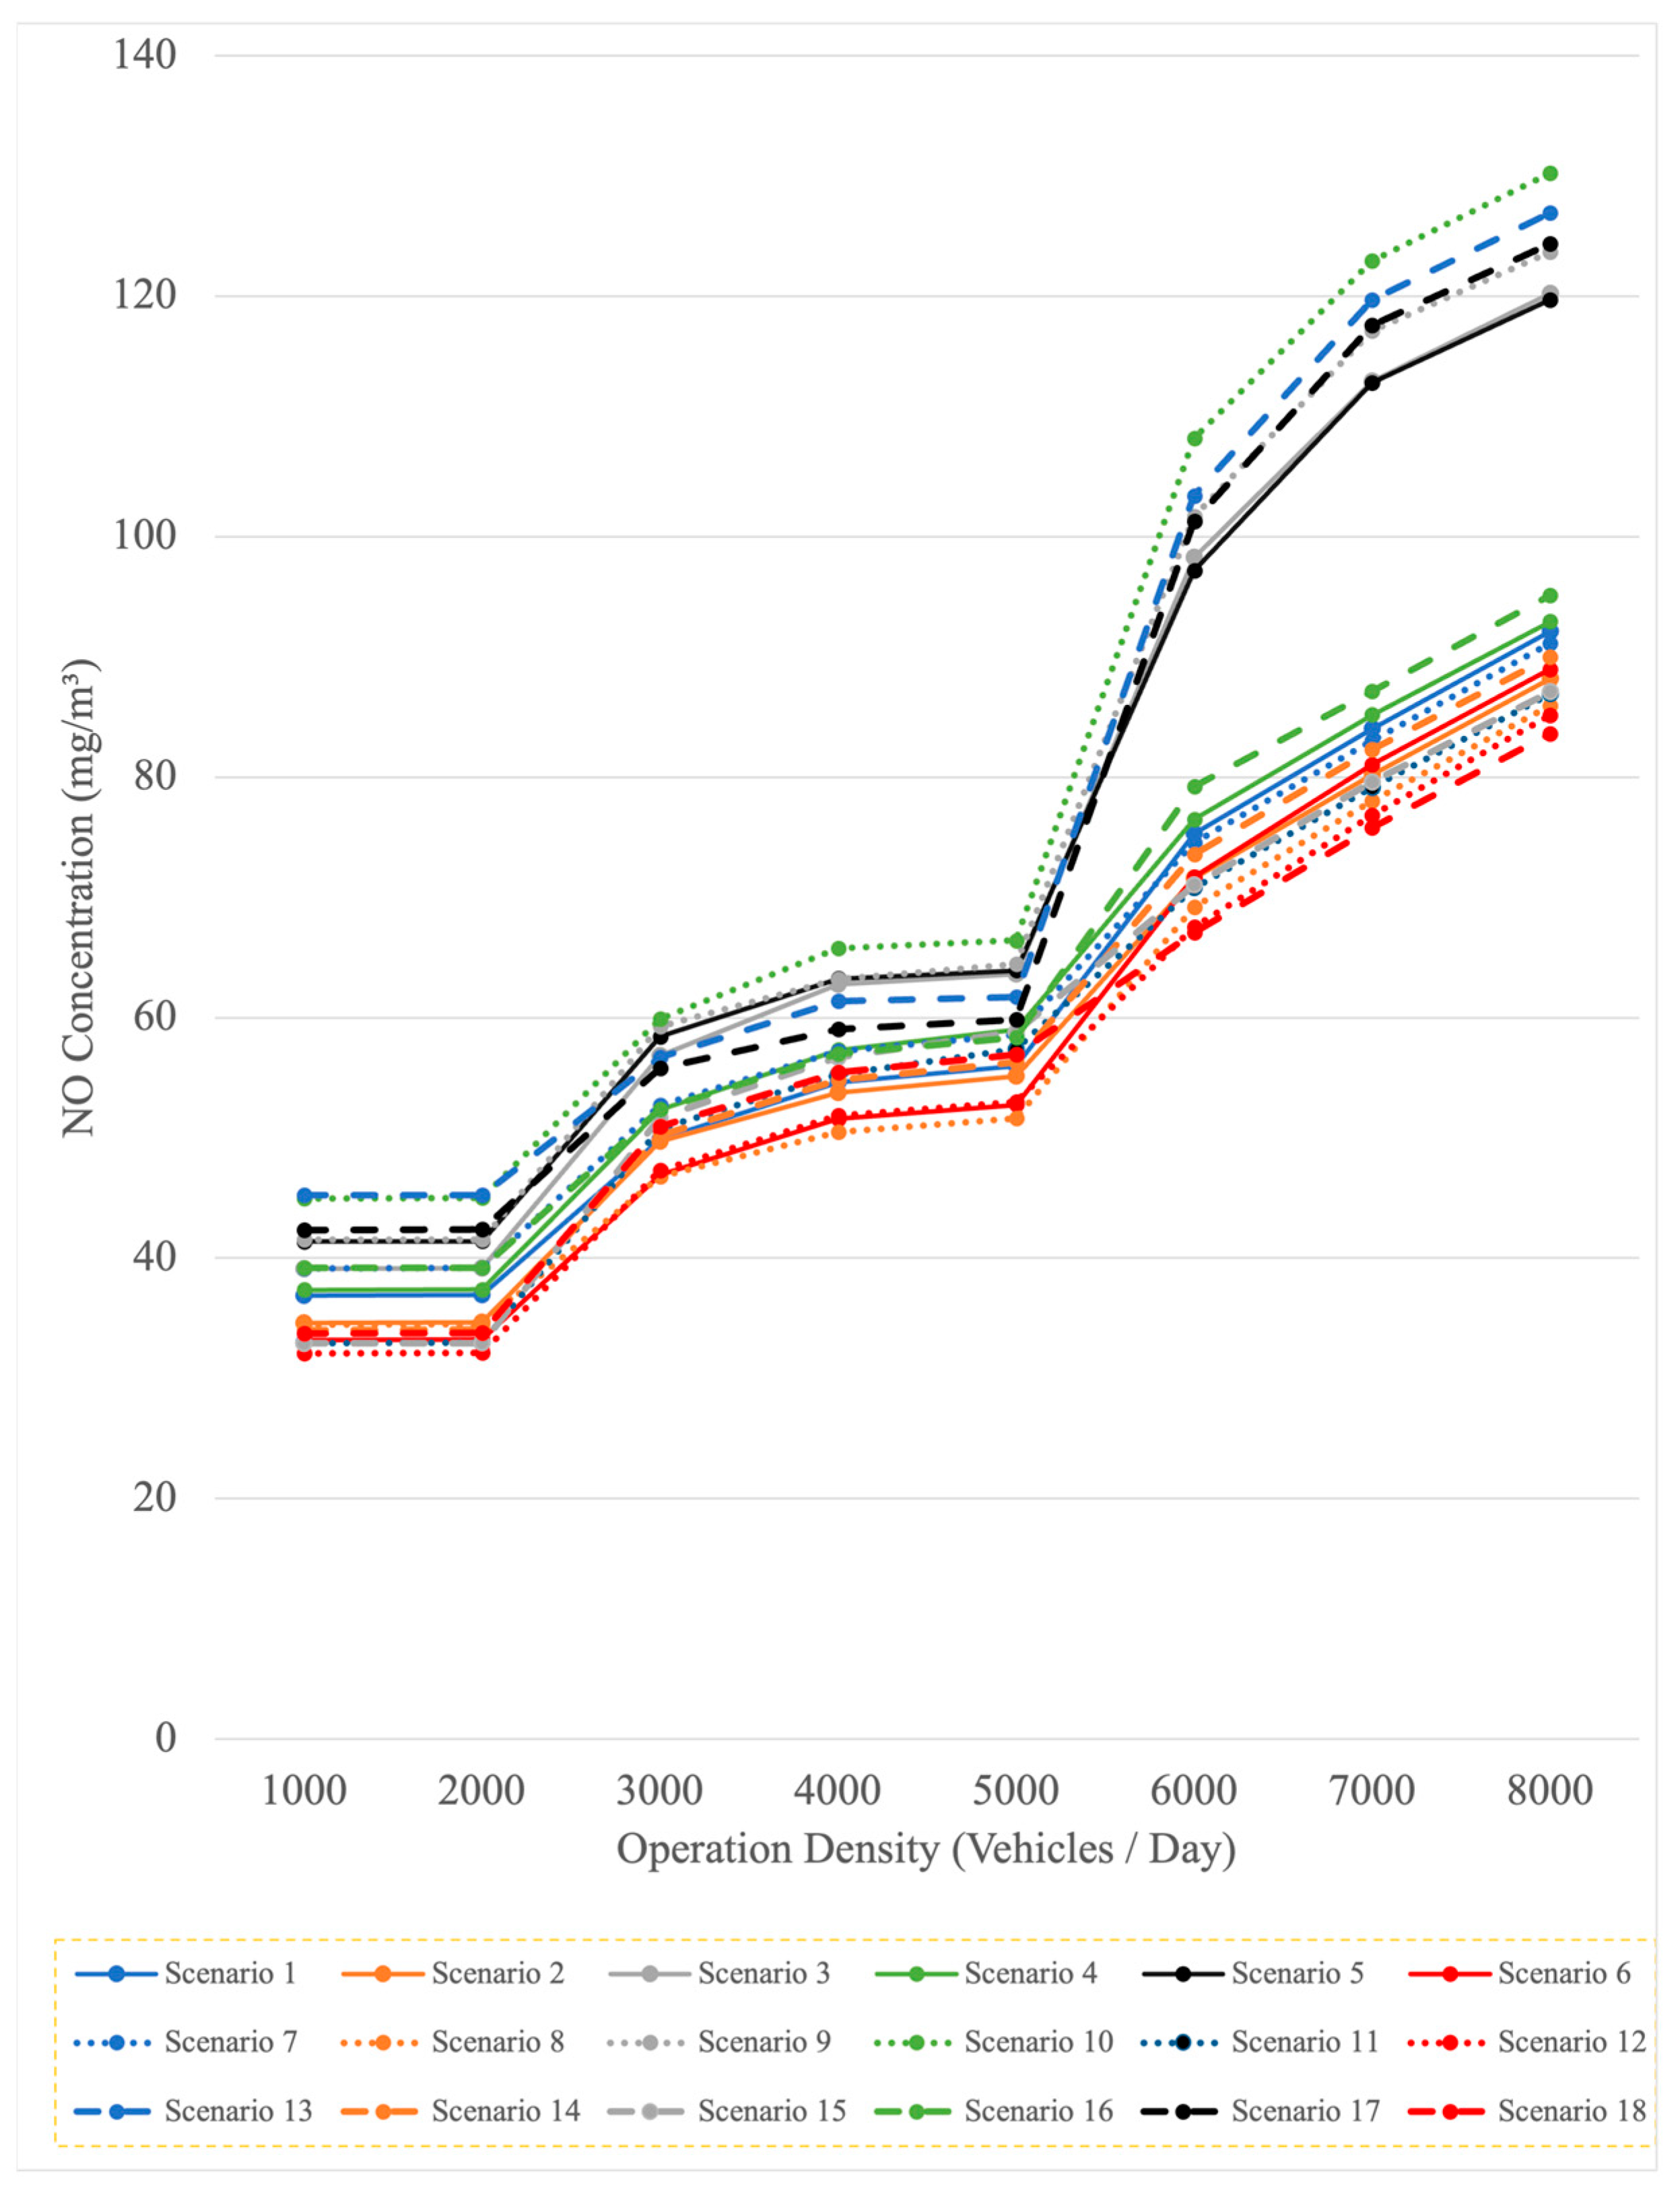
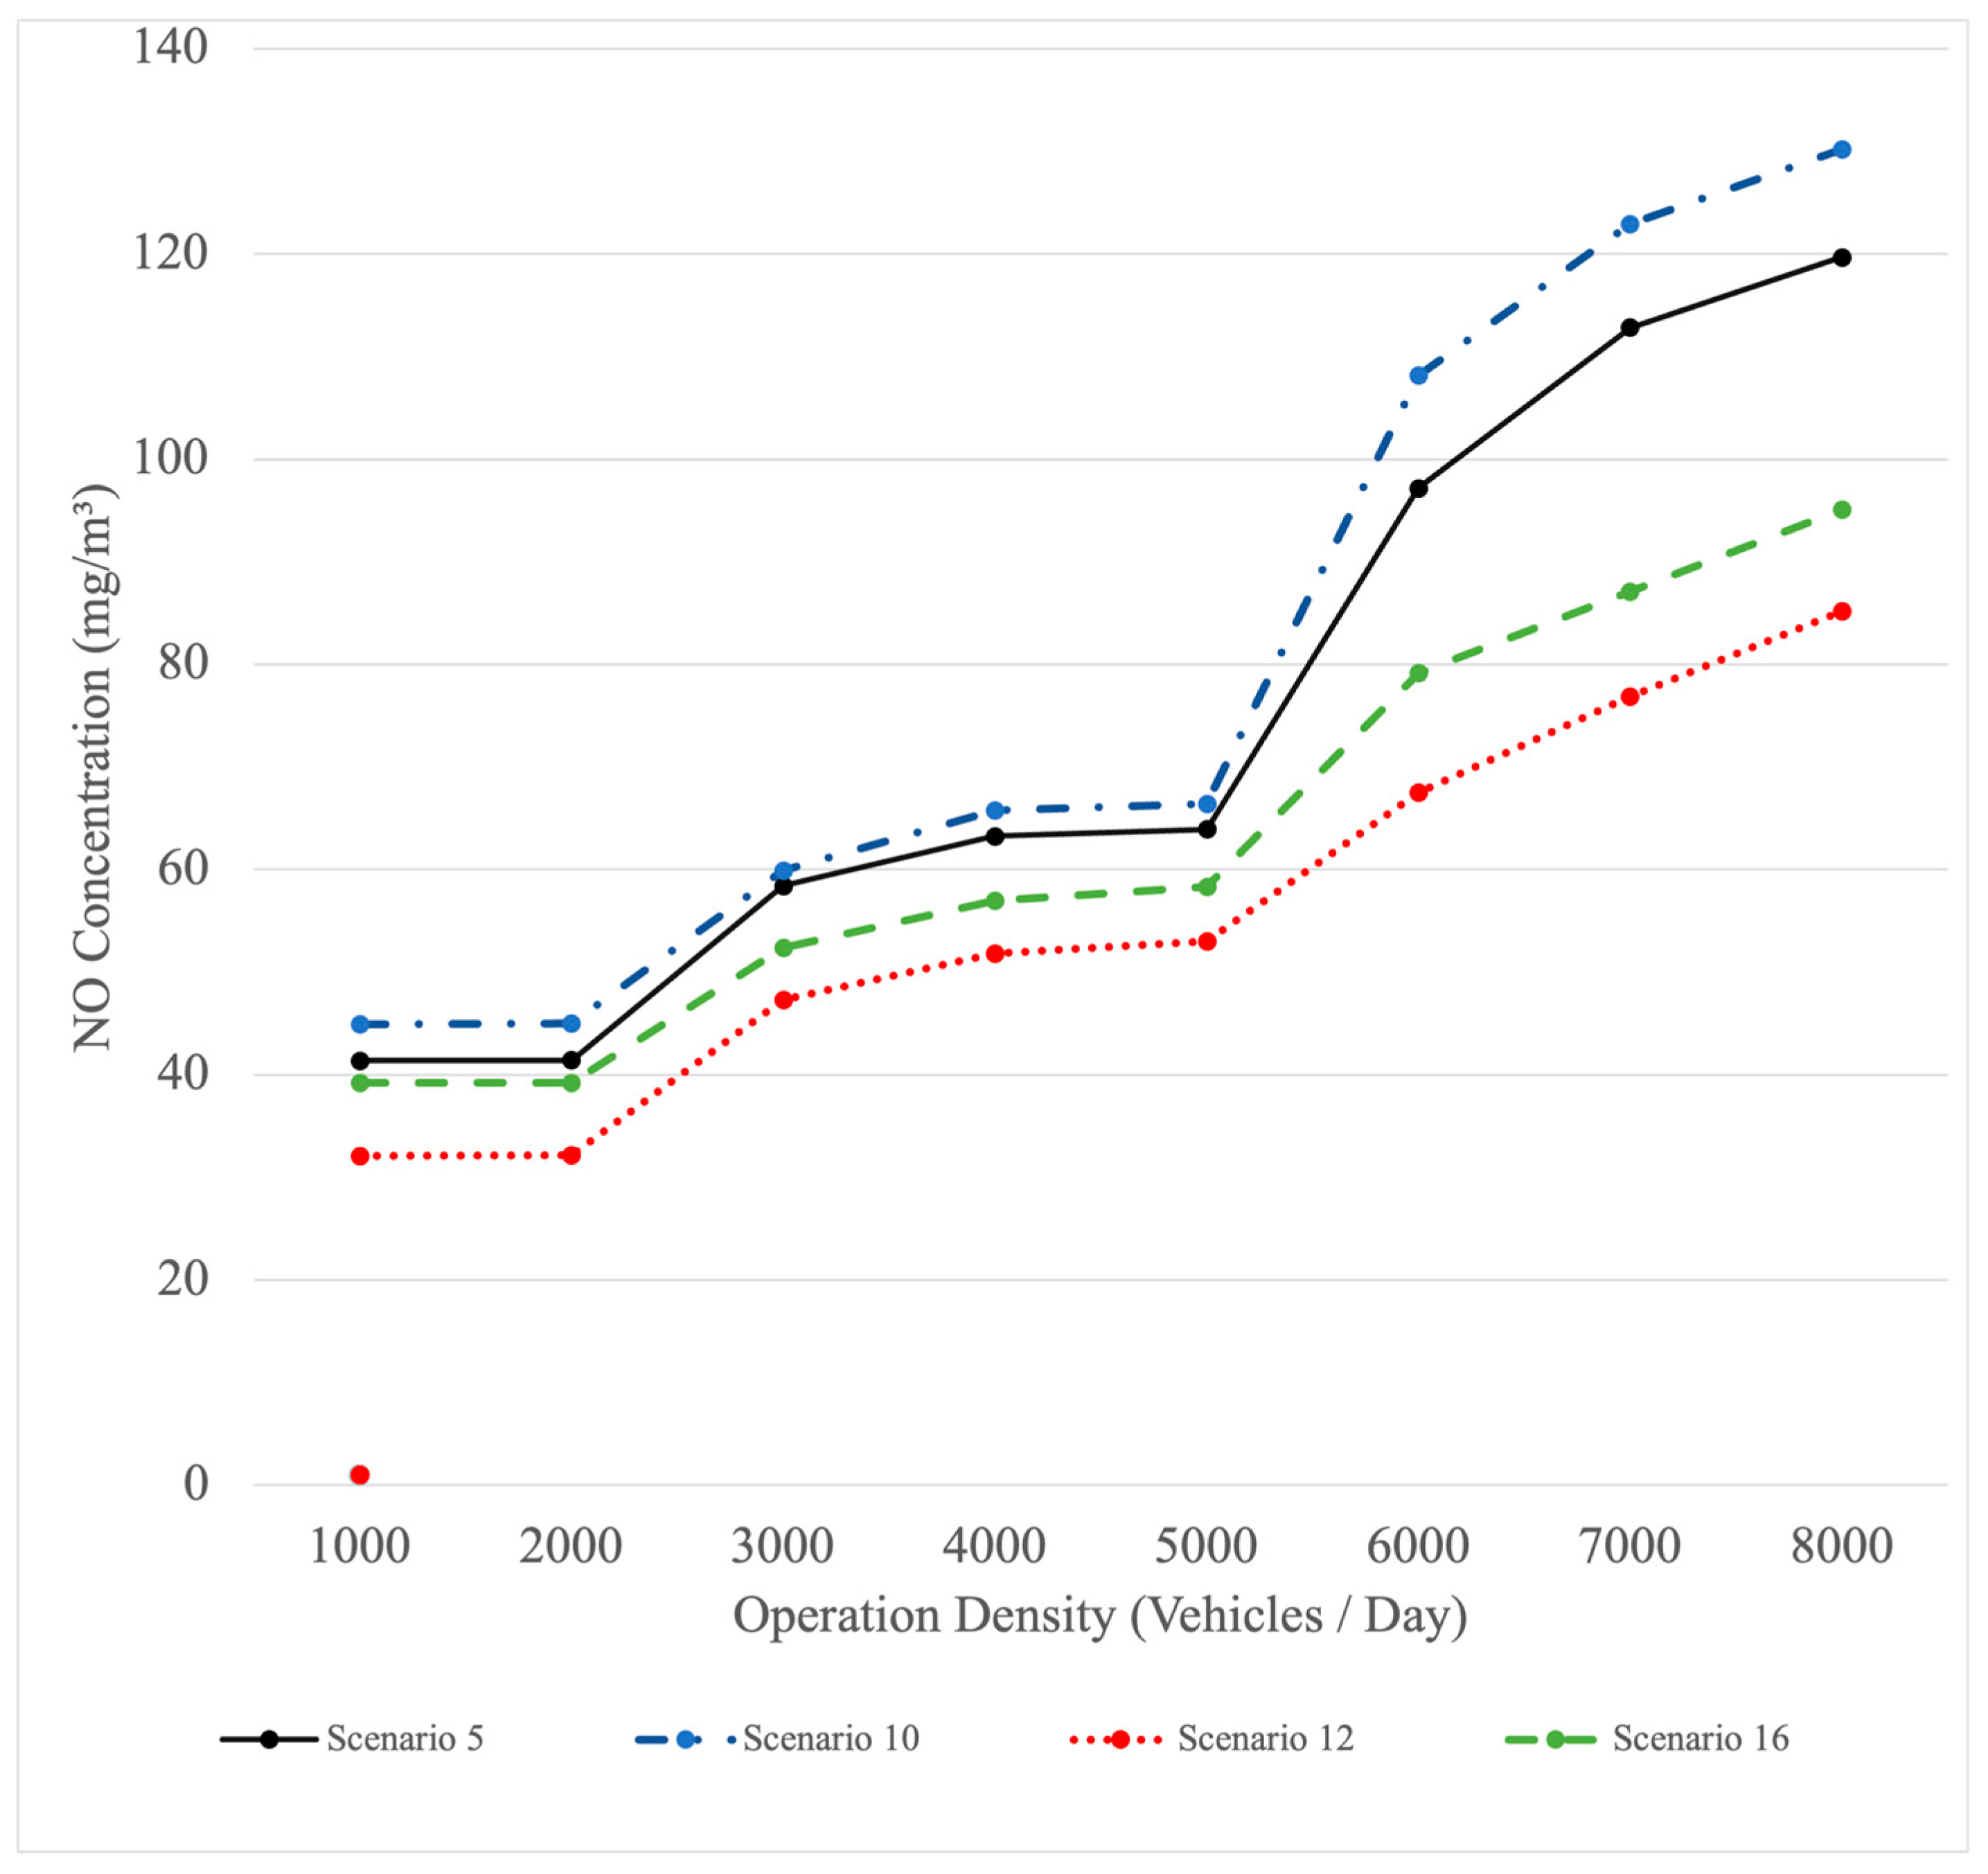
4.3.1. Number of Vehicles

In understanding vehicular contributions, we scrutinize the correlation between operational vehicular counts and NO levels, reflecting on the regulatory implications. Based on the aforementioned research, it is evident that vehicle emissions contribute significantly to NO concentrations, whereas CO shows lesser sensitivity to vehicle emissions. NO is primarily produced during high-temperature combustion processes, such as those found in diesel engines commonly used in trucks and heavy machinery prevalent in port areas. These engines tend to emit higher levels of NO compared to CO, which is more typically emitted by gasoline engines that operate at lower combustion temperatures [42,43]. Diesel engines are generally more efficient than gasoline engines and are optimized to burn fuel with less unburned carbon, resulting in lower CO emissions relative to NO emissions. Therefore, this section focuses solely on investigating the impact of vehicle emissions on NO levels. To achieve quantitative results, this study selects three distinct meteorological scenarios for further investigation.
The impact of operational intensity on pollution concentration exhibits non-linearity across varying meteorological conditions [44,45]. Designing multiple scenarios allows for a more effective and intuitive visualization of how operational intensity influences pollution levels under different weather conditions. Different meteorological factors like wind speed, direction, and humidity interact non-linearly with operational activities, impacting pollution dispersion uniquely in each scenario. These designed scenarios enable a comprehensive understanding of the complex relationship between operational intensity and pollution concentration, highlighting the nuanced variations that emerge across diverse weather conditions. This approach facilitates a clearer grasp of the non-linear patterns in the influence of operational intensity on pollution levels, enhancing insights into the environmental dynamics within port operations.
As mentioned above, the orthogonal experimental design method is used to design typical meteorological scenarios. The goal is to design a five-factor, three-level orthogonal experiment using factors such as temperature, air pressure, humidity, wind speed, and wind direction. An L 18 ( 3 7 ) array, which has 18 rows and can accommodate up to seven factors, can accommodate at least five factors (columns) and three levels. Then, assign each of your five factors (temperature, air pressure, humidity, wind speed, and wind direction) to a different column in the orthogonal array. For an L 18 ( 3 7 ) array, only five of the available columns are used. Three levels for each factor are listed below. For wind direction, three typical directions are selected. For other factors, three levels (high, medium, and low) are assigned.
  • Temperature: high (15 °C), medium (10 °C), low (5 °C);
  • Air Pressure: high (1030 hPa), medium (1020 hPa), low (1010 hPa);
  • Humidity: high (85%), medium (75%), low (70%);
  • Wind Speed: high (3 km/h), medium (2 km/h), low (1 km/h);
  • Wind Direction: SE, S, N.
Within these 18 scenarios, a random forest model is employed to predict pollutant concentrations. Subsequently, the pollution concentrations under different operational intensities are estimated, providing data-driven support for formulating subsequent emission reduction measures. The specific parameters for these 18 scenarios are outlined in Table 2.
The variation curves depicted in Figure 4 illustrate that NO exhibits similar trends in response to operational intensities across different meteorological conditions. To ensure the clarity and conciseness of the images, the figure displays 4 typical scenarios out of the 18 mentioned above. For all scenarios, please refer to Figure A1 in Appendix A. When the daily operational vehicle count is less than 5000, NO concentration shows a gradual increase. However, once this count surpasses 5000, the rate of increase becomes more rapid. In other words, when the number of operating vehicles in the port area is below 5000, the concentration variation in NO remains relatively minor. However, if the number of operating vehicles exceeds 5000, even a slight increase in operational intensity leads to a significantly higher rise in pollutant concentration levels. It can also be observed that when the operational intensity exceeds 5000, the variation pattern gradually divides into two clusters. The upper cluster includes scenarios 3, 5, 9, 10, 13, and 17, indicating that under conditions of lower wind speed, the excessive increase in pollutant concentrations becomes more pronounced. Therefore, it is evident that maintaining the daily operational vehicle count below 5000 vehicles can effectively control pollution levels. Currently, the daily average number of operating vehicles in December is 5529, with a standard deviation of 733. Limiting the vehicles to below 5000 would have approximately a 9% impact on the port’s throughput capacity, yet it could yield about a 25% reduction in emissions.

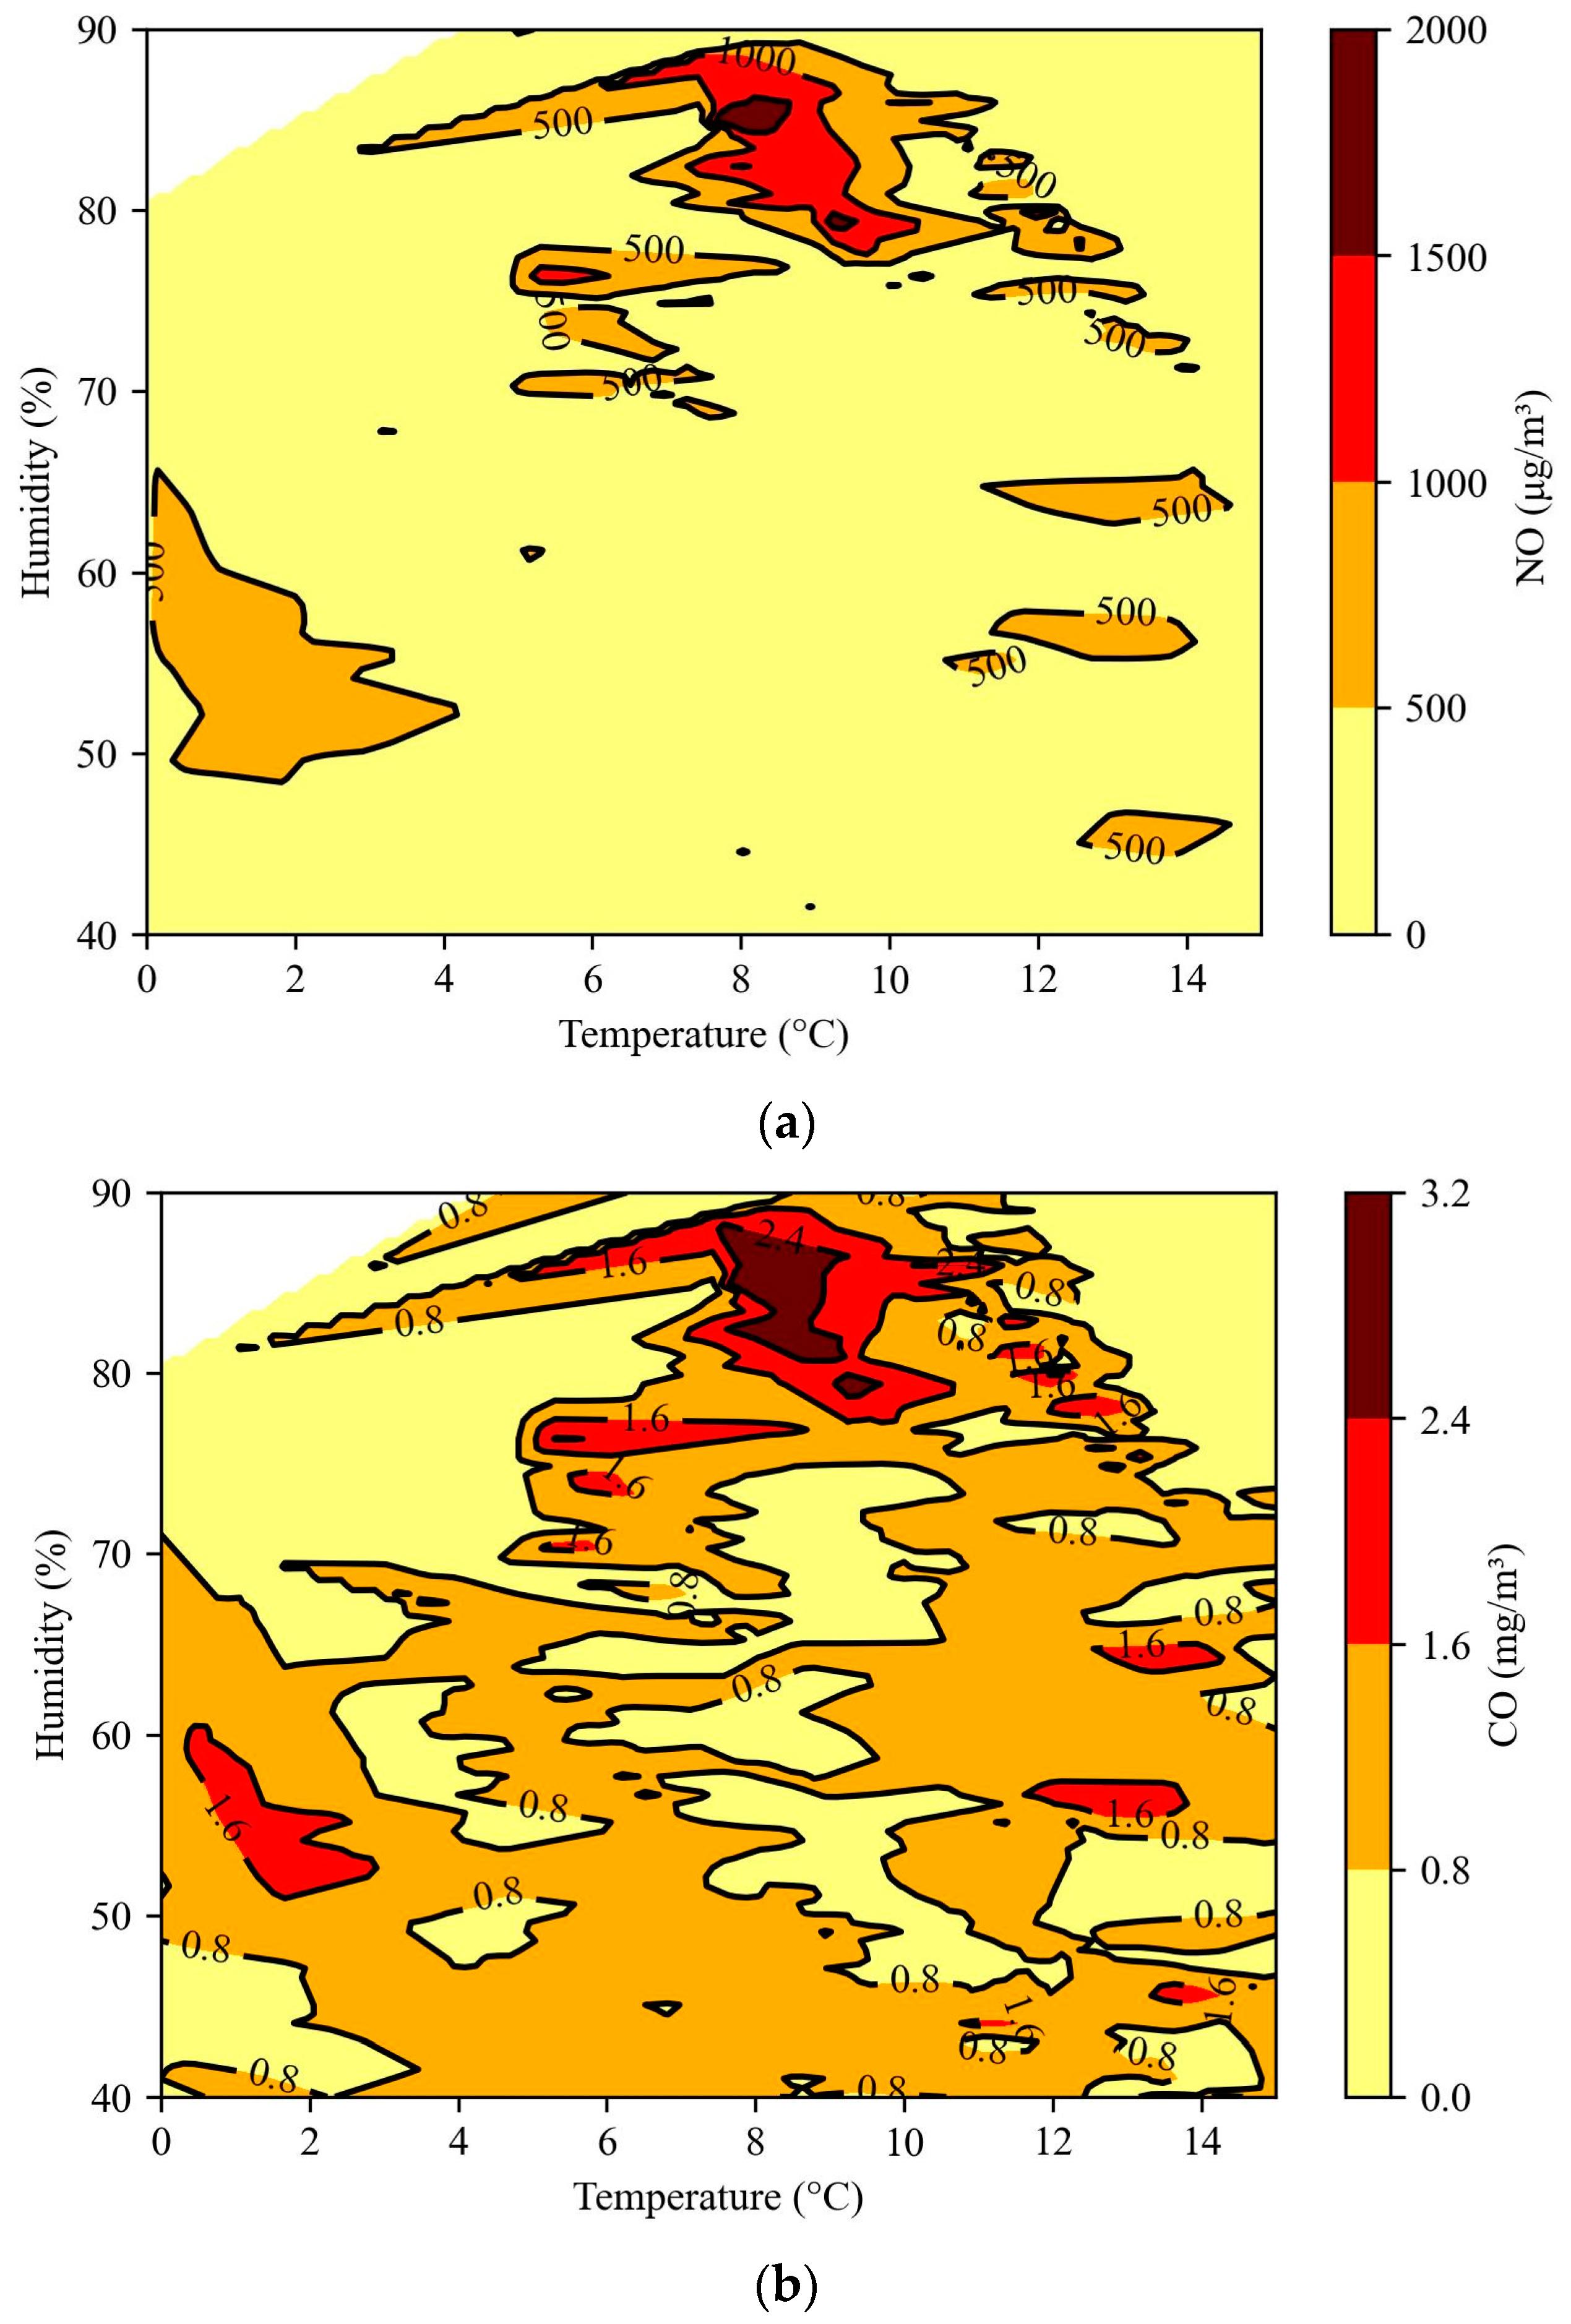
4.3.2. Temperature and Humidity

The role of meteorological elements is dissected to elucidate their direct and indirect effects on pollutant behavior, with a particular focus on temperature and humidity variations. According to Figure 5, both NO and CO exhibit similar trends in response to temperature and humidity. Severe pollution incidents are predominantly concentrated within the humidity range of 75% to 90% and the temperature range of 6 °C to 10 °C. In comparison, CO tends to experience severe pollution across a wider range of temperature and humidity levels.

4.3.3. Wind Speed and Wind Direction

Considering the complexities of wind patterns, we explore how wind speed and direction shape the dispersion of pollutants, thus informing strategic environmental planning. As depicted in Figure 6, wind speed and wind direction also exhibit a significant influence on pollutant dispersion. Particularly in conditions of low wind speed below 0.2 m/s, a stagnant environment is conducive to the accumulation of pollutants, leading to severe pollution episodes. With increasing wind speed, the dispersion of NO becomes more efficient.
Under southeast winds, pollution accumulation is most pronounced. This wind direction is essentially parallel to the direction of the river, which hinders the transport of pollutants to nearby water bodies or the influx of clean air into the port area. The mechanism behind this phenomenon lies in the airflow dynamics created when the wind direction aligns parallel to the river’s flow. When the wind runs parallel to the river, it generates a hindering effect on the river’s airflow. The wind brushing against the river’s surface forms a barrier that obstructs the flow of air along the direction of the wind, impeding the transfer of pollutants from the river area to nearby water bodies or the port area. In such circumstances, clean air also struggles to flow into the port area along the river’s path due to the obstruction caused by the wind. This airflow obstruction, formed when the wind direction aligns parallel to the river’s flow, affects the dispersion of pollutants and the entry of clean air, consequently impacting the air quality in the port area under specific meteorological conditions [46,47].

5. Discussion and Conclusions

5.1. Discussion

This research has introduced and applied a data-driven methodology for quantifying port pollution, analyzing the distribution and contribution of pollutants in Waigaoqiao Port, and offering recommendations for governmental action. The key findings include the following:
Identification of Major Pollutants: This study identified carbon monoxide (CO) and nitrogen oxide (NO) as the primary pollutants in the port area, exhibiting distinct hourly patterns. These findings contrast with the common bimodal distribution seen in urban areas, highlighting the unique pollution dynamics in port environments. More specifically, previous studies on atmospheric pollution in ports have primarily focused on sulfur oxides and nitrogen oxides. However, this research reveals that carbon monoxide pollution is also significantly prevalent in port areas. Through a comparative analysis between the port area, its surrounding region, and the urban concentration area, this study identifies NO and CO, both byproducts of incomplete combustion, as the main pollutants in the port area. These two pollutants exhibit an hourly pattern, with lower levels during the day and higher concentrations at night in the port area, surpassing the pollution levels in the surrounding region and urban area concentrations. This pattern significantly differs from the common bimodal distribution observed during rush hours in urban areas or the typical daytime-high and nighttime-low distribution. The port area does not exhibit substantial particulate matter emissions, with PM2.5 and PM10 concentrations being lower than the urban area levels. Due to the nighttime queuing of trucks at the port entrance, SO2 emissions in the vicinity of the port are notably higher compared to other areas. The data-driven analysis was crucial in uncovering the distinct hourly patterns of NO and CO in the port area. Such patterns might not have been as clearly identified without the use of sophisticated data analysis techniques. The ability to analyze large datasets over different times of the day allowed for this nuanced discovery, which adds a new dimension to the understanding of port pollution dynamics.
Quantitative Analysis Using Random Forest Model: The random forest model effectively quantified the contribution rates of different factors to pollutant concentrations. Notably, NO concentration was found to be significantly influenced by operational intensity and wind speed, while CO concentration responded more to a combination of meteorological factors. Previous studies on pollution source identification mainly employed experimental or simulation methods, whereas this research adopts a data-driven approach. A random forest model was constructed to learn the distribution patterns of pollutant concentrations, allowing for the quantitative estimation of the contribution rates of different influencing factors. NO concentration is primarily influenced by the intensity of operations (52%) and wind speed (26%), showing little sensitivity to temperature, humidity, and atmospheric pressure. CO concentration is influenced by a more complex set of factors, exhibiting a relatively even distribution of contribution rates. Various factors, including temperature (22%), atmospheric pressure (19%), wind speed (18%), operation intensity (15%), humidity (14%), and wind direction (12%), play a role in influencing CO concentrations. The data-driven approach, particularly when employing methods like random forest analysis, makes significant contributions to determining the contribution rates of various factors affecting pollution levels.
Recommendations for Policy and Practice: This study suggests implementing strict controls on operational intensities and considering meteorological conditions in pollution management strategies. Building upon the analysis of contribution rates from various influencing factors, this study further delved into a comprehensive examination of each factor’s impact. For NO concentration, restricting daily operation intensity to within 5000 trucks effectively prevents excessive growth of pollutant concentrations. This phenomenon of excess growth will be more obvious in a static wind state. Throughout the study period, both NO and CO exhibited similar trends in response to temperature and humidity. Severe pollution episodes predominantly occurred within the humidity range of 75% to 90% and the temperature range of 6 to 10 degrees Celsius. Particularly noteworthy is the susceptibility to severe pollution under calm wind conditions, with wind speeds below 0.2 m/s. Emphasizing the role of data-driven approaches, it recommends employing machine learning models for early pollution prediction, aiding in timely intervention and strategic decision making for environmental management. The findings from data-driven analysis offer a strong, evidence-based foundation for making practical recommendations. The insights gained into pollutant types and their behaviors are not based on assumptions or limited datasets but are derived from thorough and comprehensive model analysis.
In this study, the authors employed the random forest model, a machine learning approach, to analyze air pollution in the Waigaoqiao Port area, focusing on NO and CO. This contrasts with the majority of the existing literature, which relies on traditional statistical models or experimental methods [5,48]. The random forest model’s capability to handle large datasets and intricate relationships between variables surpasses traditional methodologies, enabling us to identify and analyze pollution sources with enhanced precision.
A notable distinction of our research is the in-depth exploration of temporal granularity. Unlike other studies that focus on larger time scales (daily, monthly, or yearly variations), our analysis also reveals hourly pollution changes within the region [49]. This fine-grained temporal resolution offers a novel perspective on understanding hourly pollution dynamics, allowing us to delve into the patterns of hourly variation and contribution rates of pollutants.
Additionally, our study differs in the selection of pollutants. While most research tends to focus on a single pollutant [26,48], particularly in port-related studies that often concentrate on NOx and particulate matter, our findings highlight a shift in pollution dynamics at advanced container terminals like Waigaoqiao. With the evolution of port processes and differences between types of ports, emissions of sulfur oxides and particulate matter have been effectively controlled. Therefore, our study emphasizes the emissions of NO and CO, reflecting the impact of technological advancements in port operations and the differences in port types.

5.2. Conclusions

A data-driven methodology was used to analyze port pollution at Waigaoqiao Port. Our key findings include the identification of major pollutants (CO and NO) with a unique hourly pattern differing from typical urban areas. This study used a random forest model to quantify the contribution rates of various factors to pollutant concentrations, highlighting the significant influence of operational intensity and meteorological conditions. Recommendations focus on controlling operational intensities and considering meteorological conditions in pollution management. This study underscores the importance of data-driven methods in environmental research and offers insights for policymakers and port authorities for sustainable environmental practices.
Looking forward, this research aims to further explore the mechanisms behind the influence of various factors on atmospheric pollutants. Leveraging machine learning for predictive modeling could enable proactive measures for pollution control, aligning with sustainable environmental practices.

Author Contributions

Conceptualization, X.-Z.L., Q.W. and J.P.; methodology, X.-Z.L., Z.-R.P. and H.H.; validation, X.-Z.L., Q.W. and J.P.; formal analysis, X.-Z.L.; data curation, Q.F., Q.W. and J.P.; writing—original draft preparation, X.-Z.L.; writing—review and editing, Z.-R.P., H.H. and Q.F.; visualization, X.-Z.L.; supervision, Z.-R.P. and H.H.; project administration, Z.-R.P. and Q.F. All authors have read and agreed to the published version of the manuscript.

Funding

This research received no external funding.

Institutional Review Board Statement

Not applicable.

Informed Consent Statement

Not applicable.

Data Availability Statement

The datasets presented in this article are not available because of government regulations in China.

Conflicts of Interest

The authors declare no conflicts of interest.

Appendix A

Figure A1. Change in NO with operation density under 18 scenarios.
Jmse 12 00288 g0a1

References

  1. Barberi, S.; Sambito, M.; Neduzha, L.; Severino, A. Pollutant Emissions in Ports: A Comprehensive Review. Infrastructures 2021, 6, 114. [Google Scholar] [CrossRef]
  2. Bailey, D.; Solomon, G. Pollution prevention at ports: Clearing the air. Environ. Impact Assess. Rev. 2004, 24, 749–774. [Google Scholar] [CrossRef]
  3. He, L.; Jiao, Y.; Jia, R.; Liang, Y. Review on the Research Status of Air Pollutant Emission in Port Area in the Development of Green Port. J. Chongqing Jiaotong Univ. Nat. Sci. 2021, 40, 78–87. [Google Scholar]
  4. Zhang, Y.; Yang, X.; Brown, R.; Yang, L.; Morawska, L.; Ristovski, Z.; Fu, Q.; Huang, C. Shipping emissions and their impacts on air quality in China. Sci. Total Environ. 2017, 581, 186–198. [Google Scholar] [CrossRef] [PubMed]
  5. Ye, Y.; Geng, P. A Review of Air Pollution Monitoring Technology for Ports. Appl. Sci. 2023, 13, 5049. [Google Scholar] [CrossRef]
  6. Chen, T.-M.; Shofer, S.; Gokhale, J.; Kuschner, W.G. Outdoor air pollution: Overview and historical perspective. Am. J. Med. Sci. 2007, 333, 230–234. [Google Scholar] [CrossRef] [PubMed]
  7. Kelishadi, R.; Poursafa, P. Air pollution and non-respiratory health hazards for children. Arch. Med. Sci. 2010, 6, 483–495. [Google Scholar] [CrossRef] [PubMed]
  8. He, H.D.; Lu, D.N.; Zhao, H.M.; Peng, Z.R. Characterizing CO2 and NOx emission of vehicles crossing toll stations in highway. Transp. Res. Part D Transp. Environ. 2024, 126, 104024. [Google Scholar] [CrossRef]
  9. Tengberg, A.; IEEE. Versatile use of Port and Harbor MetOcean Systems for safety, environmental monitoring, science and recreation. In Proceedings of the Oceans ‘04 MTS/IEEE Techno-Ocean ‘04 Conference, Kobe, Japan, 9–12 November 2004. [Google Scholar]
  10. Smailys, V.; Strazdauskiene, R.; Bereisiene, K. Evaluation of a possibility to identify port pollutants trace in Klaipeda City air pollution monitoring stations. Environ. Res. Eng. Manag. 2009, 50, 66–75. [Google Scholar]
  11. Kim, G.; Jeong, M.-H.; Jeon, S.-B.; Khan, M.S. Time-Series Analysis of Ship Movements Using Community Detection and Functional Data Analysis across the East Coast of the Republic of Korea. J. Coast. Res. 2023, 39, 360–365. [Google Scholar] [CrossRef]
  12. Xie, B.; Zhang, X.; Lu, J.; Liu, F.; Fan, Y. Research on ecological evaluation of Shanghai port logistics based on emergy ecological footprint models. Ecol. Indic. 2022, 139, 108916. [Google Scholar] [CrossRef]
  13. Lu, X.; Qin, D.; Sun, M.; Yi, Z.; Ma, P.; Wang, Y.; Yang, C. Method for Tracing Source of Air Pollution Discharge in Rubbish Incineration Power Plant Using Electronic Device. Patent Application No CN202210607574.X, 30 August 2022. [Google Scholar]
  14. Xue, W.; Ying, D.; Li, Y.; Sheng, Y.; He, T.; Shi, P.; Liu, M.; Zhao, L. Method for establishing soil contaminant discharge inventory: An arsenic-contaminated site case study. Environ. Res. 2023, 227, 115700. [Google Scholar] [CrossRef] [PubMed]
  15. Bie, S.; Yang, L.; Zhang, Y.; Huang, Q.; Li, J.; Zhao, T.; Zhang, X.; Wang, P.; Wang, W. Source appointment of PM2.5 in Qingdao Port, East of China. Sci. Total Environ. 2021, 755, 142456. [Google Scholar] [CrossRef] [PubMed]
  16. Ezeh, G.C.; Abiye, O.E.; Obioh, I.B. Elemental analyses and source apportionment of PM2.5 and PM2.5–10 aerosols from Nigerian urban cities. Cogent Environ. Sci. 2017, 3, 1323376. [Google Scholar] [CrossRef]
  17. Ge, S.; Wang, S.; Xu, Q.; Ho, T. Source apportionment simulations of ground-level ozone in Southeast Texas employing OSAT/APCA in CAMx. Atmos. Environ. 2021, 253, 118370. [Google Scholar] [CrossRef]
  18. Samsudin, M.S.; Azid, A.; Razik, M.A.; Zaudi, M.A.; Shaharudin, S.M. Source of apportionment of Air Quality Parameters at Federal Port of Malaysia with Emphasis on Ship Emission. IOP Conf. Ser. Earth Environ. Sci. 2021, 810, 012052. [Google Scholar] [CrossRef]
  19. Celic, J.; Cuculic, A.; Valcic, M. Remote Sensing for Ship Emissions Monitoring in Adriatic Ports: An Approach. In Proceedings of the 54th ELMAR International Symposium, Zadar, Croatia, 12–14 September 2012. [Google Scholar]
  20. Ding, B.; Zhang, C.; Lai, L.; Liao, Q.; Ding, Q.; Zhang, J. Motor Car Exhaust Gas Remote Sensing Monitoring System. Patent Application No CN201911046102.6, 31 December 2019. [Google Scholar]
  21. Steffens, J.; Kimbrough, S.; Baldauf, R.; Isakov, V.; Brown, R.; Powell, A.; Deshmukh, P. Near-port air quality assessment utilizing a mobile measurement approach. Atmos. Pollut. Res. 2017, 8, 1023–1030. [Google Scholar] [CrossRef] [PubMed]
  22. Cammin, P.; Sarhani, M.; Heilig, L.; Voß, S. Applications of Real-Time Data to Reduce Air Emissions in Maritime Ports. In Design, User Experience, and Usability. Case Studies in Public and Personal Interactive Systems; Lecture Notes in Computer, Science; Marcus, A., Rosenzweig, E., Eds.; Springer: Cham, Switzerland, 2020; pp. 31–48. [Google Scholar]
  23. Mansoursamaei, M.; Moradi, M.; Gonzalez-Ramirez, R.G.; Lalla-Ruiz, E. Machine Learning for Promoting Environmental Sustainability in Ports. J. Adv. Transp. 2023, 2023, 2144733. [Google Scholar] [CrossRef]
  24. Chen, K.; Guo, J.D.; Xin, X.; Zhang, T.; Zhang, W. Port sustainability through integration: A port capacity and profit-sharing joint optimization approach. Ocean. Coast. Manag. 2023, 245, 106867. [Google Scholar] [CrossRef]
  25. Fan, Y.Q.; Liang, C.J.; Hu, X.Y.; Li, Y. Planning connections between underground logistics system and container ports. Comput. Ind. Eng. 2020, 139, 106199. [Google Scholar] [CrossRef]
  26. Garbatov, Y.; Georgiev, P.; Fuchedzhieva, I. Extreme Value Analysis of NOx Air Pollution in the Winter Seaport of Varna. Atmosphere 2022, 13, 1921. [Google Scholar] [CrossRef]
  27. Zhang, Y.; Zhou, R.; Chen, J.H.; Gao, X.J.; Zhang, R. Spatiotemporal characteristics and influencing factors of Air pollutants over port cities of the Yangtze River Delta. Air Qual. Atmos. Health 2023, 16, 1587–1600. [Google Scholar] [CrossRef]
  28. Yu, L.; Zhou, R.T.; Chen, R.D.; Lai, K.K. Missing Data Preprocessing in Credit Classification: One-Hot Encoding or Imputation? Emerg. Mark. Financ. Trade 2022, 58, 472–482. [Google Scholar] [CrossRef]
  29. Al-Shehari, T.; Alsowail, R.A. An Insider Data Leakage Detection Using One-Hot Encoding, Synthetic Minority Oversampling and Machine Learning Techniques. Entropy 2021, 23, 1258. [Google Scholar] [CrossRef]
  30. Talekar, B.; Agrawal, S. A Detailed Review on Decision Tree and Random Forest. Biosci. Biotechnol. Res. Commun. 2020, 13, 245–248. [Google Scholar] [CrossRef]
  31. Ding, J.; Dai, Q.; Fan, W.; Lu, M.; Zhang, Y.; Han, S.; Feng, Y. Impacts of meteorology and precursor emission change on O-3 variation in Tianjin, China from 2015 to 2021. J. Environ. Sci. 2023, 126, 506–516. [Google Scholar] [CrossRef] [PubMed]
  32. Grange, S.K.; Carslaw, D.C. Using meteorological normalisation to detect interventions in air quality time series. Sci. Total Environ. 2019, 653, 578–588. [Google Scholar] [CrossRef]
  33. Sheridan R, P. Using random forest to model the domain applicability of another random forest model. J. Chem. Inf. Model. 2013, 53, 2837–2850. [Google Scholar] [CrossRef]
  34. Rybarczyk, Y.; Zalakeviciute, R. Machine Learning Approaches for Outdoor Air Quality Modelling: A Systematic Review. Appl. Sci. 2018, 8, 2570. [Google Scholar] [CrossRef]
  35. Speiser, J.L.; Miller, M.E.; Tooze, J.; Ip, E. A comparison of random forest variable selection methods for classification prediction modeling. Expert Syst. Appl. 2019, 134, 93–101. [Google Scholar] [CrossRef]
  36. Zhu, X.W.; Yin, H.T. The Visualization of E-commerce High-dimensional Data Based on Random Forest. Agro Food Ind. Hi-Tech 2017, 28, 987–991. [Google Scholar]
  37. Jain, V.; Sharma, J.; Singhal, K.; Phophalia, A. Exponentially Weighted Random Forest. In Proceedings of the 8th International Conference on Pattern Recognition and Machine Intelligence (PReMI), Tezpur Univ, Tezpur, India, 17–20 December 2019. [Google Scholar]
  38. Wang, X.J. Ladle Furnace Temperature Prediction Model Based on Large-scale Data with Random Forest. IEEE-CAA J. Autom. Sin. 2017, 4, 770–774. [Google Scholar] [CrossRef]
  39. Geramita, A.V.; Geramita, J.M.; Wallis, J.S. Orthogonal desingns. Linear Multilinear Algebra 1976, 3, 281–306. [Google Scholar] [CrossRef]
  40. Seberry, J. Orthogonal Designs, in Orthogonal Designs: Hadamard Matrices, Quadratic Forms and Algebras; Springer: Berlin/Heidelberg, Germany, 2017; pp. 1–5. [Google Scholar]
  41. Gong, W.; Cai, Z.; Jiang, L. Enhancing the performance of differential evolution using orthogonal design method. Appl. Math. Comput. 2008, 206, 56–69. [Google Scholar] [CrossRef]
  42. Liu, H.Y.; Wang, Z.; Wang, J.X.; He, X. Improvement of emission characteristics and thermal efficiency in diesel engines by fueling gasoline/diesel/PODEn blends. Energy 2016, 97, 105–112. [Google Scholar] [CrossRef]
  43. Murillo, S.; Míguez, J.L.; Porteiro, J.; López-González, L.M.; Granada, E.; Morán, J.C.; Paz, C. Exhaust emissions from diesel, LPG, and gasoline low-power engines. Energy Sources Part A Recovery Util. Environ. Eff. 2008, 30, 1065–1073. [Google Scholar] [CrossRef]
  44. Haugen, M.J.; Gkantonas, S.; El Helou, I.; Pathania, R.; Mastorakos, E.; Boies, A.M. Measurements and modelling of the three-dimensional near-field dispersion of particulate matter emitted from passenger ships in a port environment. Atmos. Environ. 2022, 290, 119384. [Google Scholar] [CrossRef]
  45. Paternina-Arboleda, C.D.; Agudelo-Castaneda, D.; Voss, S.; Das, S. Towards Cleaner Ports: Predictive Modeling of Sulfur Dioxide Shipping Emissions in Maritime Facilities Using Machine Learning. Sustainability 2023, 15, 12171. [Google Scholar] [CrossRef]
  46. Chen, T.; Deng, S.L.; Gao, Y.; Qu, L.; Li, M.C.; Chen, D. Characterization of air pollution in urban areas of Yangtze River Delta, China. Chin. Geogr. Sci. 2017, 27, 836–846. [Google Scholar] [CrossRef]
  47. Wei, X.; Zhan, H.G.; Ni, P.T.; Cai, S.Q. A model study of the effects of river discharges and winds on hypoxia in summer in the Pearl River Estuary. Mar. Pollut. Bull. 2016, 113, 414–427. [Google Scholar] [CrossRef]
  48. de Foy, B.; Heo, J.; Kang, J.Y.; Kim, H.; Schauer, J.J. Source attribution of air pollution using a generalized additive model and particle trajectory clusters. Sci. Total Environ. 2021, 780, 146458. [Google Scholar] [CrossRef]
  49. Owusu-Mfum, S.; Hudson, M.D.; Osborne, P.E.; Roberts, T.J.; Zapata-Restrepo, L.M.; Williams, I.D. Atmospheric Pollution in Port Cities. Atmosphere 2023, 14, 1135. [Google Scholar] [CrossRef]
Figure 1. Illustration of port area, near-port area, and urban area locations.
Jmse 12 00288 g001
Figure 2. Comparison of six pollutant concentrations in the port area, near-port area, and urban area: (a) NO2, (b) NO, (c) PM10, (d) PM2.5, (e) CO, and (f) SO2.
Jmse 12 00288 g002
Figure 3. Contribution rates of CO and NO across different time scales. (a) NO daily contribution, (b) NO hourly contribution, (c) CO daily contribution, and (d) CO hourly contribution.
Jmse 12 00288 g003
Figure 4. Change in NO with operation density under four typical scenarios.
Jmse 12 00288 g004
Figure 5. Variation in NO and CO with temperature and humidity. (a) NO variation, and (b) CO variation.
Jmse 12 00288 g005
Figure 6. Variation in NO and CO with wind speed and direction. (a) NO variation, and (b) CO variation.
Jmse 12 00288 g006
Table 1. Regression results of random forest model.
PollutantTime SpanR-Square
NOMonth0.64
Day0.77
COMonth0.81
Day0.79
Table 2. Eighteen designed weather condition scenarios.
ScenariosFactors
TemperatureAir PressureHumidityWind SpeedWind Direction
1HighHighHighHighSE
2HighMediumMediumMediumS
3HighLowLowLowN
4MediumHighHighMediumS
5MediumMediumMediumLowN
6MediumLowLowHighSE
7LowHighMediumHighN
8LowMediumLowMediumSE
9LowLowHighLowS
10HighHighLowLowS
11HighMediumHighHighN
12HighLowMediumMediumSE
13MediumHighMediumLowSE
14MediumMediumLowHighS
15MediumLowHighMediumN
16LowHighLowMediumN
17LowMediumHighLowSE
18LowLowMediumHighS
Disclaimer/Publisher’s Note: The statements, opinions and data contained in all publications are solely those of the individual author(s) and contributor(s) and not of MDPI and/or the editor(s). MDPI and/or the editor(s) disclaim responsibility for any injury to people or property resulting from any ideas, methods, instructions or products referred to in the content.

