Article

Essential and Non-Essential Elemental Composition and Health Risks in Pacific Sardine in the Northwest Pacific Ocean

1
College of Marine Living Resource Sciences and Management, Shanghai Ocean University, Shanghai 201306, China
2
The Key Laboratory of Sustainable Exploitation of Oceanic Fisheries Resources, Ministry of Education, Shanghai 201306, China
3
National Engineering Research Center for Oceanic Fisheries, Shanghai 201306, China
4
Key Laboratory of Sustainable Utilization of Oceanic Fisheries, Ministry of Agriculture and Rural Affairs, Shanghai 201306, China
5
College of Marine Ecology and Environment, Shanghai Ocean University, Shanghai 201306, China
6
College of Foreign Languages, Shanghai Ocean University, Shanghai 201306, China
*
Authors to whom correspondence should be addressed.
J. Mar. Sci. Eng. 2024, 12(3), 368; https://doi.org/10.3390/jmse12030368
Submission received: 17 January 2024 / Revised: 15 February 2024 / Accepted: 19 February 2024 / Published: 21 February 2024
(This article belongs to the Section Marine Biology)

Abstract

:
Pacific sardine (Sardinops sagax) in the northwest Pacific Ocean (NPO) not only preserve the equilibrium of the NPO food chain, but also serve as a source of nutrition for humans. In order to evaluate the levels of various elements in S. sagax, we collected specimens from NWP waters and ascertained the quantities of four macronutrients, nine essential trace elements, and twelve non-essential trace elements. The factors (fatness, sex, sexual maturity, body length, body weight, and age) influencing the concentration were investigated, and the correlations of trace elements were examined. Additionally, the Estimated Daily Intake (EDI) approach and the Target Hazard Quotient (THQ) methodology were used to assess contamination levels and associated consumption risks. The results revealed that the macronutrient content (54–10,500 mg kg−1) was higher than the necessary trace elements (0–488 mg kg−1) and the non-essential trace elements (0–448 mg kg−1), and most of the elements showed positive correlation with each other. Almost all of the element concentrations were below the maximum permitted levels (MPLs) recommended by the FAO/WHO, except for As and Cd. The factors, including fatness, sexual maturity, body length, body weight, and age, showed a negative correlation with most of the trace elements. The outcomes of the stepwise regression analysis showed that sex and stage of sexual maturation were the principal biological factors influencing elemental content. The risk assessment and standard dietary intake levels indicated that the potential health issues associated with the consumption of S. sagax were negligible.

1. Introduction

As a significant component of biodiversity, fish perform a crucial role in aquatic ecosystems. Fish are sustained by macronutrients and trace elements. Macronutrients, typically including Ca, Mg, K, P, S, Cl, and Na [1], are fundamental for various biological functions like skeletal formation, homeostasis, metabolic regulation, and the promotion of growth and development of marine species [2]. An imbalance in the levels of macronutrients and essential trace elements may lead to bad effects [3]. For example, Cu binds to certain proteins in organisms to produce enzymes, but excessive intake can lead to cellular abnormalities such as impaired osmotic pressure/ion regulation and oxidative stress, and Cu deficiency can also cause metabolic disorders in the body [4,5]. Similarly, several non-essential elements could seriously endanger marine lives, even at low quantities [6,7,8]. The concentrations of various elements have been dramatically increased by human activities, and the pollution of the marine environment and fishery products is a growing global issue.
Marine pelagic fish are pivotal in the marine ecosystem, concentrating essential nutrients from the environment and transferring them through the food chain, ultimately to the trophic levels [9]. Bodin et al. [10] identified a direct correlation between Hg concentration and trophic position of the species, suggesting biomagnification of Hg within the marine pelagic food web. The content of trace elements was related to the fish species and even the area surveyed. Significant differences were observed in levels of trace elements in four marine pelagic fish from the northwest coast of Africa, with anchovy muscle having the highest Mn, Cu, Cr, Ni, and Pb content [11]. However, concentrations of Na, K, Ca, and Mg in the muscle and liver tissues were higher in pelagic fishes from the eastern Mediterranean Sea [12]. Many marine species have already been affected by climate change, as well as increased environmental pollution. Levels of trace elements in golden-banded sardines from India’s southeastern coast showed that the concentration of As in the muscle, liver, and bone (at a concentration of 2.21 ww mg kg−1) exceeded the safety thresholds set by the Food and Agriculture Organisation of the United Nations (FAO) and the World Health Organisation (WHO) [13]. Similarly, levels of Cd (1.2 ww mg kg−1) in the muscle tissue of golden sardines from the Mediterranean Sea surpassed FAO and WHO standards [14]. Levels of trace elements concentrate along the food chain, jeopardizing ecosystems and even human safety.
Pacific sardine (Sardinops sagax) are a prevalent species distributed in the northwest Pacific Ocean (NPO), inhabiting coastal regions extending from China, Chinese Taipei, Japan, to Russia [15]. S. sagax is an important fishery in the NPO and is economically and ecologically important in the region [16]. S. sagax is a high-value fish species, with a diminutive size but a considerable nutritional level [15]. The Pacific sardine was once noted for its large populations, but a noticeable decline has occurred over the past decade [17]. Therefore, it is necessary to analyze the health of this species. In our study, 270 S. sagax were collected from the NPO for analysis. This study focused on quantifying four macronutrients (Na, Mg, K, Ca), nine essential trace elements (B, Cr, Mn, Fe, Co, Cu, Zn, Se, Mo), and 12 non-essential trace elements (Al, V, Ti, As, Ni, Cd, Sb, Pb, Sn, Ba, Tl, Sr). Correlation and stepwise regression models were employed to elucidate the interrelationships between these elements and influencing factors. Moreover, this study conducted an assessment of nutritional intake and its associated dietary risks to human health.

2. Materials and Methods

2.1. Sample Collection

A total of 270 specimens were collected in June and July 2022 through the use of a pelagic trawl employed in the NPO (38°11′00″ N–43°36′92″ N, 152°40′53″ E–160°00′00″ E). Each specimen was meticulously cataloged and immediately placed in transparent polyethylene bags for preservation. The samples were stored at a temperature of −20 °C until they were processed and examined.

2.2. Sample Pre-Treatment and Instrumental Measurement

Samples were cleaned with ultrapure water; after having thawed, the body length, fork length, body weight, sex, and sexual maturity of the samples were measured. Back-muscle tissues were extracted and pulverized using a high-speed pulverizer then transferred to a centrifuge tube. The muscle samples, weighing between 0.2 and 0.5 g, with an accuracy of 0.001 g, were placed into a polytetrafluoroethylene ablation tube. Then, 8 mL of an HNO3 solution (5 mg L−1, Sinopharm Chemical Reagent Co., Ltd., Shanghai, China) was added. The tube was tightly sealed and inserted into an automatic microwave ablator (ETHOSUP, Leipertec, Beijing, China). The digesting technique was executed in accordance with the standard operating procedure specified by the Ministry of Agriculture of the People’s Republic of China in 2016 [18]. Table S1 recorded the specific conditions of digestion. After an hour cooling, the tube was taken out and the cap was gradually opened to release the gas. Then it was placed it in a microwave ablator and acid expeller (VB24 Plus Acid Expeller, Leibertek, Beijing, China) and heated to 170 °C until the solution was completely formed. Next, the solution was diluted to 50 mL with ultrapure water, and after it was thoroughly mixed it was set aside for a control experiment (to verify the validity of the experiments). The elemental analyses were conducted using an inductively-coupled plasma mass spectrometer (ICP-MS, Agilent 7900a, Agilent Technologies, Inc., Santa Clara, CA, USA), with the operating conditions specified in Table S2 [18].

2.3. Quality Control and Assurance

The analytical parameters for each element, encompassing the limit of detection (LOD) and limit of quantification (LOQ), were delineated (Table S3). Prior to analysis, a calibration curve was established for each element to validate the accuracy of the analytical method, and analysis was conducted only when the linear fit of the standard curve achieved a minimum correlation coefficient (r) of 99.9% (Table S3). To ensure methodological quality, elemental standards were utilized as part of the quality control process. The recovery rates for the elements were consistently within the range of 90–115%, demonstrating the reliability of the method. Blank samples were analyzed concurrently, confirming the absence of the measured constituents in the control samples. Furthermore, each sample was subjected to triplicate analyses to ascertain analytical precision. The relative standard deviation (RSD) of the triplicate measurements was maintained below 5%, ensuring the reproducibility and reliability of the experimental results.

2.4. Age and Fatness

2.4.1. Assessment of Biological Age

The age of S. sagax was determined using the Von Bertalanffy growth equation [19,20], and parameters used were from Yang et al. [21]:
L t = 283.5 × ( 1 e 0.27 × ( t + 0.48 ) )
where Lt is the fork length in mm; t is the theoretical age of the fish when the fork length is Lt.

2.4.2. Degree of Fish Fatness

The individual fatness degree of Sardinops sagax was calculated using the Fulton state index, as described by Dai et al. [22], with the following formula:
K = 100 × W / L 3
where K is the fatness factor, W is the body weight in g, and L is the fork length in cm.

2.5. Health Risk Evaluation

2.5.1. Estimated Daily Intake

Estimated Daily Intake (EDI) was employed to assess the extent of contamination by hazardous compounds in S. sagax, and the potential health risks associated with their consumption. Due to the lack of specific data on average daily intake, the mean daily consumption rate of pelagic fish was employed as a proxy measure for this study. The daily intake levels of essential elements such as Mn, Fe, Zn, Co, Cu, Se, Cr, Mo, along with non-essential elements including V, Ni, As, Cd, Sr, Sn, Sb, Ba, and Pb, were determined by the daily consumption rate of these fish. The calculation was performed using the following formula:
E D I = F I R × C i B W
where EDI is the current daily consumption of the element in humans (mg); Ci represents the mean of the measured element i in fish (mg kg−1); the concentration of toxic inorganic arsenic is determined as 3% of the total arsenic concentration, because the form of arsenic in fish muscle is primarily non-toxic organic arsenic, causing minimal impacts on human health [23]; and FIR refers to the average rate at which S. sagax is consumed each day (g day−1). According to FAO survey statistics, the annual average intake of pelagic fish per person worldwide is 3.07 kg. Per capita daily consumption of S. sagax in the NPO will be replaced by per capita daily consumption of pelagic fish worldwide, resulting in an FIR of 8.41 g day−1 [24]. BW represents the typical weight of an adult, which is 70 kg [25]. The United States Environmental Protection Agency (U.S. EPA) did not provide RfD values for macronutrients. Consequently, essential trace elements, including Mn, Fe, Zn, Co, Cu, Se, Cr, Mo, and non-essential trace elements, including V, Ni, As, Cd, Sr, Sn, Sb, Ba, and Pb, were quantified within their assessment framework [26].

2.5.2. Target Hazard Quotient

The target hazard quotient (THQ) is a risk assessment tool that compares the level of contamination of a specific trace element with a standard reference dosage. It is mostly used to evaluate the non-carcinogenic risks associated with contamination [27,28]. When the THQ value is less than 1, it indicates that there is no apparent danger of carcinogenic health problems for the exposed population. However, when the THQ value is more than or equal to 1, it signifies a health risk in the exposed population. The total target hazard quotient (TTHQ) is a comprehensive measure used to evaluate the mixed stacking effect of heavy metals on humans based on guidelines provided by the U.S. EPA in 2001 [29]. Similarly, a TTHQ value less than 1 implies that heavy metals pose little potential risk to humans. The calculating formula is as stated below:
T H Q = E F × E D × F I R × C R fD × B W × A T × 10 3
T T H Q = T H Q
where EF denotes the frequency of exposure (365 days); ED denotes the average duration of exposure (70 years); FIR denotes the rate of food intake (g day−1); BW denotes the average body weight of 70 kg; C denotes the concentration of the element (mg kg−1); the concentration of As is based on a total arsenic concentration of 3%, as mentioned above. The variable AT represents the average duration of exposure to non-carcinogenic substances, calculated by multiplying the exposure duration (ED) by 365 days. The variable RfD represents the reference dose in mg kg−1 day−1. The reference doses (RfD) for the substances were as follows in mg kg−1 day−1: Mn = 1.4 × 10⁻¹, Fe = 7 × 10⁻¹, Zn = 3 × 10⁻¹, Co = 6 × 10⁻², Cu = 4 × 10⁻², Se = 5 × 10⁻³, Cr = 5 × 10⁻³, Mo = 5 × 10⁻³, V = 7 × 10⁻³, Ni = 2 × 10⁻², As = 3 × 10⁻⁴, Cd = 1 × 10⁻³, Sr = 6 × 10⁻¹, Sn = 6 × 10⁻¹, Sb = 4 × 10⁻⁴, Ba = 7 × 10⁻², Pb = 3.6 × 10⁻².

2.6. Data Processing

Data pre-processing was conducted via Excel 2019 (16.0.13127.20566). The correlation between elements and biological factors was conducted using the “Hmisc” package (version 4.0.3) in R. The plotting was conducted using “ggplot2” and “ggpubr” packages. Additionally, the stepwise regression analysis of influencing factors was performed using the IBM-SPSS statistics (R27.0.1.0). Origin 2019b was used to conduct Pearson’s correlation analysis between elements and create histograms in IBM-SPSS statistics (R27.0.1.0).

3. Results and Discussion

3.1. Characteristics of Elements in S. sagax

The overall concentration of macronutrients (54–10,500 mg kg−1, with an average of 1732 ± 1094 mg kg−1) was significantly higher compared to those of necessary trace elements (ND-488 mg kg−1, with an average of 11.14 ± 10.35 mg kg−1) and non-essential trace elements (ND-448 mg kg−1, with an average of 2.29 ± 4.86 mg kg−1) (Table 1). Additionally, the concentration of essential trace elements exceeded that of non-essential trace elements, as essential trace elements are involved in vital physiological processes such as maintaining internal stability, facilitating normal substance metabolism, and promoting overall growth and development of the organism. Rodrigues et al. [30] examined the composition of essential elements in 96 species of marine fish from the northeast Atlantic; they found that seafoods had high levels of macronutrients (K, P, and Na) and trace elements (Fe, Zn, and Cu). In this study, Na, Mg, K, and Ca were detected 100% of the time; the concentrations followed the order of K > Ca > Na > Mg. Among them, K had the highest average content at 3110 mg kg−1, with Mg having the lowest average content at 361 mg kg−1. The concentrations of Ca and Na ranged from 155 to 10,300 mg kg−1 (with a mean of 2220 mg kg−1) and from 470 to 5890 mg kg−1 (with a mean of 1240 mg kg−1), respectively. Queirós et al. [31] investigated the macronutrient levels in Antarctic dogfish (Dissostichus mawsoni) and found that the concentration of K (12,360 ± 3644 dw mg kg−1) was higher than that of Na (7612 ± 2817 dw mg kg−1), Ca (1237 ± 2648 dw mg kg−1), and Mg (1139 ± 408 dw mg kg−1). It is clear that K is the most abundant macronutrient, while Mg is the least abundant. Multiple studies have demonstrated that marine fish exhibit elevated levels of K, likely attributable to the crucial role of K in various physiological processes [30,31].
The average concentrations of essential trace elements in S. sagax are listed in Table 1. The element with the highest concentration was Fe at 48 ± 53 mg kg, followed by Zn at 25.6 ± 14.6 mg kg−1. Cu had an average concentration of 2.00 ± 1.43 mg kg−1, and concentration of Mn was 1.0 ± 1.0 mg kg−1. The concentration of Se (0.62 ± 0.33 ww mg kg−1) was greater than that of B (0.4 ± 1.0 ww mg kg−1). The concentration of Cr (0.35 ± 1.10 ww mg kg−1) was higher than that of Mo (0.08 ± 1.10 ww mg kg−1), which in turn was higher than that of B (0.4 ± 1.0 ww mg kg−1). The presence of non-essential trace elements in S. sagax was identified by the concentration of Al (20.4 ± 48.7 ww mg kg−1). The concentration of Sr (3.5 ± 5.6 ww mg kg−1) was higher than that of As (2.22 ± 1.03 ww mg kg−1), Ni (0.6 ± 1.4 ww mg kg−1), Ba (0.19 ± 0.40 ww mg kg−1), Cd (0.172 ± 0.205 ww mg kg−1), V (0.165 ± 0.346 ww mg kg−1), Ti (0.11 ± 0.13 ww mg kg−1), Pb (0.09 ± 0.39 ww mg kg−1), Sb (0.02 ± 0.03 ww mg kg−1), Sn (0.01 ± 0.03 ww mg kg−1), and Tl (0.0119 ± 0.0189 ww mg kg−1). The lowest concentration was found in Tl, with an average content of 0.0119 mg kg−1 and a range of 0–0.266 mg kg−1.
Jiang et al. [32] discovered that Al was the predominant non-essential element in carp, grass carp, and rainbow trout, while Co, Sn, Cd, Sb, Tl, and Pb were nearly undetectable, which is consistent with the results of the current study. Previous studies have shown that little spinefoot (Siganus spinus) possessed notable quantities of As. Additionally, it had the capability to convert inorganic arsenic into arsenobetaine, a process resulting in the accumulation of this compound [33]. Compared to the levels of trace elements in the genus sardinella from the southeast coast of India, the Atlantic Ocean, the Mediterranean coast, and the waters around Australia, the results showed that the levels of each element in the golden-banded sardine (Sardinella gibbosa) from the Indian Ocean were similar to S. sagax. However, these concentrations were lower than those found in sardinella from the waters around Australia. This variation might be due to the higher levels of pollution found offshore in the latter case [10,13,14,34].

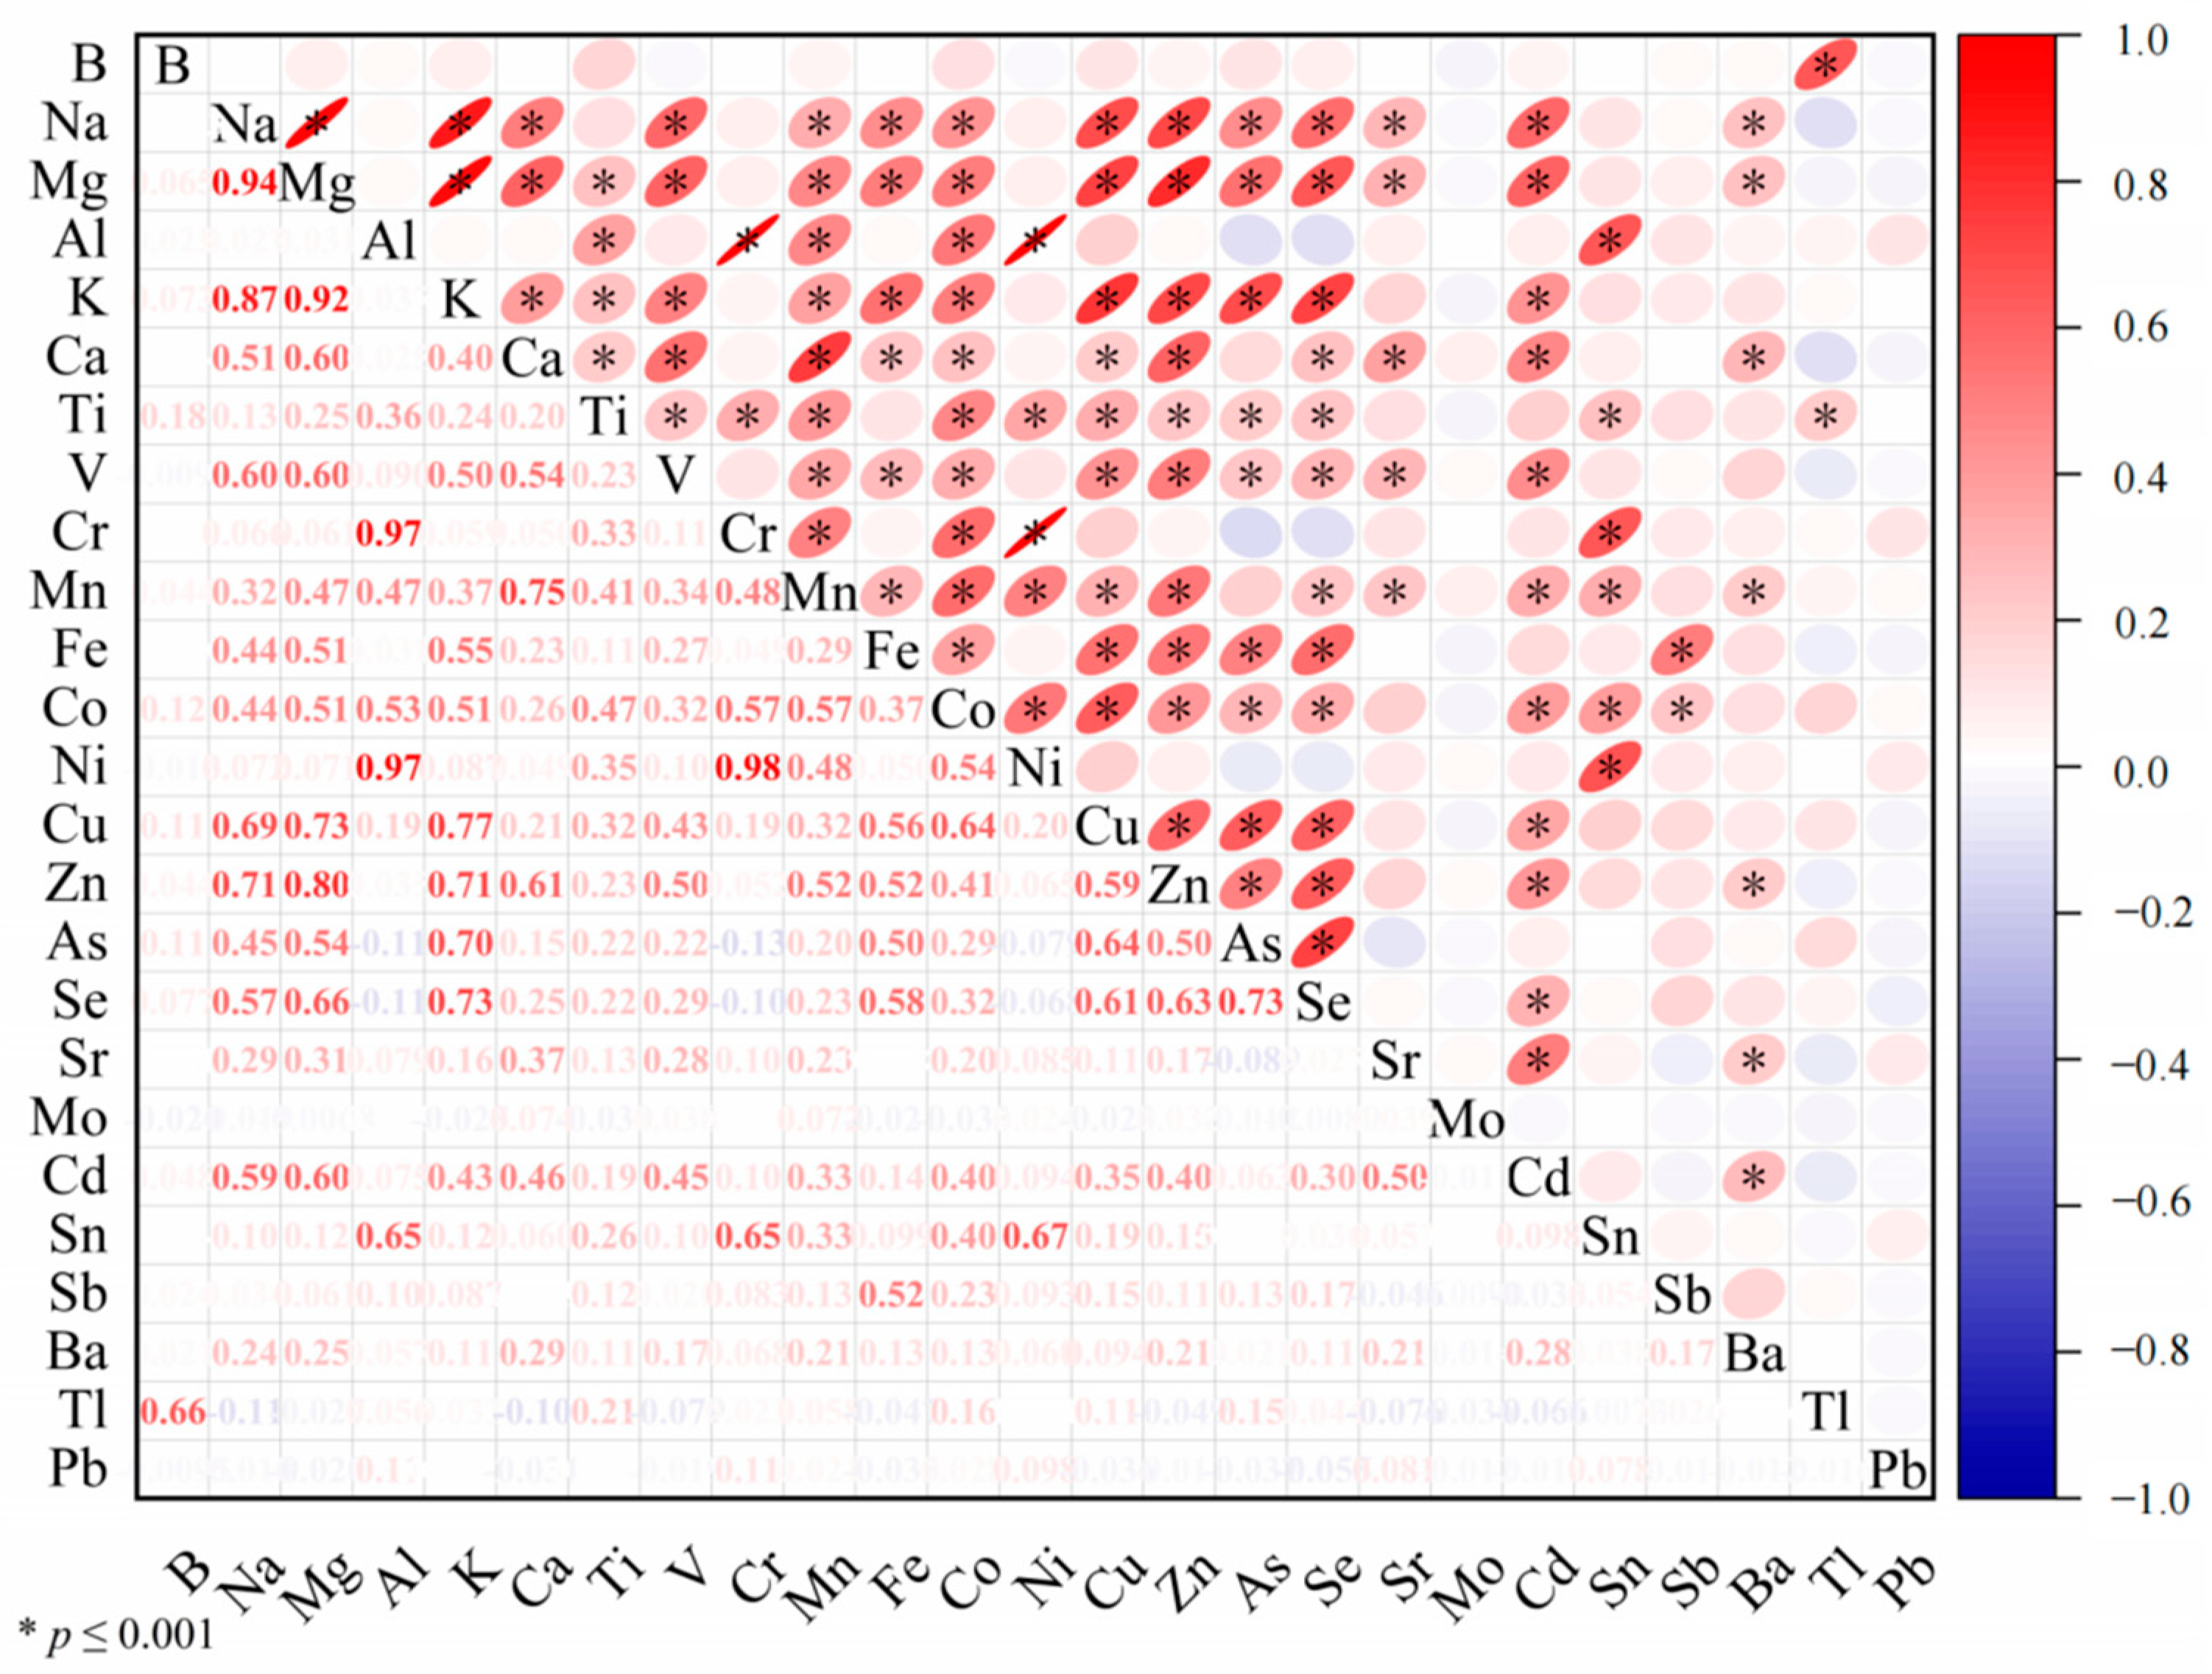
3.2. Correlation between Elements

The interactions among elements were mostly marked by synergistic and antagonistic effects [35]. A Pearson correlation analysis revealed substantial positive correlations (p ≤ 0.001) across the majority of the elements, suggesting the possibility of synergistic effects or a common source in S. sagax (Figure 1). The macronutrients (Na, Mg, K, and Ca) exhibited strong positive correlations with each other. The strongest correlations were observed between Mg and Na (R2 = 0.94, p ≤ 0.001), and Mg and K (R2 = 0.92, p ≤ 0.001). These findings suggest potential synergistic roles of Na, Mg, K, and Ca in the organism’s vital activities. Additionally, the macronutrients and essential trace elements (Mn, Fe, Co, Cu, Zn, and Se) displayed positive correlations. The strongest correlation was observed between Mg and Zn (R2 = 0.80, p ≤ 0.001), followed by K and Cu (R2 = 0.77, p ≤ 0.001), and K and Se (R2 = 0.73, p ≤ 0.001). There was a positive relationship between the macronutrients and the non-essential trace elements (V, As, and Cd). The highest association was between K and As (R2 = 0.70, p ≤ 0.001), followed by Na and Mg with V, and Mg with Cd (all with an R2 of 0.60, p ≤ 0.001). There was limited literature on the relationship between macronutrients and essential trace elements, and the positive correlation between them may be attributed to a shared source of the elements.
Significant positive correlations were observed between the essential trace elements Co and Cu, Cr and Mn, Cu and Fe and Se, Zn and Mn, Fe and Cu, and Se and Fe and Zn, with a correlation coefficient up to 0.63 between Se and Zn (p ≤ 0.001). A study by Lee [36] highlighted the interconnected nature of various trace elements in the process of hematopoiesis, such as Cu, Fe, Co, and Mn. These elements collectively contribute in various ways to facilitate the production of blood cells, demonstrating a synergistic relationship in supporting hematopoietic functions. Hilton and Hodson [37] discovered a substantial correlation between Se in the liver and Cu in the diet of rainbow trout (Oncorhynchus mykiss), consistent with this study. Additionally, a rise of Fe levels in livers was observed when the concentration of Cu increased [38], indicating a synergistic interaction between Fe and Cu, which was also found in our study.
Significant positive relationships were observed between the essential trace element Cr and the non-essential trace elements Ni and Al, between Co and Ni, Sn and Al, B and Tl, Fe, Cu, Zn and As, Fe and Sb, Zn and V. The most significant correlations were observed between Cr and Ni (r = 0.98, p ≤ 0.001), followed by Cr and Al (r = 0.97, p ≤ 0.001). These findings suggest that Cr, Ni, and Al might have common origins or exhibit substantial synergistic effects. Zhu and Zhang [39] also found a positive correlation between the toxic effects of As and Cu toxicity in carp.
This study revealed significant positive relationships among the non-essential trace elements Ni, Sn, and Al, and the highest link was between Ni and Al (r = 0.97, p ≤ 0.001). Annasawmy et al. [3] discovered that the effects of As, Cd, Co, Cu, Fe, Mn, Ni, Pb, and Zn were all positively associated with one another. Se exhibited a strong affinity for Cr, interacting at the molecular level to form less toxic CrSe crystals, thereby indicating Se’s antagonistic effect on Cr [40]. This study found a correlation coefficient of −0.10 (p ≤ 0.001) between Se and Cr, indicating a negative link between the two variables. Se not only counteracted the toxicity of Cr, but also had an inhibitory effect on other hazardous elements such as Pb (R2 = −0.05, p ≤ 0.001). The mechanism of antagonism was evident in the variations in the capacity of protein reactive groups to coordinate various components, resulting in substitution reactions [41]. There was a strong correlation between the concentration of Zn and elements such as Cr and Cd in organisms. Zn had an opposing effect on the toxicity of these elements by causing the expression of metallothionein [42]. Nevertheless, the current research revealed a rather feeble correlation between Zn and levels of Cd, Cr, and Pb, indicating a potential scarcity of metallothionein in the muscle of S. sagax.

3.3. Influence of Biosignatures on Elemental Fate

3.3.1. Biological Properties of S. sagax

Biological characteristics were classified based on several factors including sexual maturity, fatness, body length, body weight, age, and sex (Figure 2). Sexual maturity of the 270 S. sagax was determined by assessing gonadal maturity, categorized into Stage I to Stage IV. Stage I and Stage III exhibited the highest percentages, each accounting for 30% of the total. Stage II accounted for 27%, while Stage IV showed the lowest percentage at 13%. Fatness plays a significant role in evaluating growth rates, weight gain in fish, survival indicators, and habitat conditions [22]. The range of K values was 0.41–3.19, segmented into three size ranges of 0–1, 1–2, and 2–3+. The majority of S. sagax fell within the 1–2 range, constituting 85% of the total. The 0–1 range accounted for 14%, whereas only 1% fell within the 2–3+ range. In the NPO, Yang et al. [21] presented data on the fatness coefficient of 2664 S. sagax. Coefficient values ranged from 0.82 to 1.42, with an average value of 1.06. Comparisons indicated that the S. sagax in this study exhibited superior development and higher levels of fat accumulation. Age groups were categorized as 0–1, 1–2, and 2–3+. S. sagax reaches sexual maturity at the age of 2+. Gaughan et al. [13] noted that the majority (87%) of S. sagax in the study were juvenile fish, with only 13% reaching sexual maturity. These findings suggest that the sample largely comprised juvenile S. sagax. Body lengths exhibited a range of 112 to 220 mm, with an average measurement of 158.50 mm. They were categorized into four groups: 110–140 mm (27%), 140–170 mm (45%), 170–200 mm (26%), and 200–230 mm (2%). In terms of weight, the range spanned from 10 to 83 g, with an average weight of 350.79 g. These weights were further divided into four groups: 1–20 g (27%), 21–40 g (45%), 41–60 g (20%), and 61–80 g or more (8%). The S. sagax population was characterized as comprising 14% females and 86% males. Upon thorough analysis of the biological data of S. sagax, a notable observation was the prevalence of immature individuals in the study. This could be attributed to the high proportion of recently spawned or one-year-old sardines in the high seas, particularly during bait-seeking migrations. Consequently, there was a lower representation of sardines in stage III or higher of gonadal maturity and those aged 2 years or older. In addition, this study only sampled S. sagax of the NPO in 2022, which has certain limitations. In the future, it is necessary to collect samples of different years, different regions, and different sizes to determine the element content and obtain more accurate element levels.

3.3.2. Relationship between Biological Factors and Elements

The elements in marine pelagic fish were primarily influenced by biological parameters such as body size, age, sex, sexual maturity, and fatness. Association tests between biological parameters and elements revealed a positive association between As and all biological components (Figure 3). Multiple studies have shown that marine creatures exhibit elevated levels of As and have the ability to further increase the concentration of As in the marine environment. Additionally, these species could transform the harmful inorganic form of As into a non-toxic organic form, which accumulates in their bodies with the growth of S. sagax [23]. There was a negative correlation (p < 0.05) between sexual maturity, fatness, body length, body weight, and age, and the elements Na, Mg, Al, K, Ca, V, Cr, Mn, Fe, Co, Ni, Cu, Zn, Sr, Cd, Sn, and Ba. Honda et al. [43] discovered that the levels of Mn, Cu, and Cd in the muscle of the Antarctic borchgrevinki fish (Pagothenia borchgrevinki) declined as body weight increased. Several investigations have demonstrated a negative correlation between certain trace elements and body size [44]. For instance, concentrations of Zn and Cu drop as body size increases [45,46,47]. This study supports the idea that the significant role of macronutrients in the growth of S. sagax and the depletion of trace elements during its growth phase may explain the reported findings [48]. A stepwise regression model was employed to further identify the influential elements which had a substantial impact on their taxation. Table S4 illustrates that the fundamental determinants impacting elemental fugacity were sex and stage of sexual maturity. By combining the correlation and stepwise regression results, it was determined that the levels of macronutrients Na, Mg, K and Ca in S. sagax were primarily influenced by sex, sexual maturity, and body weight. The levels of essential trace elements Mn, Cu, and Zn were mainly influenced by sex and sexual maturity, while Fe and Se were influenced by sex, Co by sexual maturity, and Cr by body length. Additionally, the non-essential trace element Cd was primarily regulated by sexual maturity and body length. The regulation of V was determined by sexual maturity, body length, and age. Sr was influenced by fatness and body length, while Ni and Pb were determined by age. Sn was regulated by sexual maturity, Tl by body length, and As by body weight. According to Khezri et al. [49], the levels of trace elements in several fish species decrease as the fish grow in terms of body weight, body length, and age. Kojadinovic et al. [47] discovered that juvenile fish had a greater accumulation of trace elements, because the metabolically active juveniles had higher levels of trace elements compared to older fish. Consequently, there was a decline in trace element concentrations as the fish grew. The intake of trace elements in marine fish was directly related to their metabolic rate. Lozano-Bilbao et al. [6] discovered that trace element levels were higher in immature samples of sardine, mackerel, and blue scad (Pomatomus saltatrix) compared to mature samples. The majority of the components exhibited a decline in S. sagax as they aged and reached sexual maturity, which aligns with the findings documented by Lozano-Bilbao.

3.4. Health Risk Assessment for Consumption

The FAO and WHO have set MPLs for several components in fish intended for consumption [45]. The MPLs for the essential trace metals Cu, Mn, Zn, and Cr are 4.5, 1.0, 40, and 1.0 mg kg−1, respectively. The MPLs for the non-essential toxic elements As, Cd, Pb, and Ni are 1.0, 0.1, 0.5, and 0.8 mg kg−1, respectively. The FAO and WHO have not yet specified the requirements for the remaining items. According to the limit values for these elements, it was determined that the average concentrations of As and Cd in this study surpassed the limit values set by the FAO and WHO. Regarding As, our analysis took into account both organic and inorganic forms of this element. According to the EFSA Panel on Contaminants in the Food Chain (CONTAM) in 2009 [50], the form of As found in fish muscle was primarily non-toxic organic As, as indicated by Kruglyakova et al. [51]. This suggests that the overall concentration of As has a minimal effect on human health. According to a report, the proportion of dangerous inorganic As in fish was approximately 3% of the total As, which could be transformed into a less deadly form called arsenobetaine [23]. Following the conversion process, the concentration of harmful inorganic As in this study was around 0.067 mg kg−1 ww, much below the threshold of 1.0 mg kg−1 ww.
The daily consumption of essential elements Mn, Fe, Zn, Co, Cu, Se, Cr, Mo, and non-essential elements V, Ni, As, Cd, Sr, Sn, Sb, Ba, and Pb, derived from the concentrations of these elements and fish intake (8.41 mg day−1), were found to be lower than the guideline values set by the U.S. EPA for these elements (Table 2) [26]. Fe had the highest daily intake, providing humans with an approximate nutrient intake of 5.743 × 10⁻³ mg kg−1 d−1 per day, followed by Zn, with a daily intake as high as 3.076 × 10⁻³ mg kg−1 d−1. This suggests that S. sagax has exceptionally high nutritional values for Fe and Zn. Furthermore, consuming S. sagax at the current global per capita consumption level does not pose any risks to human health. The THQ was employed to evaluate the possible danger to human health resulting from the consumption of eight necessary and nine unnecessary micronutrients in fish. The THQ values for 17 elements were determined to be below 1, as depicted in Figure 4 and Table 2. The THQ values for all elements were found to be low, with As having the highest THQ (26.672 × 10⁻³), followed by Cd with a THQ of 20.665 × 10⁻³. This indicates that the intake of these elements by consumers when consuming S. sagax is of minimal health concern and shows no occurrence of chronic systemic effects at normal exposure levels. Similarly, the TTHQ value of 0.11 was also below 1, indicating that the overall risk associated with consumer intake of S. sagax was low. Ersoy and Çelik [11] discovered that the estimated weekly and daily intake of Pb and Cd from consuming fish products was significantly below the Established Weekly Intake (EWI) and EDI set by the FAO/WHO. These findings were consistent with the results of the current study. This study found that S. sagax was enriched in Se, which indicates that small pelagic fish are a valuable source of Se for humans [52].

4. Conclusions

This study explored the levels of 25 elements and their enrichment characteristics, factors of distribution, and the correlation between the elements and S. sagax. The results indicate that: (1) The concentrations of the 25 elements were relatively low. (2) Sex, sexual maturity, and body weight could affect macronutrient levels. (3) Essential trace elements were regulated by sex, body length, and sexual maturity, while non-essential trace elements were regulated by sexual maturity, body weight, body length, and age. (4) Consuming S. sagax of the NPO will not cause long-term human health risks. In summary, this study fills the gap pertaining to element concentrations in an economic fish species in the NPO and reveals the good quality of the marine environment in the NPO. Our results could make a certain contribution to the sustainable development of pelagic fisheries.

Supplementary Materials

The following supporting information can be downloaded at https://www.mdpi.com/article/10.3390/jmse12030368/s1: Table S1, sample microwave digestion conditions; Table S2, operating conditions of inductively coupled plasma mass spectrometer; Table S3, detection limit and quantification limit of each element and standard curve; Table S4, stepwise regression results for each element.

Author Contributions

Writing—Original Draft, T.L.; methodology, T.L.; validation, T.L. and J.X.; formal analysis, T.L.; resources, B.L.; conceptualization, J.X.; writing—review and editing, L.Z.; visualization, D.L. and T.L.; supervision, L.Z. and B.L.; funding acquisition, B.L. and J.X. All authors have read and agreed to the published version of the manuscript.

Funding

This work was sponsored by the Nation Key R&D Program of China (2023YFD2401302) Follow-up program for Professor of Special Appointment (Eastern Scholar) at Shanghai Institutions of Higher Learning under Contract (GZ2022011); Monitoring and Assessment of Global Fishery Resources (Comprehensive scientific survey of fisheries resources at the high seas).

Institutional Review Board Statement

Not applicable.

Informed Consent Statement

Not applicable.

Data Availability Statement

Data are contained within the article.

Acknowledgments

We would like to thank the teachers and students from Shanghai Ocean University for sample collection and data analysis.

Conflicts of Interest

The authors declare no conflicts of interest.

References

  1. Rowe, C.E.; Figueira, W.; Raubenheimer, D.; Solon-Biet, S.M.; Machovsky-Capuska, G.E. Effects of temperature on macronutrient selection, metabolic and swimming performance of the Indo-Pacific Damselfish (Abudefduf vaigiensis). Mar. Biol. 2018, 165, 178. [Google Scholar] [CrossRef]
  2. Nieder, R.; Benbi, D.K.; Reichl, F.X.; Nieder, R.; Benbi, D.K.; Reichl, F.X. Macro-and secondary elements and their role in human health. In Soil Components and Human Health; Springer: Dordrecht, The Netherlands, 2018; pp. 257–315. Available online: https://link.springer.com/chapter/10.1007/978-94-024-1222-2_6 (accessed on 9 February 2024).
  3. Annasawmy, P.; Bustamante, P.; Point, D.; Churlaud, C.; Romanov, E.V.; Bodin, N. Trace elements and δ15N values in micronekton of the south-western Indian Ocean. Mar. Pollut. Bull. 2022, 184, 114053. [Google Scholar] [CrossRef]
  4. Park, J.; Kim, S.; Yoo, J.; Lee, J.S.; Park, J.W.; Jung, J. Effect of salinity on acute copper and zinc toxicity to Tigriopus japonicus: The difference between metal ions and nanoparticles. Mar. Pollut. Bull. 2014, 85, 526–531. [Google Scholar] [CrossRef]
  5. Chen, L.; Min, J.; Wang, F. Copper homeostasis and cuproptosis in health and disease. Signal Transduct. Target. Ther. 2022, 7, 378. [Google Scholar] [CrossRef]
  6. Lozano-Bilbao, E.; Jurado-Ruzafa, A.; Lozano, G.; Jiménez, S.; Hardisson, A.; Rubio, C.; Weller, D.; Paz, S.; Gutiérrez, A. Development stage and season influence in the metal content of small pelagic fish in the North-West Africa. Chemosphere 2020, 261, 127692. [Google Scholar] [CrossRef]
  7. Jabeen, G.; Manzoor, F.; Javid, A.; Azmat, H.; Arshad, M.; Fatima, S. Evaluation of fish health status and histopathology in gills and liver due to metal contaminated sediments exposure. Bull. Environ. Contam. Toxicol. 2018, 100, 492–501. [Google Scholar] [CrossRef]
  8. Bosch, A.C.; O’Neill, B.; Sigge, G.O.; Kerwath, S.E.; Hoffman, L.C. Heavy metals in marine fish meat and consumer health: A review. J. Sci. Food Agric. 2016, 96, 32–48. [Google Scholar] [CrossRef] [PubMed]
  9. Nissar, S.; Bakhtiyar, Y.; Arafat, M.Y.; Andrabi, S.; Bhat, A.A.; Yousuf, T. A review of the ecosystem services provided by the marine forage fish. Hydrobiologia 2023, 850, 2871–2902. [Google Scholar] [CrossRef]
  10. Bodin, N.; Lesperance, D.; Albert, R.; Hollanda, S.; Michaud, P.; Degroote, M.; Churlaud, C.; Bustamante, P. Trace elements in oceanic pelagic communities in the western Indian Ocean. Chemosphere 2017, 174, 354–362. [Google Scholar] [CrossRef] [PubMed]
  11. Afandi, I.; Talba, S.; Benhra, A.; Benbrahim, S.; Chfiri, R.; Labonne, M.; Masski, H.; Laë, R.; Morais, L.T.D.; Bekkali, M.; et al. Trace metal distribution in pelagic fish species from the north-west African coast (Morocco). Int. Aquat. Res. 2018, 10, 191–205. [Google Scholar] [CrossRef]
  12. Ersoy, B.; Çelik, M. Essential elements and contaminants in tissues of commercial pelagic fish from the Eastern Mediterranean Sea. J. Sci. Food Agric. 2009, 89, 1615–1621. [Google Scholar] [CrossRef]
  13. Shalini, R.; Jeyasekaran, G.; Shakila, R.J.; Arisekar, U. Trace element concentrations in the organs of fish along the southeast coast of India. Mar. Pollut. Bull. 2021, 162, 111817. [Google Scholar] [CrossRef]
  14. Abdallah, M.A.M. Trace element levels in some commercially valuable fish species from coastal waters of Mediterranean Sea, Egypt. J. Mar. Syst. 2008, 73, 114–122. [Google Scholar] [CrossRef]
  15. Gaughan, D.; Di, D.F.; Hata, H. Sardinops sagax (errata version published in 2019). In The IUCN Red List of Threatened Species; International Union for Conservation of Nature and Natural Resources: Gland, Switzerland, 2018. [Google Scholar] [CrossRef]
  16. Shi, Y.; Kang, B.; Fan, W.; Xu, L.; Zhang, S.; Cui, X.; Dai, Y. Spatio-Temporal Variations in the Potential Habitat Distribution of Pacific Sardine (Sardinops sagax) in the Northwest Pacific Ocean. Fishes 2023, 8, 86. [Google Scholar] [CrossRef]
  17. Kamimura, Y.; Tadokoro, K.; Furuichi, S.; Yukami, R. Stronger density-dependent growth of Japanese sardine with lower food availability: Comparison of growth and zooplankton biomass between a historical and current stock-increase period in the western North Pacific. Fish. Res. 2022, 255, 106461. [Google Scholar] [CrossRef]
  18. GB5009.268-2016; Standard Nazionale per la Determinazione della Sicurezza Alimentare dei Multielementi Negli Alimenti. Ministero dell’Agricoltura della Repubblica Popolare Cinese, Casa Editrice Agricola: Beijing, China, 2017.
  19. Zhan, B.Y. Fisheries Resource Assessment. Fish. Resour. Assess. 1995. [Google Scholar]
  20. Pauly, D. Gill Size and Temperature as Governing Factors in Fish Growth: A Generalization of Von Bertalanffy’s Growth Formula. 1979. Available online: https://api.semanticscholar.org/CorpusID:97233525 (accessed on 9 February 2024).
  21. Yang, C.; Zhao, G.Q.; Han, H.B.; Zhang, H.; Shang, C.; Shu, B.; Liu, S.Y.; Jiang, P.W.; Xiang, D.L.; Luo, M.B. Analysis of biological characteristics of Sardinops sagax in the high seas of the northwest Pacific Ocean. Mar. Fish. 2023, 1–18. [Google Scholar] [CrossRef]
  22. Xie, R.T.; Amenyogbe, E.; Chen, G.; Huang, J.S. Effects of feed fat level on growth performance, body composition and serum biochemical indices of hybrid grouper (Epinephelus fuscoguttatus× Epinephelus polyphekadion). Aquaculture 2021, 530, 735813. [Google Scholar] [CrossRef]
  23. Muñoz, O.; Devesa, V.; Suñer, M.A.; Velez, D.; Montoro, R.; Uriera, I.; Macho, M.L.; Jalon, M. Total and inorganic arsenic in fresh and processed fish products. J. Agric. Food Chem. 2000, 48, 4369–4376. [Google Scholar] [CrossRef]
  24. FAO. Fishery and Aquaculture Statistics: Global Capture Production 1950–2021 (FishStatJ); Food and Agriculture Organization: Québec City, QC, Canada, 2023. [Google Scholar]
  25. Traina, A.; Bono, G.; Bonsignore, M.; Falco, F.; Giuga, M.; Quinci, E.M.; Vitale, S.; Sprovieri, M. Heavy metals concentrations in some commercially key species from Sicilian coasts (Mediterranean Sea): Potential human health risk estimation. Ecotoxicol. Environ. Saf. 2019, 168, 466–478. [Google Scholar] [CrossRef]
  26. US EPA (United States Environmental Protection Agency). Risk Assessment Guidance for Superfund, Volume I: Human Health Evaluation Manual (Part A); Interim Final; EPA: Washington, DC, USA, 1989. [Google Scholar]
  27. Copat, C.; Arena, G.; Fiore, M.; Ledda, C.; Fallico, R.; Sciacca, S.; Ferrante, M. Heavy metals concentrations in fish and shellfish from eastern Mediterranean Sea: Consumption advisories. Food Chem. Toxicol. 2013, 53, 33–37. [Google Scholar] [CrossRef]
  28. Saha, N.; Zaman, M.R. Evaluation of possible health risks of heavy metals by consumption of foodstuffs available in the central market of Rajshahi City, Bangladesh. Environ. Monit. Assess. 2013, 185, 3867–3878. [Google Scholar] [CrossRef] [PubMed]
  29. US EPA (United States Environmental Protection Agency). Risk Assessment Guidance for Superfund, Volume I: Human Health Evaluation Manual (Part E, Supplemental Guidance for Dermal Risk Assessment); EPA/540/R/99/005; USA Office of Emerage and Remedial Response: Washington, DC, USA, 2001. [Google Scholar]
  30. Rodrigues, M.J.; Franco, F.; Martinho, F.; Carvalho, L.; Pereira, M.E.; Coelho, J.P.; Pardal, M.A. Essential mineral content variations in commercial marine species induced by ecological and taxonomical attributes. J. Food Compos. Anal. 2021, 103, 104118. [Google Scholar] [CrossRef]
  31. Queirós, J.P.; Machado, J.F.; Pereira, E.; Bustamante, P.; Carvalho, L.; Soares, E.; Stevens, D.W.; Xavier, J.C. Antarctic toothfish Dissostichus mawsoni as a bioindicator of trace and rare earth elements in the Southern Ocean. Chemosphere 2023, 321, 138134. [Google Scholar] [CrossRef]
  32. Jiang, H.; Qin, D.; Mou, Z.; Zhao, J.; Tang, S.; Wu, S.; Gao, L. Trace elements in farmed fish (Cyprinus carpio, Ctenopharyngodon idella and Oncorhynchus mykiss) from Beijing: Implication from feed. Food Addit. Contam. Part B 2016, 9, 132–141. [Google Scholar] [CrossRef]
  33. Zhang, W.; Chen, L.; Zhou, Y.; Wu, Y.; Zhang, L. Biotransformation of inorganic arsenic in a marine herbivorous fish Siganus fuscescens after dietborne exposure. Chemosphere 2016, 147, 297–304. [Google Scholar] [CrossRef]
  34. Maage, A.; Lygren, B.; El-Mowafi, A.F.A. Manganese requirement of Atlantic salmon (Salmo salar) fry. Fish. Sci. 2000, 66, 1–8. [Google Scholar] [CrossRef]
  35. Leng, T.T.; Xie, J.Q.; Liu, B.L. Progress on trace elements occurrence of marine pelagic fish. Asian J. Ecotoxicol. 2023, 18, 115–130. [Google Scholar]
  36. Lee, G.H. The Cooperation and Antagonism between Trace Elements and Nutrients. J. Dairy Sci. Technol. 2005, 27, 80–82. [Google Scholar]
  37. Hilton, J.W.; Hodson, P.V. Effects of diet composition on selenium metabolism in rainbow trout. J. Nutr. 1983, 113, 1242–1248. [Google Scholar] [CrossRef]
  38. El-Shenawy, N.S.; EL-Hak, H.N.G.; Ghobashy, M.A.; Mansour, F.A.; Soliman, M.F. Using antioxidant changes in liver and gonads of Oreochromis niloticus as biomarkers for the assessment of heavy metals pollution at Sharkia province, Egypt. Reg. Stud. Mar. Sci. 2021, 46, 101863. [Google Scholar] [CrossRef]
  39. Zhu, Y.; Zhang, R.T. Joint Toxicity of Arsenic, Copper and Phenol to Carpsicyprinus carpio Linn. Chin. J. Appl. Environ. Biol. 2001, 7, 262–266. [Google Scholar]
  40. Zhang, Q.H. Studies on the Speciation of Mercury and Seleniumin the Soft Tissues of Bay Scallops and the Antagonism of Selenium Species to Mercury Species. Ph.D. Thesis, Ocean University of China, Qingdao, China, 2014; pp. 92–93. [Google Scholar]
  41. Jomova, K.; Makova, M.; Alomar, S.Y.; Alwasel, S.H.; Nepovimova, E.; Kuca, K.; Valko, M. Essential metals in health and disease. Chem. Biol. Interact. 2022, 367, 110173. [Google Scholar] [CrossRef]
  42. Chen, X.X.; Wu, W.J.; Lin, L.L. Acute toxicity and co-toxicity of heavy metals Cd, Zn to clams (Clamectes edulis). Jiangsu Agric. Sci. 2014, 42, 241–244. [Google Scholar]
  43. Honda, K.; Sahrul, M.; Hidaka, H.; Tatsukawa, R. Organ and tissue distribution of heavy metals, and their growth-related changes in Antarctic fish, Pagothenia borchgrevinki. Agric. Biol. Chem. 1983, 47, 2521–2532. [Google Scholar] [CrossRef]
  44. Barone, G.; Storelli, A.; Mallamaci, R.; Storelli, M.M. Comparative study on trace metal accumulation in liver of Mediterranean deep-sea fish and their selenium/mercury molar ratios. Water Air Soil. Pollut. 2017, 228, 211. [Google Scholar] [CrossRef]
  45. Ikemoto, T.; Kunito, T.; Watanabe, I.; Genta Yasunaga, G.; Baba, N.; Miyazaki, N.; Petrove, E.A.; Tanabe, S. Comparison of trace element accumulation in Baikal seals (Pusa sibirica), Caspian seals (Pusa caspica) and northern fur seals (Callorhinus ursinus). Environ. Pollut. 2004, 127, 83–97. [Google Scholar] [CrossRef] [PubMed]
  46. Lall, S.P.; Kaushik, S.J. Nutrition and metabolism of minerals in fish. Animals 2021, 11, 2711. [Google Scholar] [CrossRef] [PubMed]
  47. El-Erian, M.A.; Ibrahim, M.S.; Salem, S.M.; Mohammady, E.Y.; El-Haroun, E.R.; Hassaan, M.S. Evaluation of different copper sources in Nile tilapia diets: Growth, body indices, hematological assay, plasma metabolites, immune, anti-oxidative ability, and intestinal morphometric measurements. Biol. Trace Elem. Res. 2023, 201, 4900–4911. [Google Scholar] [CrossRef]
  48. Langston, W.J.; Spence, S.K. Biological factors involved in metal concentrations observed in aquatic organisms. Met. Metal. Speciat. Bioavailab. Aquat. Syst. 1995, 3, 407–478. [Google Scholar]
  49. Khezri, P.H.; Takhsha, M.; Jamshid, K.A.; Haghshenas, A. Assessment level of heavy metals (Pb, Cd, Hg) in four fish species of Persian Gulf (Bushehr-Iran). Int. J. Adv. Technol. Eng. Res. 2014, 4, 34–38. [Google Scholar]
  50. EFSA Panel on Contaminants in the Food Chain (CONTAM). Sci. Opin. Arsen. Food Arsen. Food 2009, 7, 1351. [CrossRef]
  51. Kruglyakova, U.S.; Bagryantseva, O.V.; Evstratova, A.D.; Malinkin, A.D.; Gmoshinskii, I.V.; Khotimchenko, S.A. Separate quontitative determination of organic and non-organic arsenic in sea products. Health Risk Anal. 2018, 2, 112–118. [Google Scholar] [CrossRef]
  52. Grgec, A.S.; Kljaković-Gašpić, Z.; Orct, T.; Tičina, V.; Sekovanić, A.; Jurasović, J.; Piasek, M. Mercury and selenium in fish from the eastern part of the Adriatic Sea: A risk-benefit assessment in vulnerable population groups. Chemosphere 2020, 261, 127742. [Google Scholar] [CrossRef] [PubMed]
Figure 1. Correlation between elements. Note: red color represents positive correlation, blue color represents negative correlation, and numbers represent correlation coefficients.
Jmse 12 00368 g001
Figure 2. Distribution of biometric data. Note: Percentages in the graph are the number of classified biological traits as a percentage of the total number of samples (n = 270). Sexual maturity was specifically classified as I (30%), II (27%), III (30%), and IV (13%); fatness was classified as 0–1 (14%), 1–2 (85%), and 2–3 (1%); age was classified as 0–1 year (27%), 1–2 year (60%), and 2–3 year (13%); and body weight was classified as 1–20 g (27%), 21–40 g (45%), 41–60 g (20%) and 61–80 g (8%); body length was classified as 110–140 mm (27%), 140–170 mm (45%), 170–200 mm (26%) and 200–230 mm (2%); and sex was classified as female (14%) and male (86%).
Jmse 12 00368 g002
Figure 3. Correlations between individual elements and biological factors. Note: red color represents positive correlation, blue color represents negative correlation, and numbers represent correlation coefficients.
Jmse 12 00368 g003
Figure 4. Target hazard values for essential and non-essential micronutrients for S. sagax in the NPO.
Jmse 12 00368 g004
Table 1. Levels of individual elements in S. sagax (mg kg−1, ww).
ClassElementsMean ± SDMaxMinDetection Rate
MacroelementK3110 ± 135010,5001120100%
Na1240 ± 7385890470100%
Mg361 ± 196153054100%
Ca2220 ± 209010,300155100%
Essential trace elementsB0.4 ± 1.09.86ND26%
Zn25.6 ± 14.685.36.02100%
Cu2.00 ± 1.439.46ND98%
Se0.62 ± 0.332.510.08100%
Cr0.35 ± 1.109.67ND53%
Mn1.0 ± 1.06.81ND87%
Fe48 ± 534881.58100%
Co0.018 ± 0.0170.142ND72%
Mo0.08 ± 0.6711.0ND83%
Non-essential trace elementsAl20.4 ± 48.7448ND87%
Ni0.6 ± 1.413.1ND57%
As2.22 ± 1.038.580.57100%
Ti0.11 ± 0.130.920.0164%
Sr3.5 ± 5.646.00.191%
V0.165 ± 0.3463.27ND86%
Cd0.172 ± 0.2051.37ND91%
Sn0.01 ± 0.030.33ND28%
Sb0.02 ± 0.030.319ND31%
Ba0.19 ± 0.405.47ND74%
Tl0.0119 ± 0.01890.266ND60%
Pb0.09 ± 0.394.82ND61%
Note: ND means not detected or below detection limit.
Table 2. Daily intakes and target hazard quotients for essential and non-essential micronutrients for S. sagax in the NPO.
ClassElementsRfD (mg kg−1 d−1)PTDI (g d−1)Ci (mg kg−1)EDI (×10−3 mg·kg−1·d−1)THQ (×10−3)
Essential trace elements Mn0.149.80.9980.1200.856
Fe0.74947.85.7438.204
Zn0.32125.63.07610.252
Co0.064.20.01780.0020.036
Cu0.042.820.2406.007
Se0.0050.350.6210.07514.922
Cr0.0050.350.3510.0428.434
Mo0.0050.350.07920.0101.903
Non-essential trace elementsV0.0070.490.1650.0202.832
Ni0.021.40.6230.0753.742
As0.00030.0210.06660.00826.672
Cd0.0010.070.1720.02120.665
Sr0.6423.450.4140.691
Sn0.6420.01290.0020.003
Sb0.00040.0280.01520.0024.565
Ba0.074.90.1920.0230.330
Pb0.0362.520.08940.0110.298
Note: RfD stands for the U.S. EPA recommended reference dose (mg kg−1 d−1); PTDI stands for the U.S. EPA recommended daily intake (g d−1); Ci stands for the mean concentration of the element; EDI stands for the daily intake (×10−3 mg kg−1 d−1); and THQ stands for the target hazard coefficient value (×10−3).
Disclaimer/Publisher’s Note: The statements, opinions and data contained in all publications are solely those of the individual author(s) and contributor(s) and not of MDPI and/or the editor(s). MDPI and/or the editor(s) disclaim responsibility for any injury to people or property resulting from any ideas, methods, instructions or products referred to in the content.

