Article

Length–Weight and Body Condition Relationships of the Exploited Sea Cucumber Pearsonothuria graeffei

by
Alison R. Hammond
and
Steven W. Purcell
*
National Marine Science Centre, Southern Cross University, Coffs Harbour, NSW 2450, Australia
*
Author to whom correspondence should be addressed.
J. Mar. Sci. Eng. 2024, 12(3), 371; https://doi.org/10.3390/jmse12030371
Submission received: 15 January 2024 / Revised: 15 February 2024 / Accepted: 19 February 2024 / Published: 22 February 2024
(This article belongs to the Section Marine Biology)

Abstract

:
Fishery stock assessments are often based on morphometric data from underwater diver surveys and landing surveys. Measurements of body length are usually converted to estimates of body weight, yet length–weight equations might differ among localities. We evaluated morphometric models for the sea cucumber, Pearsonothuria graeffei, collected at Lizard Island on the northern Great Barrier Reef, Australia, and explored differences in relative condition factor (Kn) across animal sizes. The estimation of body weight was compared among relationships with four different body size metrics: observed body length, SLW (square root of the body length–width product), recalculated body length (Le) from SLW, and body basal area. The basal area of the animals, the SLW index and Le provided more reliable estimations for body weight than using body length alone yet accounted for half of the variation in body weight. The length–weight relationship from animals at Lizard Island differed considerably from relationships published for the same species in New Caledonia and Philippines. Body condition was variable, and our model predicted a peak at 35 cm body length. Body metrics such as basal area, SLW index, and Le could offer more precise models for estimating the body weight of sea cucumbers for fishery purposes. Equations for estimating body weight from length and width of the sea cucumbers should be based on locality-specific data because morphometric relationships are spatially variable.

1. Introduction

Fisheries and ecological studies of marine animals rely heavily upon measurements of body length and weight, or at least their reliable estimation. Measurements or estimations of body weights are essential for evaluating the biomass of fished populations, forming the basis of harvest strategies and catch quotas for fisheries management [1]. For sea cucumber fisheries, catch quotas are usually based on weight of harvested animals [2,3,4]. Consequently, length–weight relationships are an important tool in the planning of resource management. These relationships are used for estimating body weight from empirical measurements of length and thus quantifying stocks in situ when it is impracticable to measure weight in the field [5]. For example, population surveys for tropical sea cucumbers often involve visual censuses of animals along belt transects, either underwater or by wading at low tide, and weighing each animal is time-consuming or impossible. Consequently, researchers might just measure the body length and width of the animals and later convert the measurements to estimates of body weight using known morphometric relationships, e.g., [3,4,6]. This is sometimes also necessary when data are provided by citizen scientists who might lack an electronic scale [7]. Known body lengths of sea cucumbers might also be converted to estimates of body weights for the purposes of growth models as part of production models for setting catch quotas [8]. Each of these purposes must be cognizant of the product form of the animals, e.g., whether they are gutted or whole and whether the animals are measured in situ or ex situ. Sometimes, the length–weight equations are constructed from animals within the locality, and other times, these are based on published reports from other countries. However, some scholars have cautioned against this practise, arguing that length–weight relationship are likely to vary among distant localities for species with large distributional ranges [9].
Significant spatial variations in length–weight relationships of fishes are well known [10]. Length–weight relationships can also differ significantly among localities for a wide variety of marine invertebrates, e.g., [11,12,13,14,15]. These spatial variations could be attributed to factors such as different growing conditions and seawater temperature or genetic differences. Irrespective of the cause, disparate morphometric relationships would be a concern for resource managers and researchers using relationships from animals from one locality to convert measurements to weights of animals at a distant locality. Sea cucumbers are known to display different length–weight equations between regions within a country [16]. However, comparisons of these relationships of sea cucumbers among localities relevant to different fisheries are scant in the literature, e.g., [17].
Length–weight relationships can also be useful when comparing growth patterns within and among species in time and space. The allometric growth exponent, b, derived from length–weight relationships, indicates whether growth is isometric (b = 3) or allometric (growing faster in length than weight, b < 3; or growing faster in weight than length, b > 3) [10]. Sea cucumbers typically display negative allometric growth (b < 3), becoming slenderer as they grow relative to body length [18,19].
Relationships between weight and length can also be used to calculate relative condition factor (Kn) of an individual animal in relation to the population or relative to other populations. This metric is applied under the generally held assumption that heavier organisms of a given length are in better physical condition than their lighter counterparts [10,20,21,22]. Seasonal variations in Kn may also provide insights into reproductive activity, influenced by maturity of gonads and spawning. For instance, Kn of sea cucumbers tends to be at a maximum during the spawning season [21].
Sea cucumbers present challenges for using their body measurements as metrics of animal size due to their high viscoelasticity, contractibility (especially when handled), and variable water and sediment retention [23,24]. These issues can be somewhat mitigated for some species via the implementation of several procedures. For example, sampling can be standardised by draining the animals for five minutes before weighing [25]. Further, bidimensional indices such as basal area (determined from length and width) or SLW (square root of the length–width product) and estimating body length from SLW may help reduce variability among individuals of effectively the same body size [5,26,27]. For certain species, this is unnecessary because length measurements alone are sufficient for estimating body weight [28].
The focus of this study is Pearsonothuria graeffei (Holothuriidae), commonly known as the blackspotted sea cucumber or “flowerfish”. This species attains a relatively small to moderate body size (generally 600–1000 g body weight) in relation to other commercially exploited species [29]. Widely distributed in the tropical Indian and Pacific oceans from Egypt and Madagascar in the west to Fiji and Kiribati in the east, this deposit-feeding holothuroid lives on hard coral reef surfaces in depths of up to 25 m. Although considered a low-value species compared to other sea cucumbers, it is fished throughout much of its range for dried seafood markets in China, where sea cucumbers are a luxury food item [29]. Exploitation of this species is also of interest due to a plethora of recent discoveries of its pharmaceutical properties [30,31,32,33,34]. Predominantly active in the daytime, P. graeffei feeds on sediments covering hard reef substrata [24]. Recently, we showed that this species is relatively long-lived and has a restricted home range [35]. Little else is known of its biology or ecology, presenting significant knowledge gaps for resource management [36,37,38]. Indeed, there are signs that some populations in Fiji may have already collapsed [39].
We aimed to evaluate the morphometric relationships of P. graeffei at Lizard Island on the Great Barrier Reef, Australia. This species is not currently targeted by the industrial-scale East Coast sea cucumber fishery in this region yet is harvested in many other fisheries in the Pacific Islands [40]. We compared the morphometric relationships between four different body size metrics with body weight to assess the most precise method for estimating individual body weight, which can be used in a fisheries management context to quantify stocks in situ [5]. We also sought to describe the general trend in relative condition factor (Kn) of P. graeffei across a range of animal sizes. We compared the length–weight equation in our study with equations from published studies from other localities, providing a rare appraisal of the application of these equations for sea cucumbers across geographic scales akin to different fisheries. This cross-locality comparison offers a novel case study for resource managers and scientists involved with using morphometric equations for sea cucumbers broadly.

2. Materials and Methods
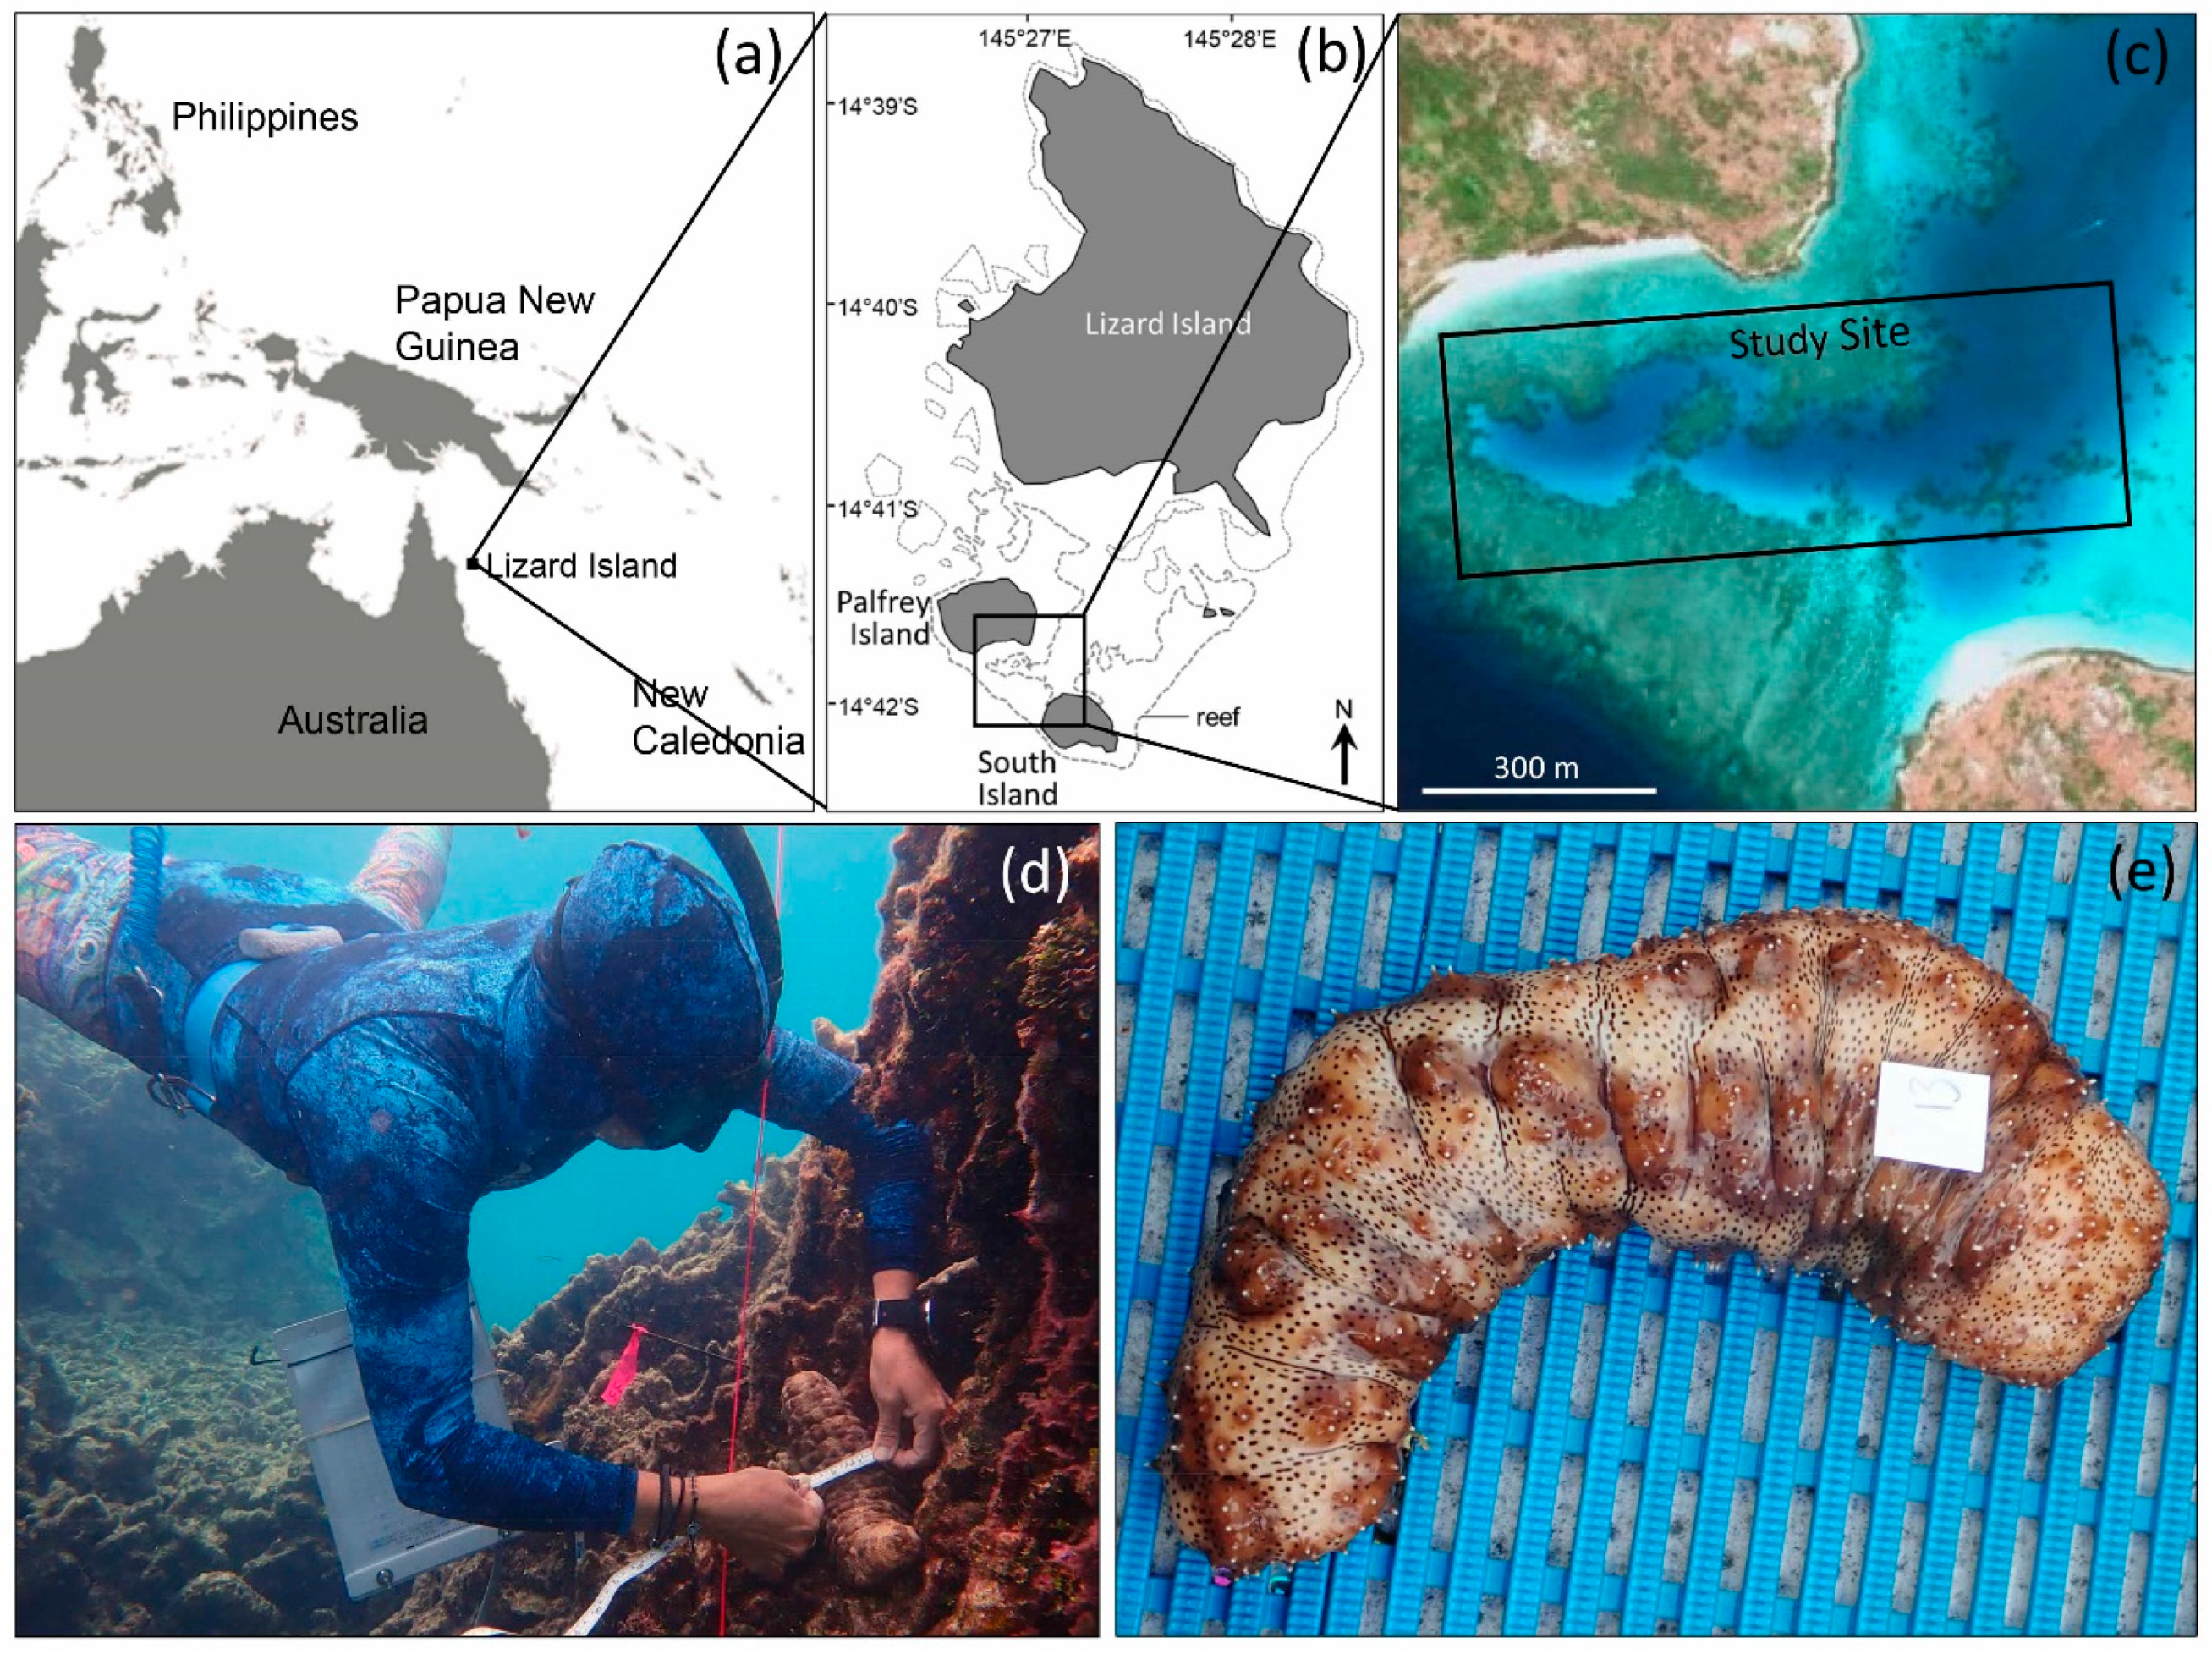
Fieldwork was carried out at Lizard Island (14°40′ S, 145°28′ E), known traditionally as Jiigurru or Dyiigurra, in the northern Great Barrier Reef, Australia (Figure 1a,b). All biota on the reefs in this island group are protected from exploitation within a no-take scientific research zone. The sea cucumbers at Lizard Island were once fished [41,42] but have not been harvested for many decades, so the population under study can be considered as unfished. The study was undertaken on coral reef habitats in a lagoon between Palfrey Island and South Island (Figure 1c), which is sheltered from the predominant winds and waves.

2.1. Field Methods

Fieldwork for this study was undertaken from 19 to 25 February 2021. A total of 139 individual P. graeffei were found and recorded from the study site (Figure 1c). Data were collected by experienced free-divers on snorkel, with lagoon depths ranging 1–7.1 m (average 3.7 m). All individuals that were encountered were recorded (i.e., there was no selectivity). We note that we had taken measurements of some of these animals in the two subsequent years for another study [35] but did not include those data in this study in order to avoid pseudo-replication.
Upon locating each animal, we measured the length and width (at body midpoint) of each animal in an un-disturbed state to ±0.5 cm in situ with a measuring tape (Figure 1d). Each individual was then placed into a plastic bag along with a numbered label and then brought to a nearby boat.
Once in the boat, each individual was removed from the bag with its label and placed on the deck of the boat for precisely 5 min (Figure 1e). That draining period allowed the animals to expel water from their body while minimising stress and is a standard procedure to reduce measurement error (following Skewes and colleagues [25]). After being drained, each animal was weighed using an electronic hanging balance (±10 g). The field site was in sheltered “back-reef” habitats, although some light wind chop could cause 10–20 g variation in weight measurements using a digital hanging scale (Rapala VMC Corporation, Minnetonka, MN, USA), corresponding to 1–3% error in weight measurements relative to the mean body weight. We then returned the animals to their exact original position on the reef, identified by a numbered marker and float.

2.2. Analytical Procedures
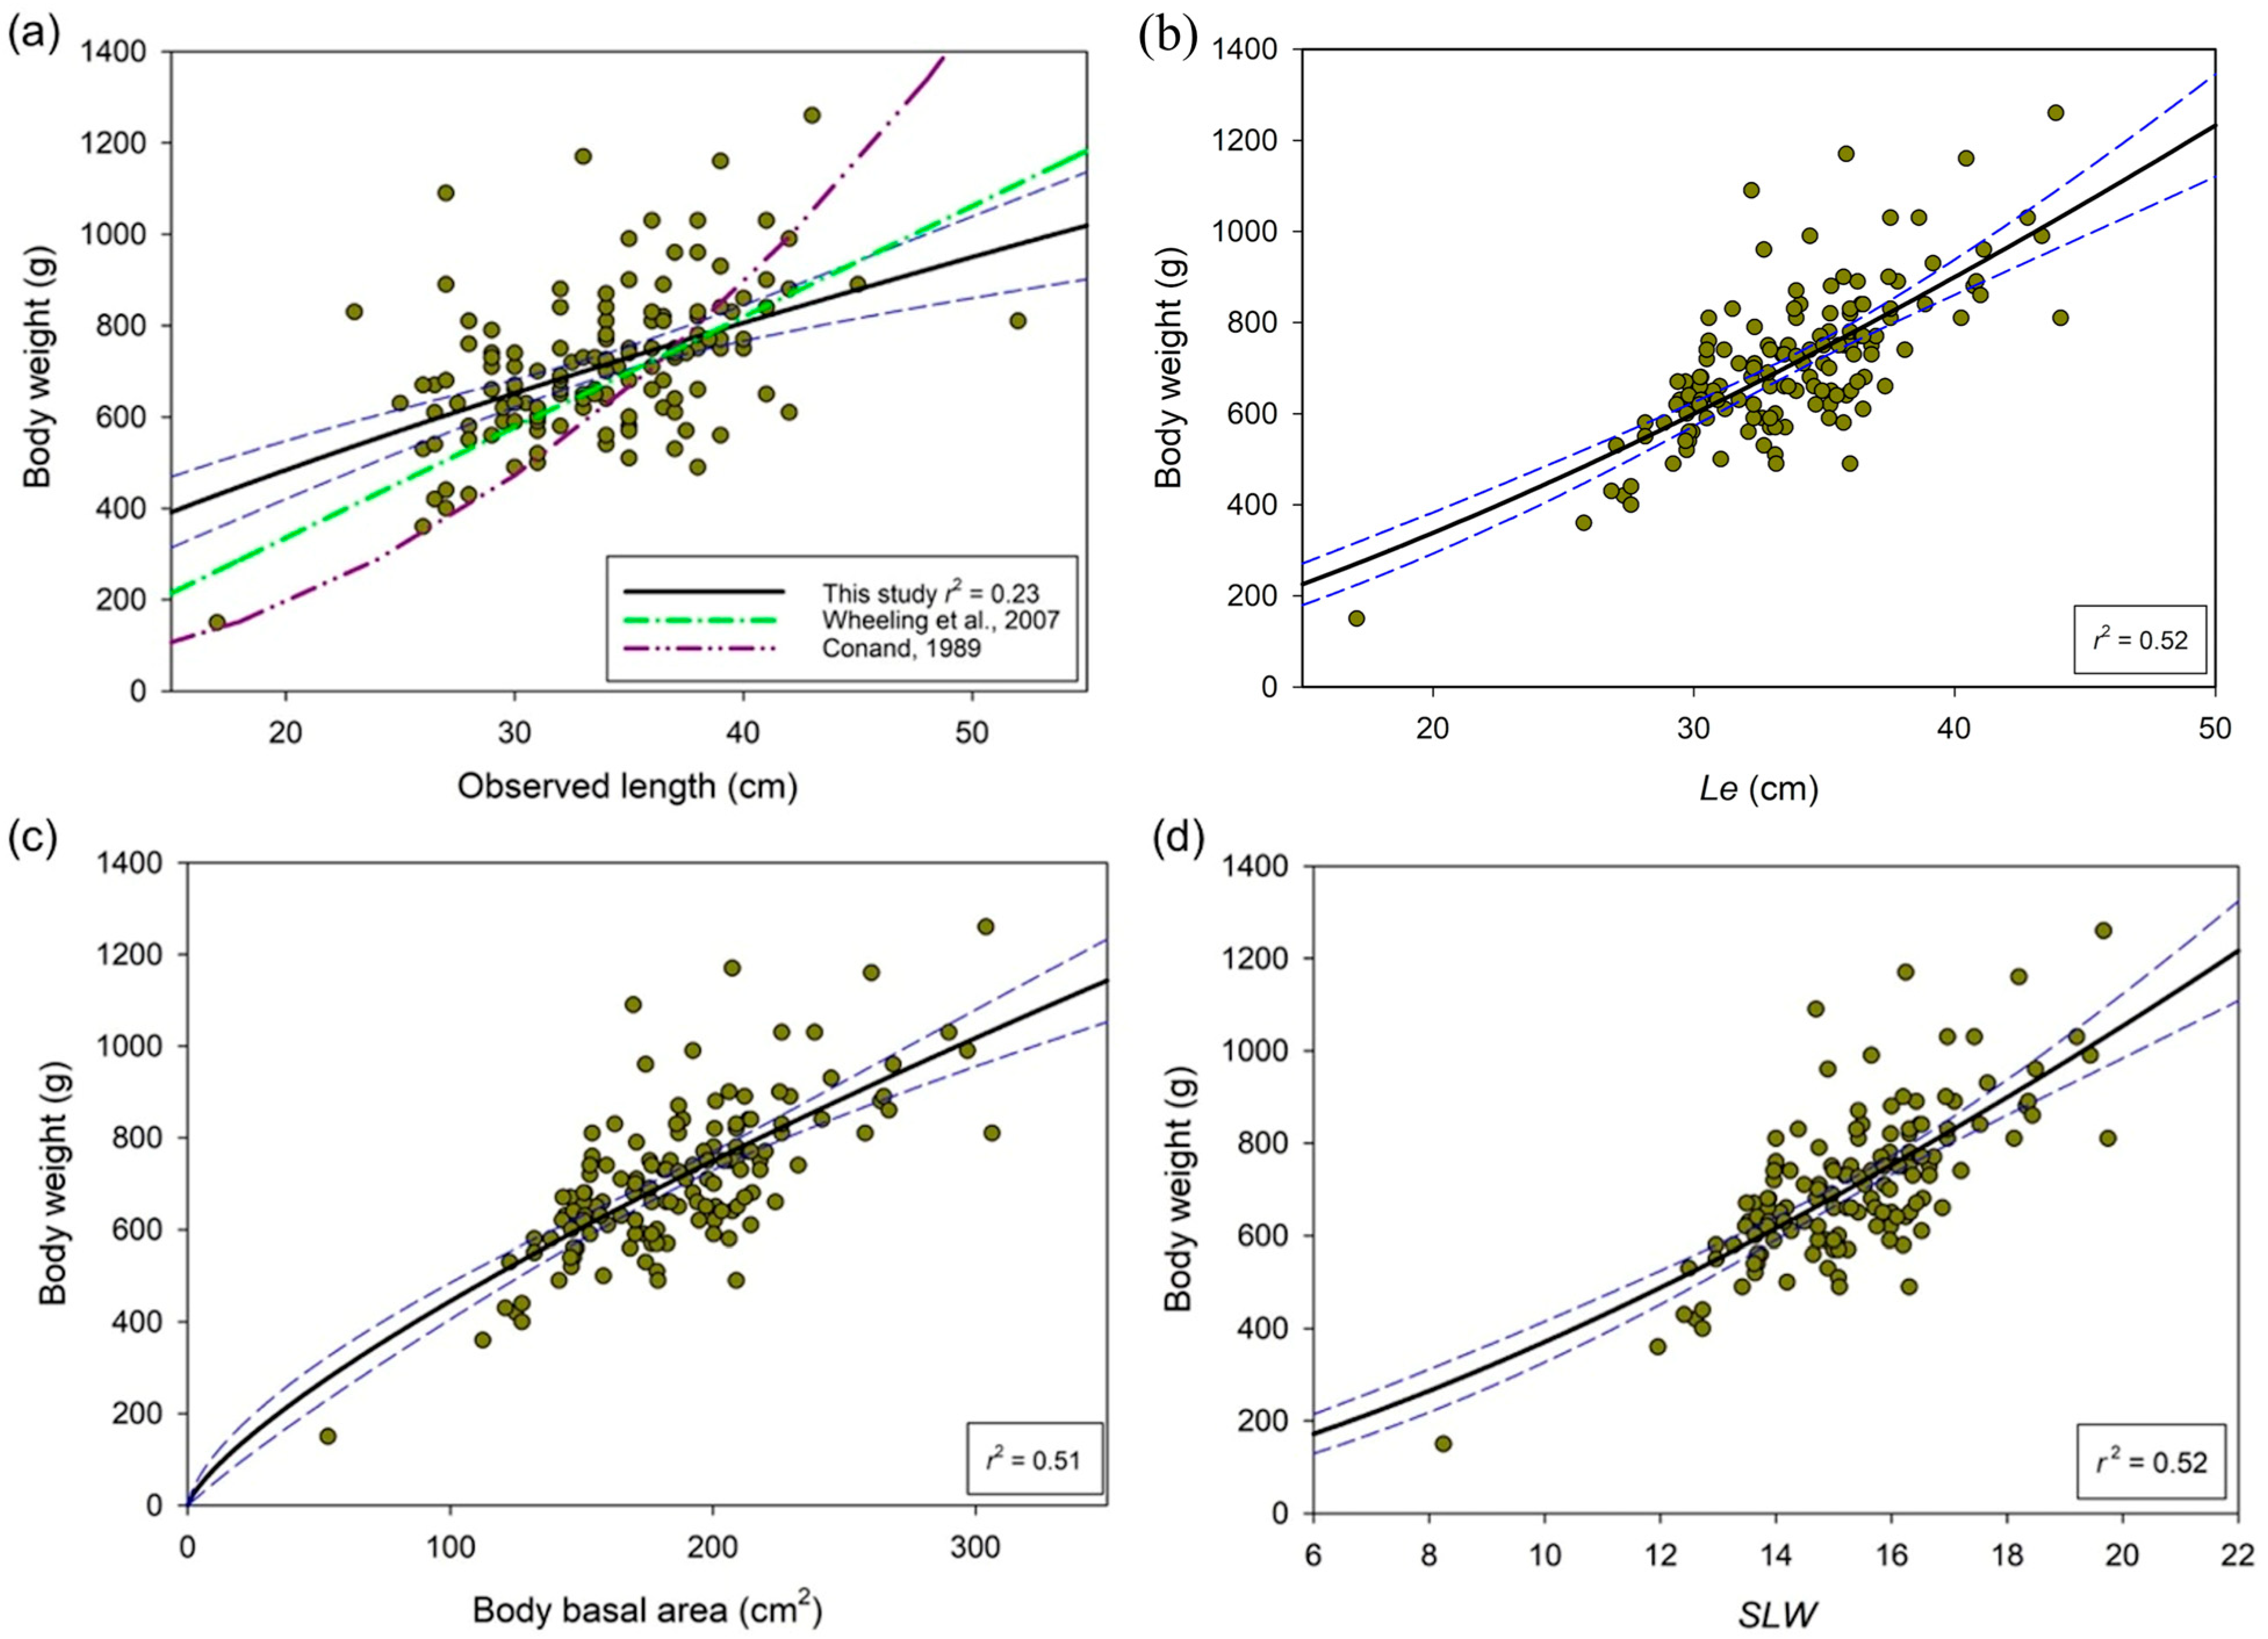
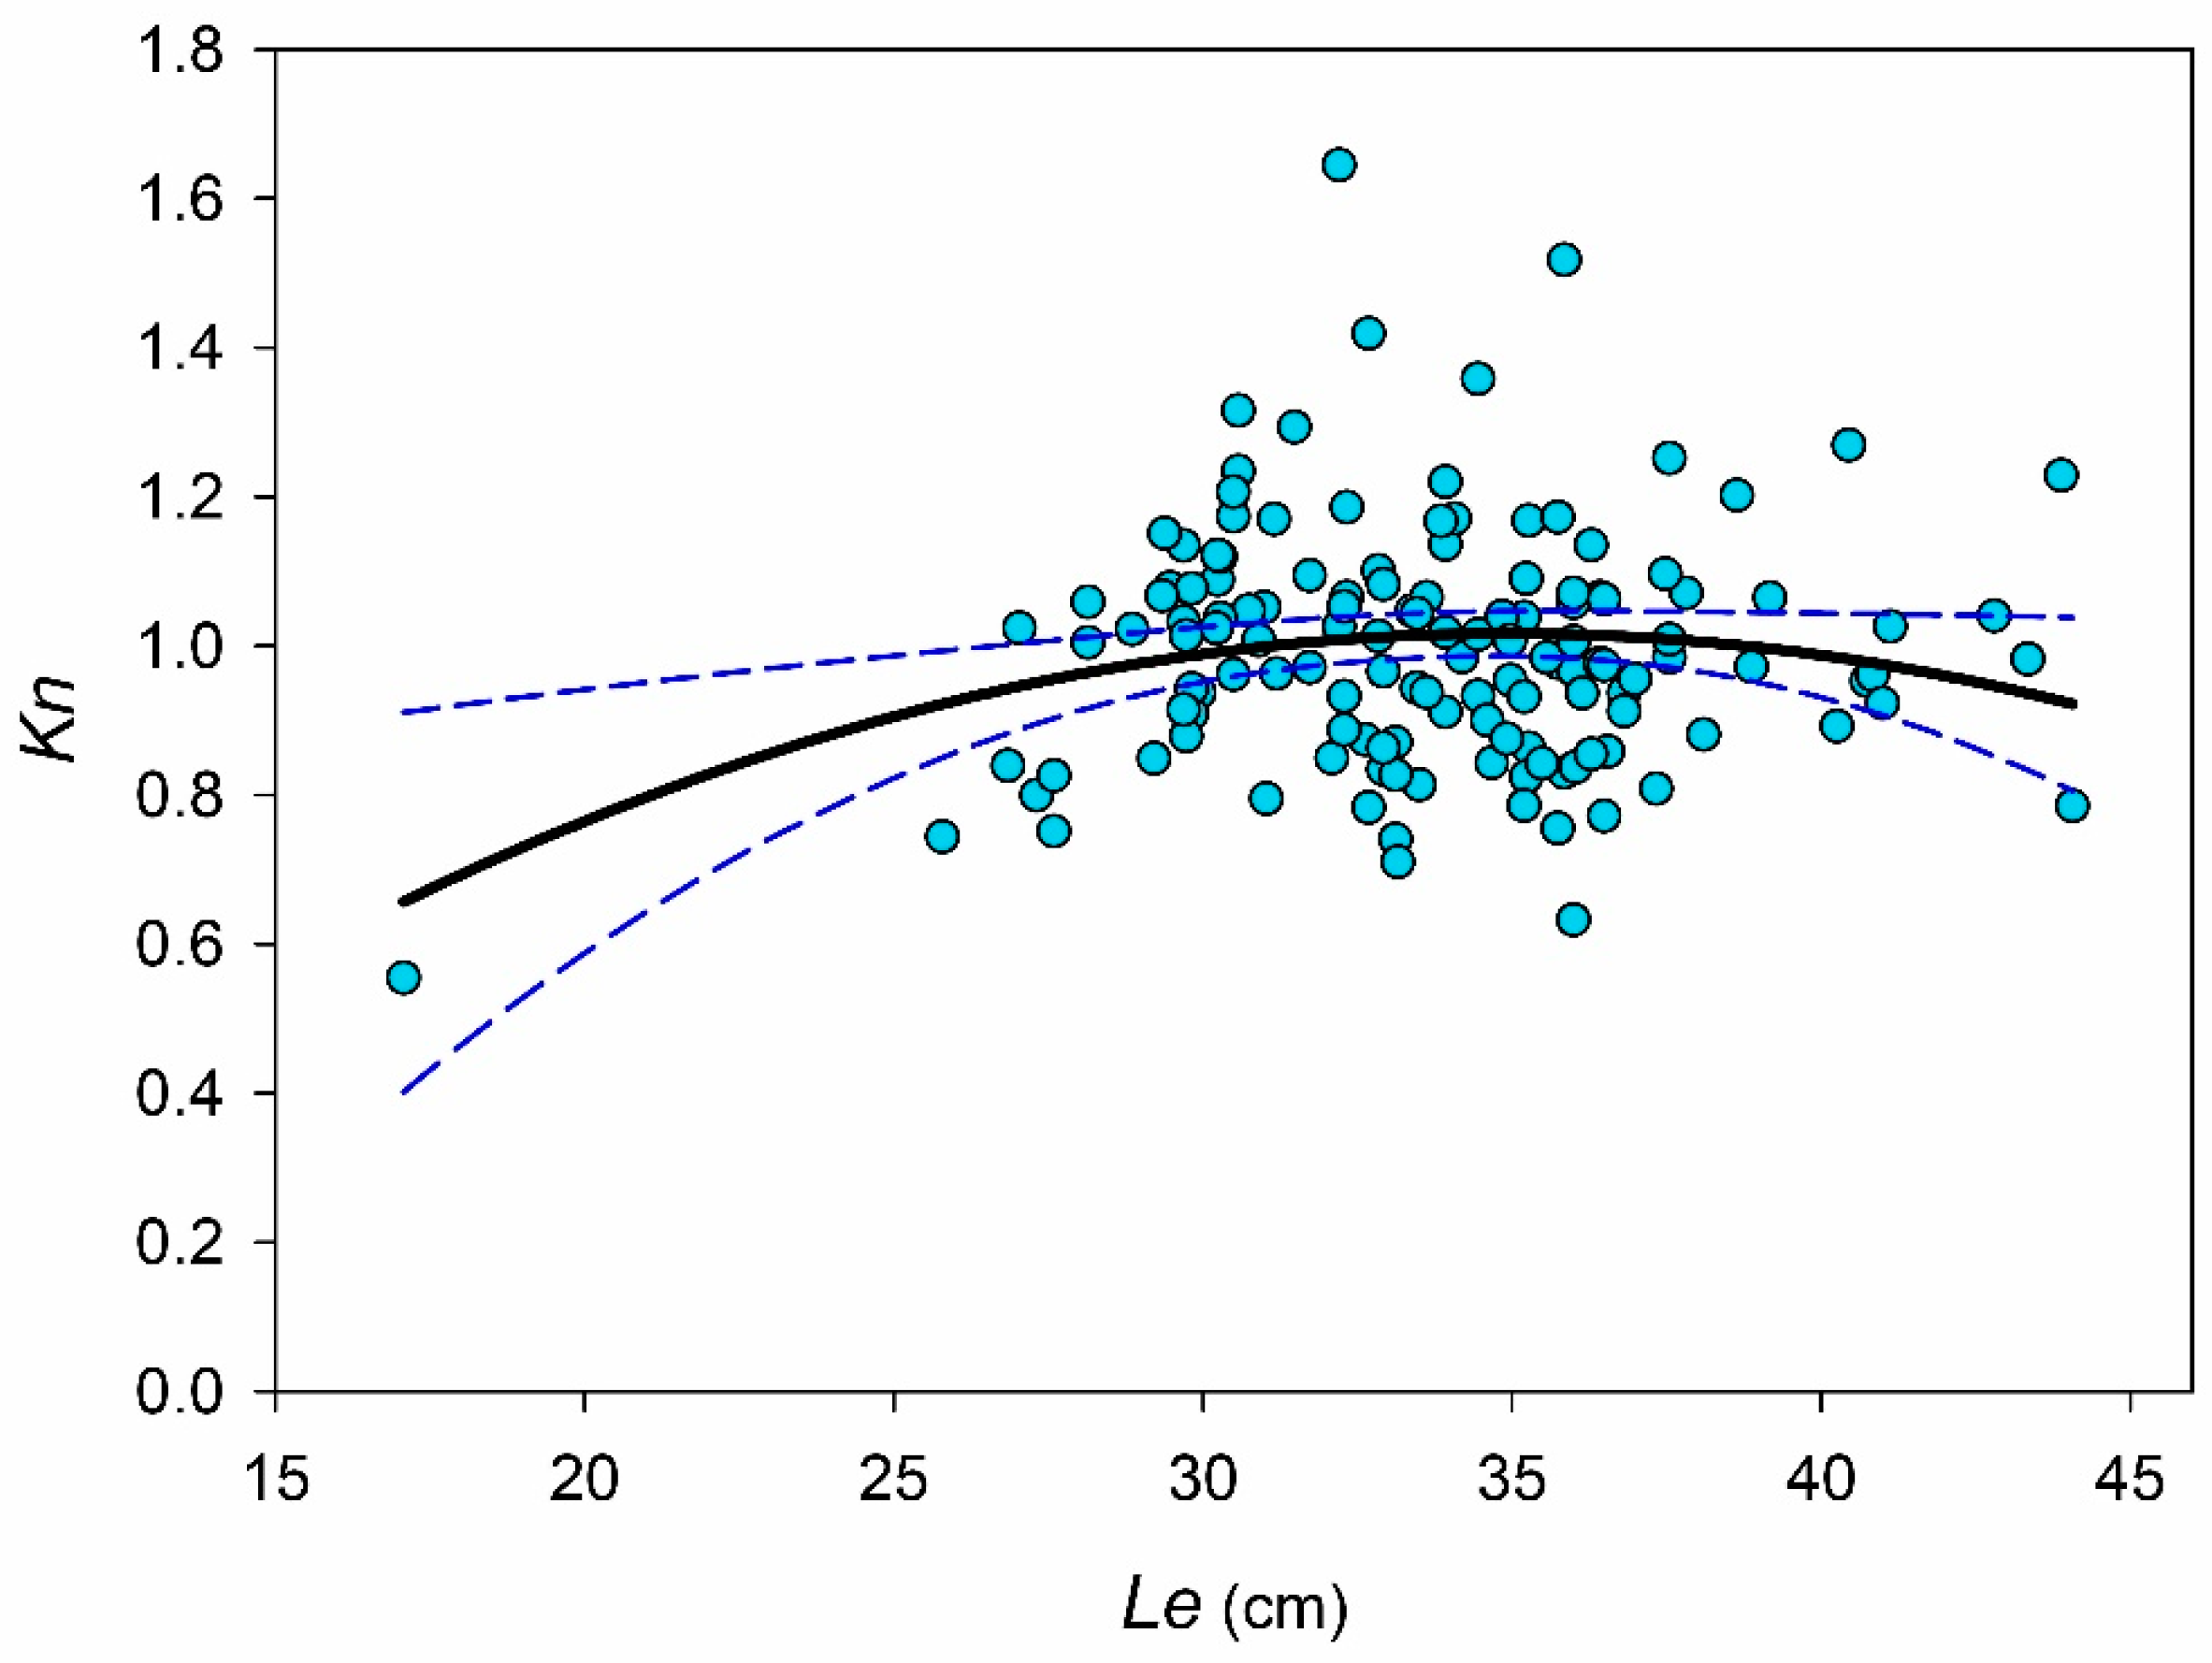
Variability of body measurements was compared using the coefficient of variation (CV) for length and width as well as for two bidimensional indices: basal area, determined using the formula of an ellipse:
basal area = π × (L ÷ 2) × (W ÷ 2)
and the SLW (square root of the body length-width product) as follows:
SLW = √((L × W))
where L is the body length in cm, and W is the body width in cm for both equations [27,43,44].
Recalculated length (Le) was derived from the regression of observed length vs SLW [27,44].
Datafit-9.0 software (Oakdale Engineering) was used to investigate relationships between body weight and observed length, Le, basal area, and SLW of the animals. These morphometric analyses were based on the standard growth function [10]:
y = a × xb,
where y is body weight (in g), and x can be length (in cm), Le, basal area, or SLW; the parameters a and b are to be estimated in the regression.
When compared against length, the exponent, b, describes the rate of change of increases in weight and can be compared within and among holothuroid species in time and space. The r-squared values were compared among the four equations to determine the model with the most precise fit. A Pearson’s correlation analysis was used to examine how closely the SLW index and the observed length were associated with one another, as neither were dependent on the other.
The estimated parameters (a and b) from the weight–Le relationship were used to calculate the index of relative condition (Kn) for each animal within the population, using observed weight and Le [21,22]:
Kn = W ÷ a × Leb,
where W is the body weight in grams, Le is the estimated body length, and a and b are parameters from the weight–Le relationship.
The relationship between the relative condition (Kn) and the recalculated lengths (Le) of the sea cucumbers was compared across numerous functions using Datafit-9 software. We selected the model with the highest r2 value as the equation of best fit.

3. Results

Body length of Pearsonothuria graeffei averaged 34 cm (±5 cm SD) across the 139 animals, which was more than four times the mean body width (7 ± 1 cm). The sea cucumbers ranged 17–52 cm in length and 150–1260 g in weight (Figure 2a,b). The bidimensional SLW index showed the smallest coefficient of variance of the four body measurements (Table 1). This index correlated significantly with the observed length (p < 0.001, r137 = 0.79) and was used to generate the recalculated length (Le):
Le = 2.35 × SLW − 2.28
The use of bidimensional indices (basal area and SLW) generated stronger biometric relationships with weight (basal area, r2 = 0.51; SLW, r2 = 0.52) than with observed length (r2 = 0.23; Table 1, Figure 3). Derived from the SLW index, Le also produced a stronger relationship with body weight (r2 = 0.52) compared to observed length, explaining a similar amount of the variation in weight as basal area and SLW (Table 1, Figure 3). The relationships between animal weight and all four body size measurements were highly significant, affirming that the animals consistently increase in weight with increases in lineal dimensions (Table 1). Because of the stronger relationship with weight, compared to observed length, Le was used to calculate the relative condition factor (Kn).
The morphometric model of observed lengths of P. graeffei in this study were compared with published equations based on populations at localities in the Philippines and New Caledonia (Figure 3a). When comparing the derived regressions using observed length, Conand’s [18] and Wheeling et al.’s [24] length–weight equations would under-predict body weight in smaller animals from Lizard Island (<700 g) but would over-predict weight in larger animals (>700 g) compared to our study (Figure 3a). Wheeling et al. [24] applied a linear equation, while Conand [18] also applied the growth equation, with parameter estimates of a = 0.251 (adjusted for body lengths in cm) and b = 2.217 (https://www.sealifebase.ca/summary/Pearsonothuria-graeffei.html accessed on 18 March 2021).
The Lizard Island population exhibited hypoallometric growth, with exponent b values of 0.74 derived from the observed length–weight relationship and 1.41 from the Le–weight relationship (Table 1). In other words, the results show that the animals increased less in weight than predicted by their increase in length, i.e., becoming more elongated as they grew [45].
The modelled relationship between Kn and Le with the highest r2 was a third-order polynomial function (r2 = 0.05; p < 0.05). This quadratic curve had an apex (1.03) at 34.5 cm Le (Figure 4), equivalent to 721 g. In other words, animals around this size were, on average, in peak condition, with larger and smaller animals exhibiting reduced body condition by comparison.

4. Discussion

Sea cucumber population assessments using body size have an inherent level of uncertainty due to variability of body measurements resulting from body contractibility of the animals and differing volume of water withheld in their bodies [5]. Pearsonothuria graeffei is no exception, with its elongate body being viscoelastic. The challenge for resource assessments is exacerbated by a lack of standardization amongst studies, complicating comparisons between different populations. For example, past studies have variously weighed P. graeffei individuals as undrained, drained using 1–5 min draining period, drained using a mediodorsal incision to remove fluid, eviscerated/gutted, or as the dried product [5,18,24,46].
Likewise, the body size of P. graeffei has been measured in a variety of ways. These include using relaxed (in situ unhandled or ex situ using a chemical relaxant) or contracted (handled) body length, dried length, and multidimensional indices using body length, width, and occasionally height [5,18,24]. In the present study, the bidimensional indices of basal area, SLW, and recalculated length (Le) provided the most accurate predictors of body weight. Of these metrics, Le had the added benefit of a less-variable length metric from which to conduct further length-related analyses, such as relative body condition. The poor prediction of body weight by using only observed length concurs with studies of various sea cucumber species, including P. graeffei [5,24]. Wheeling and colleagues [24] determined that measurements of body length, width, and height to calculate an elliptical volume gave the best predictive value (r2 = 0.78; n = 18) for body weight. However, accurate measurement of body height is not easily made in situ when the animals are on complex hard substrata. Mean body length and weight for P. graeffei at Lizard Island (34 cm and 709 g) were consistent with averages across the western central Pacific region ([47]; 35 cm length, 700 g weight), and body lengths were similar to those recorded by Conand ([18]; 15–49 cm) in New Caledonia.
Considerable variation in the length–weight relationship between our study at Lizard Island, Australia, and the studies from Philippines and New Caledonia (Figure 3a) signals a critical issue for future studies. The allometric relationships of sea cucumbers from temperate seas can differ considerably among geographic regions, implying disparate intra-specific growth strategies [17]. Our analysis of P. graeffei offers the first glimpse at this issue for tropical sea cucumbers. In other marine taxa, geographic variation in length–weight relationships has been attributed to factors including seawater temperature, salinity, oceanographic conditions, and food availability [11,12,14]. We refrain from speculating on why P. graeffei showed variable morphometry among localities, and the potential influences of measurement technique, handling, and seasons are not discounted. The important lesson for this and potential other sea cucumbers is that morphometric relationships derived from one locality should not be used on data at other localities to estimate weights of sea cucumbers.
Some tropical holothuroids have relatively rigid bodies, so length measurements are sufficient for estimating weight [28]. Future ecological and fisheries studies on P. graeffei should benefit from using both length and width to describe body size, for example, using the SLW index. This approach could apply to other elongated and highly viscoelastic species in the family Holothuriidae that are also exploited, such as Holothuria coluber, H. fuscocinerea, H. grisea, H. hilla, H. imitans, H. lentiginosa lentiginosa, H. leucospilota, H. lubrica, H. poli, H. portovallartensis, and H. tubulosa [29]. Doing so could yield less-variable measurements for weight predictions in growth studies, population assessments, or other size-based fisheries management studies. In New Caledonia in the 1980s, Conand [18] found a close prediction of body weight using body length. This can be influenced by factors such as the range in body lengths in the sample and the conditions of the population at the time of sampling. Our study reveals that estimation of body weight of P. graeffei for fishery purposes might be more reliable using the two-dimensional indices or recalculated length and applying simple conversion equations, although it is a species for which the weight estimations remain with a fair degree of uncertainty. If time and resources permit, the direct weighing of animals is preferred, using a standardised 5 min draining period [25]. In the present study, P. graeffei seemed to tolerate handling, with none eviscerating. Some other holothuroid species are much more sensitive to being handled [29,48].
The allometric growth exponent, b, derived from the Le–weight relationship (1.41) in our study is within the, albeit wide, range for other tropical holothuroids (0.75–2.9; reviewed by [49]). However, it is much lower than Conand’s [18] value of 2.2 based on observed lengths. This “power” parameter can provide an insight into growth patterns of the animals across a range of body lengths. For instance, relatively low values of b could be interpreted to imply that the animals grow progressively stouter. Potential explanations for the differences in growth pattern between the two studies include influences of regional, seasonal, and temporal factors, such as water temperature, food abundance, sexual maturity, and reproductive period [10,21,45,49,50]. Notably, our measurements are all from the same season. Froese and colleagues [45] advocated that, ideally, the sampling period should cover all seasons, preferably over a complete year cycle. Seasonal effects on morphometric relationships could explain some of the variation we found among localities for P. graeffei, so some caution is needed when applying our relationships in other seasons.
The highest predicted relative condition (Kn) of P. graeffei in moderately sized individuals within the range of body sizes is similar to findings by Herrero-Pérezrul and Reyes-Bonilla [21]. The tendency for larger animals having lower Kn values suggests that they were in poorer condition yet requires cautious interpretation due to potential effects of spawning and because our sample had only one small-sized animal (<20 cm) and wide dispersion of values. Pearsonothuria graeffei are known to spawn at Lizard Island from November to February [51,52], with our sampling period coinciding with the end of spawning season. As our sampling period was at the end of spawning season, lower relative condition of the large individuals could be partly explained by recent weight loss from spawning.
Differences in measuring and handling methodologies may explain some variability in length–weight relationships we found for P. graeffei compared with published results from populations in different localities. The length–weight relationship in our study (Figure 3a) more closely resembles that presented by Wheeling and co-authors ([24]; n = 18), who used a similar draining methodology (1–5 min), thereby reducing bias associated with the weight of withheld water. In Conand’s ([18]; n = 56) study, it is unclear whether animal length was measured in situ or ex situ using a chemical relaxant, and weighed animals were not subjected to a timed drainage period. In any case, the variability in length–weight relationships between studies (Figure 3a) highlights an advantage in standardization of handling and measuring protocols and choice of size metric for modelling.
In summary, our study reinforces a lesson that body length alone is an imprecise predictor of body weight in this sea cucumber species, suggesting the same for others. Metrics of body dimensions that incorporate body length and width can greatly improve the prediction of body weight, yet the predictive relationships can remain imprecise, with only half of the variation in body weight explained by the models. Therefore, weighing animals in the field directly is advocated. We suggest that this finding should be considered for other elongated and highly viscoelastic species—which are widely represented in the family Holothuriidae and exploited in numerous fisheries [29]. Further, our study offers a rare appraisal of length–weight relationships of a sea cucumber species across published studies, revealing substantial geographic variation. These findings necessitate locality-specific data in order to establish trustworthy relationships that can be used for converting field measurements.

Author Contributions

Conceptualization, A.R.H. and S.W.P.; methodology, A.R.H. and S.W.P.; formal analysis, A.R.H.; resources, S.W.P.; data curation, A.R.H. and S.W.P.; writing—original draft preparation, A.R.H.; writing—review and editing, A.R.H. and S.W.P.; visualization, A.R.H. and S.W.P.; supervision, S.W.P.; funding acquisition, S.W.P. All authors have read and agreed to the published version of the manuscript.

Funding

This research was partially funded by a Ralph Barclay Braun Memorial Scholarship (2021) a Southern Cross University postgraduate grant to A.R.H. and partially by the Marine Ecology Research Centre, Southern Cross University.

Institutional Review Board Statement

Not applicable.

Informed Consent Statement

Not applicable.

Data Availability Statement

Access to the study data can be gained by requesting directly by email to the authors.

Acknowledgments

We thank Sophie Rallings for assisting the data collection. We are grateful to the Lizard Island Research Station staff for supporting the fieldwork. This study was conducted under Lizard Island Research Station collection permit GBRMPA G19/39553.1. We thank four anonymous reviewers for helpful suggestions that helped us improve the manuscript.

Conflicts of Interest

The authors declare no conflict of interest.

References

  1. Zale, A.V.; Parrish, D.L.; Sutton, T.M. Fisheries Techniques; American Fisheries Society Bethesda: Bethesda, MD, USA, 2012. [Google Scholar]
  2. Purcell, S.W. Managing Sea Cucumber Fisheries with an Ecosystem Approach; Lovatelli, A., Vasconcellos, M., Yimin, Y., Eds.; FAO Fisheries and Aquaculture Technical Paper No. 520; FAO: Rome, Italy, 2010. [Google Scholar]
  3. Gilbert, A.; Georget, S.; Guillemot, N.; Ton, C.; Léopold, M.; Purcell, S.; Van Wynsberge, S.; Andréfouët, S. État des Lieux des Stocks D’holothuries Commerciales en Nouvelle-Calédonie (2021–2022); Rapport ADECAL Technopole—Projet PROTEGE; ADECAL Technopole: Noumea, New Caledonia, 2022; p. 65. [Google Scholar]
  4. Léopold, M.; Cornuet, N.; Andréfouët, S.; Moenteapo, Z.; Duvauchelle, C.; Raubani, J.; Ham, J.; Dumas, P. Comanaging small-scale sea cucumber fisheries in New Caledonia and Vanuatu using stock biomass estimates to set spatial catch quotas. Environ. Conserv. 2013, 40, 367–379. [Google Scholar] [CrossRef]
  5. Prescott, J.; Zhou, S.; Prasetyo, A.P. Soft bodies make estimation hard: Correlations among body dimensions and weights of multiple species of sea cucumbers. Mar. Freshwater Res. 2015, 66, 857–865. [Google Scholar] [CrossRef]
  6. Feary, D.A.; Hamilton, R.; Matawai, M.; Molai, C.; Karo, M.; Almany, G. Assessing Sandfish Population Stocks within the South Coast of Manus, and a Summary Report of Sandfish Connectivity Field Research; The Nature Conservancy Asia Pacific Division: Queensland, Australia, 2014. [Google Scholar]
  7. González-Wangüemert, M.; Valente, S.; Henriques, F.; Domínguez-Godino, J.A.; Serrão, E.A. Setting preliminary biometric baselines for new target sea cucumbers species of the NE Atlantic and Mediterranean fisheries. Fish. Res. 2016, 179, 57–66. [Google Scholar] [CrossRef]
  8. Helidoniotis, F. Stock Assessment of Black Teatfish (Holothuria whitmaei) in Queensland, Australia; Department of Agriculture and Fisheries Queensland: Brisbane, Australia, 2021.
  9. Cone, R.S. The need to reconsider the use of condition indices in fishery science. Trans. Am. Fish. Soc. 1989, 118, 510–514. [Google Scholar] [CrossRef]
  10. Froese, R. Cube law, condition factor and weight–length relationships: History, meta-analysis and recommendations. J. Appl. Ichthyol. 2006, 22, 241–253. [Google Scholar] [CrossRef]
  11. McShane, P.E.; Schiel, D.R.; Mercer, S.F.; Murray, T. Morphometric variation in Haliotis iris (Mollusca: Gastropoda): Analysis of 61 populations. N. Z. J. Mar. Fresh. 1994, 28, 357–364. [Google Scholar] [CrossRef]
  12. Defeo, O.; Cardoso, R.S. Macroecology of population dynamics and life history traits of the mole crab Emerita brasiliensis in Atlantic sandy beaches of South America. Mar. Ecol. Prog. Ser. 2002, 239, 169–179. [Google Scholar] [CrossRef]
  13. Ferreri, G.A.B. Length–weight relationships and condition factors of the Humboldt Squid (Dosidicus gigas) from the Gulf of California and the Pacific Ocean. J. Shellfish Res. 2014, 33, 769–780. [Google Scholar] [CrossRef]
  14. Powell, E.N.; Mann, R.; Ashton-Alcox, K.A.; Kim, Y.; Bushek, D. The allometry of oysters: Spatial and temporal variation in the length–biomass relationships for Crassostrea virginica. J. Mar. Biol. Assoc. UK 2016, 96, 1127–1144. [Google Scholar] [CrossRef]
  15. Purcell, S.W.; Ceccarelli, D.M. Population colonization of introduced trochus (Gastropoda) on coral reefs in Samoa. Restor. Ecol. 2021, 29, e13312. [Google Scholar] [CrossRef]
  16. Asha, P.; Ranjith, L.; Vivekanandan, E.; Johnson, B.; Subin, C.; Sheik Mohamed, M. Spatial variations in the population characteristics of sea cucumber resources in Gulf of Mannar and Palk Bay, south-east coast of India. Indian J. Fish. 2019, 66, 1–11. [Google Scholar] [CrossRef]
  17. Azevedo e Silva, F.; Brito, A.; Simões, T.; Pombo, A.; Marques, T.; Rocha, C.; Sousa, J.; Venâncio, E.; Félix, P. Allometric relationships to assess ontogenetic adaptative changes in three NE Atlantic commercial sea cucumbers (Echinodermata, Holothuroidea). Aquat. Ecol. 2021, 55, 711–720. [Google Scholar] [CrossRef]
  18. Conand, C. Les Holothuries Aspidochirotes du Lagon de Nouvelle-Calédonie: Biologie, Ecologie et Exploitation; ORSTOM: Paris, France, 1989; p. 393. [Google Scholar]
  19. Purcell, S.W.; Gossuin, H.; Agudo, N.S. Status and Management of the Sea Cucumber Fishery of La Grande Terre, New Caledonia; WorldFish Centre Studies and Reviews No. 1901; WorldFish Centre: Penang, Malaysia, 2009. [Google Scholar]
  20. Anibeze, C. Length-weight relationship and relative condition of Heterobranchus longifilis (Valenciennes) from Idodo River, Nigeria. Naga ICLARM Q. 2000, 23, 34–35. [Google Scholar]
  21. Herrero-Pérezrul, M.D.; Reyes-Bonilla, H. Weight-Length relationship and relative condition of the holothurian Isostichopus fuscus at Espíritu Santo Island, Gulf of California, México. Rev. Biol. Trop. 2008, 56, 273–280. [Google Scholar]
  22. Le Cren, E.D. The length-weight relationship and seasonal cycle in gonad weight and condition in the perch (Perca fluviatilis). J. Anim. Ecol. 1951, 20, 201–219. [Google Scholar] [CrossRef]
  23. Sewell, M.A. Aspects of the ecology of Stichopus mollis (Echinodermata: Holothuroidea) in north-eastern New Zealand. N. Z. J. Mar. Fresh. 1990, 24, 97–103. [Google Scholar] [CrossRef]
  24. Wheeling, R.J.; Verde, E.A.; Nestler, J.R. Diel cycles of activity, metabolism, and ammonium concentration in tropical holothurians. Mar. Biol. 2007, 152, 297–305. [Google Scholar] [CrossRef]
  25. Skewes, T.; Smith, L.; Dennis, D.; Rawlinson, N.; Donovan, A.; Ellis, N. Conversion Ratios for Commercial Beche-de-Mer Species in Torres Strait; Australian Fisheries Management Authority, Torres Strait Research Program: Canberra, Australia, 2004.
  26. Laboy-Nieves, E.N.; Conde, J.E. A new approach for measuring Holothuria mexicana and Isostichopus badionotus for stock assessments. SPC Beche-de-mer Inf. Bull. 2006, 24, 39–44. [Google Scholar]
  27. Poot-Salazar, A.; Hernández-Flores, A.; Ardisson, P.-L. Use of the SLW index to calculate growth function in the sea cucumber Isostichopus badionotus. Sci. Rep. 2014, 4, 5151. [Google Scholar] [CrossRef]
  28. Gray, B.C.; Byrne, M.; Clements, M.; Foo, S.A.; Purcell, S.W. Length-weight relationship for the dragonfish, Stichopus cf. monotuberculatus (Holothuroidea). Fish. Res. 2023, 268, 106851. [Google Scholar] [CrossRef]
  29. Purcell, S.W.; Lovatelli, A.; González-Wangüemert, M.; Solís-Marín, F.A.; Samyn, Y.; Conand, C. Commercially Important Sea Cucumbers of the World, 2nd ed.; FAO Species Catalogue for Fishery Purposes No. 6, Rev. 1; FAO: Rome, Italy, 2023. [Google Scholar]
  30. Gao, X.; Endo, H.; Taniguchi, K.; Agatsuma, Y. Combined effects of seawater temperature and nutrient condition on growth and survival of juvenile sporophytes of the kelp Undaria pinnatifida (Laminariales; Phaeophyta) cultivated in northern Honshu, Japan. J. Appl. Phycol. 2013, 25, 269–275. [Google Scholar] [CrossRef]
  31. Li, S.; Li, J.; Mao, G.; Wu, T.; Hu, Y.; Ye, X.; Tian, D.; Linhardt, R.J.; Chen, S. A fucoidan from sea cucumber Pearsonothuria graeffei with well-repeated structure alleviates gut microbiota dysbiosis and metabolic syndromes in HFD-fed mice. Food Funct. 2018, 9, 5371–5380. [Google Scholar] [CrossRef] [PubMed]
  32. Li, S.; Li, M.; Guo, R.; Zhao, T.; Gao, X.; Li, K.; Guo, X.; Li, J.; Li, D. Fucoidans from Pearsonothuria graeffei prevent obesity by regulating intestinal lipid metabolism and inflammation related signalling pathways. Food Funct. 2022, 13, 12234–12245. [Google Scholar] [CrossRef] [PubMed]
  33. Song, S.; Cong, P.; Xu, J.; Li, G.; Liu, X.; Li, Z.; Xue, C.; Xue, Y.; Wang, Y. Absorption and pharmacokinetic study of two sulphated triterpenoid saponins in rat after oral and intravenous administration of saponin extracts of Pearsonothuria graeffei by HPLC-MS. J. Funct. Foods 2016, 25, 62–69. [Google Scholar] [CrossRef]
  34. Zhao, Q.; Xue, Y.; Wang, J.F.; Li, H.; Long, T.T.; Li, Z.; Wang, Y.M.; Dong, P.; Xue, C.H. In vitro and in vivo anti-tumour activities of echinoside A and ds-echinoside A from Pearsonothuria graeffei. J. Sci. Food Agric. 2012, 92, 965–974. [Google Scholar] [CrossRef]
  35. Hammond, A.R.; Purcell, S.W. Limited long-term movement and slow growth of the sea cucumber Pearsonothuria graeffei. Mar. Ecol. Prog. Ser. 2023, 704, 1–14. [Google Scholar] [CrossRef]
  36. Conand, C.; Gamboa, R.; Purcell, S. Pearsonothuria graeffei. The IUCN Red List of Threatened Species. 2013. Available online: https://www.researchgate.net/publication/295547237_Holothuria_scabra_The_IUCN_Red_List_of_Threatened_Species_2013_eT180257A1606648 (accessed on 15 March 2013).
  37. Mangubhai, S.; Lalavanua, W.; Purcell, S. Fiji’s Sea Cucumber Fishery: Advances in Science; Report No. 01/17; Wildlife Conservation Society: Suva, Fiji, 2017. [Google Scholar]
  38. Toral-Granda, V.; Lovatelli, A.; Vasconcellos, M. Sea Cucumbers. A Global Review on Fishery and Trade; FAO Fisheries Technical Paper No. 516; FAO: Rome, Italy, 2008. [Google Scholar]
  39. Pakoa, K.; Saladrau, W.; Lalavanua, W.; Valotu, D.; Tuinasavusavu, I.; Sharp, M.; Bertram, I. Status of Sea Cucumber Resources and Fisheries Management in Fiji; Secretariat of the Pacific Community: Noumea, New Caledonia, 2013. [Google Scholar]
  40. Carleton, C.; Hambrey, J.; Govan, H.; Medley, P.; Kinch, J. Effective management of sea cucumber fisheries and the beche-de-mer trade in Melanesia. SPC Fish. Newsl. 2013, 140, 24–42. [Google Scholar]
  41. Czechura, G. The Great Barrier Reef: A Queensland Museum Discovery Guide; Queensland Museum: Brisbane, Australia, 2013.
  42. Waterson, P.; Waghorn, A.; Swartz, J.; Brown, R. What’s in a name? Beyond the Mary Watson stories to a historical archaeology of Lizard Island. Int. J. Hist. Archaeol. 2013, 17, 590–612. [Google Scholar] [CrossRef]
  43. Purcell, S.W.; Piddocke, T.P.; Dalton, S.J.; Wang, Y.-G. Movement and growth of the coral reef holothuroids Bohadschia argus and Thelenota ananas. Mar. Ecol. Prog. Ser. 2016, 551, 201–214. [Google Scholar] [CrossRef]
  44. Siddique, S.; Ayub, Z. To estimate growth function by the use of SLW index in the sea cucumber Holothuria arenicola (Holothuroidea: Echinodermata) of Pakistan (Northern Arabian Sea). Thalassas 2019, 35, 123–132. [Google Scholar] [CrossRef]
  45. Froese, R.; Tsikliras, A.C.; Stergiou, K.I. Editorial note on weight–length relations of fishes. Acta Ichthyol. Piscat. 2011, 41, 261–263. [Google Scholar] [CrossRef]
  46. Mustagfirin, M.; Wijayanti, D.P.; Subagiyo, S. Reproductive activity and morphometric assessment of three commercial species of sea cucumber (Echinodermata) from Karimunjawa National Park, Indonesia. Biodiversitas 2021, 22, 29. [Google Scholar] [CrossRef]
  47. Kinch, J.; Purcell, S.; Uthicke, S.; Friedman, K. Population status, fisheries and trade of sea cucumbers in the Western Central Pacific. In Sea Cucumbers: A Global Review of Fisheries and Trade; FAO Fisheries and Aquaculture Technical Paper No. 516; Toral-Granda, V., Lovatelli, A., Vasconcellos, M., Eds.; FAO: Rome, Italy, 2008; pp. 7–55. [Google Scholar]
  48. Yang, J.-F.; Gao, R.-C.; Wu, H.-T.; Li, P.-F.; Hu, X.-S.; Zhou, D.-Y.; Zhu, B.-W.; Su, Y.-C. Analysis of apoptosis in ultraviolet-induced sea cucumber (Stichopus japonicus) melting using terminal deoxynucleotidyl-transferase-mediated dUTP nick end-labeling assay and cleaved caspase-3 immunohistochemistry. J. Agr. Food Chem. 2015, 63, 9601–9608. [Google Scholar] [CrossRef] [PubMed]
  49. Ahmed, Q.; Alicia, P.-S.; Ali, Q.M.; Levent, B. Seasonal variation in the length-weight relationships and condition factor of four commercially important sea cucumbers species from Karachi Coast-Northern Arabian Sea. NESciences 2018, 3, 265–281. [Google Scholar] [CrossRef]
  50. Siddique, S.; Ayub, Z.; Siddiqui, G. Length-weight relationship and condition factor in Holothuria arenicola (Holothuroidea: Echinodermata) found on two rocky coasts of Karachi, Pakistan. Pak. J. Mar. Sci. 2014, 23, 51–63. [Google Scholar]
  51. Uthicke, S. Spawning observations from the Lizard Island Area. SPC Beche-de-Mer Inf. Bull. 1994, 6, 12–14. [Google Scholar]
  52. Vail, L.; Hoggett, A. Pearsonothuria graeffei. Available online: http://lifg.australianmuseum.net.au/Group.html?groupId=JRWUPmov (accessed on 20 September 2022).
Figure 1. (a) Map showing location of Lizard Island off northern Australia. (b) The Lizard Island group. (c) Aerial photograph of the reef and lagoon between Palfrey and South Islands, showing the study site (rectangle). (d) The lead author measuring the width of a Pearsonothuria graeffei individual in situ with a measuring tape. (e) An individual P. graeffei being drained on the deck of the boat for 5 min before being weighed. Labels kept with the animals (pictured) ensured correct matching of data of body measurements in situ with body weights taken on the vessel.
Jmse 12 00371 g001
Figure 2. Size distributions of Pearsonothuria graeffei found at Lizard Island in 2021 (n = 139). (a) Length–frequency histogram; (b) weight–frequency histogram. Numbers preceded by a parenthesis are excluded from the size class bin, while those followed by a bracket are included.
Jmse 12 00371 g002
Figure 3. Relationships between body weight and (a) observed body length, (b) recalculated body length (Le), (c) body basal area, and (d) SLW (square root of observed length multiplied by width) of 139 Pearsonothuria graeffei at Lizard Island, Australia, in 2021, including comparisons with populations in New Caledonia [18] and the Philippines [24] (a). Le calculated from the equation Le = 2.35 × SLW − 2.28. Blue dashed lines are 95 % confidence intervals of the fitted curve.
Jmse 12 00371 g003
Figure 4. Relationship between recalculated body length (Le) and relative condition (Kn) of 139 Pearsonothuria graeffei individuals at Lizard Island, Australia, in February 2021. The black line is the quadratic line of best fit, Kn = −0.0034 × Le2 − 0.0792 × Le − 1.0986; dashed blue lines are 95% confidence intervals.
Jmse 12 00371 g004
Table 1. Mean and coefficient of variation (CV) of various body size measurements and their relationships with body weight for 139 Pearsonothuria graeffei at Lizard Island, QLD, using the standard growth function: y = axb, where y is the body weight (g), and x is the observed length (cm), recalculated length (Le) derived from SLW (cm), SLW index, or basal area (cm2).
Relationship with Body Weight
Body MeasurementMean (±SD)CVabpr2
Basal area (cm2)186.8 (40.0)21.413.90.75<0.0010.51
SLW15.3 (1.6)10.711.61.51<0.0010.52
Observed length (cm)33.7 (4.9)14.753.30.74<0.0010.23
Le from SLW (cm)33.7 (3.9)11.64.91.41<0.0010.52
Body weight (g)709 (162)22.9
Disclaimer/Publisher’s Note: The statements, opinions and data contained in all publications are solely those of the individual author(s) and contributor(s) and not of MDPI and/or the editor(s). MDPI and/or the editor(s) disclaim responsibility for any injury to people or property resulting from any ideas, methods, instructions or products referred to in the content.

