
In-Line Inspection (ILI) Techniques for Subsea Pipelines: State-of-the-Art

 ,
,  , ,
, ,  and
and
Abstract
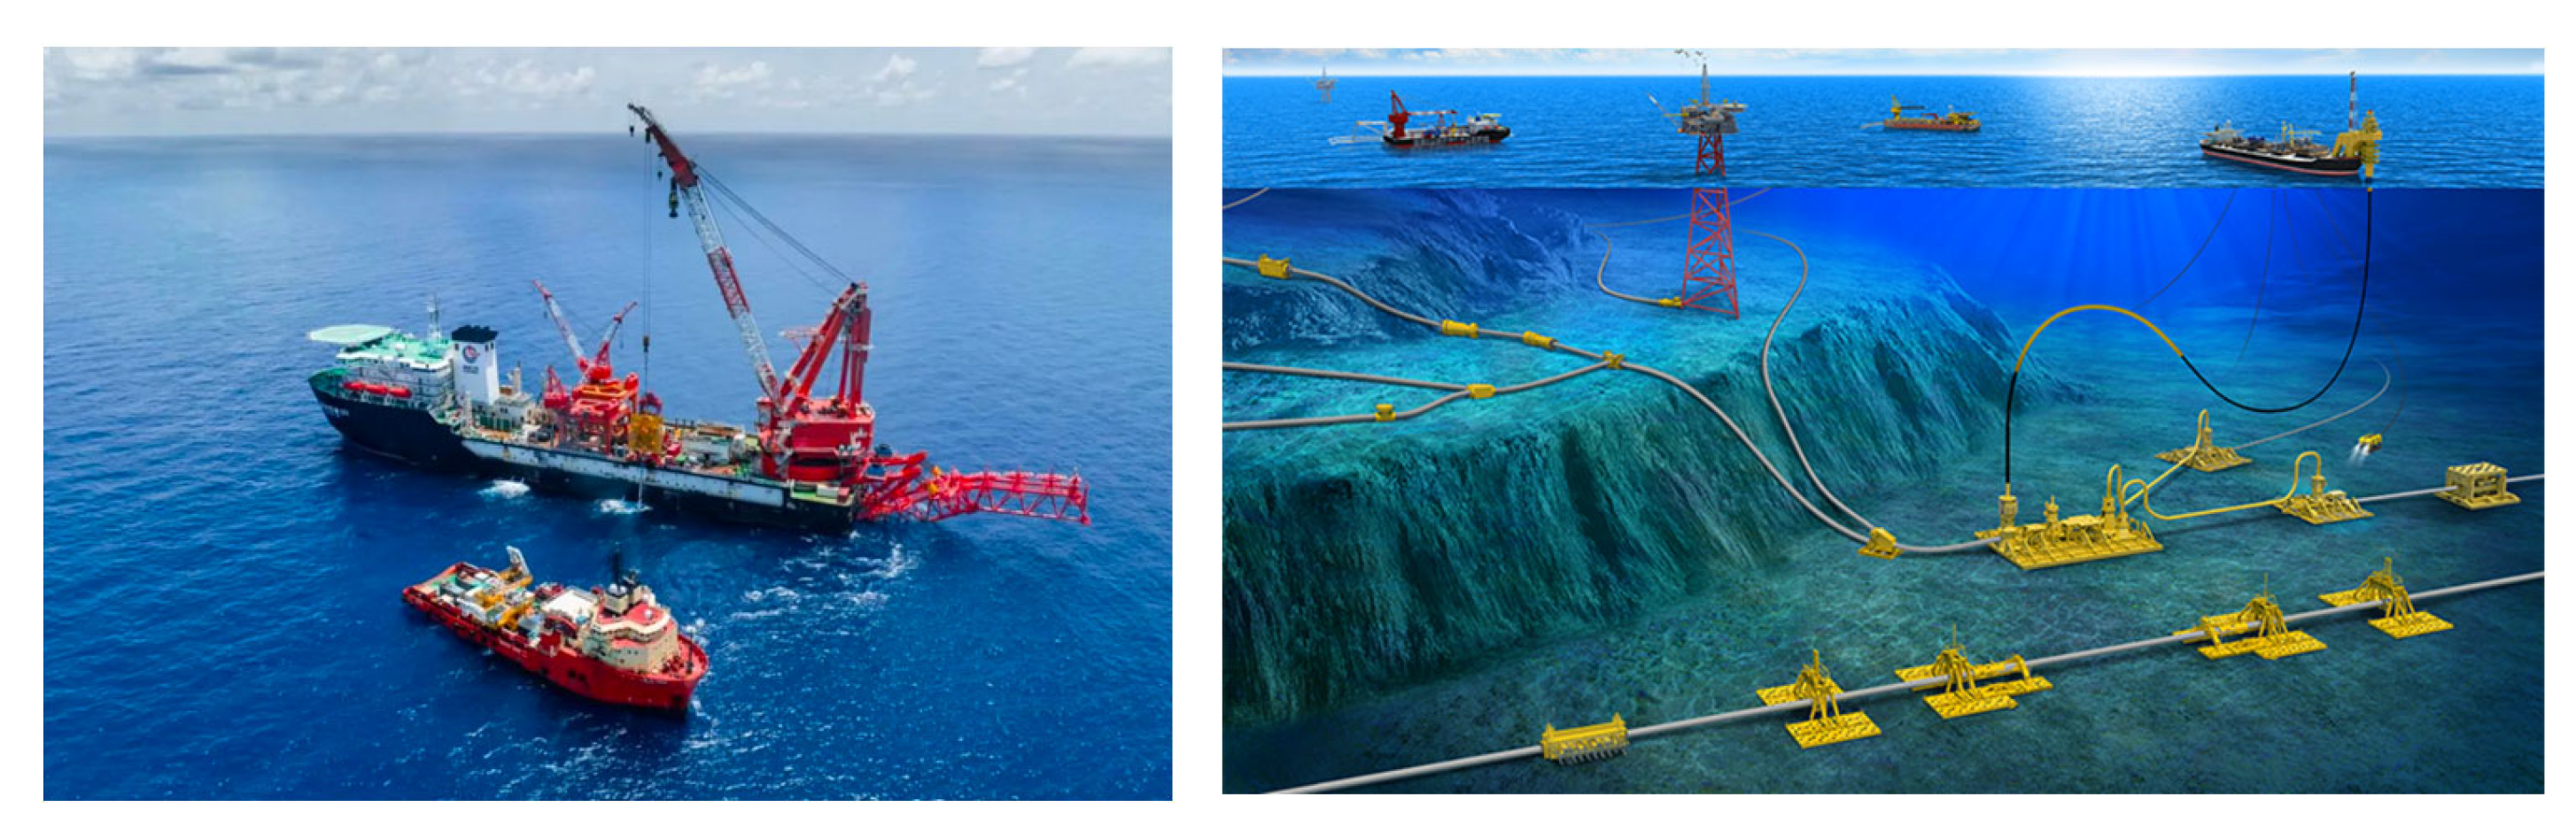
1. Introduction
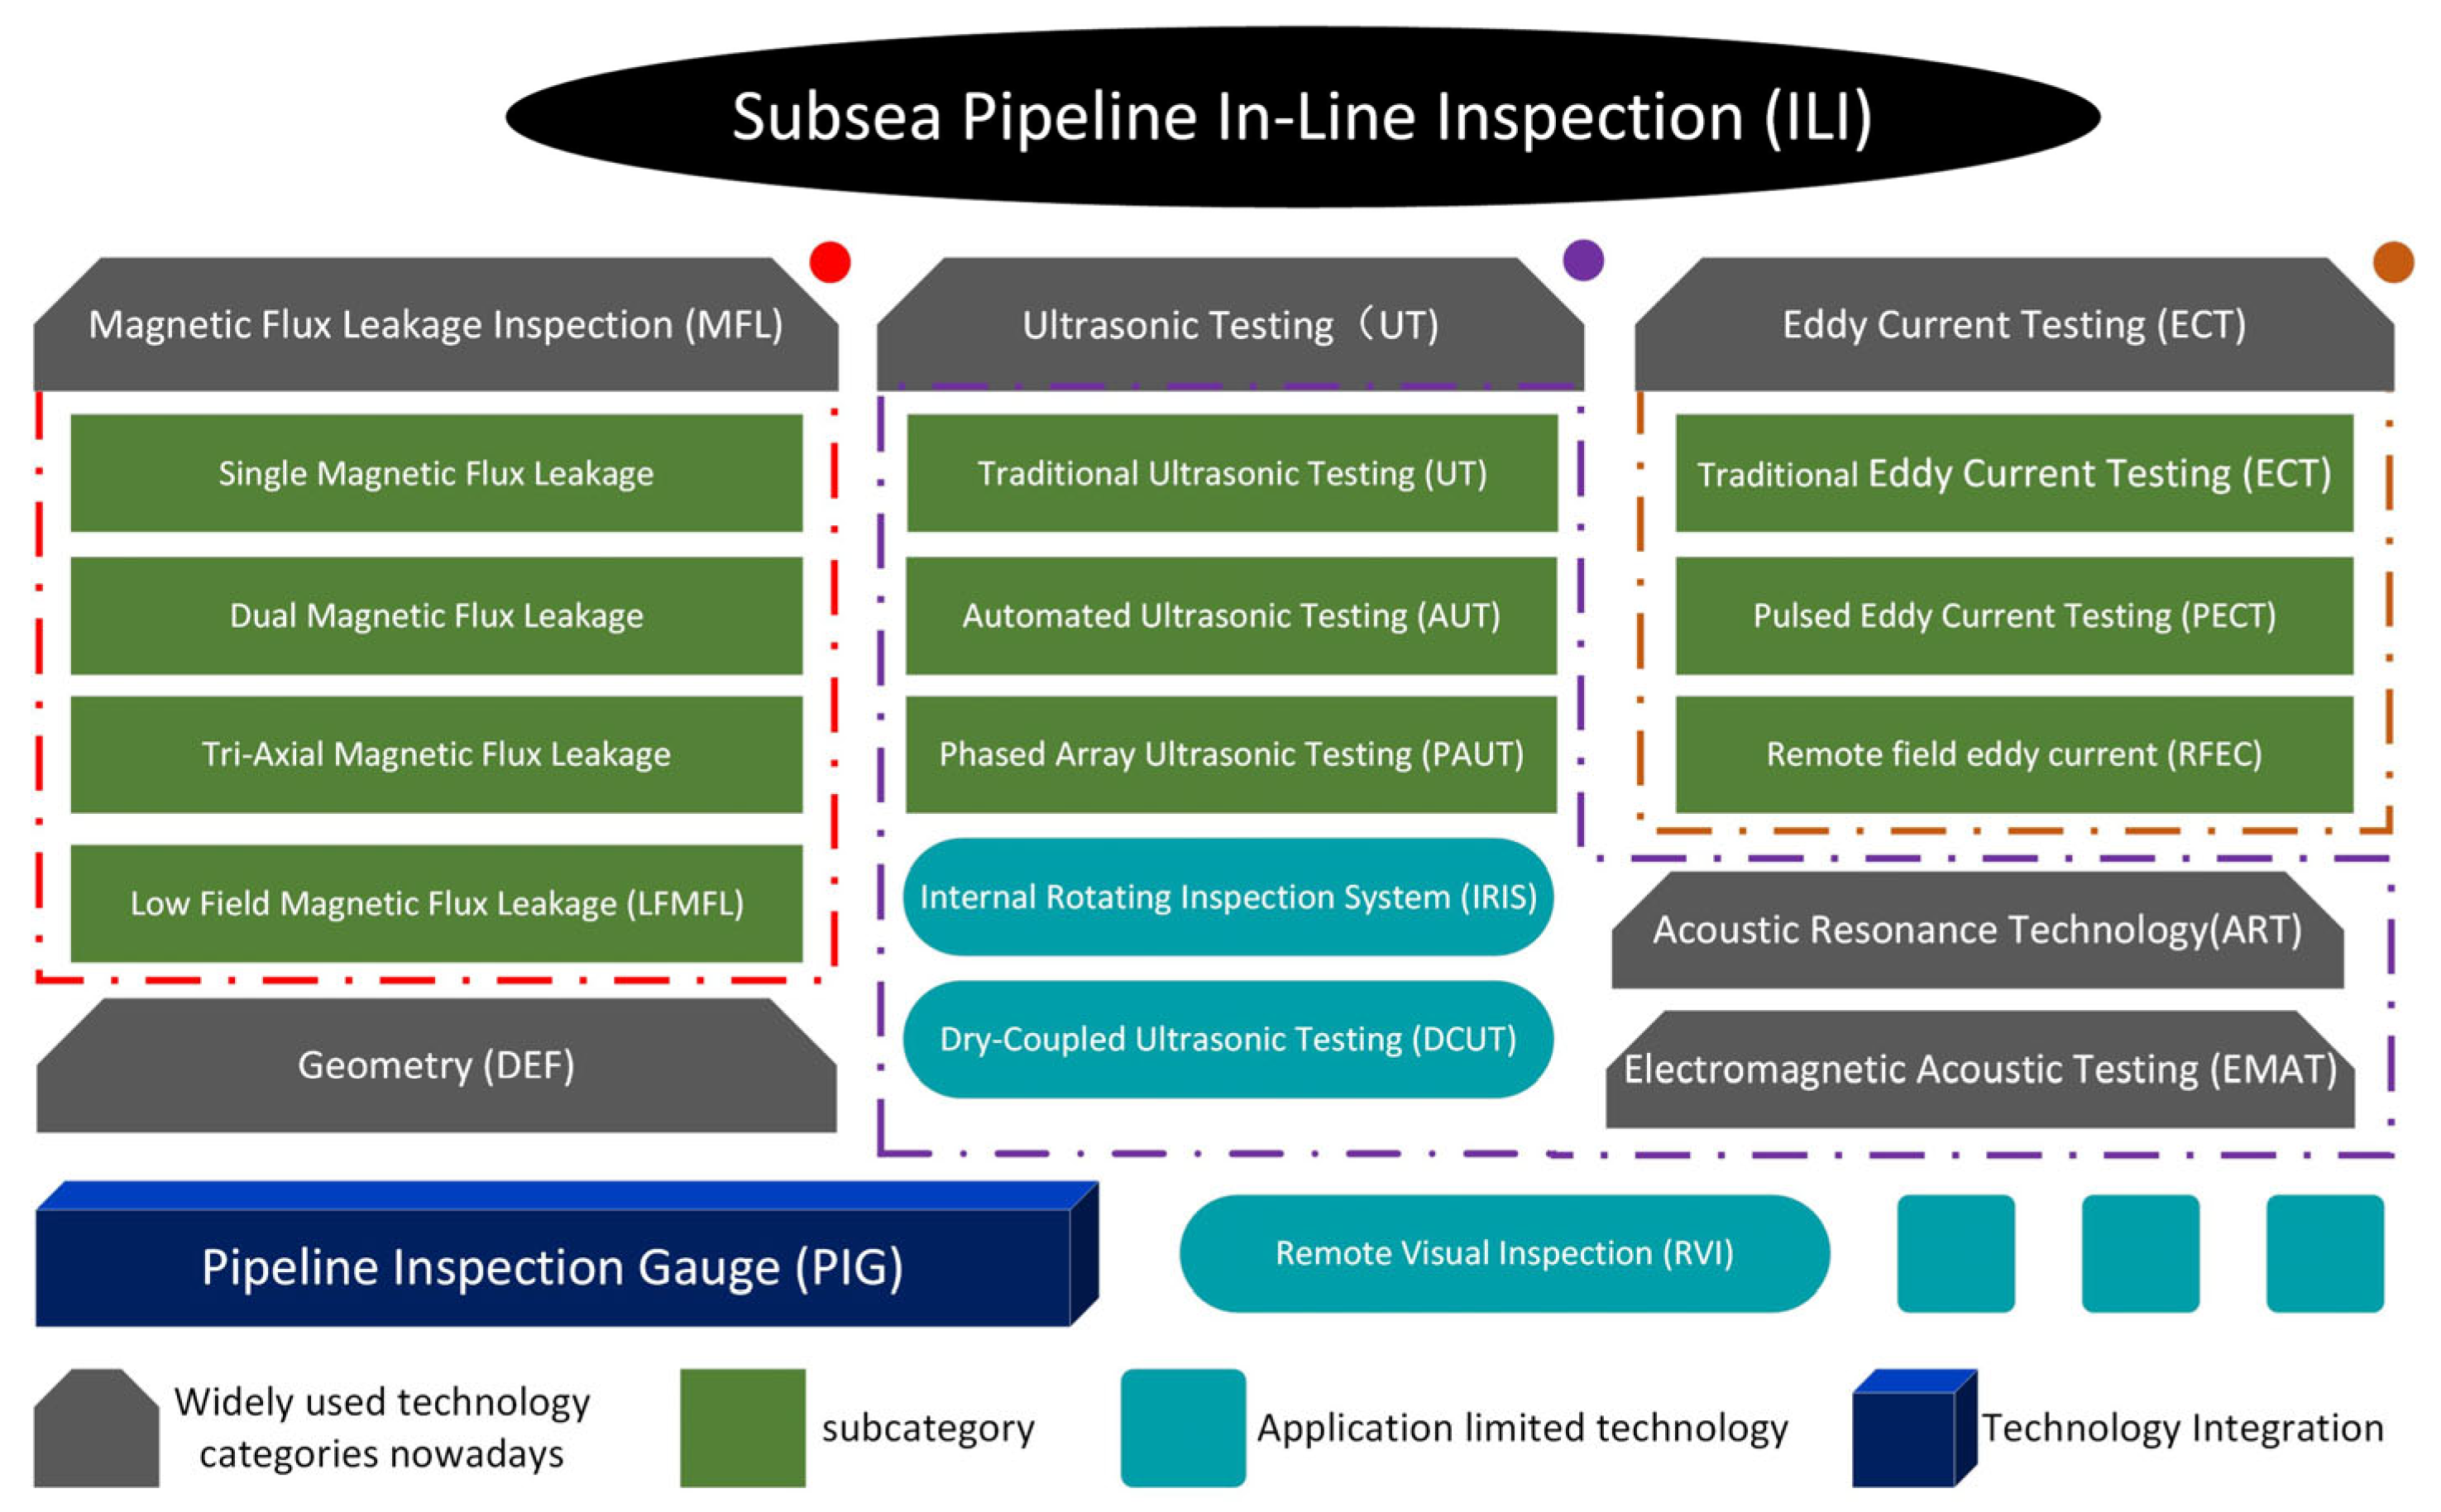
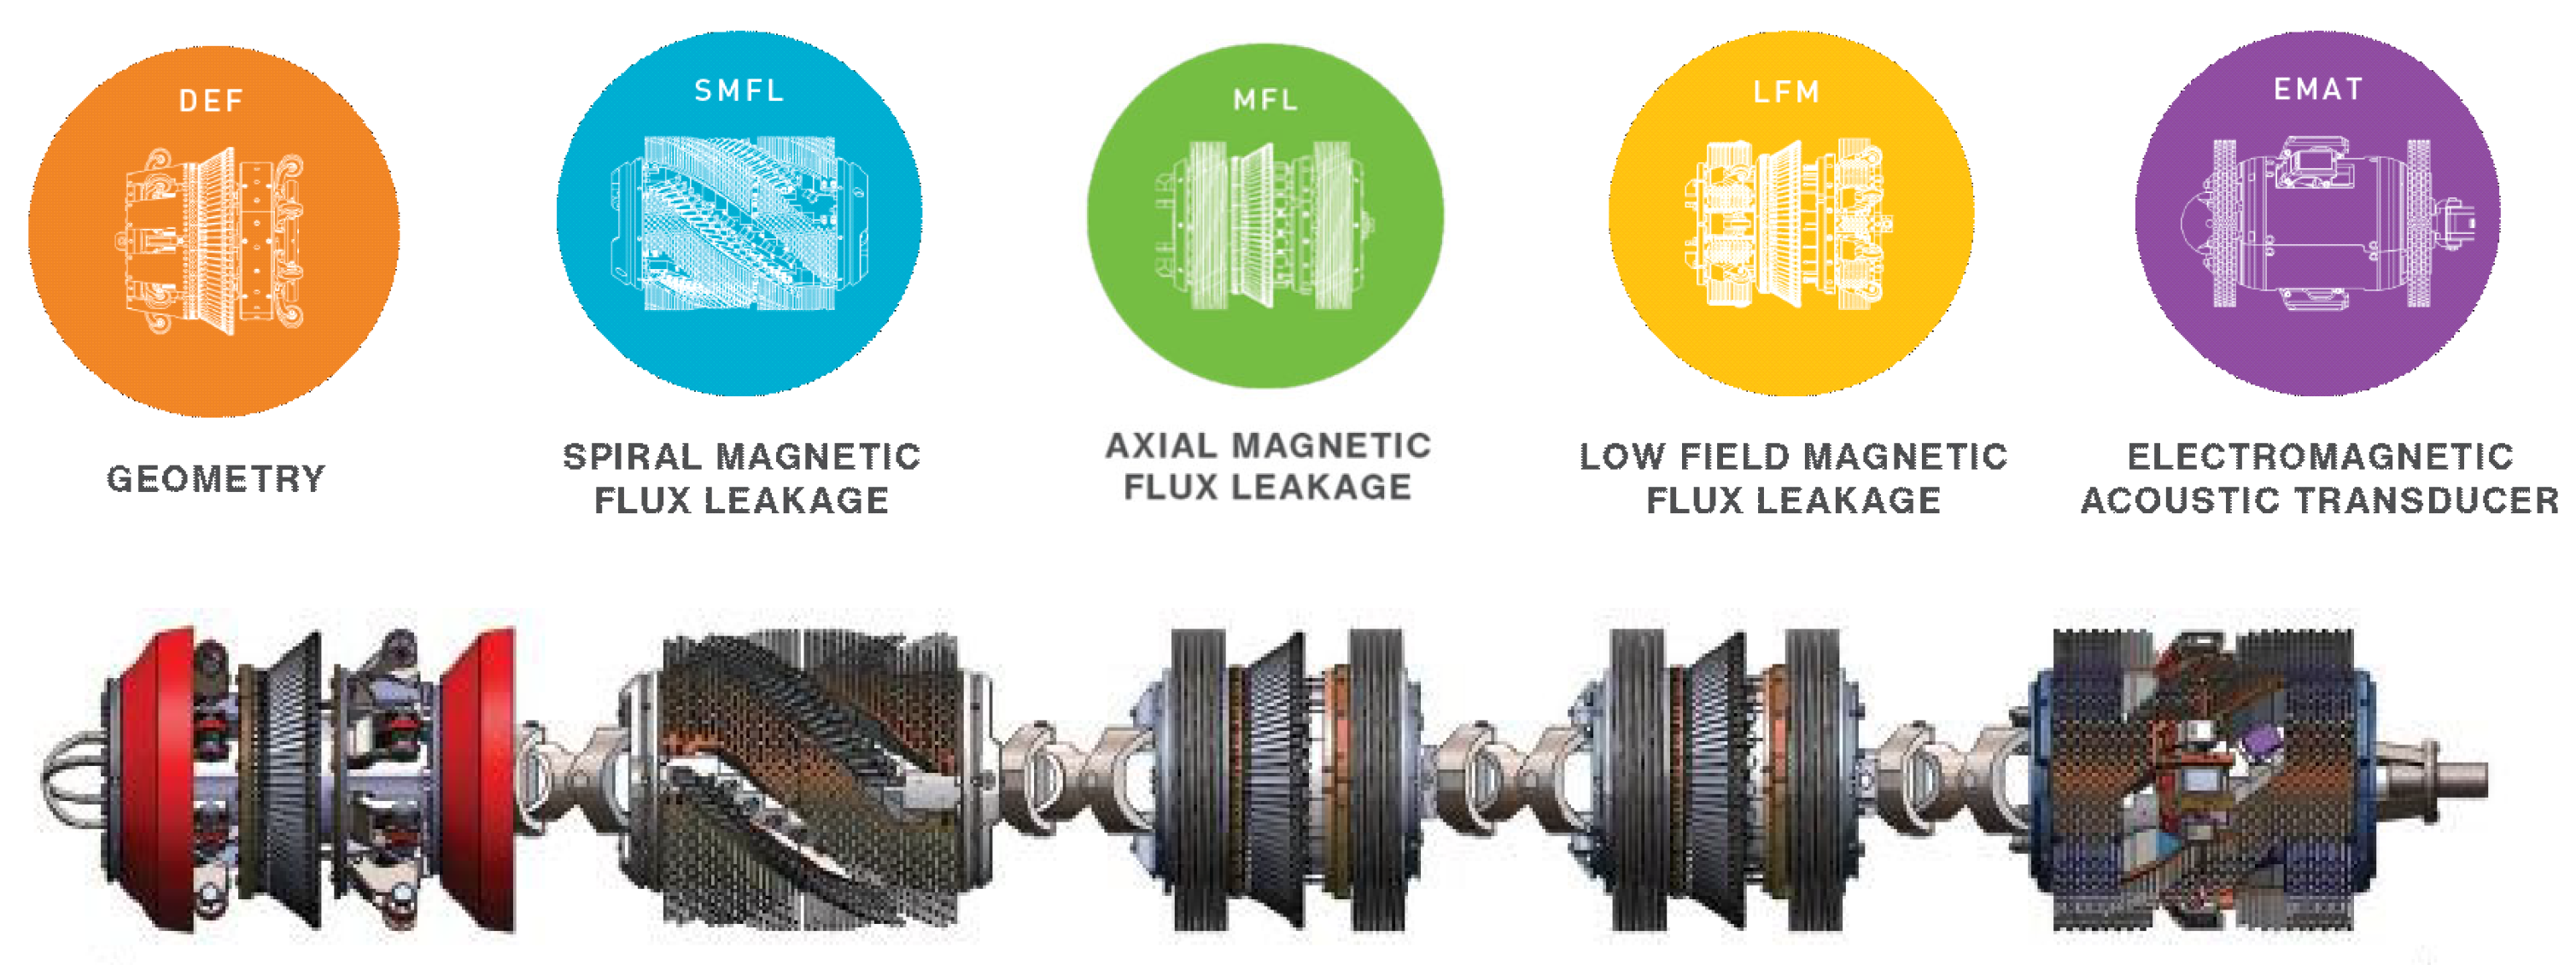
2. Existing Commonly Used ILI Technologies
2.1. Geometry Deformation Mapping (DEF)
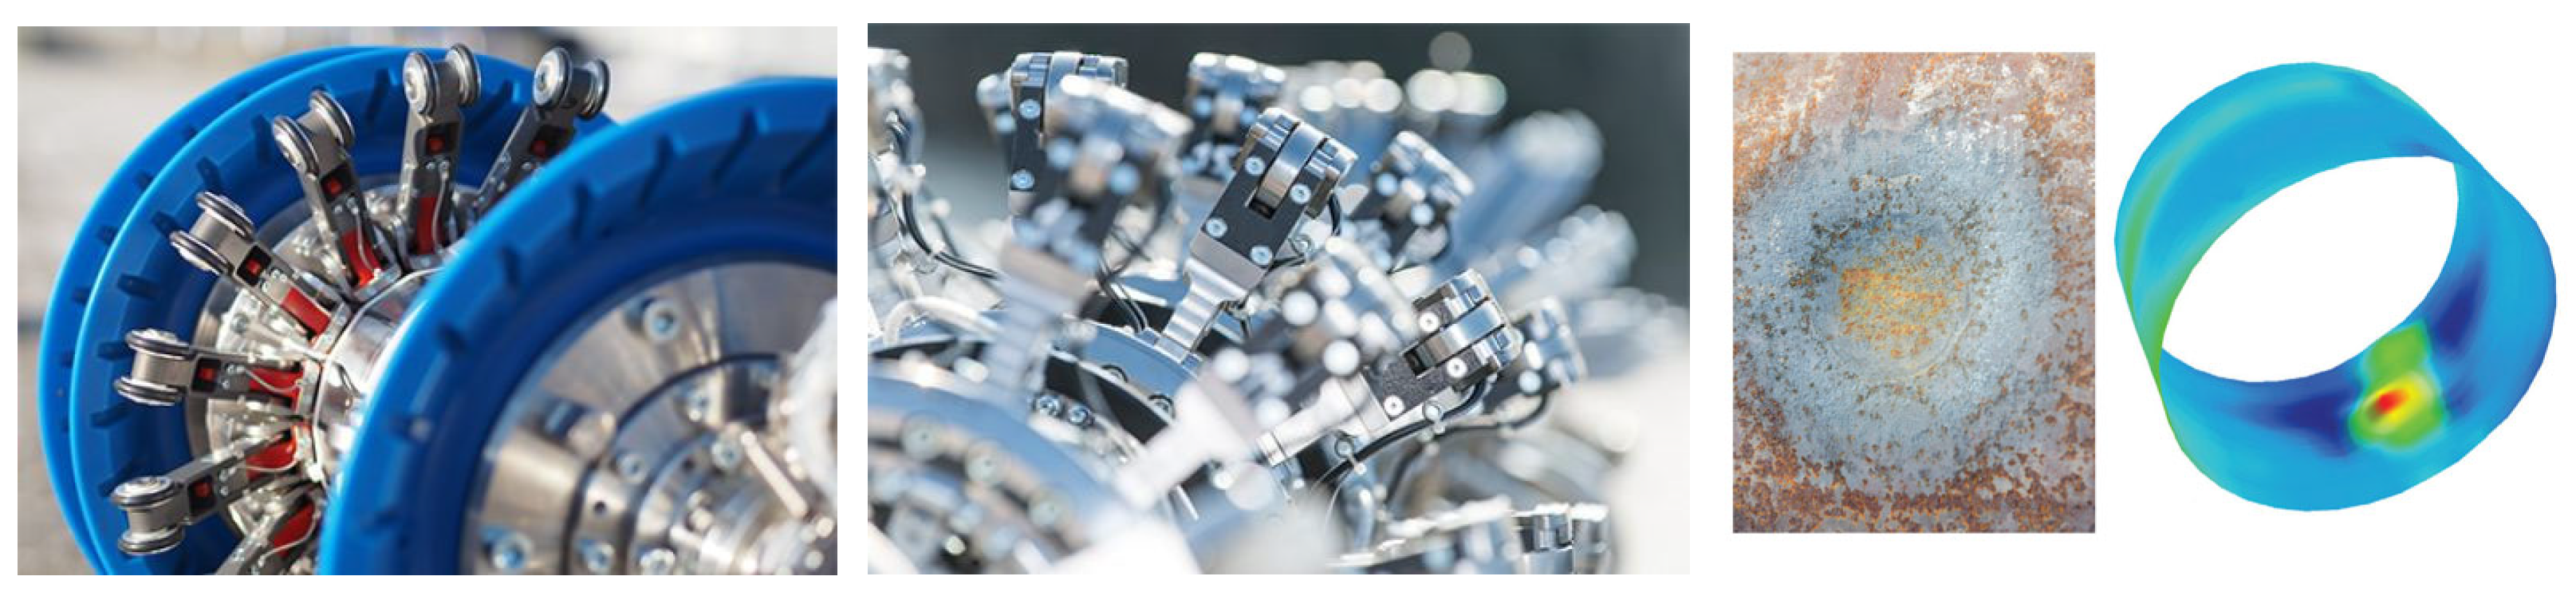
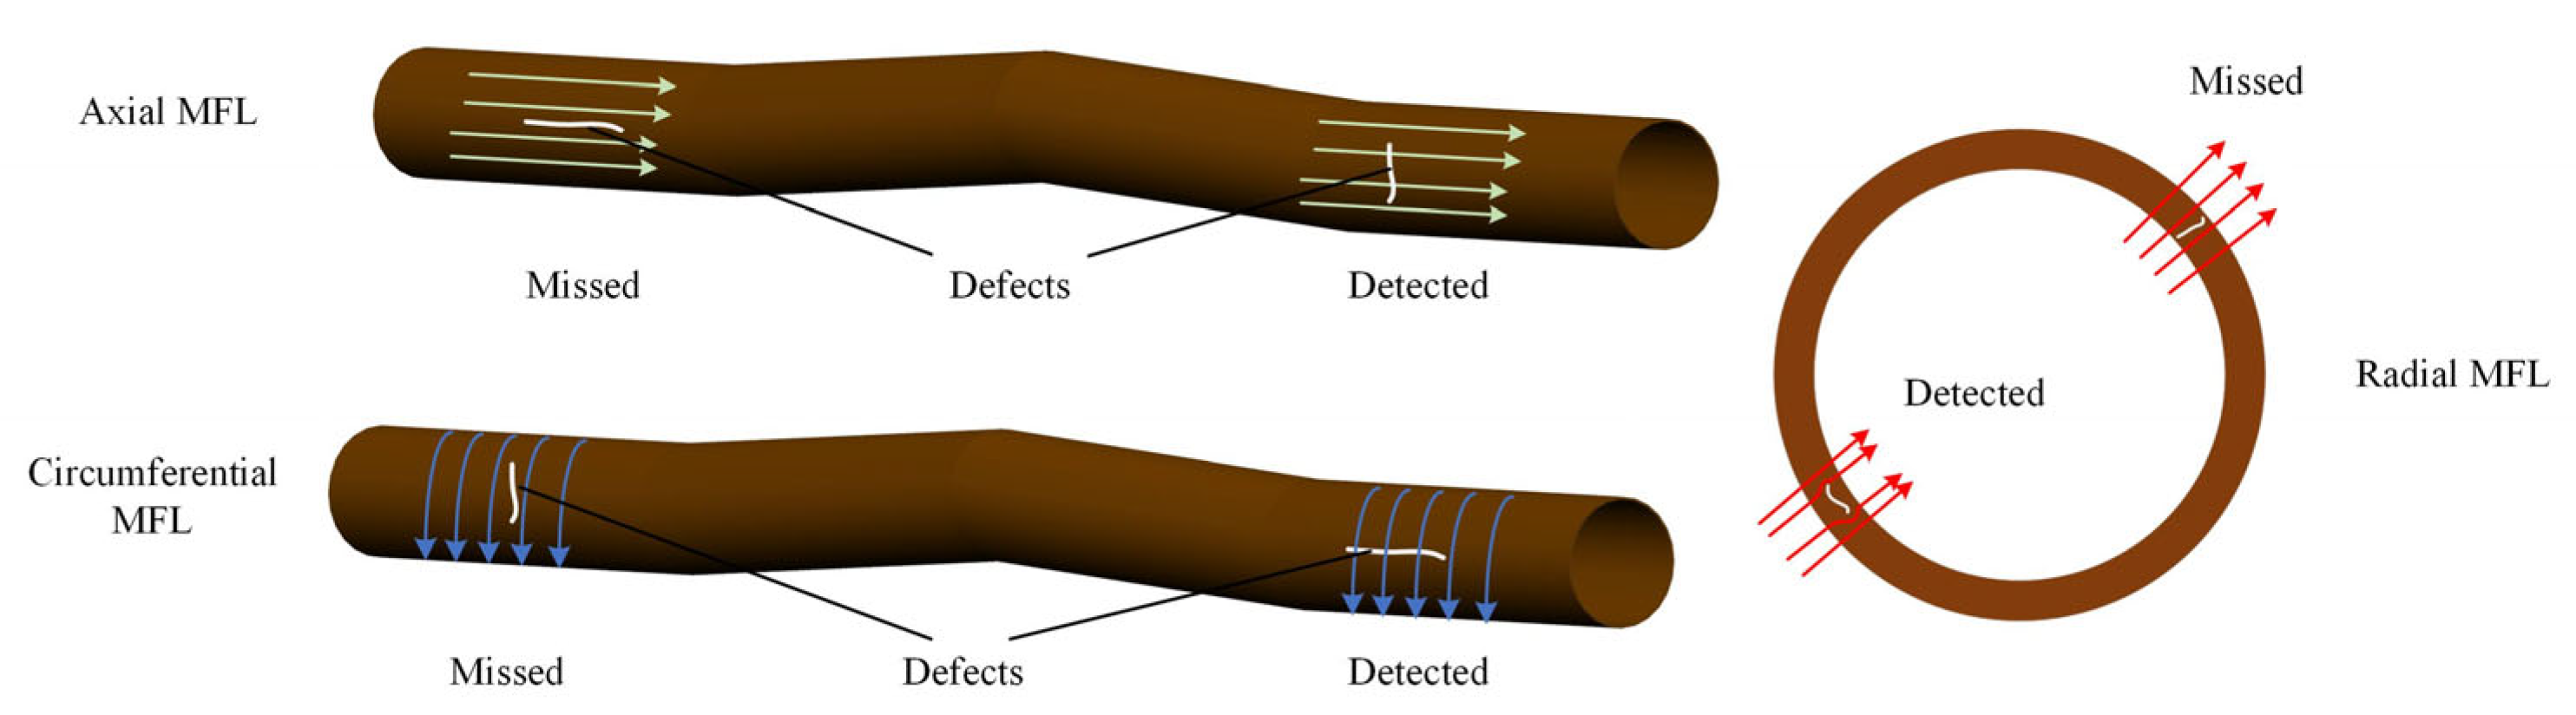
2.2. Magnetic Flux Leakage (MFL)
2.3. Ultrasonic Testing (UT)
- Conventional UT/Automated Ultrasonic Testing (AUT)
- Phased Array Ultrasonic Testing (PAUT)
2.4. Eddy Current Testing (ECT)
- Conventional ECT
- Pulsed Eddy Current Testing (PECT)
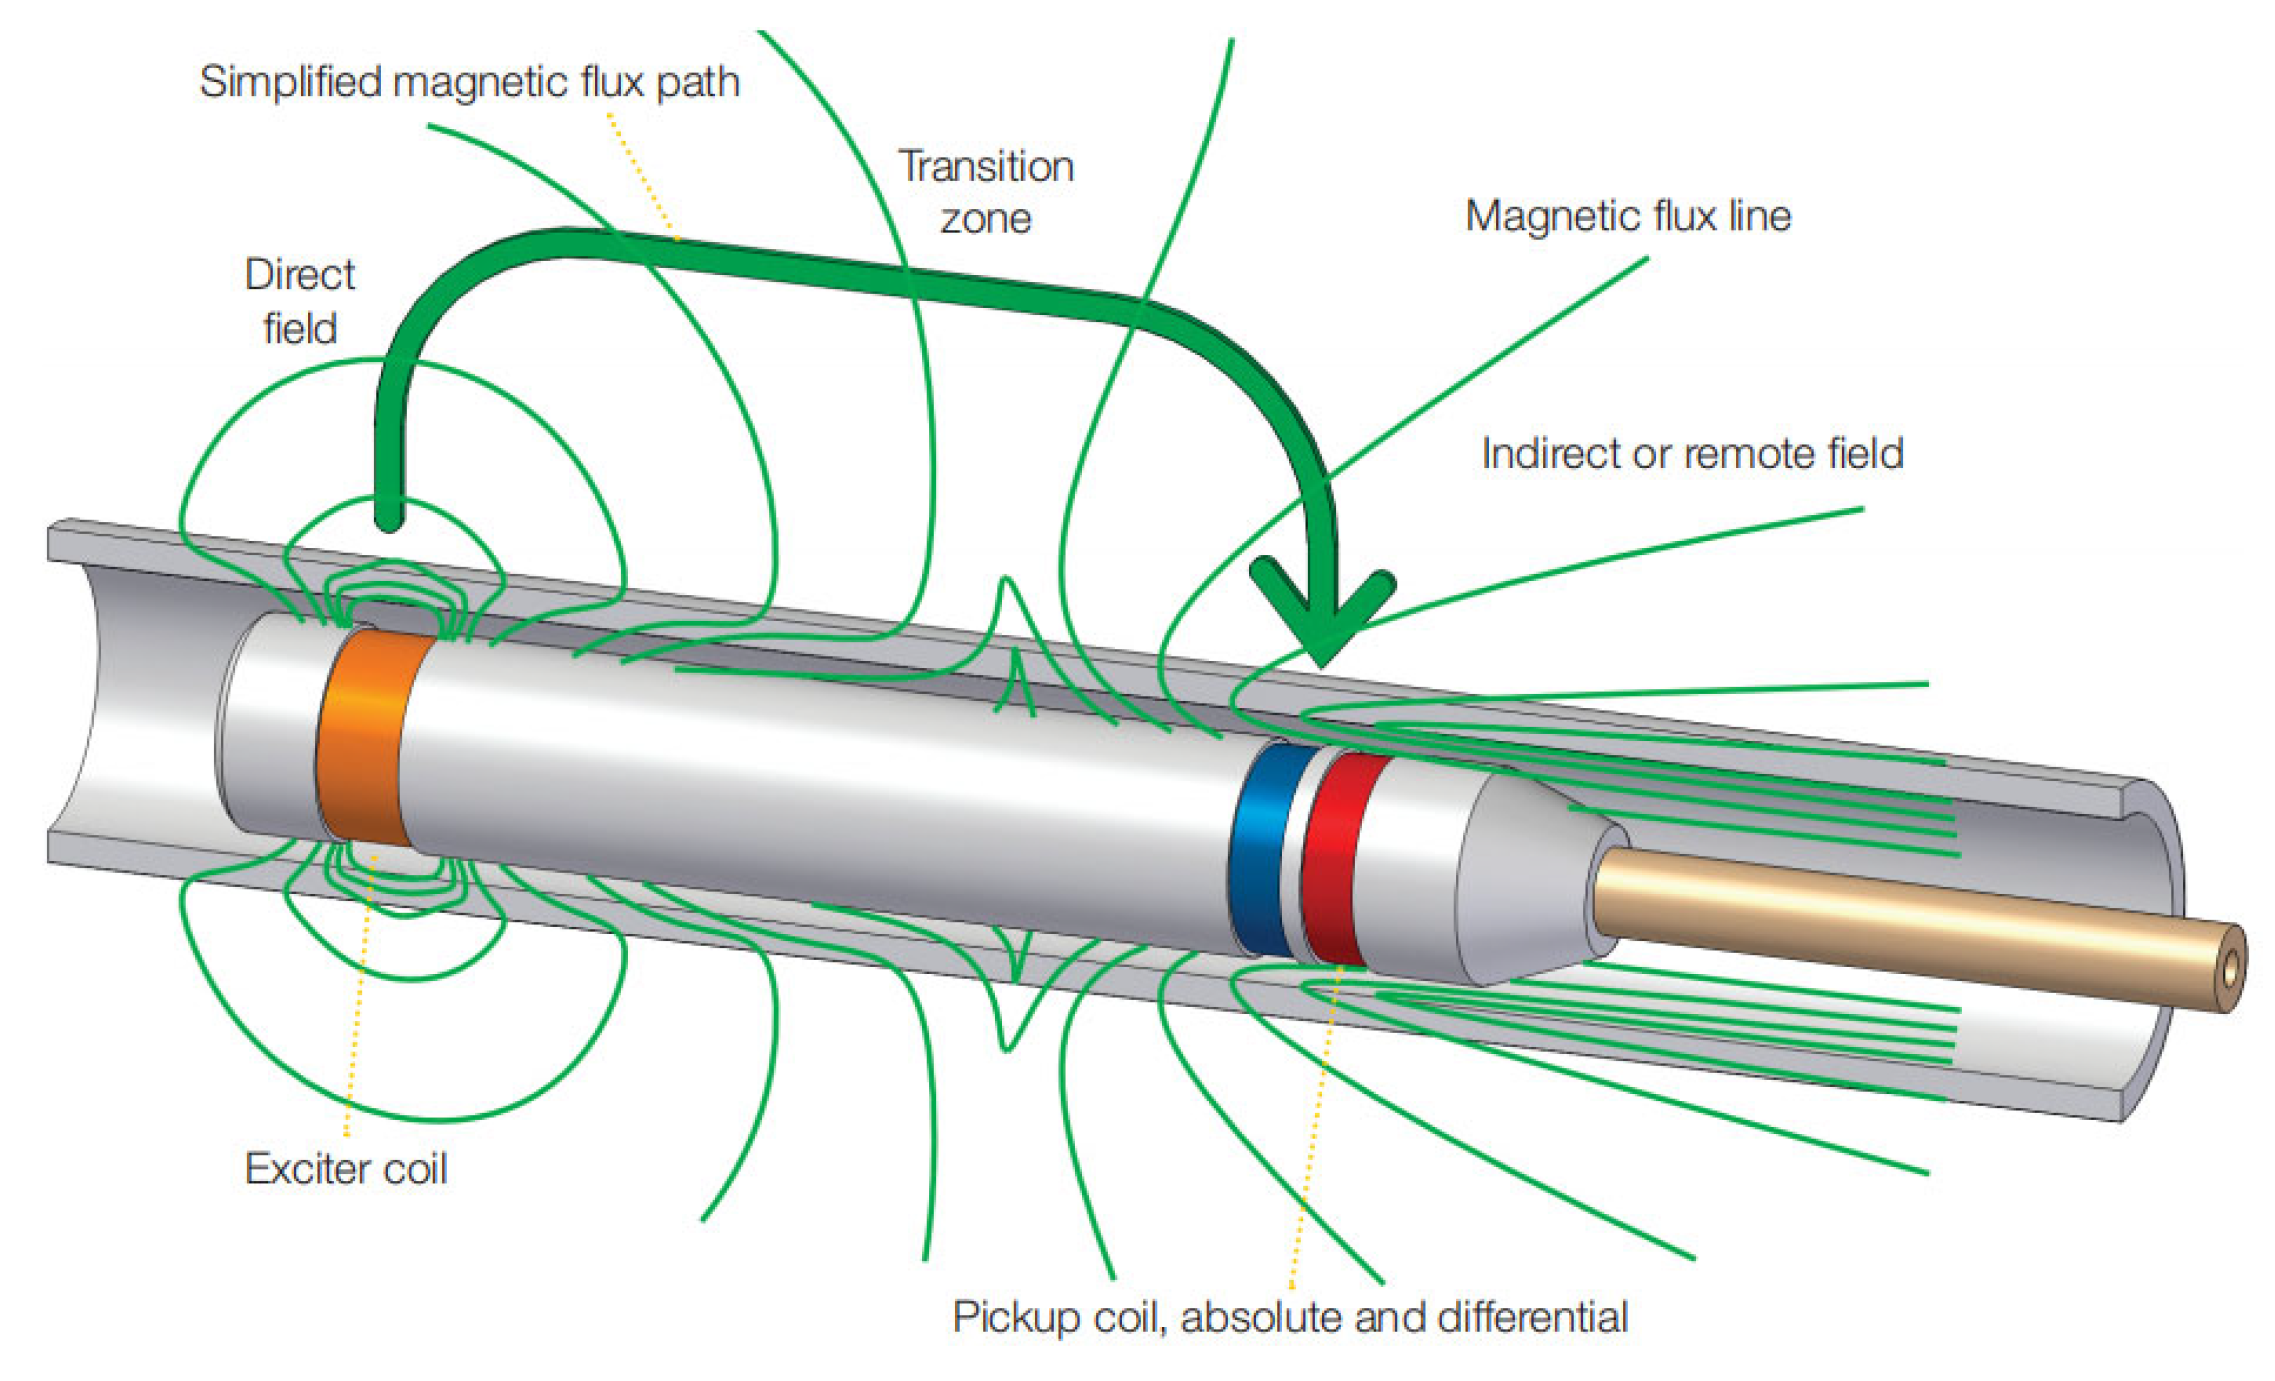
- Remote Field Eddy Current Testing (RFEC)
- Pipelines with internal rust, scaling, or significant wax buildup.
- Pipelines containing bends with small radii, tees, and reducers.
- Lined pipes (cement, high-density polyethylene, clay).
- Cast iron pipelines with nodularity.
2.5. Electromagnetic Acoustic Transducer (EMAT)
2.6. Acoustic Resonance Technology (ART)
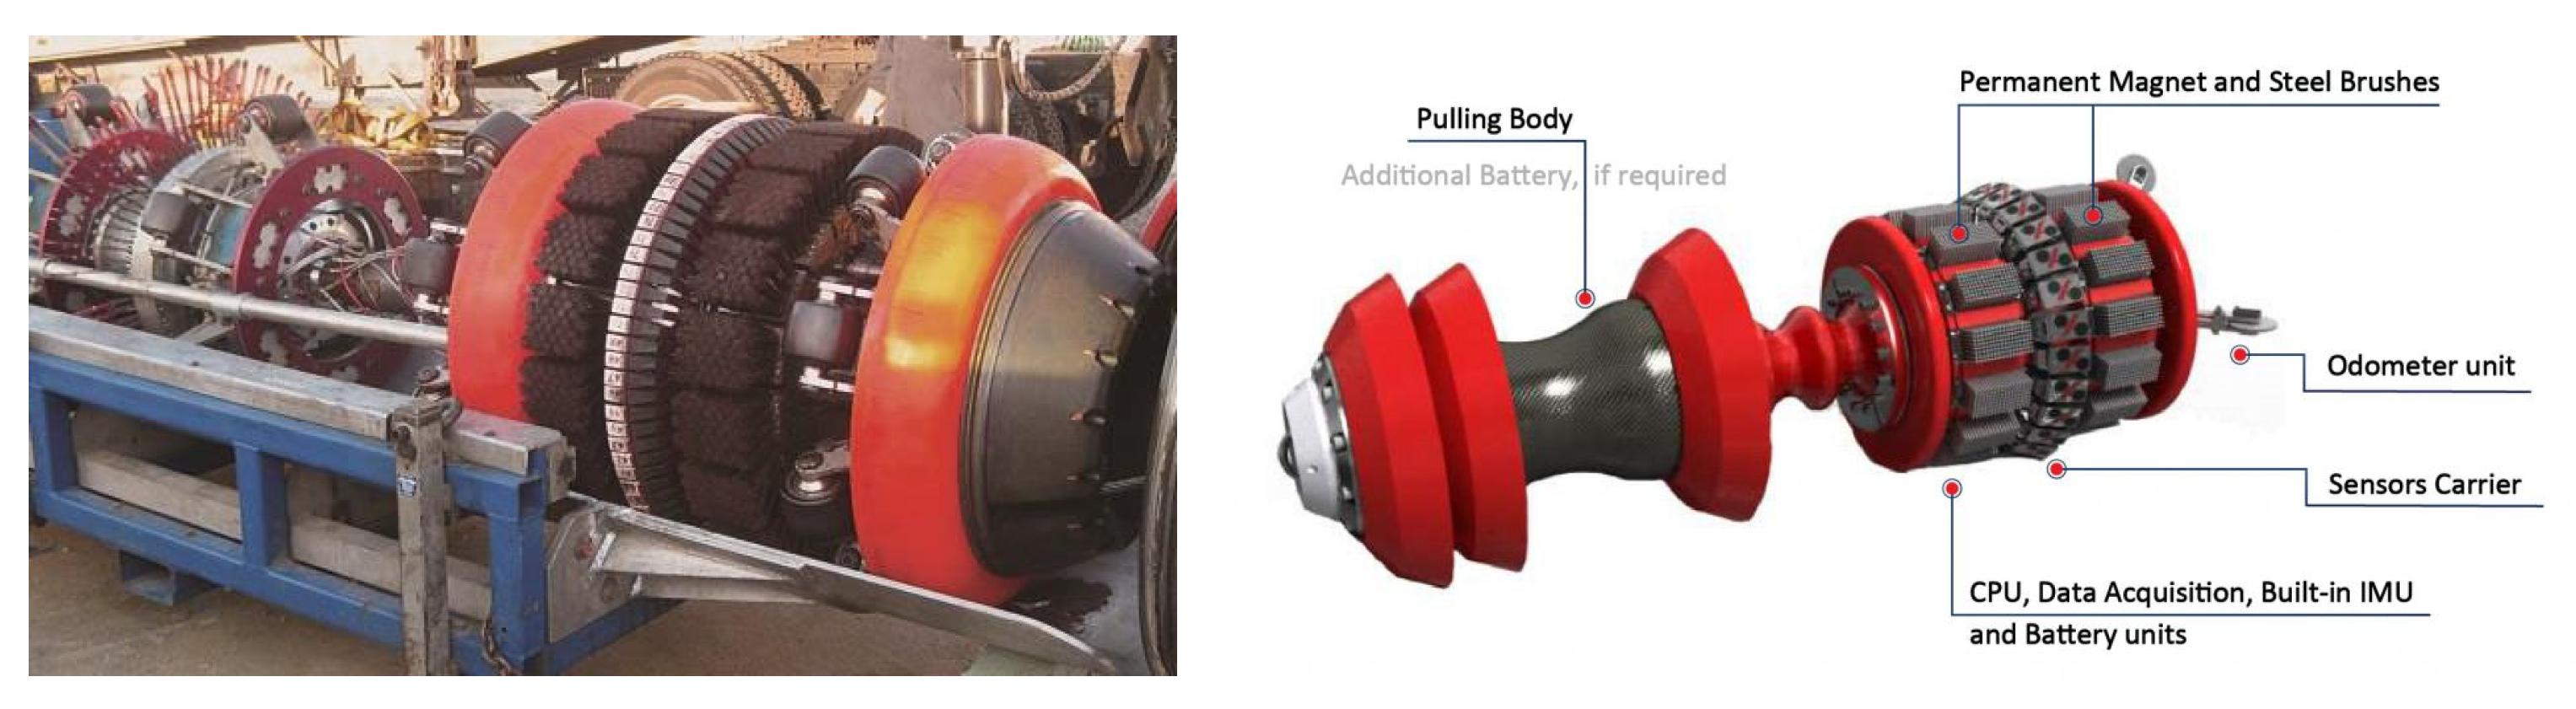
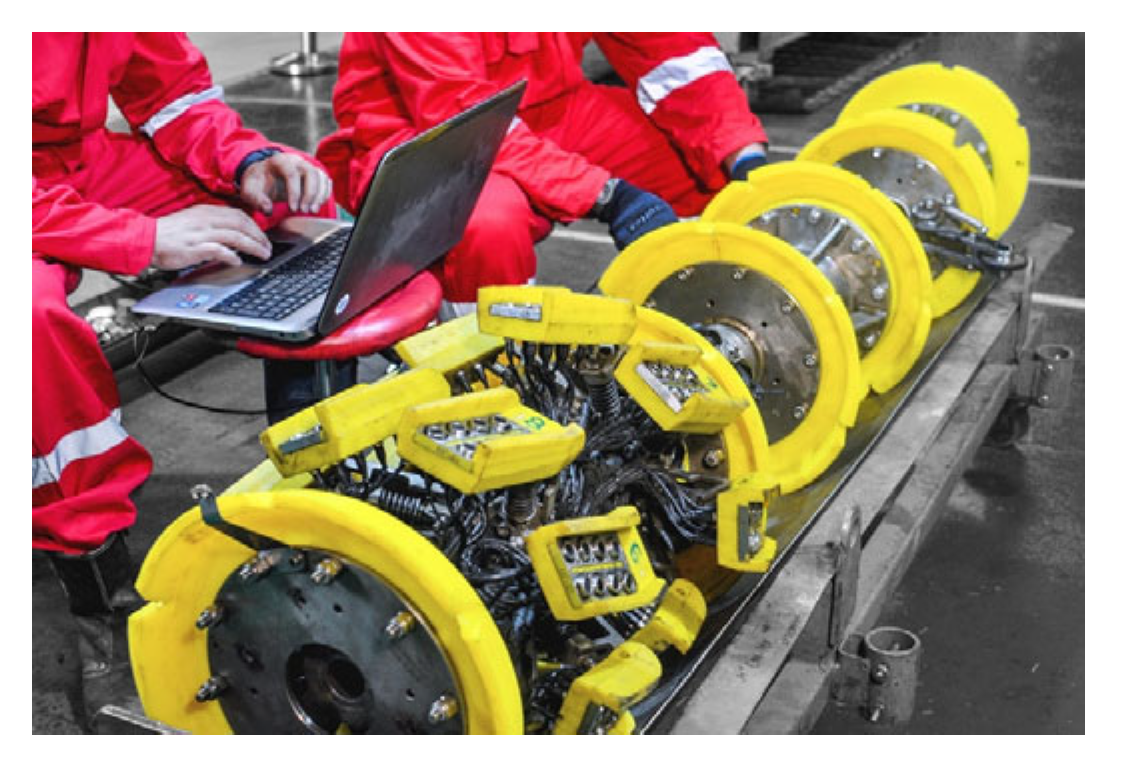
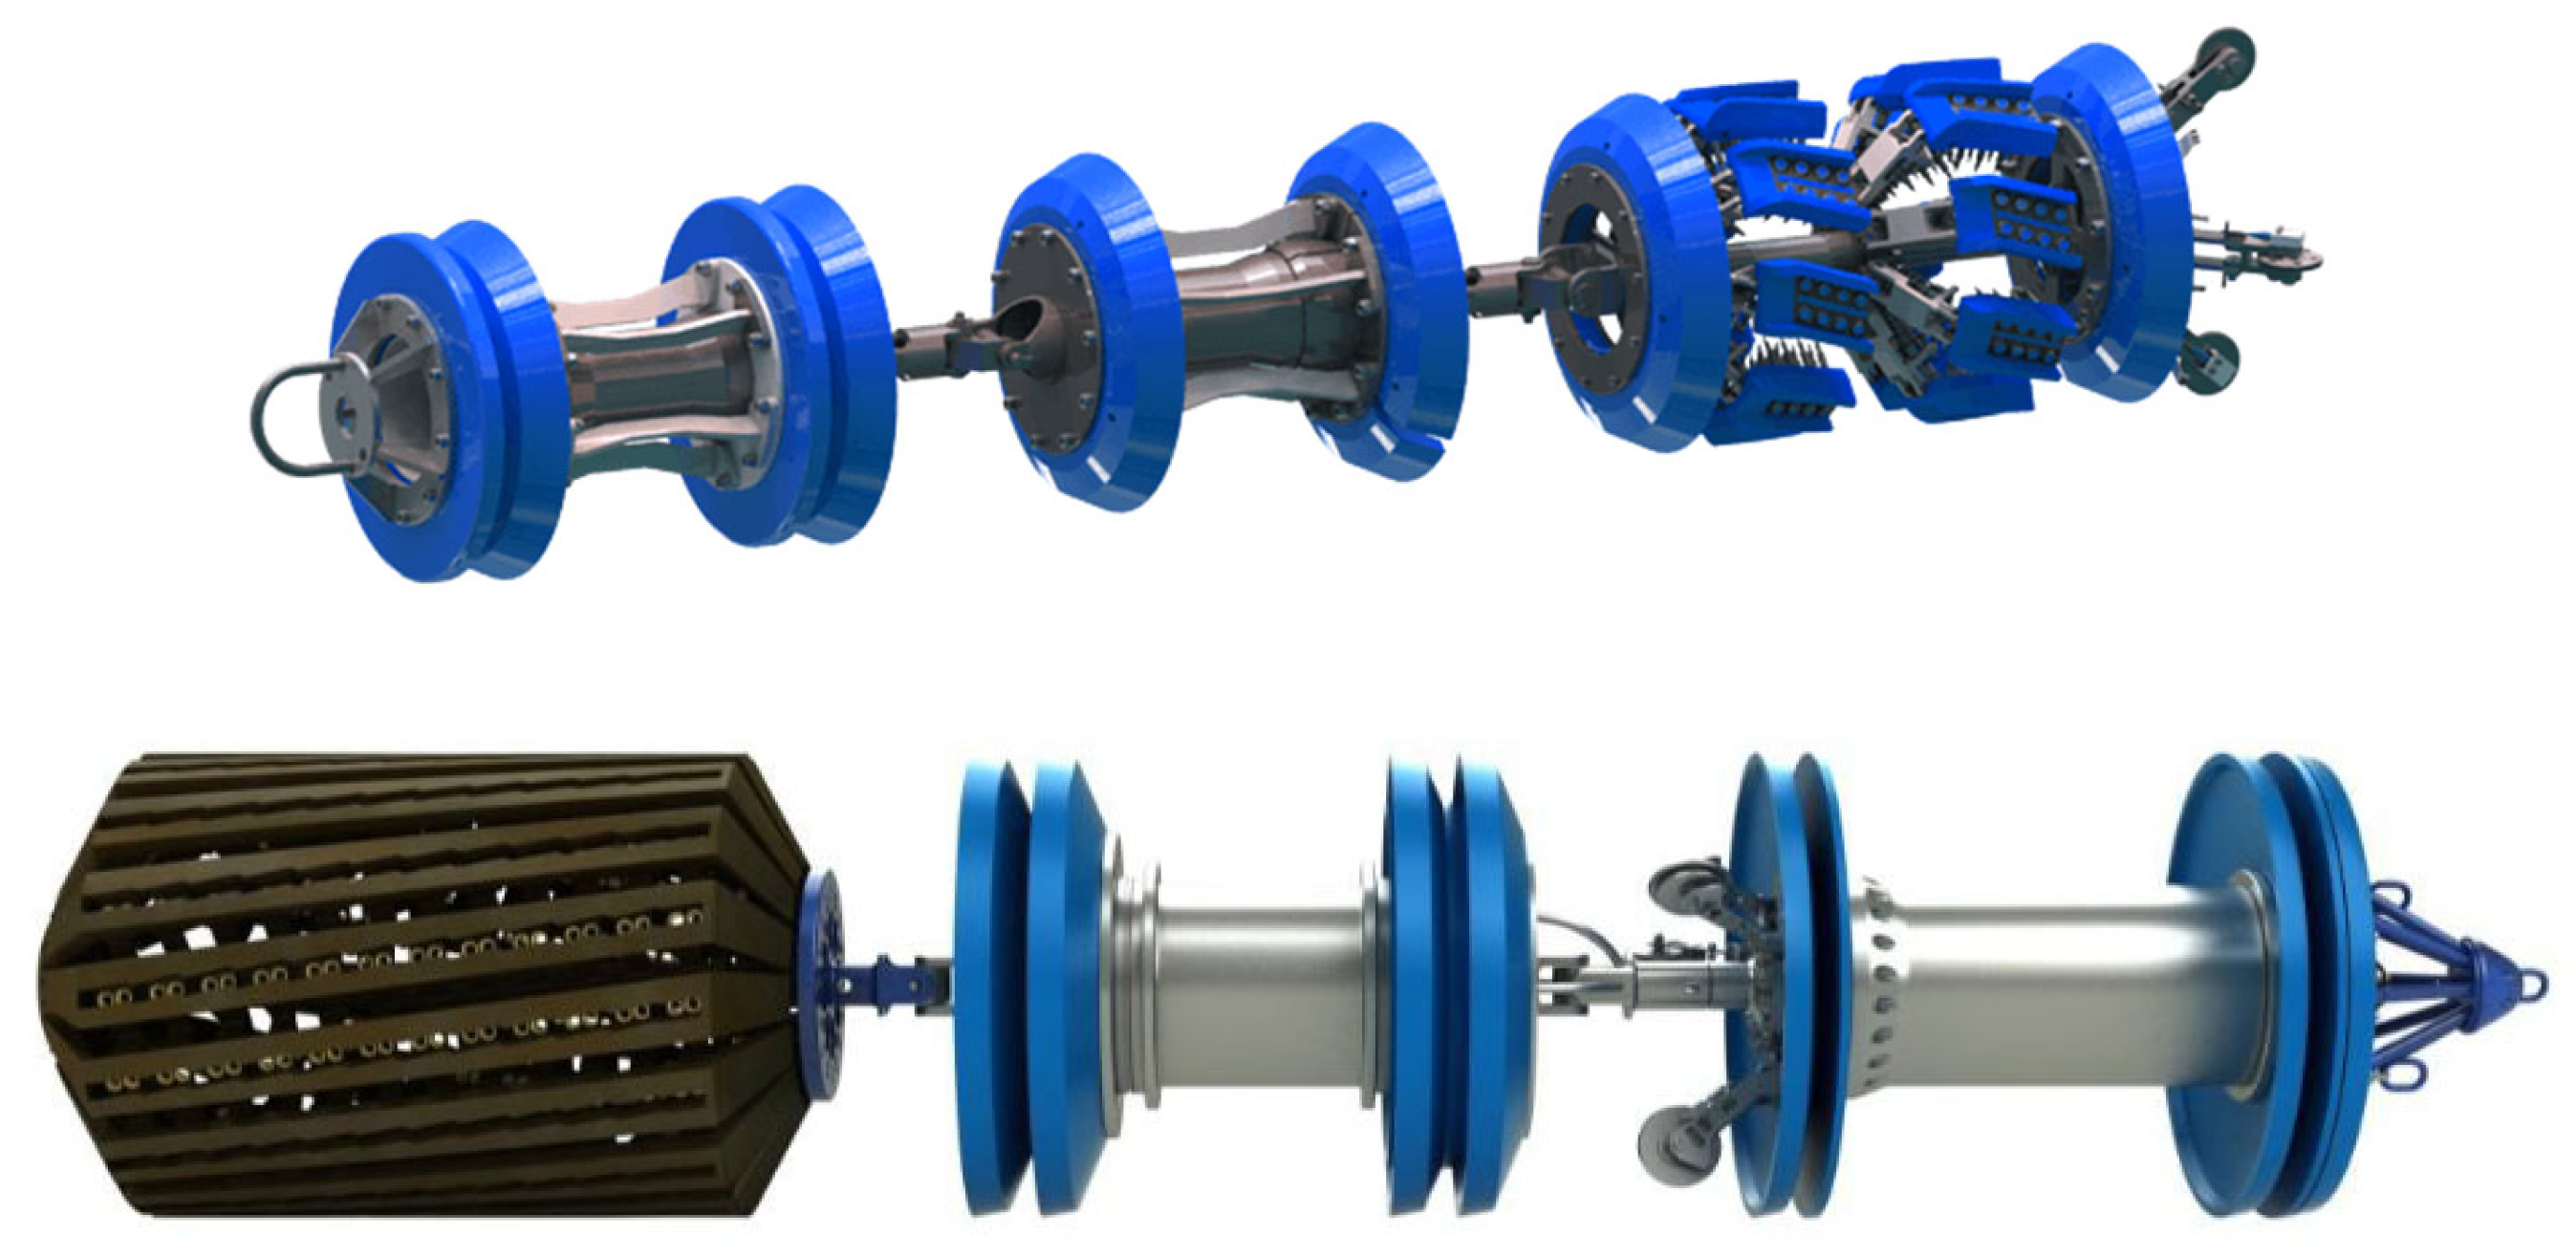
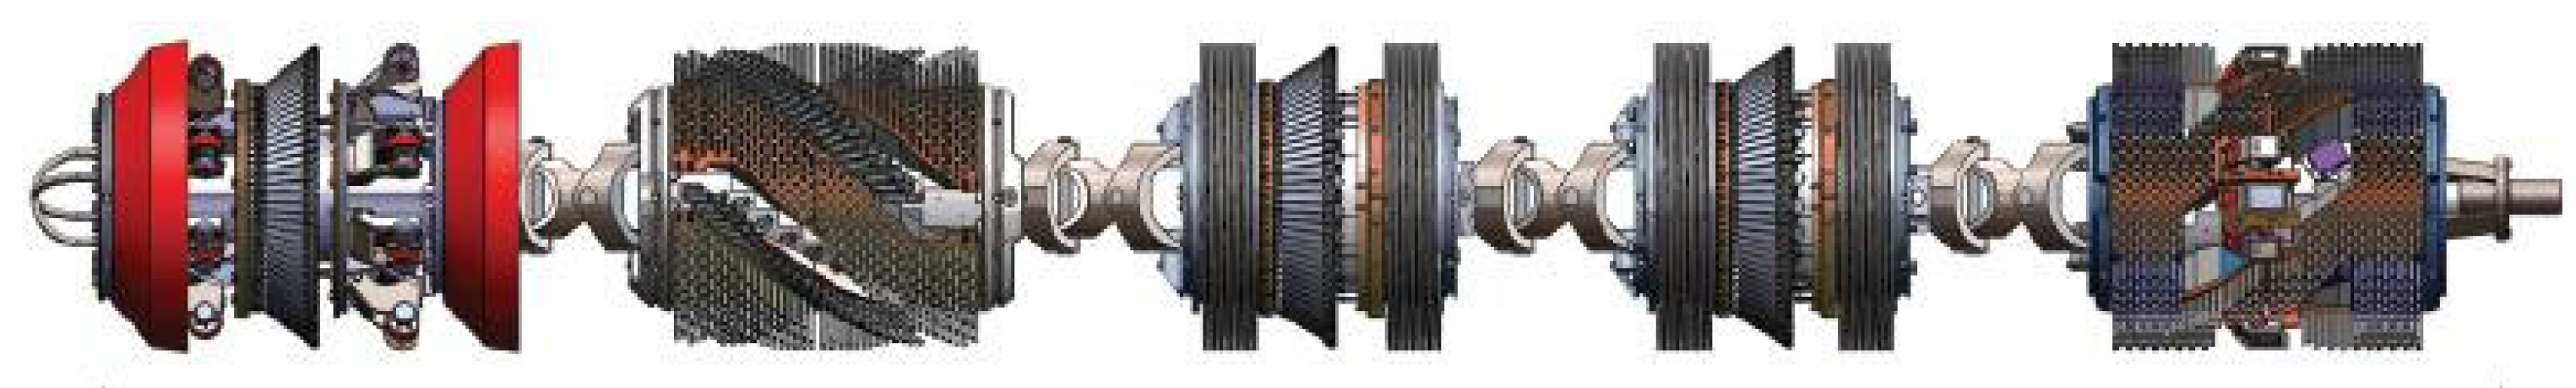
3. Pipeline Inspection Gauge (PIG)
4. Possible New Technologies
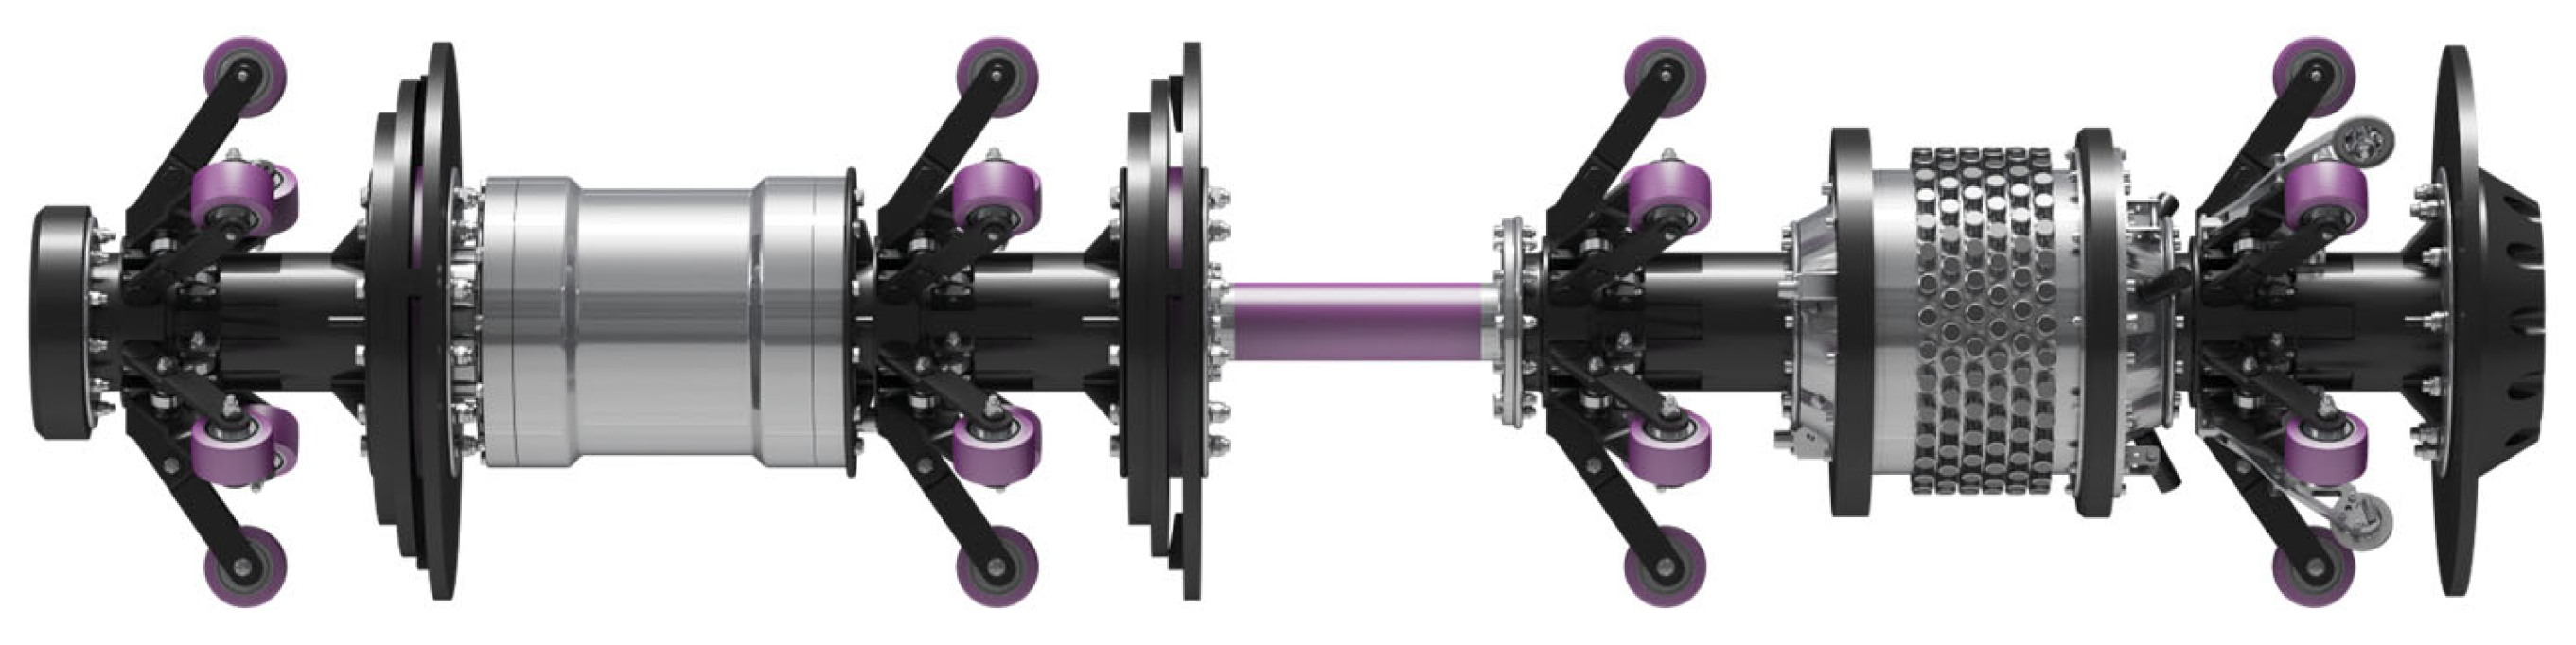
4.1. Internal Rotating Inspection System (IRIS)
4.2. Dry-Coupled Ultrasonic Testing (DCUT)
5. Conclusions
Author Contributions
Funding
Conflicts of Interest
Abbreviations
| ILI | In-line inspection | NDT | Non-destructive Testing |
| PIG | Pipeline Inspection Gauge | DEF | Geometry deformation mapping |
| MFL | Magnetic Flux Leakage | UT | Ultrasonic Testing |
| ECT | Eddy Current Testing | EMAT | Electromagnetic Acoustic Testing |
| ART | Acoustic Resonance Technology | DAMC | Direct Arm Measurement Caliper Angle or Movement Sensor |
| IEMC | Indirect EM Caliper | IMU | Inertial measurement units |
| ULF | Ultra-low frequency | GPS | Global Positioning System |
| LFM | Low Field Magnetic Flux Leakage | GMFL | Gas Magnetic Flux Leakage |
| PECT | Pulsed Eddy Current Testing | SMFL | SpirALL® Magnetic Flux Leakage |
| CNOOC | China National Offshore Oil Corporation | CASIC | China Aerospace Science and Industry Corporation |
| NMSE | Normalized mean square error | CNN | Convolutional neural network |
| THMS-Net | Two-stage heterogeneous signals mutual supervision network | AUT | Automated Ultrasonic Testing |
| PAUT | Phased Array Ultrasonic Testing | IRIS | Internal Rotating Inspection System |
| DCUT | Dry-Coupled Ultrasonic Testing | HIC | Hydrogen-Induced Cracking |
| SOHIC | Stress-Oriented Hydrogen-Induced Cracking | SCC | Stress Corrosion Cracking |
| ID | Internal diameter | OD | Outside diameter |
| RFEC | Remote field eddy current | RVI | Remote Visual Inspection |
| TOF | Time of flight | GNSS | Global Navigation Satellite System |
| EKF | Extended Kalman Filter | UKF | Unscented Kalman Filter |
| FFP | Fitness-for-Purpose |
References
- Tong, X.; Zhang, G.; Wang, Z.; Wen, Z.; Tian, Z.; Wang, H.; Ma, F.; Wu, Y. Distribution and Potential of Global Oil and Gas Resources. Pet. Explor. Dev. 2018, 45, 779–789. [Google Scholar] [CrossRef]
- Rosenberg, A.A.; Bolster, W.J.; Alexander, K.E.; Leavenworth, W.B.; Cooper, A.B.; McKenzie, M.G. The History of Ocean Resources: Modeling Cod Biomass Using Historical Records. Front. Ecol. Environ. 2005, 3, 78–84. [Google Scholar] [CrossRef]
- Kim, G.; Lee, M.E.; Lee, K.S.; Park, J.-S.; Jeong, W.M.; Kang, S.K.; Soh, J.-G.; Kim, H. An Overview of Ocean Renewable Energy Resources in Korea. Renew. Sustain. Energy Rev. 2012, 16, 2278–2288. [Google Scholar] [CrossRef]
- Zheng, C.W.; Li, C.Y.; Pan, J.; Liu, M.Y.; Xia, L.L. An Overview of Global Ocean Wind Energy Resource Evaluations. Renew. Sustain. Energy Rev. 2016, 53, 1240–1251. [Google Scholar] [CrossRef]
- Chong, Z.R.; Yang, S.H.B.; Babu, P.; Linga, P.; Li, X.-S. Review of Natural Gas Hydrates as an Energy Resource: Prospects and Challenges. Appl. Energy 2016, 162, 1633–1652. [Google Scholar] [CrossRef]
- Xu, Z.; Hu, T.; Pang, X.-Q.; Wang, E.-Z.; Liu, X.-H.; Wu, Z.-Y.; Chen, D.; Li, C.-R.; Zhang, X.-W.; Wang, T. Research Progress and Challenges of Natural Gas Hydrate Resource Evaluation in the South China Sea. Pet. Sci. 2022, 19, 13–25. [Google Scholar] [CrossRef]
- Peach, J.; Starbuck, C.M. Oil and Gas Production and Economic Growth in New Mexico. J. Econ. Issues 2011, 45, 511–526. [Google Scholar] [CrossRef]
- Wang, H.; Chen, J.; Cao, C.; Ge, Y.; Fang, J.; Zhou, P.; Lin, P. Capturing Amphipods in the Mariana Trench with a Novel Pressure Retaining Sampler. Deep Sea Res. Part I Oceanogr. Res. Pap. 2022, 184, 103772. [Google Scholar] [CrossRef]
- Abimbola, M.; Khan, F.; Khakzad, N. Dynamic Safety Risk Analysis of Offshore Drilling. J. Loss Prev. Process Ind. 2014, 30, 74–85. [Google Scholar] [CrossRef]
- Randolph, M.F.; Gaudin, C.; Gourvenec, S.M.; White, D.J.; Boylan, N.; Cassidy, M.J. Recent Advances in Offshore Geotechnics for Deep Water Oil and Gas Developments. Ocean Eng. 2011, 38, 818–834. [Google Scholar] [CrossRef]
- Hansen, P.; de Luna Pedrosa Filho, E.; Ribeiro, C.C. Location and Sizing of Offshore Platforms for Oil Exploration. Eur. J. Oper. Res. 1992, 58, 202–214. [Google Scholar] [CrossRef]
- Suslick, S.B.; Furtado, R. Quantifying the Value of Technological, Environmental and Financial Gain in Decision Models for Offshore Oil Exploration. J. Pet. Sci. Eng. 2001, 32, 115–125. [Google Scholar] [CrossRef]
- Sällh, D.; Wachtmeister, H.; Tang, X.; Höök, M. Offshore Oil: Investigating Production Parameters of Fields of Varying Size, Location and Water Depth. Fuel 2015, 139, 430–440. [Google Scholar] [CrossRef]
- Sorrell, S.; Speirs, J.; Bentley, R.; Miller, R.; Thompson, E. Shaping the Global Oil Peak: A Review of the Evidence on Field Sizes, Reserve Growth, Decline Rates and Depletion Rates. Energy 2012, 37, 709–724. [Google Scholar] [CrossRef]
- Hu, W.; Bao, J.; Hu, B. Trend and Progress in Global Oil and Gas Exploration. Pet. Explor. Dev. 2013, 40, 439–443. [Google Scholar] [CrossRef]
- Managi, S.; Opaluch, J.J.; Jin, D.; Grigalunas, T.A. Technological Change and Depletion in Offshore Oil and Gas. J. Environ. Econ. Manag. 2004, 47, 388–409. [Google Scholar] [CrossRef]
- Zhang, H.; Zhang, S.; Wang, Y.; Liu, Y.; Yang, Y.; Zhou, T.; Bian, H. Subsea pipeline leak inspection by autonomous underwater vehicle. Appl. Ocean Res. 2021, 107, 102321. [Google Scholar] [CrossRef]
- Fyrileiv, O.; Aamlid, O.; Venås, A.; Collberg, L. Deepwater Pipelines—Status, Challenges and Future Trends. Proc. Inst. Mech. Eng. Part M J. Eng. Marit. Environ. 2013, 227, 381–395. [Google Scholar] [CrossRef]
- Shafiee, M.; Ayudiani, P.S. Development of a Risk-Based Integrity Model for Offshore Energy Infrastructures—Application to Oil and Gas Pipelines. Int. J. Process Syst. Eng. 2015, 3, 211–231. [Google Scholar] [CrossRef]
- Seo, J.K.; Cui, Y.; Mohd, M.H.; Ha, Y.C.; Kim, B.J.; Paik, J.K. A Risk-Based Inspection Planning Method for Corroded Subsea Pipelines. Ocean Eng. 2015, 109, 539–552. [Google Scholar] [CrossRef]
- Ouyang, Y.; Wang, C.; Wu, Y.; Zhang, J.; Lin, Z.; Cai, L. Trend of the Environmental Supervision on Submarine Pipeline Installation. Environ. Sci. Pollut. Res. 2018, 25, 28829–28833. [Google Scholar] [CrossRef] [PubMed]
- Fang, H.; Duan, M. Submarine Pipelines and Pipeline Cable Engineering. In Offshore Operation Facilities; Fang, H., Duan, M., Eds.; Gulf Professional Publishing: Boston, MA, USA, 2014; pp. e1–e181. ISBN 978-0-12-396977-4. [Google Scholar]
- Kahnamouei, J.T.; Moallem, M. A comprehensive review of in-pipe robots. Ocean Eng. 2023, 277, 114260. [Google Scholar] [CrossRef]
- Chen, R.; Lei, Z. Progress and outlook of submarine pipeline engineering technologies in China. Oil Gas Storage Transp. 2022, 41, 667–672. [Google Scholar]
- Mahdi, E.; Eltai, E. Development of cost-effective composite repair system for oil/gas pipelines. Compos. Struct. 2018, 202, 802–806. [Google Scholar] [CrossRef]
- Andersen, T.; Misund, A. Pipeline Reliability: An Investigation of Pipeline Failure Characteristics and Analysis of Pipeline Failure Rates for Submarine and Cross-Country Pipelines. J. Pet. Technol. 1983, 35, 709–717. [Google Scholar] [CrossRef]
- Tian, Y.; Chai, W.; Borgi, S.E.; Zhang, C.; Sun, L.; Xiao, Z.; Fu, D. Assessment of Submarine Pipeline Damages Subjected to Falling Object Impact Considering the Effect of Seabed. Mar. Struct. 2021, 78, 102963. [Google Scholar] [CrossRef]
- Fan, N.; Jiang, J.; Nian, T.; Dong, Y.; Guo, L.; Fu, C.; Tian, Z.; Guo, X. Impact Action of Submarine Slides on Pipelines: A Review of the State-of-the-Art since 2008. Ocean Eng. 2023, 286, 115532. [Google Scholar] [CrossRef]
- Adumene, S.; Khan, F.; Adedigba, S.; Mamudu, A.; Rosli, M.I. Offshore Oil and Gas Development in Remote Harsh Environments: Engineering Challenges and Research Opportunities. Saf. Extrem. Environ. 2023, 5, 17–33. [Google Scholar] [CrossRef]
- Taleghani, N.D.; Tyagi, M. Impacts of Major Offshore Oil Spill Incidents on Petroleum Industry and Regional Economy. J. Energy Resour. Technol. 2017, 139, 022913. [Google Scholar] [CrossRef]
- Crone, T.J.; Tolstoy, M. Magnitude of the 2010 Gulf of Mexico Oil Leak. Science 2010, 330, 634. [Google Scholar] [CrossRef]
- Dubinsky, E.A.; Conrad, M.E.; Chakraborty, R.; Bill, M.; Borglin, S.E.; Hollibaugh, J.T.; Mason, O.U.; Piceno, Y.M.; Reid, F.C.; Stringfellow, W.T.; et al. Succession of Hydrocarbon-Degrading Bacteria in the Aftermath of the Deepwater Horizon Oil Spill in the Gulf of Mexico. Environ. Sci. Technol. 2013, 47, 10860–10867. [Google Scholar] [CrossRef] [PubMed]
- McCrea-Strub, A.; Kleisner, K.; Sumaila, U.R.; Swartz, W.; Watson, R.; Zeller, D.; Pauly, D. Potential Impact of the Deepwater Horizon Oil Spill on Commercial Fisheries in the Gulf of Mexico. Fisheries 2011, 36, 332–336. [Google Scholar] [CrossRef]
- Campagna, C.; Short, F.T.; Polidoro, B.A.; McManus, R.; Collette, B.B.; Pilcher, N.J.; Sadovy de Mitcheson, Y.; Stuart, S.N.; Carpenter, K.E. Gulf of Mexico Oil Blowout Increases Risks to Globally Threatened Species. BioScience 2011, 61, 393–397. [Google Scholar] [CrossRef]
- White, H.K.; Hsing, P.-Y.; Cho, W.; Shank, T.M.; Cordes, E.E.; Quattrini, A.M.; Nelson, R.K.; Camilli, R.; Demopoulos, A.W.J.; German, C.R.; et al. Impact of the Deepwater Horizon Oil Spill on a Deep-Water Coral Community in the Gulf of Mexico. Proc. Natl. Acad. Sci. USA 2012, 109, 20303–20308. [Google Scholar] [CrossRef] [PubMed]
- Soldi, G.; Gaglione, D.; Raponi, S.; Forti, N.; d’Afflisio, E.; Kowalski, P.; Millefiori, L.M.; Zissis, D.; Braca, P.; Willett, P.; et al. Monitoring of Critical Undersea Infrastructures: The Nord Stream and Other Recent Case Studies. IEEE Aerosp. Electron. Syst. Mag. 2023, 38, 4–24. [Google Scholar] [CrossRef]
- Du, F.; Li, C.; Wang, W. Development of Subsea Pipeline Buckling, Corrosion and Leakage Monitoring. J. Mar. Sci. Eng. 2023, 11, 188. [Google Scholar] [CrossRef]
- Wang, H.; Yajima, A.; Liang, R.Y.; Castaneda, H. A Bayesian Model Framework for Calibrating Ultrasonic In-Line Inspection Data and Estimating Actual External Corrosion Depth in Buried Pipeline Utilizing a Clustering Technique. Struct. Saf. 2015, 54, 19–31. [Google Scholar] [CrossRef]
- Che, T.-C.; Duan, H.-F.; Lee, P.J. Transient wave-based methods for anomaly detection in fluid pipes: A review. Mech. Syst. Signal Process. 2021, 160, 107874. [Google Scholar] [CrossRef]
- Xu, X.; Karney, B. An Overview of Transient Fault Detection Techniques. In Modeling and Monitoring of Pipelines and Networks: Advanced Tools for Automatic Monitoring and Supervision of Pipelines; Applied Condition Monitoring; Verde, C., Torres, L., Eds.; Springer International Publishing: Cham, Switzerland, 2017; pp. 13–37. ISBN 978-3-319-55944-5. [Google Scholar]
- Tian, C.H.; Yan, J.C.; Huang, J.; Wang, Y.; Kim, D.-S.; Yi, T. Negative pressure wave based pipeline Leak Detection: Challenges and algorithms. In Proceedings of the 2012 IEEE International Conference on Service Operations and Logistics, and Informatics, Suzhou, China, 8–10 July 2012; pp. 372–376. [Google Scholar]
- Zhao, L.; Wang, J.; Hou, M.; Li, Z. Negative Pressure Wave Leakage Location Algorithm Based on Difference Cross-Correlation Delay Estimation. IOP Conf. Ser. Mater. Sci. Eng. 2019, 612, 042047. [Google Scholar] [CrossRef]
- Brunone, B. Transient Test-Based Technique for Leak Detection in Outfall Pipes. J. Water Resour. Plan. Manag. 1999, 125, 302–306. [Google Scholar] [CrossRef]
- Meniconi, S.; Capponi, C.; Frisinghelli, M.; Brunone, B. Leak Detection in a Real Transmission Main Through Transient Tests: Deeds and Misdeeds. Water Resour. Res. 2021, 57, e2020WR027838. [Google Scholar] [CrossRef]
- Meniconi, S.; Brunone, B.; Frisinghelli, M. On the Role of Minor Branches, Energy Dissipation, and Small Defects in the Transient Response of Transmission Mains. Water 2018, 10, 187. [Google Scholar] [CrossRef]
- Adegboye, M.A.; Fung, W.-K.; Karnik, A. Recent Advances in Pipeline Monitoring and Oil Leakage Detection Technologies: Principles and Approaches. Sensors 2019, 19, 2548. [Google Scholar] [CrossRef] [PubMed]
- Brockhaus, S.; Ginten, M.; Klein, S.; Teckert, M.; Stawicki, O.; Oevermann, D.; Meyer, S.; Storey, D. In-Line Inspection (ILI) Methods for Detecting Corrosion in Underground Pipelines. In Underground Pipeline Corrosion; Orazem, M.E., Ed.; Woodhead Publishing: Sawston, UK, 2014; pp. 255–285. ISBN 978-0-85709-509-1. [Google Scholar]
- Ma, Q.; Tian, G.; Zeng, Y.; Li, R.; Song, H.; Wang, Z.; Gao, B.; Zeng, K. Pipeline In-Line Inspection Method, Instrumentation and Data Management. Sensors 2021, 21, 3862. [Google Scholar] [CrossRef] [PubMed]
- Revie, R.W. Oil and Gas Pipelines: Integrity and Safety Handbook. In Oil and Gas Pipelines; John Wiley & Sons, Ltd: Hoboken, NJ, USA, 2015; pp. 793–816. ISBN 978-1-119-01921-3. [Google Scholar]
- Michailides, P.; Deis, T. NPS 8 Geopig: Inertial Measurement and Mechanical Caliper Technology; American Society of Mechanical Engineers Digital Collection: Calgary, AB, Canada, 2016; pp. 373–378. [Google Scholar]
- Chen, H.; Zhang, X.; Li, J. Ultra Low Frequency Electromagnetic Wave Localization and Application to Pipeline Robot. In Proceedings of the 2006 IEEE/RSJ International Conference on Intelligent Robots and Systems, Beijing, China, 9–15 October 2006; pp. 1201–1205. [Google Scholar]
- Li, R.; Cai, M.; Shi, Y.; Feng, Q.; Chen, P. Technologies and Application of Pipeline Centerline and Bending Strain of In-Line Inspection Based on Inertial Navigation. Trans. Inst. Meas. Control 2018, 40, 1554–1567. [Google Scholar] [CrossRef]
- Dobmann, G.; Barbian, O.A.; Willems, H. State of the Art of In-Line Nondestructive Weld Inspection of Pipelines by Ultrasonics. Russ. J. Nondestruct. Test. 2007, 43, 755–761. [Google Scholar] [CrossRef]
- Guan, M.; Cheng, Y.; Li, Q.; Wang, C.; Fang, X.; Yu, J. An Effective Method for Submarine Buried Pipeline Detection via Multi-Sensor Data Fusion. IEEE Access 2019, 7, 125300–125309. [Google Scholar] [CrossRef]
- Parlak, B.O.; Yavasoglu, H.A. A Comprehensive Analysis of In-Line Inspection Tools and Technologies for Steel Oil and Gas Pipelines. Sustainability 2023, 15, 2783. [Google Scholar] [CrossRef]
- Salama, M.M.; Nestleroth, B.J.; Maes, M.A.; Rodriguez, C.; Blumer, D. Characterization of the Accuracy of the MFL Pipeline Inspection Tools; American Society of Mechanical Engineers Digital Collection: Rio de Janeiro, Brazil, 2013; pp. 247–251. [Google Scholar]
- Wang, F.; Feng, Q.; Zhou, L. Application Progress of Tri-Axial MFL Sensors Technology; American Society of Civil Engineers: Reston, VA, USA, 2012; pp. 981–989. [Google Scholar] [CrossRef]
- Feng, J.; Li, F.; Lu, S.; Liu, J.; Ma, D. Injurious or Noninjurious Defect Identification from MFL Images in Pipeline Inspection Using Convolutional Neural Network. IEEE Trans. Instrum. Meas. 2017, 66, 1883–1892. [Google Scholar] [CrossRef]
- Wang, H. Research on Defect Quantitative Characterization and Profile Reconstruction in Submarine Pipelines Based on Magnetic Flux Leakage Testing. Ph.D. Thesis, China University of Petroleum (East China), Beijing, China, 2020. [Google Scholar]
- Ho, M.; El-Borgi, S.; Patil, D.; Song, G. Inspection and monitoring systems subsea pipelines: A review paper. Struct. Health Monit. 2020, 19, 606–645. [Google Scholar] [CrossRef]
- Nestleroth, J.B. Circumferential MFL In-Line Inspection for Cracks in Pipelines; Battelle Memorial Institute: Richland, WA, USA, 2003. [Google Scholar]
- Liu, H. Research and Application of Submarine Pipeline Inspection Technology. Chem. Enterp. Manag. 2021, 36, 64–65. [Google Scholar] [CrossRef]
- Dai, L.S.; Feng, Q.S.; Sutherland, J.; Wang, T.; Sha, S.Y.; Wang, F.X.; Wang, D.P. Application of MFL on Girth-Weld Defect Detection of Oil and Gas Pipelines. J. Pipeline Syst. Eng. Pract. 2020, 11, 04020047. [Google Scholar] [CrossRef]
- Chen, J.; Jia, G.; Fu, K.; Zhang, H. Integrity Assessment of Moda Crude Oil Pipeline Based on Multi In-Line Inspection Datasets. In Proceedings of the 12th International Conference on Quality, Reliability, Risk, Maintenance, and Safety Engineering (QR2MSE 2022), Emeishan, China, 27–30 July 2022; pp. 1482–1486. [Google Scholar] [CrossRef]
- Piao, G.; Guo, J.; Hu, T.; Leung, H.; Deng, Y. Fast Reconstruction of 3-D Defect Profile from MFL Signals Using Key Physics-Based Parameters and SVM. NDT E Int. 2019, 103, 26–38. [Google Scholar] [CrossRef]
- China Develops Own Magnetic Flux Leakage Detector for Burgeoning Offshore Pipeline Inspection|Pipeline Technology Journal. Available online: https://www.pipeline-journal.net/news/china-develops-own-magnetic-flux-leakage-detector-burgeoning-offshore-pipeline-inspection (accessed on 30 December 2023).
- Kathirmani, S.; Tangirala, A.K.; Saha, S.; Mukhopadhyay, S. Online Data Compression of MFL Signals for Pipeline Inspection. NDT E Int. 2012, 50, 1–9. [Google Scholar] [CrossRef]
- Feng, J.; Zhang, X.; Lu, S.; Yang, F. A Single-Stage Enhancement-Identification Framework for Pipeline MFL Inspection. IEEE Trans. Instrum. Meas. 2022, 71, 1–13. [Google Scholar] [CrossRef]
- Jiang, L.; Zhang, H.; Liu, J.; Shen, X.; Xu, H. THMS-Net: A Two-Stage Heterogeneous Signals Mutual Supervision Network for MFL Weak Defect Detection. IEEE Trans. Instrum. Meas. 2022, 71, 1–9. [Google Scholar] [CrossRef]
- Cui, G. Deep Learning Based MFL Data Identification Method for Pipeline Defects. Master’s Thesis, Shenyang University of Technology, Shenyang, China, 2023. [Google Scholar]
- Lindner, H. Deepwater, High-Pressure and Multidiameter Pipelines—A Challenging in-Line Inspection Project. In Oil and Gas Pipelines; John Wiley & Sons, Ltd: Hoboken, NJ, USA, 2015; pp. 777–784. ISBN 978-1-119-01921-3. [Google Scholar]
- Uzelac, N.I.; Reber, K.; Belter, M.; Barbian, O.A. Ultrasonic In-Line Inspection of Pipelines, New Generation of Tools. In Proceedings of the Rio Pipeline Conference & Exposition; Rio de Janeiro, Brazil, 22–24 October 2003. Available online: https://www.osti.gov/etdeweb/servlets/purl/20963350 (accessed on 11 January 2024).
- Beller, M.; Schneider, U. Pipeline Inspection Utilizing Ultrasound Technology: On the Issue of Resolution. In Proceedings of the 1st International Conference on Pipeline Integrity, Schiphol, The Netherlands, 5–7 November 2008; pp. 139–148. [Google Scholar]
- Dann, M.R.; Dann, C. Automated Matching of Pipeline Corrosion Features from In-Line Inspection Data. Reliab. Eng. Syst. Saf. 2017, 162, 40–50. [Google Scholar] [CrossRef]
- Amaya-Gómez, R.; Schoefs, F.; Sánchez-Silva, M.; Muñoz, F.; Bastidas-Arteaga, E. Matching of Corroded Defects in Onshore Pipelines Based on In-Line Inspections and Voronoi Partitions. Reliab. Eng. Syst. Saf. 2022, 223, 108520. [Google Scholar] [CrossRef]
- Fang, H. Ultrasonic Phased Array Defect Detection Simulation Considering Sound Attenuation and Dispersion Characteristics of Polyethylene. Master’s Thesis, Zhejiang University, Hangzhou, China, 2023. [Google Scholar]
- Bosch, J. Phased Array Technology for Automated Pipeline Inspection. e-J. Nondestruct. Test. 2004, 9, 1–4. [Google Scholar]
- Jayasinghe, V.; Eaton, C.; Millejours, B. Application of Flexible PAUT Probes for Small Diameter FAC Elbow Inspection II. e-J. Nondestruct. Test. 2016, 21, 82–86. [Google Scholar]
- Aulin, A.; Shahzad, K.; MacKenzie, R.; Bott, S. Comparison of Non-Destructive Examination Techniques for Crack Inspection; American Society of Mechanical Engineers Digital Collection: Lawrence, KS, USA, 2021. [Google Scholar]
- Kang, D.; Choi, Y.M.; Lee, D.M.; Kim, J.B.; Kim, Y.K.; Park, T.S.; Park, I.K. Reliability Analysis of PAUT Based on the Round-Robin Test for Pipe Welds with Thermal Fatigue Cracks. Materials 2023, 16, 6908. [Google Scholar] [CrossRef] [PubMed]
- Li, C. The Research of Pipeline Internal Detection Based on Pulsed Eddy Current. Master’s Thesis, Inner Mongolia University, Hohhot, China, 2014. [Google Scholar]
- Piao, G.; Guo, J.; Hu, T.; Deng, Y.; Leung, H. A Novel Pulsed Eddy Current Method for High-Speed Pipeline Inline Inspection. Sens. Actuators A Phys. 2019, 295, 244–258. [Google Scholar] [CrossRef]
- Hirao, M.; Ogi, H. An SH-Wave EMAT Technique for Gas Pipeline Inspection. NDT E Int. 1999, 32, 127–132. [Google Scholar] [CrossRef]
- Mirkhani, K.; Chaggares, C.; Masterson, C.; Jastrzebski, M.; Dusatko, T.; Sinclair, A.; Shapoorabadi, R.J.; Konrad, A.; Papini, M. Optimal Design of EMAT Transmitters. NDT E Int. 2004, 37, 181–193. [Google Scholar] [CrossRef]
- Shu, D. Research of the Pipeline Defect Detection Technology Based on Electromagnetic Ultrasonic Guided Wave. Master’s Thesis, Shenyang University of Technology, Shenyang, China, 2014. [Google Scholar]
- Xing, Y. Research on Propagation Mechanism and Detection of Electromagnetic Ultrasonic Helical Guided in the Pipeline. Ph.D. Thesis, Shenyang University of Technology, Shenyang, China, 2019. [Google Scholar]
- Zhang, X.; Li, B.; Zhang, X.; Song, X.; Tu, J.; Cai, C.; Yuan, J.; Wu, Q. Internal and External Pipe Defect Characterization via High-Frequency Lamb Waves Generated by Unidirectional EMAT. Sensors 2023, 23, 8843. [Google Scholar] [CrossRef] [PubMed]
- Yan, Y.; Liu, D.; Gao, B.; Tian, G.Y.; Cai, Z.C. A Deep Learning-Based Ultrasonic Pattern Recognition Method for Inspecting Girth Weld Cracking of Gas Pipeline. IEEE Sens. J. 2020, 20, 7997–8006. [Google Scholar] [CrossRef]
- Khalili, P.; Cawley, P. The Choice of Ultrasonic Inspection Method for the Detection of Corrosion at Inaccessible Locations. NDT E Int. 2018, 99, 80–92. [Google Scholar] [CrossRef]
- Vos, W.; Norli, P.; Vallee, E. Application of Wide-Band Ultrasound for the Detection of Angled Crack Features in Oil and Gas Pipelines. In Proceedings of the InInternational Pipeline Conference 2018, Calgary, AB, Canada, 24–28 September 2018. [Google Scholar]
- Sahhaf Naeini, H.; Soorgee, M.H. Experimental Investigation on Sphere Pig Movement in Multiple Thickness Pipe. J. Nat. Gas Sci. Eng. 2021, 95, 104152. [Google Scholar] [CrossRef]
- Quarini, J.; Shire, S. A Review of Fluid-Driven Pipeline Pigs and Their Applications. Proc. Inst. Mech. Eng. Part E J. Process Mech. Eng. 2007, 221, 1–10. [Google Scholar] [CrossRef]
- Guan, L.; Gao, Y.; Liu, H.; An, W.; Noureldin, A. A Review on Small-Diameter Pipeline Inspection Gauge Localization Techniques: Problems, Methods and Challenges. In Proceedings of the 2019 International Conference on Communications, Signal Processing, and their Applications (ICCSPA), Sharjah, United Arab Emirates, 19–21 March 2019; pp. 1–6. [Google Scholar]
- Anjum, M.L.; Park, J.; Hwang, W.; Kwon, H.; Kim, J.; Lee, C.; Kim, K.; Danr Cho, D. Sensor Data Fusion Using Unscented Kalman Filter for Accurate Localization of Mobile Robots. In Proceedings of the ICCAS 2010, Gyeonggi-do, Republic of Korea, 27–30 October 2010; pp. 947–952. [Google Scholar]
- Chmelko, V.; Garan, M.; Šulko, M.; Gašparík, M. Health and Structural Integrity of Monitoring Systems: The Case Study of Pressurized Pipelines. Appl. Sci. 2020, 10, 6023. [Google Scholar] [CrossRef]
- Chmelko, V.; Biro, D. Safety of Pressure Pipe Operation with Corrosive Defect. Procedia Struct. Integr. 2019, 17, 520–525. [Google Scholar] [CrossRef]


| Property | Gen 3 |
|---|---|
| Size range | 24 to 36 inch. |
| Inspection range | Up to 220 kilometers (136 miles) |
| Speed range (at full resolution) | Up to 2.5 m/s (5.5 mph) |
| Bend passing | 1.5D (back-to-back on request) |
| Minimum defect size * | 2 × 50 mm |
| POI %achieved to date * | >80% |
| POD %achieved to date * | >90% |
| Detection redundancy * | Multiple |
Disclaimer/Publisher’s Note: The statements, opinions and data contained in all publications are solely those of the individual author(s) and contributor(s) and not of MDPI and/or the editor(s). MDPI and/or the editor(s) disclaim responsibility for any injury to people or property resulting from any ideas, methods, instructions or products referred to in the content. |
© 2024 by the authors. Licensee MDPI, Basel, Switzerland. This article is an open access article distributed under the terms and conditions of the Creative Commons Attribution (CC BY) license (https://creativecommons.org/licenses/by/4.0/).
Share and Cite
Zhu, H.; Chen, J.; Lin, Y.; Guo, J.; Gao, X.; Chen, Y.; Ge, Y.; Wang, W. In-Line Inspection (ILI) Techniques for Subsea Pipelines: State-of-the-Art. J. Mar. Sci. Eng. 2024, 12, 417. https://doi.org/10.3390/jmse12030417
Zhu H, Chen J, Lin Y, Guo J, Gao X, Chen Y, Ge Y, Wang W. In-Line Inspection (ILI) Techniques for Subsea Pipelines: State-of-the-Art. Journal of Marine Science and Engineering. 2024; 12(3):417. https://doi.org/10.3390/jmse12030417
Chicago/Turabian StyleZhu, Hai, Jiawang Chen, Yuan Lin, Jin Guo, Xu Gao, Yuanjie Chen, Yongqiang Ge, and Wei Wang. 2024. "In-Line Inspection (ILI) Techniques for Subsea Pipelines: State-of-the-Art" Journal of Marine Science and Engineering 12, no. 3: 417. https://doi.org/10.3390/jmse12030417
APA StyleZhu, H., Chen, J., Lin, Y., Guo, J., Gao, X., Chen, Y., Ge, Y., & Wang, W. (2024). In-Line Inspection (ILI) Techniques for Subsea Pipelines: State-of-the-Art. Journal of Marine Science and Engineering, 12(3), 417. https://doi.org/10.3390/jmse12030417