Article

Safety Analysis of Initial Separation Phase for AUV Deployment of Mission Payloads

1
State Key Laboratory of Robotics, Shenyang Institute of Automation, Chinese Academy of Sciences, Shenyang 110016, China
2
Institutes for Robotics and Intelligent Manufacturing, Chinese Academy of Sciences, Shenyang 110169, China
3
University of Chinese Academy of Sciences, Beijing 100049, China
*
Author to whom correspondence should be addressed.
J. Mar. Sci. Eng. 2024, 12(4), 608; https://doi.org/10.3390/jmse12040608
Submission received: 8 February 2024 / Revised: 27 March 2024 / Accepted: 28 March 2024 / Published: 31 March 2024

Abstract

:
This study verifies the effects of deployment parameters on the safe separation of Autonomous Underwater Vehicles (AUVs) and mission payloads. The initial separation phase is meticulously modeled based on computational fluid dynamics (CFD) simulations employing the cubic constitutive Shear Stress Transport (SST) k-ω turbulence model and overset grid technologies. This phase is characterized by a 6-degree-of-freedom (6-DOF) framework incorporating Dynamic Fluid-Body Interaction (DFBI), supported by empirical validation. The SST k-ω turbulence model demonstrates superior performance in managing flows characterized by adverse pressure gradients and separation. DFBI entails computationally modeling fluid–solid interactions during motion or deformation. The utilization of overset grids presents several advantages, including enhanced computational efficiency by concentrating computational resources solely on regions of interest, simplified handling of intricate geometries and moving bodies, and adaptability in adjusting grids to accommodate changing simulation conditions. This research analyzes mission payloads’ trajectories and attitude adjustments after release from AUVs under various cruising speeds and initial release dynamics, such as descent and angular velocities. Additionally, this study evaluates the effects of varying ocean currents at different depths on separation safety. Results indicate that the interaction between AUVs and mission payloads during separation increases under higher navigational speeds, reducing the separation speed and degrading the stability. As the initial drop velocities increase, fast transition through the AUV’s immediate flow field promotes separation. The core of this process is the initial pitch angle management upon deployment. Optimizing initial pitching angular velocity prolongs the time for mission payloads to reach their maximum pitch angle, thus decreasing horizontal displacement and improving separation safety. Deploying AUVs at greater depths alleviates the influence of ocean currents, thereby reducing disturbances during payload separation.

1. Introduction

Due to their superior concealment, enhanced safety, economic feasibility, and resistance to maritime and atmospheric conditions, unmanned submersible transport platforms have been widely utilized in real-world applications [1,2,3]. Simultaneously, seabed mission payloads are characterized by their operational depth, variable task requirements, and significant logistical challenges [4]. Due to their landing and transit capabilities, these payloads facilitate extended underwater operations, a feature increasingly relevant for future seabed warfare applications. Deploying these mission payloads predominantly relies on manned vessels, considerably increasing the human and material costs. A promising alternative is to employ large AUVs to deliver unmanned systems, such as seabed support stations and underwater resource detection instruments [5]. Nonetheless, the intricate marine environment introduces obstacles in deploying mission payloads. The final phase of separating AUVs and mission payloads, initializing the payload’s separation, is critical. Insecure separation may cause collisions, threatening the accuracy of payload deployment in targeted areas. Therefore, it is vital to evaluate the influence of initial separation conditions on the safety of AUV-deployed mission payloads while analyzing the payloads’ attitudes and positions under various separation scenarios.
The advancements in AUVs and their applications in underwater logistics and pay-load transportation [6] highlight a significant shift toward innovative marine technology. The ‘Orca’ unmanned underwater vehicle, developed in the United States, has successfully performed comprehensive underwater trials [7]. This vehicle performs payload delivery missions to the seafloor using the knowledge and experience acquired from the Proteus underwater carrier. Similarly, the ‘Modifiable Underwater Mothership’ project by ThyssenKrupp Marine Systems in Germany [8] has been utilized for the modular transportation of mission payloads to the seafloor and has accomplished the initial phase of sea trials. Within the realm of academic scholarship, distinguished scholars, exemplified by the Opel Innovations team [9], have introduced the concept of underwater logistics. The conceptual underwater logistics network comprises AUVs providing logistical support through underground loading docks while entirely navigating beneath the water’s surface. This concept assumes the vehicles’ capability to intercept parcels or containers at sea and deliver them to their destination. In order to address the challenging task of predicting payload descent and bluff body flow phenomena, Gao Wei et al. [10] comprehensively investigated the payloads’ passive descent characteristics, meticulously considering the multifaceted effects of ocean currents and buoyancy fluctuations. They substantially enhanced the accuracy of descent motion predictions by fine-tuning the control parameters. Gong et al. [11] performed Reynolds-Averaged Navier–Stokes (RANS) simulations to meticulously validate the fluid dynamics surrounding circular and square-section bluff bodies, instigated with an initial velocity. The resultant predictions for drag coefficients and pressure distributions of two-dimensional and three-dimensional cylindrical bodies were remarkably consistent with experimental findings. Yao et al. [12] employed sophisticated Large Eddy Simulation (LES) methods to systematically analyze the intricate hydrodynamics governing water flow around circular cylinders with various height-to-diameter ratios. Their meticulous inquiry yielded valuable insights into the complex fluid dynamics at play. Pena et al. [13] introduced various turbulence modeling approaches, discussed the limitations of different models, and offered recommendations for establishing turbulence models based on specific scenarios such as drag prediction, ship flow modeling, self-propulsion, and cavitation. The advice is grounded in appropriate simulation cases and aims to minimize computational costs. Concurrently, Yan et al. [14] developed safe longitudinal and vertical velocities tailored to various reference parameters to avoid collisions with the mother platform during the rapid docking of the AUV. This methodology allows the AUV to dock swiftly and securely. Additionally, they simulated the docking procedure between the AUV and the mother platform for validation purposes. Considering the extant body of research, CFD techniques are necessary to improve the precision of initial separation simulations for underwater payloads and ensure the safety of initial payload separation.
There is limited research on payload deployment in underwater missions, with most payload initial separation studies focusing on aircraft deploying air-to-ground munitions and satellite launches. Ghoreyshi et al. [15] investigated a parachute-payload system’s flight dynamics and trajectory analysis at different deck angles as it exited a C-17 aircraft. Adaptive grid refinement techniques were employed to better capture the engine exhaust and wake flow behind the C-17, parachute, and payload. Additionally, it was found that the aerodynamic forces on the payload in the cargo bay had a negligible effect on the payload dynamics until the payload exited the ramp. Thus, the higher the exit velocity, the lower the rotation rate. Bogomolov et al. [16] optimized the payload configuration by simulating the separation process for deploying small satellites from a cargo spacecraft. Beyond inertial characteristics, they accounted for the interactions between the satellites and the launcher’s guide rails and doors. In order to evaluate the viability of the proposed con-figurations, they performed statistical analyses for various launch scenarios. They com-pared different strategies and offered recommendations for the optimal layout. Additionally, different aerodynamic configurations of embedded missiles affect their separation compatibility. Olejnik et al. [17] simulated the separation process of a GBU-31 bomb and a 370 gallon empty fuel tank from an aircraft based on a 6-DOF program and CFD code. Their results closely matched wind tunnel tests and offered suggestions for safe separation. Fei et al. [18] derived the motion equations for high-velocity wind tunnel load separation tests under no-wind conditions. They ensured that the separation trajectories in the wind tunnel tests were similar to those of a real aircraft by obtaining the model mass values and initial separation velocity. Airborne payload deployment primarily relies on wind tunnel testing. Given the unique environment of underwater payload deployment and existing research, CFD methods should be studied to enhance the accuracy of initial separation simulations for underwater payloads and improve the safety of their safety.
This study employs a cubic SST k-ω model for combining CFD methods with dynamic fluid interaction, overset grid, and moving grid technologies to investigate the impact of various separation conditions on the initial separation safety of payloads from AUV. Model evaluation and simulations under multiple conditions indicate that the cubic SST k-ω model can accurately capture the physical phenomena of turbulence and acquire results with a specific level of credibility. This study proposes recommendations to enhance the safety of payload separation, providing support for determining initial separation conditions in future maritime tests. Additionally, these findings can assist in the engineering design and practical usage of similar products.
This paper comprises the following sections: Section 1 introduces the prospect of using AUVs to deliver mission payloads to the seafloor and related research. The details of modeling conditions and numerical methods used in this paper are described in Section 2. Section 3 describes the test platform, procedure, and turbulence model selection. Section 4 performs numerical simulations with different initial separation conditions and com-pares the simulation results. The last section presents the main conclusions and provides recommendations.

2. Materials and Methods

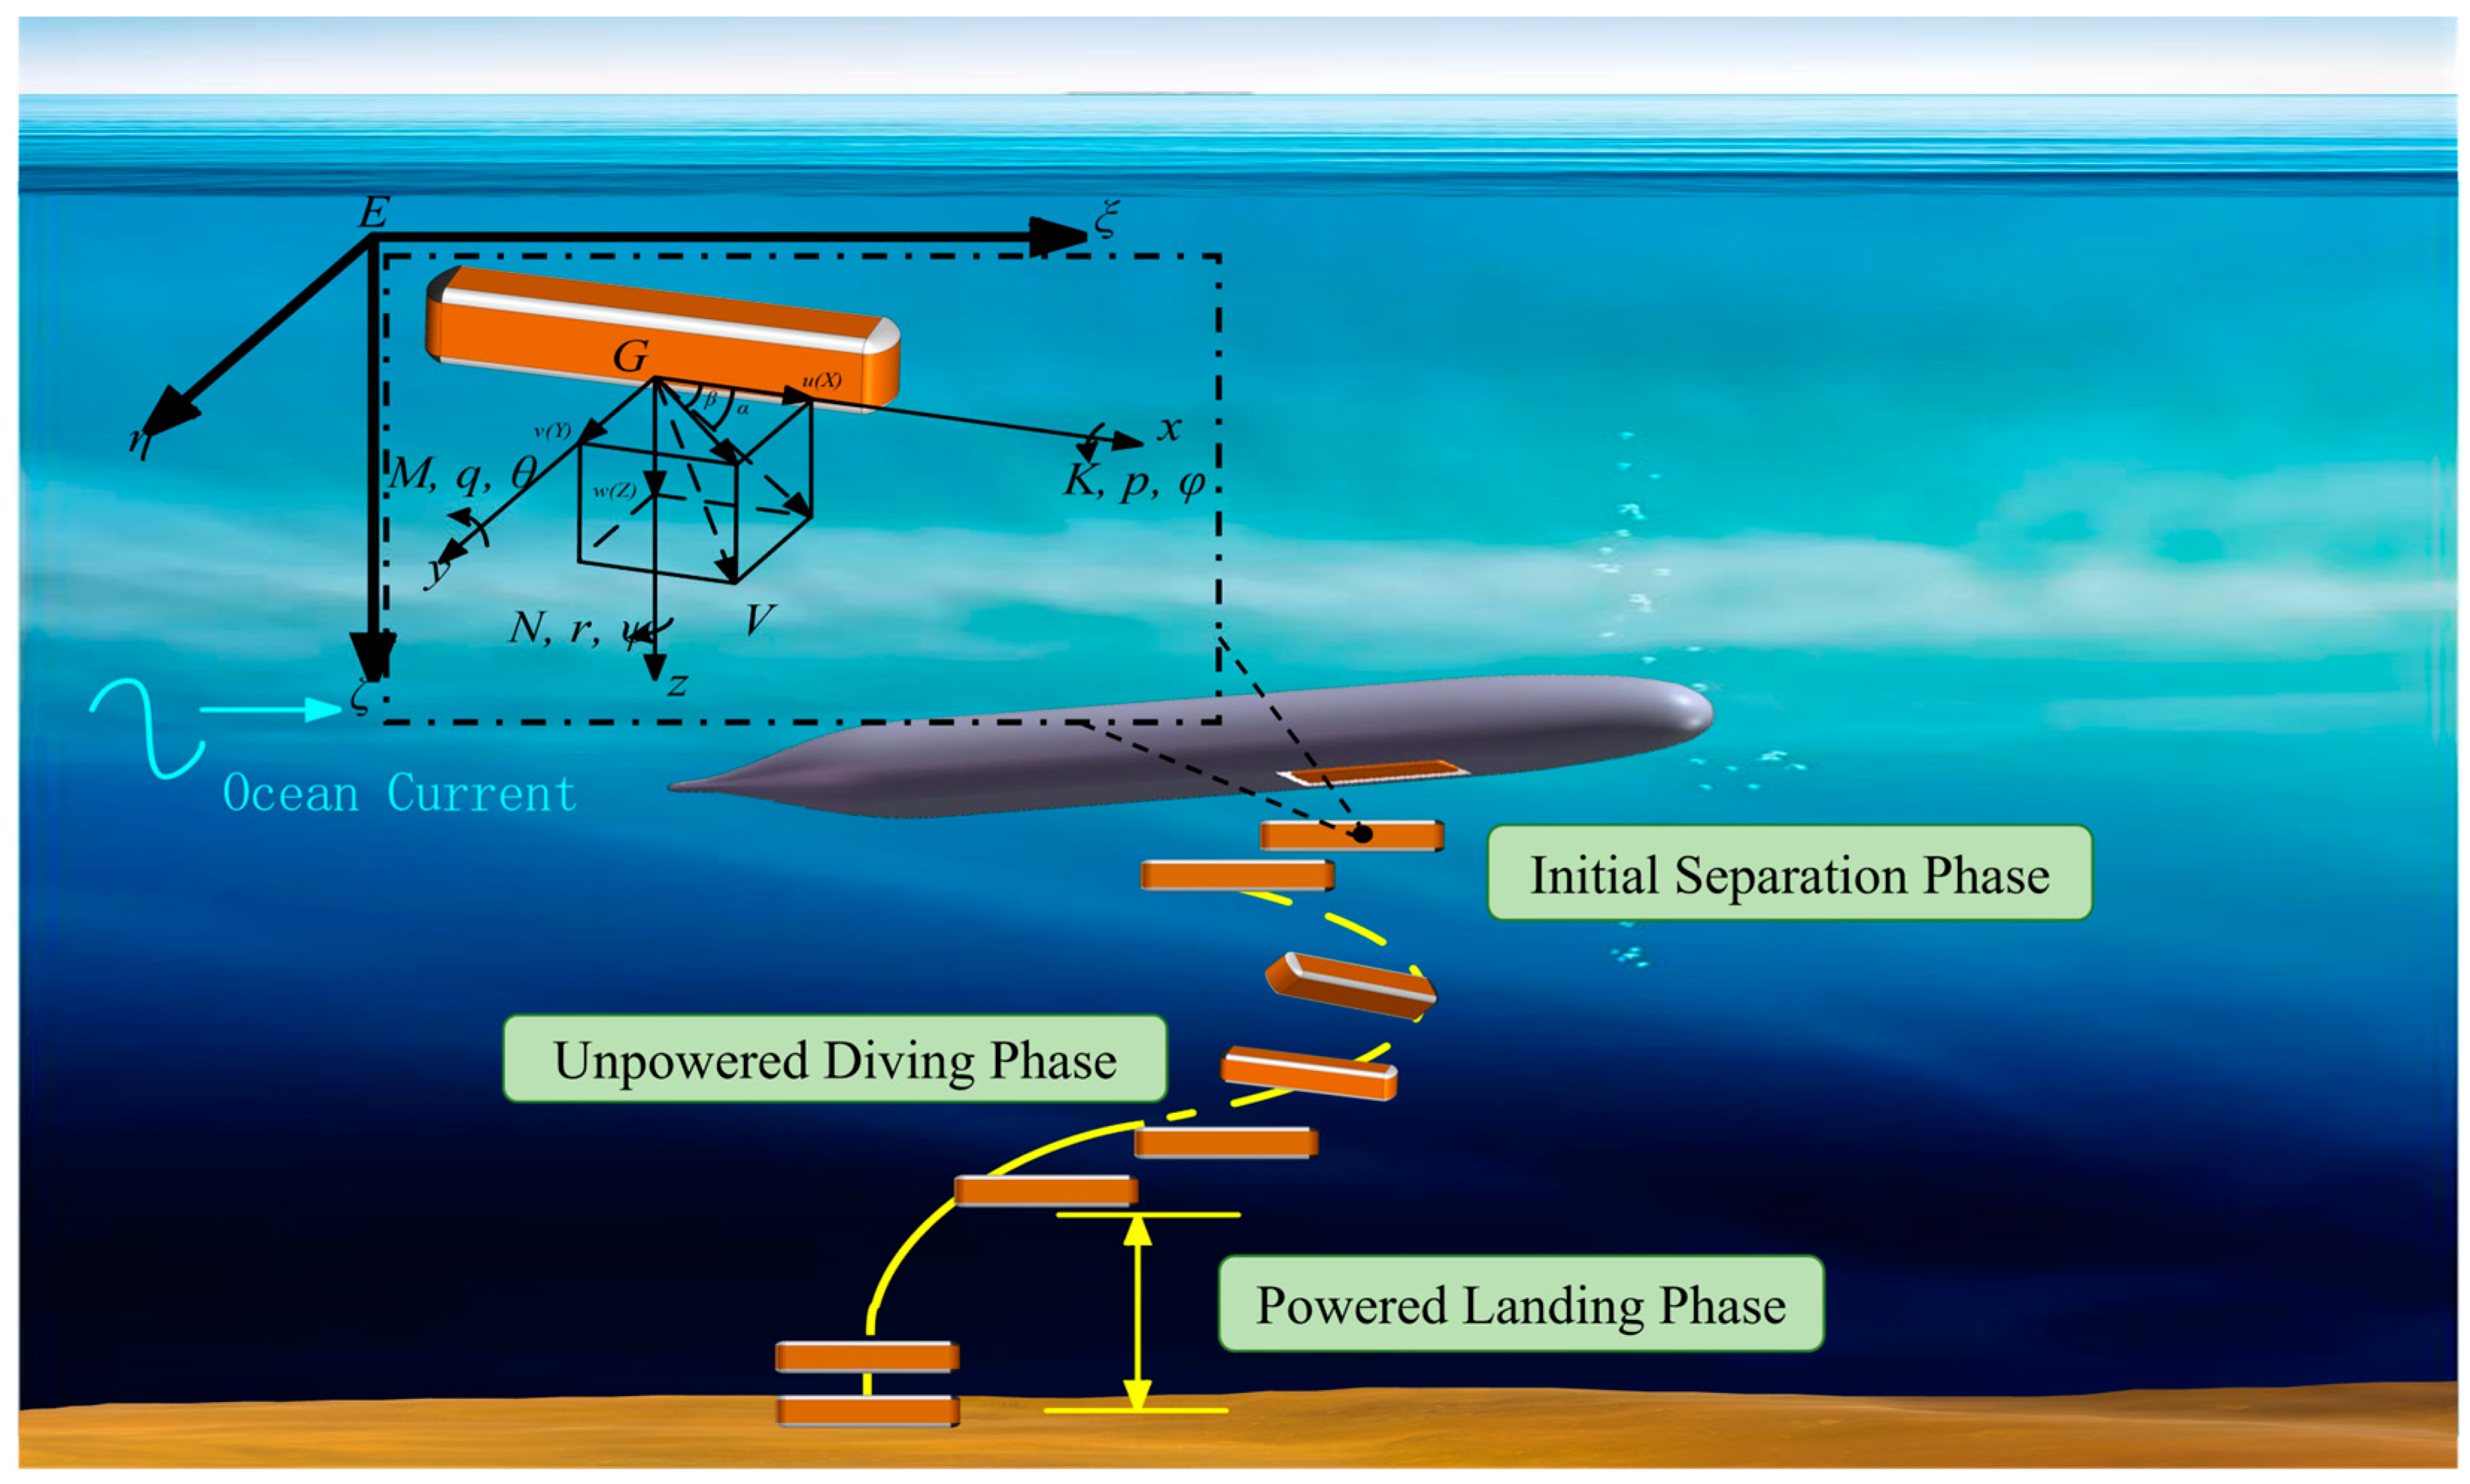
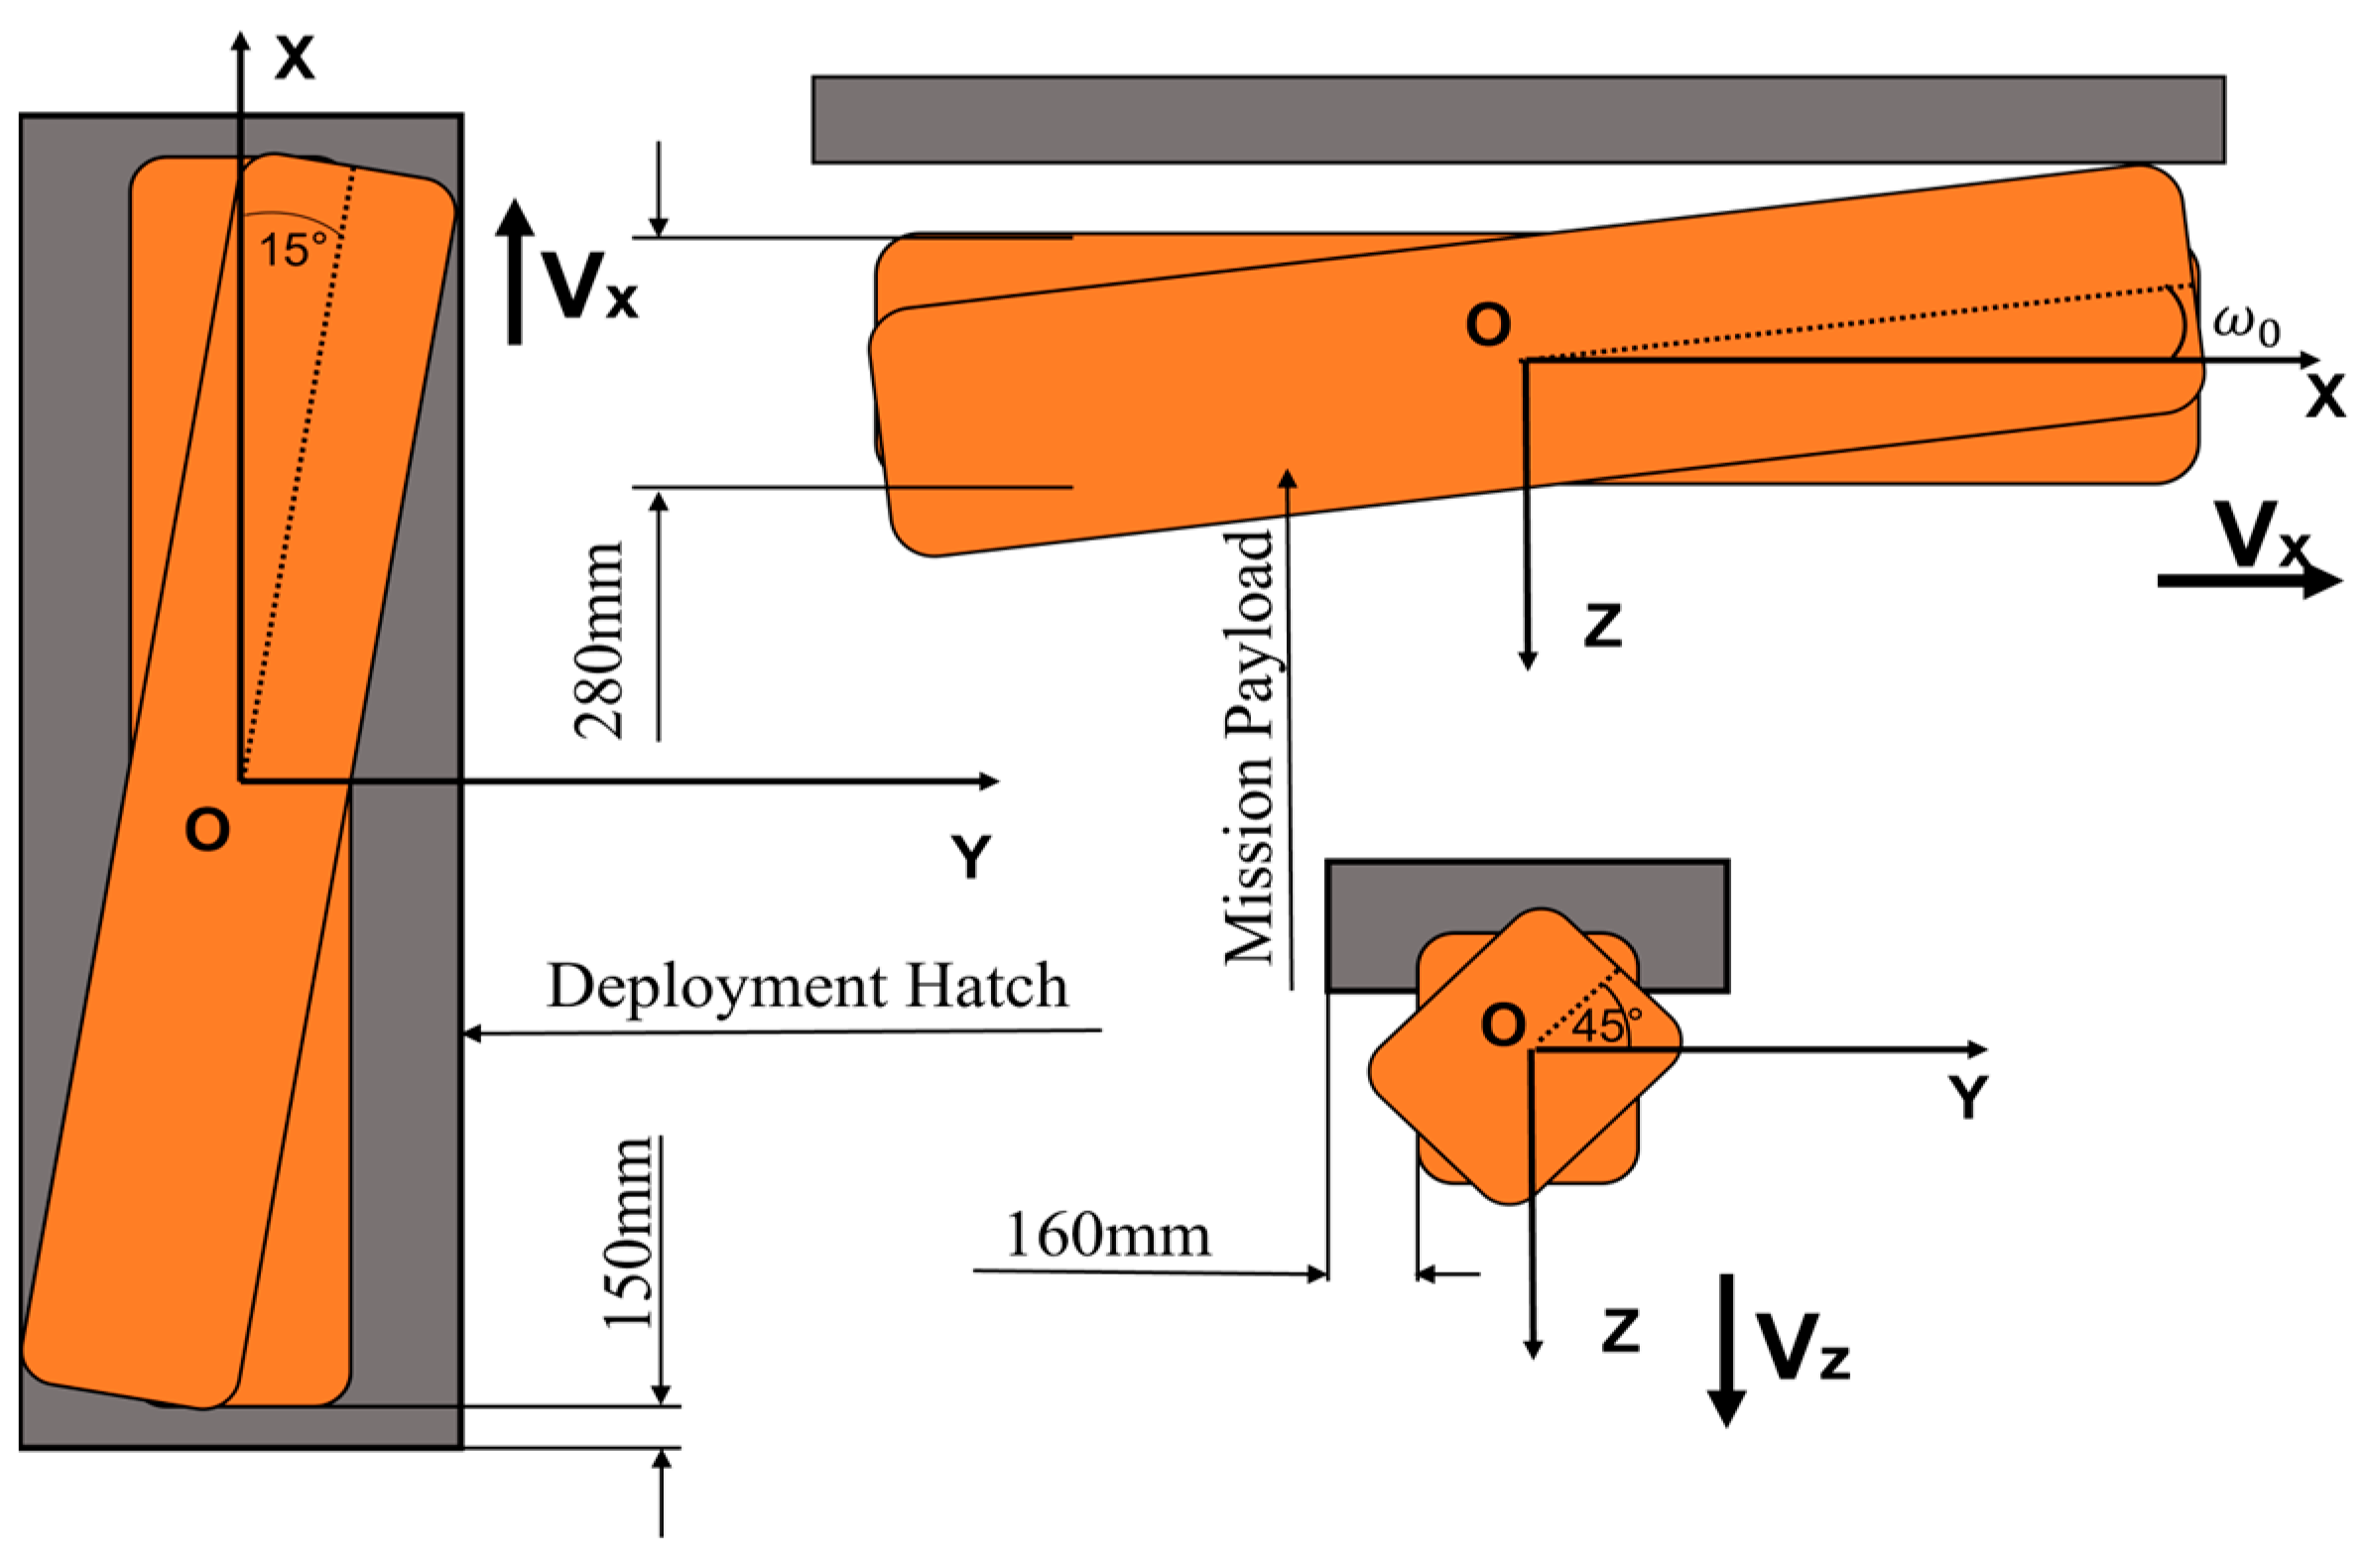
2.1. Separation Model and Parameters

The AUV adopts the main body outline of the SUBOFF [19] standard submarine shape, initially released by DARPA in 1989. Simulation conditions are established by referencing the HUGIN Endurance’s technical specifications, a Kongsberg Maritime product [20]. Table 1 shows comprehensive technical dimensions and parameters for the AUV and the mission payload. An internally integrated through-hull segment is designed to facilitate the conveyance of substantial mission payloads, ensuring uniform internal and external pressures to streamline the loading and deployment processes (as shown in Figure 1). Compared with external payload transport methodologies, the internal housing approach significantly mitigates the hydrodynamic resistance. The separation scenario between the mission payload and the AUV is illustrated in Figure 2. The model simplification excludes consideration of ocean currents’ impact on mission payload during simulations of various separation conditions. Ocean currents’ influence is factored in solely for analyzing the depth of mission load release.
The initial separation of mission payloads is numerically simulated by releasing the payloads from the AUV payload compartment under different separation conditions. The following computational conditions are considered:
  • AUV velocities Vx are set at 0 kn, 2 kn, 4 kn, and 6 kn;
  • Initial separation velocities Vz are set at 0 m/s, 0.5 m/s, 1 m/s, and 2 m/s;
  • Initial pitching angular velocities ω0 are chosen as 0.25 rad/s, 0 rad/s, −0.5 rad/s, and −1.0 rad/s;
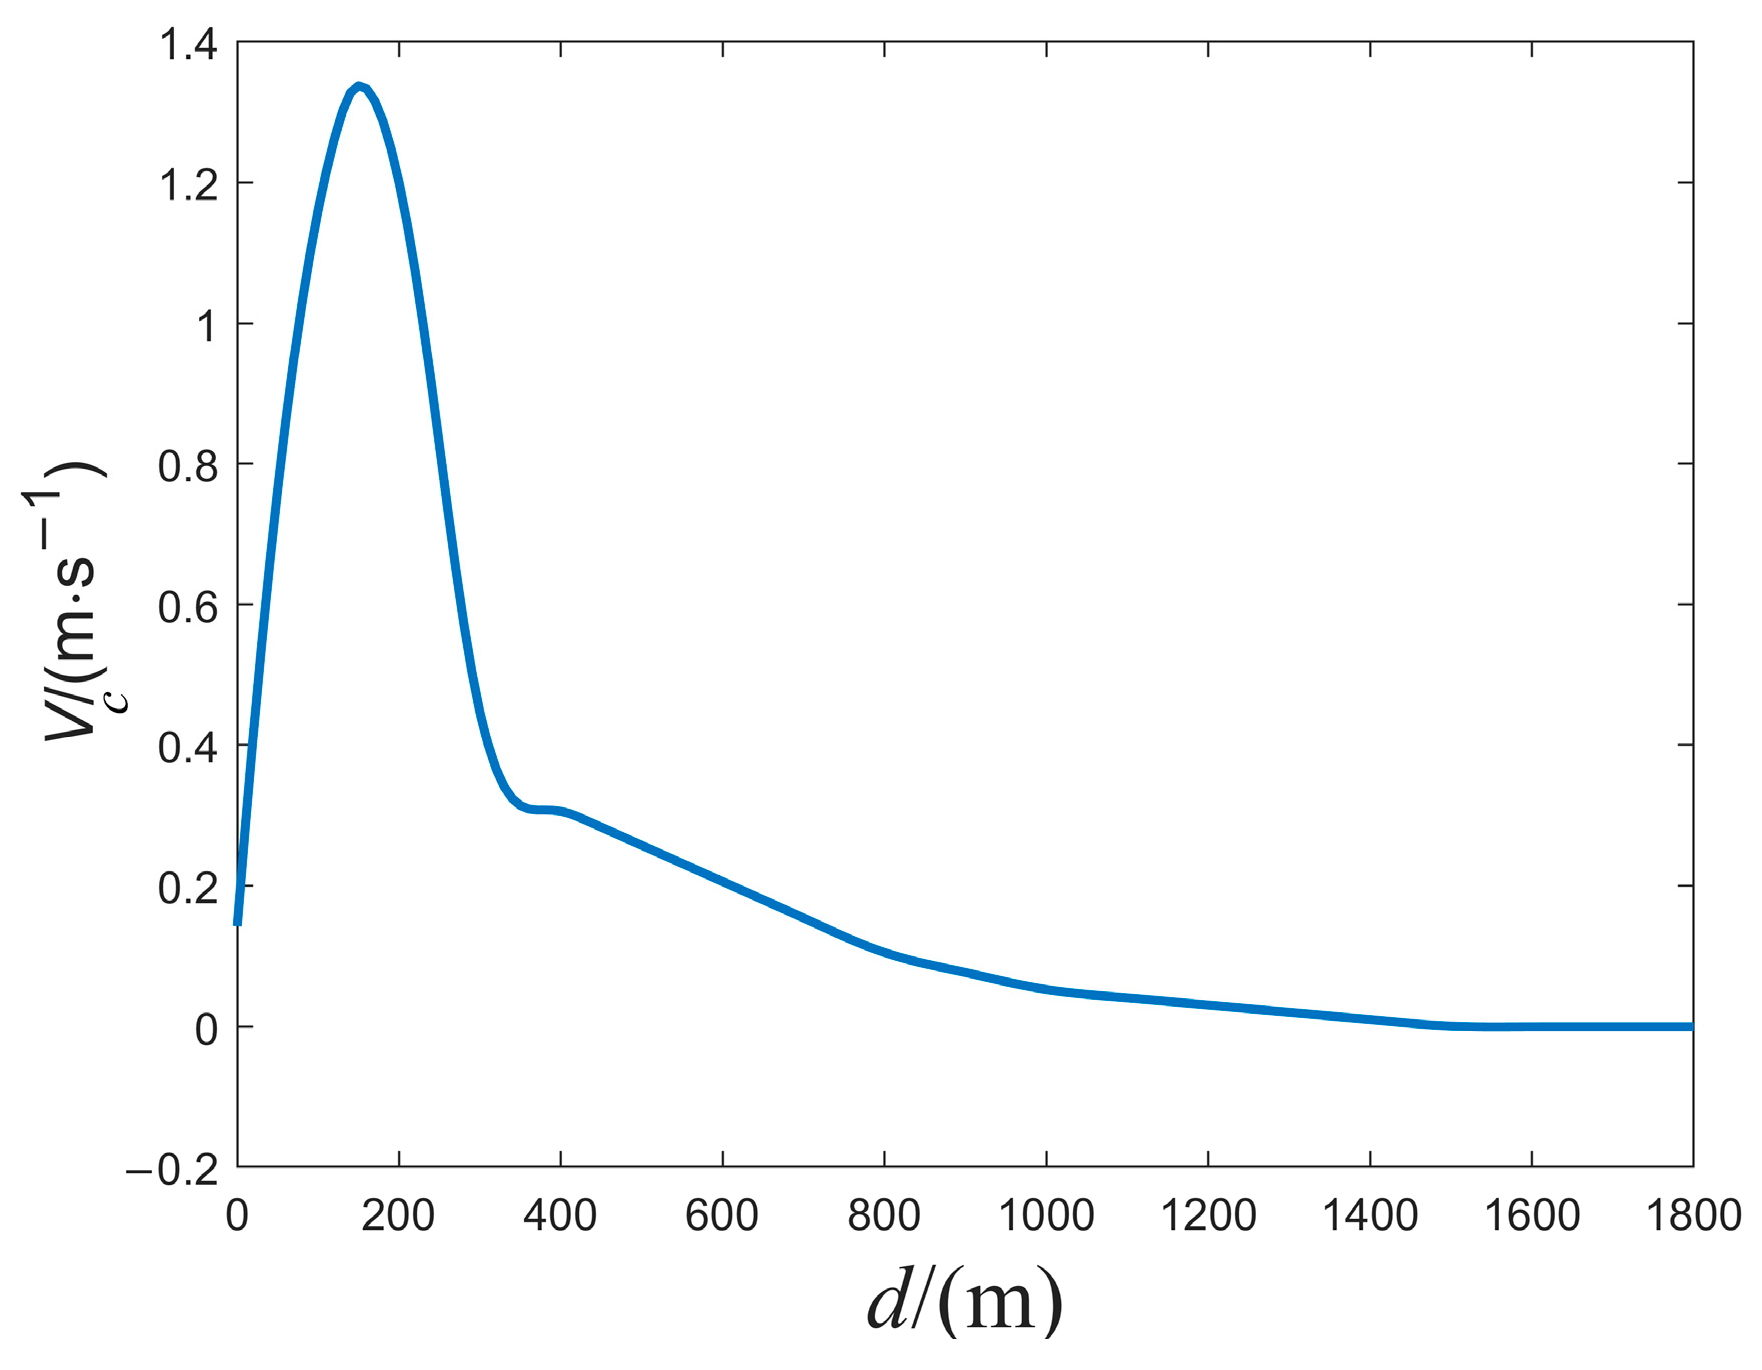
  • Ocean currents are varied at different navigation depths.

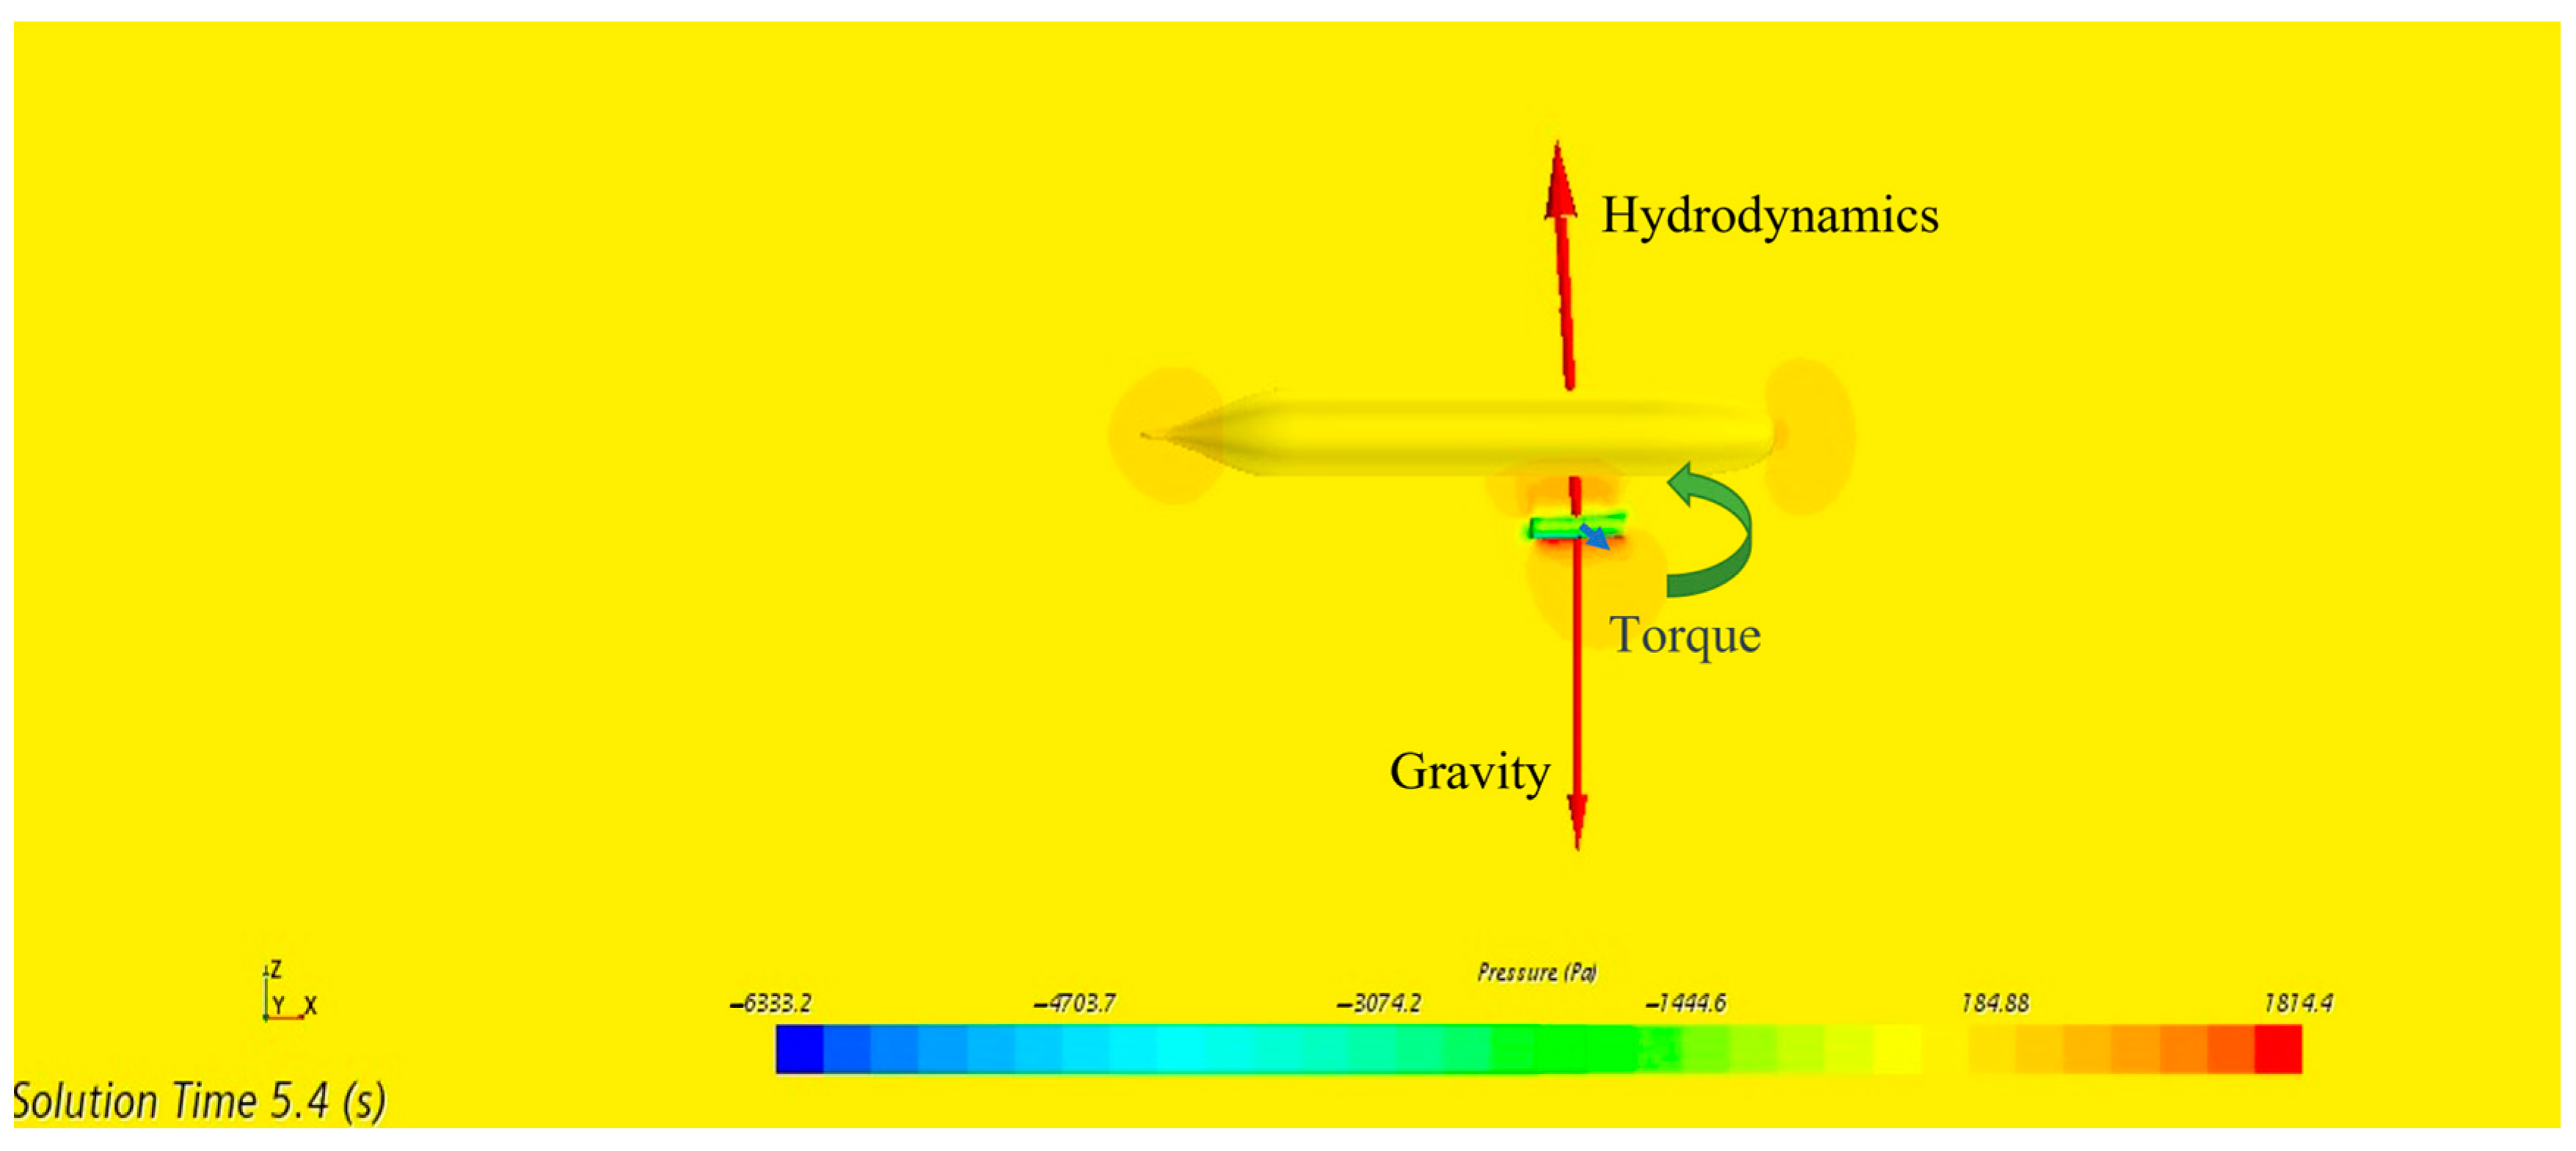
2.2. Governing Equation

In this paper, the RANS equation is used as its basic control framework to simulate the unsteady flow process using an implicit solution method. The CFD methodologies, anchored in the RANS equations, are effectively established to address fluid dynamics challenges in engineering, as supported by [21]. The RANS equations can depict the evolution of averaged flow field variables in turbulent motion, achieved through time-averaging the unsteady flow governing equations and primarily focusing on large-scale, time-averaged flow phenomena. This approach has been extensively implemented in hydrodynamic CFD analyses. The RANS equations include the averaged mass (as described in Equation (1)) and momentum transport (as described in Equation (2)) equations represented as follows:
ρ t + ρ v ¯ = 0
t ( ρ ) + ( ρ v ¯ v ¯ ) = P ¯ + ( T + T R A N S ) + f b
where ρ is density, v ¯ indicates the mean velocity, P ¯ refers to mean pressure, I stands for Laplace operator, T denotes the viscous stress tensor, T R A N S indicates an additional viscous stress tensor, and f b is the net force obtained from volume forces.
The T R A N S represents the additional stress tensor induced by turbulence expressed within the RANS framework. T R A N S is specialized in various RANS models. T t is a specific instance of T R A N S under specific assumptions, such as the Boussinesq approximation [22]. In RANS models, T R A N S may include more complex terms to simulate the turbulence effects more accurately, whereas T t typically has a simplified expression. The eddy viscosity model describes the Reynolds stress tensor versus the mean flow based on the concept of turbulent viscosity ν t . The most common model is known as the Boussinesq approximation:
T t = 2 ν t S 2 3 ( ν t v ¯ ) I
where S is the mean strain rate tensor, ν t is the turbulent viscosity, and I is the identity tensor. The turbulence model specifies the turbulent viscosity ν t . Standard turbulence models include the Spalart–Allmaras model, the k-ε model, and the k-ω model. The default Boussinesq approximation represents a linear constitutive relation [23].

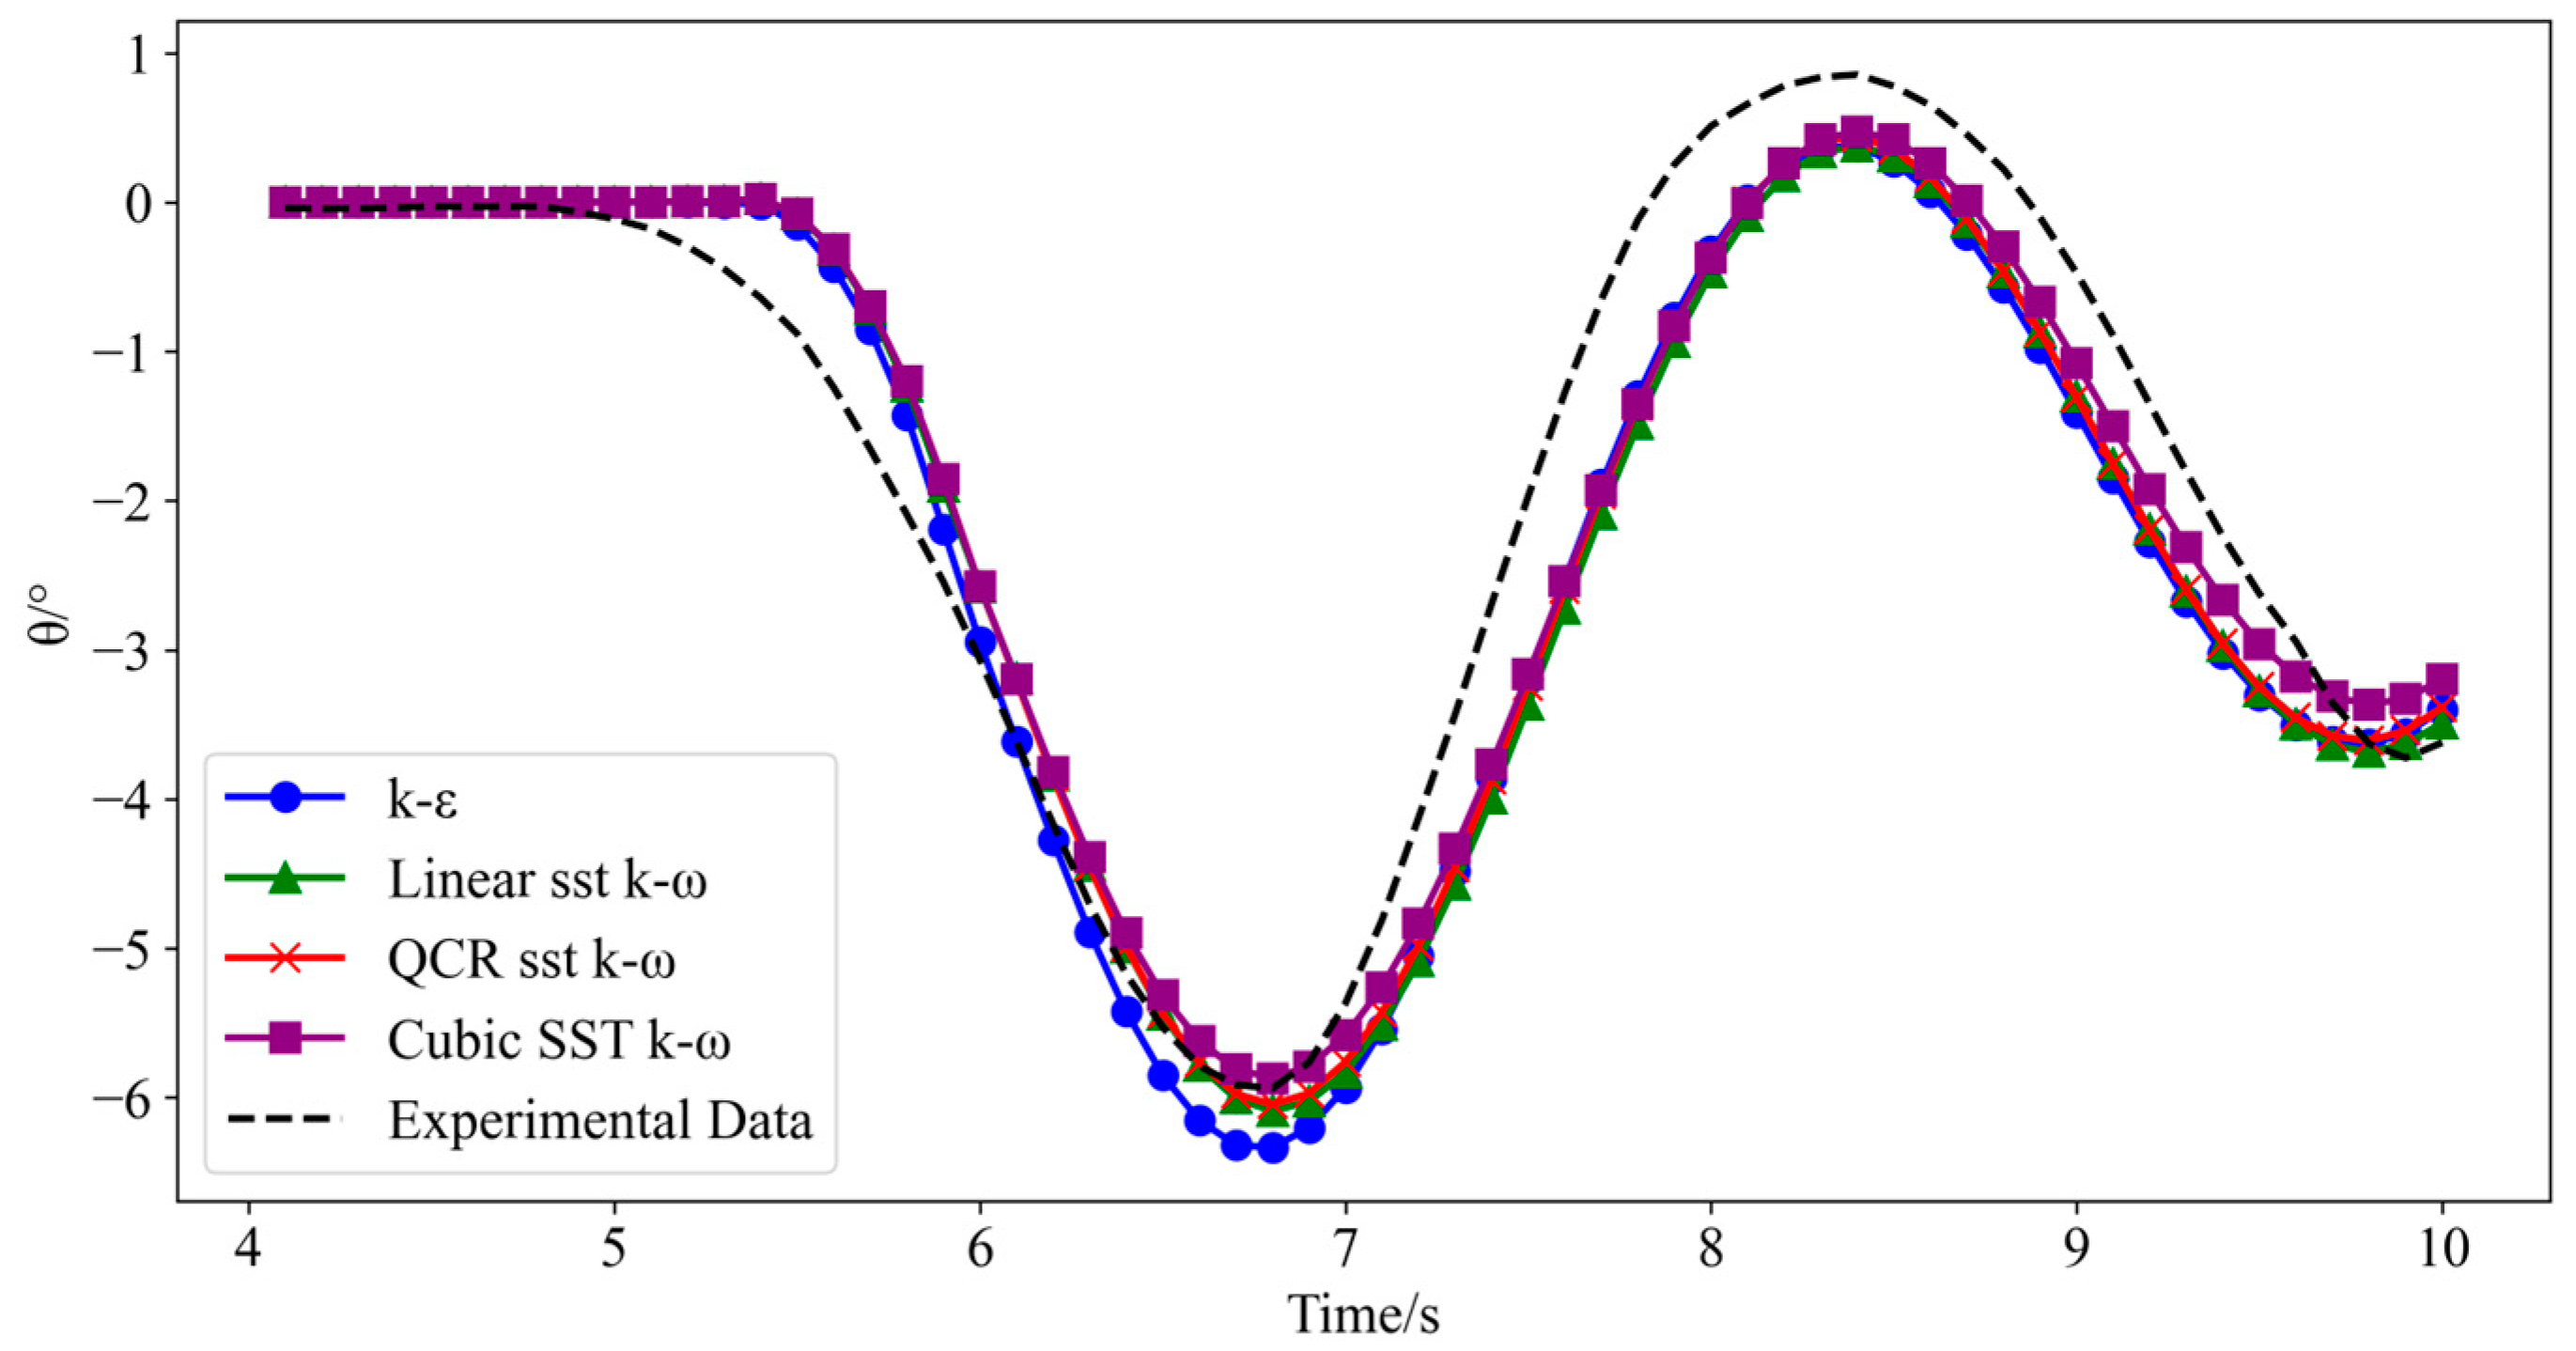
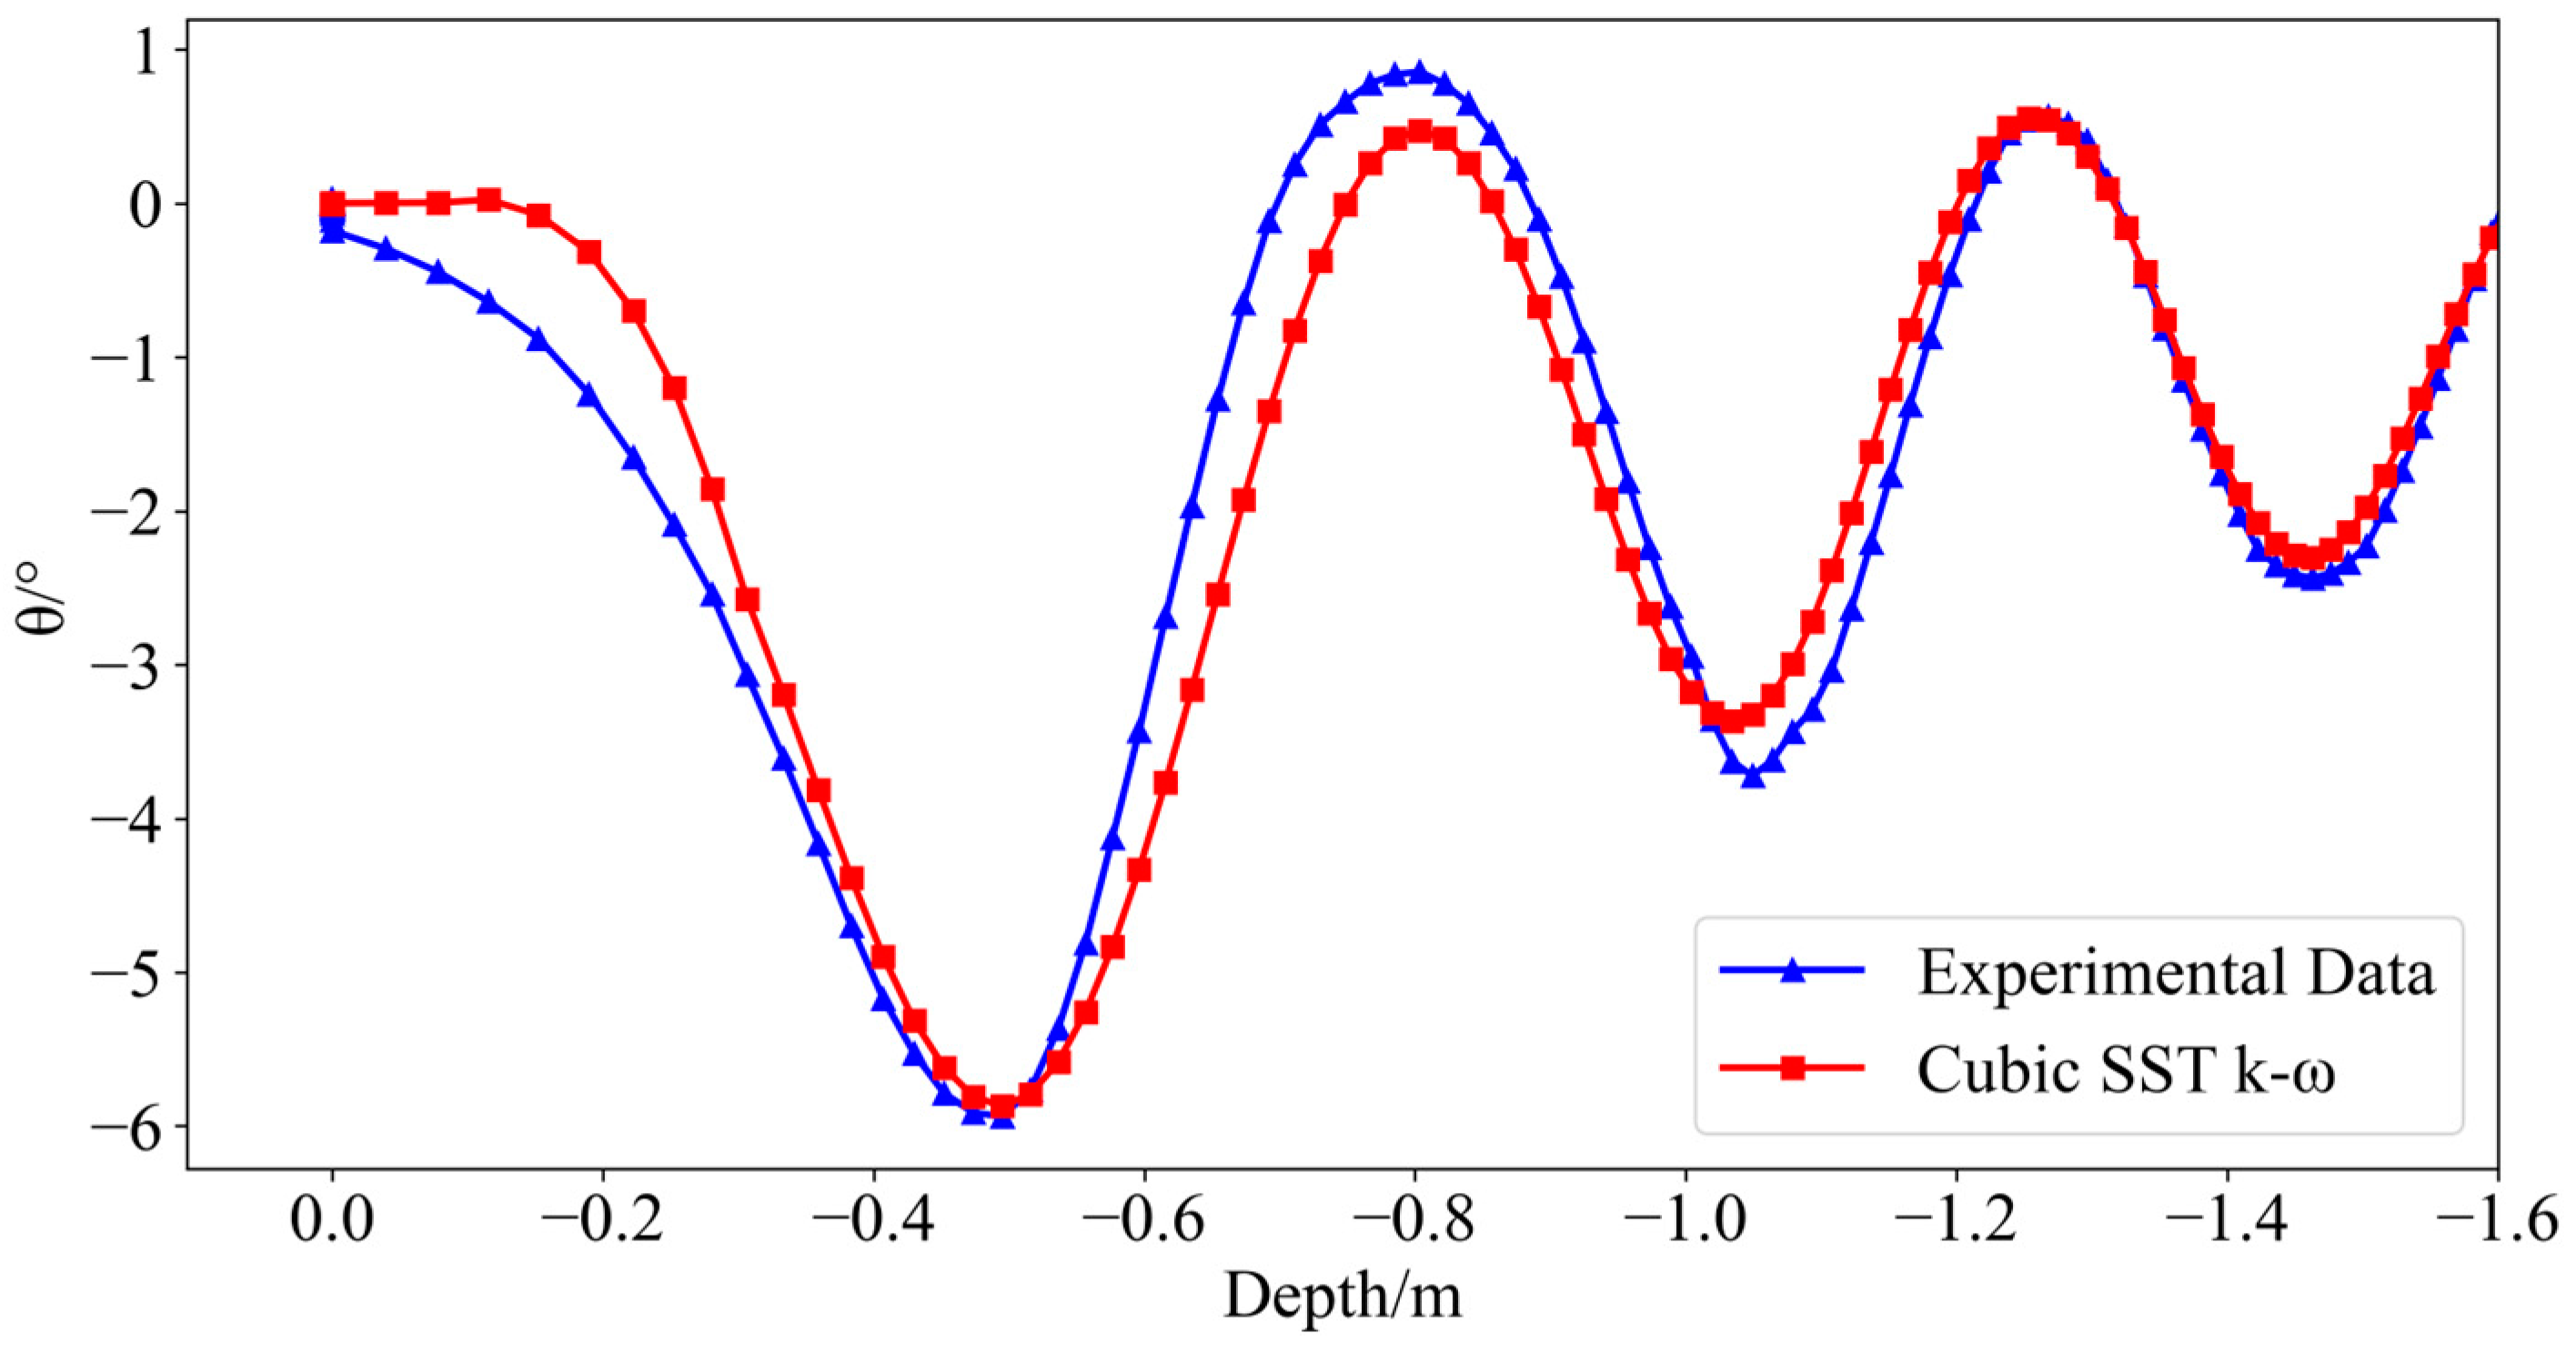
2.3. Selection of the Turbulence Model

The RANS equations describe only the mean flow field, and turbulence models approximate the effects of turbulent eddies. Turbulence models consider the statistical features of turbulence to estimate the impact of turbulent motion. The k-ε model, commonly used in CFD simulations of turbulent fluid dynamics and widely applied in near-wall turbulence modeling in engineering fields, describes the velocity and turbulent energy distribution of the turbulent flow [24]. Wilcox’s modified formulation of the k-ω turbulence model [25] includes a single new closure approach and an adjustment describing the dependence of the eddy viscosity on turbulence properties. Menter’s [26] SST k-ω turbulence model combines the k-ε and k-ω models using a blending function, enhancing accuracy and stability under various turbulent conditions. The SST k-ω model establishes a relationship between the constitutive relations and the turbulent viscosity ν t , a key parameter used to approximate turbulent stresses, primarily based on linear and quadratic constitutive relations [27] without directly including cubic constitutive relations [28,29]. The linear and quadratic constitutive relations in the SST k-ω turbulence model typically do not directly include the cubic constitutive relations used in more advanced RSM. However, the cubic relations within the Reynolds Stress Model (RSM) provide a more detailed description of turbulent structures, allowing the model to capture more complex turbulent phenomena. This enhancement is evident in the SST k-ω model implemented in the STAR-CCM+ software (version: v2022.3), which incorporates cubic constitutive relations. The inclusion of cubic constitutive relations, along with the turbulent viscosity relationship, reflects the primary improvement achieved in the SST k-ω model, contributing to a more comprehensive representation of turbulent behavior. Although the RSM outperforms the SST k-ω model in anisotropic turbulence, it has the disadvantage of being computationally more expensive [30]. Therefore, the cubic model balances these two models. The turbulent energy equation is typically written as follows:
( ρ k ) t + ( ρ k U j ) x j = x j [ ( ν + ν t σ k ) k x j ] ρ ε + P k β * ρ k ω
where k is the turbulent kinetic energy, ν is the kinematic viscosity, ω is the turbulence dissipation rate, and ε is the generation term of ω. The parameter β * estimates the production of turbulent energy, x j are the spatial coordinates, and U j are the velocity components. The k-ω model turbulent viscosity in the cubic constitutive relationship (5) can be expressed as follows:
ν t = 1 2 β * ( β 1 + i   j   W i j * W j i * β 2 ) ρ k T
where β 1 and β 2 are model coefficients, W i j * is the normalized vorticity tensor, and T is the turbulence timescale.
This study employed the Star-CCM+ software to simulate the initial separation of blunt body payloads tailored to their specific separation characteristics. The SST k-ω model and the cubic constitutive relation were finally chosen through experimentation. Furthermore, the Gamma transition model [31], coupled with a second-order upwind convection scheme, was utilized. The research incorporated dynamic fluid interaction with overlapping grid technology to enhance the simulation’s accuracy and applicability.

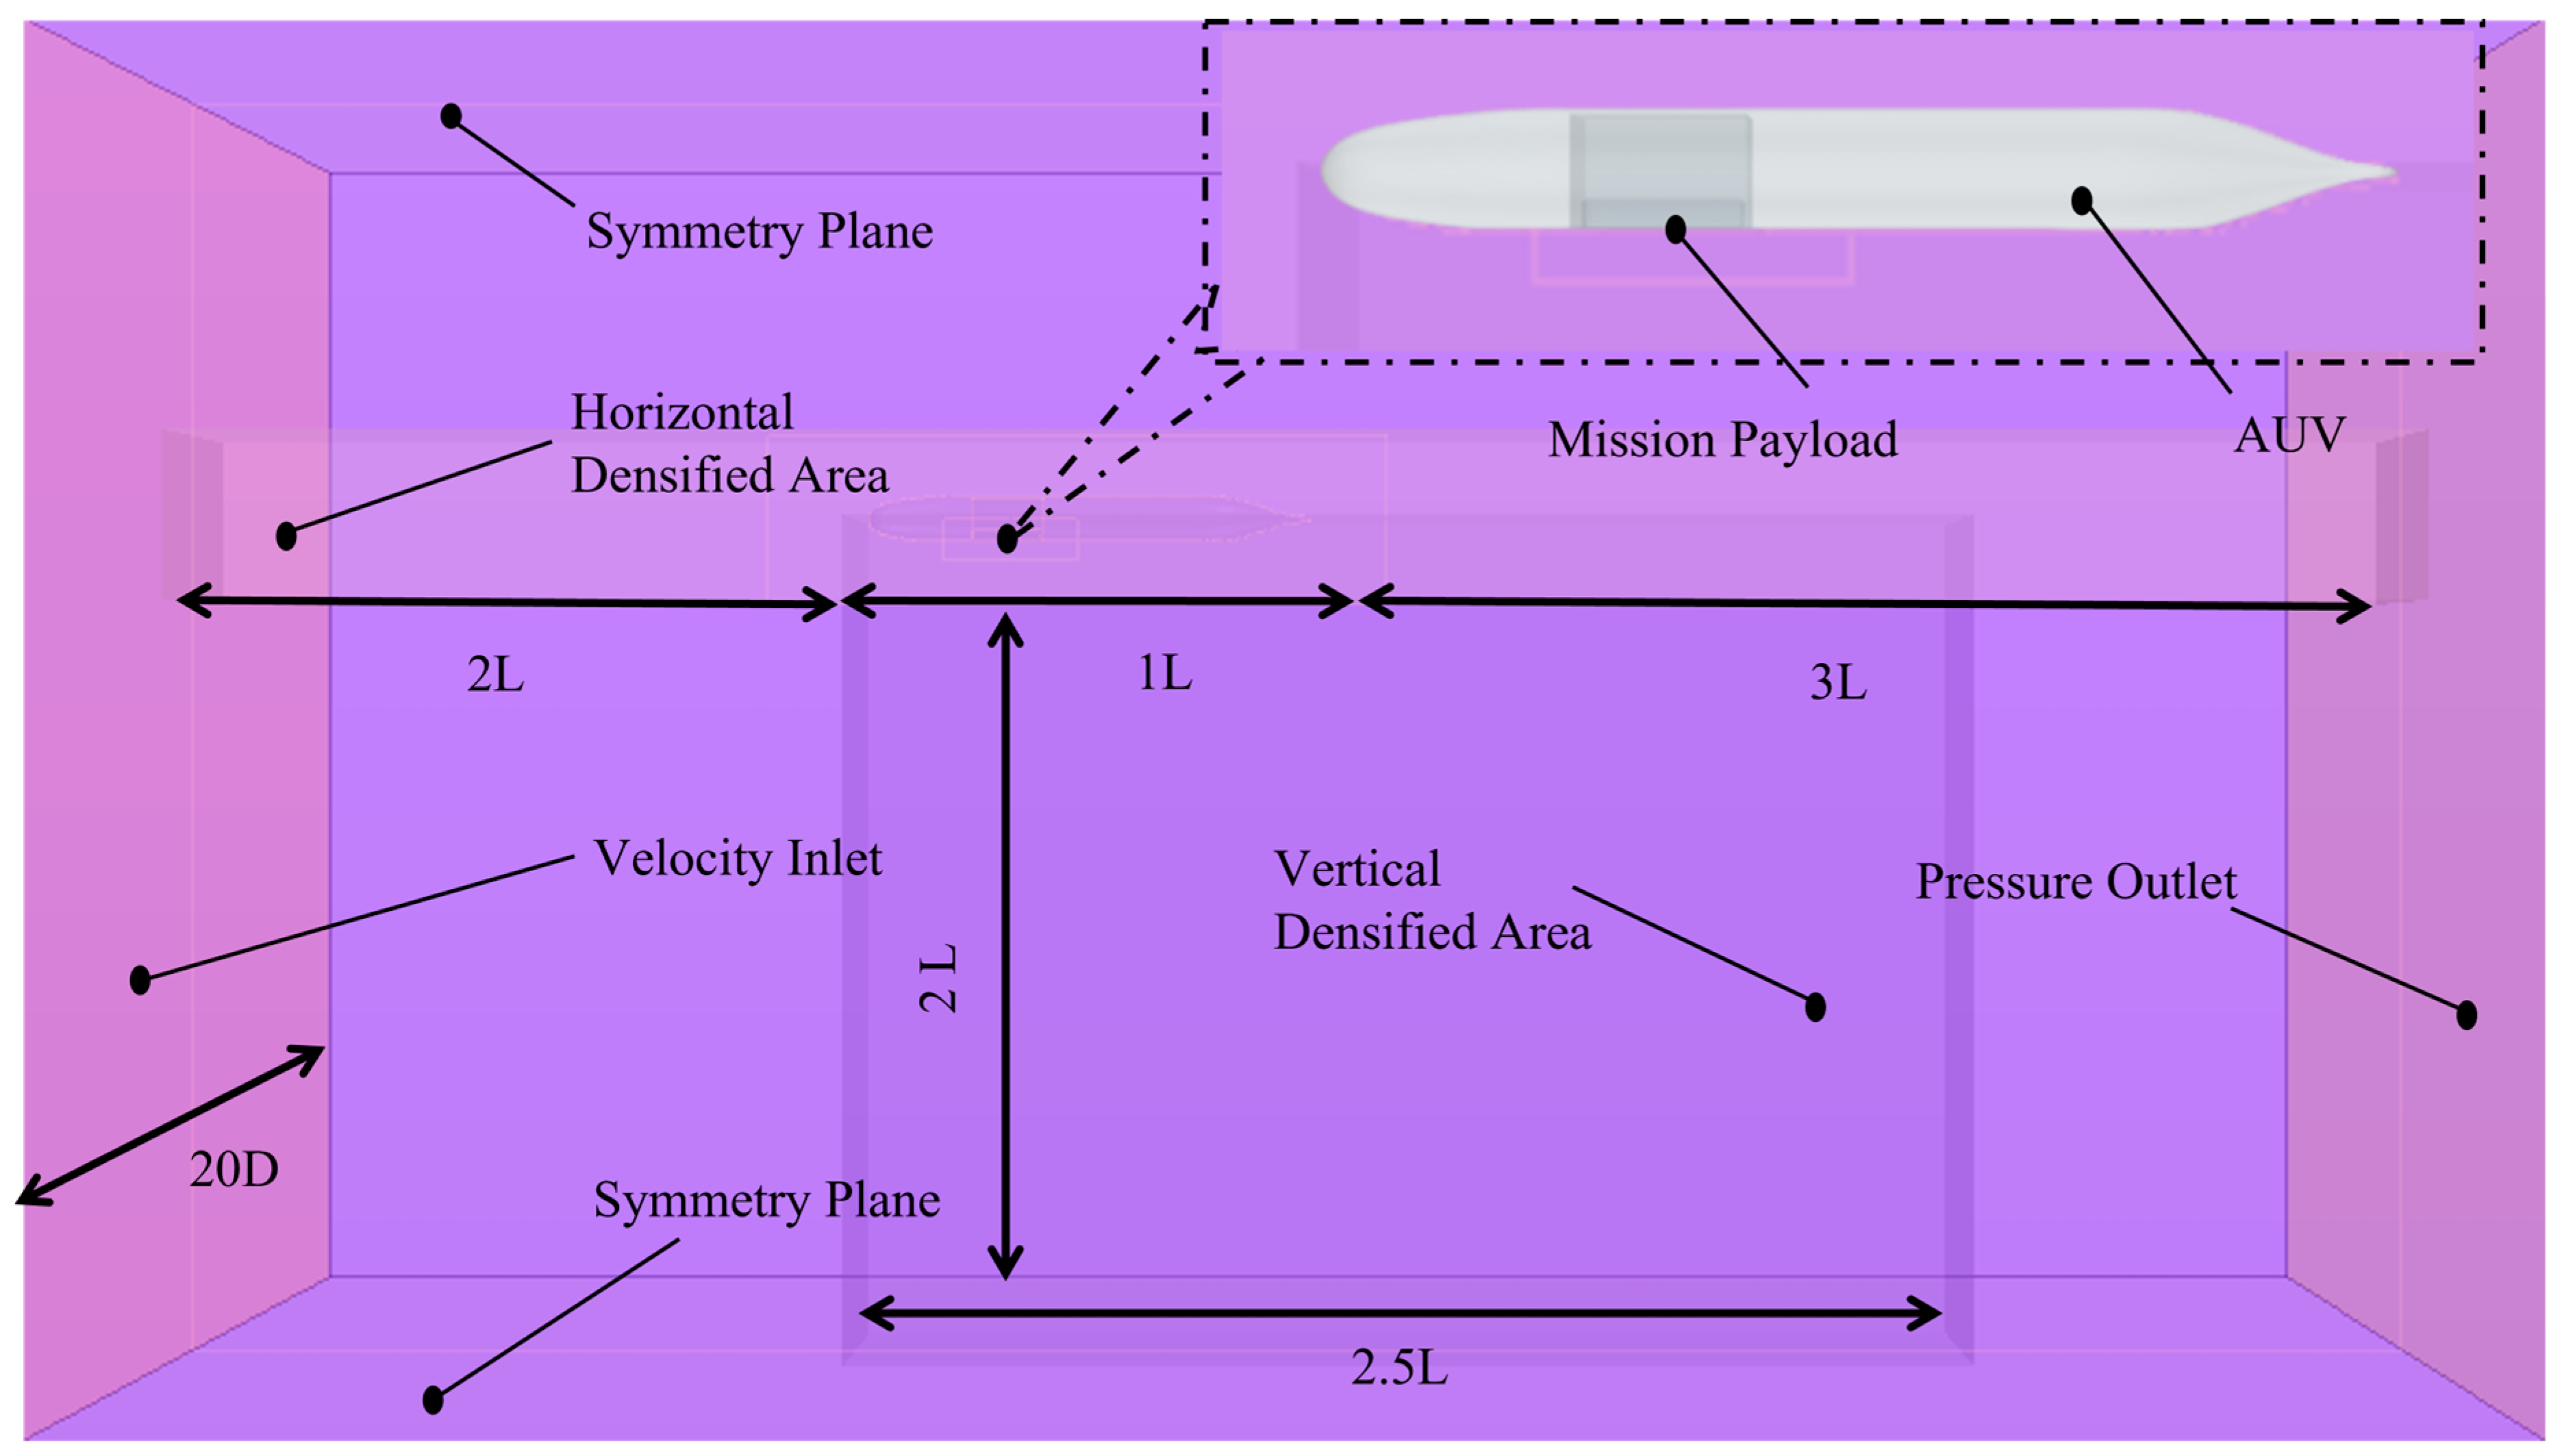
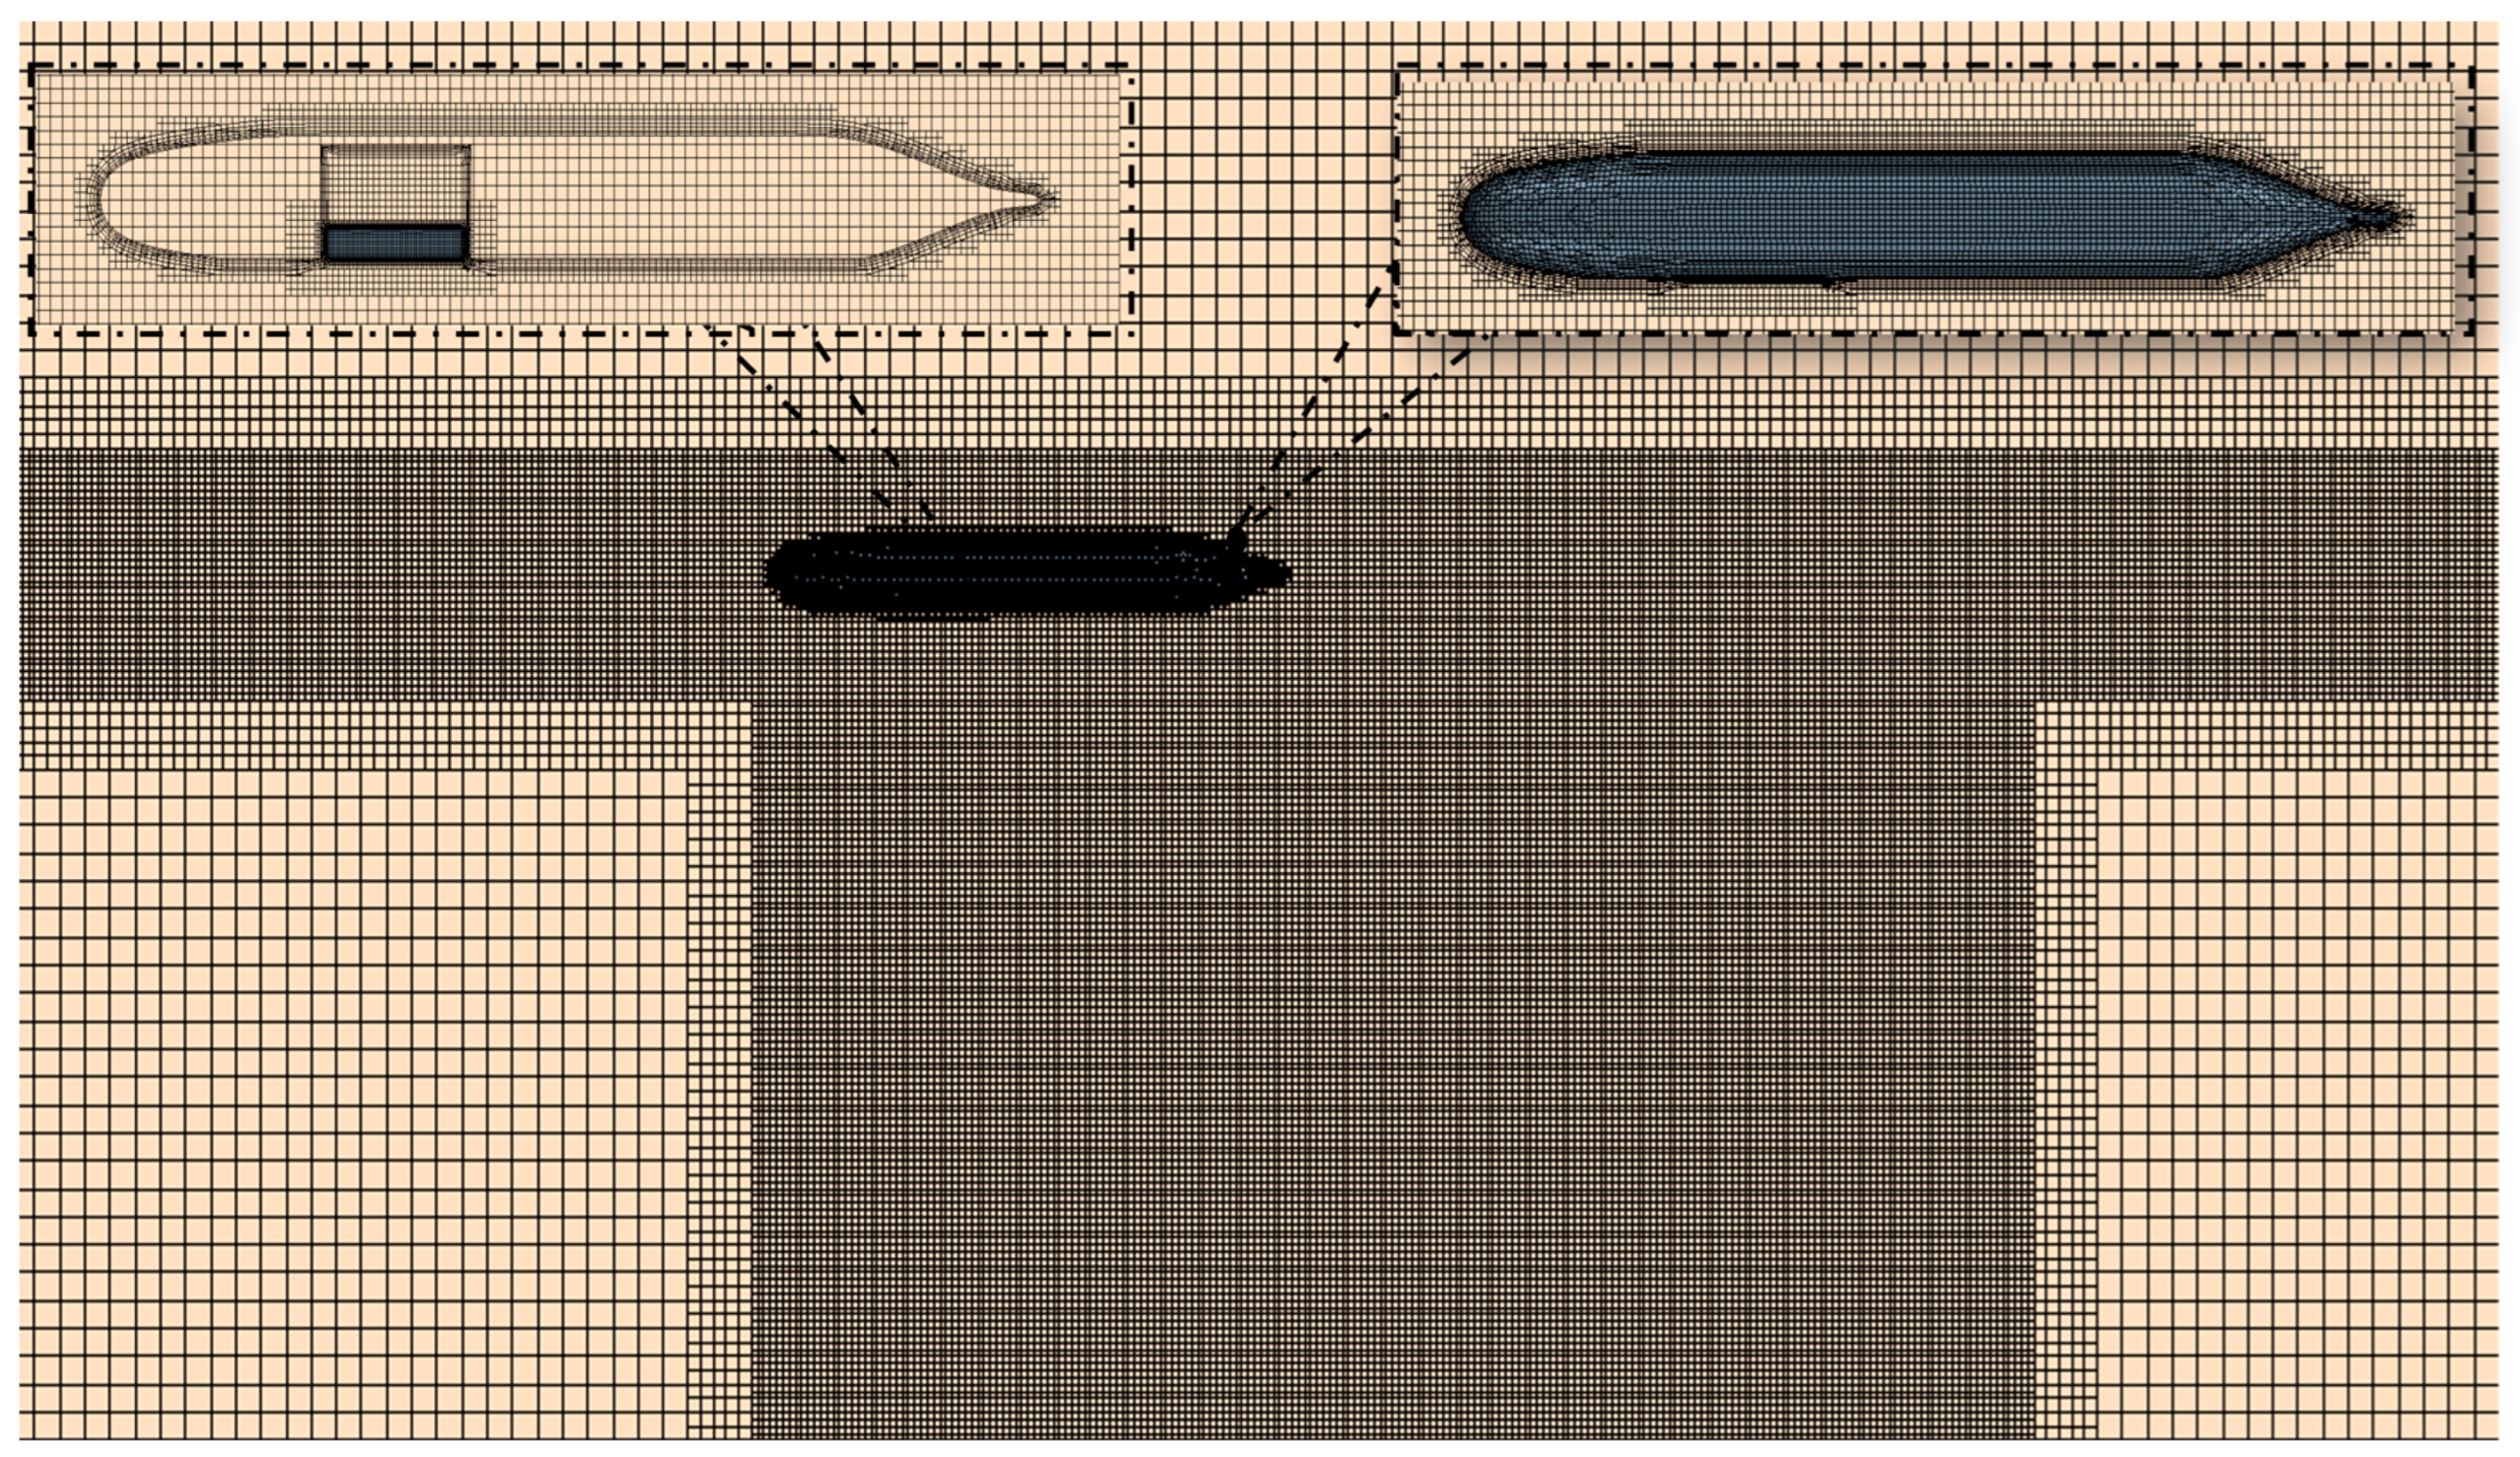
2.4. DFBI and Overlapping Grid

The payload with a rounded rectangular cross-section, is modeled dynamically akin to conventional rotary-body AUVs, establishing a spatial 6-degree-of-freedom equation for the payload. The initial separation movement issues between the payload and AUV are addressed using DFBI rotation and translation methods [32]. In addition to this, attribute parameters are set, such as release time, buffer time, initial separation velocity, and initial angular velocity of the payload. The DFBI rotation and translation model, in conjunction with overlapping and moving grid techniques, divides the computational area into multiple independent grid blocks. In order to enhance computational efficiency, each block typically takes a coarser grid for approximation. Grids between blocks can overlap, allowing various grid densities within different simulation region areas. This approach facilitates the simultaneous handling of coarse and fine grids within the same simulation, enabling more accurate capturing of complex physical phenomena. The AUV, payload, and towing tank grid divisions intersect each other through multiple overlapping grids.

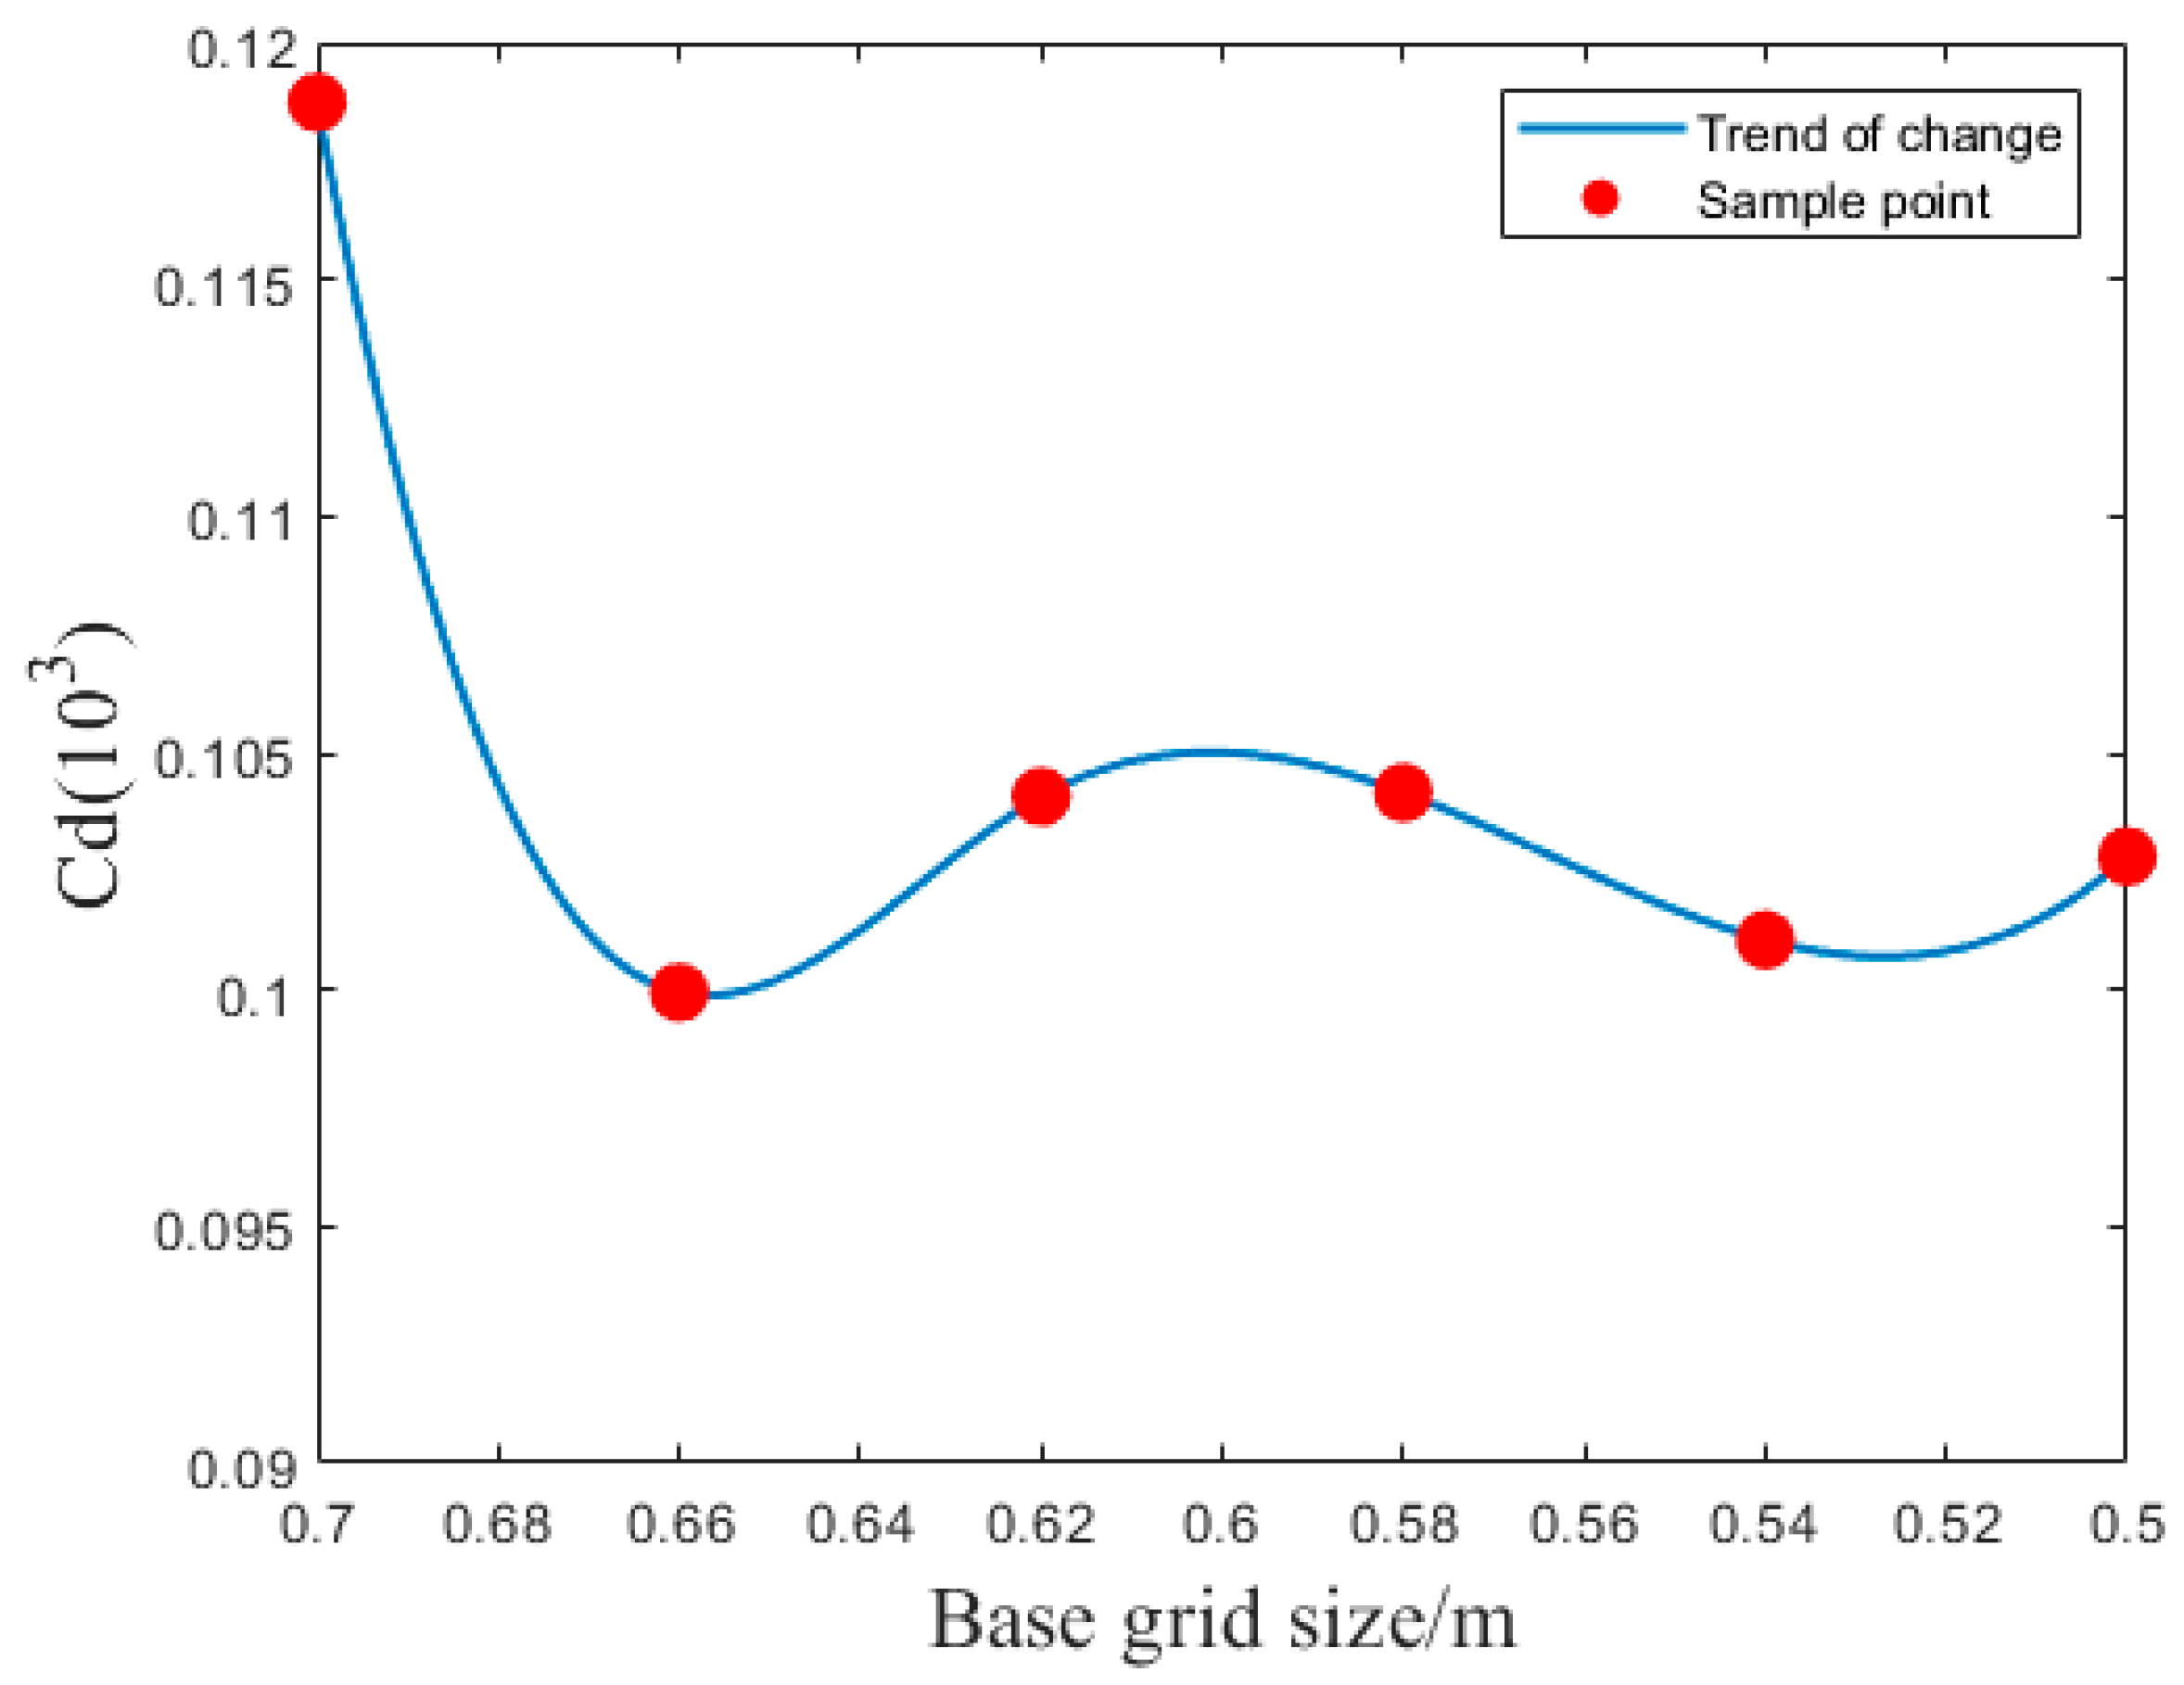
2.5. Simulation Settings and Grid Independence Analysis

The simulation utilized the following configuration. The selected termination criterion was based on the maximum physical time, set at 15 s. Solver selection implicit unsteady solver, with a fixed time step of 0.05 s. The overset grid encompasses the AUV grid, the mission payload grid, and the towing pool grid. Furthermore, the DFBI model regulates the release time to occur at 5 s, with an additional buffer of 1 s. This study selects a rectangular solid measuring 60 m × 20 m × 30 m as the computational domain. During horizontal and vertical deployment, volume control refinement is applied in the vertical region directly below the AUV and the payload. Grid densification is performed on the surface areas of both the AUV and the payload to enhance the computational precision near the AUV carrier. As described in Figure 3, the left side is designated as the velocity inlet, while the right side is set as a pressure outlet with the outlet pressure fixed at 0. The surrounding sides are defined as symmetric faces, and the AUV and payload surfaces are treated as wall boundaries. Regarding grid parameters, the generator is set to ‘cut body’ with the selected hexahedral grid types. The prism layer thickness is 10% of the base dimension, with five layers and a 1.2 growth rate, facilitating effective simulation of the fluid’s near-wall flow.
Since the grid division in CFD requires careful consideration of the computational hardware performance and the tolerance for the result accuracy, an appropriate grid size should be selected for the calculations, demonstrating the importance of grid independence verification. This paper primarily simulates the effects of flow field changes around the AUV during straight-line navigation on the payload. Due to the negligible effect of different grid sizes on the axial and longitudinal force variations on the payload, various base grid sizes were selected to calculate the drag during the AUV’s straight navigation. The incoming flow velocity at the velocity inlet was set to −2.0567 m/s, introducing the straight-line navigation drag coefficient Cd to visually express changes in drag. As shown in Table 2, when the grid count exceeds 2,533,876, the straight-line navigation drag coefficient Cd remains relatively stable within a small range of variation. Observing Figure 4, it is evident that when the grid base size is less than 0.65, the variation in Cd is minimal, and further increasing the grid count has little impact on the results. Taking into account the overall computational cost, a grid base size of 0.62 is chosen for subsequent simulation grid settings. Figure 5 describes the final grid division.

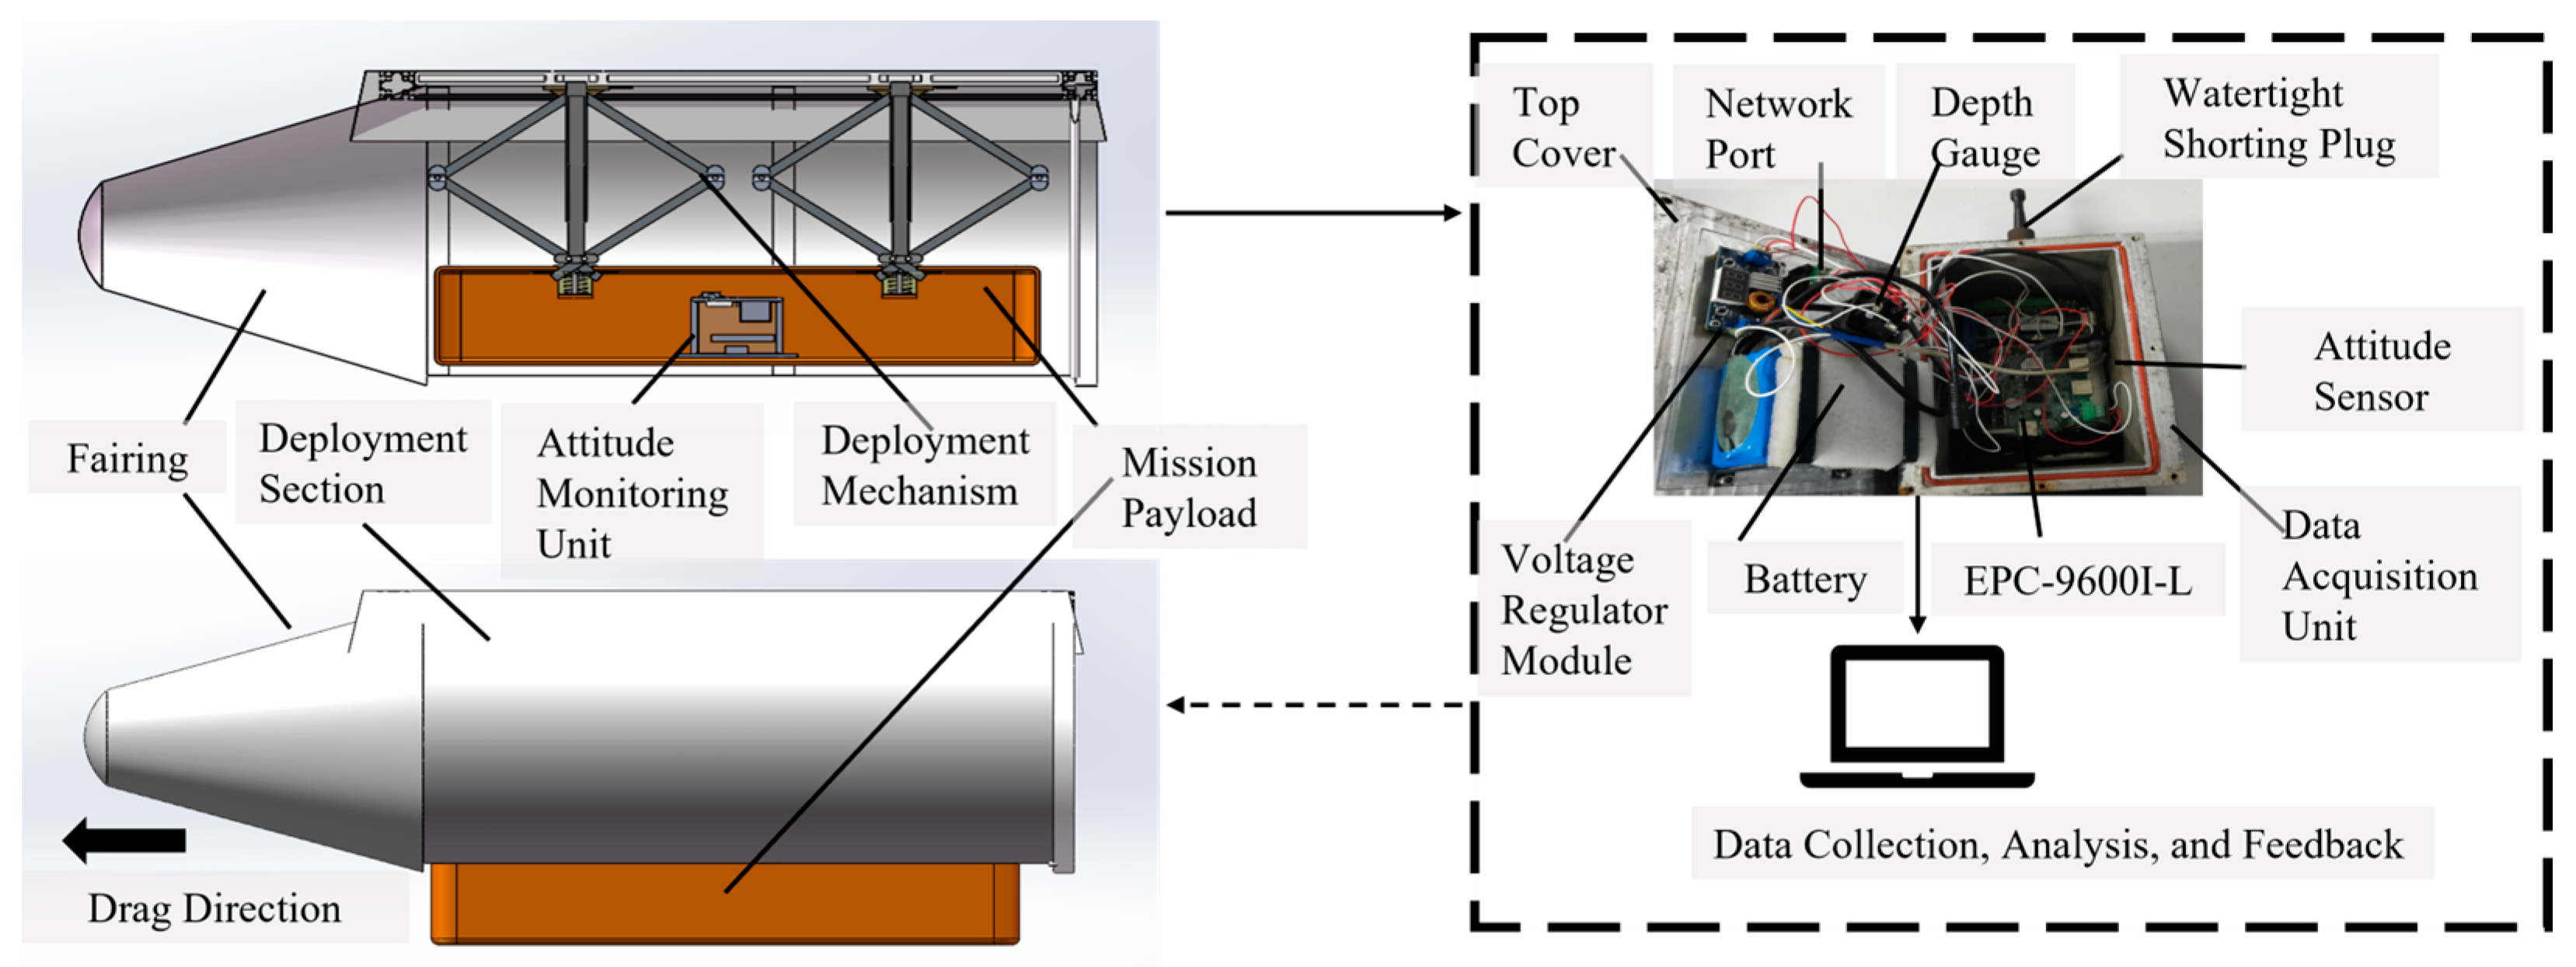
3. Test Platform and Verification

In order to evaluate the accuracy of the numerical simulation method, an appropriate turbulence model was selected, and a payload separation test platform was constructed to perform towing deployment tests over a lake. As shown in Figure 6, the test area was a 60 m × 40 m × 10 m region with a 35 m effective towing distance. The comprehensive experimental platform comprises three integral parts: the external shell, the internal deployment mechanism, and the mission payload. The external shell is subdivided into fairing and deployment sections designed to generate a characteristic fluid flow. The mission payload, equipped with an internal attitude monitoring device, featured a blunt body shape with a rounded rectangular cross-section. The deployment mechanism adopted a SC63 × 300 pneumatic cylinder and a connecting rod powered by an air compressor. A flexible hose connected the compressor to the pneumatic cylinder, complemented by control switches, pressure gauges, and three-way valves. The attitude angle monitoring box mainly comprised an EPC-9600I-L, attitude sensor, depth meter, voltage stabilizing module, and lithium battery pack. It acquired attitude and depth information during towing tests, as shown in Figure 7. In order to facilitate the actuation of the folding arm through cylinder extension and retraction, an air compressor mounted on the towing device drove the deployment mechanism via a hose connected to the cylinder’s air inlets and outlets. The air compressor’s pressure was changed to modulate the initial descent velocity of payload release. Additionally, the deployment speeds of the two mechanisms were differentially adjusted by manipulating the position of a three-way valve. This experimental platform is constructed to maintain a horizontal orientation while towing underwater, ensuring the effective deployment of the mission payload. The platform can be inverted on the surface of the water after post-deployment simplifying the payload’s reinstallation and retrieval, enhancing the platform’s safety and reliability.

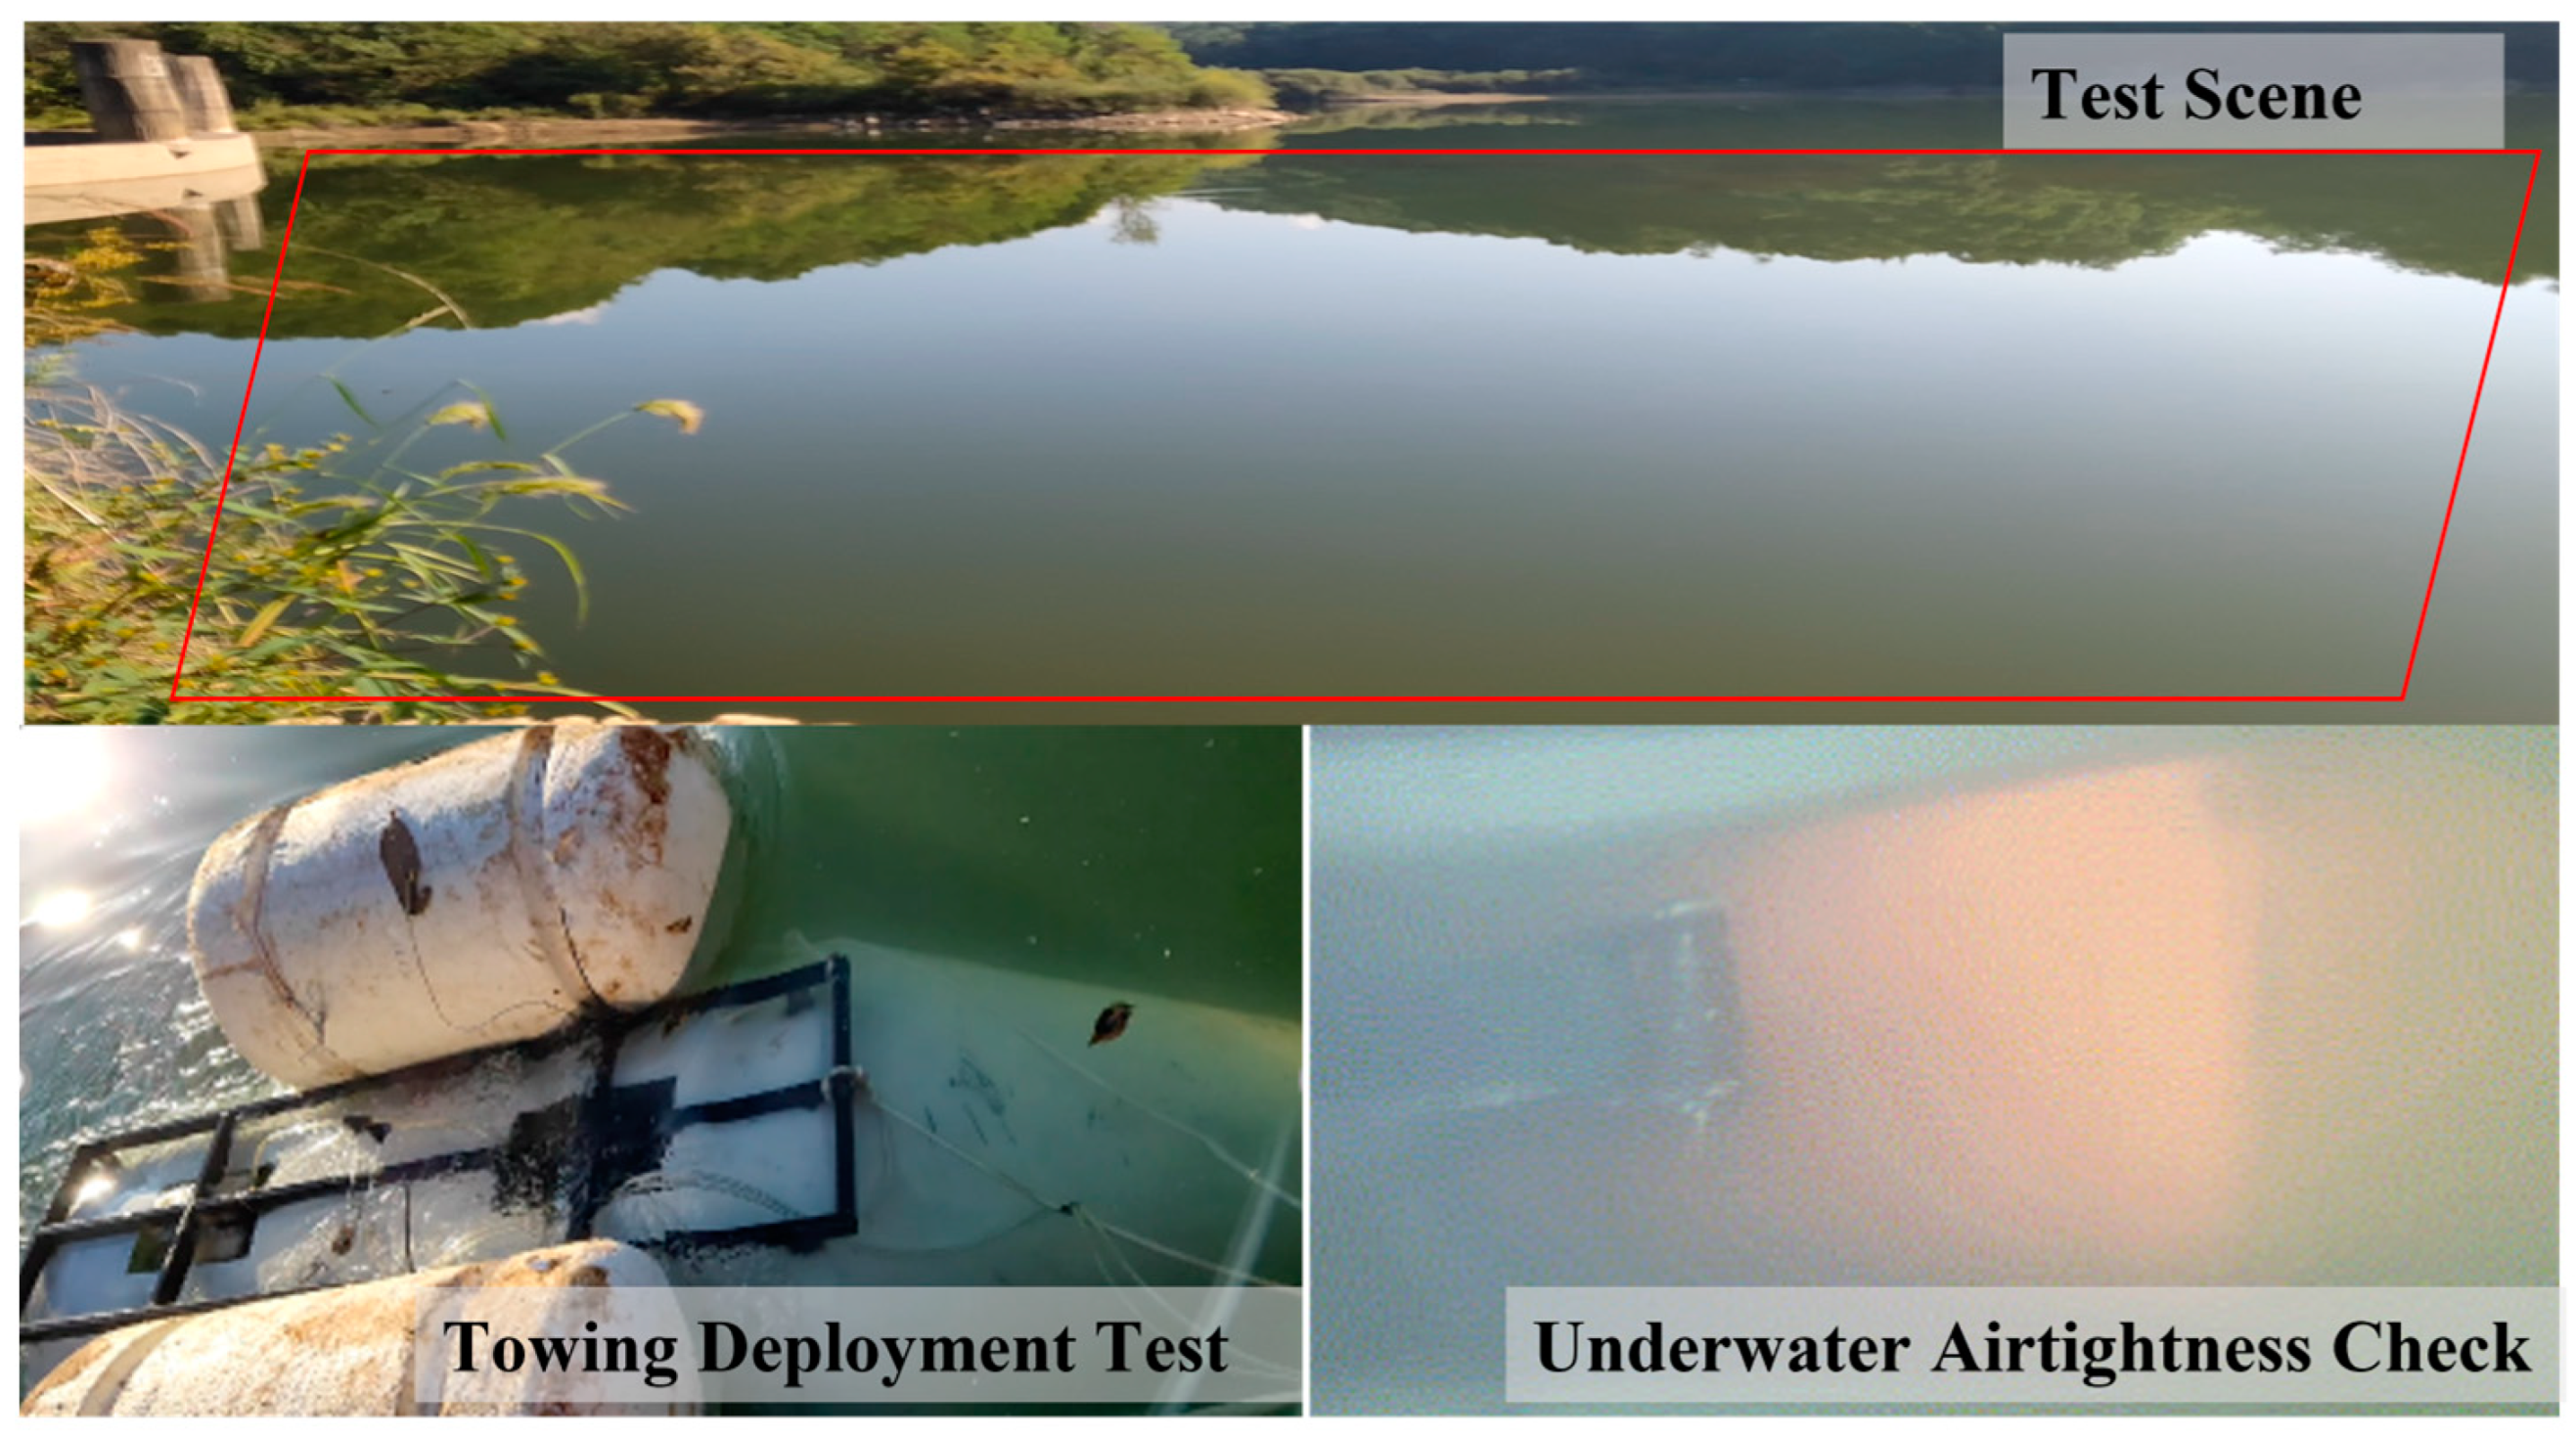
3.1. Experimental Process

The towing test platform simulated the payload platform deployment under the AUV’s cruising state. Test data were acquired by iteratively simulating achievable deployment conditions on the platform and taking the average values. The process of payload release from the test platform was as follows:
  • Pressure Maintenance: An air compressor was employed to pressurize the system. The switch was turned, and the cylinder’s reciprocating motion was checked. Synchronized push–pull movements of the two cylinders indicated normal conditions.
  • Payload Loading: A rod fork was inserted into the payload’s mounting port. The switch was turned counterclockwise, and the release mechanism pulled the payload back to the center of the test platform to complete the installation.
  • Water Entry: After entering the water, the buoy’s position was adjusted to maintain a horizontal state of the test platform for five minutes, and the airtightness of the deployment mechanism system (pressure gauge) was verified.
  • Deployment: The towing mechanism was towed horizontally. Upon reaching the predetermined velocity, the switch was turned clockwise to deploy the payload into the water. Then, the timing was commenced.
  • Recovery: A 25 m safety rope was reserved, where its ends were connected to a recovery ring on the payload and a fixed position near the deployment point. The payload was recovered 20 s after release.
A spring-locking device was constructed to provide tighter integration and faster payload separation from the test platform. During the payload loading, the fork was inserted, and the spring pressure plate pressed the fork, securing the payload. During separation, the fork pushed the pressure plate, and the spring force acted on the payload to accelerate separation.

3.2. Validating Turbulence Models

The data on the pitch angle are extracted, since this significantly affects the safety of payload deployment, and the test platform and simulation data are compared at the same separation times, as shown in Figure 8. It was observed that the numerical simulation results in the initial separation phase have slightly lower variation than the experimental ones. The variation curves of different turbulence models are compatible with the experimental ones. The average absolute errors between each model and the experimental data are as follows: the k-ε model error is 0.3136, the linear SST k-ω model error is 0.3232, the QCR SST k-ω model error is 0.3068, and the cubic SST k-ω model error is 0.2798. As shown in Figure 9, the cubic SST k-ω model error is 0.2609 when comparing the same descent distance. This indicates the high credibility of the data acquired from numerical simulations. Ultimately, the cubic SST k-ω model was selected as the turbulence model for simulation, as determined through experimental validation.

4. Analysis of Simulation Results

The simulation results evaluation indicates that the roll and yaw angles undergo minimal variations during the initial separation phase with a negligible impact on safe separation. Conversely, significant variations in the pitch angle are noted, which influence the safety of the separation. According to the pressure distribution chart (Figure 10) and the force/moment exerted on the payload at 0.4 s after deployment, a moment is generated by the combined hydrodynamic forces and gravity at the onset of separation, causing the payload to pitch up. This serves as an illustrative instance in time, and the particular gesture requires further analysis and examination. Adjusting the cruising velocity and the initial vertical deployment velocity can significantly change the payload’s displacement and attitude angle. In order to ensure the payload’s swift and stable transit through the complex flow field surrounding the AUV, the displacement and attitude changes caused by different specific separation conditions are analyzed by manipulating control variables.

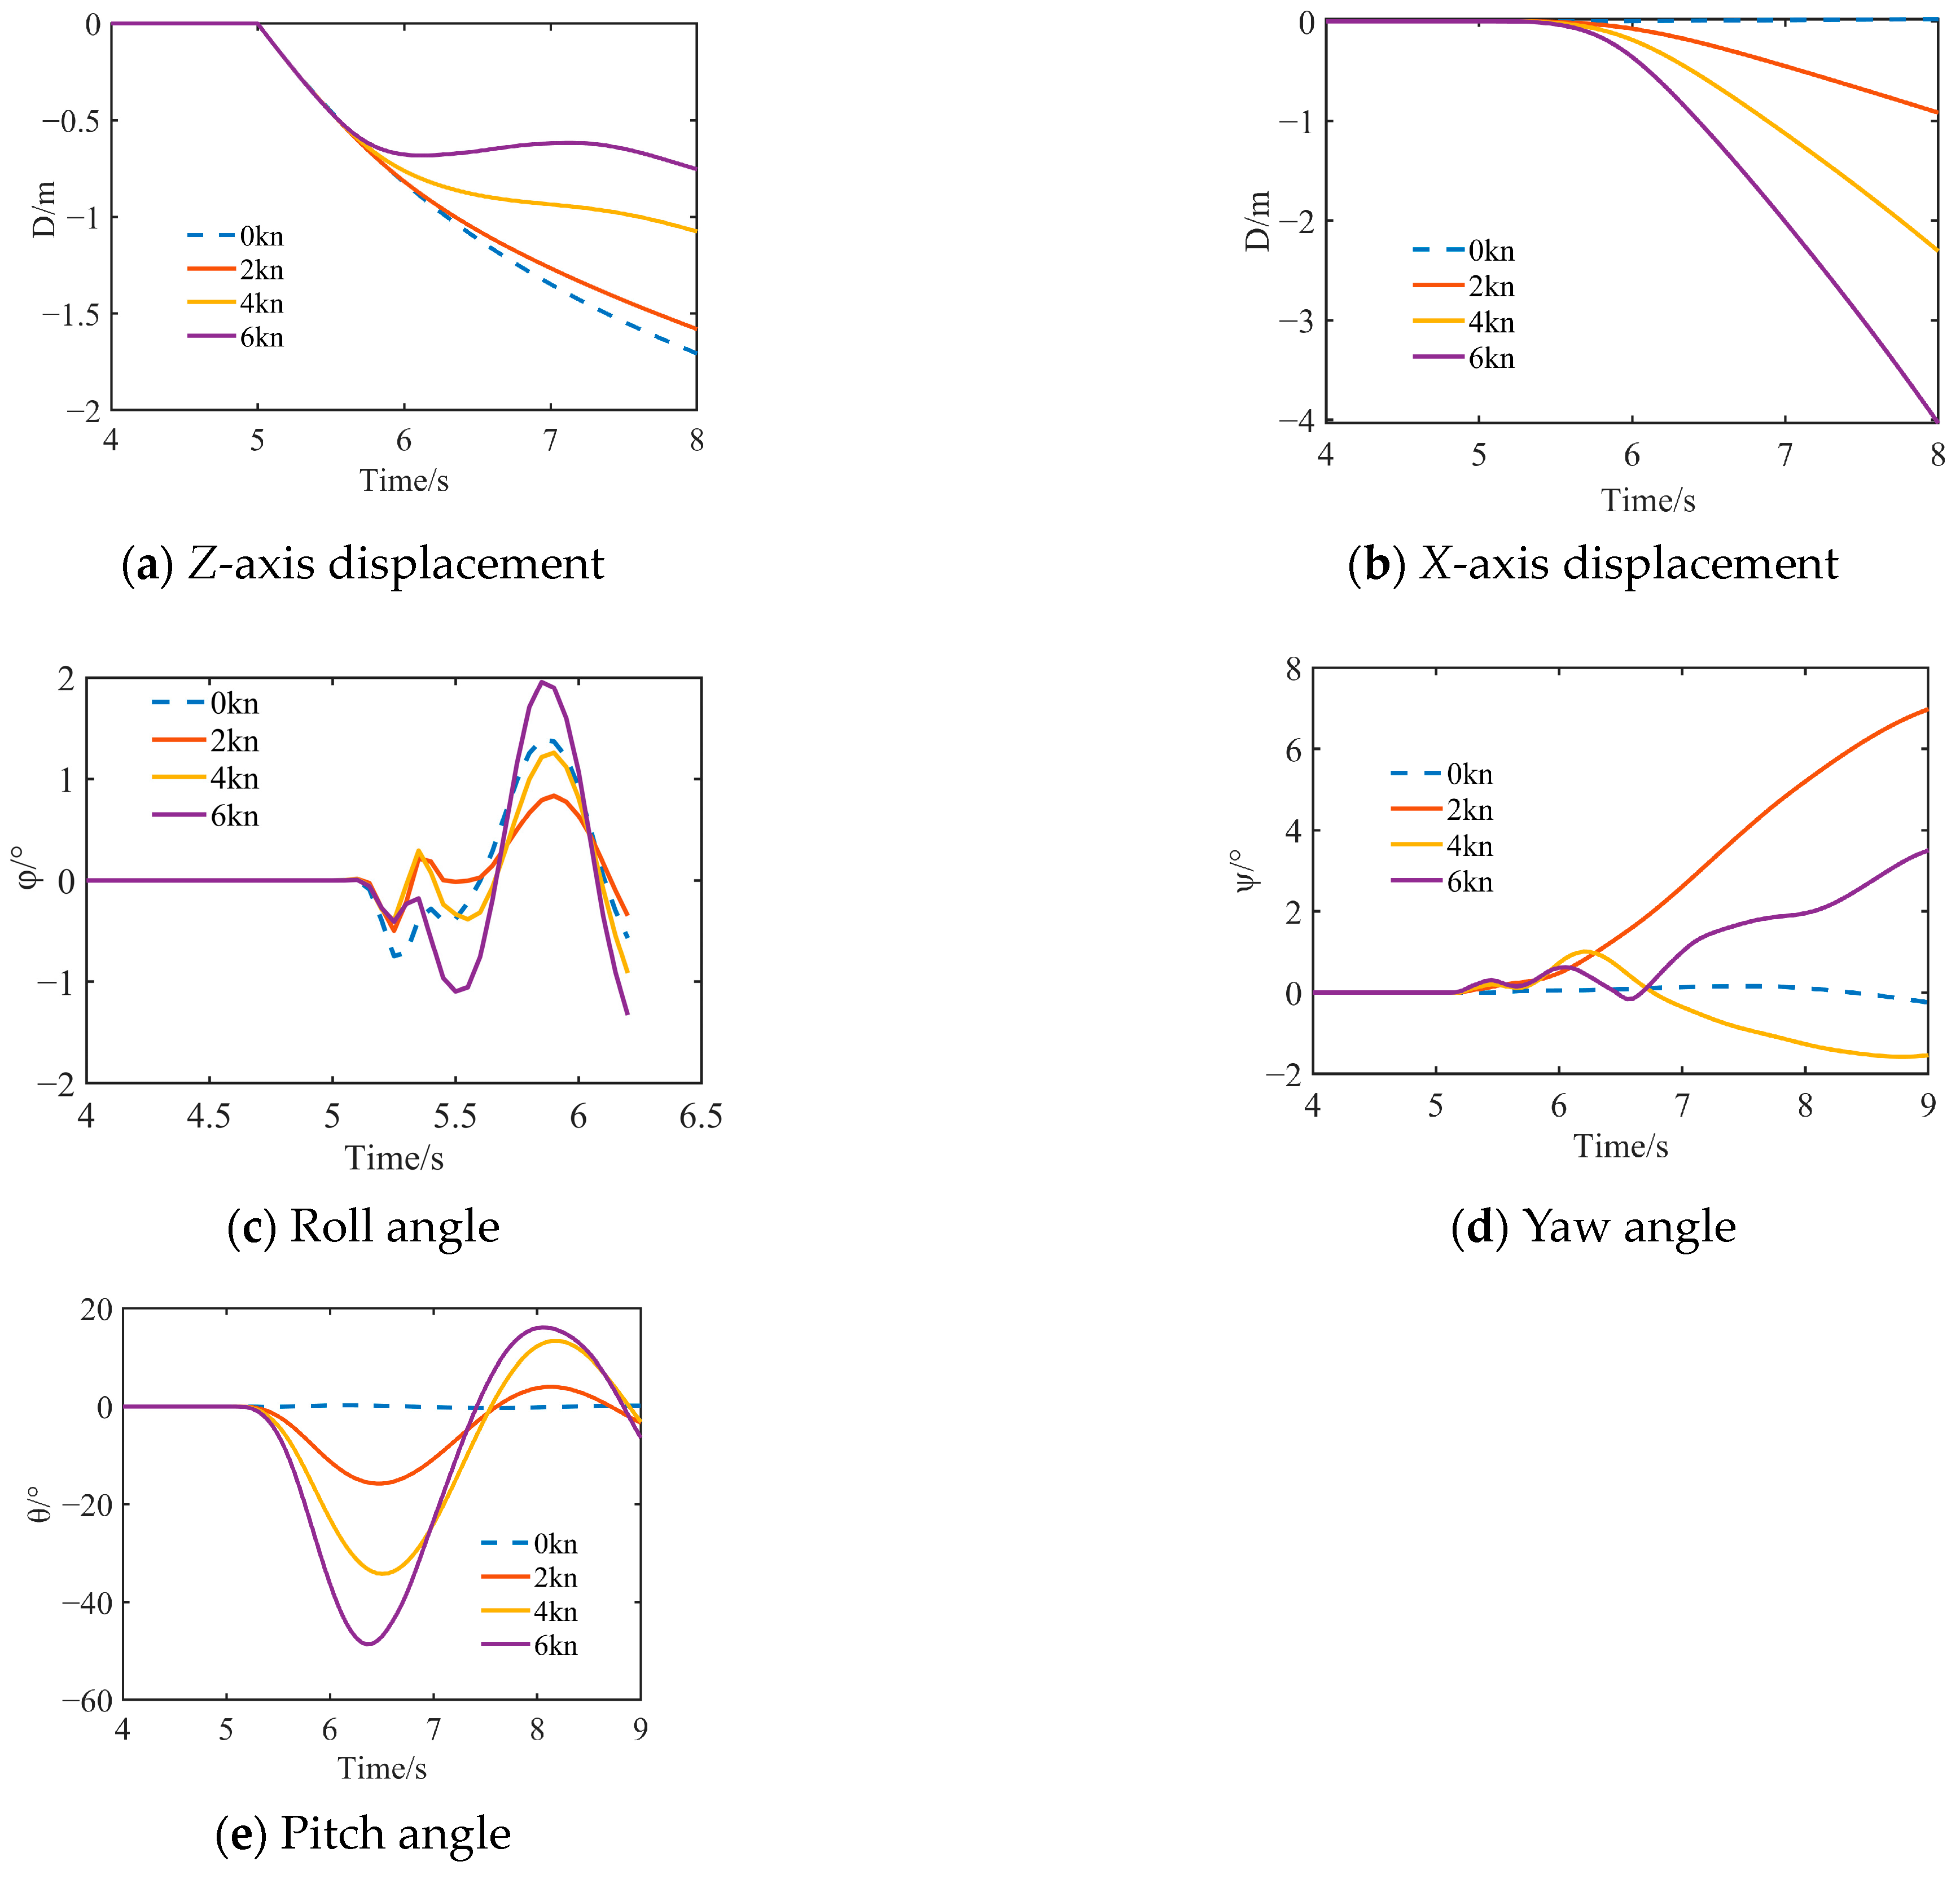
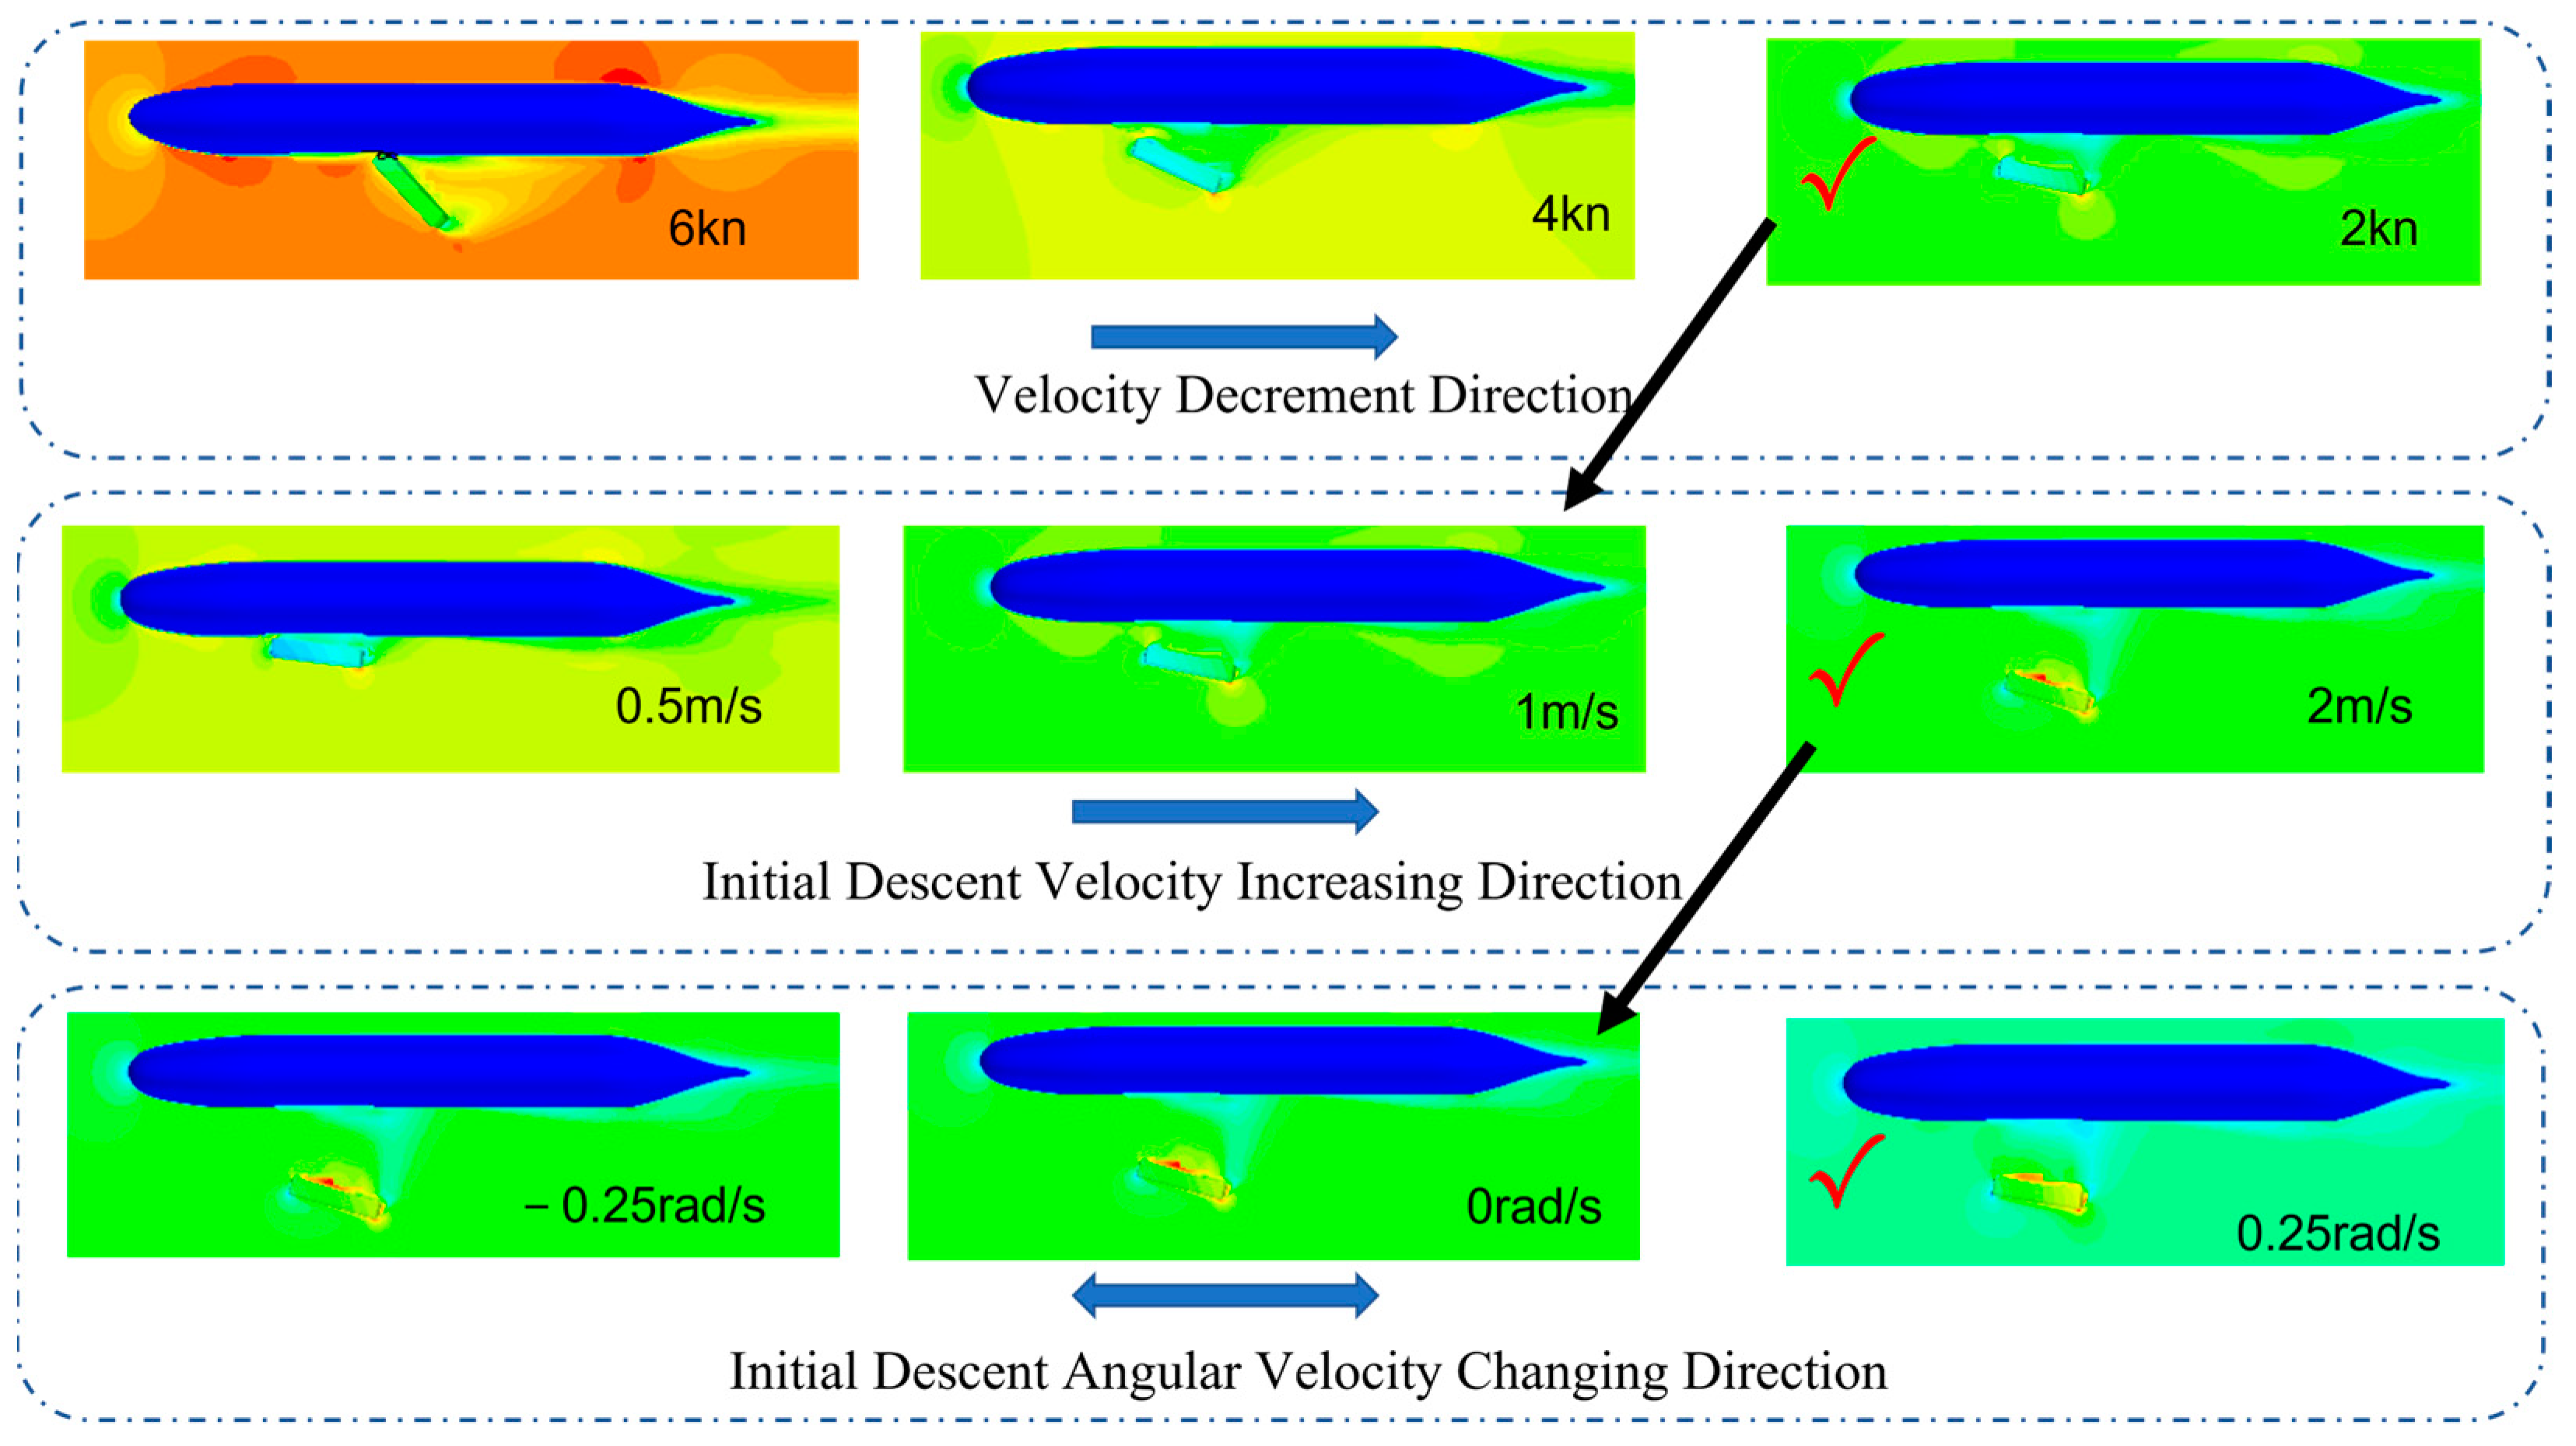
4.1. The Impact of Cruising Velocity on Initial Separation

Simulations of the separation phase for the payload deployed with an initial vertical velocity (Vz) of 1 m/s and an initial angular velocity (ω0) of 0 rad/s at cruising velocities of 0 knots, 2 knots, 4 knots, and 6 knots were obtained, focusing on the displacement and attitude angles in the horizontal (X-axis) and vertical (Z-axis) directions over time. According to the simulation data in Figure 11a, increasing the cruising velocity increases the disturbance from the AUV’s surrounding flow field to the payload during separation, slowing the payload’s descent and prolonging its dwell time in the complex flow field near the AUV. Concurrently, higher cruising velocities result in larger horizontal displacements of the payload, as shown in Figure 11b. As shown in Figure 12, an increase in horizontal displacement could potentially lead to collisions between the payload and the AUV, as demonstrated at a cruising velocity of 6 knots where an initial separation collision occurs. The impact of cruising velocity on the payload’s roll angle was analyzed using a reference state of 0 knots inflow and introducing boundary dimensions, such as the distance from the payload to the AUV deployment bay wall and the payload height (Figure 13).
Simulation results indicated that the variations in roll angle and pitch angle direction do not exhibit a clear pattern. This is attributed to multiple factors influencing the attitude changes of the blunt body payload during descent underwater, including the stochastic nature of turbulence models, the damping torque, the restoring torque of the mission payload, and the inherent inertial properties of the object. The stochastic nature of turbulence models results in various scales and directions of vortex structures in the water flow, causing random perturbations to the payload’s motion. These disturbances lead to non-uniform fluid field effects on the payload during descent, resulting in attitude changes. The damping torque refers to the resistance torque experienced by the payload during descent in water, which counteracts the motion and rotation of the payload, stabilizing its attitude changes. The restoring torque can counter external disturbances, correcting and stabilizing the payload’s attitude within a certain range. The inertial properties of the object affect the payload’s response speed and extent to external disturbances. Payloads with higher rotational inertia exhibit slower responses to external disturbances, potentially leading to significant attitude changes.
Simulation results also illustrated that the roll angle amplitude during initial separation increases with velocity, remaining within 5 degrees, and is less than the static deployment state at 2 knots and 4 knots cruising velocities, as shown in Figure 11c. The heading angle during initial separation fluctuates around the reference curve at 0 knots inflow, with an amplitude within 10 degrees (Figure 11d). The simulation results indicate that the amplitude of the pitch angle increases with cruising velocity, reaching an amplitude of 48.63 degrees at 6 knots during the initial payload separation phase (Figure 11e). In summary, reducing the AUV’s cruising velocity enhances the safety of dynamic payload deployment.

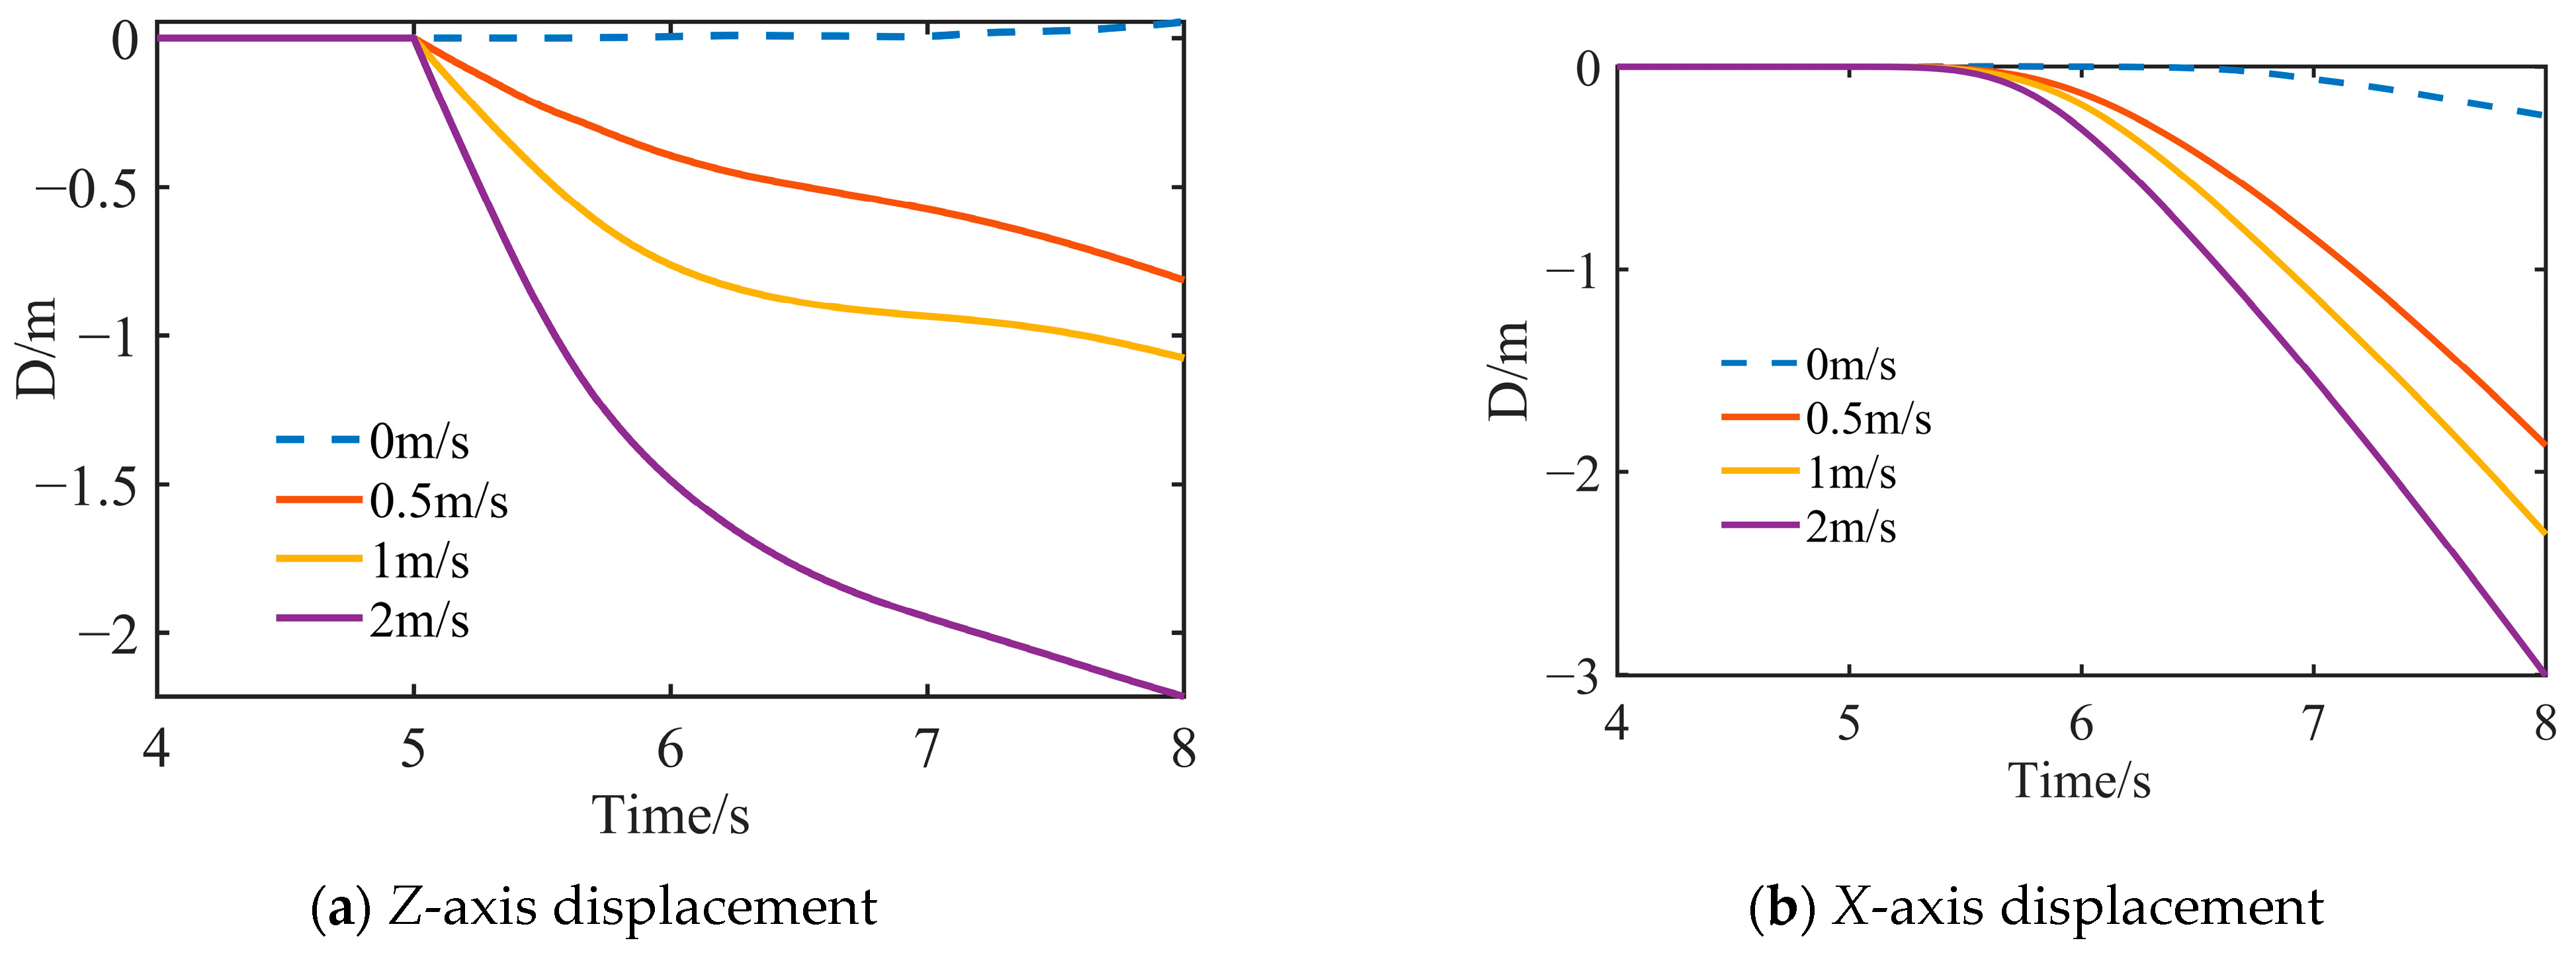
4.2. Impact of Initial Separation Velocity on Payload

The displacement and attitude angles in the horizontal (X-axis) and vertical (Z-axis) directions during the initial separation stage were observed over time under conditions of a cruising velocity Vx of 4 knots, an initial pitch velocity ω0 of 0 rad/s, and initial descent velocities of 0 m/s, 0.5 m/s, 1 m/s, and 2 m/s. As the initial descent velocity increases, the payload traverses the complex flow field near the AUV more rapidly, thereby reducing the duration of the flow field’s influence on the payload (Figure 14a). Additionally, an increase in the initial descent velocity results in more significant horizontal displacement (Figure 14b). The impact of initial descent velocity on the roll angle was analyzed using a deployment at 0 m/s as a reference and introducing boundary conditions. The simulation results indicate that a higher initial descent velocity increases the amplitude of the roll angle during the initial separation phase, with an amplitude within 5 degrees. The roll angle significantly changes when the initial descent velocity increases from 1 m/s to 2 m/s (Figure 14c). The heading angle during the initial separation phase fluctuates around the reference curve for a 0 m/s deployment, with an amplitude within 13 degrees (Figure 14d). The pitch angle exhibits significant amplitude variations during the initial separation stage. The simulation results indicate that a higher initial descent velocity increases the amplitude of the initial pitch angle but with a decreasing growth rate. The initial pitch angle at a 0 m/s deployment exhibits irregular fluctuations under the influence of cruising velocity (Figure 14e). In summary, the issue of excessive horizontal displacement caused by the increase in the payload’s pitch angle should be addressed when increasing the initial descent velocity.

4.3. The Impact of Initial Descent Angular Velocity on Payload

This section evaluates the effects of applying an initial pitch angular velocity to the payload on its initial separation safety. The settings include a cruising velocity Vx of 2 knots, an initial descent velocity Vz of 2 m/s, and initial pitch angular velocities ω0 of 0.25 rad/s, 0 rad/s, −0.5 rad/s, and −1.0 rad/s. Simulation data analysis reveals that applying an initial angular velocity has little effect on the descent rate at the initial separation stage (Figure 15a). When applying an initial angular velocity, which causes the payload to pitch down, the horizontal displacement decreases, while it increases when the payload is made to pitch up (Figure 15b). Additionally, an initial angular velocity that makes the payload pitch down increases the time to reach the maximum pitch angle amplitude, indicating that the payload reaches its maximum initial separation pitch angle at a farther distance from the AUV. Observations indicate that initial angular velocities of 0.25 rad/s and −0.5 rad/s have a negligible impact on the maximum amplitude of the pitch angle. However, when the initial angular velocity is −1.0 rad/s, the amplitude of the pitch angle significantly increases during the initial separation (Figure 15c). In summary, the safety of payload separation can be enhanced by applying an initial angular velocity that results in a bow-down and stern-up orientation of the payload.

4.4. Impact of Payload Release Depth

Ocean currents significantly affect the deployment depth of payloads. Ocean currents refer to the horizontal flow of seawater moving in a specific direction with a relatively stable velocity. Typically, ocean currents are faster at the surface, sub-surface, and mid-layers but slower at bottom layers. For example, the current velocity in the South China Sea ranges from 1 knot to 3 knots, with maximum velocities of about 5 knots [33]. The ocean current velocity varies with diving depth, disregarding vertical flows and eddies, as illustrated in Figure 16, where V represents the current velocity, and d represents the diving depth. The strength of the ocean current considerably affects the payload deployment environment. Payload deployment locations are often deeper than 500 m. As the depth of the deployment point increases, the interference from ocean currents diminishes, thereby enhancing the safety of the payload’s initial separation.

5. Conclusions

The cruising velocity range for large AUVs is generally 2-6 knots. Significant pitch angles in AUVs can cause unexpected forces and moments on sensors, making the output from attitude sensors incorrect. Additionally, large pitch angles significantly increase the payload’s frontal area, increasing the horizontal displacement. The experiments have indicated that the third-order SST k-ω model, chosen for its constitutive relationship, enhances the accuracy and applicability of numerical simulations and better captures the physical characteristics of turbulent flow. Simulations were performed under different conditions by combining experimental and engineering experiences and adjusting state parameters during separation. The following conclusions can be drawn from observations of payload position and attitude angle variations at the same moment after separation (as shown in Figure 17):
  • As cruising velocity increases, the disturbance from the flow field around the AUV during separation intensifies, degrading the payload’s separation and stability.
  • Increasing the initial descent velocity allows the payload to pass through the complex flow field near the AUV quickly. Although it facilitates safe separation, it requires pitch angle control during the initial deployment phase.
  • An appropriate initial pitch angular velocity can increase the time to reach the maximum pitch angle during initial separation. This makes the payload continuously move away from the AUV while slowing horizontal movement, thus enhancing separation safety.
  • As the deployment depth of the payload increases, ocean current interference decreases, decreasing the effect of disturbances on the AUV during the separation process, thus enhancing the safety of payload separation.
Based on these conclusions, the following three recommendations are proposed to enhance the safety of payload separation:
  • The payload should be deployed at low velocity and high depth as deep as possible while ensuring AUV dynamic stability.
  • A release mechanism with guide rods and pushing devices should be designed.
  • Favorable conditions should be established for the payload to exit the bay with the bow first and the stern following. Additionally, the pitch angle of the payload should be controlled.

Supplementary Materials

The following supporting information can be downloaded at: https://www.mdpi.com/article/10.3390/jmse12040608/s1.

Author Contributions

Conceptualization, Z.W.; Funding acquisition, H.G.; methodology, Z.W., H.G. and L.X.; software, Z.W., J.L. and L.X.; supervision, H.G.; validation, Z.W.; writing—original draft, Z.W.; writing—review and editing, Z.W., H.G., J.L. and L.X. All authors have read and agreed to the published version of the manuscript.

Funding

This research was funded in part by the National Key R&D Program of China (Grant No. 2022YFB3808805), and the Fundamental Research Project of SIA (Grant 2022JC3G02).

Institutional Review Board Statement

Not applicable.

Informed Consent Statement

Not applicable.

Data Availability Statement

Data are contained within the article and Supplementary Materials.

Conflicts of Interest

The authors declare no conflicts of interest.

References

  1. Xing, Y.; Santoso, T.A.D.; Ma, Y. Technical–economic feasibility analysis of subsea shuttle tanker. J. Mar. Sci. Eng. 2022, 10, 20. [Google Scholar] [CrossRef]
  2. Shu, Y.; Hu, A.; Zheng, Y.; Gan, L.; Xiao, G.; Zhou, C.; Song, L. Evaluation of ship emission intensity and the inaccuracy of exhaust emission estimation model. Ocean Eng. 2023, 287, 115723. [Google Scholar] [CrossRef]
  3. Chen, X.; Liu, S.; Liu, R.W.; Wu, H.; Han, B.; Zhao, J. Quantifying Arctic oil spilling event risk by integrating an analytic network process and a fuzzy comprehensive evaluation model. Ocean Coast. Manag. 2022, 228, 106326. [Google Scholar] [CrossRef]
  4. Brignone, L.; Opderbecke, J.; Bouhier, M.E.; Marfia, C.; Piasco, R.; Gobillot, N.; Magnier, C.; Arnaubec, A. Validation at sea for uly x, the latest deep diving AUV for oceanographic research. In Proceedings of the OCEANS 2023, Limerick, Ireland, 5–8 June 2023; pp. 1–6. [Google Scholar]
  5. Sun, K.; Cui, W.; Chen, C. Review of underwater sensing technologies and applications. Sensors 2021, 21, 7849. [Google Scholar] [CrossRef]
  6. Palmroos, N. Extra-Large Unmanned Underwater Vehicles (XLUUVs): Payload Benefits, Technological Advancements and Military Utility in the Baltic Sea. 2023. Available online: https://www.diva-portal.org/smash/record.jsf?pid=diva2:1823200 (accessed on 5 December 2023).
  7. Slocombe, G. Uninhabited systems: Autonomous unmanned vehicles could mean fewer large submarines. Asia-Pac. Def. Report. 2020, 46, 23–25. [Google Scholar]
  8. Greve, M.; Kurowski, M.; Ritz, S.; Golz, M.; Vijayasarathi, L.N.; Bayazit, N.; Rentzow, E. Design of the Propulsion System for the Autonomous XLUUV MUM. In Proceedings of the International Conference on Offshore Mechanics and Arctic Engineering, Hamburg, Germany, 5–10 June 2022; p. V05AT06A035. [Google Scholar]
  9. McCarragher, S.T. The Marine Corps Future Prepositioned Network: Beneath the Oceans and Beyond. 2021. Available online: https://apps.dtic.mil/sti/citations/AD1178101 (accessed on 1 December 2023).
  10. Wei, G.; Tian, C.L.; Hai, T.G.; Zhi, B.S.; Yuan, S. Unpowered diving motion characteristics of deep-sea autonomous underwater vehicle. Robot 2021, 43, 674–683. (In Chinese) [Google Scholar]
  11. Xiang, G.; Soares, C.G. Improved dynamical modelling of freely falling underwater cylinder based on CFD. Ocean Eng. 2020, 211, 107538. [Google Scholar] [CrossRef]
  12. Yao, J.; Zhen, X.; Huang, Y.; Wang, W. Numerical investigation on hydrodynamic characteristics of immersed buoyant platform. J. Mar. Sci. Eng. 2021, 9, 168. [Google Scholar] [CrossRef]
  13. Pena, B.; Huang, L. A review on the turbulence modelling strategy for ship hydrodynamic simulations. Ocean Eng. 2021, 241, 110082. [Google Scholar] [CrossRef]
  14. Yan, Z.; Gong, P.; Zhang, W. Dynamic Docking Technology between AUV and Mobile Mothership. In Proceedings of the 2020 Chinese Control and Decision Conference (CCDC), Hefei, China, 22–24 August 2020; pp. 3045–3049. [Google Scholar]
  15. Ghoreyshi, M.; Bergeron, K.; Jirasek, A.; Seidel, J.; Noetscher, G. High-Fidelity Simulations of Flight Dynamics and Trajectory of a Parachute-Payload System Leaving the C-17 Aircraft. In Proceedings of the AIAA SCITECH 2023 Forum, National Harbor, MD, USA, 23–27 January 2023; p. 0419. [Google Scholar]
  16. Bogomolov, N.; Anfalov, A.; Borzykh, S.; Bakulin, V. Simulation of process of small satellites separation from deployer installed on cargo spacecraft. J. Phys. Conf. Ser. 2019, 1392, 012003. [Google Scholar] [CrossRef]
  17. Olejnik, A.; Dziubiński, A.; Kiszkowiak, Ł. Separation safety analysis using CFD simulation and remeshing. Aerosp. Sci. Technol. 2020, 106, 106190. [Google Scholar] [CrossRef]
  18. Xue, F.; Wang, Y.; Qin, H. Derivation and validation of wind tunnel free-flight similarity law for store separation from aircraft. Aerosp. Sci. Technol. 2020, 97, 105614. [Google Scholar] [CrossRef]
  19. Lin, Y.-H.; Li, X.-C. The investigation of a sliding mesh model for hydrodynamic analysis of a SUBOFF model in turbulent flow fields. J. Mar. Sci. Eng. 2020, 8, 744. [Google Scholar] [CrossRef]
  20. Fun Sang Cepeda, M.; Freitas Machado, M.D.S.; Sousa Barbosa, F.H.; Santana Souza Moreira, D.; Legaz Almansa, M.J.; Lourenço de Souza, M.I.; Caprace, J.-D. Exploring Autonomous and Remotely Operated Vehicles in Offshore Structure Inspections. J. Mar. Sci. Eng. 2023, 11, 2172. [Google Scholar] [CrossRef]
  21. Liu, B.; Xu, X.; Pan, D. Resistance reduction optimization of an amphibious transport vehicle. Ocean Eng. 2023, 280, 114854. [Google Scholar] [CrossRef]
  22. Dey, S.; Mahato, R.K.; Ali, S.Z. Turbulent Shear Flow over a Downstream-Skewed Wavy Bed: Analytical Model Based on the RANS Equations with Boussinesq approximation Boussinesq Approximation. J. Hydraul. Eng. 2023, 149, 04023028. [Google Scholar] [CrossRef]
  23. Wei, S. Assessment of advanced rans turbulence models for prediction of complex flows in compressors. Chin. J. Aeronaut. 2023, 36, 162–177. [Google Scholar]
  24. Xu, Y.; Tan, L.; Yuan, Y.; Zhang, M. Numerical simulation on flow field and design optimization of a generator unit based on computational fluid dynamics analysis. Math. Probl. Eng. 2021, 2021, 3350867. [Google Scholar] [CrossRef]
  25. Wilcox, D.C. Formulation of the kw turbulence model revisited. AIAA J. 2008, 46, 2823–2838. [Google Scholar] [CrossRef]
  26. Menter, F.R. Two-equation eddy-viscosity turbulence models for engineering applications. AIAA J. 1994, 32, 1598–1605. [Google Scholar] [CrossRef]
  27. Eça, L.; Kerkvliet, M.; Toxopeus, S. Attaining the Asymptotic Range in Rans Simulations. Verif. Valid. 2023, 86748, V001T002A002. [Google Scholar]
  28. Hellsten, A. New advanced kw turbulence model for high-lift aerodynamics. AIAA J. 2005, 43, 1857–1869. [Google Scholar] [CrossRef]
  29. Wallin, S.; Johansson, A.V. An explicit algebraic Reynolds stress model for incompressible and compressible turbulent flows. J. Fluid Mech. 2000, 403, 89–132. [Google Scholar] [CrossRef]
  30. Liu, Q.; Li, Z.; He, X. Numerical simulation of the complex flow field in a new recycling cyclone separator. J. Phys. Conf. Ser. 2024, 2707, 012085. [Google Scholar] [CrossRef]
  31. Pacheco, J.; Marta, A.C.; Eça, L. Wind tunnel testing of a Formula Student vehicle for checking CFD simulation trends. Proc. Inst. Mech. Eng. Part D J. Automob. Eng. 2023. [Google Scholar] [CrossRef]
  32. Wang, H.; Zhu, R.; Huang, S.; Zha, L.; Gu, M. A study on hydrodynamic characteristics of a planing hull by CFD simulation and modified MS method. Ships Offshore Struct. 2023, 18, 157–174. [Google Scholar] [CrossRef]
  33. Wang, N. CAS Thesis & Disserta. Master’s Thesis, University of Chinese Academy of Sciences, Beijing, China, 2021. Available online: http://dpaper.las.ac.cn/Dpaper/homeNew (accessed on 15 November 2023). (In Chinese).
Figure 1. Internally perforated permeable chamber segment.
Jmse 12 00608 g001
Figure 2. Separation process scenario.
Jmse 12 00608 g002
Figure 3. Calculation domain and boundary settings.
Jmse 12 00608 g003
Figure 4. Grid sensitivity curve.
Jmse 12 00608 g004
Figure 5. The meshing scene of the computational domain.
Jmse 12 00608 g005
Figure 6. Testing site.
Jmse 12 00608 g006
Figure 7. Test platform.
Jmse 12 00608 g007
Figure 8. Pitch angle of different models.
Jmse 12 00608 g008
Figure 9. Pitch angle of the same descent distance.
Jmse 12 00608 g009
Figure 10. Pressure distribution chart.
Jmse 12 00608 g010
Figure 11. Comparison of displacement and attitude at different cruising velocities.
Jmse 12 00608 g011
Figure 12. Velocity distribution chart during a collision.
Jmse 12 00608 g012
Figure 13. Boundary dimensions.
Jmse 12 00608 g013
Figure 14. Comparison of displacement and attitude at different initial descent velocities.
Jmse 12 00608 g014aJmse 12 00608 g014b
Figure 15. Comparison of displacement and attitude at different initial angular velocities.
Jmse 12 00608 g015
Figure 16. Ocean current velocity at different depths.
Jmse 12 00608 g016
Figure 17. Comparison of the velocity distribution of different operating conditions at the same moment.
Jmse 12 00608 g017
Table 1. Main dimensions and technical parameters.
ParameterValue
SUBOFF DimensionsScale radio2.3
Forebody/m2.337
Midbody/m5.127
Afterbody/m2.555
Middle swing diameter/m1.17
Hatch dimensions L/D1.8/0.5
Mission PayloadsWeight/kg100
Negative buoyancy/N10
X-axis moment of inertia Lxx/kg·m21.17
Y-axis moment of inertia Lyy/kg·m219.16
Z-axis moment of inertia Lzz/kg·m219.02
HUGIN EnduranceLength/m10
Diameter/m1.2
Navigational velocity/kn2–6
Operating depth/m6000
Detection area/km21100
Endurance/day15
Table 2. Verification of the grid independence.
Base Grid Size/(m)Grid QuantityCd/(103)Relative Error
0.701,825,3510.11874315.8321%
0.662,213,1530.09994418.8101%
0.622,533,8760.104077−3.9717%
0.583,077,0550.104162−0.0809%
0.543,790,3170.1010523.0772%
0.504,981,8440.102813−1.7131%
Disclaimer/Publisher’s Note: The statements, opinions and data contained in all publications are solely those of the individual author(s) and contributor(s) and not of MDPI and/or the editor(s). MDPI and/or the editor(s) disclaim responsibility for any injury to people or property resulting from any ideas, methods, instructions or products referred to in the content.

