1. Introduction
The maritime industry has undergone and is amid a significant transformation due to technological advancements and the increasing adoption of digital solutions [
1]. The integration of digital technologies, such as AI and big data analytics, is revolutionizing operations ranging from cargo handling to fleet management [
2]. Cybersecurity has emerged as a paramount concern with the maritime industry’s increasing reliance on digital systems, necessitating robust security measures [
3]. The industry is furthermore actively exploring revival strategies centered on technological innovation and sustainability [
2]. The latter are reliant on the synergistic collaboration between academic institutions and the maritime industry, which is also aiding the digitalization of the sector [
4,
5]. Ongoing research and innovation in these areas are expected to remain central to the growth of the maritime industry and for allowing adaptations to be made to future challenges [
2,
3,
4,
5,
6,
7,
8,
9]. Consultancy firms such as McKinsey and Boston Consulting Group furthermore indicate that digital technologies such as big data, and the Internet of Things will have a severe impact on certain parts of the industry, like, for instance, the container shipping industry [
10,
11]. By 2067, these consultancy groups envision that the industry could see autonomous 50,000-TEU ships and modular, drone-like floating containers, with container trade volumes potentially increasing two to five times compared to current levels because of the digitization.
As such, studying the evolution of the digital trends ongoing in the maritime industry is of relevance not only in support of academic endeavors, highlighted in the need for university–industry collaboration, but also for practitioners who need to make sense of often parallel developments. Hence, in fostering such support we analyzed one web source
1, which for the period between 2016–2023 held over 500 conference presentations on the topic of digitalization in the shipping industry. We applied OCR recognition software to transform the PDF files into readable text files and applied Natural Language Processing software (BERTopic 0.16.0, KeyBERT 0.8.4, Gensim 4.3.2, scikit-learn version: 1.4.1. post 1) to analyze the batch of documents. This set of presentations presents an interesting set of data that gives us a view both on the current state of innovation in the sector, as well as a view on how innovation pressures have evolved over the years. By exploring these trends, we hope to start a longitudinal research effort that continuously monitors the self-reported digital innovative developments in the sector, reported by industry representatives and experts.
In the following paragraphs, we discuss the state of the industry and the research methodology that we employed, present an overview of our findings, conclude, and open avenues for further research.
2. Current State of the Maritime Industry: An Industry 4.0 Perspective
The maritime industry, integral to global trade and commerce, has witnessed a paradigm shift driven by technological advancements and the increasing adoption of digital solutions. The latter has been established in multiple scholarly efforts including the work by Wang [
7,
8], Munim [
6], Koukaki and Tei [
5], de la Pena Zarzuelo [
4], Sullivan [
9], Kala and Mahesh Balakrishnan [
3], and Terpsidi [
2].
2.1. Digitalization and Technological Innovations
Digitalization in the maritime sector has been a game-changer, offering unprecedented opportunities for efficiency and sustainability. The integration of digital technologies, such as AI and big data analytics, is revolutionizing operations ranging from cargo handling to fleet management [
2]. A notable aspect of this digital shift is the utilization of big data for predictive analytics, which significantly improves decision-making processes in maritime operations. Advanced algorithms are being employed to analyze vast datasets, enhancing route planning, fuel consumption optimization, and predictive maintenance of vessels, thus leading to cost savings, and increased operational efficiency [
6,
7]
Exemplary of the latter are the developments in vessel tracking and fuel optimization. AI algorithms are now utilized to provide more accurate Estimated Time of Arrival (ETA) predictions for vessels. A platform called PortXchange’s Synchronizer, for instance, combines AIS data with proprietary information to monitor if vessels adhere to their planned routes and issue alerts about potential delays. This approach aims to tackle the challenge of schedule unreliability in the container shipping industry, which has historically led to significant financial losses [
12]. AI, along with IoT and analytics, is also aiding the maritime sector in minimizing fuel consumption and reducing emissions through the optimization of vessel routes. For these cases, weather routing technologies enable captains to optimize vessel routes based on load, weather conditions, and currents, enhancing the efficiency of the entire supply chain and contributing to a significant reduction in carbon footprint [
13].
2.2. Cybersecurity in the Digital Era
With the maritime industry’s increasing reliance on digital systems, cybersecurity has emerged as a paramount concern. The transition to digital technologies exposes the sector to cyber threats, necessitating robust security measures [
3].
Representative of this is the significant incident in Australia in 2023, which saw a cyberattack paralyze several major ports for days. This attack targeted DP World’s ports, handling around 40% of Australia’s freight trade, causing widespread disruptions. This event is part of a broader trend of cyber threats facing the maritime industry globally, including ransomware attacks on Japan’s busiest port, Nagoya, and disruptions at oil terminals in western Europe due to cyberattacks. Furthermore, the “NotPetya” malware in 2017 also severely impacted the global shipping giant Maersk, along with cyber incidents at major ports in the Netherlands, Canada, India, South Africa, and the United States [
14,
15].
In response to these growing threats, measures and guidelines are being developed and implemented. For example, the U.S. issued Presidential Executive Order 14028 in May 2021, focusing on enhancing cybersecurity across government agencies, critical infrastructure, and private companies. Moreover, the International Maritime Organization (IMO) is actively working to address cyber risks by revising guidelines for maritime cyber risk management [
16].
2.3. Towards Revival and Adaptation Strategies—Collaborations and Prospects
In response to global market fluctuations and environmental challenges, the maritime industry is actively exploring revival strategies centered on technological innovation and sustainability [
2]. Embracing digital technologies, particularly AI, is seen as a key driver for enhancing competitiveness and operational efficiency. Moreover, the industry is increasingly focused on adopting environmentally sustainable practices, aligning with global efforts to reduce greenhouse gas emissions and minimize the ecological footprint of maritime activities.
The latter is often facilitated by the synergistic collaboration between academic institutions and the maritime industry. This collaboration is also evident in joint research initiatives aimed at advancing AI applications, improving data analytics capabilities, and strengthening cybersecurity frameworks [
4,
5]. As the industry continues to evolve, ongoing research and innovation in these areas are expected to remain central to its growth and adaptation to future challenges.
The current state of the maritime industry is therefore characterized by a dynamic transition towards greater digitalization and a commitment to sustainable operations. The integration of cutting-edge technologies like AI and big data analytics, coupled with a strong emphasis on cybersecurity and strategic revival initiatives, is redefining the future landscape of maritime activities.
3. Methodology
The general field of this research is natural language processing. NLP is a subfield of Artificial Intelligence (AI) concerned with the interaction between computers and human language. It aims to develop computational techniques that enable computers to understand, interpret, and manipulate natural language in its various forms (spoken, written) [
17].
In the domain of Natural Language Processing (NLP), a suite of techniques exists to unlock meaning and structure from textual data. Keyword extraction serves as the foundation, identifying the most significant words or phrases that illuminate the core content of a document. Sentiment analysis delves deeper, classifying the emotional tone—positive, negative, or neutral—expressed within the text. Topic modeling ventures beyond individual documents, uncovering hidden thematic structures that bind a collection together, revealing underlying topics. Named Entity Recognition (NER) hones in on specific elements within the text, identifying and classifying named entities like people, organizations, and locations. Finally, text summarization automates the creation of concise summaries, capturing the essence of a document while streamlining its length.
This paper aims to extract significant trends and identify emerging weak signals from a collection of PDF-embedded presentations, grouped by year, sourced from a website focused on digitalization in the shipping industry. The website provides open access to an archive of presentations made by industry practitioners over a 10 years plus period. As such, the content reflects the ongoing efforts made in real world terms and addresses the issue from a practicality point of view rather than from a theoretical or hypothetical point of view.
Our methodology is aligned with the analytical approaches of Wang [
7,
8], and Egger and Yu [
18], employing Bidirectional Encoder Representations from Transformers (BERT) to unearth new insights.
To unearth weak signals, we employed an increase ratio of words strategy, consistent with the methods of Griol-Barres [
19], and Yoon [
20]. Our study leveraged a semiotic model to assess the signal and issue dimensions through the degree of visibility (DoV) and the degree of diffusion (DoD), reflecting the frequency and distribution of keywords, respectively.
Our research process began with acquiring and preprocessing text data, followed by classifying and extracting keywords, which bifurcates into four categories: principal topics, fine-grained topics, topic-related keywords, and document-specific keywords. These classifications aid in identifying primary and emerging trends, and in the modeling and detection of weak signals.
For classification, we utilized BERT, specifically BERTopic [
21,
22,
23], for topic definition and KeyBERT [
24] for the keyword extraction from documents. Guided topic modeling is enhanced through similarity calculations, employing methods like Spacy cosine similarity, Scikit-learn cosine similarity, and Jaccard similarity [
25,
26,
27].
3.1. Data Collection and Preprocessing
The dataset comprises over 500 presentations, which we converted to machine-readable text using OCR technology, specifically Tesseract, to handle the mixed text and image content [
28,
29,
30,
31]. OCR is in most cases used starting from a document, scanning it and transforming it to machine-readable text. Here, the starting point were pdf files of presentations. The pdf files were converted to pictures and the transformations to texts are coming from those pictures. The algorithms of Tesseract are binarization, the threshold algorithm, local binarization, thinning and line finding [
28,
29]. For further research, Intelligent Document Processing, is worthwhile looking into [
32].
Metadata extraction from each PDF enriches the dataset with details like title, author, and publication date. This is performed using PDFParser and chardet.
Cleaning is performed by using stopwords, Wordlemmatizer, and ad hoc removing highly frequent used words.
3.2. Topic Detection
Topic detection is aimed at identifying consistent themes across the document set. We analyzed presentation frequencies by year and used word networks, built on co-occurrence relationships, to visualize word interactions, utilizing Gensim’s coherence model [
33]. Dimensionality reduction was achieved through Uniform Manifold Approximation and Projection (UMAP), preparing data for BERTopic, which employed vectorization and class-based TF-IDF to ascertain topics.
The BERTopic algorithm for topic modeling combines several powerful techniques. At its core lies the use of pre-trained transformer models like BERT. These models excel at converting documents into dense vector representations, capturing the essence of how words relate to each other within the text. This allows BERTopic to grasp the underlying meaning conveyed in the documents.
BERTopic goes beyond traditional TF-IDF by employing a class-based variation. This modified scheme emphasizes words that hold particular importance within a specific topic, even if they do not appear frequently throughout the entire document collection. This helps pinpoint keywords crucial for understanding the thematic content.
To group documents with similar semantic meaning, BERTopic utilizes clustering algorithms like HDBSCAN. This process essentially sorts documents based on their semantic closeness, resulting in the formation of distinct clusters that represent different topics.
To make the identified themes interpretable, BERTopic extracts keywords and phrases for each topic. This involves breaking down the text into individual words or phrases (tokenization) and assigning weights to identify the most significant words within each topic.
BERTopic achieves these goals in a sequential manner. First, it transforms documents into numerical representations using BERT. Since these embeddings can be high-dimensional and complex, BERTopic then applies dimensionality reduction techniques like UMAP to make the data more manageable. With the simplified embeddings, BERTopic utilizes clustering algorithms to group them into distinct topic clusters. Finally, BERTopic performs topic tokenization and weighting to extract and highlight the most significant words and phrases associated with each identified thematic group [
26].
A more mathematical view of the BERTopic model consists of the document embeddings and document clustering formulas.
For the document embeddings, BERTopic uses the Sentence-BERT (SBERT) framework. It is based on the following functions. For the classification objective function, the sentence embeddings u and v are concatenated with the element-wise difference |u − v| and this is multiplied by the trainable weight.
where n is the dimension of the sentence embeddings and k the number of labels.
For the regression objective function, the cosinesimilarity between the two sentence embeddings u and v is computed. The meansquared-error loss as the objective function is used. For the triplet objective function, given an anchor sentence a, a positive sentence p, and a negative sentence n, triplet loss tunes the network such that the distance between a and p is smaller than the distance between a and n. Mathematically, we minimized the following loss function:
with sx the sentence embedding for a/n/p, and || · || a distance metric and margin. Margin ensures that sp is at least closer to sa than sn [
34].
For the document clustering, UMAP was used.
UMAP has been found to retain more local and global characteristics of high-dimensional data when projected into lower dimensions [
17]. The reduced embeddings are clustered using HDBSCAN.
The computational view of UMAP starts with the construction of a weighted k-neighbor graph. Let X = {x1,…, xN} be the input dataset, with a metric (or dissimilarity measure) d: X × X → R ≥ 0. Given an input hyperparameter k, for each xi we computed the set {xi1,…, xik} of the k nearest neighbors of xi under the metric d.
For each xi, we defined ρi and σi.
Let ρ
i = min{d(x
i, x
ij) | 1 ≤ j ≤ k, d(x
i, x
ij) > 0}, and set σ
i to be the value such that
We could now define a weighted directed graph Ḡ = (V, E, w). The vertices V of Ḡ were simply the set X. We could then form the set of directed edges E = {(x
i, x
ij) | 1 ≤ j ≤ k, 1 ≤ i ≤ N}, and define the weight function w by setting
For a given point xi, there exists an induced graph of xi and outgoing edges incident on xi.
In this research, pytesseract was used in the language English, a long short-term memory (LSTM)-based OCR engine with automatic detection of blocks of texts in an image. For BERTopic, en_core_web_sm, an English-language multi-task Convolutional Neural Network (CNN) trained on OntoNotes was used. The number of neighbors and components was defined on a coherence table. This results in the principal and fine-grained topics. The minimum distance was 0 and the metric was cosine.
KeyBERT represents an approach to keyword extraction, utilizing BERT embeddings and cosine similarity to identify the most relevant terms within a document.
3.3. Crystallization of Trends and Detecting Weak Signals
We calculated topic frequencies to spot trends and used Theil–Sen regressions to mitigate outlier impact [
35]. For weak signals, we adapted Griol-Barres’s method, focusing on the DoD to track keyword prevalence over time and across documents, applying a time-weighted factor to emphasize recent data.
3.4. Supervised Machine Learning
Complementing our unsupervised techniques, we integrated supervised learning, referencing Hassan’s [
36] work on text classification. Using manually analyzed 2012 data as a baseline, we employed logistic regression models to categorize presentations, enriching our analysis with expert-driven insights and AI-generated topic clusters.
4. Analysis
This analysis investigates the content and trends within presentations using a combination of unsupervised and supervised learning techniques.
The unsupervised learning section will focus on topic detection. Here, we will explore two approaches: BERTopic, which can identify both high-level (principal) and more specific (fine-grained) topics within the presentations. Additionally, guided topic modeling will be employed to uncover similar thematic structures. As with BERTopic, this will be conducted at both principal and fine-grained levels.
Following topic detection, the analysis will shift towards trends and evolutions. We will examine trends emerging from both principal and fine-grained topics, with a particular focus on identifying potential upcoming themes based on fine-grained analysis. Furthermore, the evolution of topics over time will be explored using principal topics.
Beyond thematic analysis, the presence of solutions will be investigated through the identification of solution-related keywords. Additionally, the concept of diffusion will be employed to detect weak signals, which represent emerging or under-discussed topics.
Finally, the analysis will incorporate supervised learning using logistic regression to further refine the insights gleaned from the unsupervised techniques.
4.1. Exploration of the Data
4.1.1. Frequency
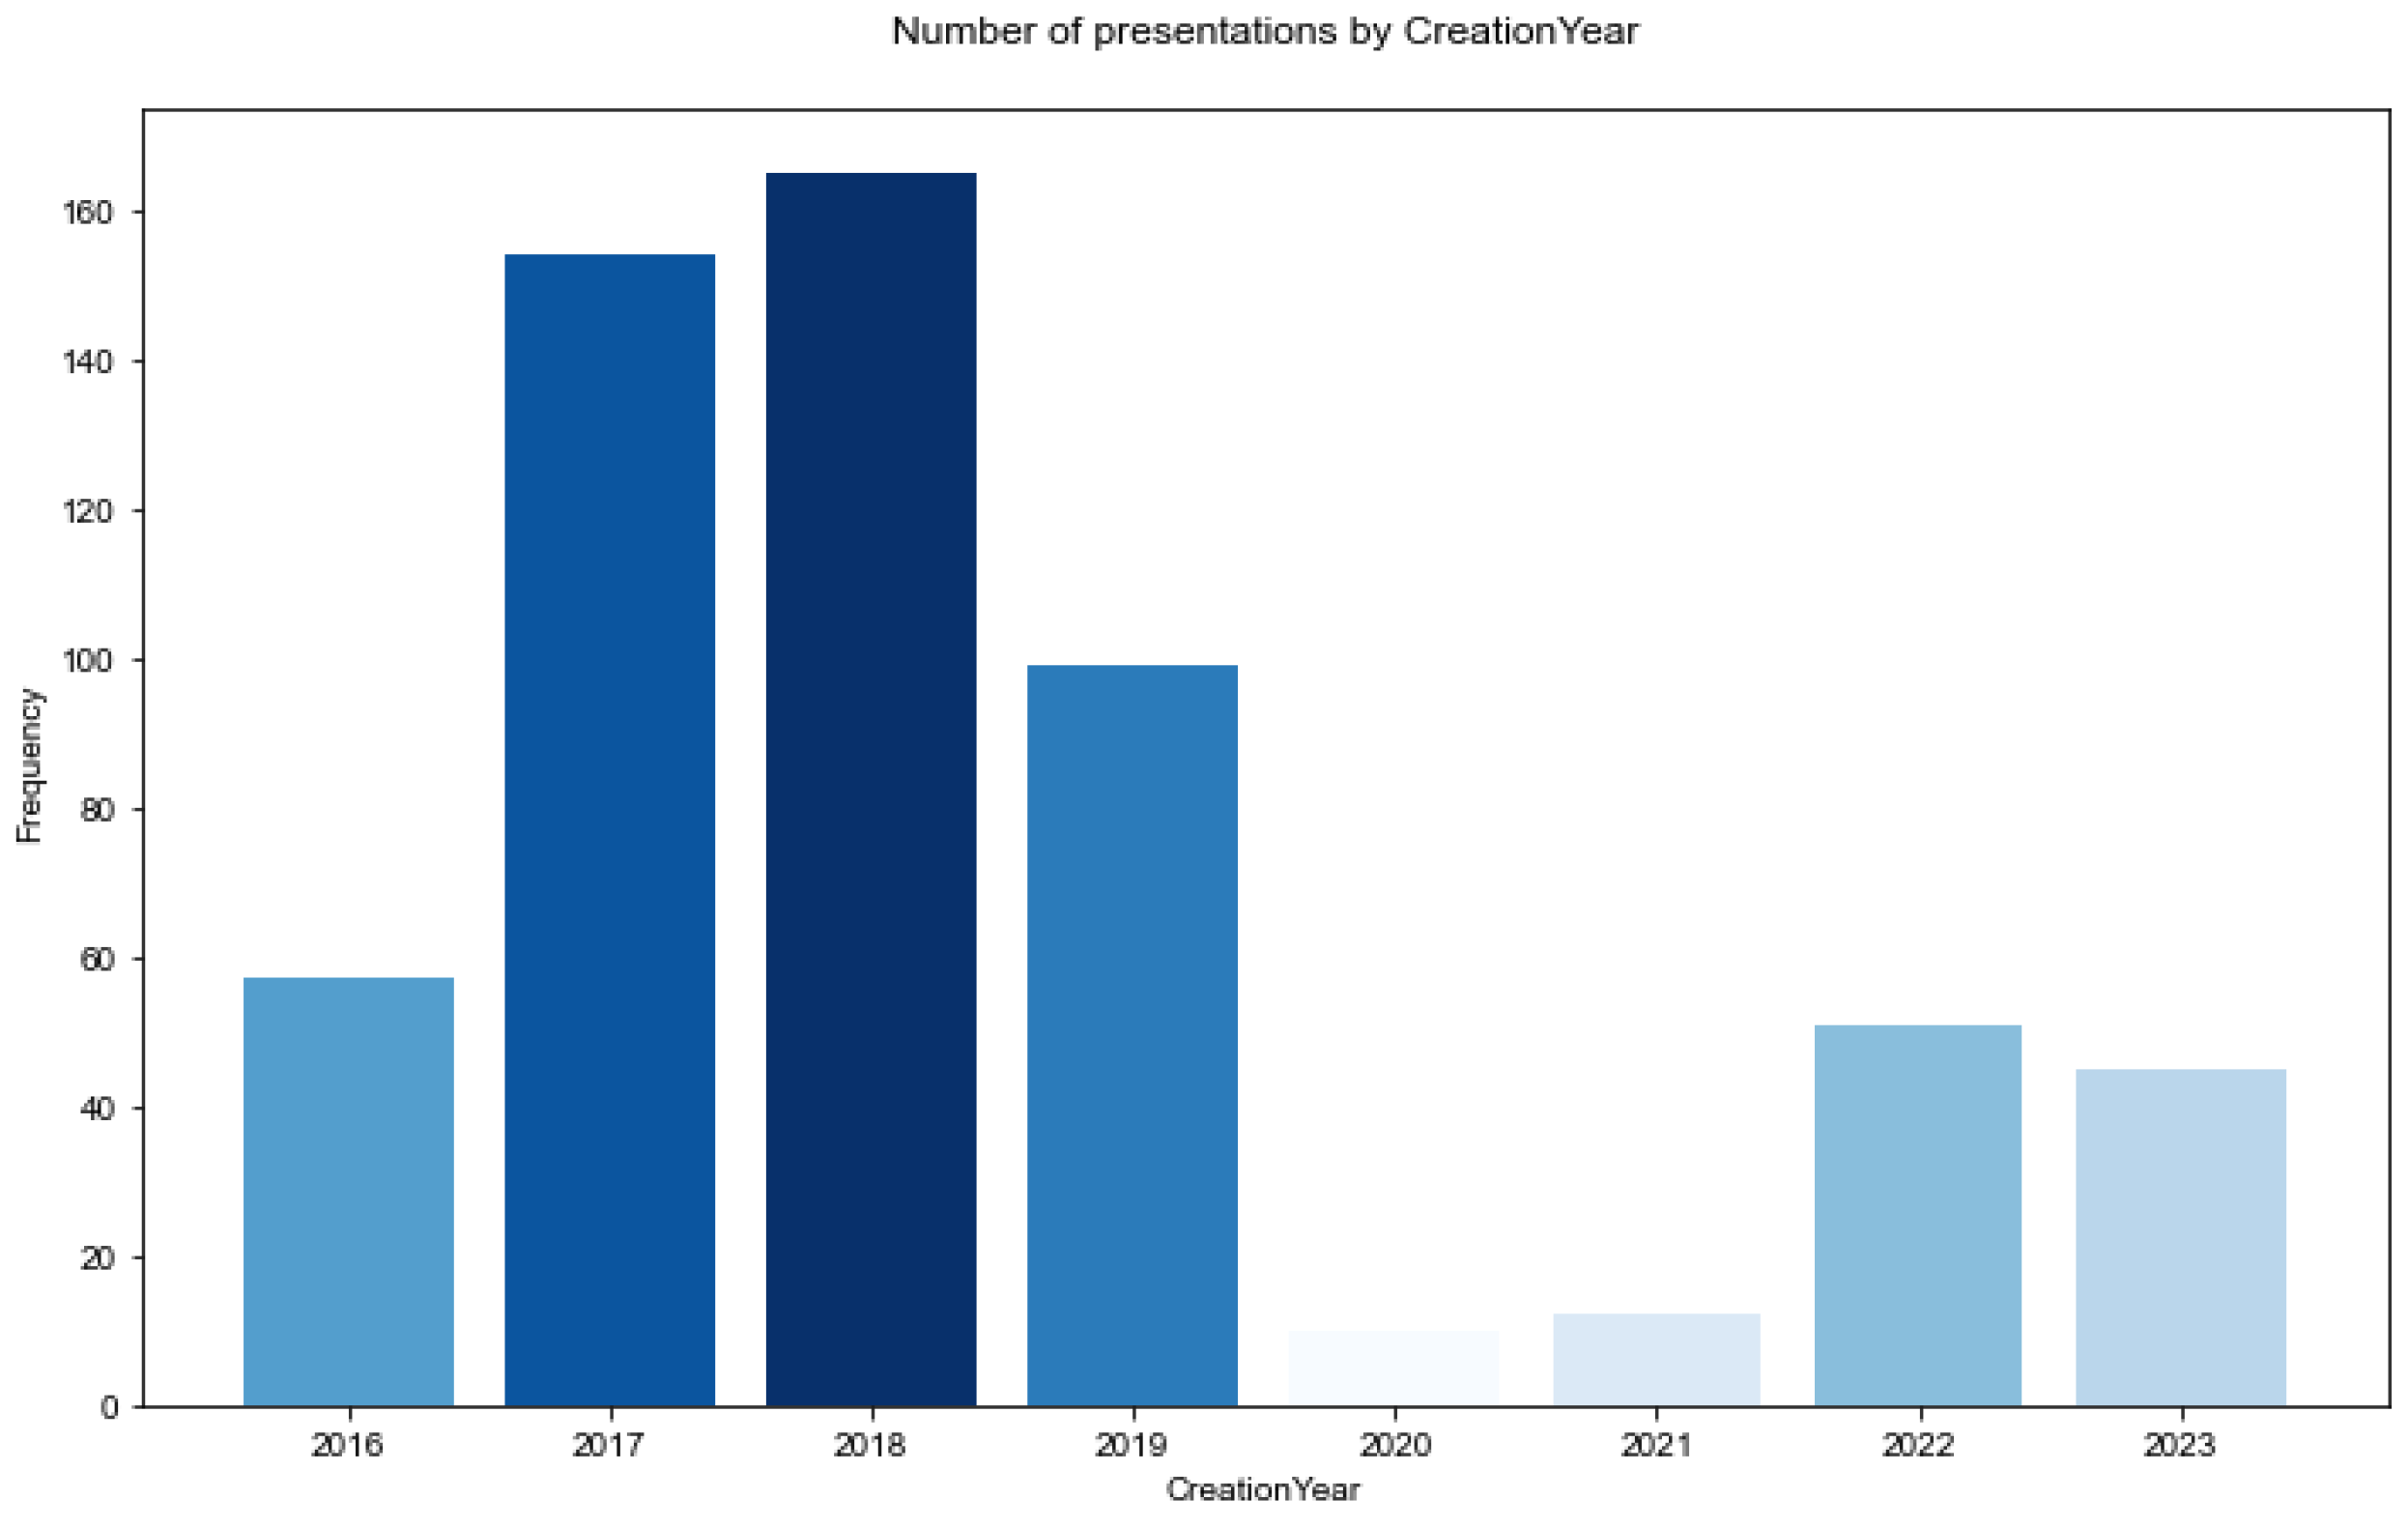
In the first step of the analysis, we looked at the number of presentations per year, to provide the reader with some descriptive statistics on the composition of the data.
There was an observed surge in the number of presentations during the years 2017 and 2018, followed by a noticeable decrease in 2020 and 2021, as shown in
Table 1 and
Figure 1. This decline can be attributed to the disruptive impact of the COVID-19 pandemic. These fluctuations were considered when analyzing trends and identifying weak signals within the data.
4.1.2. Word Network
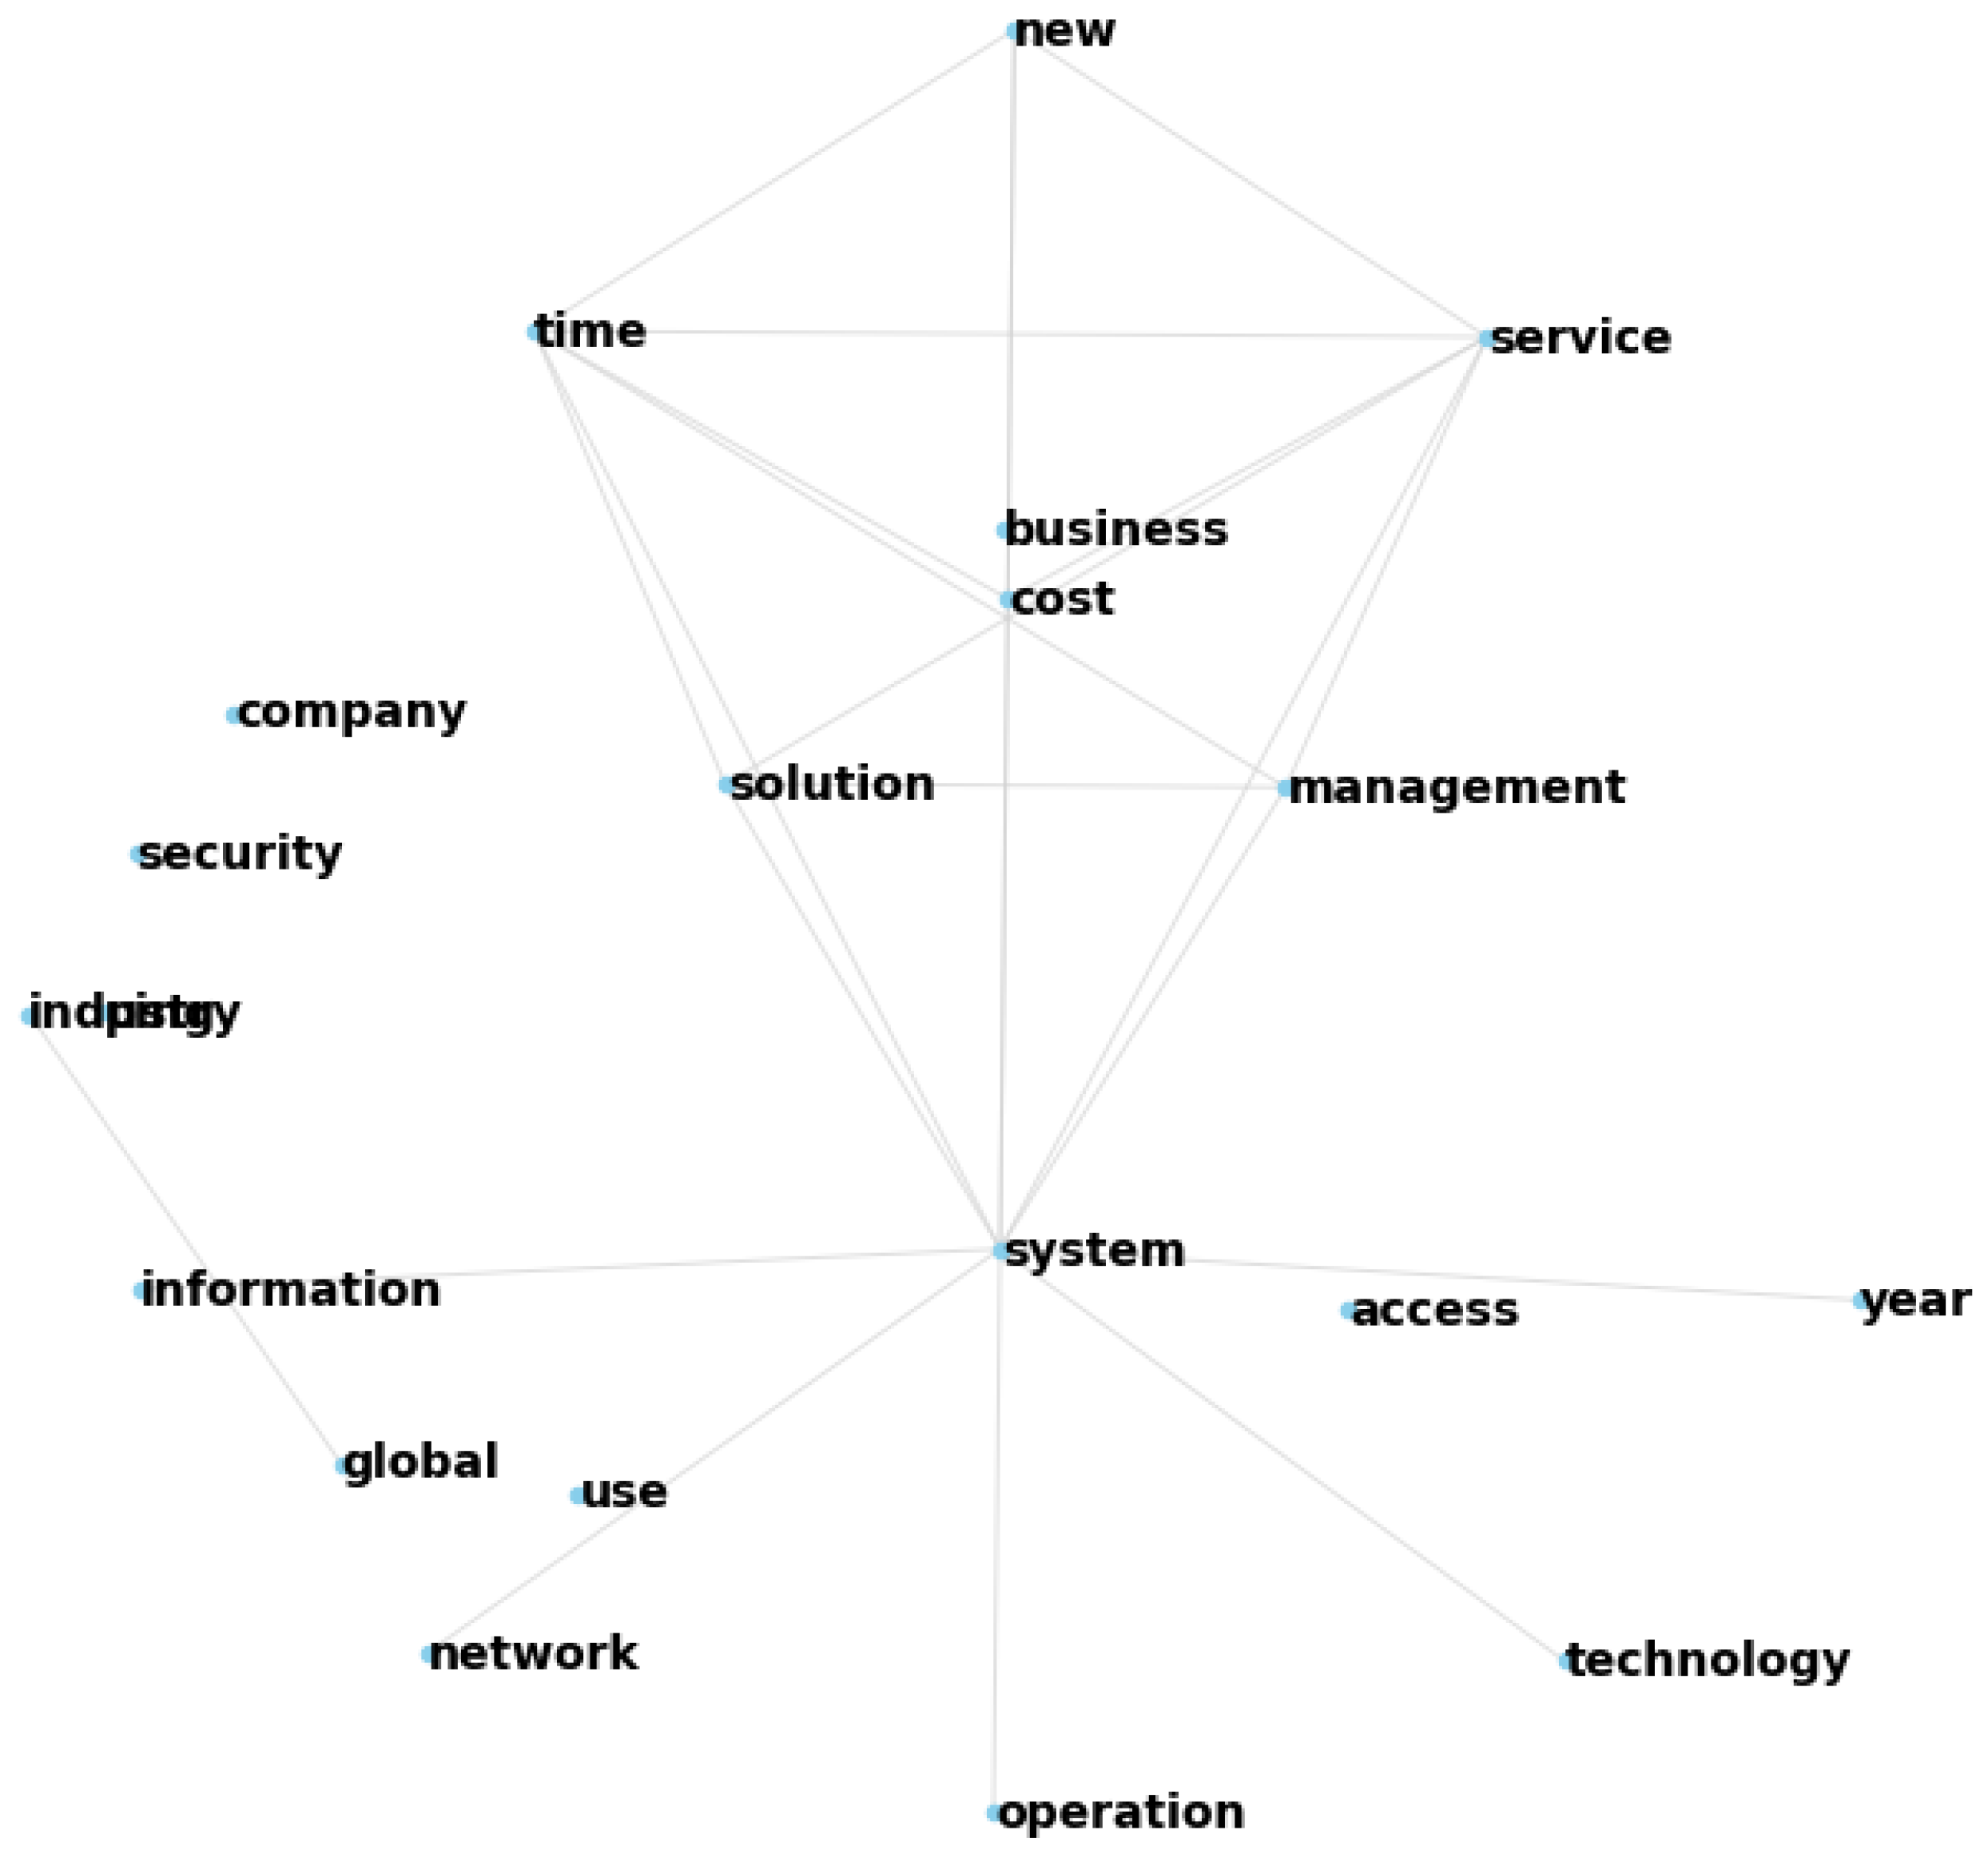
Network analysis allows the detection of influential keywords, identification of main topics, and insights into the structure of the text. The top 15 feature words and their relationships can be seen in the graph in
Figure 2. The most important features were system, security, risk, service, management, company, solution, operation, cyber, information, port, ping, control, business, and industry. A bit further down the list is also mentioned cost.
In
Figure 2, the word network, together with the centrality outlined in
Table 2, reveals a complex tapestry of interconnected themes that include systems, security, technology, networks, information, business, and risk. This intricate network underscores a strong emphasis on cybersecurity, highlighted by the frequent co-occurrence of terms such as “system”, “security”, “cyber”, “risk”, and “technology”. This emphasis points towards a primary concern with safeguarding against threats. Furthermore, the inclusion of terms like “company”, “business”, “control”, “industry”, “solution”, and “operation” embeds this focus on cybersecurity within a broader business context, indicating that these protective measures are not just technical concerns but are integral to the operational and strategic frameworks of businesses.
The analysis also points to a global perspective on these issues, with words like “global”, “satellite”, and “network” hinting at the need for measures that span across internationally interconnected systems, including the potential use of satellite-based technologies. Additionally, the mention of “management”, “service”, “port”, and “ping” within the network indicates a focus on the technical management of networks, service delivery, and the diagnostics critical for maintaining system integrity.
Lastly, the presence of “cost” within the network highlights an awareness of the financial implications, suggesting that economic considerations are crucial in the planning and implementation of security measures. This multifaceted analysis reveals a comprehensive view of cybersecurity that encompasses technical, business, and global considerations, alongside the practical aspects of management and cost-efficiency.
4.2. Detecting Topics from Presentations
4.2.1. Tuning Hyperparameters BERTopic
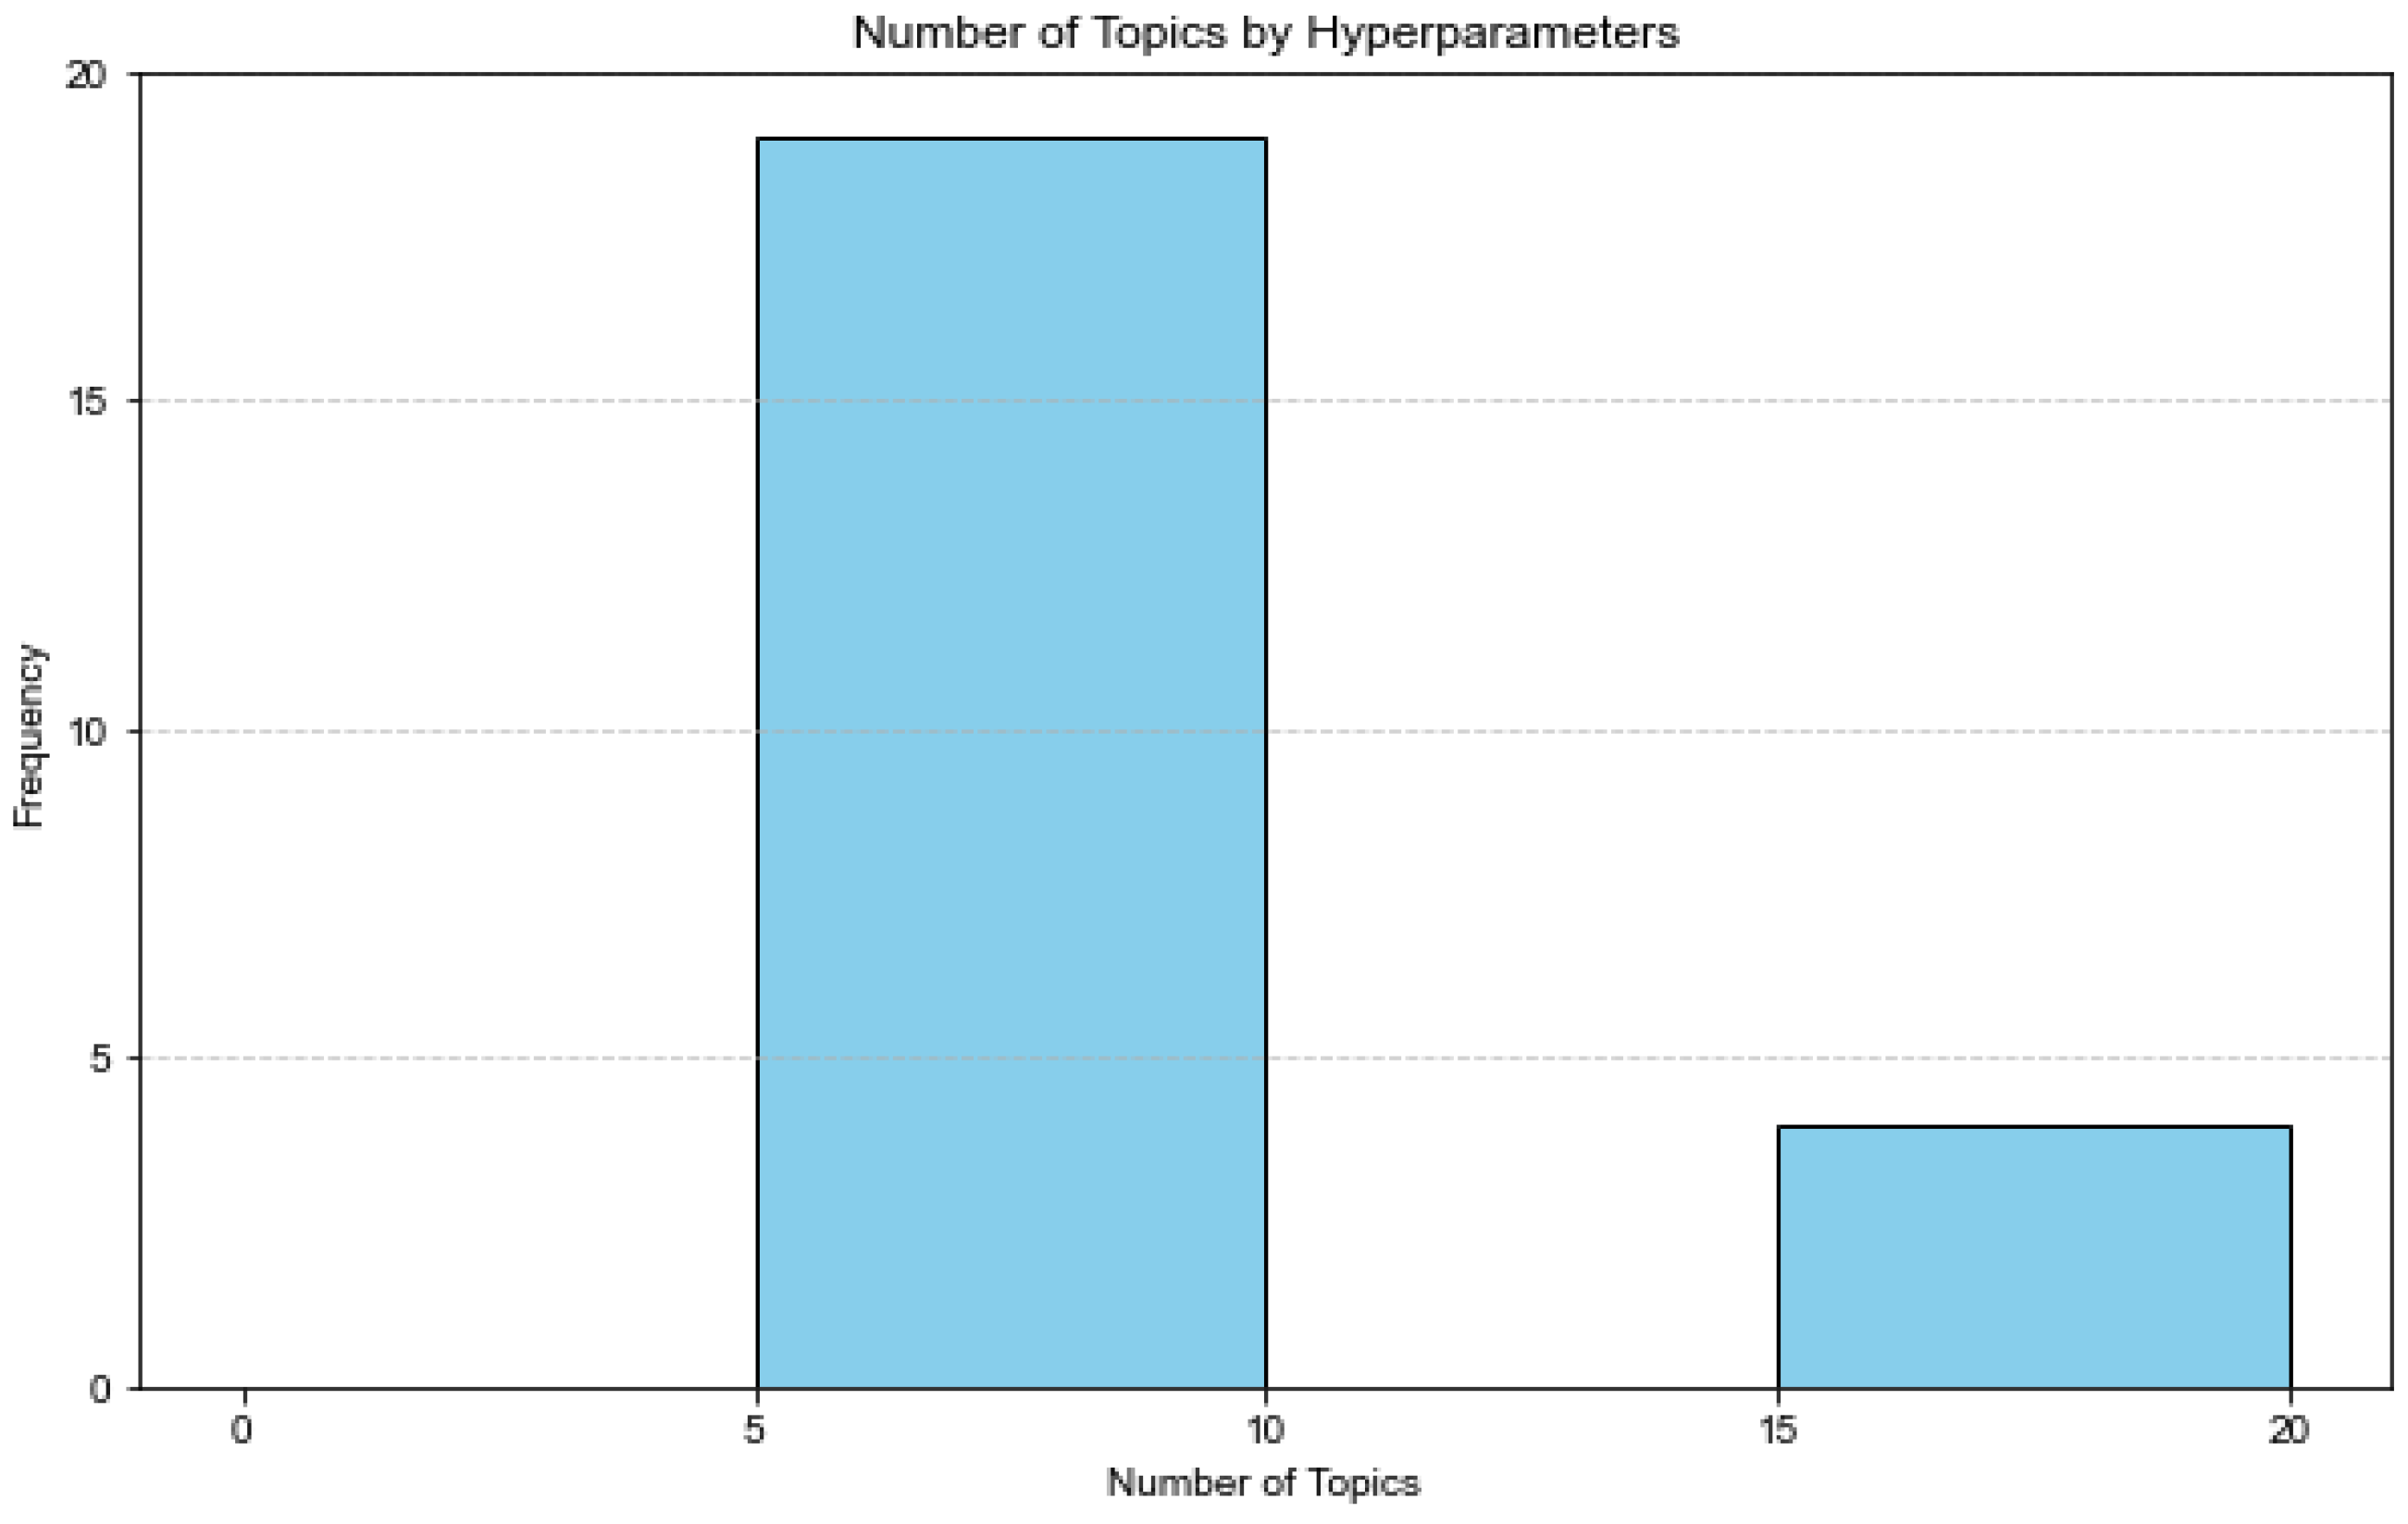
To use BERTopic, some parameters were tuned. The number of neighbors, and the number of components, were varied to obtain the best cosine coherence. The number of topics was also considered.
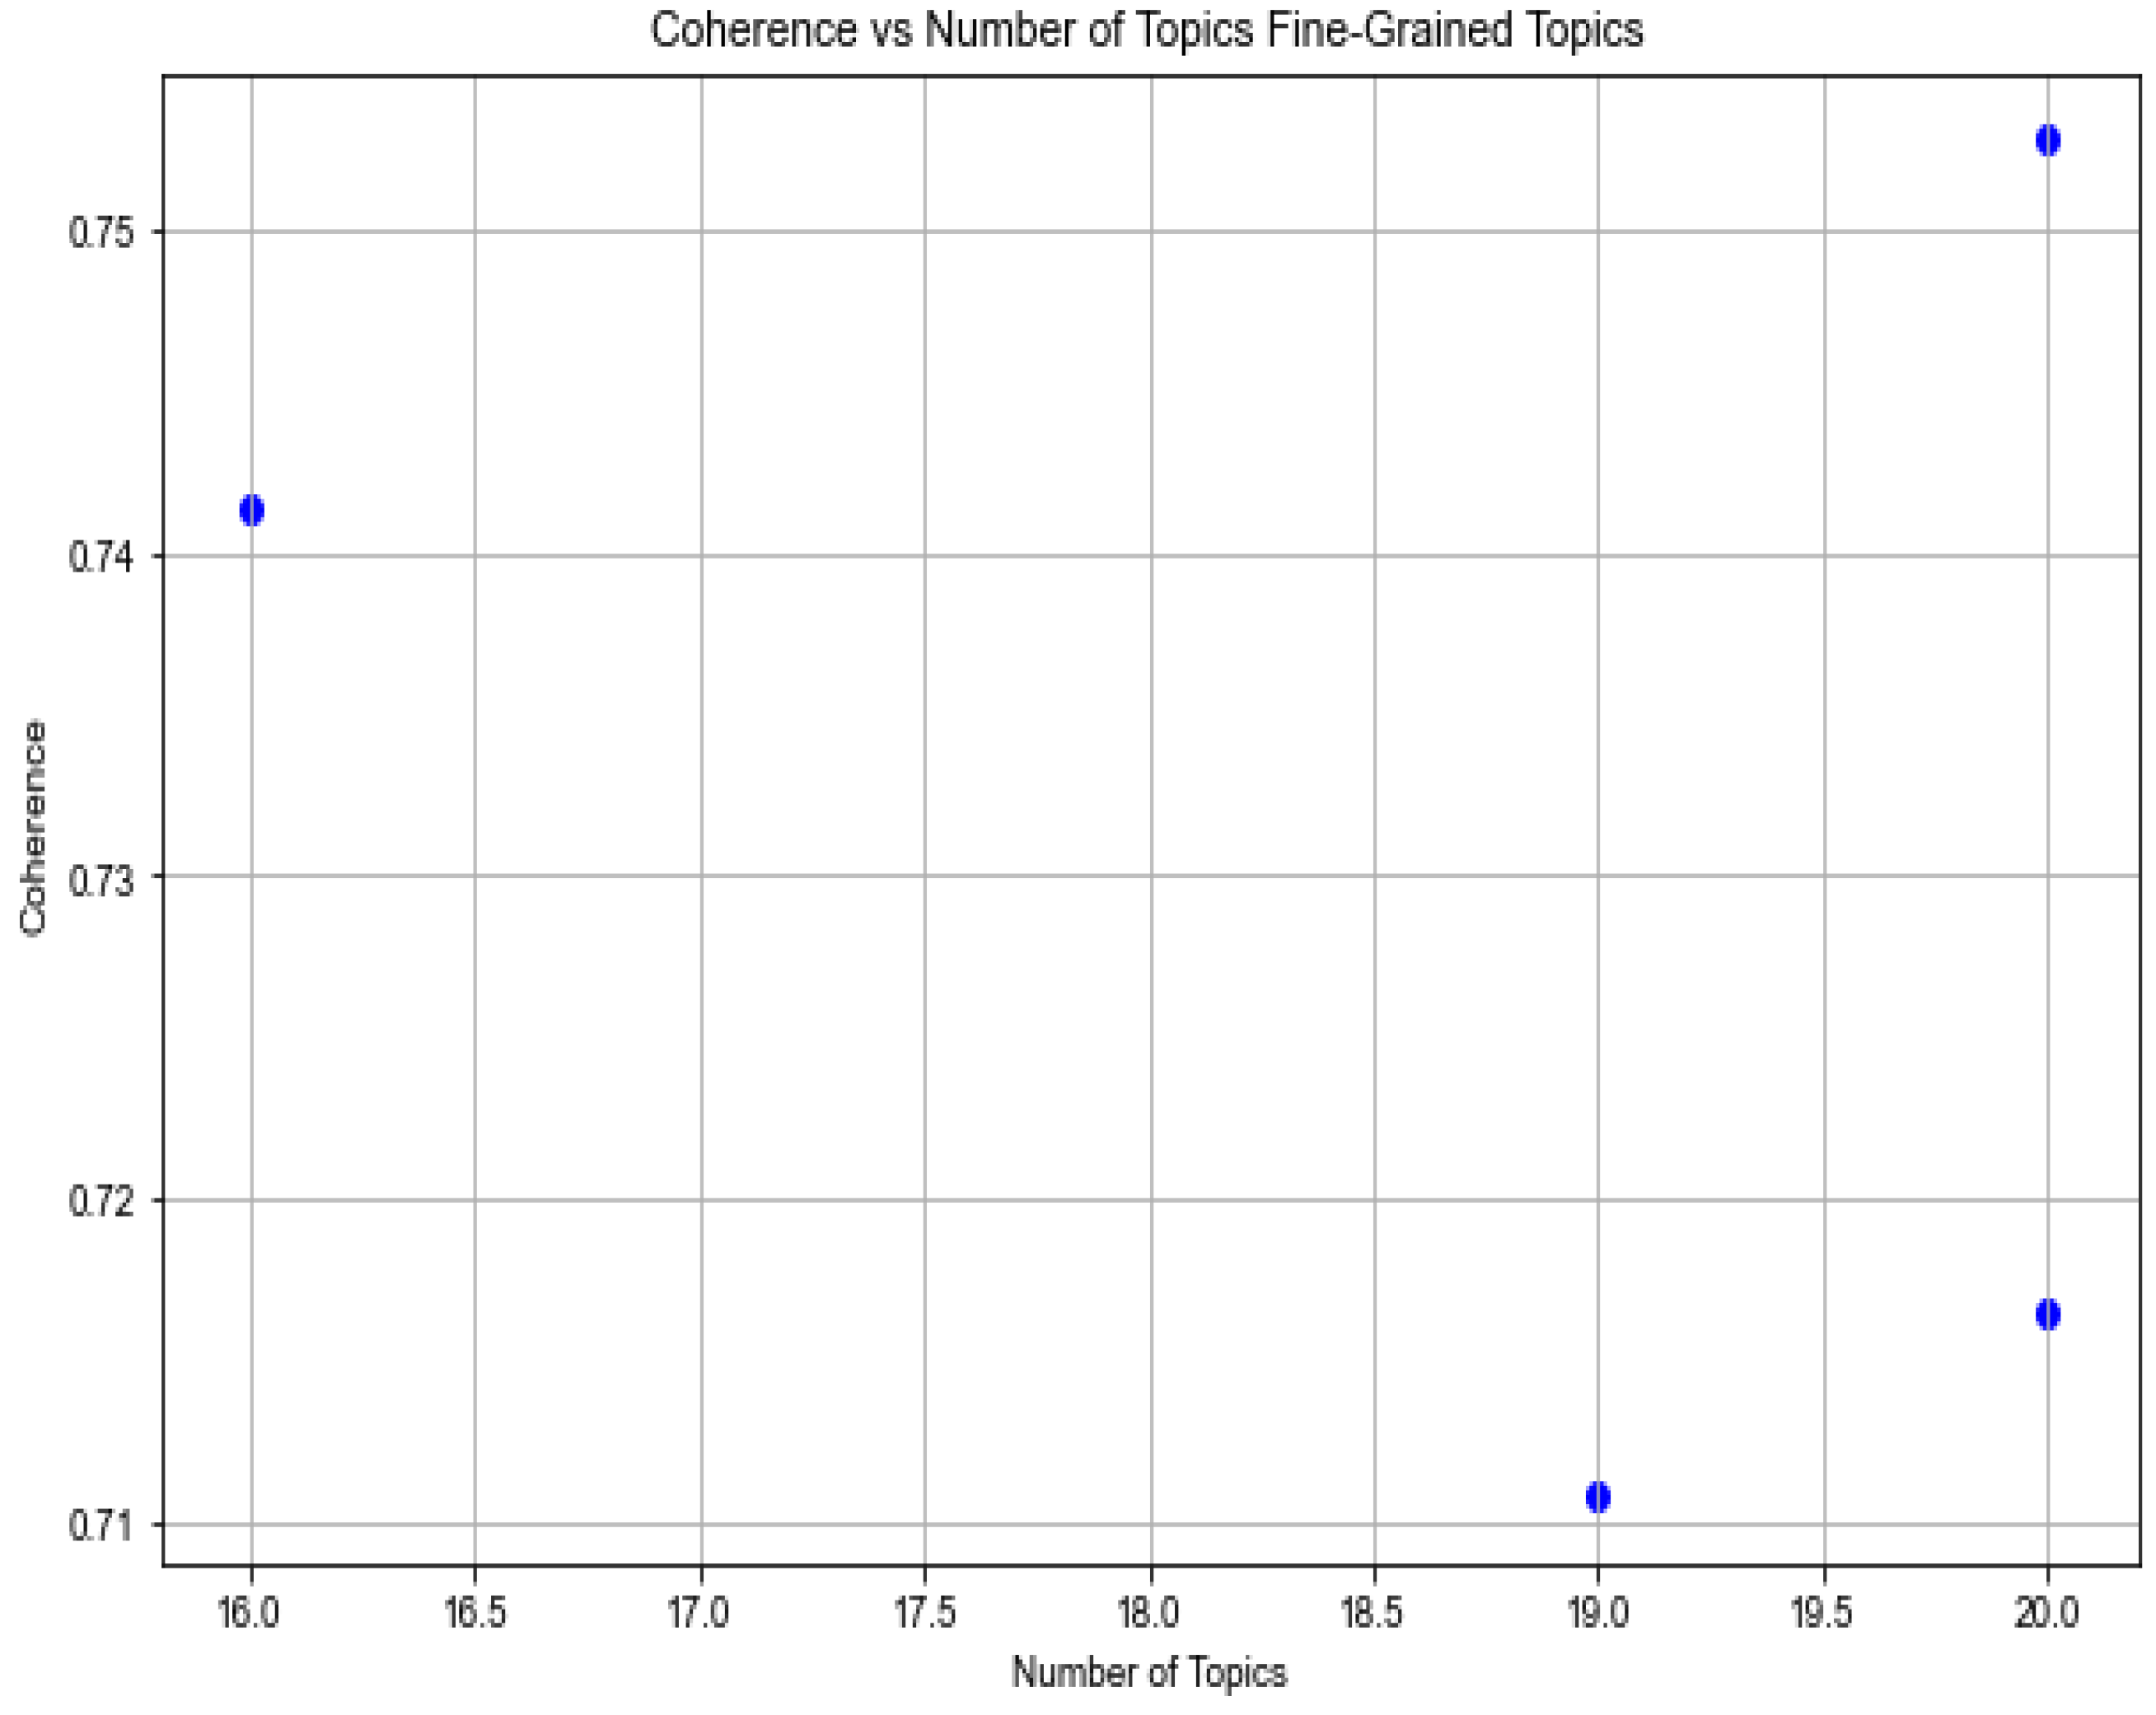
The distribution of the number of topics by hyperparameters in
Figure 3 shows that there were two groups of numbers of topics that could be generated with the number of topics automated, a main group with 5 to 10 topics (called principal topics) and a smaller with 15 to 20 topics (called fine-grained topics). The first group was the most important one, the second group, although the smaller could be interesting to detect more hidden attention points that pop up.
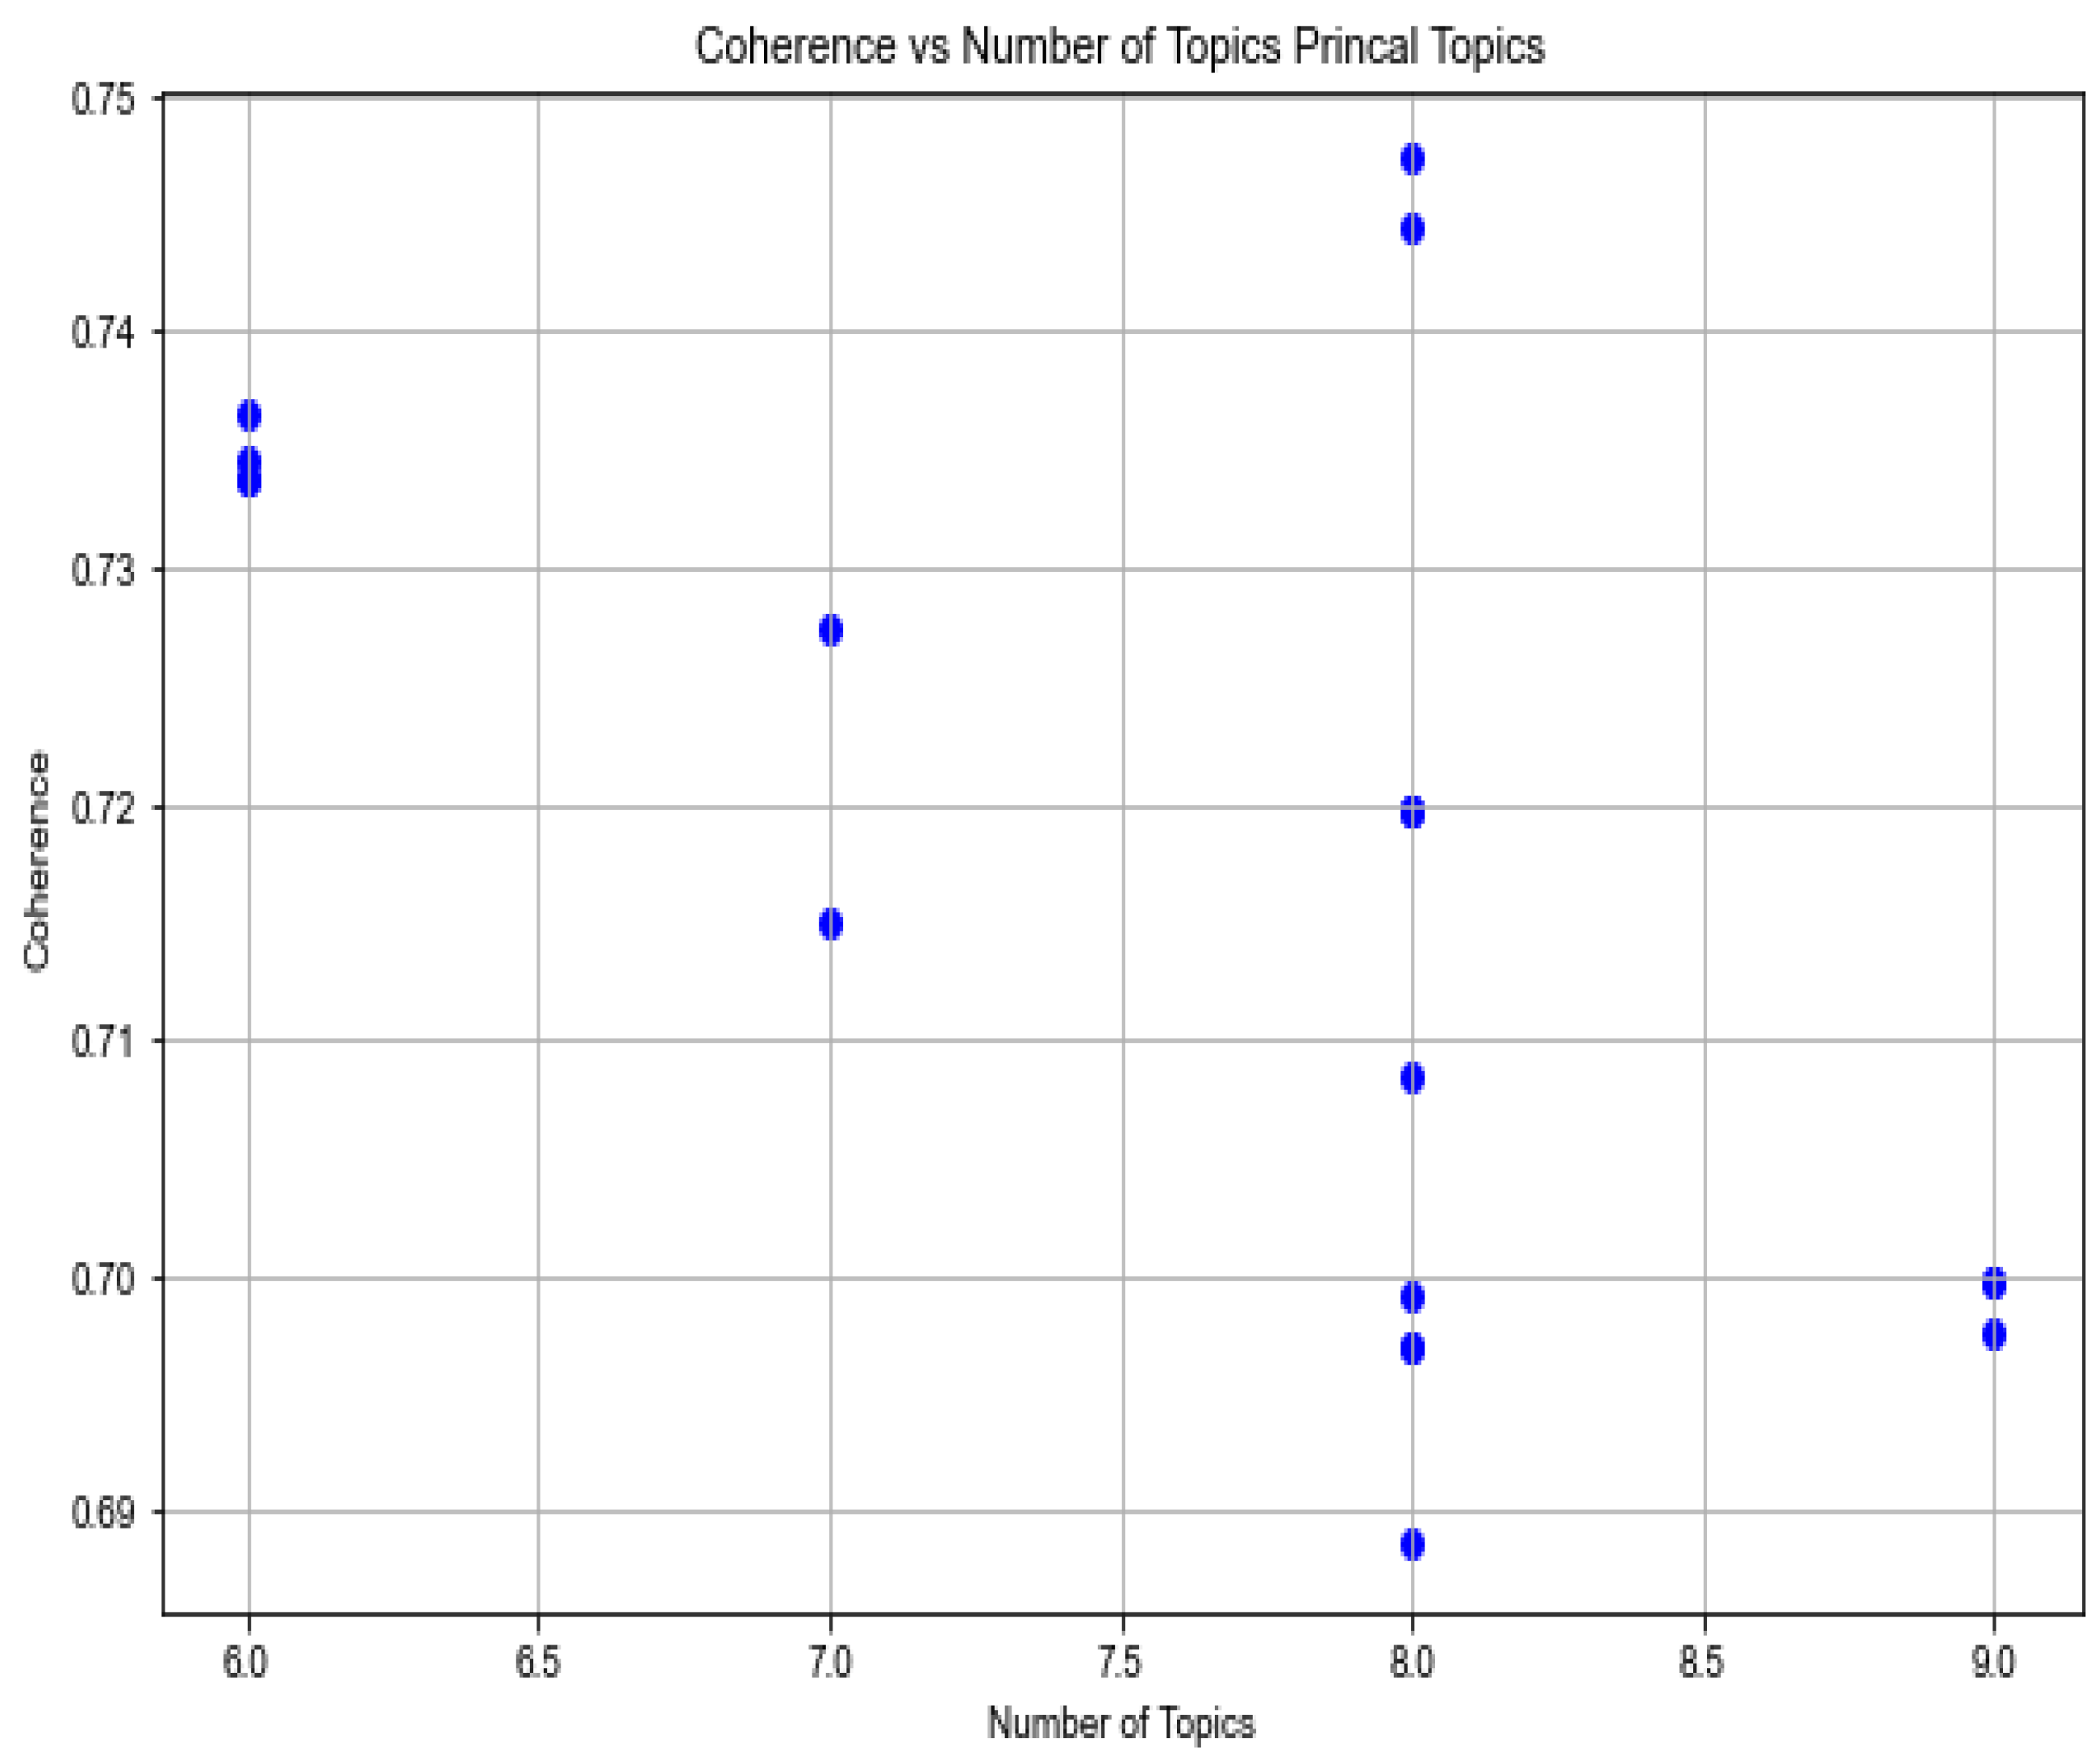
The coherences, depending on topics within each group, are shown in
Figure 4 and
Figure 5. The highest coherences within each group were selected. These were 0.747 for 8 topics and 0.753 for 20 topics.
The translation from the number of topics generated and coherence towards the hyperparameters, the number of neighbors and the number of components was performed based on
Table 3.
The hyperparameters neighbors 7, components 10, and neighbors 4, components 8, were chosen due to the highest coherence in their group.
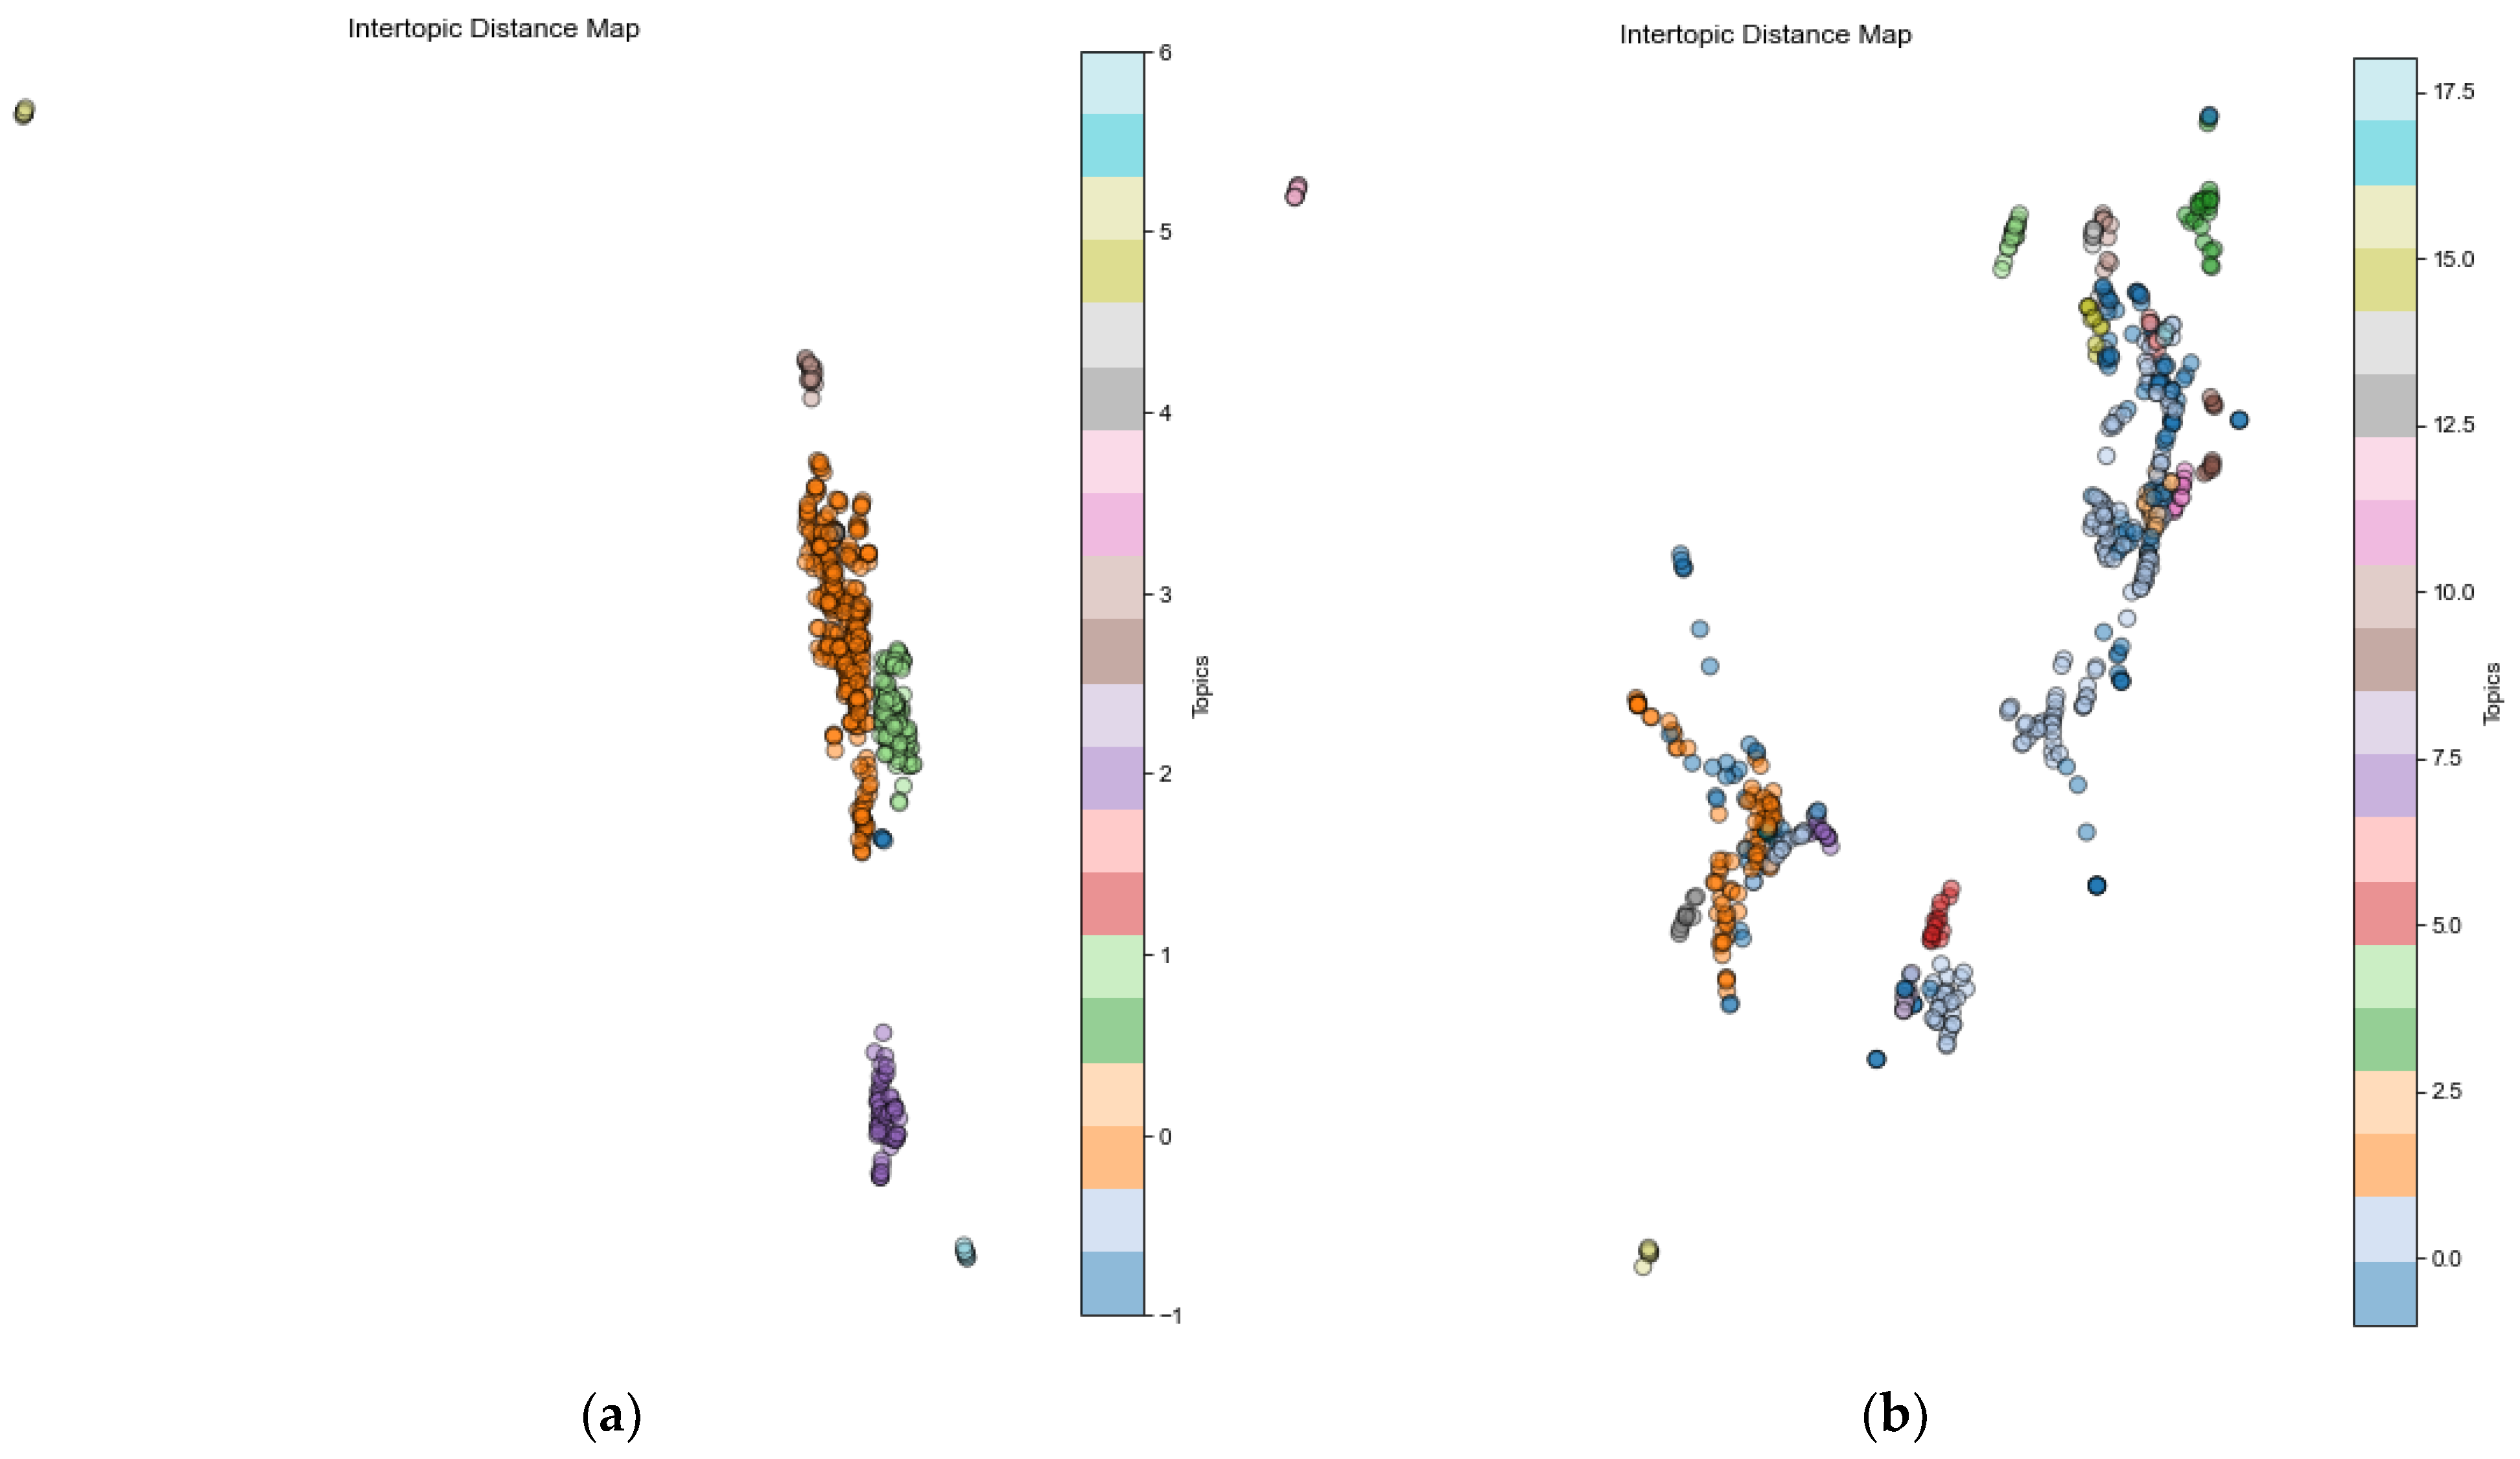
The intertopic distance map in
Figure 6a,b visualizes the cluster’s coherence and the outliers for the principal topics. For the principal topics approach, the cosine coherence was 0.747 (Gensim coherence c_v). For the fine-grained topics approach, the cosine coherence was 0.753. The average cosine distance between groups for the principal topics was 0.86 and for the fine-grained topics was 0.94. A mix of principal and fine-grained topics was used for detecting principal and upcoming trends.
4.2.2. Topic Generation
The transformer generated a group of topics twice. The names of the topics were the 10 keywords of each topic.
4.2.3. Principal Topics
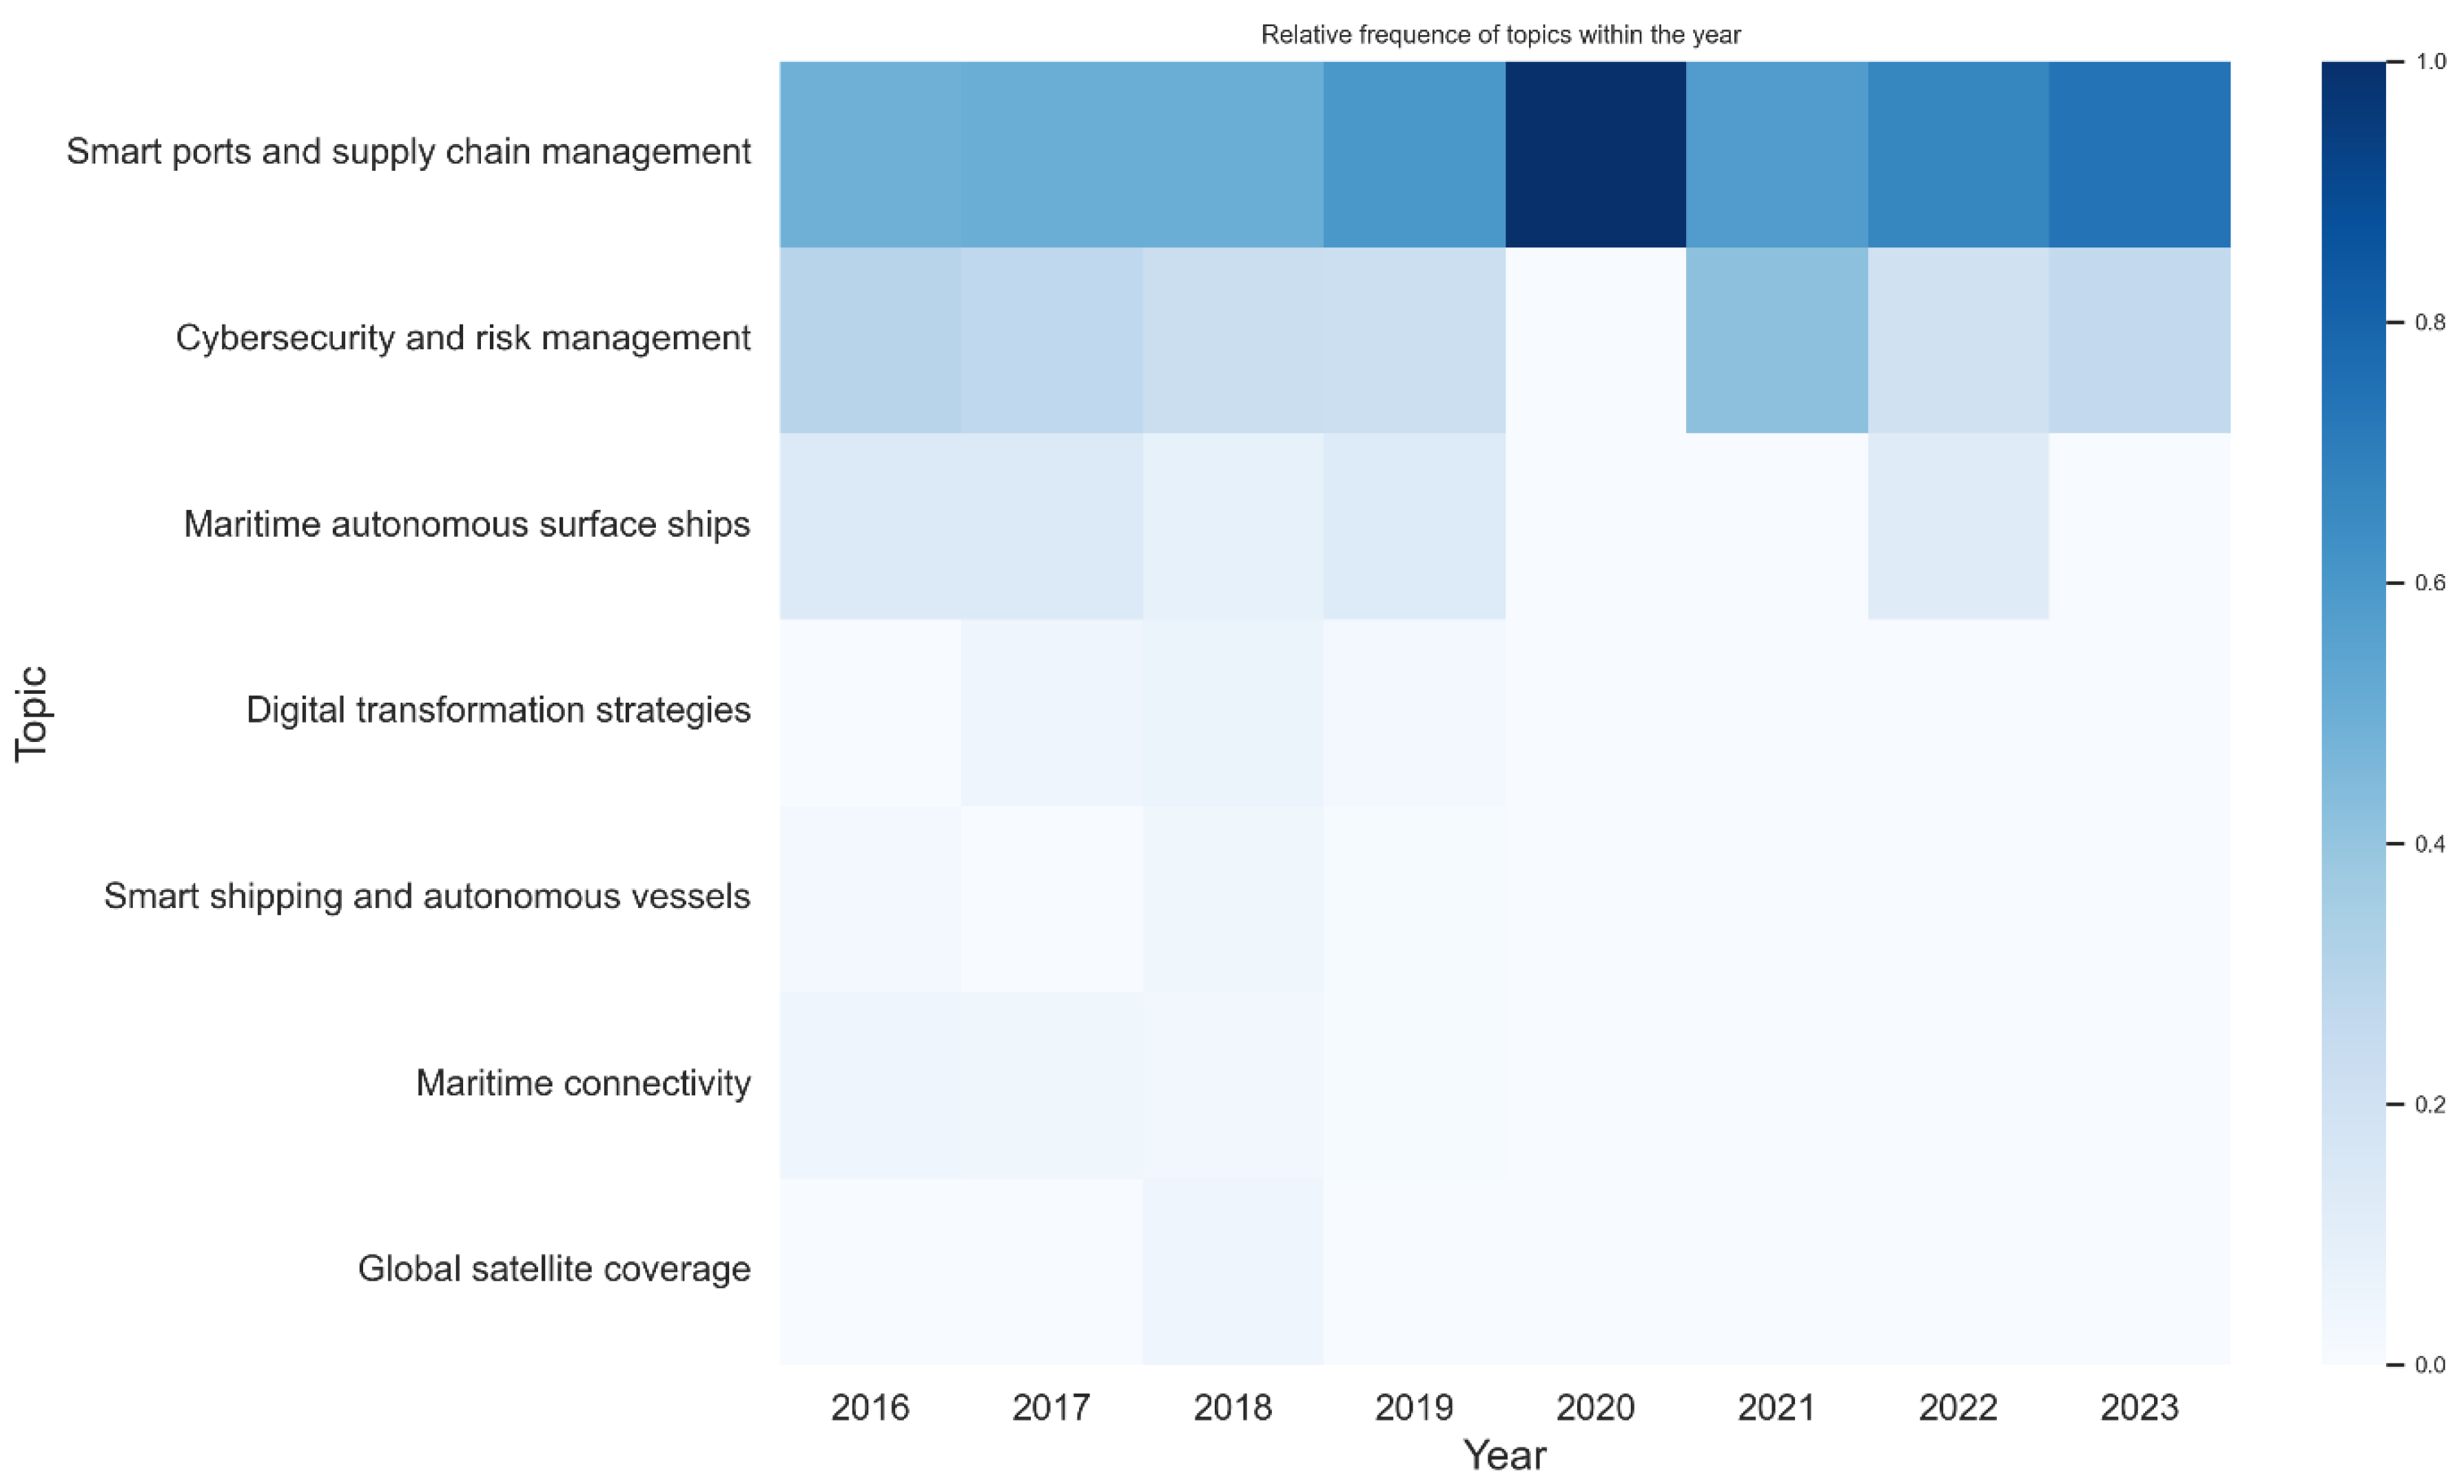
The heatmap in
Figure 7 shows the normalized frequency of presentations by topic and year. The more intense the color, the higher the frequency. The Theil—Sen regression [
21] gives us the evolution over the years.
Table 4 provides more details.
Normalization was required, as is shown in
Table 4, due to the high fluctuations in the number of presentations by year. The number of presentations by topic was divided by the number of the presentations of the concerned year. The darker the color, the higher the frequency of the topic in that year. The rows show the normalized evolution of the topic over the years. The columns show the relative importance of the topics within a year. The most important topics were Cybersecurity and risk management and Global satellite coverage.
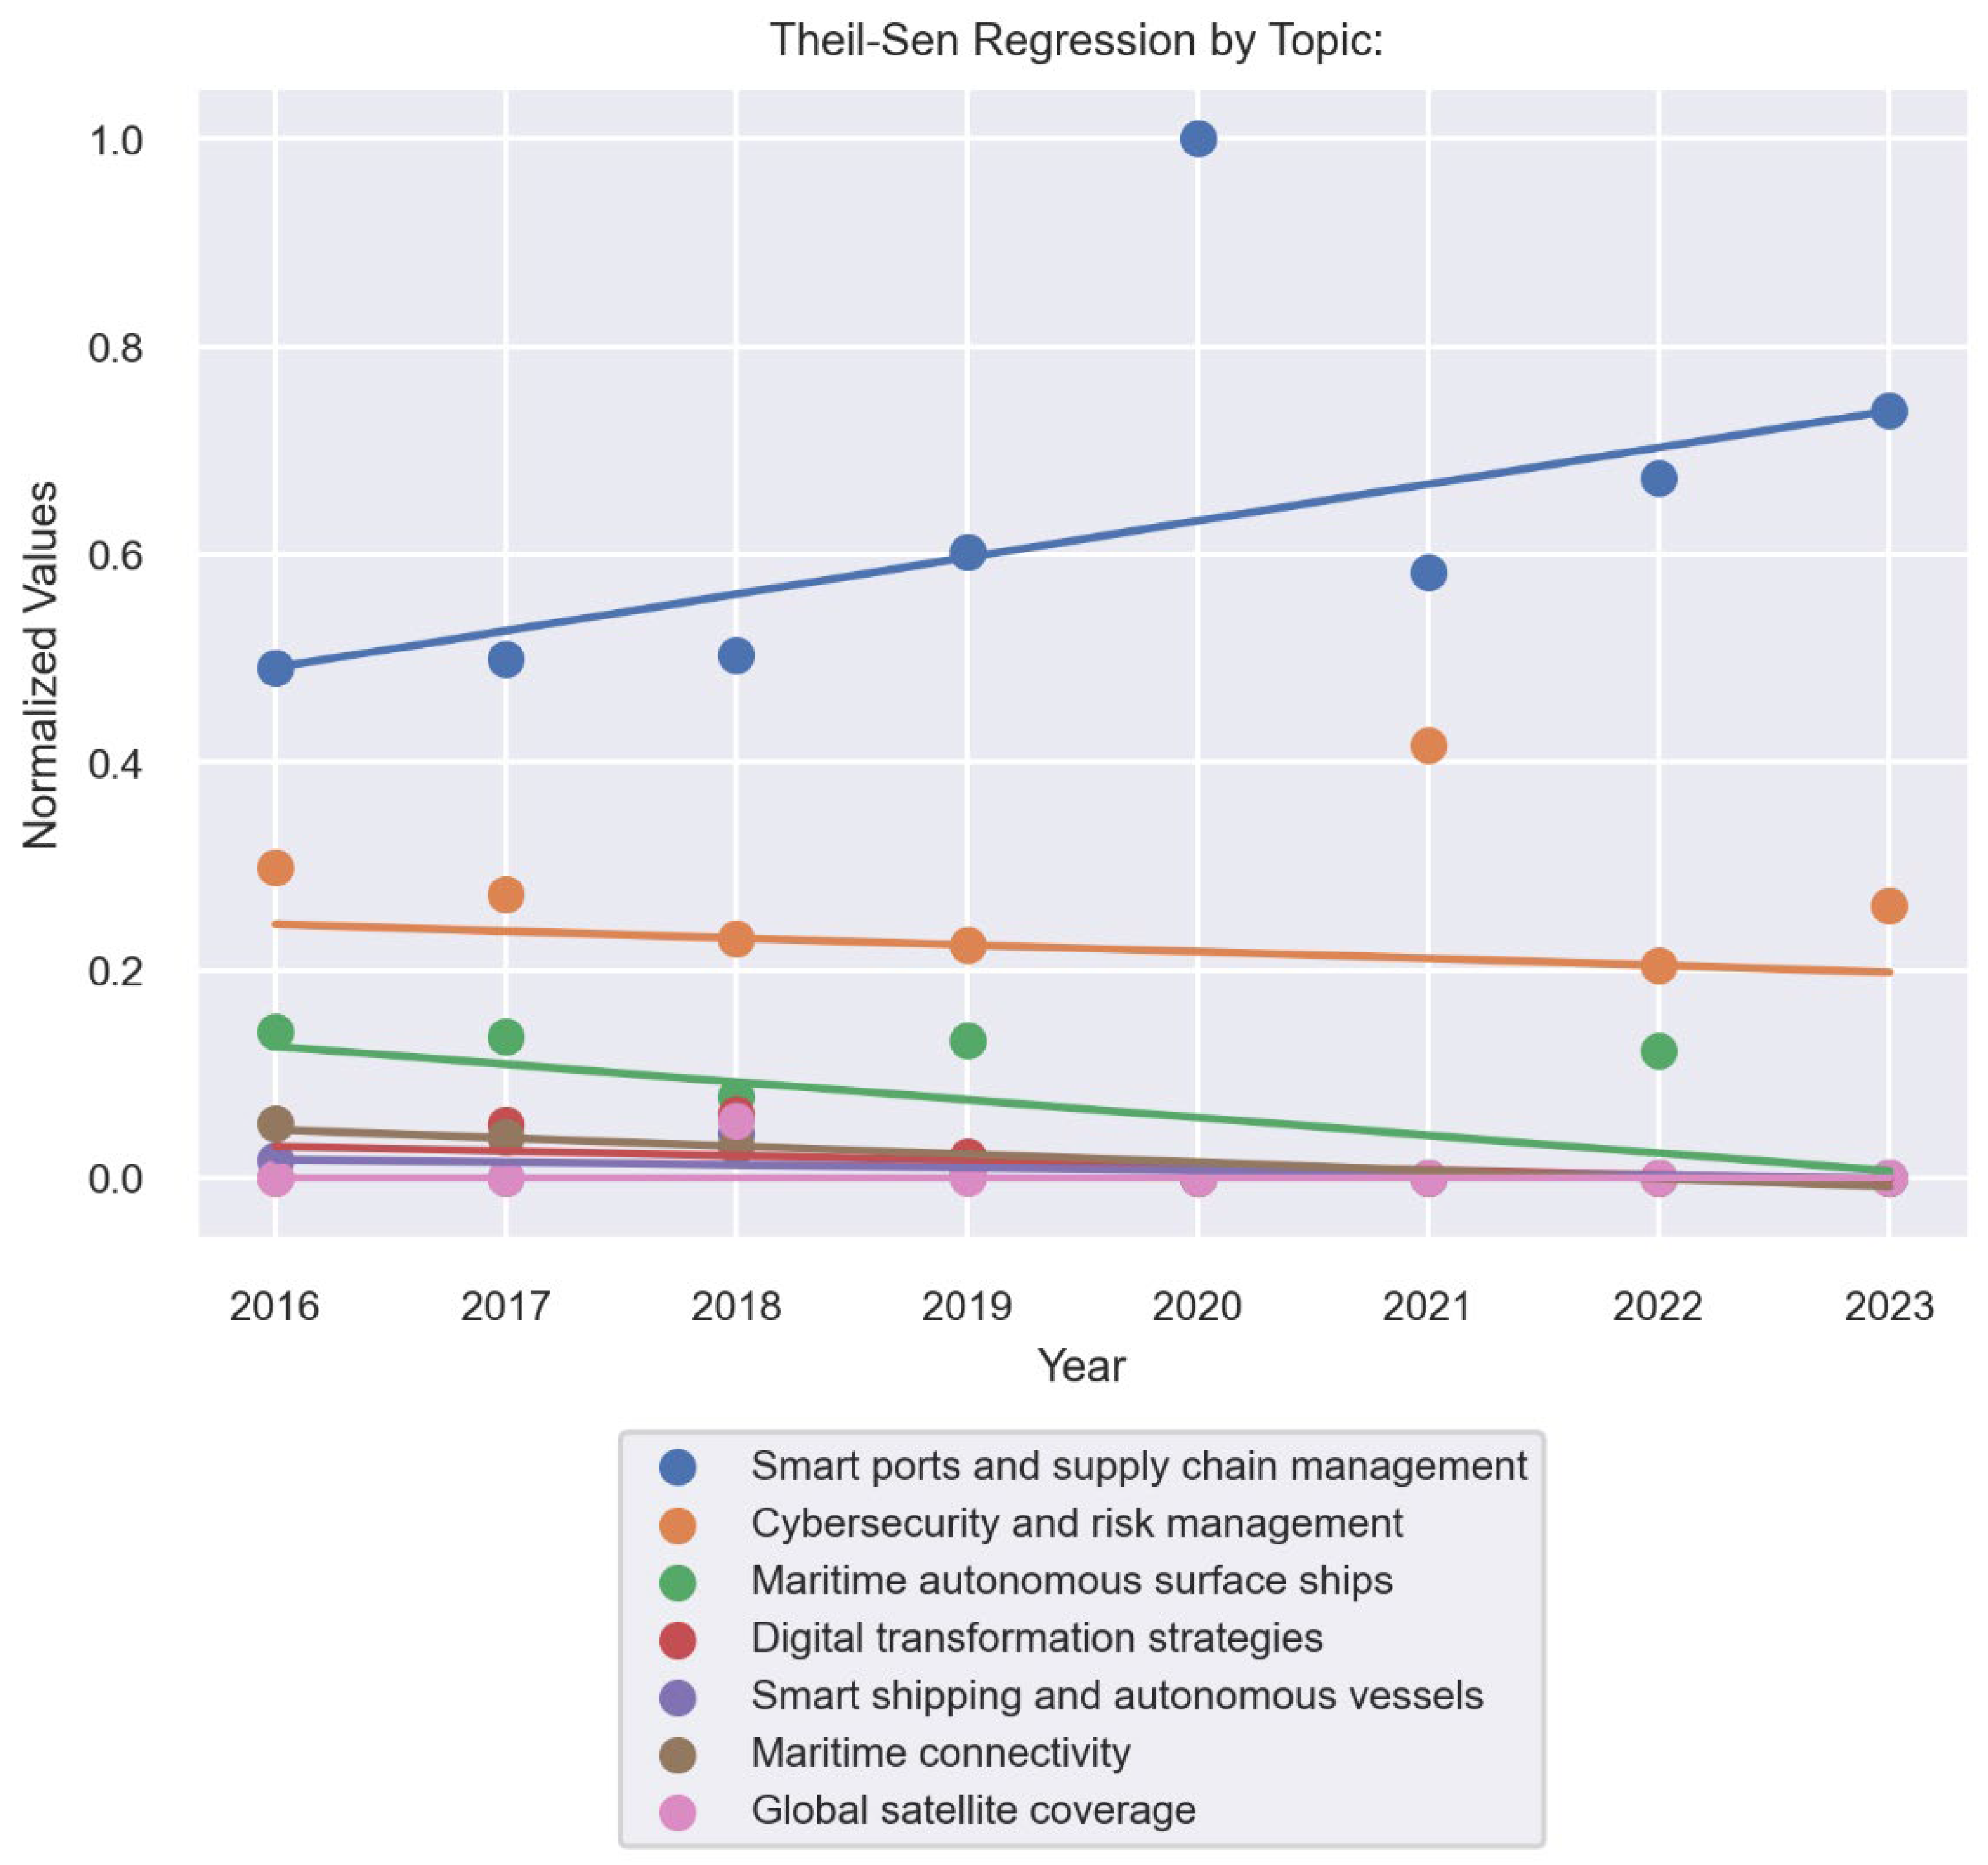
The Theil–Sen regression of
Figure 8 shows the evolution of the topics over the years. There was an increase in interest in smart ports and supply chain management. There is a decrease in interest in cybersecurity and risk management, and in Global satellite coverage.
Table 4 presents the normalized number of presentations by principal topic by year, unveiling several key insights into industry trends and interests. The table highlights a marked increase in interest towards smart ports and supply chain management, with interest levels hitting 100% in 2020. This surge underscores a growing focus on digitalization and efficiency enhancements in port operations, reflecting the industry’s commitment to adopting cutting-edge technologies to streamline processes.
On the cybersecurity and risk management front, the data revealed fluctuations in interest levels over the years. Despite these variations, there was an observable trend of shifting concern and investment in cybersecurity measures. With a peak in 2021, the figures indicate a dynamic landscape of cybersecurity priorities within the industry.
Fuel management is as an attention point moderate and constantly present. This indicates that some evolution is going on.
Regarding Global satellite coverage, the interest levels have remained relatively low, suggesting a cautious or selective approach toward adopting digitalization and cybersecurity measures across the maritime sector. This indicates that while there is awareness of the importance of cybersecurity, the adoption rate was gradual and not yet widespread.
The topic of Supply chain management initially piqued some interest in 2017 but saw a decline in the subsequent years. This trend might reflect a reevaluation of priorities within the industry or challenges in overcoming technological hurdles associated with the deployment of autonomous vessels.
Lastly, the exploration of digital transformation strategies, alongside smart shipping, and the Internet of Things (IoT), has consistently attracted minimal interest. This suggests that, despite the buzz around these concepts, they have not emerged as central focuses within the industry, at least not within the presentations that we analyzed, possibly due to the nascent stage of these technologies or the industry’s cautious stance toward more speculative ventures.
4.2.4. Fine-Grained Topics
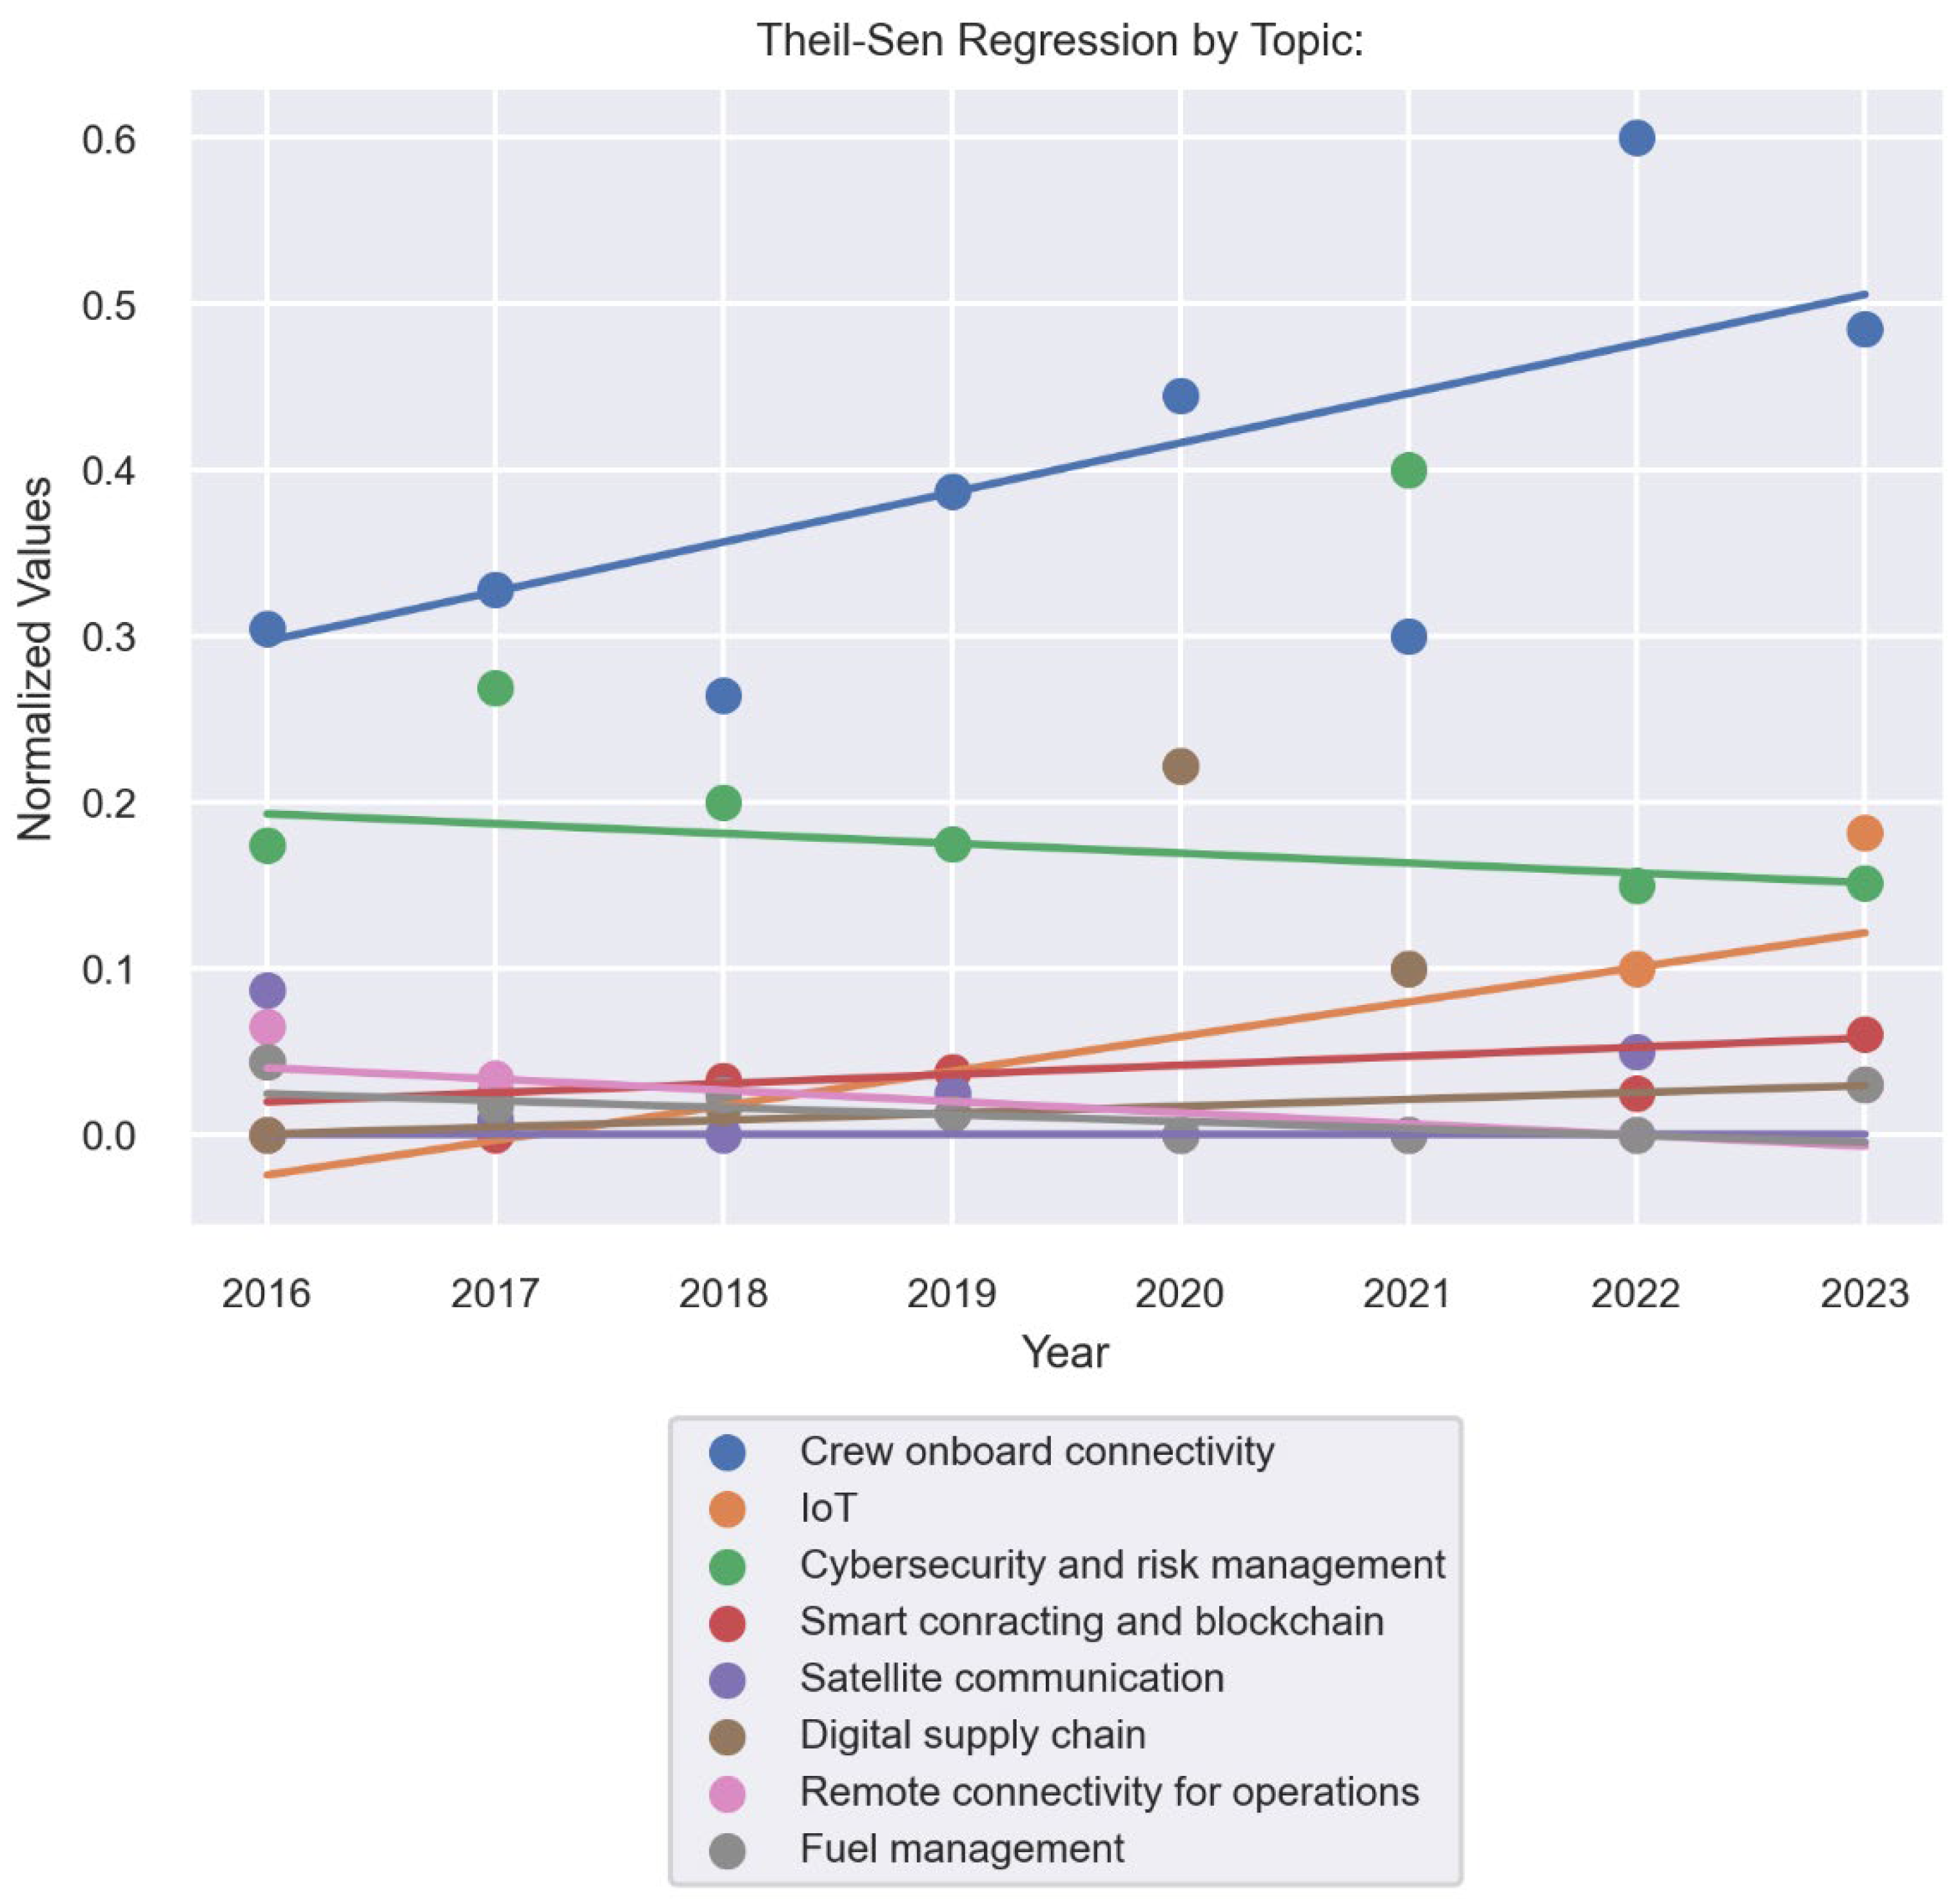
Figure 9 and
Figure 10 and
Table 5 therefore indicate that the analysis of key insights reveals several trends in the maritime sector, with Crew onboard connectivity as outstanding and increasing topic. This is an important topic, also in the light of the kind of meetings.
The selection of only those topics with presentations in the last year with recalculation relative frequencies amongst them was to focus on the relevant topics.
Cybersecurity and risk management stood out due to its fluctuating percentages and a significant uptick in interest in 2021. This trend points towards an increased focus on cybersecurity and risk management within the industry, likely spurred by the emergence of new threats and changes in regulatory landscapes. The industry’s response suggests a proactive approach to strengthening defenses and managing risks more effectively.
Another area of growing interest is the IoT, which has seen varying levels of attention, with notable spikes in interest in 2023. This can be interpreted as a co-topic with Smart contracting and blockchain.
Remote connectivity for operations has also exhibited a fluctuating pattern, with a significant rise in interest in 2020. This surge reflects the maritime industry’s escalating focus on connectivity and communication technologies. Driven by the increasing importance of data exchange and the need for real-time monitoring, this trend underscores the sector’s commitment to enhancing communication infrastructures and capabilities.
Regarding smart shipping and the Internet of Things (IoT), the interest levels have fluctuated, yet there remains a consistent focus on this area. This demonstrates an ongoing attention to integrating IoT technologies into smart shipping initiatives, suggesting a continuous effort to leverage IoT for operational improvements and innovation in shipping practices.
Lastly, Crew onboard connectivity has shown fluctuating interest levels, with a noticeable increase in 2021. This suggests a renewed emphasis on boosting connectivity within the maritime sector, indicating a recognition of the critical role that enhanced communication networks play in facilitating more efficient and integrated maritime operations.
4.2.5. Guided Topic Modeling
The goal of guided topic modeling is to make the generated keywords more understandable and integrate some domain-specific knowledge. Guided topic modeling allows one to provide a list of words that should be present in the topics, while supervised topic modeling requires the user to provide labeled examples of documents for each topic. A list of topics was given (see addendum). To find the best link between the unsupervised keywords and the more understandable formulations, Spacy cosine similarity was used.
Table 6 and
Table 7 give the matching descriptions with the keywords from the unsupervised learning.
4.2.6. Metrics
For OCR, Tesseract gave an average confidence score of 74.38%.
The calculation of accuracy in unsupervised learning is tricky due to the lack of predefined labels. For this reason, the coherence was a metric. For the principal topics approach, the cosine coherence was 0.76 (Gensim coherence c_v). For the fine-grained topics approach, the cosine coherence was 0.70.
For supervised learning, the accuracy has to be approached carefully due to the small number of training data. The training accuracy was 95.33% and test accuracy was 94.82%.
4.3. Trends and Evolutions
4.3.1. Trends
Based on the highest frequencies, the important topics with their relative frequencies and evolutions are shown in
Table 8.
4.3.2. Potential Upcoming Trends
In this context, a simple way to detect an upcoming trend is a topic that is not frequent enough to be a trend and is growing. Therefore, the fine-grained approach was used. The small frequency topics that have a presentation in the last year and are growing were taken.
These were Crew onboard connectivity (4–10%) growing from 7% to 6% and Digital transformation strategies (0–14%) and growing from 0% to 3%.
4.3.3. Evolutions within the Topics
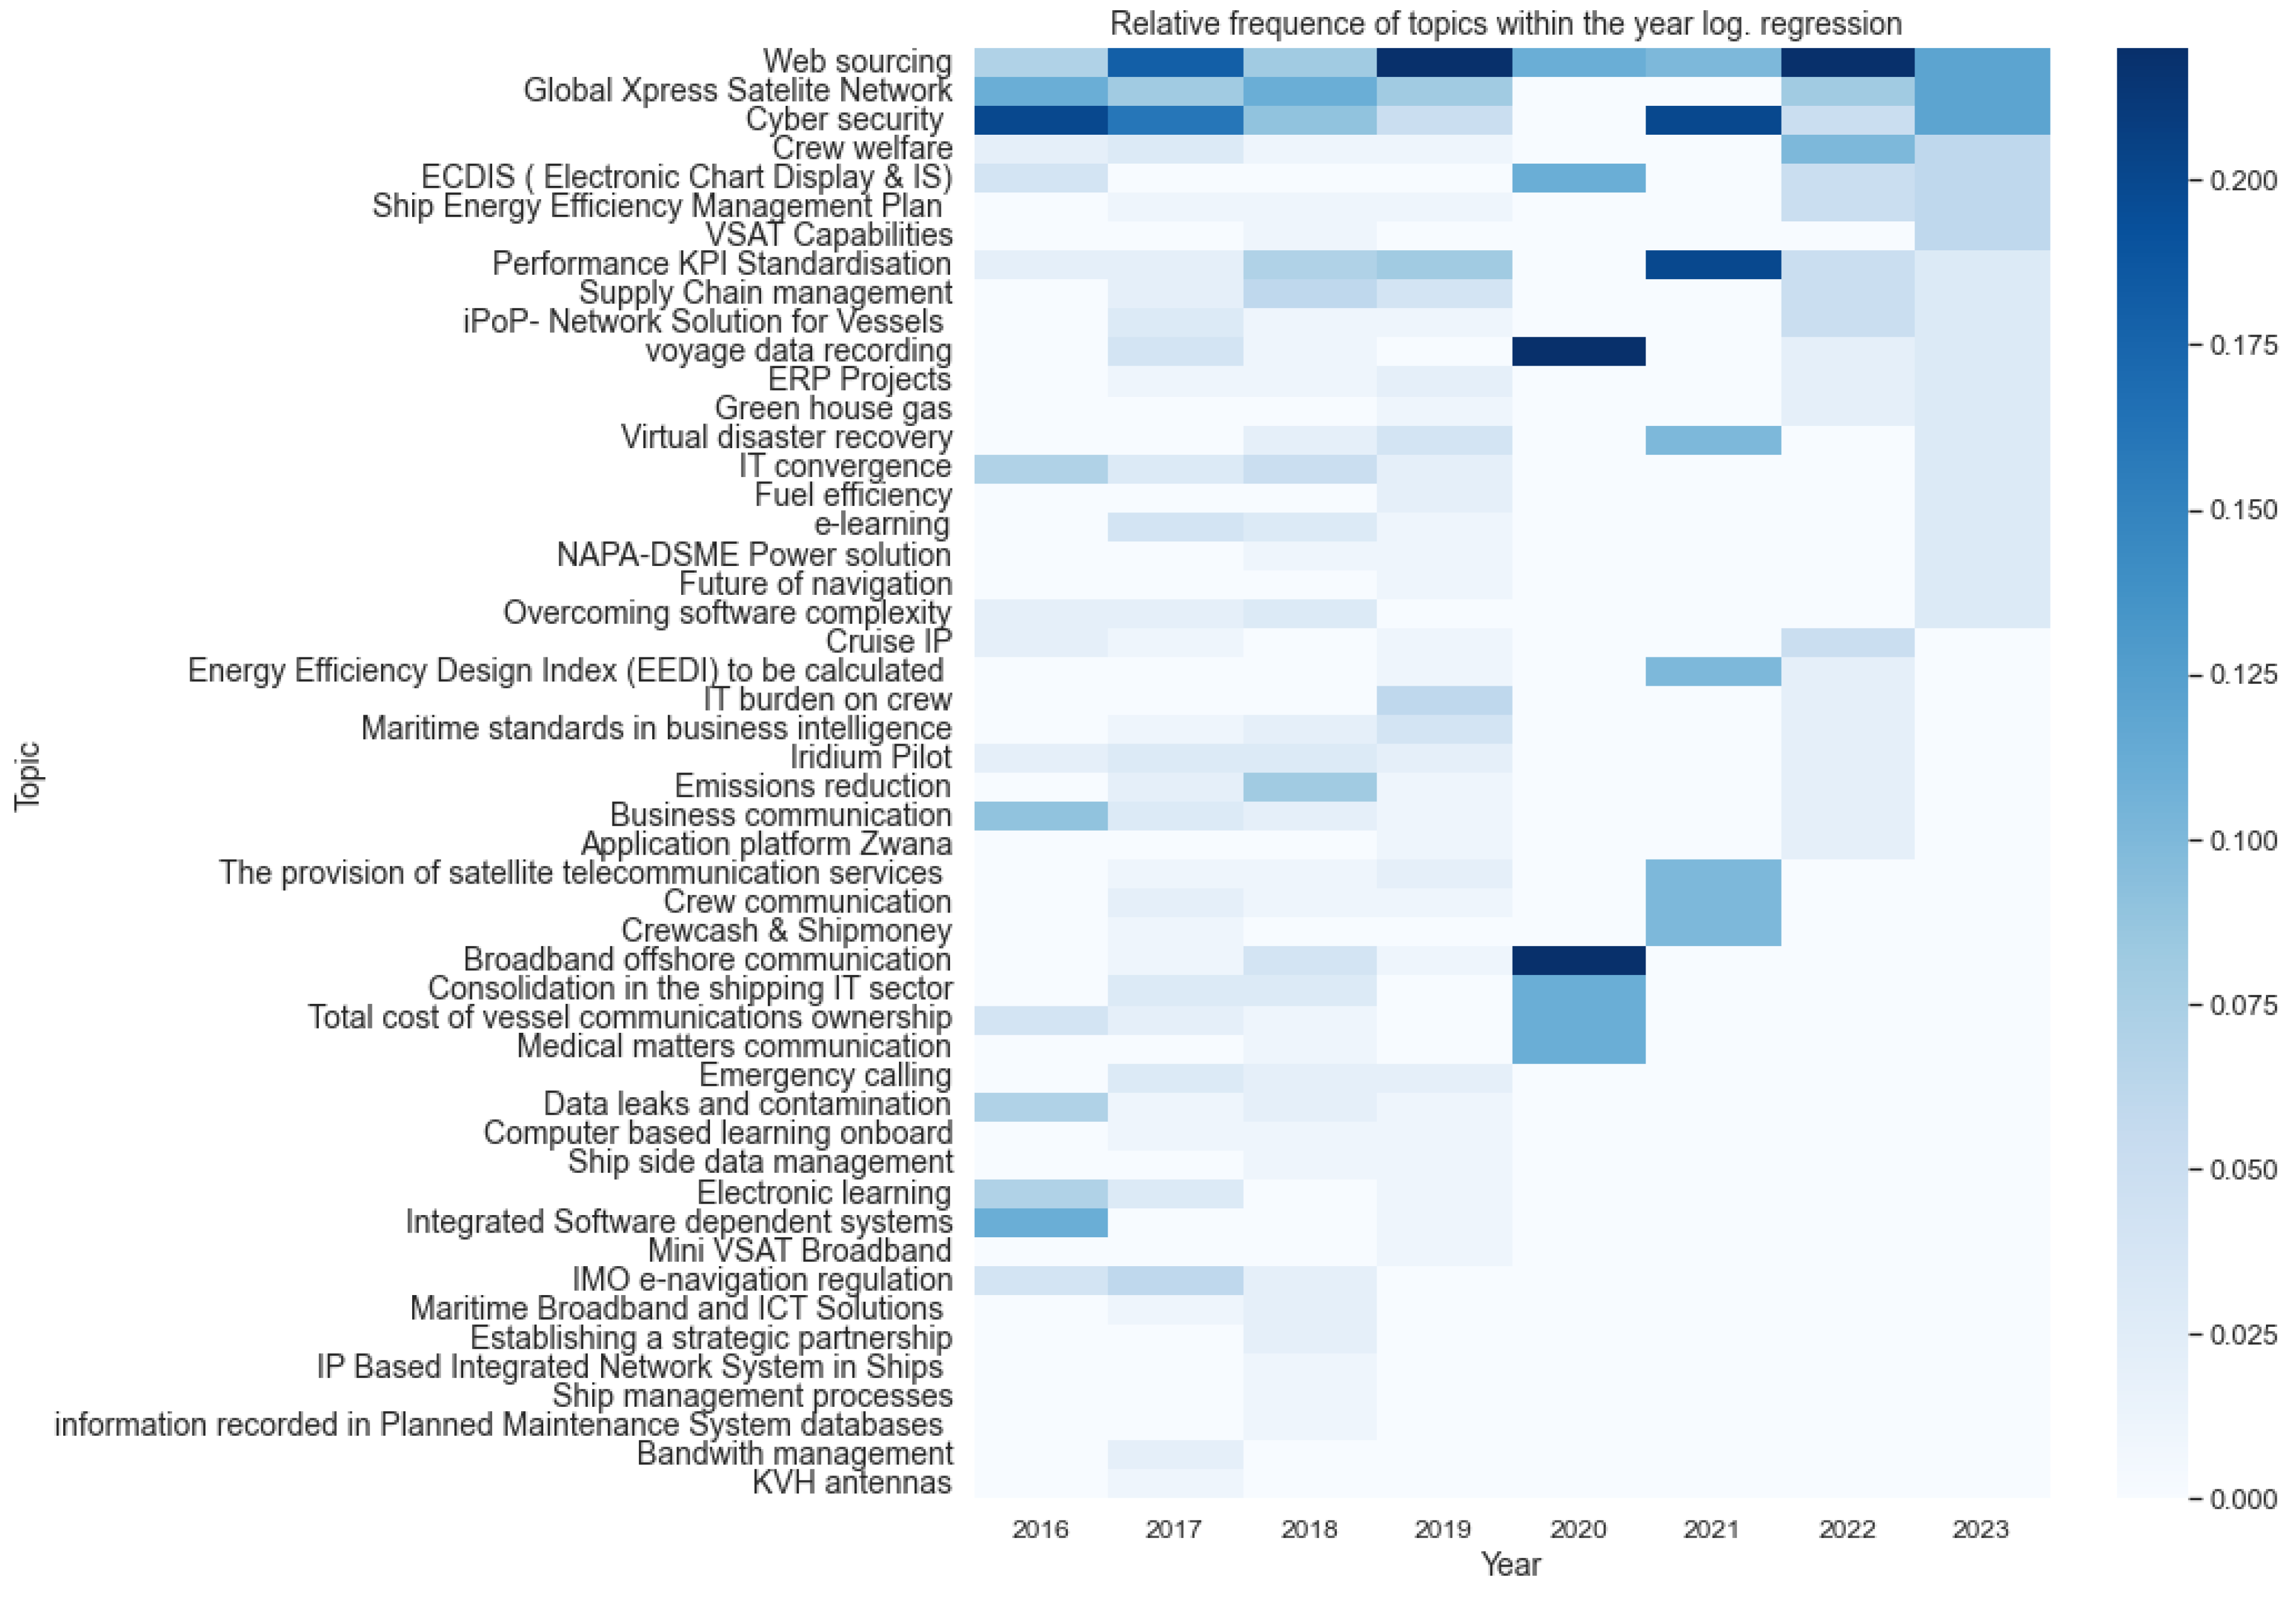
The changes in the frequency of the keywords in the documents by topic showed the evolutions within the topics. For this, a count was made of the keywords of the documents by topic. The results are shown in
Table 9.
Between 2016 and 2017, the prevailing keywords were “service”, “port”, “system”, and “ping”, indicating a focus on technology and infrastructure within the discussed context. As time progressed into 2018 and 2019, there was a shift in focus towards industry and business. This transition was marked by the emergence of keywords such as “iot”, “inmarsat”, “sector”, and “security”, signifying a change in the primary topics of interest.
Moving into the years 2020 and 2021, the emphasis continued on industry and business, but with a heightened focus on cybersecurity. This shift was reflected in the prominence of keywords like “cybersecurity”, “management”, “network”, and “risk”, illustrating the evolving concerns and focal points within these sectors.
By 2022, the topic had broadened further to encompass satellite services and blockchain technology. This expansion was highlighted by the introduction of keywords such as “satellite”, “certus”, “network”, “trade”, “smart”, “blockchain”, “transaction”, “contract”, “ledger”, and “IBM”, showcasing a diversification in the areas of interest and discussion.
There has thus been a growing interest in the use of technology to improve business operations and address security challenges. There has also been a growing interest in the use of satellite services and blockchain technology.
The keyword “service” was consistently among the most common keywords throughout the entire period. This suggests that the topic has always been focused on the delivery of services.
The keyword “management” has become more prominent in recent years. This suggests that there is a growing focus on the management of technology and cybersecurity risks.
The keywords “satellite” and “blockchain” are relatively new to the topic, but they have become increasingly prominent in recent years. This suggests that these technologies are gaining traction in the business world.
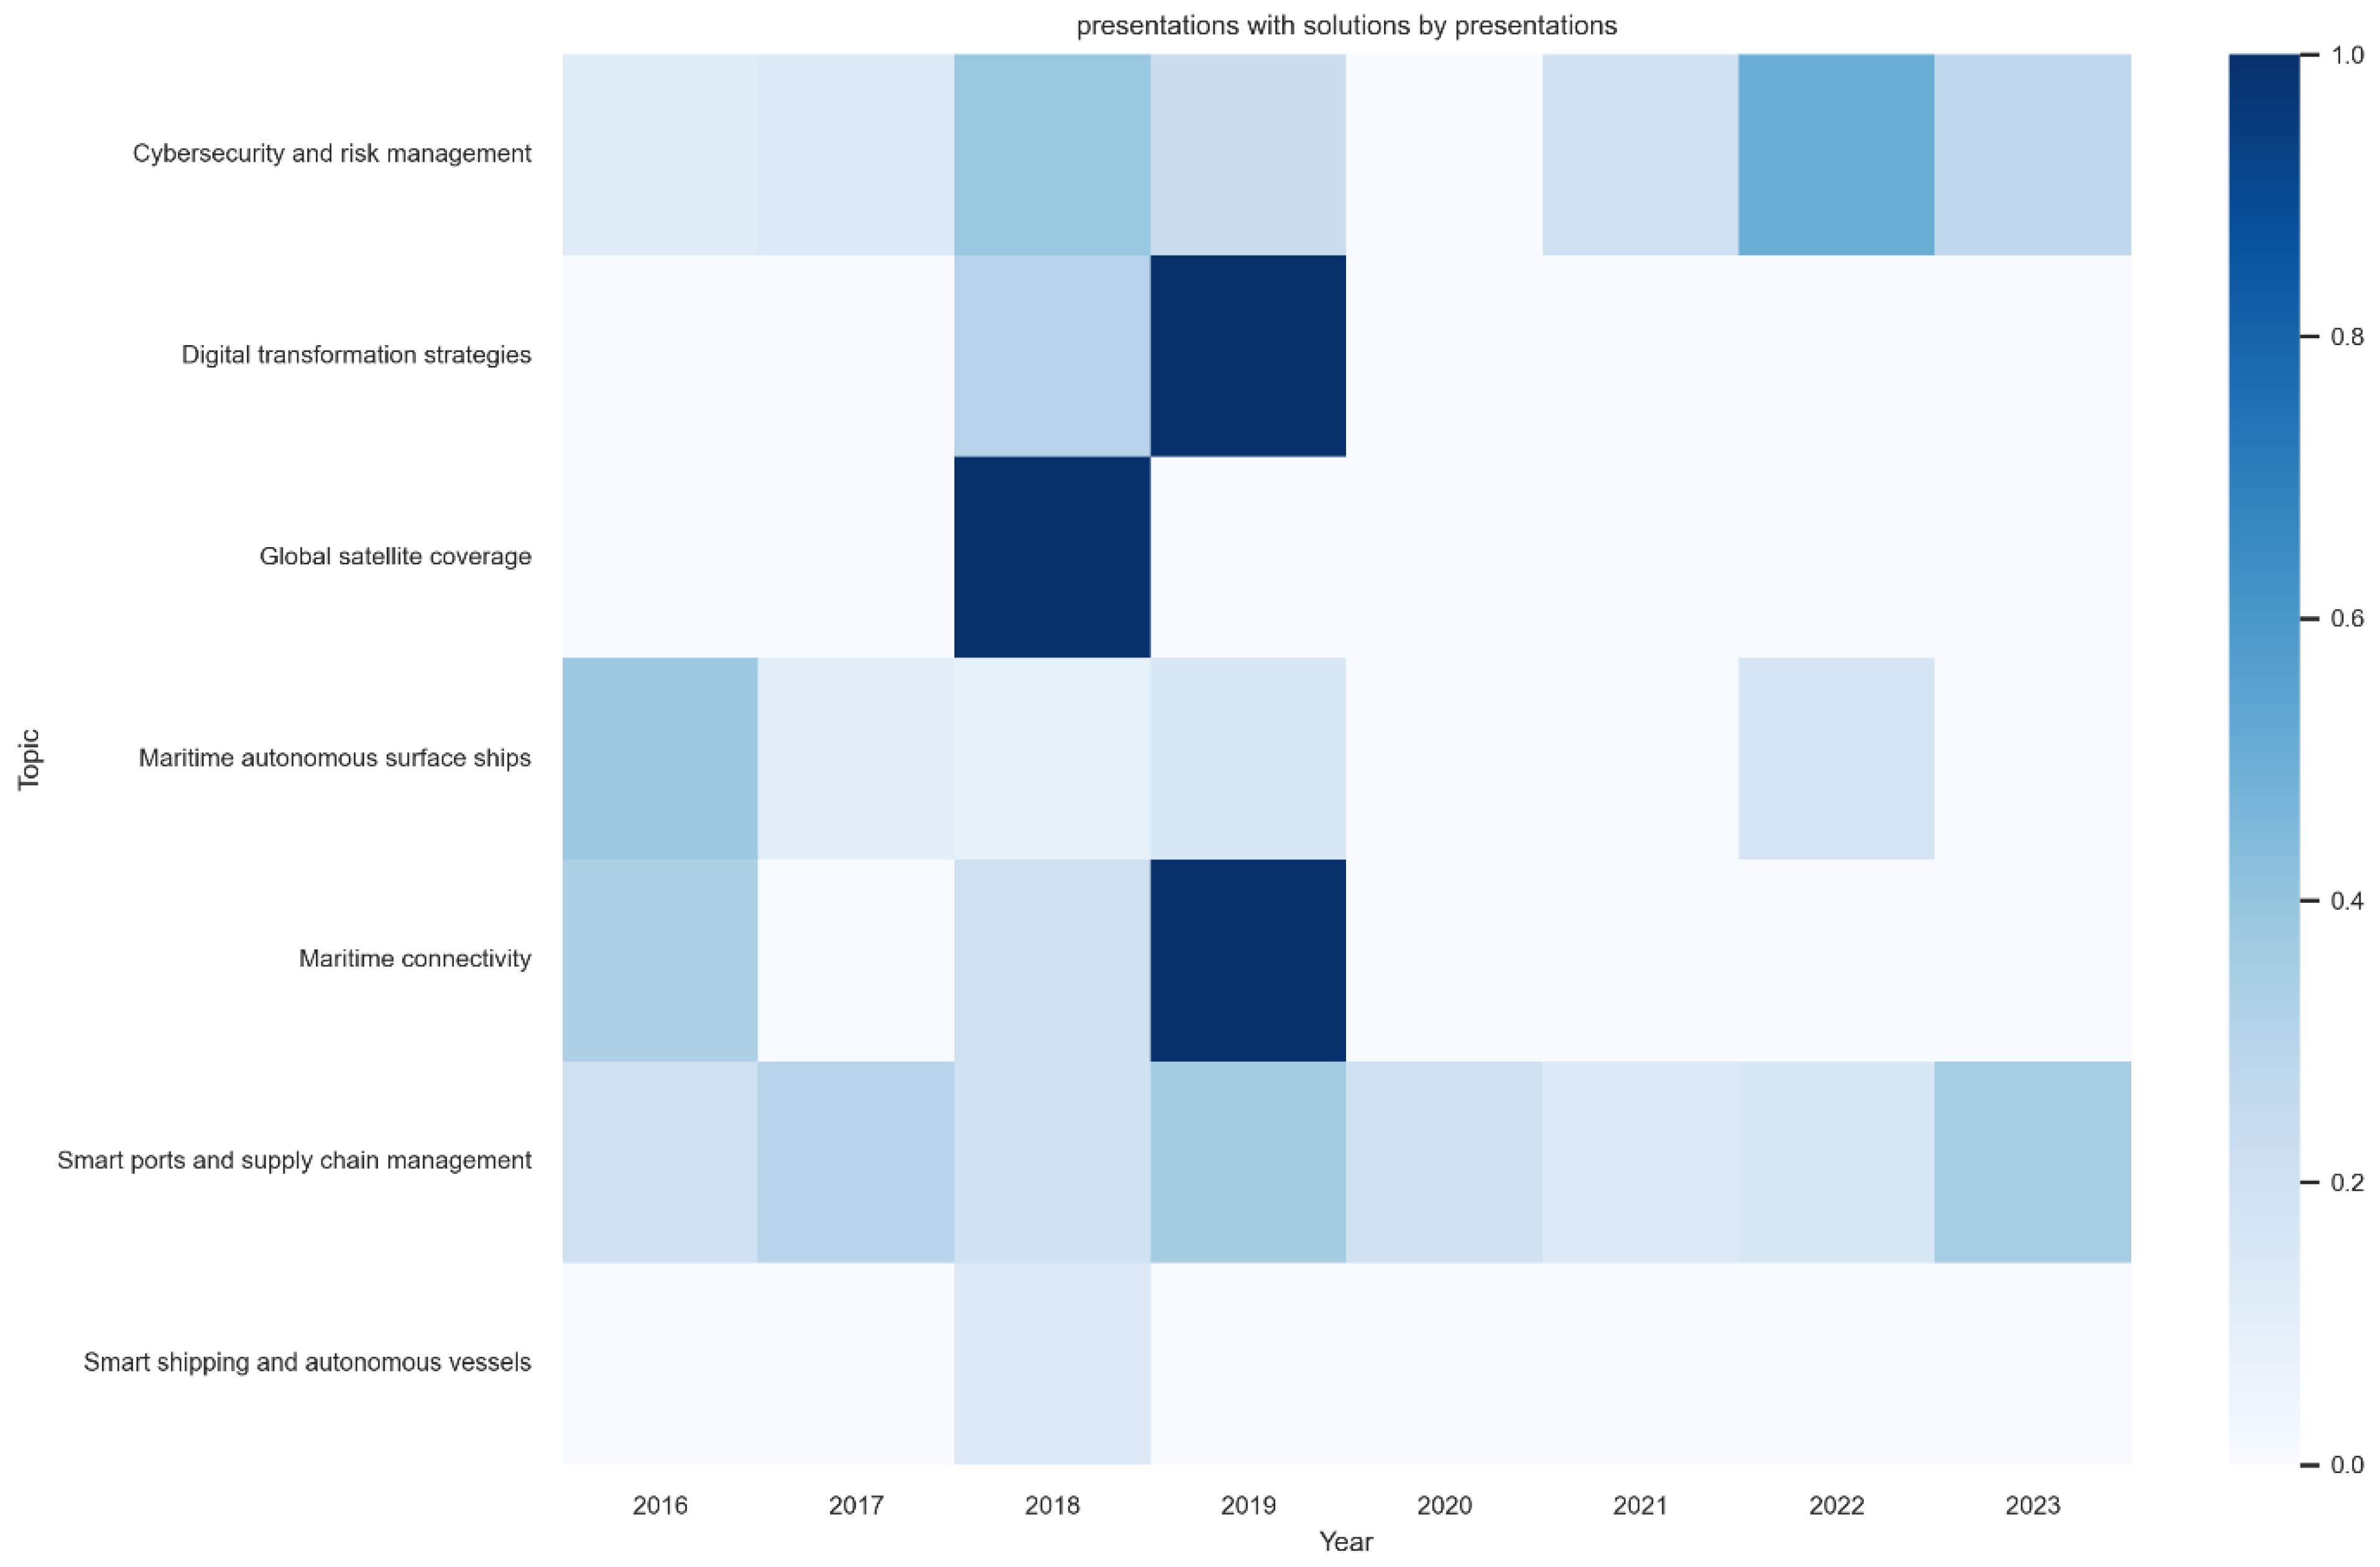
4.4. Presence of Solutions
The analysis of the presence of solutions within various topics provided valuable insights into the maturity of these trends within the industry. By comparing the number of presentations that discuss solutions to the total number of presentations for each topic and year, as outlined in
Table 10 and
Figure 11, we could gauge the development stage of each topic.
In the realm of “Cybersecurity and risk management”, the presence of solutions was noted to fluctuate over time, with a strong emphasis on solutions being observed in 2022. This indicates a growing maturity in the topic, as more concrete solutions to cybersecurity and risk management challenges are being addressed.
For “Remote connectivity for operations”, solutions have been consistently present, reaching a peak in 2016. This peak suggests that during this period, there was a significant focus on addressing the challenges associated with Remote connectivity for operations within the industry.
The topic of “Smart ports and supply chain management” has also seen the presence of solutions, although there was a noted decline in the discussion of solutions over time. This decline could reflect a shifting focus within the industry or the need for new innovations to address emerging challenges in smart ports and supply chain management.
Digital transformation and strategies, specifically in 2018, were predominantly focused on solutions. The fact that this topic appeared prominently only once suggests that 2018 was a pivotal year for discussing digital transformation strategies within the industry, possibly indicating a peak in interest or a critical moment of development for this trend.
Similarly, the discussion of solutions in “Supply chain management” was particularly noted in 2019, after which the topic disappeared from discussions. This could imply that the industry had a specific window of interest in exploring solutions for Supply chain management, which may have shifted due to various factors such as technological challenges or changing priorities.
Overall, the presence and discussion of solutions across these topics provide a lens through which the industry’s engagement with and the evolution of these trends can be understood, highlighting moments of significant focus and areas where further development may be needed.
4.5. Detection of Weak Signals
Average frequency is the average of normalized DODij. The increase ratio is the geometrical mean of the increase in DODij over time. These resulted in weak signals, strong signals and noise, as shown in
Figure 12.
The keywords with a high increase rate and low frequency, as in
Table 11, are the keywords in the area of the weak signals. The significant words have to be selected from these by hand. These were put in bold. The candidate weak signals were subsea, drone, diesel, and blockchain.
4.6. Supervised Learning
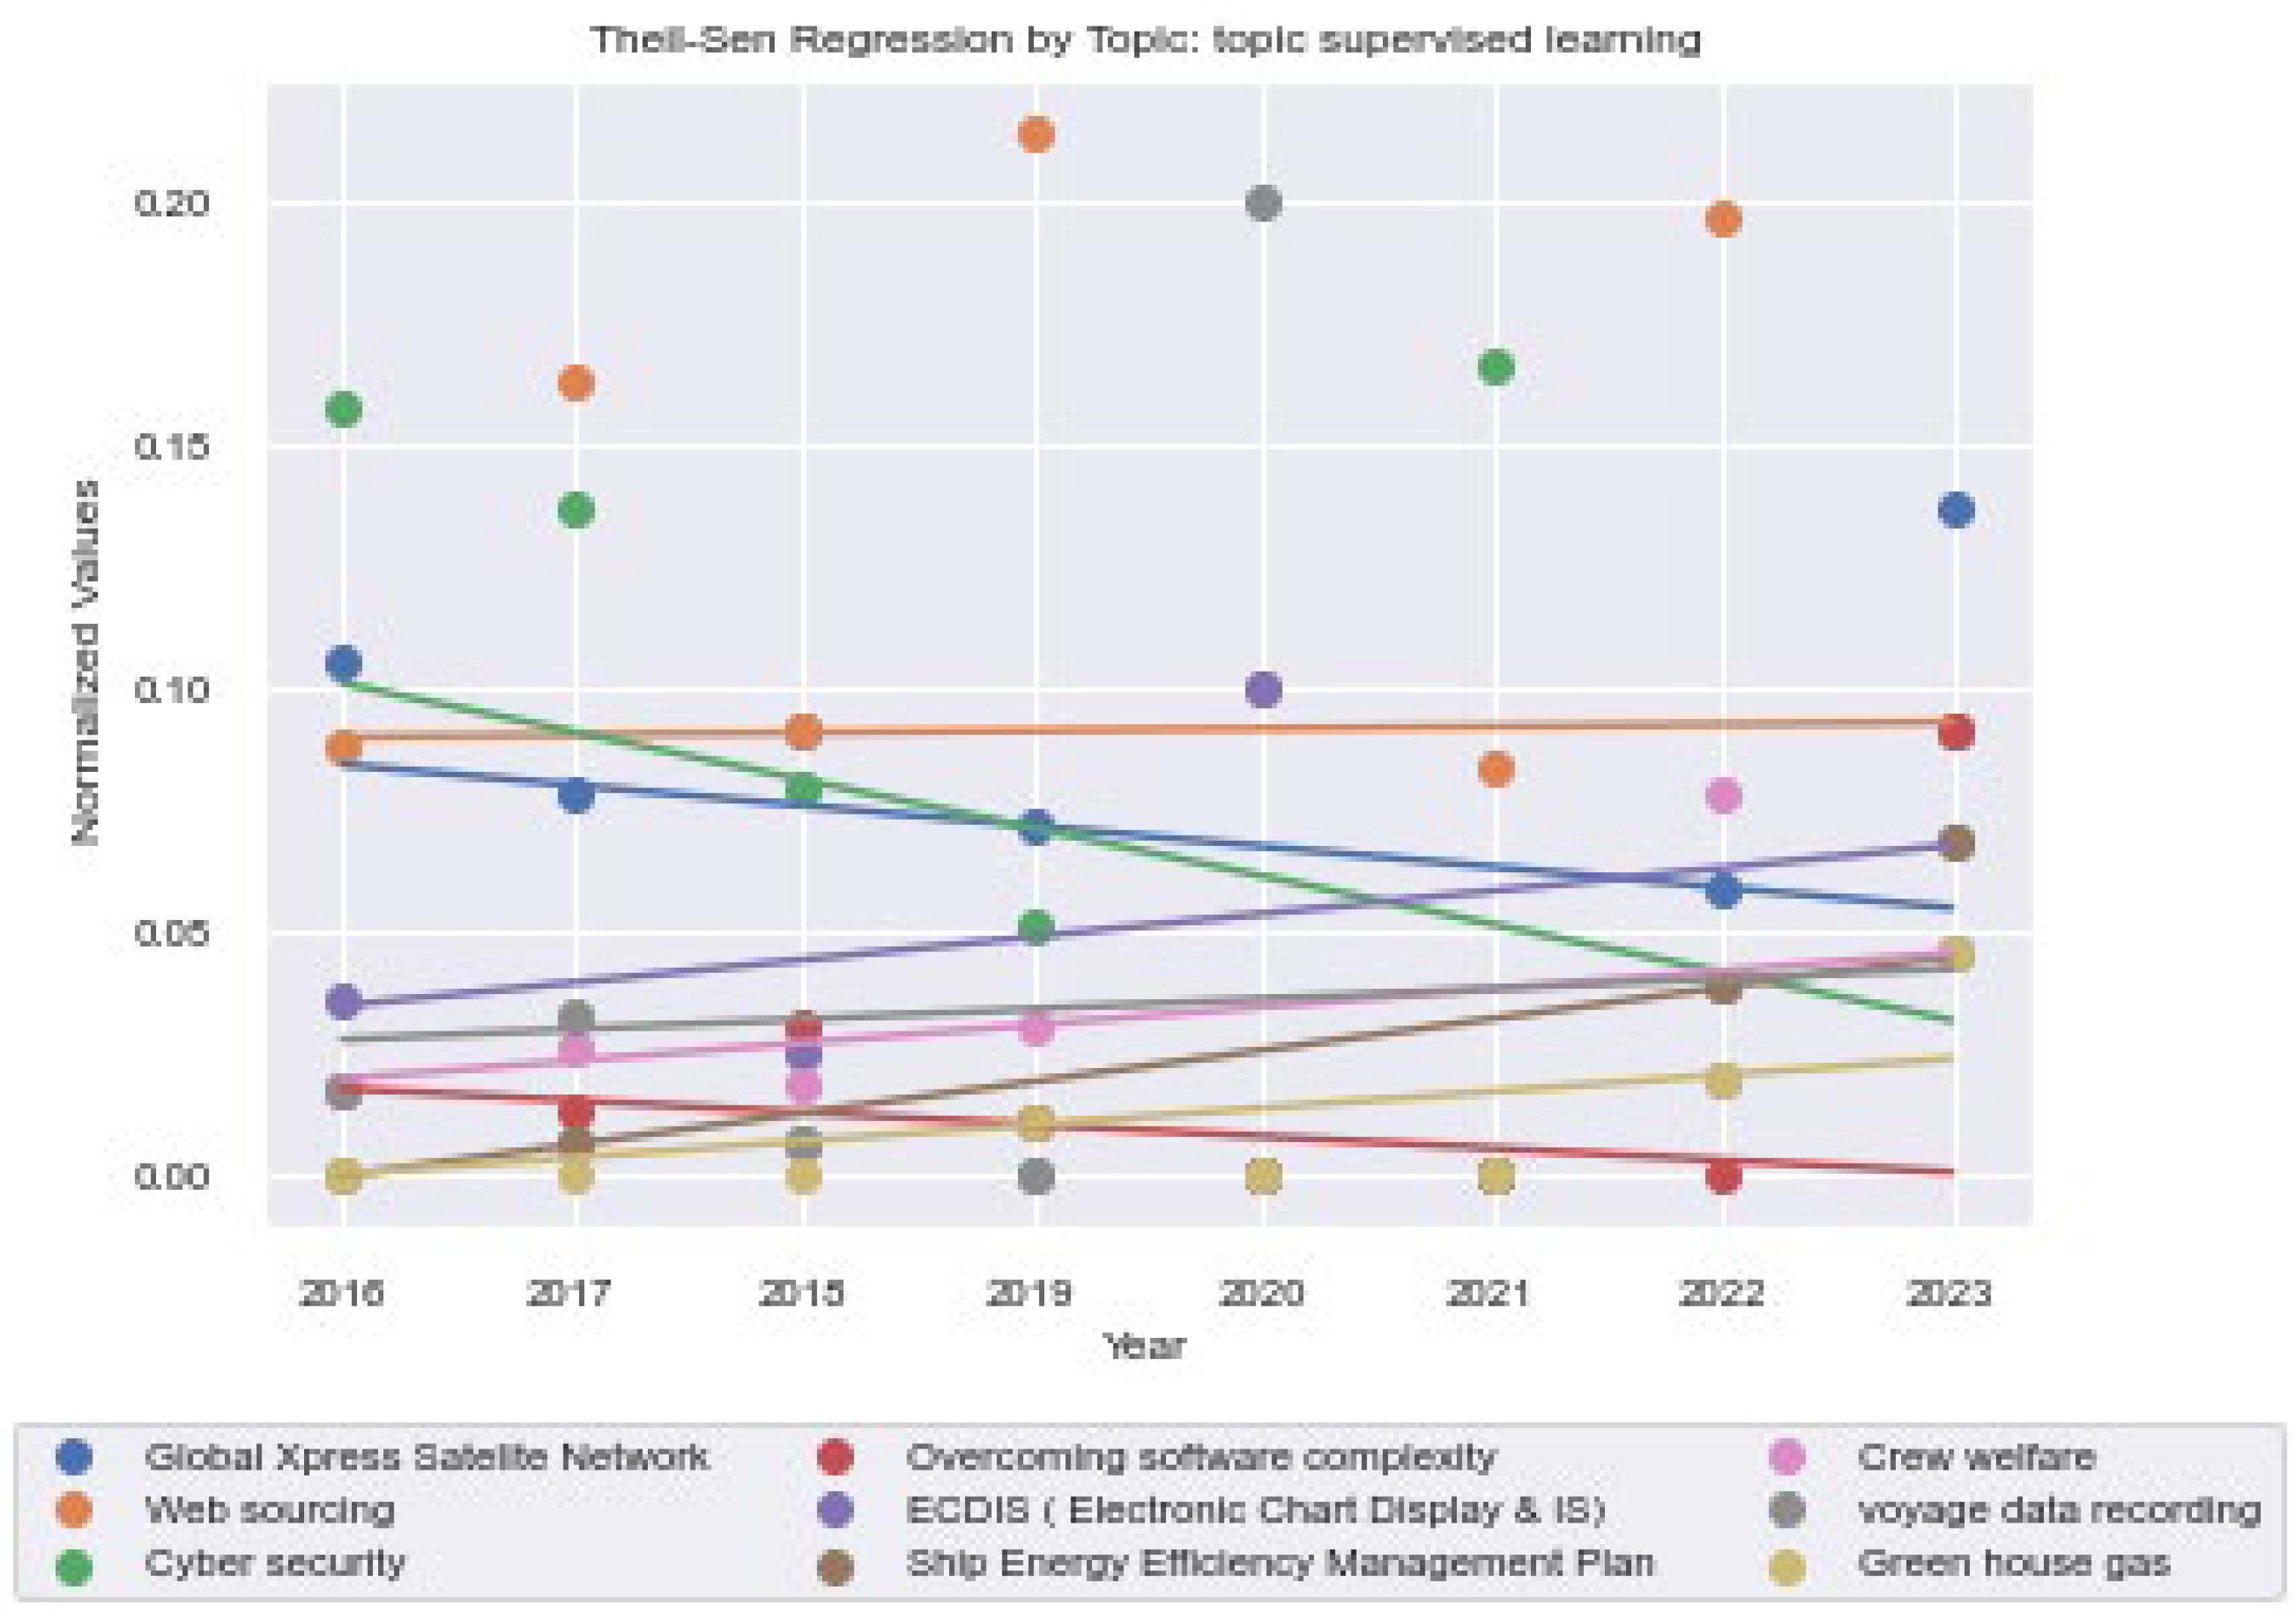
Figure 13 and
Figure 14 and
Table 12 provide data on the topics and their corresponding percentages for the years 2016 to 2023 based on our supervised learning approach. Initially, the Global Xpress Satellite Network topic exhibited a declining trend until 2018 but then saw a resurgence, with its mention doubling from 7% in 2019 to 14% in 2023. This fluctuation underscores the changing relevance and adoption of satellite network technologies in the industry.
Web sourcing emerged as a significant area of interest, peaking in 2019 with 21% of presentations focusing on this topic. Although there were some variations in subsequent years, the sustained attention indicates a consistent reliance on and interest in web-based solutions within the shipping sector.
Cybersecurity’s prominence in presentations fluctuated, reaching peaks in 2016 and 2021. This pattern highlights the industry’s ongoing and evolving focus on cybersecurity issues, reflecting the sector’s response to emerging digital threats.
The topic of overcoming software complexity received modest attention, peaking at 3% in 2018 before experiencing a notable decline. This trend suggests a shift in focus away from software complexity challenges in later years.
ECDIS (Electronic Chart Display and Information System) saw a slight uptick in discussions, indicating a growing acknowledgment of its importance in enhancing maritime navigation and safety.
The attention to the Ship Energy Efficiency Management Plan gradually increased, illustrating the industry’s escalating commitment to energy efficiency as a key component of sustainable shipping practices.
Discussions on crew welfare and voyage data recording experienced growth in their respective percentages, signaling an increased industry focus on enhancing crew well-being and the importance of data in optimizing maritime voyages.
Lastly, the topic of greenhouse gas emissions experienced a gradual rise in discussions, reflecting the maritime industry’s growing concern and proactive stance on environmental issues.
4.6.1. Trends and Weak Signals
Table 13 shows the slopes of the top topics, which indicates that the growing topics were a Ship Energy Efficiency Management Plan, ECDIS, Crew welfare, Greenhouse gas and voyage data recording. These are considered as trends. Further looking in the growing slopes of the non-top topics, the fastest growers were Virtual disaster recovery (0.0032) and ERP Projects (0.0020). These were weak candidate signals.
4.6.2. Grouping
Another interpretation is to group those topics and see what the evolution is of those groups. The grouping can be seen in
Table 14.
Key insights of the grouped topics:
- -
Technology and Connectivity:
The topics in this category have shown varying levels of importance over the years. “Global Xpress Satellite Network” has declined in importance since 2016, while “Web sourcing” has remained consistently important. “Broadband offshore communication” and “VSAT Capabilities” have shown a sudden increase in importance in 2020, while “Mini VSAT Broadband” and “KVH antennas” have remained relatively stable.
- -
Cybersecurity and Data Management:
The topics in this category have shown consistent importance over the years, with “Cybersecurity” and “Data leaks and contamination” being consistently important. “Electronic learning” and “Information recorded in Planned Maintenance System databases” have shown a decline in importance over the years.
- -
Environmental Sustainability:
The topics in this category have shown a steady increase in importance over the years, with “Greenhouse gas” and “Fuel efficiency” being consistently low. “Emissions reduction” and “Energy Efficiency Design Index (EEDI) to be calculated” have shown a sudden increase in importance in 2017 and 2018, respectively.
- -
Maritime Operations and Management:
The topics in this category have shown varying levels of importance over the years. “Overcoming software complexity” has declined in importance since 2018, while “ECDIS (Electronic Chart Display and Information System)” and “Ship Energy Efficiency Management Plan” have remained relatively stable. “Voyage data recording” and “Performance KPI Standardization” have shown a sudden increase in importance in 2020 and 2021, respectively.
- -
Learning and Development:
The topics in this category have shown a decline in importance over the years, with “E-learning” and “Computer-based learning onboard” being consistently low.
- -
Regulatory Compliance and Safety:
The topics in this category have shown varying levels of importance over the years. “Energy Efficiency Design Index (EEDI) to be calculated” and “Future of navigation” have remained relatively stable, while “IMO e-navigation regulation” has shown a sudden increase in importance in 2016 and 2017.
5. Conclusions
This paper aimed to identify key trends and detect emerging weak signals in the field of digitalization in shipping by analyzing a collection of industry-related presentations in PDF format. The collection of documents consisted of over 500 conference presentations, presentations performed by industry executives and operators. Our research approach integrated a variety of tools and technologies to accomplish these objectives. These tools included optical character recognition for converting the pdf content to machine-readable text. For topic definition and keyword generation, bidirectional encoder representations from transformers were used. By utilizing Spacy cosine similarity, Scikit-learn and Jaccard similarity guided topic modeling was performed, thereby enhancing the interpretability of the results. Theil–Sen regressions were used to perform the trend analysis, whilst the degree-of-diffusion (DoD) metrics were used for the weak signal detection.
The results of the paper indicate that in terms of trends, smart ports and supply chain management experienced a significant uptick in interest especially in 2020. This indicates a heightened focus on enhancing efficiency and digitalization within port operations and supply chains. The trend therefore highlights an industry that is moving towards more smart technology in the optimizing of supply chain management. Overall, there is consistent interest in the digitalization of maritime operations and cybersecurity. Again, this points towards a trend in the industry that acknowledges the critical importance of securing digital infrastructures as part of the broader digital transformation efforts. Strikingly, the interest in Supply chain management was present in the beginning years but waned over time. The later might be indicative of these technological developments being in the so-called slope of disillusionment often found on the technology life cycles, as presented by some consultancy companies. Further research is needed to establish the current state of the art in autonomous shipping.
Within topics, the keyword analysis over time reveals a shifting focus from general technology and infrastructure (service, port, system) towards more specific areas like cybersecurity (cyber, cybersecurity, risk management) and emerging technologies (satellite, blockchain). This shift indicates an evolving industry narrative from foundational technological adoption towards addressing specific challenges and opportunities presented by digitalization.
The consistent presence of the keyword “service” throughout the years points to a continuous focus on service delivery improvements, while the increasing prominence of “management” highlights an escalating concern with managing technology and cybersecurity risks.
The analysis of these presentations also addressed those presentations discussing solutions as it might provide insight into the maturity of the topics. As such, “Cybersecurity and risk management” showed a strong presence of solutions in 2022, indicating a proactive stance towards addressing cybersecurity challenges. In contrast, “Smart ports and supply chain management” showed a declining presence of solutions, possibly reflecting a shift towards exploring new challenges or the implementation phase of previously discussed solutions.
In terms of weak signals, the identification of “subsea”, “drone”, “diesel”, and “blockchain” as weak signals pointed to nascent areas of interest that may become more prominent in the future. These areas represent potential innovations and shifts in the industry, such as the exploration of undersea technologies, the use of drones for surveillance or logistics, the focus on diesel alternatives or efficiency for environmental concerns, and the application of blockchain for secure and transparent transactions.
Finally, an alternative approach leveraging supervised machine learning, trained on expert-derived insights from historical data, uncovered a cluster of trending topics within maritime operations. These prominent themes encompassed energy efficiency, Energy Consumption Data Information System (ECDIS) utilization, crew well-being, greenhouse gas emissions, and voyage data recording practices. Conversely, the analysis identified “Virtual disaster recovery” and “ERP Projects” as emerging weak signals, warranting further investigation due to their potential to significantly impact the maritime domain.
Future research should therefore pivot towards critical areas such as Environmental, Social, and Governance (ESG) and sustainability, where the industry’s digital transformation could have significant impacts. Additionally, exploring automation’s role in enhancing operational efficiency, alongside the pivotal aspects of security and safety in digitalization, will provide valuable insights into the industry’s progression towards a more sustainable and technologically advanced future.
In conclusion, the findings from this study not only shed light on the current state of digitalization in the shipping industry but also chart a course for future research endeavors. By focusing on areas like ESG, sustainability, automation, and security, the industry can continue to harness the power of digital technology to address emerging challenges and capitalize on new opportunities.
6. Limitations
The results of the UMAP algorithm are not always consistent between runs due to its stochastic nature. This is a known phenomenon [
37] and therefore requires visual validation before usage of the results.


