Abstract
Understanding the conversion characteristics of pore water is crucial for investigating the mechanism of hydrate accumulation; however, research in this area remains limited. This study conducted methane hydrate formation experiments in unconsolidated sands using an in-house low-field nuclear magnetic resonance (NMR) system. It focused on pore water conversion characteristics and influencing factors such as initial water saturation and sand particle sizes. Results show that methane hydrate formation enhances the homogeneity of the effective pore structure within sand samples. The conversion rate of pore water is significantly influenced by differences in heat and mass transfer capacity, decreasing as initial water saturation and sand size increase. Pore water cannot be fully converted into hydrates in unconsolidated sands. The final conversion ratio of pore water in water-poor sand samples nears 97%, while in water-rich sand samples, it is only 65.80%. Sand particle size variation has a negligible impact on the final conversion ratio of pore water, with ratios exceeding 94% across different particle sizes, differing by less than 3%.
1. Introduction
It is estimated that the global demand for natural gas will increase by more than 15% in the next decade, which is due to the population explosion and rapid economic growth [1]. To meet the huge demand gap for natural gas and promote energy structure optimization, natural gas hydrates (NGHs) have become a good medicine to solve this problem [2,3]. Composed of natural gas and water, NGHs have an ice-like appearance but are flammable [4,5]. NGHs possess various benefits, which include extensive distribution, high energy density, high inventory, and clean combustion [6,7], so they are viewed as a fresh energy option that can reshape the current energy framework [8,9]. At present, more than one-third of the countries around the world have participated in hydrate research, and a number of them have also formulated industrial development schedules for NGHs [10]. To realize the industrial development of NGHs, it is crucial to accurately assess the hydrate reservoir resources and obtain reliable data on resource accumulation.
Hydrate saturation is an essential indicator for evaluating hydrate resources through hydrate volume percentage in hydrate-bearing sediments (HBS). Different levels of hydrate saturation cause significant differences in the response of physical parameters such as acoustic velocity [11,12], resistivity [13,14], mechanical properties [15,16,17], and permeability [18,19] of HBS. Therefore, accurately obtaining hydrate saturation is essential for the accuracy of hydrate resource evaluation and the rationality of exploitation program formulation. The excess-gas method is the most widely used method for forming NGHs in the laboratory [20], which determines hydrate saturation by strictly controlling the pore water content in sediments. However, lots of studies have shown that the conversion ratio of pore water, defined as the ratio of the pore water converted into hydrates to the total pore water content, is consistently below 100%. That is, the pore water in sediments cannot be completely converted into hydrates [21]. The hydrate saturation calculated by assuming that the pore water is wholly converted into hydrates may be overestimated. This will lead to an inaccurate description of the quantitative relationship between hydrate saturation and physical parameters. Therefore, understanding the conversion characteristics of pore water during the hydrate formation in sediments and clarifying the control mechanism of pore water conversion are crucial for accurate hydrate saturation estimation. It is essential for comprehending the NGH accumulation mechanism and evaluating NGH resources.
Low-field nuclear magnetic resonance (NMR) technology includes time-domain NMR analysis (TD-NMR) technology and nuclear magnetic resonance imaging (MRI) technology. As a non-invasive technology, it can quantitatively analyze the evolution characteristics of pore structure, material content, and material spatial distribution during the hydrate formation in sediments. TD-NMR technology has been widely applied in hydrate research [22,23]. Ge et al. [24] observed changes in transverse relaxation time (T2) distribution during the methane hydrate formation in four sandstones with different pore size distributions. The findings revealed that methane hydrate preferentially formed in large pores, while the formation of hydrates in small pores was challenging. Zhan et al. [25] applied TD-NMR technology to explore the methane hydrate formation kinetics in unconsolidated sands. They discovered that methane hydrate first formed in large pores and then gradually transitioned to smaller pores. The hydrate film formed in large pores hindered the contact of water and methane gas in small pores, weakening the consolidation efficiency of methane hydrate. In addition, Zhang et al. [26] divided the methane hydrate formation process in partially saturated unconsolidated sands into two stages: the rapid and slow decrease in water content. In the rapid decrease stage, the methane hydrate formation mainly occurred in large pores, and the variation of water content in small pores was not noticeable. The above TD-NMR studies have verified that large pores are more conducive to hydrate formation under the premise of ignoring the NMR signal intensity of methane gas in T2 distribution. However, Ji et al. [27] thought that ignoring the NMR signal intensity of methane gas in T2 distribution would cause a significant error in determining material content in the later stage of the experiment. Therefore, to precisely analyze the characteristics of hydrate formation in sediments at the pore scale, the NMR signal intensity of methane gas in T2 distribution must be eliminated.
MRI technology is generally used to monitor the evolution law of the spatial distribution of water, gas, and hydrate during the hydrate formation in sediments [28,29]. MRI and X-CT are the main visualization techniques for in situ non-destructive detection of material distribution in sediments. It cannot be realized by optical microscopy technique which can only observe material distribution on the surface of sediments. Although the resolution of X-CT is much higher than that of MRI, X-CT is difficult to accurately distinguish between pure water and methane hydrate due to the little density difference. MRI has a stronger advantage in accurately obtaining water distribution in methane hydrate-bearing sediments. Zhao et al. [30] directly witnessed the formation of methane hydrate in glass beads using MRI technology. The results indicated that the growth rate of the methane hydrate and the final hydrate saturation are influenced by the size of the glass beads. In addition, some scholars also pointed out that the formation of hydrates exhibits significant non-uniformity at different spatial positions in porous media. The initial water saturation and pressure both play a significant role in determining the distribution of hydrates [31,32,33]. Ren et al. [34] experimented with methane hydrate formation in clayey–silty sediments based on MRI technology. The continuous increase in methane hydrate caused the continuous decrease in water signal intensity, but the decrease was different at different positions. Therefore, hydrates also exhibited heterogeneous spatial distribution in clayey–silty sediments [35,36]. In summary, current researchers using MRI technology mainly focus on the hydrate distribution characteristics and the evolution laws of hydrate saturation during the hydrate formation. However, there is relatively little research on the spatiotemporal evolution characteristics of pore water during the hydrate formation in porous media.
This study uses low-field NMR technology to analyze the evolution of pore water during hydrate formation in unconsolidated sands. By tracking the transitions from pore water to hydrate, the spatial distribution of pore water is elucidated, providing insights into transformation mechanisms across different sand samples. This study sheds light on how initial water saturation and sand size impact the conversion rate of pore water and the final conversion ratio of pore water, which are crucial for accurately determining hydrate saturation and assessing hydrate resources.
2. Experiment
2.1. Experimental Equipment
The hydrate formation experiments were carried out by using the low-field NMR test system (Figure 1). The system mainly consists of a low-field NMR analyzer, a low-temperature and high-pressure probe module, a gas injection module, a temperature and pressure control module, and a data acquisition module. The low-field NMR analyzer (MesoMR23-060H, Suzhou Niumag Analytical Instrument Corp., Suzhou, China) can perform the TD-NMR analysis and the MRI measurement on test samples. The type of magnet is a permanent magnet. The magnetic field strength is 0.52 ± 0.05 T. The working temperature of the magnet is 32 ± 0.1 °C. The imaging gradients in X, Y, and Z directions can be independently amplified, with a gradient peak of 5 Gauss/cm [37].
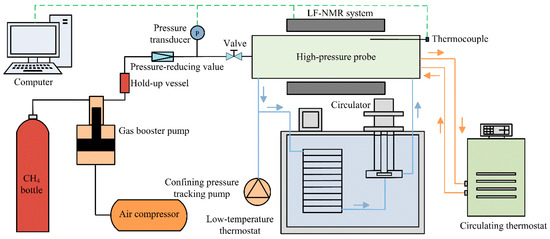
Figure 1.
Schematic diagram of the experimental equipment.
Figure 2 shows the low-temperature and high-pressure probe module. It includes the high-pressure reactor and the probe coil. The high-pressure reactor created from PEEK comprises a confining-liquid circulation chamber, an isolating-liquid circulation chamber, and a sample chamber. The PEEK does not contain hydrogen protons (1H) and ferromagnetic materials. The high-pressure reactor has a maximum operating pressure of 15 MPa. The sample chamber size is Φ30 mm × H60 mm. Its filling volume is 42.41 ± 0.12 cm3.
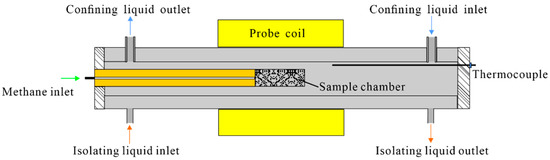
Figure 2.
Schematic diagram of low-temperature and high-pressure probe module.
The methane gas is supplied to the sample chamber by the gas injection module. It includes a methane gas bottle, a gas booster pump, an air compressor, a hold-up vessel, and a pressure-reducing valve. The gas injection module is used to provide constant pore pressure during methane hydrate formation in the sample chamber.
The temperature and pressure control module includes a low-temperature thermostat, a circulator, a confining pressure tracking pump, and a circulating thermostat. The fluorination liquid (FC-40, 3M Company, St. Paul, MN, USA) is used to control the temperature and pressure of confining-liquid circulation chamber. The low-temperature thermostat reduces the fluorination liquid temperature to the experimental temperature. The low-temperature fluorination liquid flows in from the right end of the high-pressure reactor by the circulator. The confining pressure tracking pump controls the constant pressure difference between the confining pressure and the pore pressure. The pressure difference is set to 0.4 MPa to prevent the sample chamber from breaking. In addition, fluorinated liquid is also used as an isolation liquid. It flows in from the left end of the high-pressure reactor by the circulating thermostat. It can eliminate the interference of low-temperature confining liquid on the temperature of permanent magnet. The isolation liquid temperature is set to 30 °C.
The data acquisition is used to monitor the pore pressure in the sample chamber and the temperature of the circulating cooling liquid close to the sample chamber in real time. It includes a computer, a pressure transducer, and a thermocouple. The accuracy of the pressure transducer (Senex, Guangzhou, China) is 0.25%. The accuracy of thermocouple (PT100) is ±0.1 °C. In addition, the nuclear magnetic signal data are recorded during the methane hydrate formation.
2.2. Experimental Materials
Methane gas (99.99%, Dehai Weiye Technology Co., Ltd., Qingdao, China) and deionized water are utilized to form the methane hydrate. The sand (Perfemiker Chemical Technology Co., Ltd., Shanghai, China) with three particle sizes of 58–75 μm, 100–200 μm, and 420–590 μm is selected. Table 1 displays the key parameters of sand samples in each experimental group.

Table 1.
The key parameters of sand samples.
2.3. Experimental Procedures
This study used the excess-gas method to complete the experiment. The pore pressure was always maintained at 6.0 MPa and the temperature of sample chamber was always kept at 275.65 K during the methane hydrate formation. The following are the experimental procedures:
- (1)
- The sand weight was calculated based on the filling volume of the sample chamber, the sand density, and the sand sample porosity. The deionized water weight was calculated according to the water saturation. Sand and water were mixed thoroughly, sealed, and placed in a cool place for 24 h.
- (2)
- The sand sample was loaded into the low-temperature and high-pressure probe module (Figure 2). The measurement parameters of T2 distribution were determined.
- (3)
- The sand sample was removed from the low-temperature and high-pressure probe module and sealed for storage. The standard samples with different water contents (Suzhou Niumag Analytical Instrument Corp., Suzhou, China) were cooled to 275.65 K in the thermostat. Next, these standard samples were loaded into the low-temperature and high-pressure probe module one by one. The measurement parameters in the procedure (2) were used to obtain T2 distributions corresponding to standard samples with different water contents at the experimental temperature. Based on these data, the calibration curve was obtained. Based on the calibration curve and the NMR signal intensity of T2 distribution, the water content in the sand sample could be determined.
- (4)
- The sand sample was reloaded into the low-temperature and high-pressure probe module. After connecting all experimental components, the confining pressure was adjusted to exceed the pore pressure by 0.4 MPa. The temperature of the sample chamber was controlled at 275.65 K. After the temperature was stabilized, the measurement parameters in the procedure (2) were used to measure T2 distribution of the sand sample at the experimental temperature. Next, the initial water content (mw0 in Table 1) in the sand sample was determined by the calibration curve obtained in the procedure (3). Based on the above data, the initial water saturation Sw0, porosity φNMR, and other parameters of each experimental group were obtained (shown in Table 1). In addition, the initial pore water distribution characteristics of the sand sample at this temperature were obtained using the MRI.
- (5)
- On the premise of safety, the pore pressure was raised to 6.0 MPa in approximately 45 s using the gas injection module. During the methane hydrate formation, the pore pressure remained constant. After the methane gas injection, the initial T2 distribution was immediately measured. Afterward, T2 distribution measurement and MRI were conducted alternately. The test interval was adjusted according to the experimental progress. The methane hydrate formation was completed when the T2 distribution remained unchanged.
- (6)
- After the experiment, the sand sample was removed from the sample chamber and completely dried (120 °C, 12 h). The initial water content in the sand sample was once again determined by the weight method (mwa in Table 1).
3. Methodology
3.1. T2 Distribution Measurement
In low-field NMR measurements, the decay amplitude of the spin-echo train is accurately fitted using the sum of exponential decay curves. The inverse Laplace transform algorithm (BRD) is utilized to derive the T2 spectrum by fitting the relaxation echo signal [38]. Car–Purcell–Meiboom–Gill (CPMG) pulse sequence can eliminate the interference of magnetic field inhomogeneity on signal attenuation. Therefore, it is widely used in T2 distribution measurement. In this study, the echo spacing (TE) is 0.17 ms. The CPMG pulse sequence can only detect the first echo signal after one TE time after applying a 90° radio frequency pulse. The 1H in the solid (for instance, methane hydrate) completely relaxes before the first echo detection, and the signal cannot be detected [39]. Therefore, the hydrate formation will cause the NMR signal intensity of 1H in the sand sample to decrease.
Under the effect of sediment particle interface, the T2 of pore fluid in the sand sample will include three independent relaxation mechanisms [40]. The T2 can be shown by Equation (1):
where T2B, T2S, and T2D represent the bulk, surface, and diffusion transverse relaxation time, respectively. Previous studies have proved that the T2B of water is over 3000 ms [41], and 1/T2B can be effectively neglected. The pore fluid in a uniform magnetic field has no obvious diffusion relaxation characteristics [42,43], and 1/T2D is also neglected. Therefore, under the influence of pore structure characteristics, the T2 of pore fluid in the sand sample can be represented by Equation (2):
where ρ2 is the transverse surface relaxation. S/V is the ratio of pore surface to volume, which can also be shown by Equation (3):
where Fs and r represent the pore shape factor and pore radius, respectively. For spherical pores, Fs = 3. Following Equations (2) and (3), the expression of T2 is provided by Equation (4).
Based on Equation (4), the T2 is directly proportional to the r under the premise of constant transverse surface relaxation ρ2 and pore shape factor Fs [42]. The larger the T2, the larger the corresponding pores. Therefore, the T2 distribution can effectively evaluate the distribution law of pore water in various pore structures. In addition, the total signal intensity of T2 distribution reflects the total pore water content of the sand sample [44].
3.2. MRI Measurement
In this study, the Multi-slice Spin Echo (MSE) pulse sequence was utilized to acquire MRI images [45]. It can simultaneously perform the imaging of multiple planes. The signal intensity is directly proportional to the amount of 1H in different locations of MRI images. However, the 1H in methane gas and solid hydrate crystals have a short relaxation time, and the MRI signal is almost undetectable. MRI technology can accurately distinguish liquid water from other substances [46]. Therefore, the reduced signal intensity in the MRI image can directly characterize the consumed pore water content during the methane hydrate formation. Key parameters of the MSE pulse sequence in this study include a TR set to 1000 ms, TE of 5.885 ms, 10 accumulations, and imaging along the sagittal plane (YZ plane) of the sample chamber containing sediment (as shown in Figure 3). The maximum MRI slice thickness is 25.0 mm in the low-field NMR analyzer, smaller than the sand sample diameter (d = 30.0 mm). Consequently, a single slice cannot cover the entire sand sample. This study sets the slice count along the X direction to 3, with a slice thickness of 9.5 mm and a slice gap of 0.5 mm.
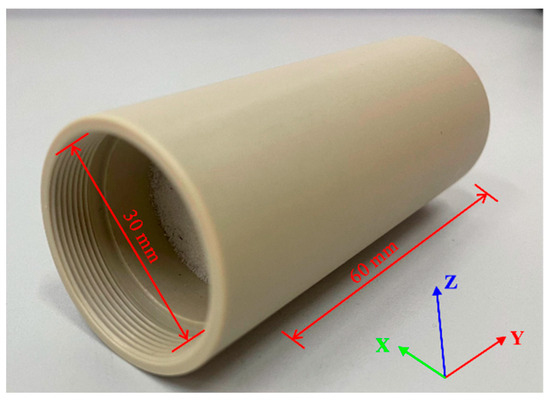
Figure 3.
Photograph of sample chamber containing sediment and schematic diagram of MRI direction.
3.3. Data Processing Methods
Data processing methods are introduced by taking Experiment 2 as an example. As outlined above, the pore water content can be determined by the total signal intensity in the T2 distribution of the sand sample [22]. Based on the calibration curve, the water content is directly proportional to the total signal intensity of T2 distribution (Figure 4). In Experiment 2, the water content calibration equation is provided by Equation (5):
where mw represents the water weight in the sand sample, Iw is the total signal intensity of T2 distribution, and k is the undetermined coefficient. In Experiment 2, k is 2.7587 × 10⁻⁴, and the correlation coefficient (R2) is 0.9996.
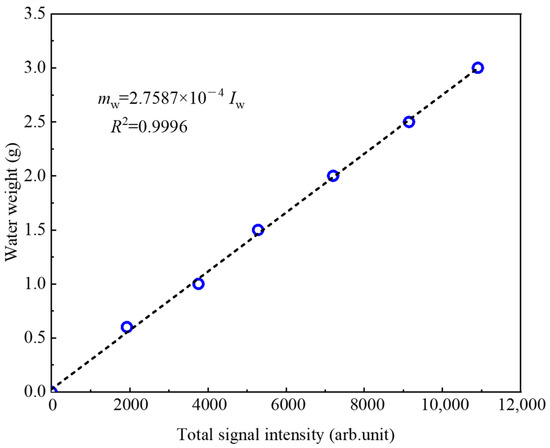
Figure 4.
Relationship between water content and total signal intensity of T2 distribution.
Before methane gas is injected into the sand sample, the water weight in the sand sample of Experiment 2 is calculated to be 9.53 g by Equation (5). In addition, the actual water weight obtained by the weight method is 9.54 g (shown in Table 1). Therefore, the error in calculating the water weight based on the T2 distribution is minimal. The pore volume Vp of the sand sample can be obtained by Equation (6):
where Vs represents the apparent volume of the sand sample. m0 is the initial sand sample weight obtained by the weight method. mw0 is the initial water weight calculated based on T2 distribution. ρs is the sand density, 2.65 g/cm3. Vs is provided by Equation (7):
where D represents the inner diameter of the sample chamber, 30 mm. The L represents the length of the sand-filled sample, 60 mm.
Combining with Equations (6) and (7), the porosity φNMR of the sand sample is obtained as shown in Equation (8).
Furthermore, the initial water saturation Sw0 can be calculated by Equation (9):
where ρw is the deionized water density, 1.0 g/cm3.
As shown in Figure 5a, there are slight differences in the T2 distribution range, peak area, and peak value between before and after gas injection in Experiment 2. The total signal intensity of T2 distribution increases by 7.89% after filling 6.0 MPa methane gas injection (Figure 5b). If the NMR signal intensity of 1H in methane gas is directly ignored, it will cause a significant error.
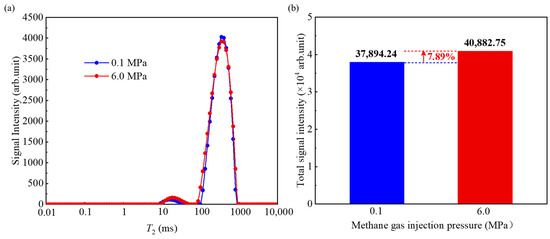
Figure 5.
Comparison of T2 distribution and total nuclear magnetic signal before and after methane gas injection. (a) is the T2 distribution before and after methane gas injection; (b) is a comparison of the total nuclear magnetic signal. (Exp 2 in Table 1).
Following the gas state equation, the total moles in methane gas are directly proportional to the methane gas volume under constant temperature and pressure conditions. So, the total signal intensity of methane gas is also directly proportional to the methane gas volume, which can be expressed by Equation (10):
where Vg and Ig represent the methane gas volume and the total signal intensity of methane gas, respectively. a denotes the undetermined coefficient. Following Equation (5) and Equation (6), the pore volume Vp is 19.08 cm3 in Experiment 2. The initial pore water volume Vw0 = mw0/ρw = 9.53 cm3. Therefore, the initial methane gas volume Vg0 = Vp − Vw0 = 9.55 cm3. The total signal intensity in Experiment 2 increases from 37,894.24 to 40,882.75 after the methane gas injection, which can be displayed in Figure 5b. By substituting Vw0 and Ig0 into Equation (10), the undetermined coefficient a is 3.2 × 10⁻³ in Experiment 2.
The signal intensity proportion of methane gas (Φg) during the methane hydrate formation is expressed by Equation (11):
where Ii is the total signal intensity of T2 distribution.
Combining with Equations (5) and (10), the pore water weight (mw) during the methane hydrate formation is provided by Equation (12).
According to the molecular formula of methane hydrate (CH4·6H2O [3]), the weight of methane hydrate formed can be obtained by reducing the amount of water, as shown in Equation (13):
where mh is the hydrate weight. and are the relative molecular mass of H2O and CH4, respectively.
Moreover, the methane gas volume during the methane hydrate formation is calculated by Equation (14):
where ρh is the methane hydrate density, 0.914 g/cm3 [47].
To sum up, the conversion ratio of pore water (Cw) during the methane hydrate formation can be obtained by Equation (15).
Table 2 displays the comparison of results in each group of experiments.
Table 2.
Comparison of experimental results.
4. Result and Discussion
4.1. Variation Characteristics of T2 Distribution
According to the above analysis, the NMR signal intensity of methane gas significantly influences the total signal intensity of T2 distribution under the pore pressure of 6.0 MPa. The signal intensity proportion of methane gas (Φg in Equation (11)) will gradually increase with the methane hydrate formation in each group of experiments, as shown in Figure 6. The final signal intensity proportion of methane gas exceeds 30% in Experiments 1, 2, 3, 5, and 6, as shown in Table 2. In Experiment 1, the final signal intensity proportion of methane gas even exceeds 80%. The high signal intensity proportion of methane gas makes the T2 distribution unable to accurately characterize the evolution law of the pore structure during hydrate formation. The signal intensity proportion of methane gas is only 3.06% before hydrate formation in Experiment 4, in which the initial water saturation is 79.24%. The signal intensity proportion of methane gas only increases by 0.13% after the hydrate formation. Therefore, the signal intensity proportion of methane gas can be ignored during methane hydrate formation in Experiment 4.
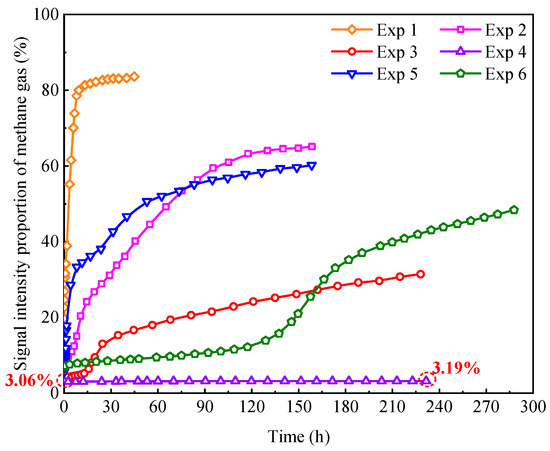
Figure 6.
Variation of the signal intensity proportion of methane gas during methane hydrate formation.
Figure 7 presents the variation of T2 distributions during methane hydrate formation in Experiment 4. Based on the principle that the T2 of pore water is directly proportional to the pore radius r (shown in Equation (4)), the pores with T2 ≤ 75 ms are defined as small pores, and those with T2 > 75 ms are defined as large pores in this study. Results show that the large pore peak of T2 distribution shifts to the left along the horizontal axis with the hydrate formation, and the signal intensity at the peak point decreases continuously (A-B-C-D, shown in Figure 7a). This phenomenon indicates that the pore water in large pores gradually converts into hydrates. The decrease in pore water content results in a decrease in the signal intensity at the peak point. The hydrates formed in large pores occupy a part of the pore space to reduce the pore size. The reduction of pore size causes the large pore peak to shift to the left.
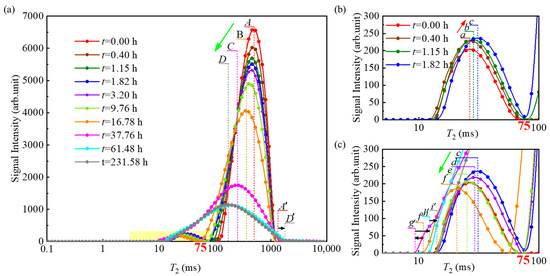
Figure 7.
Variation of T2 distribution during methane hydrate formation. (b,c) are enlarged figures of yellow-shaded areas in (a). The legend of (c) is the same as that of (a). (Exp 4 in Table 1.).
Meanwhile, the small pore peak of T2 distribution exhibits more complex variation characteristics. During the period of 0~1.82 h, the formed hydrate occupies a portion of the large pore space. The large pores are divided into some small pores in a larger size. As a result, the number of small pores in a larger size increases. It causes the small pore peak of the T2 distribution to shift to the right. Moreover, the signal intensity at the peak point of small pores also increases slightly (a-b-c, shown in Figure 7b). During the period of 1.82~16.78 h, as with the hydrate formation in large pores, the hydrate formation in small pores causes the leftward shift of the small pore peak and the decrease in the signal intensity at the peak point (c-d-e-f, shown in Figure 7c). The small pore peak at t = 16.78 h (the orange line in Figure 7c) is located at the bottom left of the small pore peak at t = 0 h (the red line in Figure 7c). This illustrates that the initial water in the small pore is also converted into hydrate.
During the period of 16.78~37.76 h, the methane hydrate formation continues to decrease the size of small pores. It causes the minimum value of T2 to decrease from 10.7 ms to 9.3 ms (f′-g′, shown in Figure 7c). The boundary between the large and small pore peaks disappears in T2 distribution at t = 37.76 h (shown in Figure 7a). In addition, the hydrate formed on the surface of sand particles decreases the transverse surface relaxation of the solid in contact with pore water [48]. According to Equation (3), it causes an increase in the minimum value of T2 (g′-h′-i′, shown in Figure 7c). This conclusion also explains the phenomenon that the maximum value of T2 exceeds its initial value after the hydrate formation (A′-D′, shown in Figure 7a).
After hydrate formation, the T2 distribution of the hydrate-bearing sand sample exhibits a unimodal distribution (the gray line shown in Figure 7a). Following the assumption of the normal distribution model, the T2 distribution of the homogeneous porous media exhibits a unimodal distribution, and the T2 distribution of the heterogeneous porous media exhibits a bimodal or trimodal distribution [22]. Based on the bimodal T2 distribution of the hydrate-free sand sample (the red line shown in Figure 7a), it can be concluded that the hydrate formation in both large and small pores enhances the homogeneity of the effective pore structure of sand samples.
4.2. Variation Characteristics of Pore Water Spatial Distribution
Figure 8a displays the MRI images of the sand sample during methane hydrate formation in Experiment 4. Each image is produced by overlaying the MRI images of three slices in the YZ direction. The MRI process takes 30 min, and the consumption of pore water is fast in the early stage of the experiment. Therefore, an MRI image cannot be obtained at 0 h after gas injection.
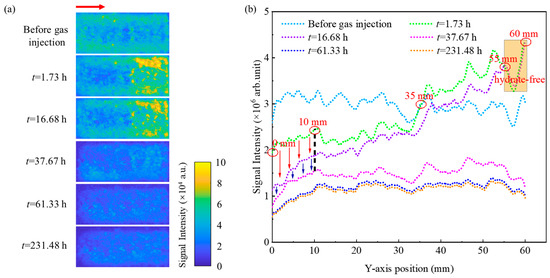
Figure 8.
Variation of (a) MRI images in the YZ direction and (b) MRI signal intensity along the Y-axis direction during methane hydrate formation. The red arrow indicates the direction of methane gas injection. (Exp 4 in Table 1).
Based on MRI images, the variation curves of the MRI signal intensity along the Y-axis direction can be obtained at different stages of methane hydrate formation in Experiment 4, as shown in Figure 8b. Results show that the distribution of the MRI signal intensity curve is relatively flat along the Y-axis direction before gas injection. However, the MRI signal intensity in the 35~60 mm area is significantly higher than before the gas injection after 1.73 h. In contrast, the MRI signal intensity in the 0~35 mm area shows a significant decrease. This phenomenon indicates that a rightward shift of pore water is caused by methane gas injection. It results in the heterogeneous distribution of pore water before hydrate formation. Subsequently, pore water continuously converts into hydrates. It leads to a decrease in MRI signal intensity during the hydrate formation.
The methane gas is sufficient near the gas injection site (0 mm in Figure 8b). The high content of methane gas provides favorable conditions for hydrate formation [26,49]. During the period of 1.73~16.68 h, the MRI signal intensity in the 0~10 mm area shows the most significant decrease, in that a large amount of pore water is converted into methane hydrate. It has been confirmed that particle-coated hydrate will be formed in unconsolidated porous media using the excess-gas method [50]. A thin and water-permeable hydrate film is initially formed at the gas-liquid interface [51]. Subsequently, the hydrate film gradually thickens, and its densification is enhanced [52]. The hydrate film hinders the direct contact between methane gas and the water layer on the particle surface. It enhances the mass transfer resistance between gas and water. Therefore, the further growth of methane hydrate film is inhibited, and the conversion rate of pore water is greatly reduced [53,54]. In addition, the heat release leads to an increase in local temperature. It causes a decrease in the driving force of hydrate formation. This is another reason for inhibiting the further growth of hydrate film [55]. Therefore, during the period of 16.68~37.67 h, the reduction rate of the MRI signal intensity slows down in the 0~10 mm area. In contrast, the methane gas injection leads to an increase in pore water content in the 10~60 mm area. It worsens the connectivity of methane gas in the pores and slows down the diffusion rate of methane gas. It is not conducive to rapid nucleation [56]. The hydrate formation requires a longer induction time in a high-water content area. Therefore, the methane hydrate formation rate is slower in the 10~60 mm area, and there is even a hydrate-free area (55~60 mm in Figure 8b) during the period of 1.73~16.68 h. However, sufficient water content provides a rich material basis for the hydrate formation. Once rapid nucleation begins, the amount of pore water is converted into methane hydrates rapidly. As a result, the MRI signal intensity decreases significantly in the 10-60 mm area during the period of 16.68~37.67 h.
The distribution of MRI signal intensity curves along the Y-axis direction tends to be flat in the whole area (0~60 mm in Figure 8b) after 37.67 h. During the period of 37.67~61.33 h, the hydrate film formed on the gas–water interface continues to thicken. The thickening of the hydrate film increases the diffusion resistance to limit the contact between methane gas and water. The conversion rate of pore water is greatly reduced. The reduction rate of MRI signal intensity slows down. However, the reduction amplitude of MRI signal intensity is similar in the different areas of sand samples during the period of 37.67~61.33 h. Afterward, there is no significant change in the MRI signal intensity curve. The total MRI signal intensity in the whole area (0~60 mm in Figure 8b) only continues to decrease by less than 4.8% during the period of 61.33~231.48 h.
After hydrate formation, the residual MRI signal intensity is decreased to 34% of the initial MRI signal intensity. This illustrates that around 34% of the initial pore water is not converted into hydrate. In addition, the distribution of the MRI signal intensity curve is flat along the Y-axis direction after hydrate formation (orange line shown in Figure 8b). This means that the spatial distribution of the unconverted pore water is homogeneous. Based on the heterogeneous distribution of pore water before hydrate formation (green line shown in Figure 8b), the spatial distribution of methane hydrate is heterogeneous in the sand sample after hydrate formation. This indicates that the initial water distribution will affect the final hydrate distribution in the hydrate formation experiment by the excess-gas method. This conclusion has also been confirmed in the methane hydrate formation experiment in a partially saturated sandstone [22].
4.3. Analysis of Influence Factors on Pore Water Conversion
4.3.1. Effect of Initial Water Saturation
Figure 9 represents the variation of the pore water conversion ratio during the methane hydrate formation under different initial water saturation levels (Experiments 1–4 in Table 1). Results show that the time required for the conversion ratio of pore water to reach 50% gradually increases with increases in the initial water saturation (t1 < t2 < t3 < t4, shown in Figure 9 and Table 2). This illustrates that the conversion rate of pore water slows down with increases in the initial water saturation. It has been analyzed that the contact area between water and methane gas in pores decreases with increases in the initial water saturation under the same pore pressure and sand size. This leads to a weakening of mass transfer. It is not conducive to rapid hydrate nucleation [57]. Consequently, the conversion rate of pore water decreases.
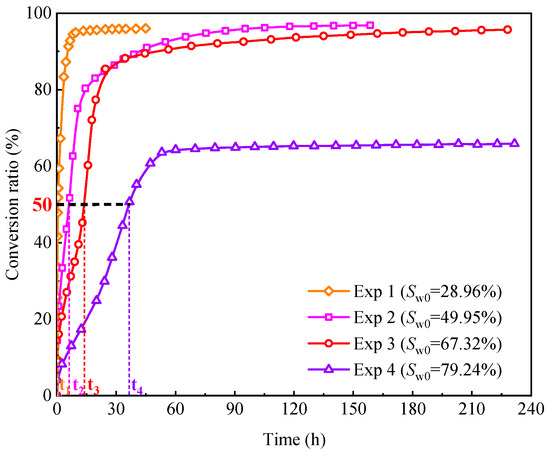
Figure 9.
Comparison of pore water conversion ratio during methane hydrate formation under different initial water saturation.
For another, the water molecules near the surface of a solid have higher potential energy and are strongly bound to the surface of sand particles [58]. There is a water molecule layer with a thickness of 0.8 Å on the surface of sand particles, which will not form ice or hydrate [20]. Aladko et al. [59]. also pointed out that the hydrate can only form when the water content is sufficient for the occurrence of capillary condensation. The strongly bound water closely attached to the mineral surface cannot participate in the hydrate formation. Therefore, the pore water in Experiments 1–4 has not been completely converted into hydrates after the experiment. In addition, although the pore water in Experiments 1–3 has not been completely converted, the final conversion ratio of pore water exceeds 95% in these experiments. However, the final conversion ratio of pore water is only 65.80% in Experiment 4. The sand sample initially exhibits a water-rich state (Sw0 = 79.24%) after methane gas injection in Experiment 4. Compared to Experiments 1–3, high water content and small gas–water contact area make it difficult for pore water to come into full contact with methane gas. As mentioned in Section 4.2, the methane hydrate is more likely to grow laterally on the gas–water interface. The hydrate film formed on the gas–water interface continues to thicken during the hydrate formation. The thickening of the hydrate film increases the diffusion resistance to limit the contact between methane and water. Consequently, the conversion rate of pore water significantly decreases [52]. In the later stage of Experiment 4, the hydrate film barrier effect almost completely interrupts the direct contact between gas and water. There is still 34.20% of pore water that has not been converted into hydrates after hydrate formation in the sand sample. However, the initial water saturations in Experiments 1–3 are significantly lower than those in Experiment 4. Low water content and a large gas–water contact area benefit from methane gas and pore water to form a hydrate in the whole sand sample. The hydrate film has a relatively weak barrier effect. The pore water will react more fully with methane gas to form a hydrate in the sand sample. As a result, the proportion of unconverted pore water to hydrates is only 3.81%, 3.18%, and 4.32% in Experiments 1–3, respectively.
The above results indicate that the final conversion ratio of pore water is mainly affected by the mineral surface in the sand sample with low initial water saturation. The final conversion ratio of pore water is primarily determined by the barrier effect of the hydrate film in the sand sample with high initial water saturation.
4.3.2. Effect of Sand Particle Size
Figure 10 presents the variation of the pore water conversion ratio during methane hydrate formation under different sand particle sizes in Experiments 2, 5, and 6. Results indicate that the time required for the conversion ratio of pore water to reach 50% gradually increases as the sand size increases (t5 < t2 < t6, shown in Figure 10 and Table 2). This illustrates that the conversion rate of pore water slows down with the increase in sand size. Furthermore, the conversion rate of pore water in Experiment 6 (ds = 420–590 μm) is significantly lower than that in Experiment 2 (ds = 100–200 μm) and Experiment 5 (ds = 58–75 μm). It takes 105.65 h to achieve a 50% conversion ratio of pore water in this experiment. The specific surface area of sand particles is inversely proportional to the particle size. Therefore, the contact area between methane gas and water is less in the coarser particle sample at a similar initial water saturation. It results in a slower conversion rate of pore water in the coarser particle sample. In addition, the hydrate film formed on the gas–water interface can block the contact between methane gas and the water layer on the particle surface [60]. Due to the smaller contact area between methane gas and water, the hydrate film is thicker at the same hydrate saturation in the coarser particle sample. The barrier effect of hydrate film is stronger. It takes a longer time to achieve the same conversion ratio of pore water. Besides those, the decrease in a specific surface area will also reduce nucleation sites on the surface of sand particles. The potential of hydrate formation will decrease [58].
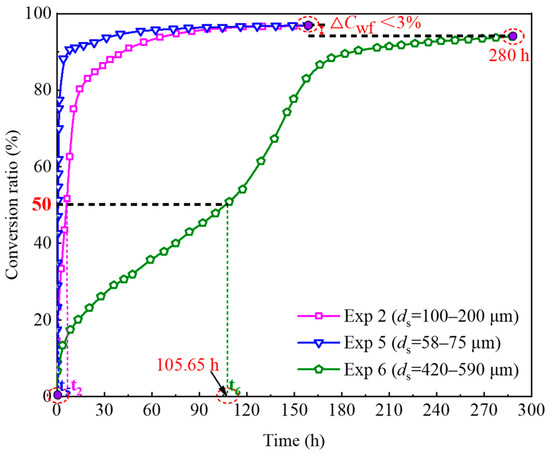
Figure 10.
Comparison of pore water conversion ratio during methane hydrate formation under different sand particle sizes.
The final conversion ratio of pore water in Experiment 2 (ds = 100–200 μm) is almost the same as that in Experiment 5 (ds = 58–75 μm). Due to the larger gas–water contact area, the hydrate film is thinner in the finer particle sample at the same hydrate saturation. However, due to the larger specific surface area of sand particles, the content of the unconverted strongly bound water is higher in the finer particle sample. In addition, the reduction in sand size will also lead to the enhancement of capillary force inside the pores. The supersaturation will decrease accordingly. It enhances the difficulty of hydrate formation [61]. Therefore, although the reduction of sand size weakens the barrier effect of the hydrate film, the content of the unconverted, strongly bound water and the supersaturation of hydrate formation is improved (shown in Figure 11a). It results in almost no difference in the final conversion ratio of pore water between Experiment 2 and Experiment 5. When the sand size increases to 420–590 μm, the hydrate film is thicker at the same hydrate saturation. The barrier effect of the hydrate film is significantly enhanced. Hydrate growth time is greatly extended. Until 280 h, the conversion ratio of pore water in Experiment 6 remains slightly lower than in Experiment 2 and Experiment 5 (ΔCwf < 3%, shown in Figure 10). However, the conversion ratio of pore water in Experiment 6 will continue to exhibit a growth trend for some time. Therefore, although the increase in the sand size leads to a decrease in unconverted, strongly bound water on the sand particle surface and a decrease in the supersaturation of hydrate formation, the barrier effect of the hydrate film limits the contact between methane gas and weakly bound water (shown in Figure 11b) [62,63]. Accordingly, the final conversion ratio of pore water also does not change much.
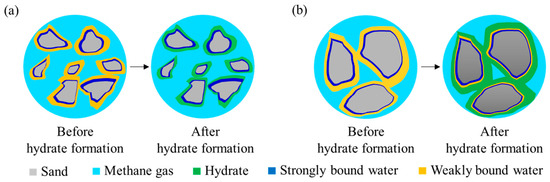
Figure 11.
Schematics before and after hydrate formation under different sand particle sizes: (a) fine-grained sand; (b) coarse-grained sand.
According to the above research, the main controlling factors affecting the final conversion ratio of pore water in sand samples with different particle sizes at low initial water saturation are different. The final conversion ratio of pore water in the finer particle sample is mainly affected by the unconverted, strongly bound water content on the sand particle surface and the supersaturation of hydrate formation. However, the final conversion ratio of pore water in the coarser particle sample is determined by the thickness of the hydrate film on the particle surface. Within the scope of the study, there is little difference in the final conversion ratio of pore water among sand samples with different particle sizes. Zhang et al. [60] also obtained consistent conclusions in porous silica gels with similar particle size ranges.
5. Conclusions
The paper investigates the formation process of methane hydrate in unconsolidated sands using low-field NMR technology and discusses the conversion characteristics of pore water, along with the effects of initial water saturation and sand particle size. The main conclusions are drawn as follows:
- (1)
- Methane hydrate formation occurs in both large and small pores within unconsolidated sands. The hydrate formation process leads to the transformation of large pores into small pores, and contributes to enhancing the homogeneity of the effective pore structure within the samples.
- (2)
- Variations in heat and mass transfer capacity significantly influence the conversion rate of pore water across different regions within unconsolidated sands. The thickening of the hydrate film increases mass transfer resistance between methane gas and water, thereby causing an early termination of the pore water conversion process. The distribution of hydrate within unconsolidated sands is primarily controlled by the initial distribution of pore water, especially when utilizing the excess-gas method for methane hydrate formation.
- (3)
- Increased initial water saturation reduces the contact area between methane gas and water, leading to a decline in the conversion rate of pore water. Moreover, large-sized sand particles with a small specific surface area and fewer nucleation sites also contribute to decreased pore water conversion rates. For instance, it takes over 100 h to achieve a 50% conversion ratio of pore water in unconsolidated sands with particle sizes of 420–590 μm.
- (4)
- Pore water cannot be completely converted into hydrates within unconsolidated sands. The final conversion ratio of pore water in water-poor sands across different particle sizes exceeds 94% but remains below 97%. However, in water-rich sand samples, the final conversion ratio is only 65.80% due to the barrier effect of the hydrate film on gas–water contact.
Author Contributions
Conceptualization, J.W. and C.L.; methodology, Y.J.; validation, C.L., Q.M. and F.N.; investigation, J.W. and C.L.; data curation, J.W., Y.J. and Z.Z.; writing—original draft preparation, J.W.; writing—review and editing, Y.Z., Q.M., J.S. and L.L.; visualization, J.W.; supervision, Y.J. and C.L; project administration, C.L. and L.L.; funding acquisition, Y.J., C.L. and L.L. All authors have read and agreed to the published version of the manuscript.
Funding
This research was jointly supported by National Natural Science Foundation of China (Grant Nos. 42176212 and 42206233), the Postdoctoral Innovative Talents Support Program in Shandong Province (Grant No. SDBX2021015) and the Taishan Scholars Program (Grant Nos. tsqn202312280 and tsqn202306297). This financial support is gratefully acknowledged.
Institutional Review Board Statement
Not applicable.
Informed Consent Statement
Not applicable.
Data Availability Statement
Data are contained within the article.
Conflicts of Interest
The authors declare no conflict of interest.
References
- Liu, J.; Li, X. Recent advances on natural gas hydrate exploration and development in the South China Sea. Energy Fuels 2021, 35, 7528–7552. [Google Scholar] [CrossRef]
- Hassanpouryouzband, A.; Joonaki, E.; Farahani, M.V.; Takeya, S.; Ruppel, C.; Yang, J.H.; English, N.J.; Schicks, J.M.; Edlmann, K.; Mehrabian, H. Gas hydrates in sustainable chemistry. Chem. Soc. Rev. 2020, 49, 5225–5309. [Google Scholar]
- Wu, X.; Guo, G.; Ye, H.; Miao, Y.; Li, D. Application of dual horizontal well systems in the Shenhu area of the South China Sea: Analysis of productivity improvement. J. Mar. Sci. Eng. 2023, 11, 1443. [Google Scholar] [CrossRef]
- Sloan, E.D.; Koh, C.A. Clathrate Hydrates of Natural Gases; CRC Press: Boca Raton, FL, USA, 2007. [Google Scholar]
- Zhan, L.; Wang, Y.; Li, X. Experimental study on characteristics of methane hydrate formation and dissociation in porous medium with different particle sizes using depressurization. Fuel 2018, 230, 37–44. [Google Scholar] [CrossRef]
- Boswell, R.; Collett, T.S. Current perspectives on gas hydrate resources. Eng. Environ. Sci. 2011, 4, 1206–1215. [Google Scholar] [CrossRef]
- Sloan, E. Gas hydrates: Review of physical/chemical properties. Energy Fuels 1998, 12, 191–196. [Google Scholar] [CrossRef]
- He, J.; Huang, X.; Cao, P. Fine particle migration in a gas hydrate sand: Single-and two-phase fluid using a device for observation at the pore scale. J. Mar. Sci. Eng. 2024, 12, 109. [Google Scholar] [CrossRef]
- Yu, Y.; Zhang, X.; Liu, J.; Lee, Y.; Li, X. Natural gas hydrate resources and hydrate technologies: A review and analysis of the associated energy and global warming challenges. Eng. Environ. Sci. 2021, 14, 5611–5668. [Google Scholar] [CrossRef]
- Liang, Y.; Tan, Y.; Luo, Y.; Zhang, Y.; Li, B. Progress and challenges on gas production from natural gas hydrate-bearing sediment. J. Clean. Prod. 2020, 261, 121061. [Google Scholar] [CrossRef]
- Zhan, L.; Liu, B.; Zhang, Y.; Lu, H. Rock physics modeling of acoustic properties in gas hydrate-bearing sediment. J. Mar. Sci. Eng. 2022, 10, 1076. [Google Scholar] [CrossRef]
- Hu, Q.; Li, Y.; Sun, X.; Chen, M.; Bu, Q.; Gong, B. Integrating test device and method for creep failure and ultrasonic response of methane hydrate-bearing sediments. Rev. Sci. Instrum. 2023, 94, 025105. [Google Scholar] [CrossRef]
- Peng, C.; Zou, C.; Lu, Z.; Yu, C.; Liu, A.; Tang, Y.; Hu, X.; Zhang, S.; Wen, H.; Li, Y.; et al. Characteristics of gas hydrate reservoirs and their effect on petrophysical properties in the Muli area, Qinghai-Tibetan plateau permafrost. J. Nat. Gas Sci. Eng. 2018, 57, 266–283. [Google Scholar] [CrossRef]
- Liu, C.; Jing, J.; Zhao, Q.; Luo, X.; Chen, K.; Wang, M.; Deng, M. High-resolution resistivity imaging of a transversely uneven gas hydrate reservoir: A case in the Qiongdongnan basin, South China Sea. Remote Sens. 2023, 15, 2000. [Google Scholar] [CrossRef]
- Yuan, Q.; Kong, L.; Liang, Q.; Liang, J.; Yang, L.; Dong, Y.; Wang, Z.; Wu, X. Mechanical characteristics of gas hydrate-bearing sediments: An experimental study from the South China Sea. J. Mar. Sci. Eng. 2024, 12, 301. [Google Scholar] [CrossRef]
- Zhao, Y.; Kong, L.; Liu, L.; Hu, G.; Ji, Y.; Bu, Q.; Bai, C.; Zhao, J.; Li, J.; Liu, J. Mechanical behaviors of natural gas hydrate-bearing clayey-silty sediments: Experiments and constitutive modeling. Ocean Eng. 2024, 294, 116791. [Google Scholar] [CrossRef]
- Li, Y.; Hu, W.; Tang, H.; Wu, P.; Liu, T.; You, Z.; Yu, T.; Song, Y. Mechanical properties of the interstratified hydrate-bearing sediment in permafrost zones. Energy 2023, 282, 128970. [Google Scholar] [CrossRef]
- Li, N.; Fan, Z.; Ma, H.; Jia, S.; Kan, J.; Sun, C.; Liu, S. Permeability of hydrate-bearing sediment formed from CO2-N2 mixture. J. Mar. Sci. Eng. 2023, 11, 376. [Google Scholar] [CrossRef]
- Zhao, Y.; Liu, J.; Sang, S.; Hua, L.; Kong, L.; Zeng, Z.; Yuan, Q. Experimental investigation on the permeability characteristics of methane hydrate-bearing clayey-silty sediments considering various factors. Energy 2023, 269, 126811. [Google Scholar] [CrossRef]
- Handa, Y.P.; Stupin, D. Thermodynamic properties and dissociation characteristics of methane and propane hydrates in 70-. ANG.-radius silica gel pores. J. Phys. Chem. 1992, 96, 8599–8603. [Google Scholar] [CrossRef]
- Chuvilin, E.M.; Istomin, V.A.; Safonov, S.S. Residual nonclathrated water in sediments in equilibrium with gas hydrate: Comparison with unfrozen water. Cold. Reg. Sci. Technol. 2011, 68, 68–73. [Google Scholar] [CrossRef]
- Ji, Y.; Hou, J.; Cui, G.; Lu, N.; Zhao, E.; Liu, Y.; Du, Q. Experimental study on methane hydrate formation in a partially saturated sandstone using low-field NMR technique. Fuel 2019, 251, 82–90. [Google Scholar] [CrossRef]
- Feng, Y.; Qu, A.; Han, Y.; Shi, C.; Liu, Y.; Zhang, L.; Zhao, J.; Yang, L.; Song, Y. Effect of gas hydrate formation and dissociation on porous media structure with clay particles. Appl. Eng. 2023, 349, 121694. [Google Scholar] [CrossRef]
- Ge, X.; Liu, J.; Fan, Y.; Xing, D.; Deng, S.; Cai, J. Laboratory investigation into the formation and dissociation process of gas hydrate by low-field NMR technique. J. Geophys. Res. Solid Earth 2018, 123, 3339–3346. [Google Scholar] [CrossRef]
- Zhan, J.; Zhang, P.; Wang, Y.; Wu, Q. Experimental research on methane hydrate formation in porous media based on the low-field NMR technique. Chem. Eng. Sci. 2021, 244, 116804. [Google Scholar] [CrossRef]
- Zhang, Y.; Zhao, Y.; Lei, X.; Yang, M.; Zhang, Y.; Song, Y. Quantitatively study on methane hydrate formation/decomposition process in hydrate-bearing sediments using low-field MRI. Fuel 2020, 262, 116555. [Google Scholar] [CrossRef]
- Ji, Y.; Hou, J.; Zhao, E.; Lu, N.; Bai, Y.; Zhou, K.; Liu, Y. Study on the effects of heterogeneous distribution of methane hydrate on permeability of porous media using low-field NMR technique. J. Geophys. Res. Solid Earth 2020, 125, e2019JB018572. [Google Scholar] [CrossRef]
- Farahani, M.V.; Hassanpouryouzband, A.; Yang, J.H.; Tohidi, B. Insights into the climate-driven evolution of gas hydrate-bearing permafrost sediments: Implications for prediction of environmental impacts and security of energy in cold regions. RSC Adv. 2021, 11, 14334–14346. [Google Scholar] [CrossRef] [PubMed]
- Farahani, M.V.; Guo, X.W.; Zhang, L.X.; Yang, M.Z.; Hassanpouryouzband, A.; Zhao, J.F.; Yang, J.H.; Song, Y.C.; Tohidi, B. Effect of thermal formation/dissociation cycles on the kinetics of formation and pore-scale distribution of methane hydrates in porous media: A magnetic resonance imaging study. Sustain. Energy Fuels 2021, 5, 1567–1583. [Google Scholar] [CrossRef]
- Zhao, J.; Lv, Q.; Li, Y.; Yang, M.; Liu, W.; Yao, L.; Wang, S.; Zhang, Y.; Song, Y. In-situ visual observation for the formation and dissociation of methane hydrates in porous media by magnetic resonance imaging. Magn. Reson. Imaging 2015, 33, 485–490. [Google Scholar] [CrossRef]
- Linga, P.; Haligva, C.; Nam, S.C.; Ripmeester, J.A.; Englezos, P. Gas hydrate formation in a variable volume bed of silica sand particles. Energy Fuels 2009, 23, 5496–5507. [Google Scholar] [CrossRef]
- Lv, J.; Jiang, L.; Mu, H.; Xue, K.; Cheng, Z.; Wang, S.; Liu, Y. MRI investigation of hydrate pore habits and dynamic seepage characteristics in natural gas hydrates sand matrix. Fuel 2021, 303, 121287. [Google Scholar] [CrossRef]
- Zhao, J.; Guo, X.; Sun, M.; Zhao, Y.; Yang, L.; Song, Y. N2O hydrate formation in porous media: A potential method to mitigate N2O emissions. Chem. Eng. J. 2019, 361, 12–20. [Google Scholar] [CrossRef]
- Ren, J.; Yin, Z.; Li, Q.; Wu, F.; Chen, D.; Li, S. Pore-scale investigation of CH4 hydrate kinetics in clayey-silty sediments by low-field NMR. Energy Fuels 2022, 36, 14874–14887. [Google Scholar] [CrossRef]
- Bello-Palacios, A.; Almenningen, S.; Fotland, P.; Ersland, G. Experimental and numerical analysis of the effects of clay content on CH4 hydrate formation in sand. Energy Fuels 2021, 35, 9836–9846. [Google Scholar] [CrossRef]
- Sun, X.; Qin, X.; Lu, H.; Wang, J.; Xu, J.; Ning, Z. Gas hydrate in-situ formation and dissociation in clayey-silt sediments: An investigation by low-field NMR. Eng. Explor. Exploit. 2021, 39, 256–272. [Google Scholar] [CrossRef]
- Zhang, Z.; Liu, L.; Li, C.; Liu, C.; Ning, F.; Liu, Z.; Meng, Q. A testing assembly for combination measurements on gas hydrate-bearing sediments using x-ray computed tomography and low-field nuclear magnetic resonance. Rev. Sci. Instrum. 2021, 92, 085108. [Google Scholar] [CrossRef]
- Liu, B.; Zhan, L.; Lu, H.; Zhang, J. Advances in characterizing gas hydrate formation in sediments with NMR transverse relaxation time. Water 2022, 14, 330. [Google Scholar] [CrossRef]
- Kleinberg, R.L.; Flaum, C.; Griffin, D.D.; Brewer, P.G.; Malby, G.E.; Peltzer, E.T.; Yesinowski, J.P. Deep sea NMR: Methane hydrate growth habit in porous media and its relationship to hydraulic permeability, deposit accumulation, and submarine slope stability. J. Geophys. Res. Solid Earth 2003, 108, 2508. [Google Scholar] [CrossRef]
- Coates, G.R.; Xiao, L.; Prammer, M.G. NMR Logging: Principles and Applications; Halliburton Energy Services: Huston, TX, USA, 1999. [Google Scholar]
- Zhao, Y.; Liu, T.; Lin, B.Q.; Sun, Y. Evaluation of compressibility of multiscale pore-fractures in fractured low-rank coals by low-field nuclear magnetic resonance. Energy Fuels 2021, 35, 13133–13143. [Google Scholar] [CrossRef]
- Duschl, M.; Pohlmeier, A.; Brox, T.I.; Galvosas, P.; Vereecken, H. Effect of magnetic pore surface coating on the NMR relaxation and diffusion signal in quartz sand. Magn. Reson. Chem. 2016, 54, 975–984. [Google Scholar] [CrossRef]
- Kleinberg, R.L. Nuclear Magnetic Resonance Pore-Scale Investigation of Permafrost and Gas Hydrate Sediments; Geological Society: London, UK, 2006; pp. 179–192. [Google Scholar]
- Weng, L.; Wu, Z.; Liu, Q.; Chu, Z.; Zhang, S. Evolutions of the unfrozen water content of saturated sandstones during freezing process and the freeze-induced damage characteristics. Int. J. Rock. Mech. Min. 2021, 142, 104757. [Google Scholar] [CrossRef]
- Meiboom, S.; Gill, D. Modified spin-echo method for measuring nuclear relaxation times. Rev. Sci. Instrum. 1958, 29, 688–691. [Google Scholar] [CrossRef]
- Kuang, Y.; Lei, X.; Yang, L.; Zhao, Y.; Zhao, J. Observation of in situ growth and decomposition of carbon dioxide hydrate at gas-water interfaces using magnetic resonance imaging. Energy Fuels 2018, 32, 6964–6969. [Google Scholar] [CrossRef]
- Wu, Z.; Gu, Q.; Li, G.; Zhao, Z.; Li, Y. Effect of decomposition water content of natural gas hydrate on permeability and gas production of clay sediments based on numerical simulation. J. Nat. Gas Sci. Eng. 2022, 108, 104826. [Google Scholar] [CrossRef]
- Ji, Y.; Liu, C.; Zhang, Z.; Meng, Q.; Liu, L.; Zhang, Y.; Wu, N. Experimental study on characteristics of pore water conversion during methane hydrates formation in unsaturated sand. China Geol. 2022, 5, 276–284. [Google Scholar] [CrossRef]
- Ma, S.; Zheng, J.; Tian, M.; Tang, D.; Yang, M. NMR quantitative investigation on methane hydrate formation characteristics under different driving forces. Fuel 2020, 261, 116364. [Google Scholar] [CrossRef]
- Li, M.; Wu, P.; Zhou, S.; Zhang, L.; Yang, L.; Li, Y.; Liu, Y.; Zhao, J.; Song, Y. Permeability Analysis of Hydrate-Bearing Sediments during the Hydrate Formation Process. Energy Fuels 2021, 35, 19606–19613. [Google Scholar] [CrossRef]
- Kar, A.; Bhati, A.; Acharya, P.V.; Mhadeshwar, A.; Venkataraman, P.; Barckholtz, T.A.; Bahadur, V. Diffusion-based modeling of film growth of hydrates on gas-liquid interfaces. Chem. Eng. Sci. 2021, 234, 116456. [Google Scholar] [CrossRef]
- Kneafsey, T.J.; Tomutsa, L.; Moridis, G.J.; Seol, Y.; Freifeld, B.M.; Taylor, C.E.; Gupta, A. Methane hydrate formation and dissociation in a partially saturated core-scale sand sample. J. Pet. Sci. Eng. 2007, 56, 108–126. [Google Scholar] [CrossRef]
- Davies, S.R.; Sloan, E.D.; Sum, A.K.; Koh, C.A. In Situ Studies of the Mass Transfer Mechanism across a Methane Hydrate Film Using High-Resolution Confocal Raman Spectroscopy. J. Phys. Chem. C 2010, 114, 1173–1180. [Google Scholar] [CrossRef]
- Mori, Y.H.; Mochizuki, T. Mass transport across clathrate hydrate films—A capillary permeation model. Chem. Eng. Sci. 1997, 52, 3613–3616. [Google Scholar] [CrossRef]
- Tian, M.; Song, Y.; Zheng, J.; Gong, G.; Yang, M. Effects of temperature gradient on methane hydrate formation and dissociation processes and sediment heat transfer characteristics. Energy 2022, 261, 125220. [Google Scholar] [CrossRef]
- Song, Y.; Wang, S.; Cheng, Z.; Huang, M.; Zhang, Y.; Zheng, J.; Jiang, L.; Liu, Y. Dependence of the hydrate-based CO2 storage process on the hydrate reservoir environment in high-efficiency storage methods. Chem. Eng. J. 2021, 415, 128937. [Google Scholar] [CrossRef]
- Bagherzadeh, S.A.; Moudrakovski, I.L.; Ripmeester, J.A.; Englezos, P. Magnetic resonance imaging of gas hydrate formation in a bed of silica sand particles. Energy Fuels 2011, 25, 3083–3092. [Google Scholar] [CrossRef]
- Grünberg, B.; Emmler, T.; Gedat, E.; Shenderovich, I.; Findenegg, G.H.; Limbach, H.H.; Buntkowsky, G. Hydrogen bonding of water confined in mesoporous silica MCM-41 and SBA-15 studied by 1H solid-state NMR. Chem. A Eur. J. 2004, 10, 5689–5696. [Google Scholar] [CrossRef]
- Aladko, E.Y.; Dyadin, Y.A.; Fenclonov, V.B.; Larionov, E.G.; Mel’gunov, M.S.; Manakov, A.Y.; Nesterov, A.N.; Zhurko, F.V. Dissociation conditions of methane hydrate in mesoporous silica gels in wide ranges of pressure and water content. J. Phys. Chem. B 2004, 108, 16540–16547. [Google Scholar] [CrossRef]
- Zhang, Y.; Li, X.; Chen, Z.; Li, G.; Wang, Y. Effects of particle and pore sizes on the formation behaviors of methane hydrate in porous silica gels. J. Nat. Gas Sci. Eng. 2016, 35, 1463–1471. [Google Scholar] [CrossRef]
- Jia, J.; Zhang, Y.; Li, G.; Chen, Z.; Li, X.; Wu, H. Experimental study on formation behavior of methane hydrate in sea mud from South China Sea. Geoscience 2013, 27, 1373. [Google Scholar]
- Smirnov, V.G.; Manakov, A.Y.; Ukraintseva, E.A.; Villevald, G.V.; Karpova, T.D.; Dyrdin, V.V.; Lyrshchikov, S.Y.; Ismagilov, Z.R.; Terekhova, I.S.; Ogienko, A.G. Formation and decomposition of methane hydrate in coal. Fuel 2016, 166, 188–195. [Google Scholar] [CrossRef]
- Sun, Y.; Jiang, S.; Li, S.; Wang, X.; Peng, S. Hydrate formation from clay bound water for CO2 storage. Chem. Eng. J. 2021, 406, 126872. [Google Scholar] [CrossRef]
Disclaimer/Publisher’s Note: The statements, opinions and data contained in all publications are solely those of the individual author(s) and contributor(s) and not of MDPI and/or the editor(s). MDPI and/or the editor(s) disclaim responsibility for any injury to people or property resulting from any ideas, methods, instructions or products referred to in the content. |
© 2024 by the authors. Licensee MDPI, Basel, Switzerland. This article is an open access article distributed under the terms and conditions of the Creative Commons Attribution (CC BY) license (https://creativecommons.org/licenses/by/4.0/).