Article

Changes in Carbon, Nitrogen, and Oxygen Stable Isotope Ratios and Mercury Concentrations in Killer Whales (Orcinus orca) during and after Lactation

1
School of Pharmaceutical Sciences, Health Sciences University of Hokkaido, 1757, Ishikari-Tobetsu, Hokkaido 061-0293, Japan
2
Kagawa School of Pharmaceutical Sciences, Tokushima Bunri University, Sanuki 769-2193, Japan
3
Department of Pharmaceutical Sciences, Daiichi University of Pharmacy, Minami-ku, Fukuoka 815-8511, Japan
*
Author to whom correspondence should be addressed.
J. Mar. Sci. Eng. 2024, 12(4), 623; https://doi.org/10.3390/jmse12040623
Submission received: 1 March 2024 / Revised: 24 March 2024 / Accepted: 29 March 2024 / Published: 6 April 2024

Abstract

:
The changes in the stable isotope ratios of carbon (δ13C), nitrogen (δ15N), oxygen (δ18O), and mercury (Hg) concentrations in muscle and liver tissues during and after lactation were studied in killer whales stranded along the coast of Hokkaido, in the northern area of Japan (n = 16). Calf muscles displayed δ13C- and δ15N-enriched peaks and a δ18O-depleted peak during lactation. The δ13C- and δ15N-enriched peaks appear to reflect the extensive nursing of 13C- and 15N-enriched milk and the onset of weaning, whereas the δ18O-depleted peak may be attributable to the extensive nursing of 18O-depleted milk and the onset of weaning. The δ13C and δ15N values tended to gradually increase after the weaning, whereas the δ18O values tended to decrease. The δ13C and δ15N levels in calves were similar between liver and muscle samples, whereas those in mature animals were higher in liver than in muscle samples. The isotopic turnover rates of C and N may be similar between the liver and muscle tissues in calves, which are rapidly growing animals. The Hg concentrations in muscle tissues were slightly higher in small calves than in large calves, probably due to the Hg transfer across placenta. The Hg concentrations in liver and muscle samples increased with increasing body length, and those in two liver samples from mature animals exceeded the high-risk threshold for marine mammal health effects (82 μg/wet g).

1. Introduction

Cetaceans, especially large whales, give birth and suckle in inaccessible oceans, making it difficult to observe their reproduction [1]. Currently, stable isotope ratios of nitrogen (δ15N) and carbon (δ13C) are exclusively used to study the reproduction of cetaceans. The δ15N levels in calves are higher than in their lactating mothers owing to the suckling of 15N-enriched milk [2,3,4,5]. The δ15N-enriched peaks were found in calf muscles during the lactation period in common minke whales (Balaenoptera acutorostrata [6]), humpback whales (Megaptera novaeangliae [7]), bowhead whales (Balaena mysticetus [1]), and Dall’s porpoises (Phocoenoides dalli [1]) owing to the extensive nursing and the onset of weaning. The δ13C-enriched small peaks due to lactation are also found in bowhead whale and Dall’s porpoise muscles [1], whereas the δ13C peak attributable to lactation was not found in the muscles of common minke whales [6] and humpback whales [7]. Cetacean milk generally contains high concentrations of 13C-depleted lipids and moderate concentrations of 13C-enriched proteins [8,9], and the lipid concentrations vary during the lactation period [8,10].
The stable isotope ratio of oxygen (δ18O) in teeth and bones has been increasingly used to discriminate, verify, and identify the habitat of marine animals because this value strongly reflects the geographic and climatic conditions of habitats [11,12,13,14,15,16,17]. Drinking water is the main source of oxygen in the tissues of terrestrial animals [18]. However, cetaceans do not drink water, and they obtain water from ingested food, in which the δ18O levels are related to environmental water [19]. Small increases in δ18O values, probably due to breastfeeding, have been reported in the tooth enamel of ancient humans, in addition to the δ15N enrichment [9,20]. However, the changes in δ18O values attributable to the lactation have not been reported in cetacean muscles.
Mercury is a global pollutant emitted to the atmosphere from both natural and anthropogenic sources. The mercury accumulation in marine animals generally increases with increasing trophic levels (i.e., increasing δ15N values) [21,22,23,24,25] and in an age- and/or body length (BL)-dependent manner, with particularly high levels in the liver of odontocetes [26,27,28]. Methylmercury passes through the placenta and causes fetal Hg poisoning [29].
Killer whales (Orcinus orca) are large apex predators; the ages when 90% of the life span has been realized are 34 ± 0.3 for males and 52 ± 0.5 for females [30]. They are the most widespread cetaceans in the ocean, from polar water to tropical seas, although they appear to prefer high latitudes and coastal waters rather than tropical offshore and deep-sea waters [17,31]. There are at least three ecotypes of killer whales in the North Pacific [32], which are genetically distinct and have different dietary preferences: the ‘transient’ ecotype, which feeds on marine mammals, and the ‘resident’ and ‘offshore’ ecotypes, which feed on fish [33].
In February 2005, at the shoreline of Aidomari, Hokkaido prefecture, in the northern area of Japan, a pod of up to twelve killer whales became trapped on drifting ice floes and died after approximately one week (Figure 1). They were the transit ecotype and had eaten mainly seals and squid as determined from the digestive residues in their stomachs [27]. We obtained muscle and liver samples from nine dead killer whales including three calves and three lactating females (Aidomari killer whale (AKW) samples). We thereafter obtained three killer whale samples stranded in 2010 and 2015 from the Stranding Network of Hokkaido (SNH10055, SNH10057, and SNH12015, see Table 1), and reported the analytical data of δ13C, δ15N, and δ18O values and Hg concentrations in the combined killer whale samples [34]. In this previous study, we could not find the δ15N-enriched peak and apparent trends in the δ13C and δ18O values during the lactation period because of the small number of calf samples, but these data suggested that the δ13C and δ15N levels were higher in liver tissues than in muscle tissues from mature animals but were similar in these tissues from calves.
In the present study, we quantified the δ13C, δ15N, and δ18O values and the Hg concentrations in other killer whales stranded along the Hokkaido coast in 2016 and 2017 (SNH samples of two calves and two mature animals) after the previous study [34] for verification and further exploration. In addition, we quantified the δ18O values in the remaining muscle samples of common minke whales in which we had quantified the δ13C and δ15N values before [6] to compare with the change of δ18O values in killer whales. On the basis of these results, we studied the BL at the onset of weaning using the calculated δ15N-enriched peak in calf muscles; investigated whether the δ13C- and δ18O-enriched peaks are found in calf muscles; and compared the difference in δ13C values, δ15N value, and δ18O values between liver and muscle tissues (δ13Cliver-muscle, δ15Nliver-muscle, and δ18Oliver-muscle, respectively) in calves with those in mature animals. Finally, we discussed placental transport of mercury to neonates, and compared hepatic mercury levels in mature killer whales with those previously reported in other odontocetes.

2. Materials and Methods

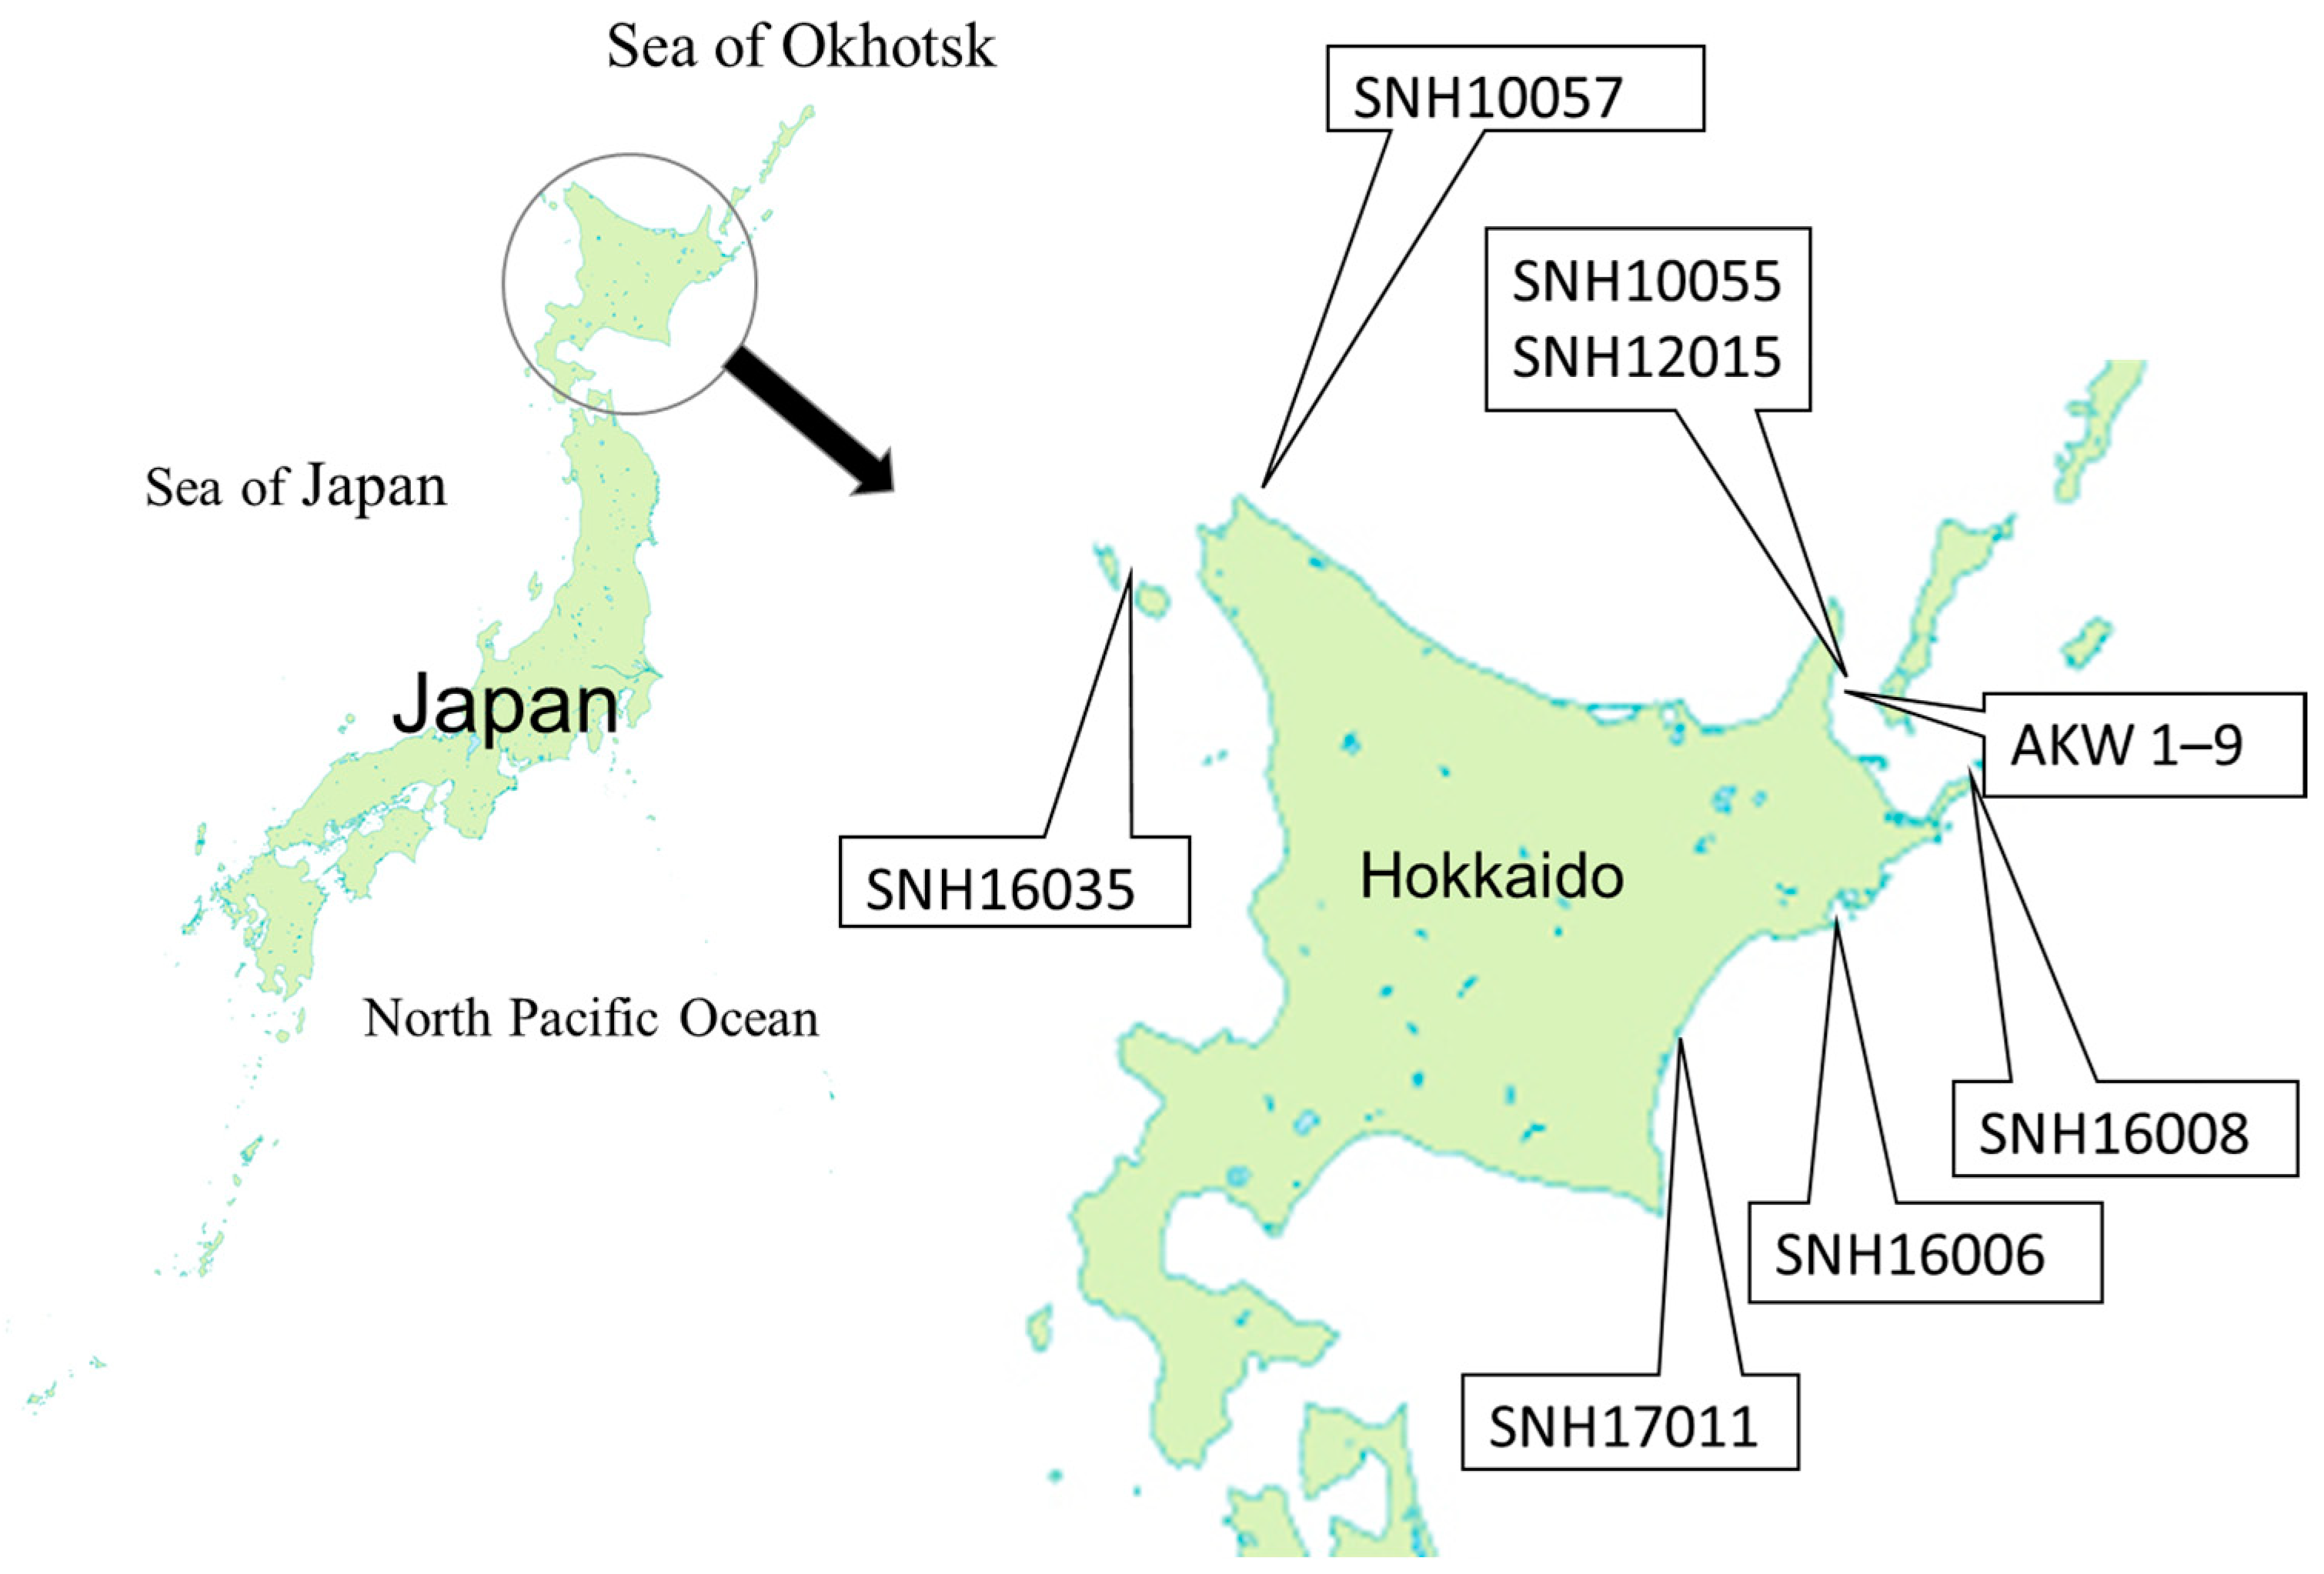
2.1. Samples of Killer and Common Minke Whales

Muscle samples from killer whale calves (SNH 16006 and SNH 16035), a mature male animal (SNH 16008), and a mature female animal (SNH 17011) stranded on the coast of Hokkaido, Japan in 2016 and 2017 were obtained from SNH (http://www.kujira110.com/ accessed on 30 March 2024). Liver samples from one calf (SNH 16006) and both mature whales (SNH 16008 and SNH 17011) were also obtained from SNH. These samples were quantified with the δ13C, δ15N, and δ18O values and the mercury concentrations. All killer whale data from the previous and current studies are summarized in Table 1, and stranding locations from both studies are presented in Figure 1. The ecotypes of all SNH whales in both studies are unidentified.
The calves with BLs of 2.2 m (SNH 16006) and 2.3 m (SNH 16035) were considered neonates because the BLs of newborns are reported to be 2.1 m [35] and 2.3 m [36]. Three calves with BLs of 2.7 m (AKW 3 and AKW 8) and 3.0 m (AKW 7) are estimated to be approximately 3 months old [34]. In two calves, milk was found in their stomachs, whereas the stomach of the third calf was empty. We believe that the three calves died immediately before or at the start of weaning, as the shortest BL of calves in which solid materials are found in the stomach is 2.6 m [37]. We believe that the animal with BL of 3.8 m (SNH 12015) is approximately 3 years old [38], and it was categorized into the late stage of weaning because the weaning is reported to completely cease at BL of 4.3 m [37] and age of 4 years [39], although our previous study misstated its age as 2 years [34].
Muscle samples from common minke whales (n = 20), in which the δ13C and δ15N values and the Hg concentrations had been previously quantified ([6], Table 2), were quantified the δ18O values.
The samples from killer whales and common minke whales were stored at −20 °C until chemical analysis.

2.2. Chemical Analyses

Lipids were removed from dried muscle and liver samples by chloroform/methanol extraction [40]. The extraction was performed at least three times and repeated until the color of the extraction solvent became clear. Samples were then analyzed for C, N, and O isotopes.
The 13C and 15N levels in the muscle and liver samples from killer whales, the 18O levels in the muscle and liver samples from the killer whales, as well as in the muscle samples from common minke whales, were analyzed by an isotope-ratio mass spectrometry (Delta V PLUS or Delta V Advantage, Thermo Fisher Scientific, Tokyo, Japan) as reported previously [6,7,41].
As reported previously [6], total mercury (Hg) concentrations in the muscle and liver samples were quantified using a flameless atomic absorption spectrophotometer (Hiranuma Sangyo Co., Ltd., HG-310, Ibaraki, Japan) after digestion of samples by a mixture of HNO3, H2SO4, and HClO4. The Hg concentrations in muscle and liver samples were expressed on a wet weight basis, and the determination limit of Hg was approximately 0.01 μg/wet g.

2.3. Statistical Analyses

We investigated whether the relationship between BL and analytical data (δ13C, δ15N, and δ18O values and Hg concentrations) could be fitted by a linear or exponential function using JMP (SAS Institute Japan Ltd., Tokyo, Japan, version 14.3). The data were analyzed by Student’s t-test and presented as the mean ± SD. The level of significance was set at p < 0.05.

3. Results

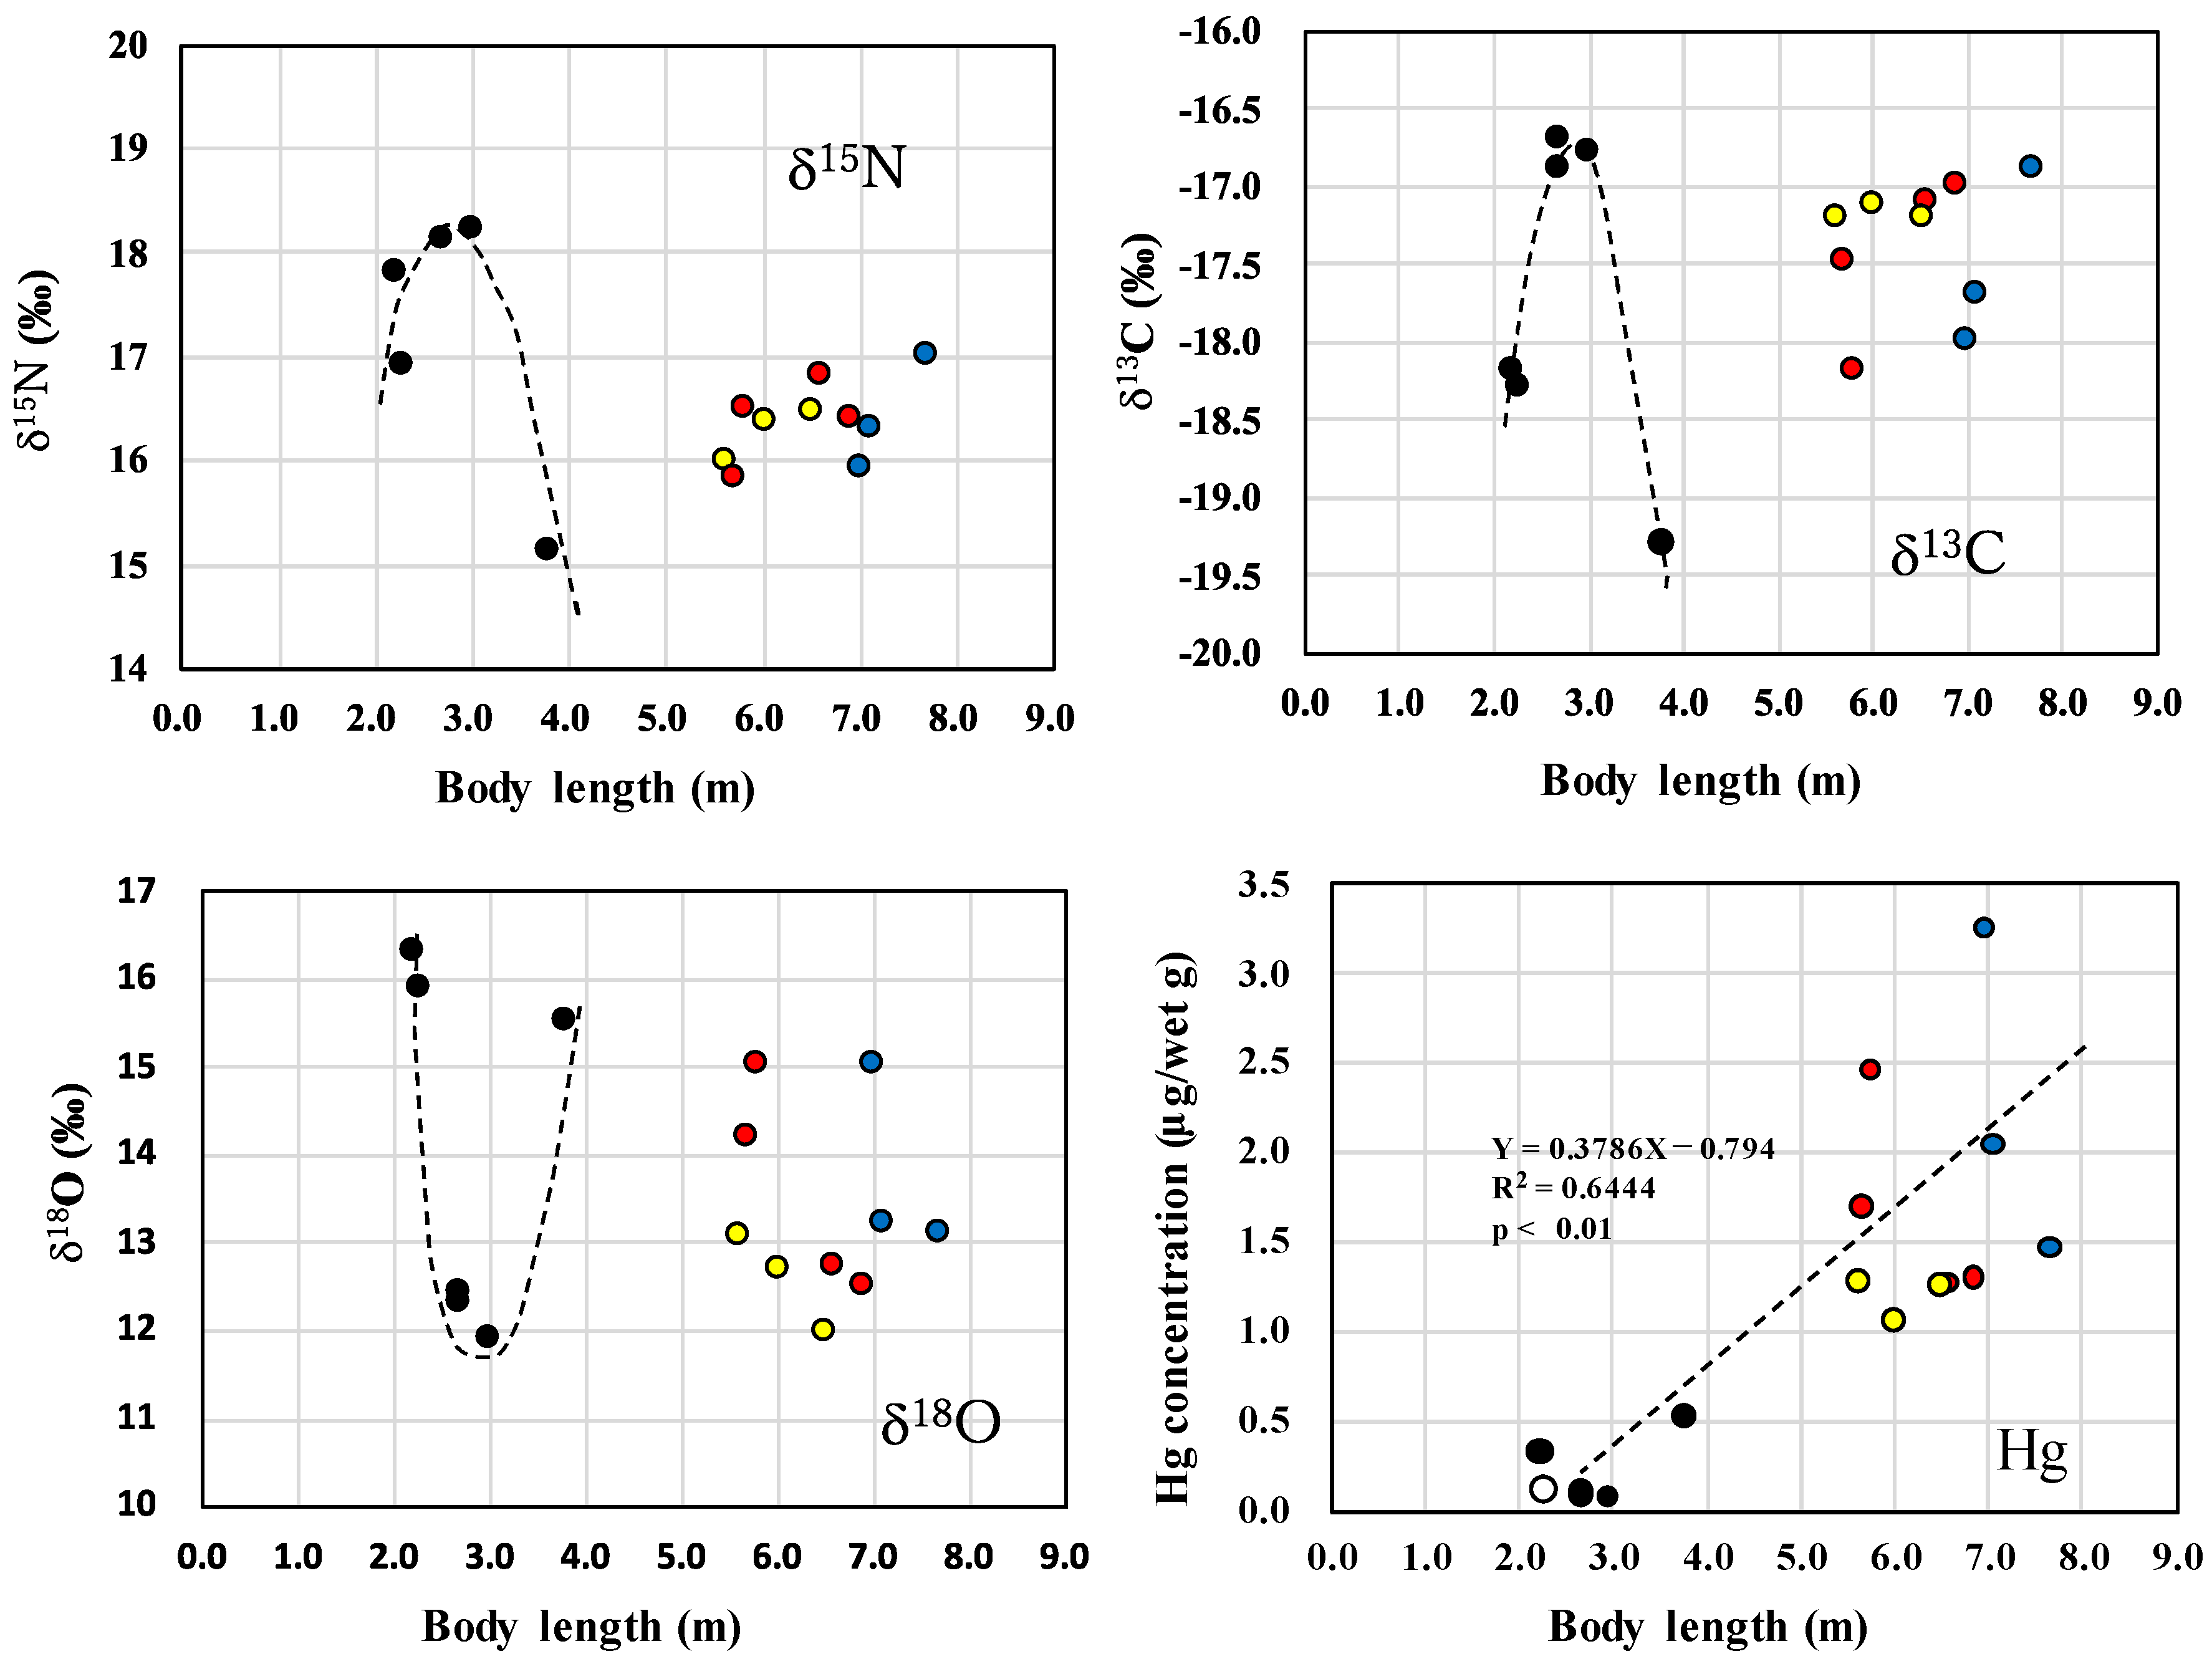
3.1. Changes in δ13C, δ15N, δ18O Values and Hg Concentrations during and after Lactation in Killer Whales

Mature males had longer BLs (7.0–7.7 m, n = 3) than mature females (5.6–6.9 m, n = 7) (Table 1), and these ranges were consistent with the reported BLs of killer whales of mature males (6–8 m) and mature females (5–7 m), respectively [42]. The relationships of BL with δ13C, δ15N, or δ18O values in muscle samples from calves and mature animals are shown in Figure 2.
The δ15N values from calves (n = 6) were fitted to a quadratic function (F = 8.0816, R2 = 0.84345, p = 0.0619) although not significantly. The calculated δ15N-enriched peak (convex upward) was located at BL of 2.7 m and δ15N value of 18.2‰. Similarly, the δ13C values from calves fitted to a significantly quadratic function (F = 43.7615, R2 = 0.9668, p = 0.0060), with the δ13C-enrichedpeak at BL of 2.9 m and δ13C value of −16.7‰. The δ18O values from calves were significantly fitted to a quadratic function (F = 91.3808, R2 = 0.98385, p = 0.0021), but this function exhibited a convex downward peak (δ18O-depleted peak) at BL of 3.0 m and δ18O value of 11.7‰.
As observed for muscle samples shown in Figure 2, the δ15N, δ13C, and δ18O values in the liver samples from calves (n = 5) were significantly fitted to quadratic functions. As data are not shown in figure, the δ15N-enriched peak was located at BL of 2.9 m and δ15N value of 18.8‰ (F = 705.41, R2 = 0.9986, p = 0.0014), and the δ13C-enriched peak was located at BL of 2.9 m and δ13C value of −16.5‰ (F = 143.64, R2 = 0.9930, p = 0.0069). Meanwhile, the δ18O-depleted peak was located at BL of 2.9 m and δ18O value of 12.9‰ (F = 23.406, R2 = 0.9590, p = 0.0410). These BLs of the δ15N, δ13C, and δ18O peaks calculated in liver samples (2.9 m) were extremely close to those calculated in muscle samples (2.7–3.0 m).
The δ13C and δ15N values for muscle samples in the largest calf at the late stage of weaning (SNH 12015) were the lowest among all killer whales, whereas the δ18O value in the largest calf was higher than that in all mature whales.
The δ13C and δ15N values for muscle samples in mature males increased with increasing BL, whereas no or slight increases in these values were found in both lactating and non-lactating females. The δ13C and δ15N levels in lactating (n = 3) and non-lactating females (n = 4) were similar, being −17.2 ± 0.1 and −17.5 ± 0.5‰, respectively, for the δ13C values and 16.3 ± 0.3 and 16.4 ± 0.5‰, respectively, for the δ15N values. Conversely, the δ18O levels in mature males, lactating females, and non-lactating females tended to decrease with increasing BL, and the δ18O level was slightly lower in lactating females (12.6 ± 0.6‰, n = 3) than in non-lactating females (13.6 ± 1.2‰, n = 4) and mature males (13.9 ± 1.0‰, n = 3).
The Hg concentrations in muscle samples increased with increasing BL (F = 26.7529, R2 = 0.6564, p = 0.001), although large variation was found in mature males (n = 3) and the Hg concentrations were slightly higher in small calves (0.22 and 0.21 μg/wet g in SNH 16006 and SNH 16035 samples, respectively) than in large calves (0.10, 0.07, and 0.08 μg/wet g in AKW 3, AKW 7, and AKW 8 samples, respectively). The Hg concentrations in lactating females (1.40 ± 0.24 μg/wet g, n = 3) were similar to these in non-lactating females (1.52 ± 0.62 μg/wet g, n = 4). Conversely, the increasing trend of Hg concentrations in liver samples due to increasing BL was unclear because of the large variation in Hg concentrations in the mature animals (60.9 ± 25.7 μg/wet g, 35.1–107.6 μg/wet g, n = 9) (not shown in figure). All Hg concentrations exceeded low-risk threshold for marine mammal health effects (16 μg/wet g), and two Hg concentrations exceeded high-risk threshold (83 μg/wet g) [43].
BLs, δ13C, δ15N, and δ18O values of AKW samples from mature animals (transient type, n = 6) were compared with those of SNH samples from mature animals (type is unidentified, n = 4). The BLs were 6.1 ± 0.1 m and 6.1 ± 0.8 m, the δ13C values were −17.1 ± 0.1‰ and −17.8 ± 0.3‰, the δ15N values were 16.5 ± 0.3‰ and 16.1 ± 0.3‰, and the δ18O values were 12.7 ± 0.4‰ and 14.4 ± 0.7‰, which were similar except for the δ18O values. On the other hand, the Hg concentrations in muscle and liver samples of AKW were 1.27 ± 0.13 μg/wet g (n = 6) and 12.75 ± 0.78 μg/wet g (n = 6), respectively, slightly lower than those in muscle samples (2.35 ± 0.67 μg/wet g, n = 4) and liver samples (15.12 ± 1.85 μg/wet g, n = 3) of SNH.

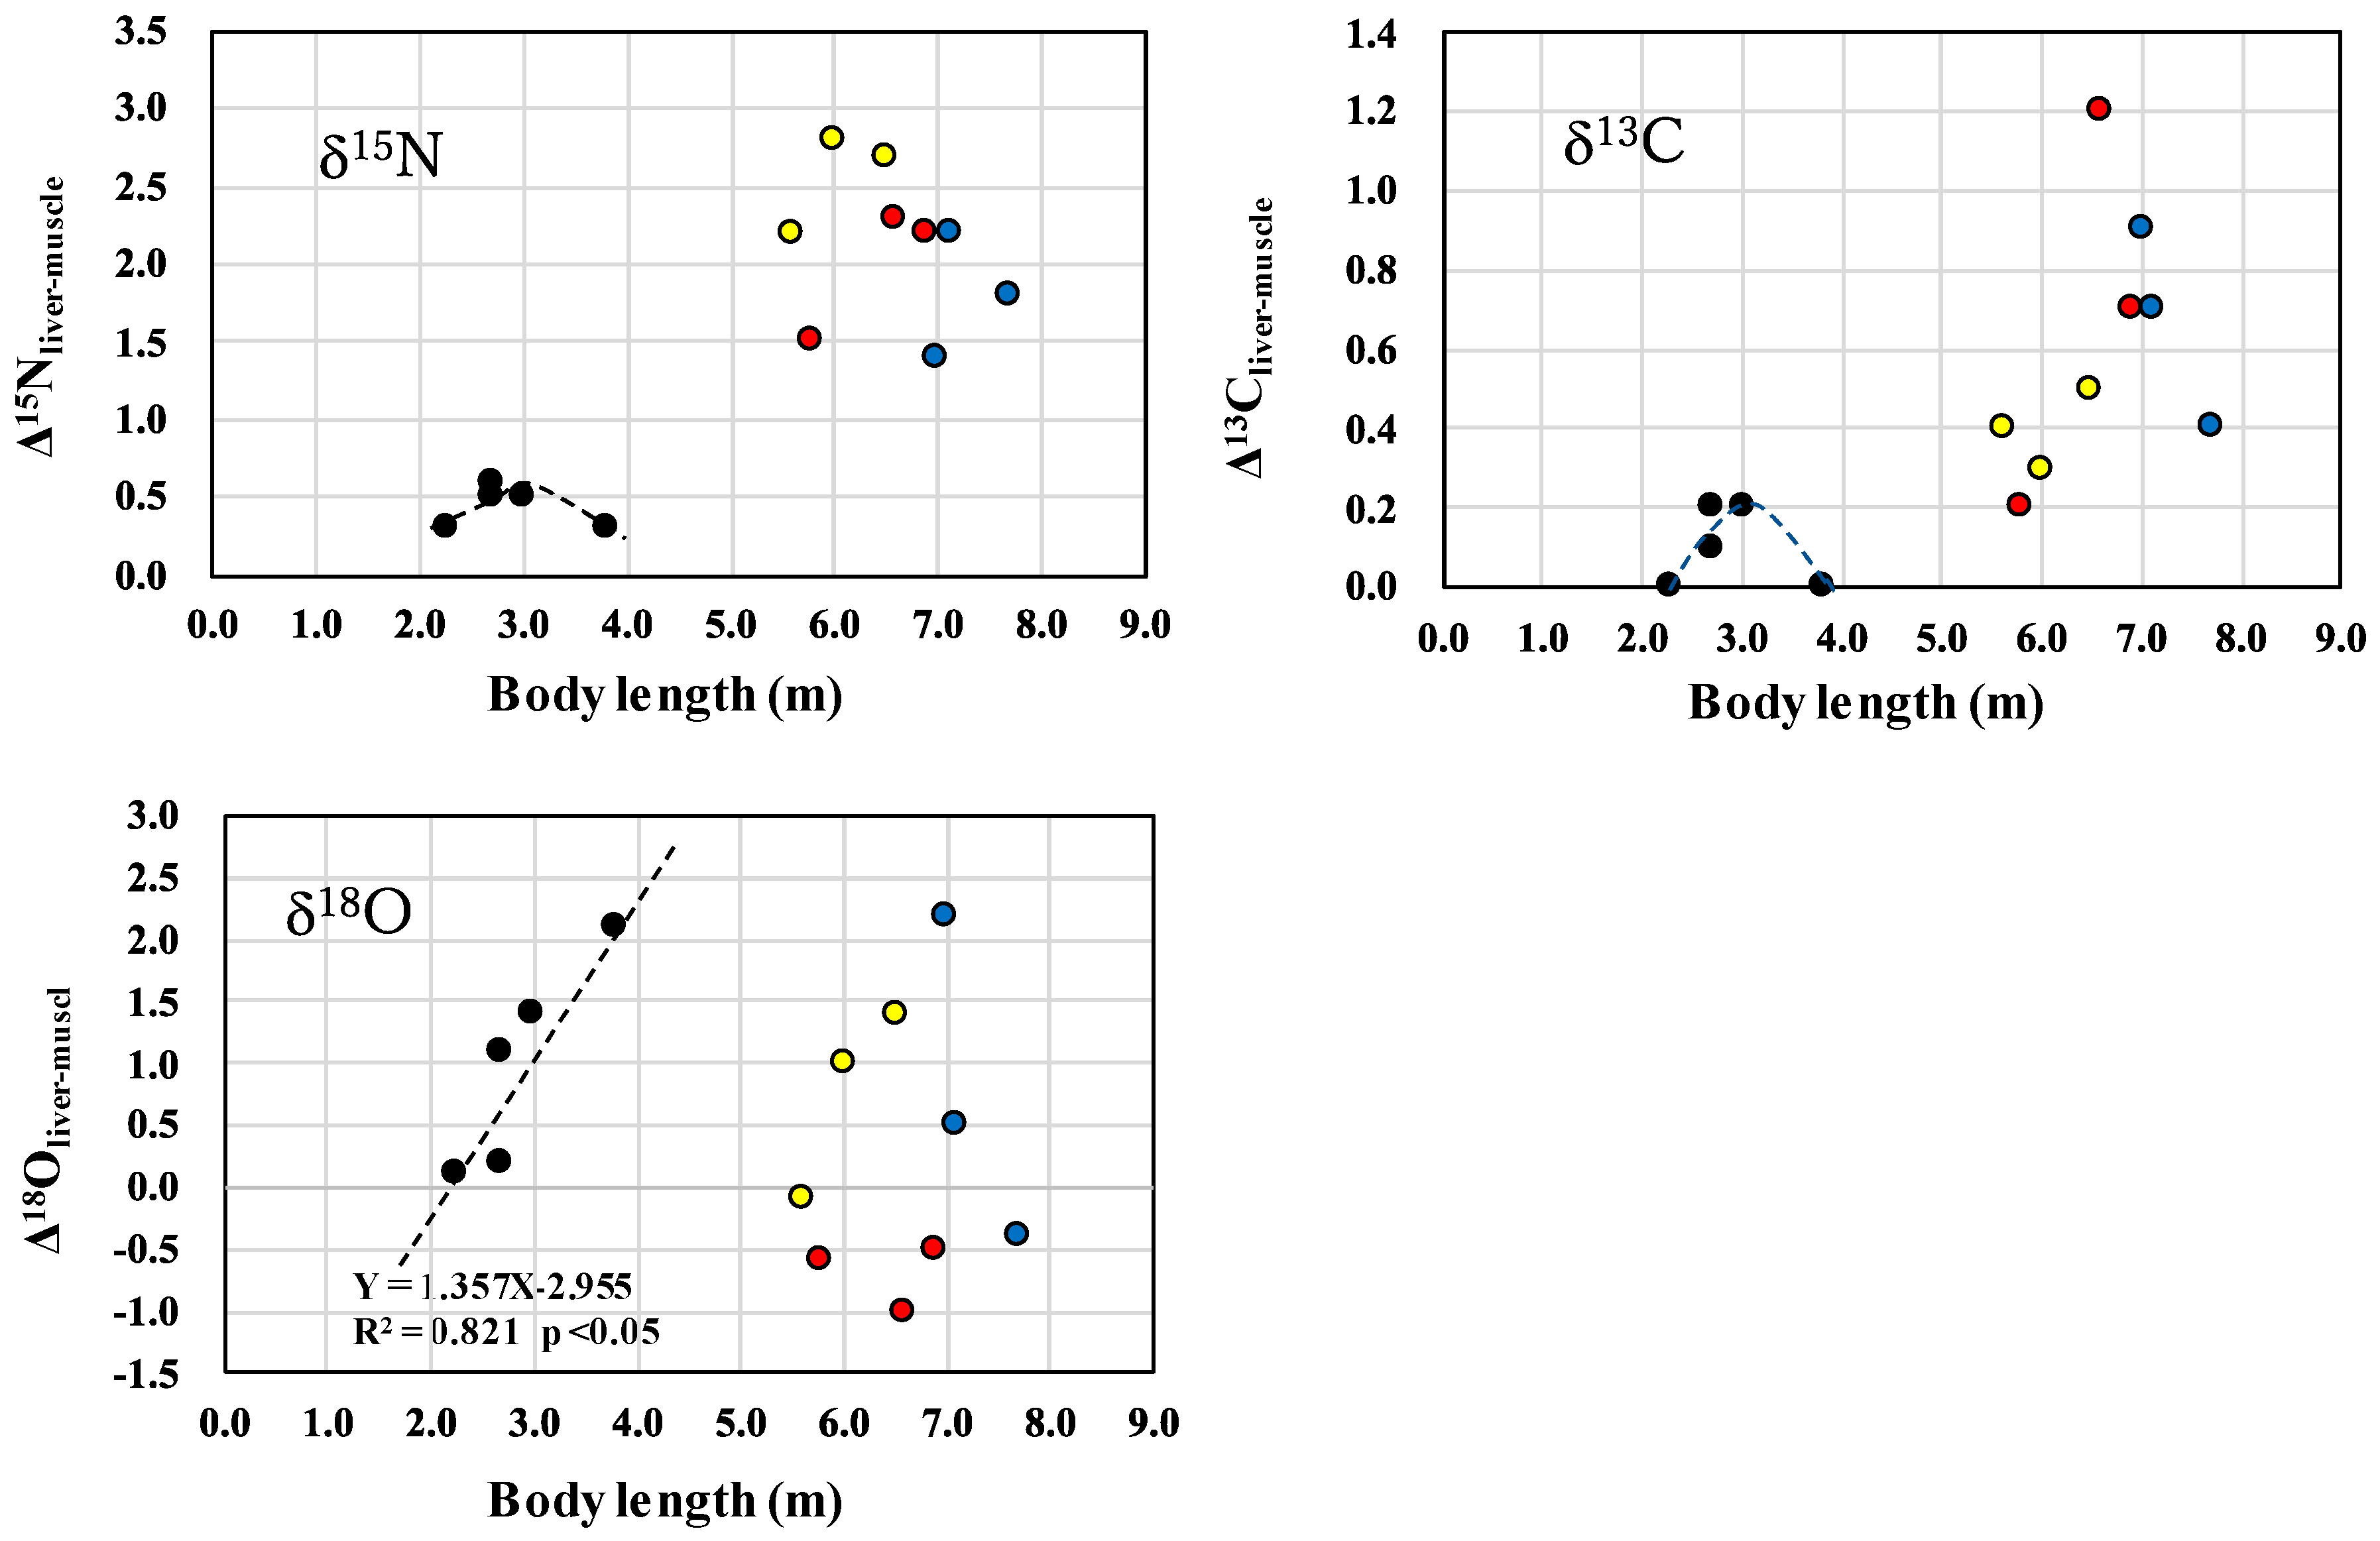
3.2. Comparison of δ13Cliver-muscle, δ15Nliver-muscle, and δ18Oliver-muscle Levels in Calves and Mature Animals

We compared the δ13C, δ15N, and δ18O levels in muscle samples with those levels in the liver samples, respectively (Table 3).
In mature animals, the δ13C and δ15N levels were higher in liver samples (−16.8 ± 0.6 and 18.5 ± 0.6‰, respectively) than in muscle samples (−17.4 ± 0.4 and 16.4 ± 0.4‰, respectively), but only δ15N levels were significantly different between tissues. On the other hand, no differences in δ13C and δ15N levels were observed between muscle and liver samples from calves. On the contrary, the δ18O levels were similar between liver and muscle samples from both calves and mature whales, although these levels were slightly lower in mature animals than in calves.
We investigated the relationship between BL and the differences in δ13C, δ15N, or δ18O values between liver and muscle samples (Figure 3). The δ15Nliver-muscle values were significantly larger (t12 = 7.525, p < 0.01) in mature animals (2.12 ± 0.48) than in calves (0.44 ± 0.13), and the δ13Cliver-muscle values were also significantly larger (t12 = 3.296, p < 0.01) in mature animals (0.59 ± 0.32) than in calves (0.10 ± 0.10). Although the δ15Nliver-muscle and δ13Cliver-muscle values in calves were small, these values likely had small peaks, as in the case of the δ15N and δ13C values (Figure 2). The trends of δ15Nliver-muscle and δ13Cliver-muscle values associated with increasing BL in mature animals were unclear. By contrast, the δ18Oliver-muscle values in calves (0.98 ± 0.84) increased linearly with increasing BL (F = 13.7243, R2 = 0.821, p = 0.0342), whereas no particular trend was observed for the δ18Oliver-muscle values in mature animals (0.28 ± 1.07).

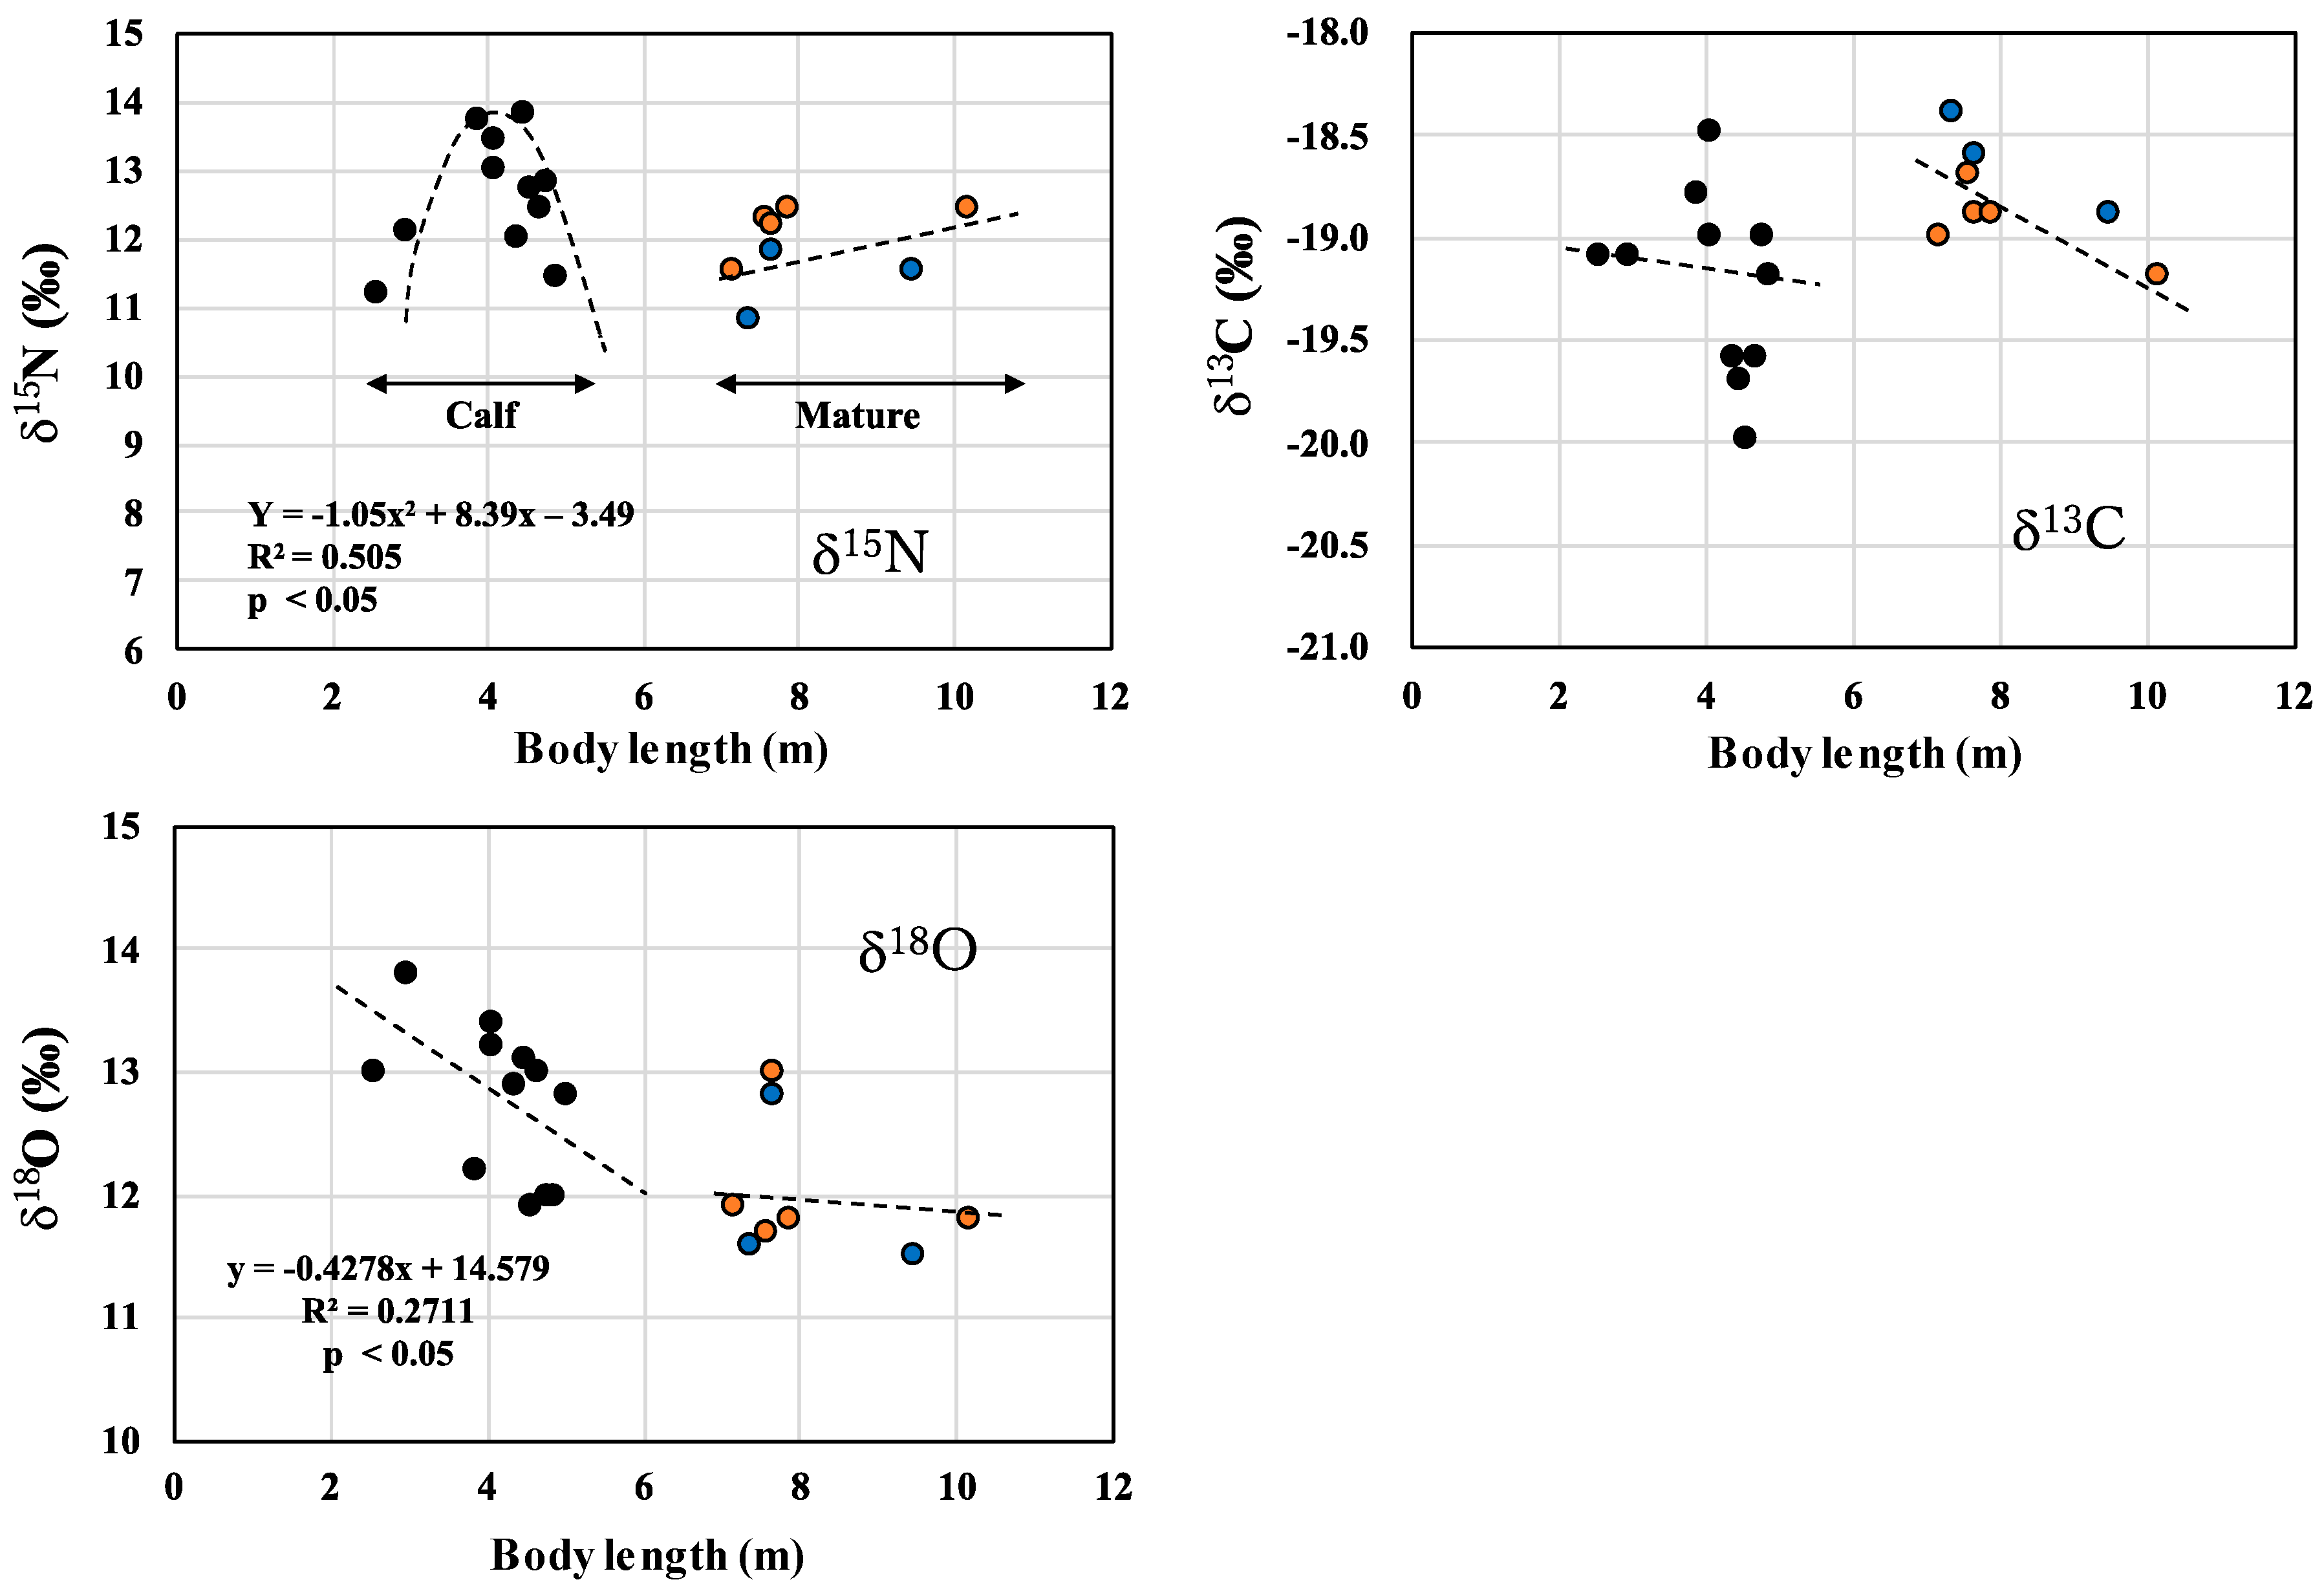
3.3. Changes in δ18O Values during Lactation in Common Minke Whales

We quantified δ18O values in muscle samples from common minke whales (Figure 4) to compare the change in δ18O values in killer whales (Figure 2). We show the δ15N-enriched peak at BL of 4.0 m and the variation in δ13C values in common minke whale calves in Figure 4, which was quoted from the previous report [6]. No sex-related differences were found in BL, δ13C, δ15N, and δ18O values and Hg concentrations between calves and mature animals.
The δ18O values were 12.8 ± 0.6‰ (n =12) in common minke whale calves, and these values tended to decrease throughout the lactation period (F = 3.7185, R2 = 0.27106, p = 0.0826), as in the case of killer whale calves excluding the largest calf (Figure 2). By contrast, no particular changes were found in the δ18O values from mature whales (12.3 ± 0.5‰, n = 8). The δ18O-enriched peak likely exists between the large calf and small mature animal.

4. Discussion

We studied the changes in δ13C, δ15N, δ18O values, and Hg concentrations in muscle and liver tissues during and after lactation of killer whales.
The δ15N-enriched peak due to lactation was found in the current study of killer whale muscles (Figure 2). The increase in δ15N values across the peak could represent the extensive nursing of δ15N-enriched milk, and the decrease in δ15N values from the peak could represent the onset of weaning [1,2,4,5,6,7]. The BLs at the onset of weaning calculated from the δ15N peak of 2.7 m in muscle samples (Figure 2) and 2.9 m in liver samples were consistent with the actual BLs at the onset weaning of 2.6 and 3.3 m reported in wild killer whales [37]. Meanwhile, the BL and the age at the complete cessation of weaning were reported to be approximately 4.3 m [37] and 4 years [39], respectively. Unfortunately, we could not estimate this BL because our analysis included only one weaning calf sample (SNH12015) and no juvenile samples.
As with the δ15N-enriched peak, the δ13C-enriched peaks attributable to lactation were found in muscle (Figure 2) and liver samples, with both peaks occurring at the BL of 2.9 m. The δ13C-enriched peak during the lactation period has been observed in human scalp hairs [2] and bowhead whale and Dall’s porpoise muscles [1]; this peak was not found in common minke whale muscles (Figure 4) and humpback whale muscles [7]. Cetacean milk contains high concentrations of δ13C-depleted lipids and moderate concentrations of δ13C-enriched proteins, and lipid concentrations vary among species and during the lactation period [8,10]. The δ13C-enriched peak found in killer whales (Figure 2), bowhead whales, and Dall’s porpoises [1] might result from the suckling of milk containing δ13C-enriched proteins and relatively lower concentrations of δ13C-depleted lipids, whereas the lack of δ13C peak or no trend of δ13C change found in common minke and humpback whales may be due to the large variation of δ13C-depleted lipid concentrations in milk [4,14].
The BLs of the δ18O-depleted peak of 3.0 and 2.9 m calculated from muscle samples (Figure 2) and liver samples, respectively, were extremely close to the BLs of the δ15N- and δ13C-enriched peaks. Thus, the BLs of the δ18O-depleted peak could be related to the onset of weaning. A similar δ18O-depleted peak is likely to exist between the large calf and small mature animal (juvenile) of common minke whales (Figure 4) and humpback whales [7]. Suckling appears to decrease the δ18O levels of calf tissues, and the onset of weaning may increase the δ18O levels, seemingly because of lower δ18O levels in milk than in calf muscles and in weaning foods. Interestingly, a large enrichment in δ18O values with wide variability was reported in the deciduous teeth enamel formed during the first 6 months of breastfeeding in humans [44].
No studies have been reported on δ18O levels in the milk of marine mammals. Available information on the δ18O levels in milk has been obtained from terrestrial animals, for which the main source of oxygen in milk is drinking water, and cow’s milk water is enriched in δ18O by about 3‰ compared to drinking water (−9.2 to −0.02‰) [45]. The δ18O values in the seawaters the stranded killer whales inhabited were reported to range from −0.1 to −0.01‰ in the Okhotsk Sea [46] and from −2.0 to 0.1‰ in the North Pacific Oceans around Japan [47]. Based on these reports, we estimate the δ18O values in killer whale milk to be around 1–3‰, which supports our assumption that the δ18O level in milk is lower than in muscle of calves. Analyses of δ18O levels in milk and weaning foods are needed to clarify the δ18O-depleted peak and δ18O-enriched peak in killer whales (Figure 2).
The isotopic half-life (T1/2) for C and N in terrestrial mammalian muscles (1–3 months) is markedly longer than that of the more metabolically active tissue of the liver (3–7 days) [48,49], and T1/2 could decrease generally with a decrease in animal body mass and with increases in metabolic and growth rates [50,51]. Thus, we believe that the isotopic turnover rates of N and C in muscle tissue are much faster in calves than in mature animals, and therefore there is little time lag between the actual onset weaning and that calculated from the calf muscles (Figure 2). We previously estimated the BL at the onset of weaning in common minke whales [6] and humpback whales [7] using the δ15N-enriched peaks in their muscle samples, which are close to their actual BLs at the onset of weaning. Curve fitting of δ15N values in calf muscle samples appears to be a powerful method for estimating the onset of weaning.
By contrast, little information is available on the turnover rate of O in marine mammals. The origins of O in milk could be mainly derived from water [45], whereas those of C and N in milk could be mainly derived from proteins, lipids, and carbohydrates [8,9]. The different patterns of the δ18O values and the δ13C and δ15N values in calves (Figure 2 and Figure 4) could be attributable to their different origins in milk.
It is known that the δ15N levels are generally higher in liver tissue than in muscle tissue from mature animals [18,52,53,54], and the higher values in liver tissue are thought to reflect the higher metabolic turnover rates in liver tissue. Consistent with this, the δ15N levels as well as the δ13C levels were higher in liver tissue than in muscle tissue of mature animals (Table 2). Conversely, δ15N and δ13C values were similar between calf liver and muscle tissues, suggesting that the turnover rates of N and C between these tissues are similar in calves, which are rapidly growing animals. By contrast, no difference in δ18O values was found between liver and muscle tissues in both calves and mature animals, whereas the δ18O value in both tissues was slightly higher in calves than in mature animals and the δ18Oliver-muscle values in calves increased with increasing BL (Figure 3). These differences between the δ18O values and the δ13C and δ15N values could be attributed to the different origins of O and C and N and the different evolution of their turnover rates with growth. Further studies are necessary to investigate the different patterns of the δ13C and δ15N values and the δ18O value between liver and muscle tissues and between the calves and mature animals.
The dentin growth layer in teeth can be used to investigate the continuous annual changes in the values of δ13C and δ15N, although this analysis cannot investigate any changes occurring within the first year such as the δ15N- and δ13C-enriched peaks and δ18O-depleted peak in muscle tissues (Figure 2) and liver samples. Newsome et al. [39] analyzed the dentin growth layers of killer whale teeth and reported an approximate 2.5‰ decrease in δ15N value due to the weaning, which occurs mainly during the first 3 years, and an approximate 1.5‰ of increase in δ15N value thereafter due to the ontogenetic increase in trophic levels. The decrease (2.5‰) and subsequent increase in δ15N values (1.5‰) reported in the dentin growth layer corresponded to the present finding of a 3.0‰ increase in δ15N values (range of maximum and minimum) in calves and 2.5‰ increase in δ15N value from the largest calf to the largest mature animal (Figure 2). We reported previously the peaks of δ15N and δ13C values during lactation period and the ontogenetic slight increase in δ15N of mature animals in the muscle samples from Dall’s porpoises and bowhead whales [1].
The Hg is preferentially accumulated in the liver of marine mammals [27,28,55]. In agreement, the Hg concentrations in liver samples from mature killer whales were 60.9 ± 25.6 μg/wet g (n = 9), and two Hg concentrations exceeded 83 μg/wet g, which is the high-risk threshold for marine mammal health effects [43]. Available information on the Hg concentrations in livers and δ15N values in muscles of marine mammals stranded or incidentally caught off the coast of Hokkaido, which may be preyed upon by the transient ecotype of killer whales, are summarized in Table 4. The Hg concentrations and δ15N values in killer whales were markedly higher than those in the other mammals, particularly common minke whales (baleen whale).
δ15N and Hg levels were compared between two ecotypes of killer whales off Norway, fish-eaters and seal-eaters. Skin δ15N levels were markedly higher in the seal-eaters (12.6 ± 0.3‰) than in the fish-eaters (11.7 ± 0.2‰) [56], and the Hg concentrations in the skin were about twice higher in the seal-eaters than in the fish-eaters (Andvik et al. 2020). In the current study, the δ15N levels as well as the δ13C and BL levels in mature animals from SNH (ecotype unidentified) approximated those from AKW samples (transient ecotype), with slightly higher Hg concentrations in muscle and liver tissues. This suggests that the SNH samples are likely to include the samples taken from transient ecotypes.
The Hg concentrations in muscle samples from small calves (SNH 16006 and SNH 16033) were slightly higher than those of large calves (AKW 3, AKW 7, and AKW 8). Similar phenomena have been reported in the calves of striped dolphins [57,58] and humpback whales [7]. The higher Hg concentrations in small calves (neonates) could be explained by the transfer of methylmercury across the placenta, and the lower Hg concentrations in large calves can be explained by the suckling of milk containing trace concentrations of Hg [57,59] and the growth dilution effect [57].
The marine mammal-eating type of killer whale could have higher Hg contamination and δ15N levels than the fish-eating type [21,56]. However, these comparisons have not been investigated between both types of calves. In the current study, the Hg concentrations in muscle samples were higher in small calves (SNH samples, ecotype unidentified) than in large calves (AKW samples, transient ecotype), whereas the δ15N levels were lower in small calves than in large calves. Further studies focusing on the Hg load across placenta and the δ15N levels are needed to increase the number of ecotype-identified calves.

5. Conclusions

The δ15N- and δ13C-enriched peaks were found in muscle and liver samples from killer whale calves because of extensive nursing and subsequent weaning.
The δ18O-depleted peaks were found in muscle and liver samples from calves, probably because of the consumption of δ18O-depleted milk and weaning foods. The decrease in δ18O values during the lactation period was found in common minke whale calves, similar to killer whale calves.
The δ13C and δ15N values were higher in liver samples than in muscle samples of mature killer whales. By contrast, the δ13C and δ15N values in calves were similar between liver and muscle tissues, probably because of the higher metabolic rate of calves, which are rapidly growing animals.
The Hg concentrations in muscle tissues were slightly higher in small calves than in large calves, probably due to the Hg transfer across placenta. The Hg concentrations in two liver samples from mature animals exceeded the high-risk threshold for marine mammal health effects (82 μg/wet g).

Author Contributions

T.E.: Conceptualization, Investigation, Data curation, Methodology, Writing—original draft, Writing—review and editing. O.K.: Methodology, Data curation. M.T.: Methodology, Data curation. Y.F.: Formal analysis, Writing—review and editing. K.H.: Funding acquisition, Writing—review and editing. Y.K.: Methodology, Writing—review and editing. All authors have read and agreed to the published version of the manuscript.

Funding

This work was supported by JSPS KAKENHI (grant number 20K12188, K.H.).

Institutional Review Board Statement

Not applicable.

Informed Consent Statement

Not applicable.

Data Availability Statement

Not applicable.

Acknowledgments

We would like to thank the Stranding Network Hokkaido (SNH) for providing samples and information on the stranded whales studied in this study. We would like to thank Aquatic Mammals for granting permission to use Figure 4 from Endo et al. [6].

Conflicts of Interest

The authors declare that there are no conflicts of interest.

References

  1. Endo, T.; Kobayashi, M. Typical changes in carbon and nitrogen stable isotope ratios and mercury concentration during the lactation of marine mammals. In Marine Mammals; Kaoud, H.A.E., Ed.; IntechOpen: London, UK, 2022; ISBN 978-1-80355-490-7. [Google Scholar]
  2. Fuller, B.; Fuller, J.; Harris, D.; Hedges, R. Detection of breastfeeding and weaning in modern human infants with carbon and nitrogen stable isotope ratios. Am. J. Phys. Anthr. 2006, 129, 279–293. [Google Scholar] [CrossRef] [PubMed]
  3. Newsome, S.D.; Koch, P.L.; Etnier, M.A.; Aurioles-Gamboa, D. Using Carbon and nitrogen isotope values to investigate maternal strategies in northeast pacific otariids. Mar. Mammal Sci. 2006, 22, 556–572. [Google Scholar] [CrossRef]
  4. Borrell, A.; Gómez-Campos, E.; Aguilar, A. Influence of Reproduction on Stable-Isotope Ratios: Nitrogen and Carbon Isotope Discrimination between Mothers, Fetuses, and Milk in the Fin Whale, a Capital Breeder. Physiol. Biochem. Zool. 2016, 89, 41–50. [Google Scholar] [CrossRef] [PubMed]
  5. Vales, D.; Cardona, L.; García, N.; Zenteno, L.; Crespo, E. Ontogenetic dietary changes in male South American fur seals Arctocephalus australis in Patagonia. Mar. Ecol. Prog. Ser. 2015, 525, 245–260. [Google Scholar] [CrossRef]
  6. Endo, T.; Kimura, O.; Terasaki, M.; Kobayashi, M. Body length, stable carbon, and nitrogen isotope ratios and mercury levels in common minke whales (Balaenoptera acutorostrata) stranded along the coast of Hokkaido, Japan. Aquat. Mamm. 2021, 47, 86–95. [Google Scholar] [CrossRef]
  7. Endo, T.; Terasaki, M.; Kimura, O. Stable isotope ratios of carbon, nitrogen, oxygen, and mercury concentrations in north pacific baleen whales and the comparison of their calves with toothed whale calves. J. Veter.-Sci. Med. 2022, 10, 1–10. [Google Scholar] [CrossRef]
  8. Oftedal, O.T. Lactation in Whales and Dolphins: Evidence of Divergence Between Baleen- and Toothed-Species. J. Mammary Gland. Biol. Neoplasia 1997, 2, 205–230. [Google Scholar] [CrossRef] [PubMed]
  9. Tsutaya, T.; Yoneda, M. Reconstruction of breastfeeding and weaning practices using stable isotope and trace element analyses: A review. Am. J. Phys. Anthr. 2015, 156, 2–21. [Google Scholar] [CrossRef]
  10. Oftedal, O.T. Milk of marine mammals. In Encyclopedia of Dairy Sciences, 2nd ed.; Fuquay, J.W., Ed.; Academic Press: Cambridge, MA, USA, 2011; pp. 563–580. [Google Scholar] [CrossRef]
  11. Kalish, J.M. 13C and 18O isotopic disequilibria in fish otoliths: Metabolic and kinetic effects. Mar. Ecol. Prog. Ser. 1991, 75, 191–203. [Google Scholar] [CrossRef]
  12. Clementz, M.T.; Koch, P.L. Differentiating aquatic mammal habitat and foraging ecology with stable isotopes in tooth enamel. Oecologia 2001, 129, 461–472. [Google Scholar] [CrossRef]
  13. Liu, A.G.S.C.; Seiffert, E.R.; Simons, E.L. Stable isotope evidence for an amphibious phase in early proboscidean evolution. Proc. Natl. Acad. Sci. USA 2008, 105, 5786–5791. [Google Scholar] [CrossRef]
  14. Newsome, S.D.; Clementz, M.T.; Koch, P.L. Using stable isotope biogeochemistry to study marine mammal ecology. Mar. Mammal Sci. 2010, 26, 509–572. [Google Scholar] [CrossRef]
  15. Lin, H.-Y.; Shiao, J.-C.; Chen, Y.-G.; Iizuka, Y. Ontogenetic vertical migration of grenadiers revealed by otolith microstructures and stable isotopic composition. Deep. Sea Res. Part I Oceanogr. Res. Pap. 2012, 61, 123–130. [Google Scholar] [CrossRef]
  16. Matthews, C.J.D.; Longstaffe, F.J.; Ferguson, S.H. Dentine oxygen isotopes (δ18O) as a proxy for odontocete distributions and movements. Ecol. Evol. 2016, 6, 4643–4653. [Google Scholar] [CrossRef]
  17. Matthews, C.J.D.; Longstaffe, F.J.; Lawson, J.W.; Ferguson, S.H. Distributions of Arctic and Northwest Atlantic killer whales inferred from oxygen isotopes. Sci. Rep. 2021, 11, 6739. [Google Scholar] [CrossRef]
  18. Camin, F.; Bontempo, L.; Perini, M.; Piasentier, E. Stable Isotope Ratio Analysis for Assessing the Authenticity of Food of Animal Origin. Compr. Rev. Food Sci. Food Saf. 2016, 15, 868–877. [Google Scholar] [CrossRef]
  19. Yoshida, N.; Miyazaki, N. Oxygen isotope correlation of cetacean bone phosphate with environmental water. J. Geophys. Res. Ocean. 1991, 96, 815–820. [Google Scholar] [CrossRef]
  20. Wright, L.E.; Schwarcz, H.P. Stable carbon and oxygen isotopes in human tooth enamel: Identifying breastfeeding and weaning in prehistory. Am. J. Physiol. Anthropol. 1998, 106, 1–18. [Google Scholar] [CrossRef]
  21. Andvik, C.; Jourdain, E.; Ruus, A.; Lyche, J.L.; Karoliussen, R.; Borgå, K. Preying on seals pushes killer whales from Norway above pollution effects thresholds. Sci. Rep. 2020, 10, 11888. [Google Scholar] [CrossRef]
  22. Power, M.; Klein, G.M.; Guiguer, K.R.R.A.; Kwan, M.K.H. Mercury accumulation in the fish community of a sub-Arctic lake in relation to trophic position and carbon sources. J. Appl. Ecol. 2002, 39, 819–830. [Google Scholar] [CrossRef]
  23. Chouvelon, T.; Spitz, J.; Caurant, F.; Mèndez-Fernandez, P.; Autier, J.; Lassus-Débat, A.; Chappuis, A.; Bustamante, P. Enhanced bioaccumulation of mercury in deep-sea fauna from the Bay of Biscay (north-east Atlantic) in relation to trophic positions identified by analysis of carbon and nitrogen stable isotopes. Deep. Sea Res. Part I Oceanogr. Res. Pap. 2012, 65, 113–124. [Google Scholar] [CrossRef]
  24. Chouvelon, T.; Caurant, F.; Cherel, Y.; Simon-Bouhet, B.; Spitz, J.; Bustamante, P. Species- and size-related patterns in stable isotopes and mercury concentrations in fish help refine marine ecosystem indicators and provide evidence for distinct management units for hake in the Northeast Atlantic. ICES J. Mar. Sci. 2014, 71, 1073–1087. [Google Scholar] [CrossRef]
  25. Pethybridge, H.; Butler, E.; Cossa, D.; Daley, R.; Boudou, A. Trophic structure and biomagnification of mercury in an assemblage of deepwater chondrichthyans from southeastern Australia. Mar. Ecol. Prog. Ser. 2012, 451, 163–174. [Google Scholar] [CrossRef]
  26. Honda, K. Contamination of heavy metals in marine mammals. In Biology of Marine Mammals; Miyazaki, N., Kasuya, T., Eds.; Scientist Inc.: Tokyo, Japan, 1990; pp. 242–253. [Google Scholar]
  27. Endo, T.; Kimura, O.; Hisamichi, Y.; Minoshima, Y.; Haraguchi, K. Age-dependent accumulation of heavy metals in a pod of killer whales (Orcinus orca) stranded in the northern area of Japan. Chemosphere 2007, 67, 51–59. [Google Scholar] [CrossRef] [PubMed]
  28. Endo, T.; Hisamichi, Y.; Kimura, O.; Haraguchi, K.; Baker, C.S. Contamination levels of mercury and cadmium in melon-headed whales (Peponocephala electra) from a mass stranding on the Japanese coast. Sci. Total. Environ. 2008, 401, 73–80. [Google Scholar] [CrossRef] [PubMed]
  29. Sakamoto, M.; Itai, T.; Murata, K. Effects of Prenatal Methylmercury Exposure: From Minamata Disease to Environmental Health Studies. Nippon. Eiseigaku Zasshi Jpn. J. Hyg. 2017, 72, 140–148. [Google Scholar] [CrossRef] [PubMed]
  30. Nielsen, M.L.K.; Ellis, S.; Towers, J.R.; Doniol-Valcroze, T.; Franks, D.W.; Cant, M.A.; Weiss, M.N.; Johnstone, R.A.; Balcomb, K.C., 3rd; Ellifrit, D.K.; et al. A long postreproductive life span is a shared trait among genetically distinct killer whale populations. Ecol. Evol. 2021, 11, 9123–9136. [Google Scholar] [CrossRef] [PubMed]
  31. Ciner, B.; Wang, Y.; Parker, W. Oxygen isotopic variations in modern cetacean teeth and bones: Implications for ecological, paleoecological, and paleoclimatic studies. Sci. Bull. 2016, 61, 92–104. [Google Scholar] [CrossRef]
  32. Morin, P.A.; Archer, F.I.; Foote, A.D.; Vilstrup, J.; Allen, E.E.; Wade, P.; Durban, J.; Parsons, K.; Pitman, R.; Li, L.; et al. Complete mitochondrial genome phylogeographic analysis of killer whales (Orcinus orca) indicates multiple species. Genome Res. 2010, 20, 908–916. [Google Scholar] [CrossRef]
  33. Mitani, Y.; Kita, Y.F.; Saino, S.; Yoshioka, M.; Ohizumi, H.; Nakahara, F. Mitochondrial DNA haplotypes of killer whales around Hokkaido, Japan. Mammal Study 2021, 46, 205–211. [Google Scholar] [CrossRef]
  34. Endo, T.; Kimura, O.; Sato, R.; Kobayashi, M.; Matsuda, A.; Matsuishi, T.; Haraguchi, K. Stable isotope ratios of carbon, nitrogen and oxygen in killer whales (Orcinus orca) stranded on the coast of Hokkaido, Japan. Mar. Pollut. Bull. 2014, 86, 238–243. [Google Scholar] [CrossRef] [PubMed]
  35. Kastelein, R.A.; Kershaw, J.; Berghout, E.; Wiepkema, P.R. Food consumption and suckling in Killer whales. Int. Zoo Yearb. 2003, 38, 204–218. [Google Scholar] [CrossRef]
  36. Kasuya, T. Biology and Conservation of Small Cetaceans around Japan; University of Tokyo Press: Tokyo, Japan, 2019; ISBN 978-4-13-060238-9. [Google Scholar]
  37. Heyning, J.E. Presence of solid food in a young calf killer whale (Orcinus orca). Mar. Mamm. Sci. 1988, 4, 68–71. [Google Scholar] [CrossRef]
  38. Clark, S.T.; Odell, D.K.; Lacinak, C.T. Aspects of growth in captive killer whales (Orcinus orca). Mar. Mammal Sci. 2000, 16, 110–123. [Google Scholar] [CrossRef]
  39. Newsome, S.; Etnier, M.; Monson, D.; Fogel, M. Retrospective characterization of ontogenetic shifts in killer whale diets via δ13C and δ15N analysis of teeth. Mar. Ecol. Prog. Ser. 2009, 374, 229–242. [Google Scholar] [CrossRef]
  40. Logan, J.M.; Lutcavage, M.E. A comparison of carbon and nitrogen stable isotope ratios of fish tissues following lipid extractions with non-polar and traditional chloroform/methanol solvent systems. Rapid Commun. Mass Spectrom. 2008, 22, 1081–1086. [Google Scholar] [CrossRef] [PubMed]
  41. Ogasawara, H.; Hayasaka, M.; Maemoto, A.; Furukawa, S.; Ito, T.; Kimura, O.; Endo, T. Stable isotope ratios of carbon, nitrogen and selenium concentration in the scalp hair of Crohn’s disease patients who ingested the elemental diet Elental®. Rapid Commun. Mass Spectrom. 2018, 33, 41–48. [Google Scholar] [CrossRef] [PubMed]
  42. Baird, R.W. Killer Whales of the World: Natural History and Conservation; Voyager Press: McGregor, MN, USA, 2002. [Google Scholar]
  43. Dietz, R.; Letcher, R.J.; Desforges, J.-P.; Eulaers, I.; Sonne, C.; Wilson, S.; Andersen-Ranberg, E.; Basu, N.; Barst, B.D.; Bustnes, J.O.; et al. Current state of knowledge on biological effects from contaminants on arctic wildlife and fish. Sci. Total. Environ. 2019, 696, 133792. [Google Scholar] [CrossRef]
  44. de Armas, Y.C.; Mavridou, A.-M.; Domínguez, J.G.; Hanson, K.; Laffoon, J. Tracking breastfeeding and weaning practices in ancient populations by combining carbon, nitrogen and oxygen stable isotopes from multiple non-adult tissues. PLoS ONE 2022, 17, e0262435. [Google Scholar] [CrossRef]
  45. O’Sullivan, R.; Schmidt, O.; Monahan, F.J. Stable isotope ratio analysis for the authentication of milk and dairy ingredients: A review. Int. Dairy J. 2021, 126, 105268. [Google Scholar] [CrossRef]
  46. Yamamoto, M.; Tanaka, N.; Tsunogai, S. Okhotsk Sea intermediate water formation deduced from oxygen isotope systematics. J. Geophys. Res. Oceans 2001, 106, 31075–31084. [Google Scholar] [CrossRef]
  47. Oda, M.; Tetsu, T.; Sakai, S.; Ishimura, T. Discrimination of the migration for Japanese sardine in Pacific stock by using mi-croscale stable isotopic analytical technique. Bull. Jpn. Scoc. Fish Oceanogr. 2016, 80, 48–55. [Google Scholar]
  48. Boecklen, W.J.; Yarnes, C.T.; Cook, B.A.; James, A.C. On the Use of Stable Isotopes in Trophic Ecology. Annu. Rev. Ecol. Evol. Syst. 2011, 42, 411–440. [Google Scholar] [CrossRef]
  49. O’Brien, D.M. Stable Isotope Ratios as Biomarkers of Diet for Health Research. Annu. Rev. Nutr. 2015, 35, 565–594. [Google Scholar] [CrossRef] [PubMed]
  50. Trueman, C.N.; McGill, R.A.R.; Guyard, P.H. The effect of growth rate on tissue-diet isotopic spacing in rapidly growing animals. An experimental study with Atlantic salmon (Salmo salar). Rapid Commun. Mass Spectrom. 2005, 19, 3239–3247. [Google Scholar] [CrossRef] [PubMed]
  51. Zanden, M.J.; Clayton, M.K.; Moody, E.K.; Solomon, C.T.; Weidel, B.C. Stable Isotope Turnover and Half-Life in Animal Tissues: A Literature Synthesis. PLoS ONE 2015, 10, e0116182. [Google Scholar] [CrossRef] [PubMed]
  52. Caut, S.; Angulo, E.; Courchamp, F. Variation in discrimination factors (Δ15N and Δ13C): The effect of diet isotopic values and applications for diet reconstruction. J. Appl. Ecol. 2009, 46, 443–453. [Google Scholar] [CrossRef]
  53. Drago, M.; Franco-Trecu, V.; Cardona, L.; Inchausti, P. Diet-to-female and female-to-pup isotopic discrimination in South American sea lions. Rapid Commun. Mass Spectrom. 2015, 29, 1513–1520. [Google Scholar] [CrossRef] [PubMed]
  54. Borrell, A.; Abad-Oliva, N.; Gómez-Campos, E.; Giménez, J.; Aguilar, A. Discrimination of stable isotopes in fin whale tissues and application to diet assessment in cetaceans. Rapid Commun. Mass Spectrom. 2012, 26, 1596–1602. [Google Scholar] [CrossRef]
  55. Honda, K.; Tatsukawa, R.; Itano, K.; Miyazaki, N.; Fujiyama, T. Heavy metal concentrations in muscle, liver and kidney tissue of striped dolphin, Stenella coeruleoalba, and their variations with body length, weight, age and sex. Agric. Biol. Chem. 1983, 47, 1219–1228. [Google Scholar] [CrossRef]
  56. Jourdain, E.; Andvik, C.; Karoliussen, R.; Ruus, A.; Vongraven, D.; Borgå, K. Isotopic niche differs between seal and fish-eating killer whales (Orcinus orca) in northern Norway. Ecol. Evol. 2020, 10, 4115–4127. [Google Scholar] [CrossRef] [PubMed]
  57. Itano, K.; Kawai, S.; Miyazaki, N.; Tatsukawa, R.; Fujiyama, T. Mercury and selenium levels at the fetal and suckling stages of striped dolphin, Stenella coeruleoalba. Agric. Biol. Chem. 1984, 48, 1691–1698. [Google Scholar] [CrossRef]
  58. Endo, T.; Kimura, O.; Terasaki, M.; Nakagun, S.; Kato, Y.; Fujii, Y.; Haraguchi, K.; Baker, C.S. Carbon, nitrogen, and oxygen stable isotope ratios of striped dolphins and short-finned pilot whales stranded in Hokkaido, northern Japan, compared with those of other cetaceans stranded and hunted in Japan. Isot. Environ. Health Stud. 2023, 59, 230–247. [Google Scholar] [CrossRef] [PubMed]
  59. Caon, G.; Secchi, E.R.; Capp, E.; Kucharski, L.C. Milk composition of franciscana dolphin (Pontoporia blainvillei) from Rio Grande do Sul, southern Brazil. J. Mar. Biol. Assoc. United Kingd. 2008, 88, 1099–1101. [Google Scholar] [CrossRef]
Figure 1. Map showing the stranding locations of AKW and SNH killer whales.
Jmse 12 00623 g001
Figure 2. Relationship between body length and either δ15N values, δ13C values, δ18O values or Hg concentrations in the muscle of calves (Jmse 12 00623 i001), lactating female (Jmse 12 00623 i002), non-lactating females (Jmse 12 00623 i003) and mature males (Jmse 12 00623 i004) of killer whales.
Jmse 12 00623 g002
Figure 3. Differences in δ15N values, δ13C values and δ18O values between liver and muscle samples of killer whale calves (Jmse 12 00623 i001), lactating female (Jmse 12 00623 i002), non-lactating females (Jmse 12 00623 i003), and mature males (Jmse 12 00623 i004).
Jmse 12 00623 g003
Figure 4. Relationship between body length and either δ15N values, δ13C values or δ18O values in the muscle samples of common minke whale calves (Jmse 12 00623 i001), mature males (Jmse 12 00623 i004), and mature females (Jmse 12 00623 i002). The upper figures showing δ15N and δ13C values were reprinted from Endo et al. [6] with permission from Aquatic Mammals.
Jmse 12 00623 g004
Table 1. Stable isotope ratios of carbon, nitrogen and oxygen and mercury concentrations in muscle and liver of killer whales stranded along the coast of Hokkaido, Japan. Data from SNH16006, SNH16035, SNH16008 and SNH17011 were added to previous data (Endo et al. [34]).
MuscleLiver
Body Length
(m)
Age
(y)
δ13C
(‰)
δ15N
(‰)
δ18O
(‰)
Hg
(μg/
wet g)
δ13C
(‰)
δ15N
(‰)
δ18O
(‰)
Hg
(μg/
wet g)
SNH16006 *Calf male2.2<1−18.217.816.30.22NDNDNDND
SNH16035 *Calf female2.3<1−18.316.915.90.21−18.317.216.00.48
AKW3 **Calf male a2.7<1−16.718.112.40.10−16.618.612.60.30
AKW8 **Calf female b2.7<1−16.918.112.30.08−16.718.713.40.50
AKW7 **Calf female c3.0<1−16.818.211.90.07−16.618.713.30.30
SNH12015 **Weaning calf d3.83−19.315.115.50.52−19.315.417.62.36
AKW2 **Mature female e5.613−17.216.013.11.27−16.818.213.057.4
SNH16008 *Mature female5.7ND−17.515.814.21.68NDNDNDND
SNH10055 **Mature female5.8ND−18.216.515.02.45−18.018.014.4107.6
AKW6 **Mature female f6.017−17.116.412.71.06−16.819.213.738.0
AKW9 **Mature female g6.529−17.216.512.01.26−16.719.213.462.4
AKW4 **Mature female6.624−17.116.812.71.25−15.919.111.755.4
AKW5 **Mature female6.959−17.016.412.51.30−16.318.612.097.8
SNH10057 **Mature male7.0ND−18.015.915.03.24−17.117.317.253.3
SNH17011 *Mature male7.1ND−17.716.313.52.03−17.018.513.741.0
AKW1 **Mature male7.734−16.917.013.11.46−16.518.812.735.1
N.D.; not detected; a Suckling, no mother among AKW. b Suckling, calf of AKW9. c Suckling, calf of AKW6. d Corrected from the juvenile female and age 2 (Endo et al. [34]) to the weaning calf and age 3. e Lactating, no calf among AKW. f Lactating, mother of AKW7. g Lactating, mother of AKW8; * Current study ** Endo et al. [34].
Table 2. Stable isotope ratio of oxygen in muscle of common minke whales stranded in Hokkaido, Japan.
SamplesBLδ18Oδ13C *δ15N *Hg *
(m)(‰)(‰)(‰)(μg/wet g)
12.6 (C)13.0−9.111.20.03
23.0 (C)13.8−19.112.10.01
33.9 (C)12.2−18.813.70.04
44.1 (C)13.4−18.513.00.01
54.1 (C)13.2−19.013.40.02
64.4 (C)12.9−19.612.00.06
74.5 (C)13.1−19.713.80.02
84.6 (C)11.9−20.012.70.01
94.7 (C)13.0−19.612.40.07
104.8 (C)12.0−19.012.80.02
114.9 (C)12.0−19.211.40.06
125.0 (C) 12.8−18.312.90.03
137.2 (M)11.9−19.011.50.12
147.4 (M)12.8−18.410.80.11
157.6 (F)12.5−18.712.30.14
167.7 (M)12.8−18.611.80.13
177.7 (F)13.0−18.912.20.15
187.9 (F)11.8−18.912.40.07
199.5 (M)12.0−18.911.50.17
2010.2 (F)11.8−19.212.40.18
* The δ13C and δ15N values and Hg concentration in muscle were quoted from the previous report (Endo et al. [6]). C; calf, M; male mature animal, F; female mature animal.
Table 3. Stable isotope ratios of carbon, nitrogen, and oxygen in muscle and liver samples of calves and mature animals from killer whales.
δ13C (‰)δ15N (‰)δ18O (‰)
CalvesMuscle (n = 6)−17.7 ± 1.117.4 ± 1.214.1 ± 2.1
Liver (n = 5)−17.5 ± 1.217.7 ± 1.414.6 ± 2.1
Mature animalsMuscle (n =10)−17.4 ± 0.416.4 ± 0.413.4 ± 1.0
Liver (n = 9)−16.8 ± 0.618.5 ± 0.6 *13.5 ± 1.6
* Significantly different from muscle samples (p < 0.01).
Table 4. Comparison of mercury concentrations in liver and δ15N values in muscle of cetaceans inhabiting waters around Hokkaido.
SpeciesHg concentration in Liver
(μg/wet g)
δ15N in Muscle
(‰)
Killer whale (mature animals) of this study60.9 ± 25.6 (n = 9) a16.4 ± 0.4 (n = 10) a
all animals of this study39.4 ± 36.0 (n = 16) a16.7 ± 0.9 (n = 16) a
Dall’s porpoises (Phocoenoides dalli)8.62 ± 10.60 (n = 52) b13.1 ± 0.9 (n = 56) b
Harbor porpoises (Phocoena phocoena)6.80 ± 14.9 (n = 45) b13.2 ± 1.0 (n = 49) b
Spotted seals (Phoca largha)1.93 and 0.34 b14.5 and 15.1 b
Harbor seals (Phoca vitulina)2.96 ± 3.26 (n = 32) b15.6 ± 0.52 (n = 32) b
Common minke whales (Balaenoptera acutorostrata)0.103 ± 0.100 (n = 8) b12.3 ± 0.8 (n = 20) c
a Current study, b Our unpublished data, c Endo et al. [6].
Disclaimer/Publisher’s Note: The statements, opinions and data contained in all publications are solely those of the individual author(s) and contributor(s) and not of MDPI and/or the editor(s). MDPI and/or the editor(s) disclaim responsibility for any injury to people or property resulting from any ideas, methods, instructions or products referred to in the content.

