
Long-Term Spatiotemporal Characteristics of Ulva prolifera Green Tide and Effects of Environmental Drivers on Its Monitoring by Satellites: A Case Study in the Yellow Sea, China, from 2008 to 2023

 ,
,
Abstract
1. Introduction
2. Materials and Methods
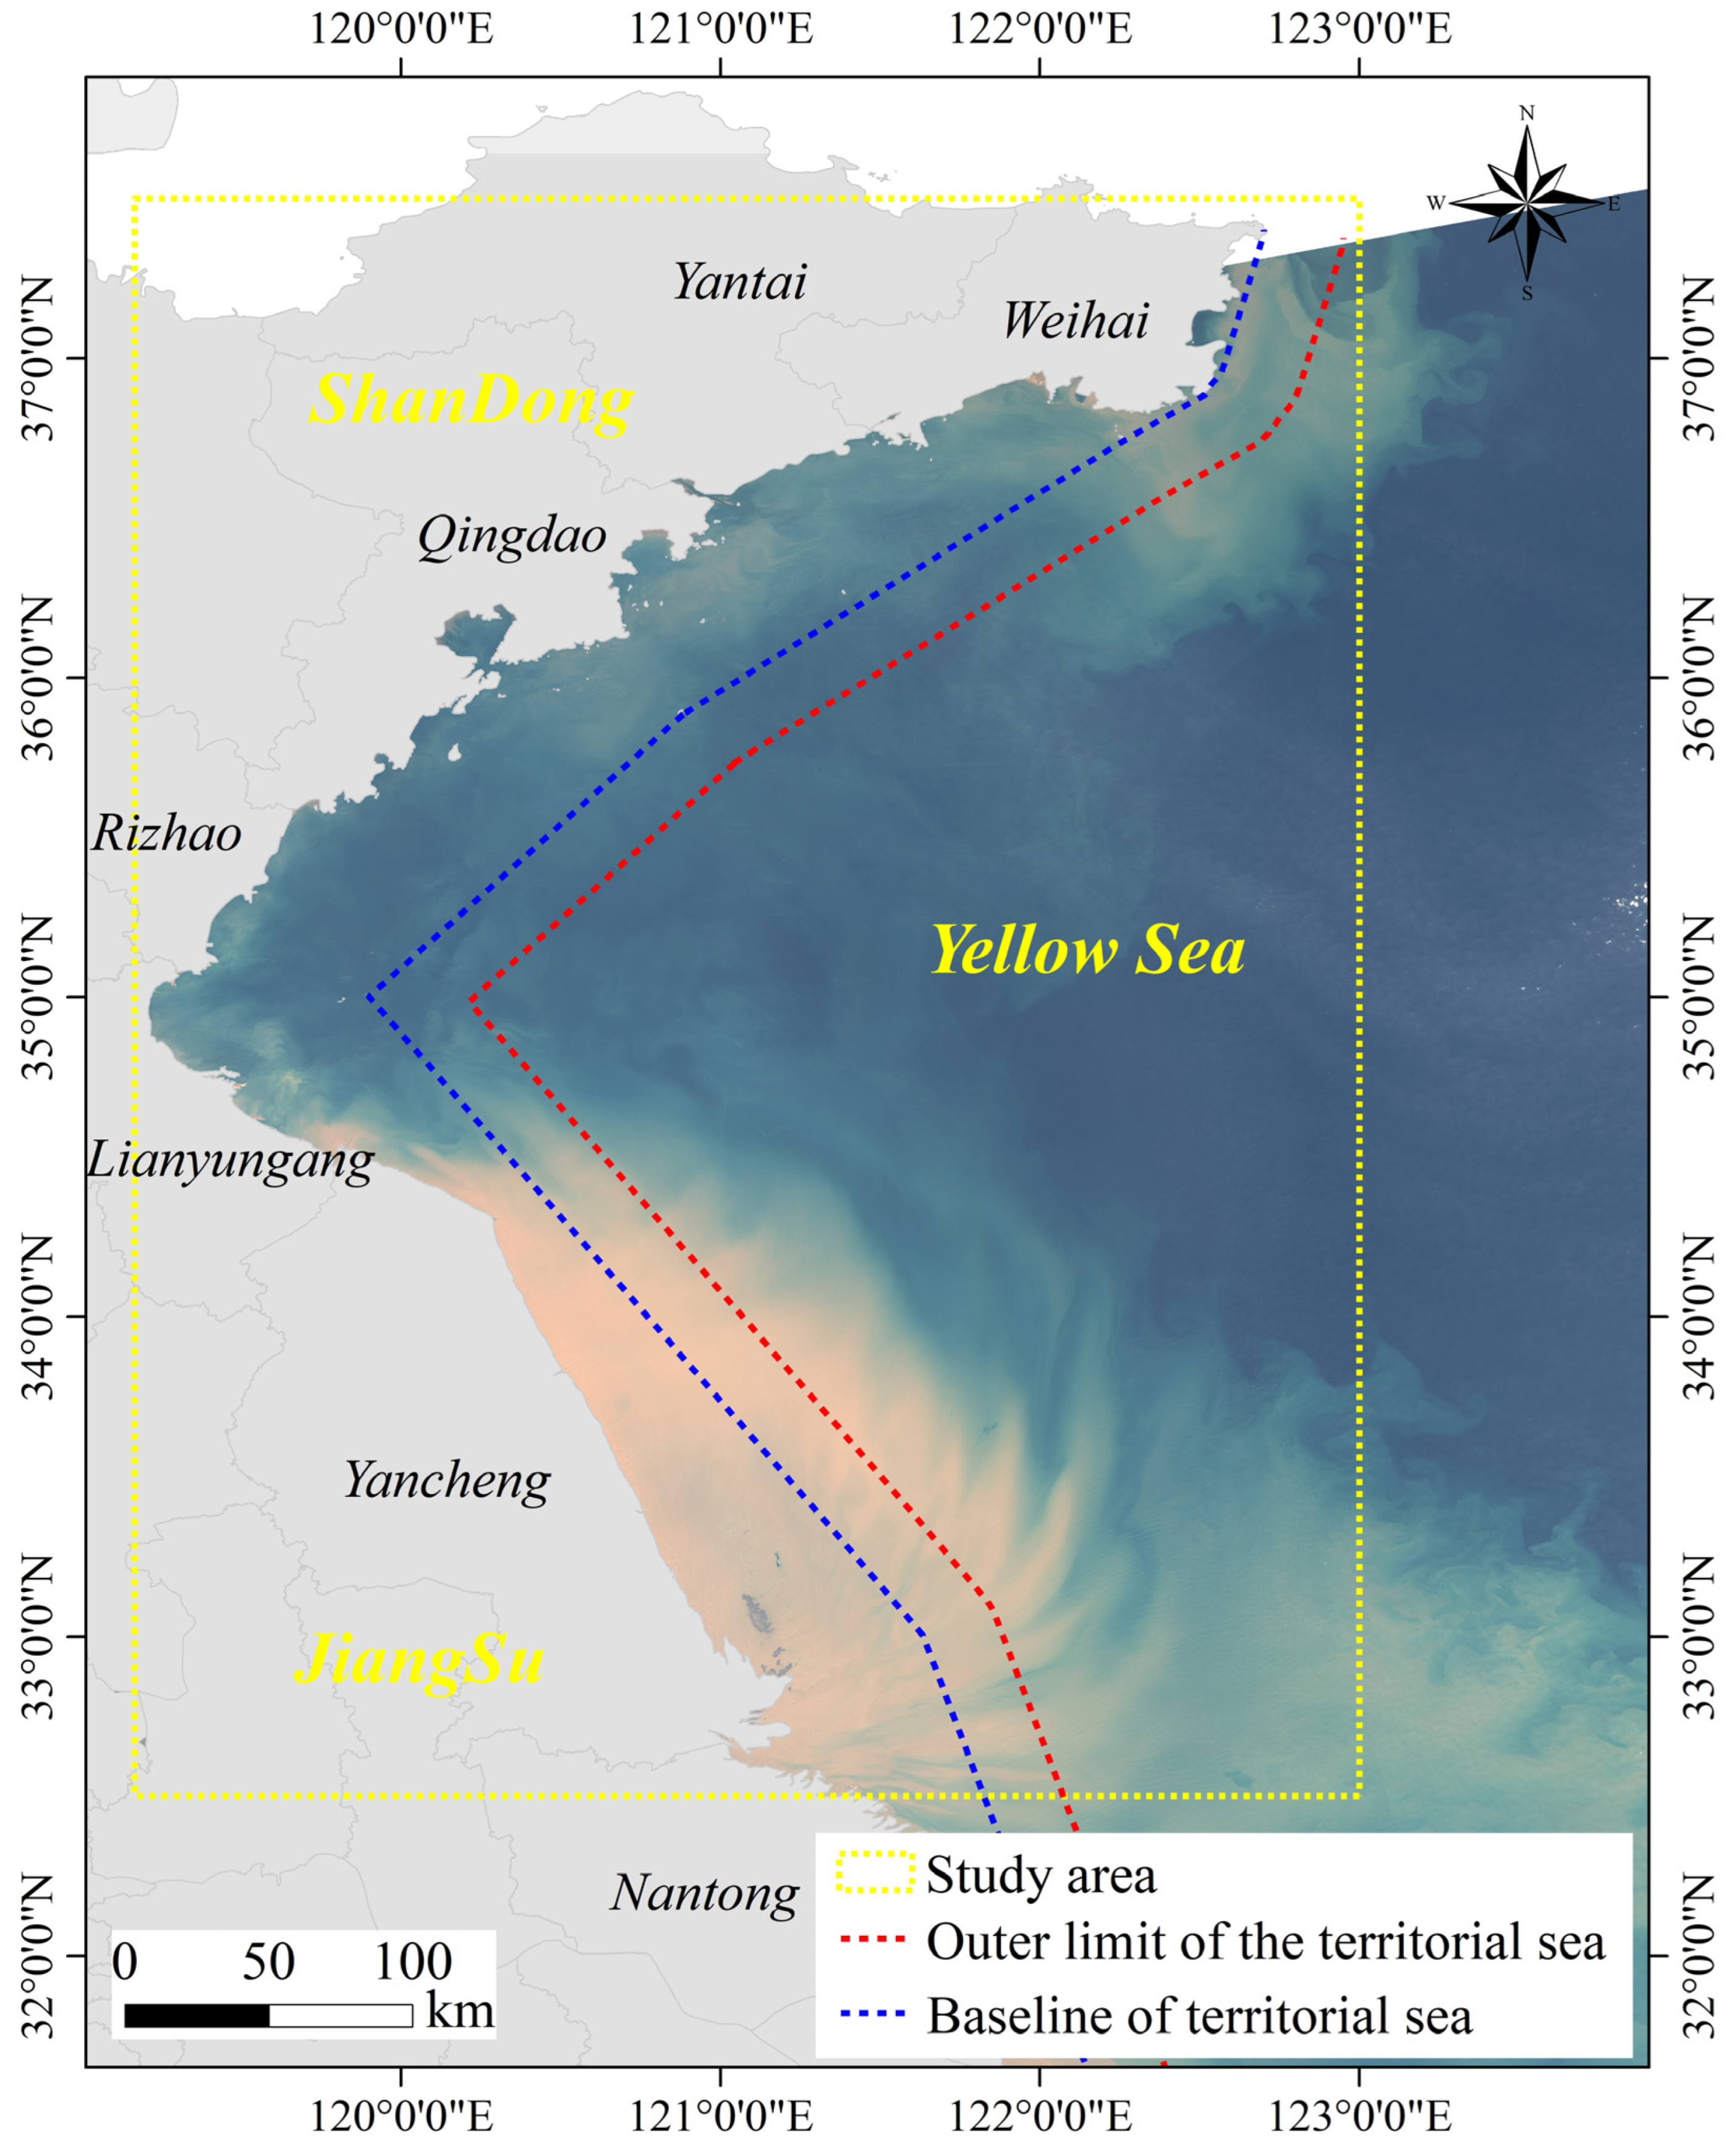
2.1. Study Area
2.2. Data Source
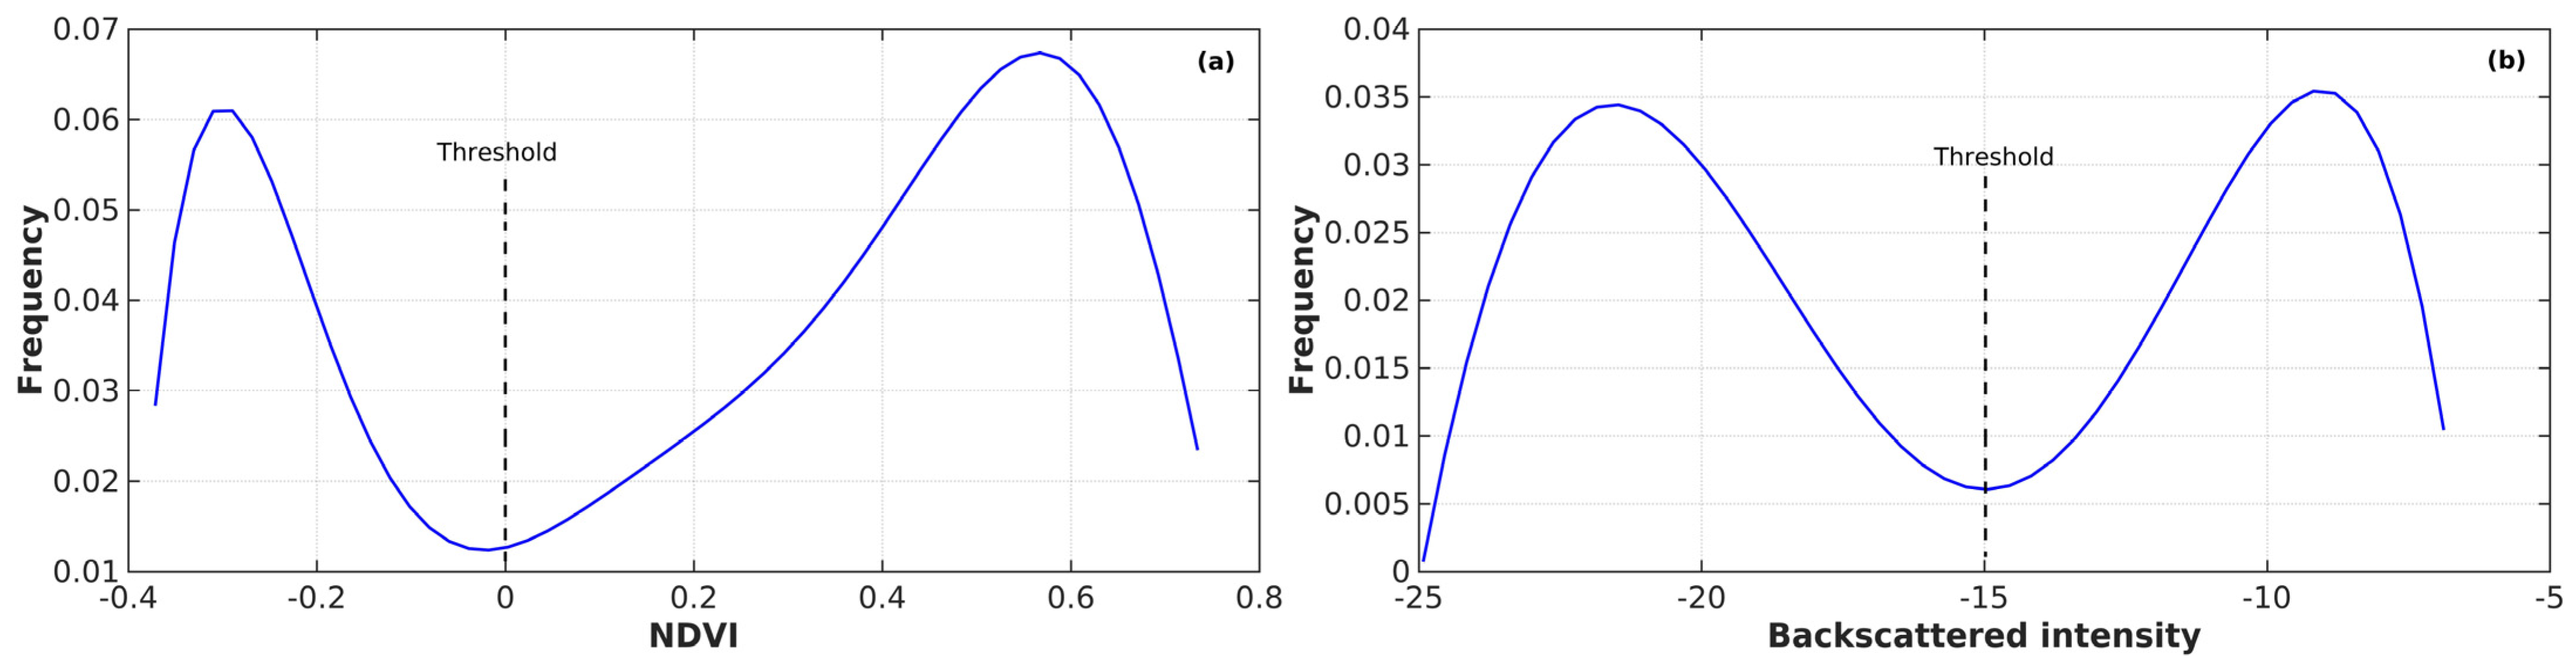
2.3. Method
2.4. Area Calculation
3. Results and Discussion
3.1. Temporal Distribution Characteristics
- (1)
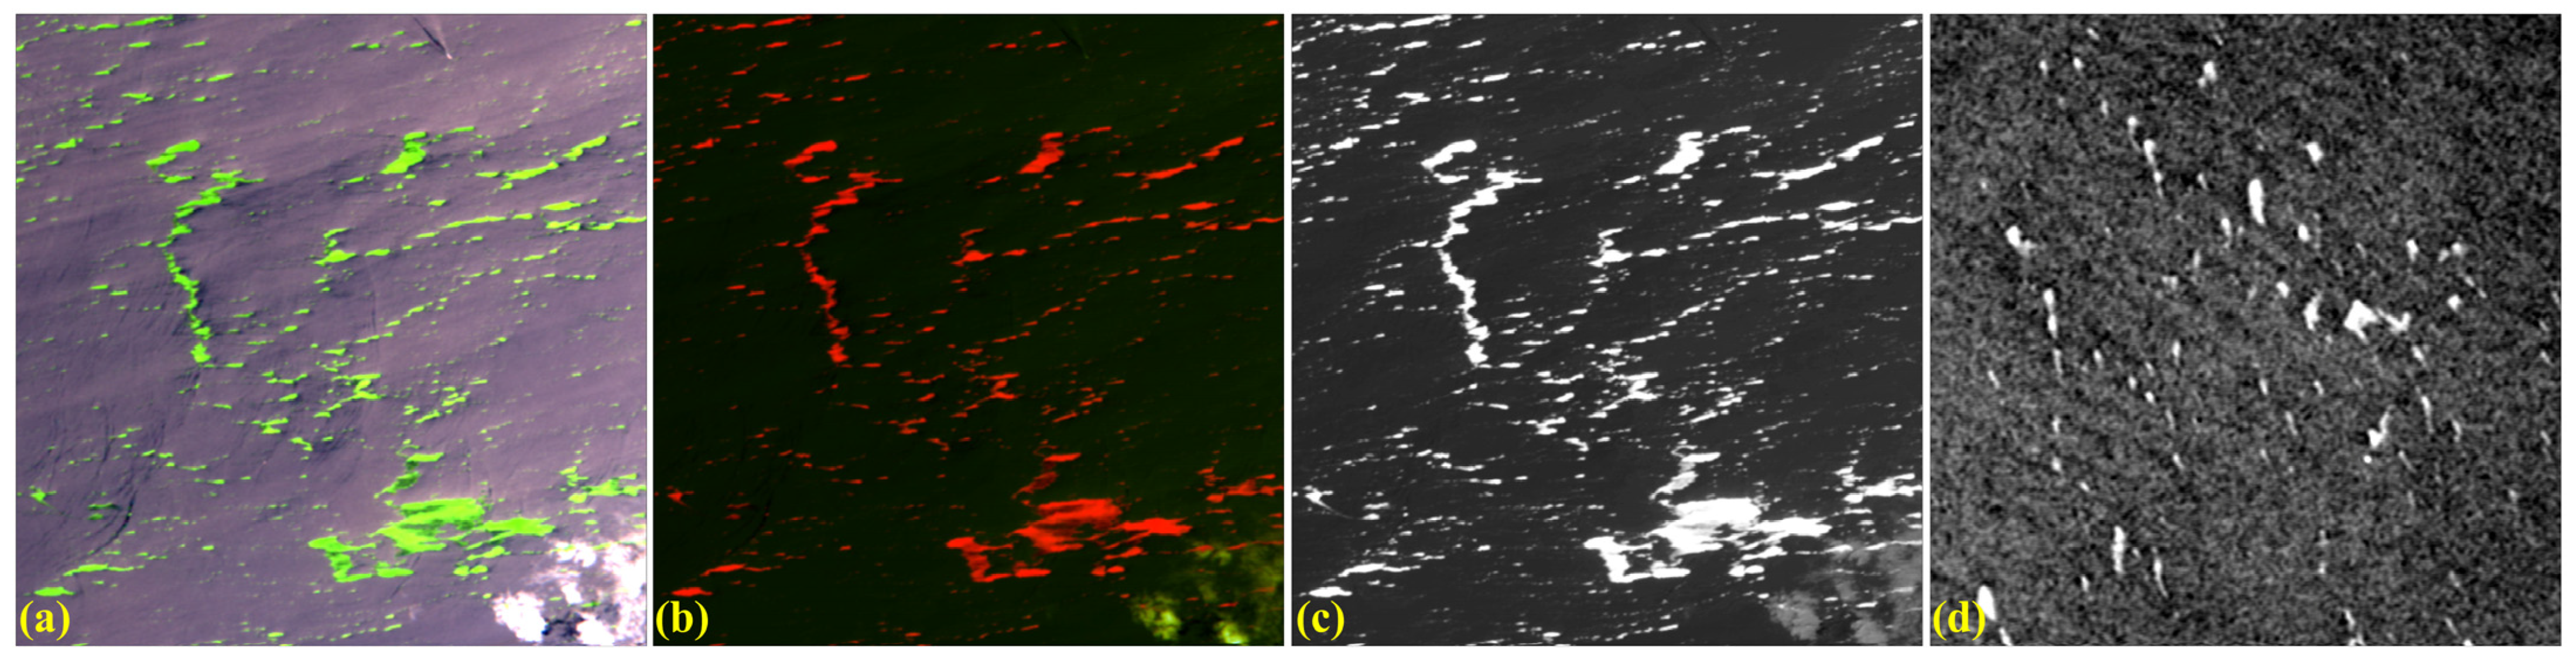
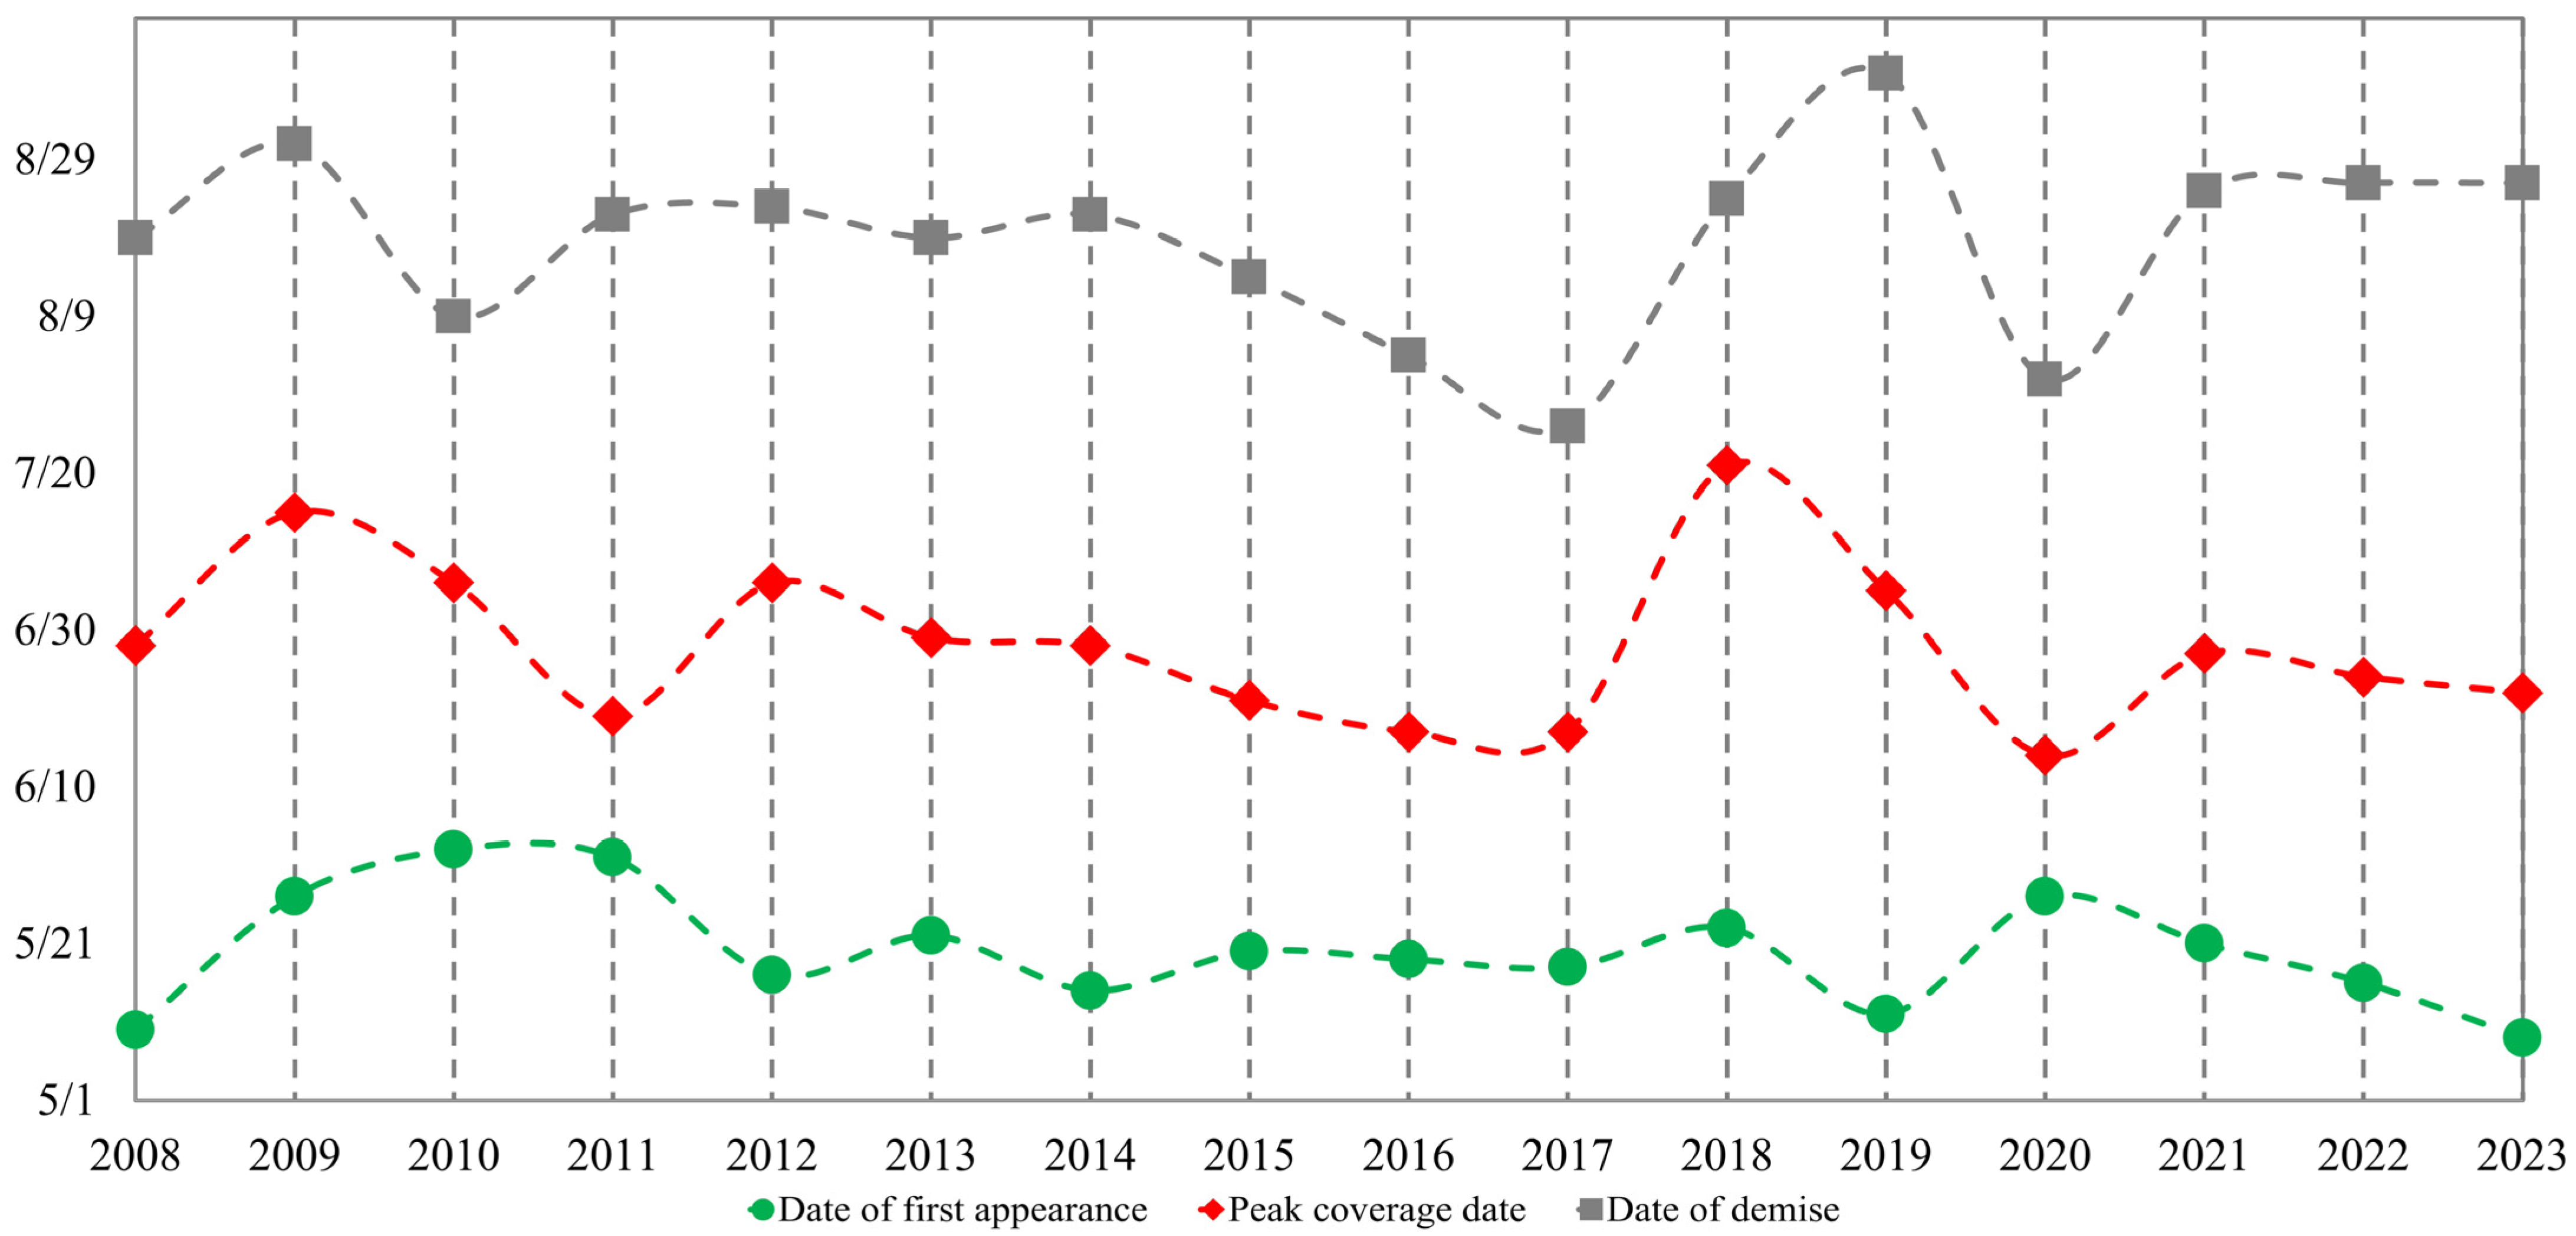
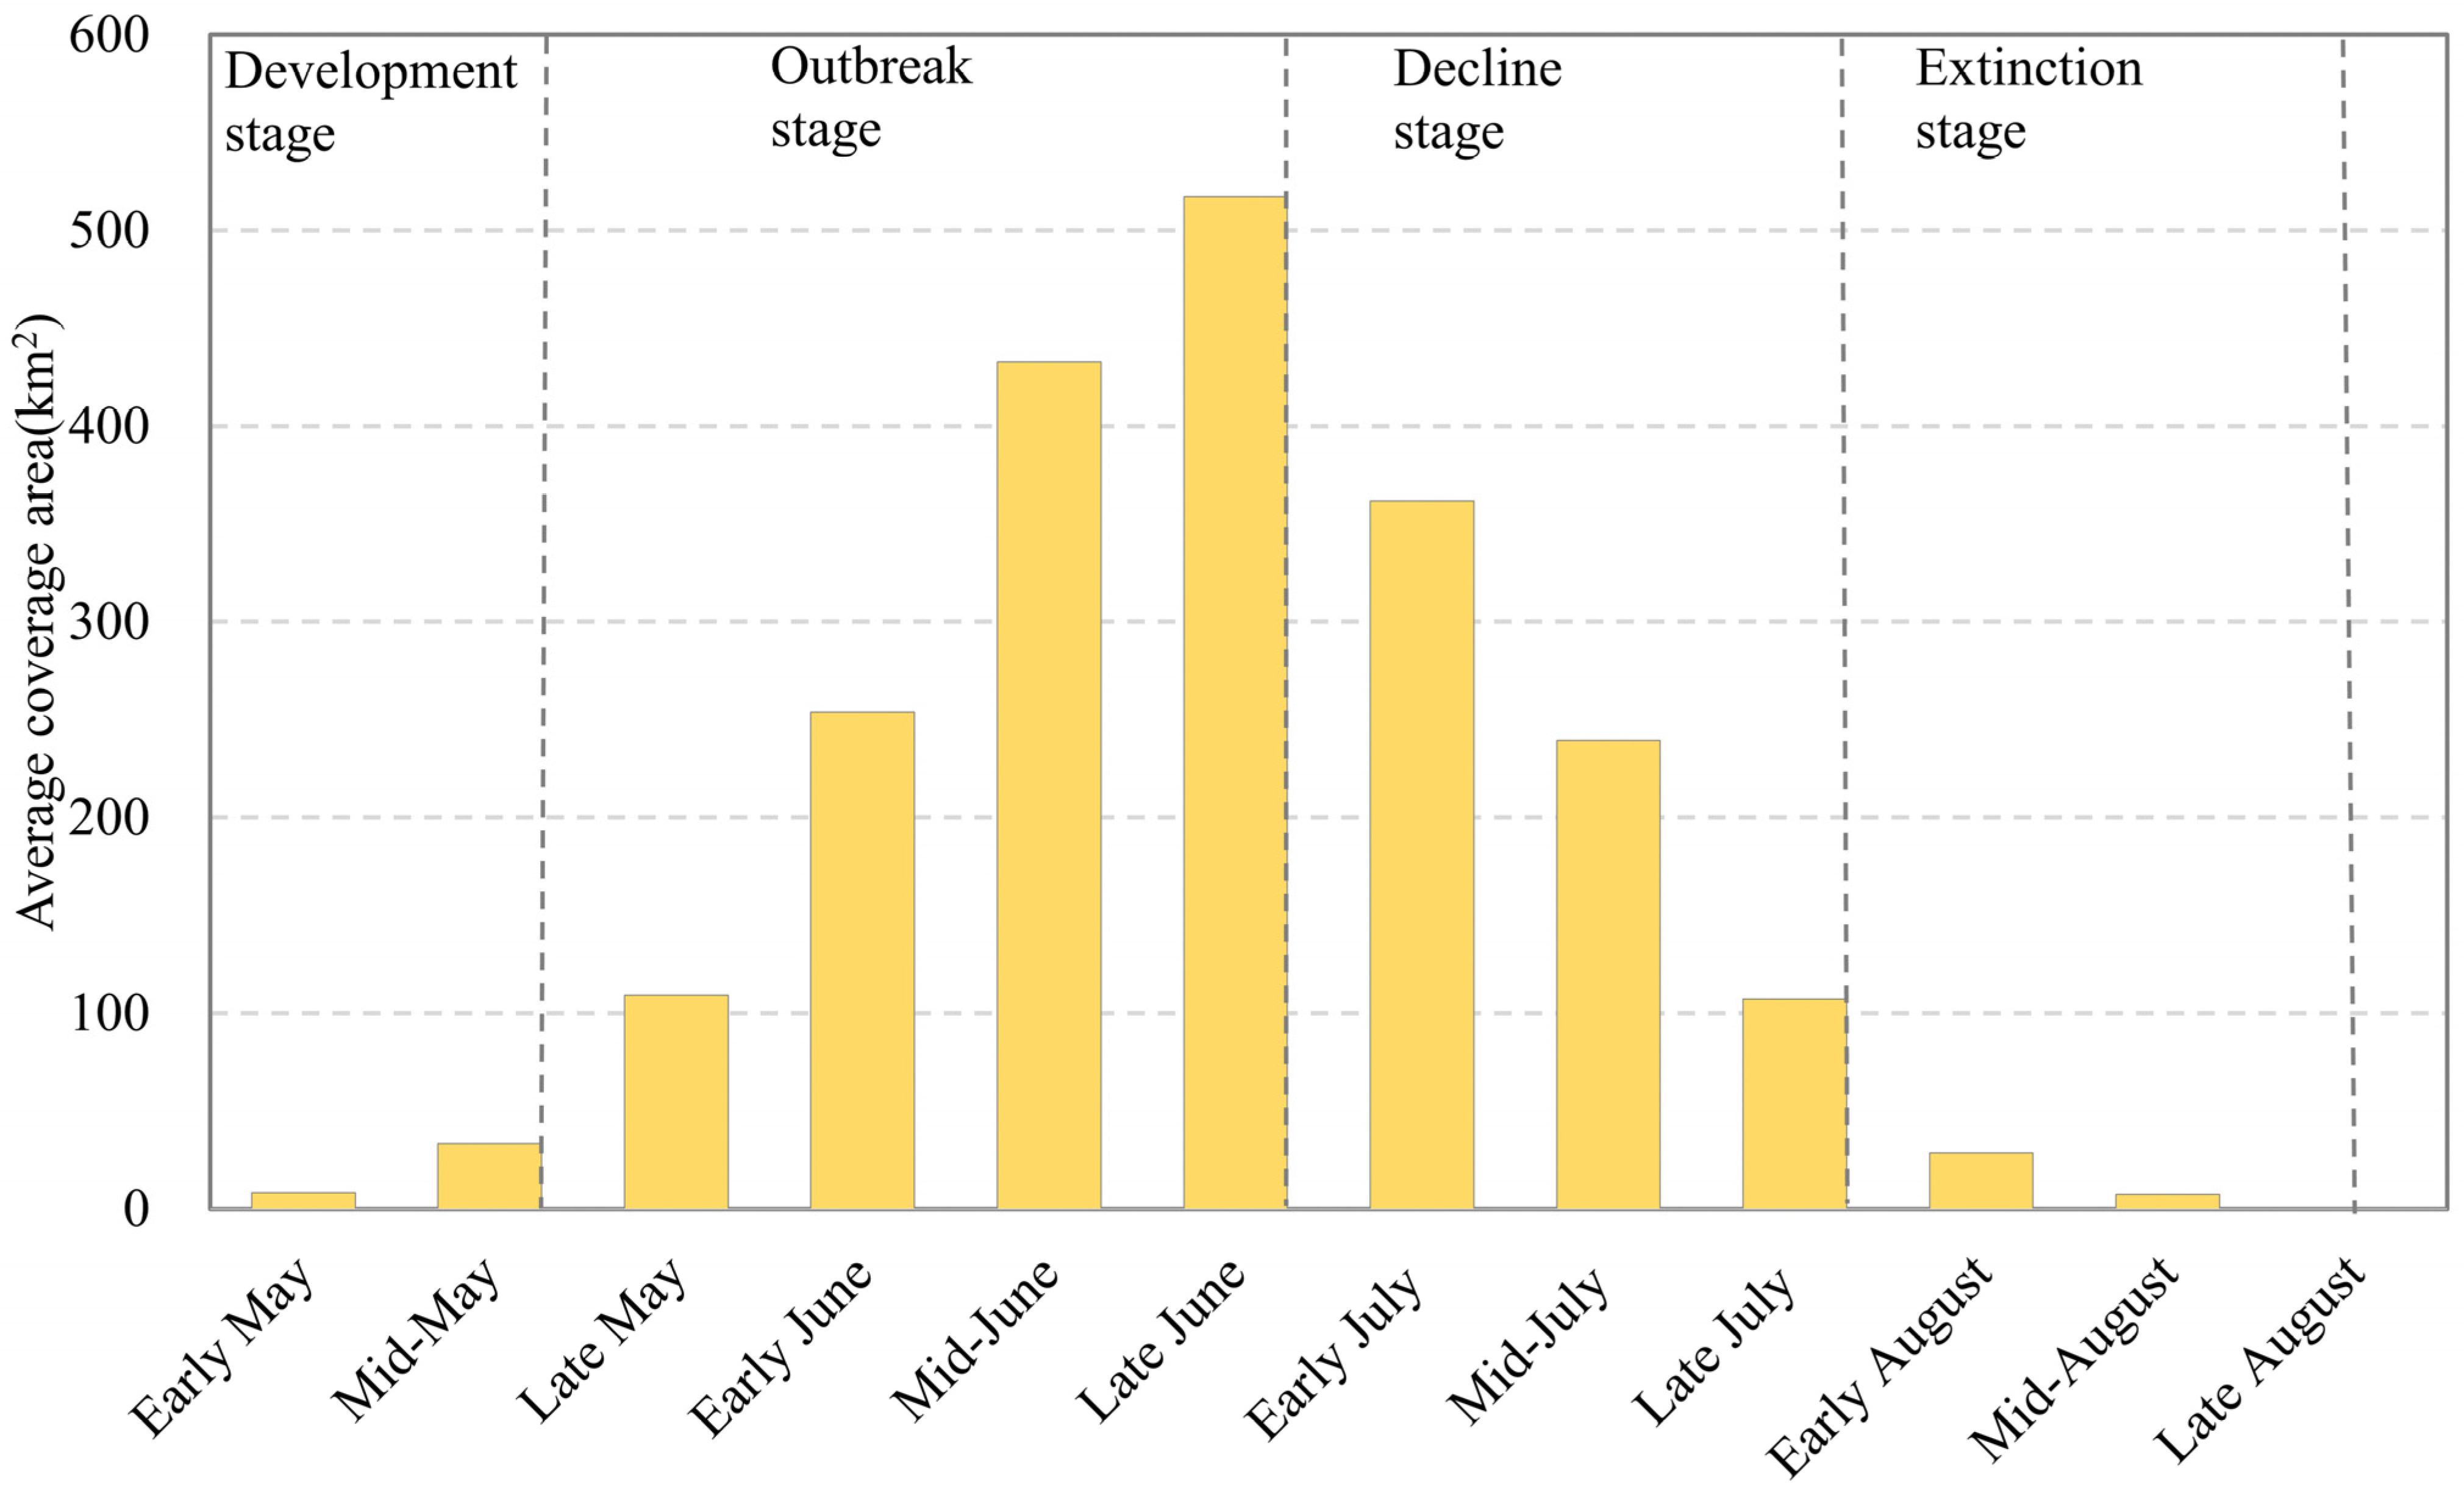
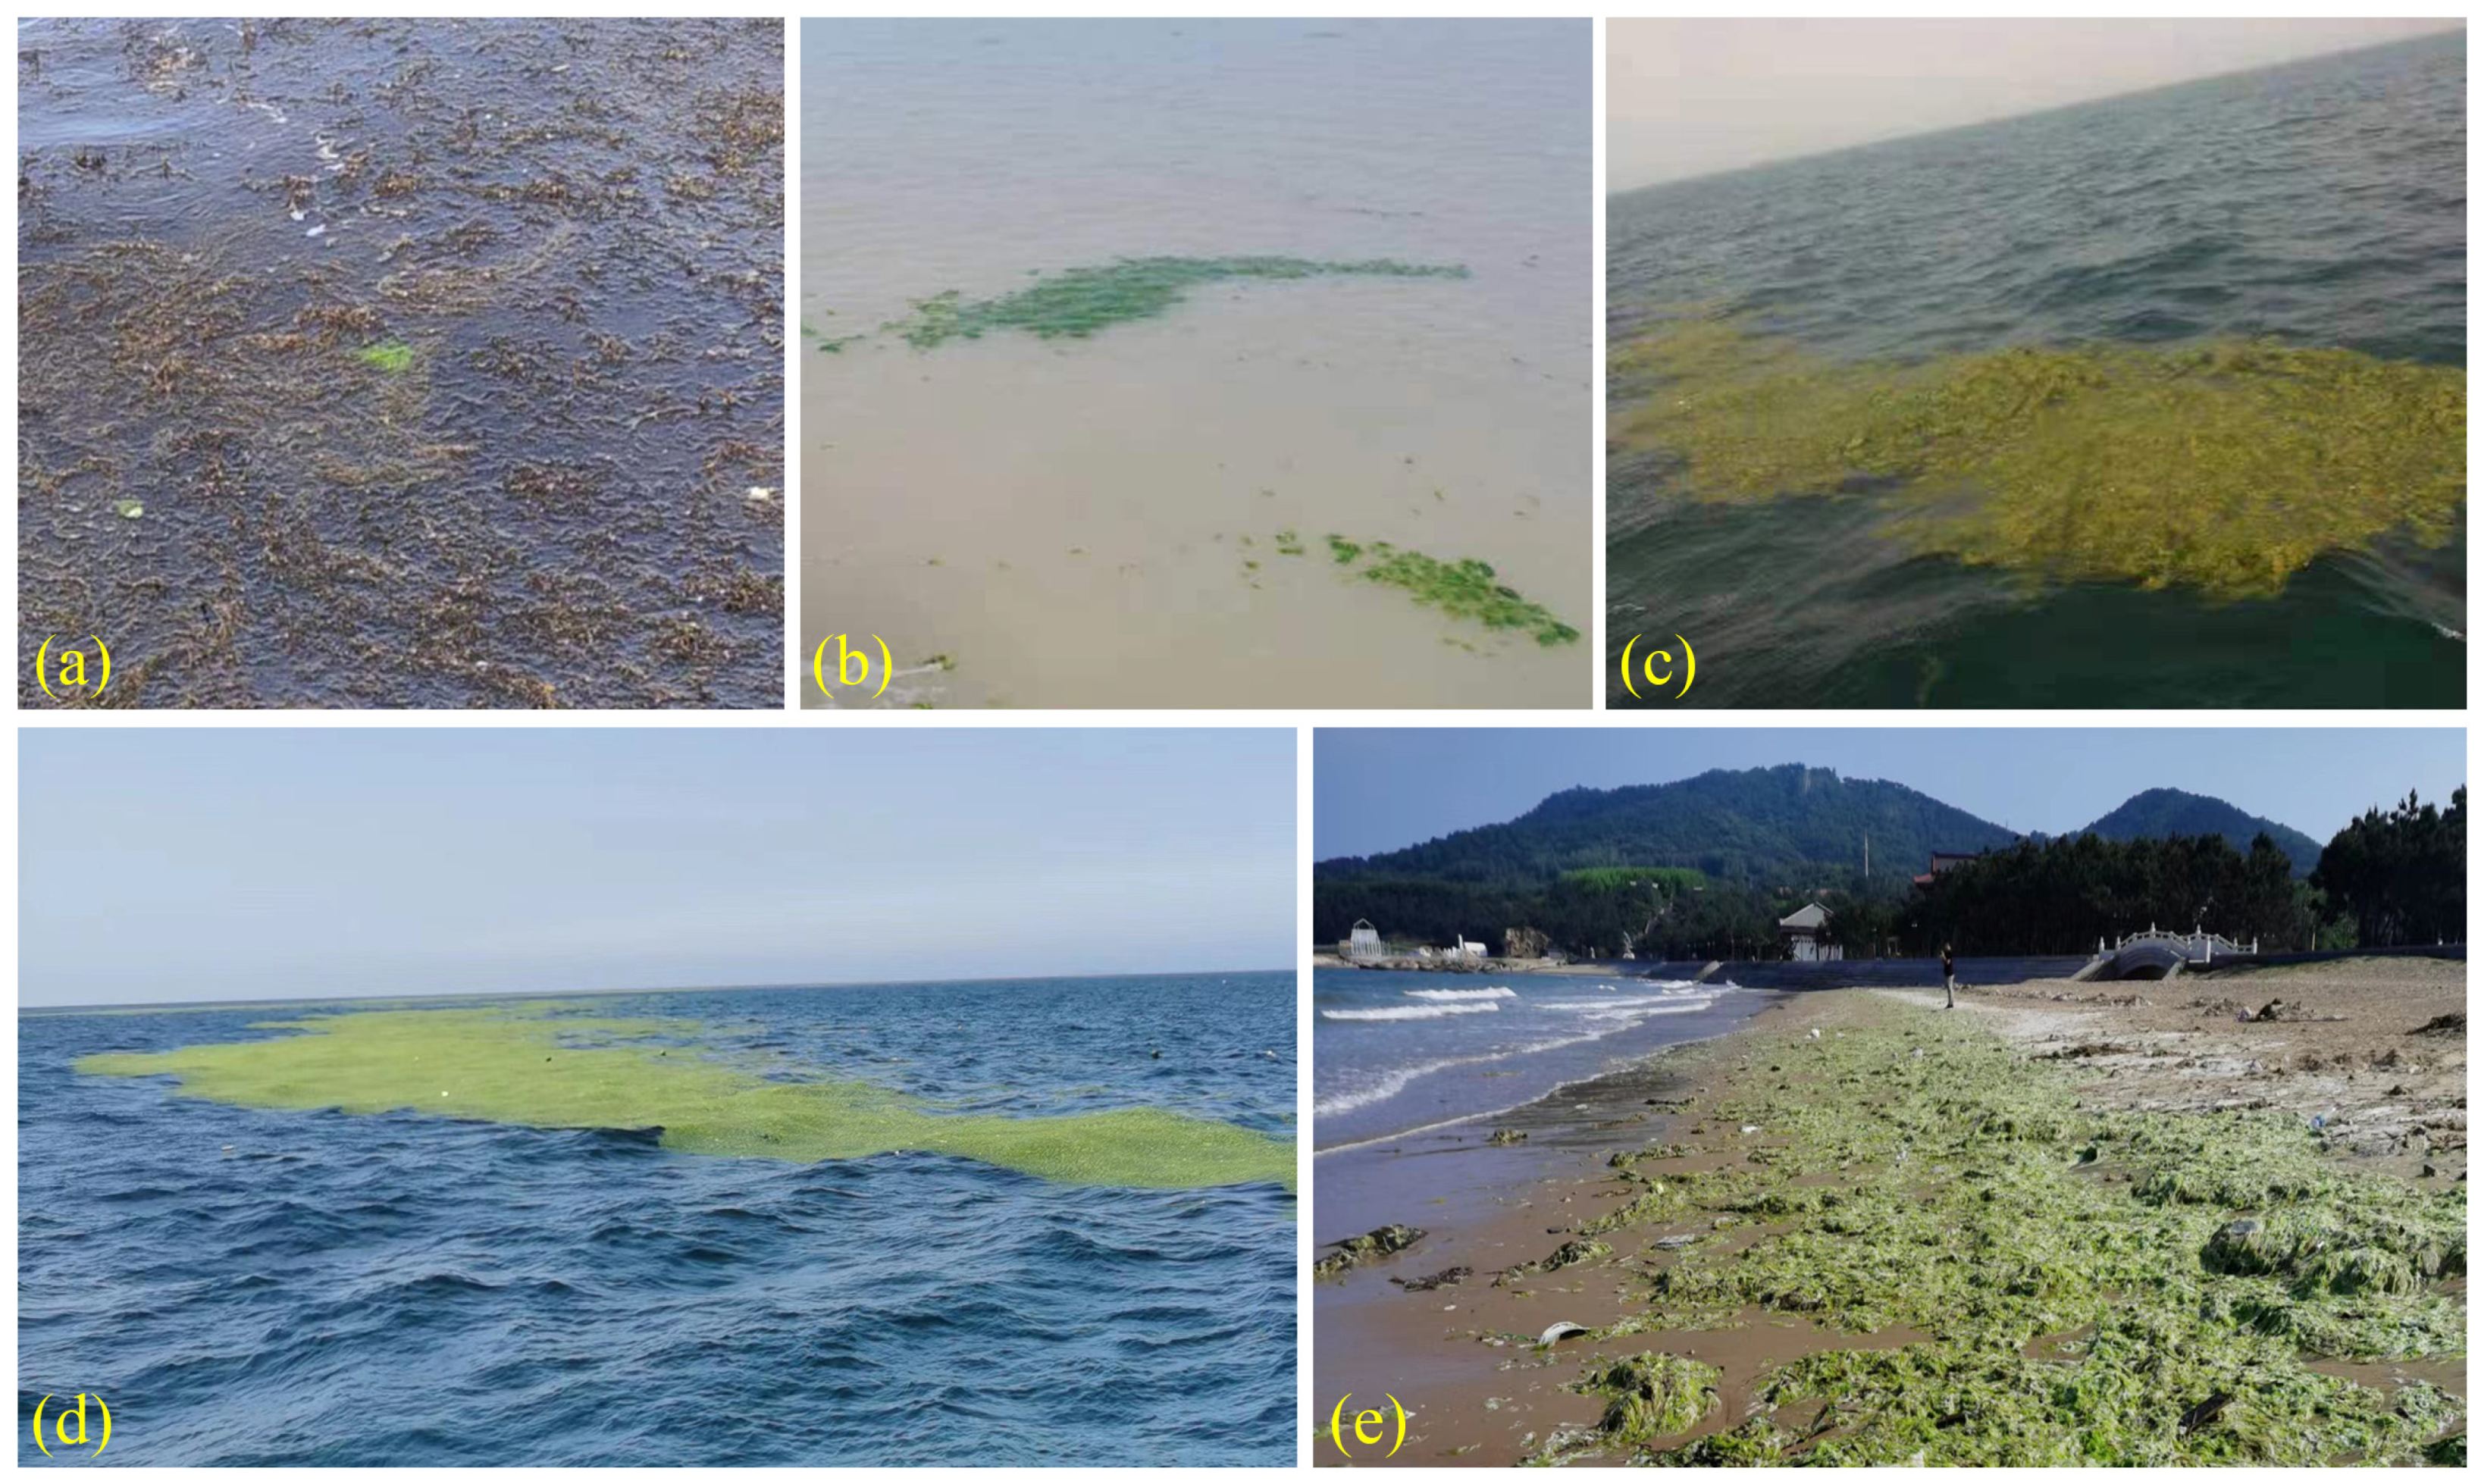
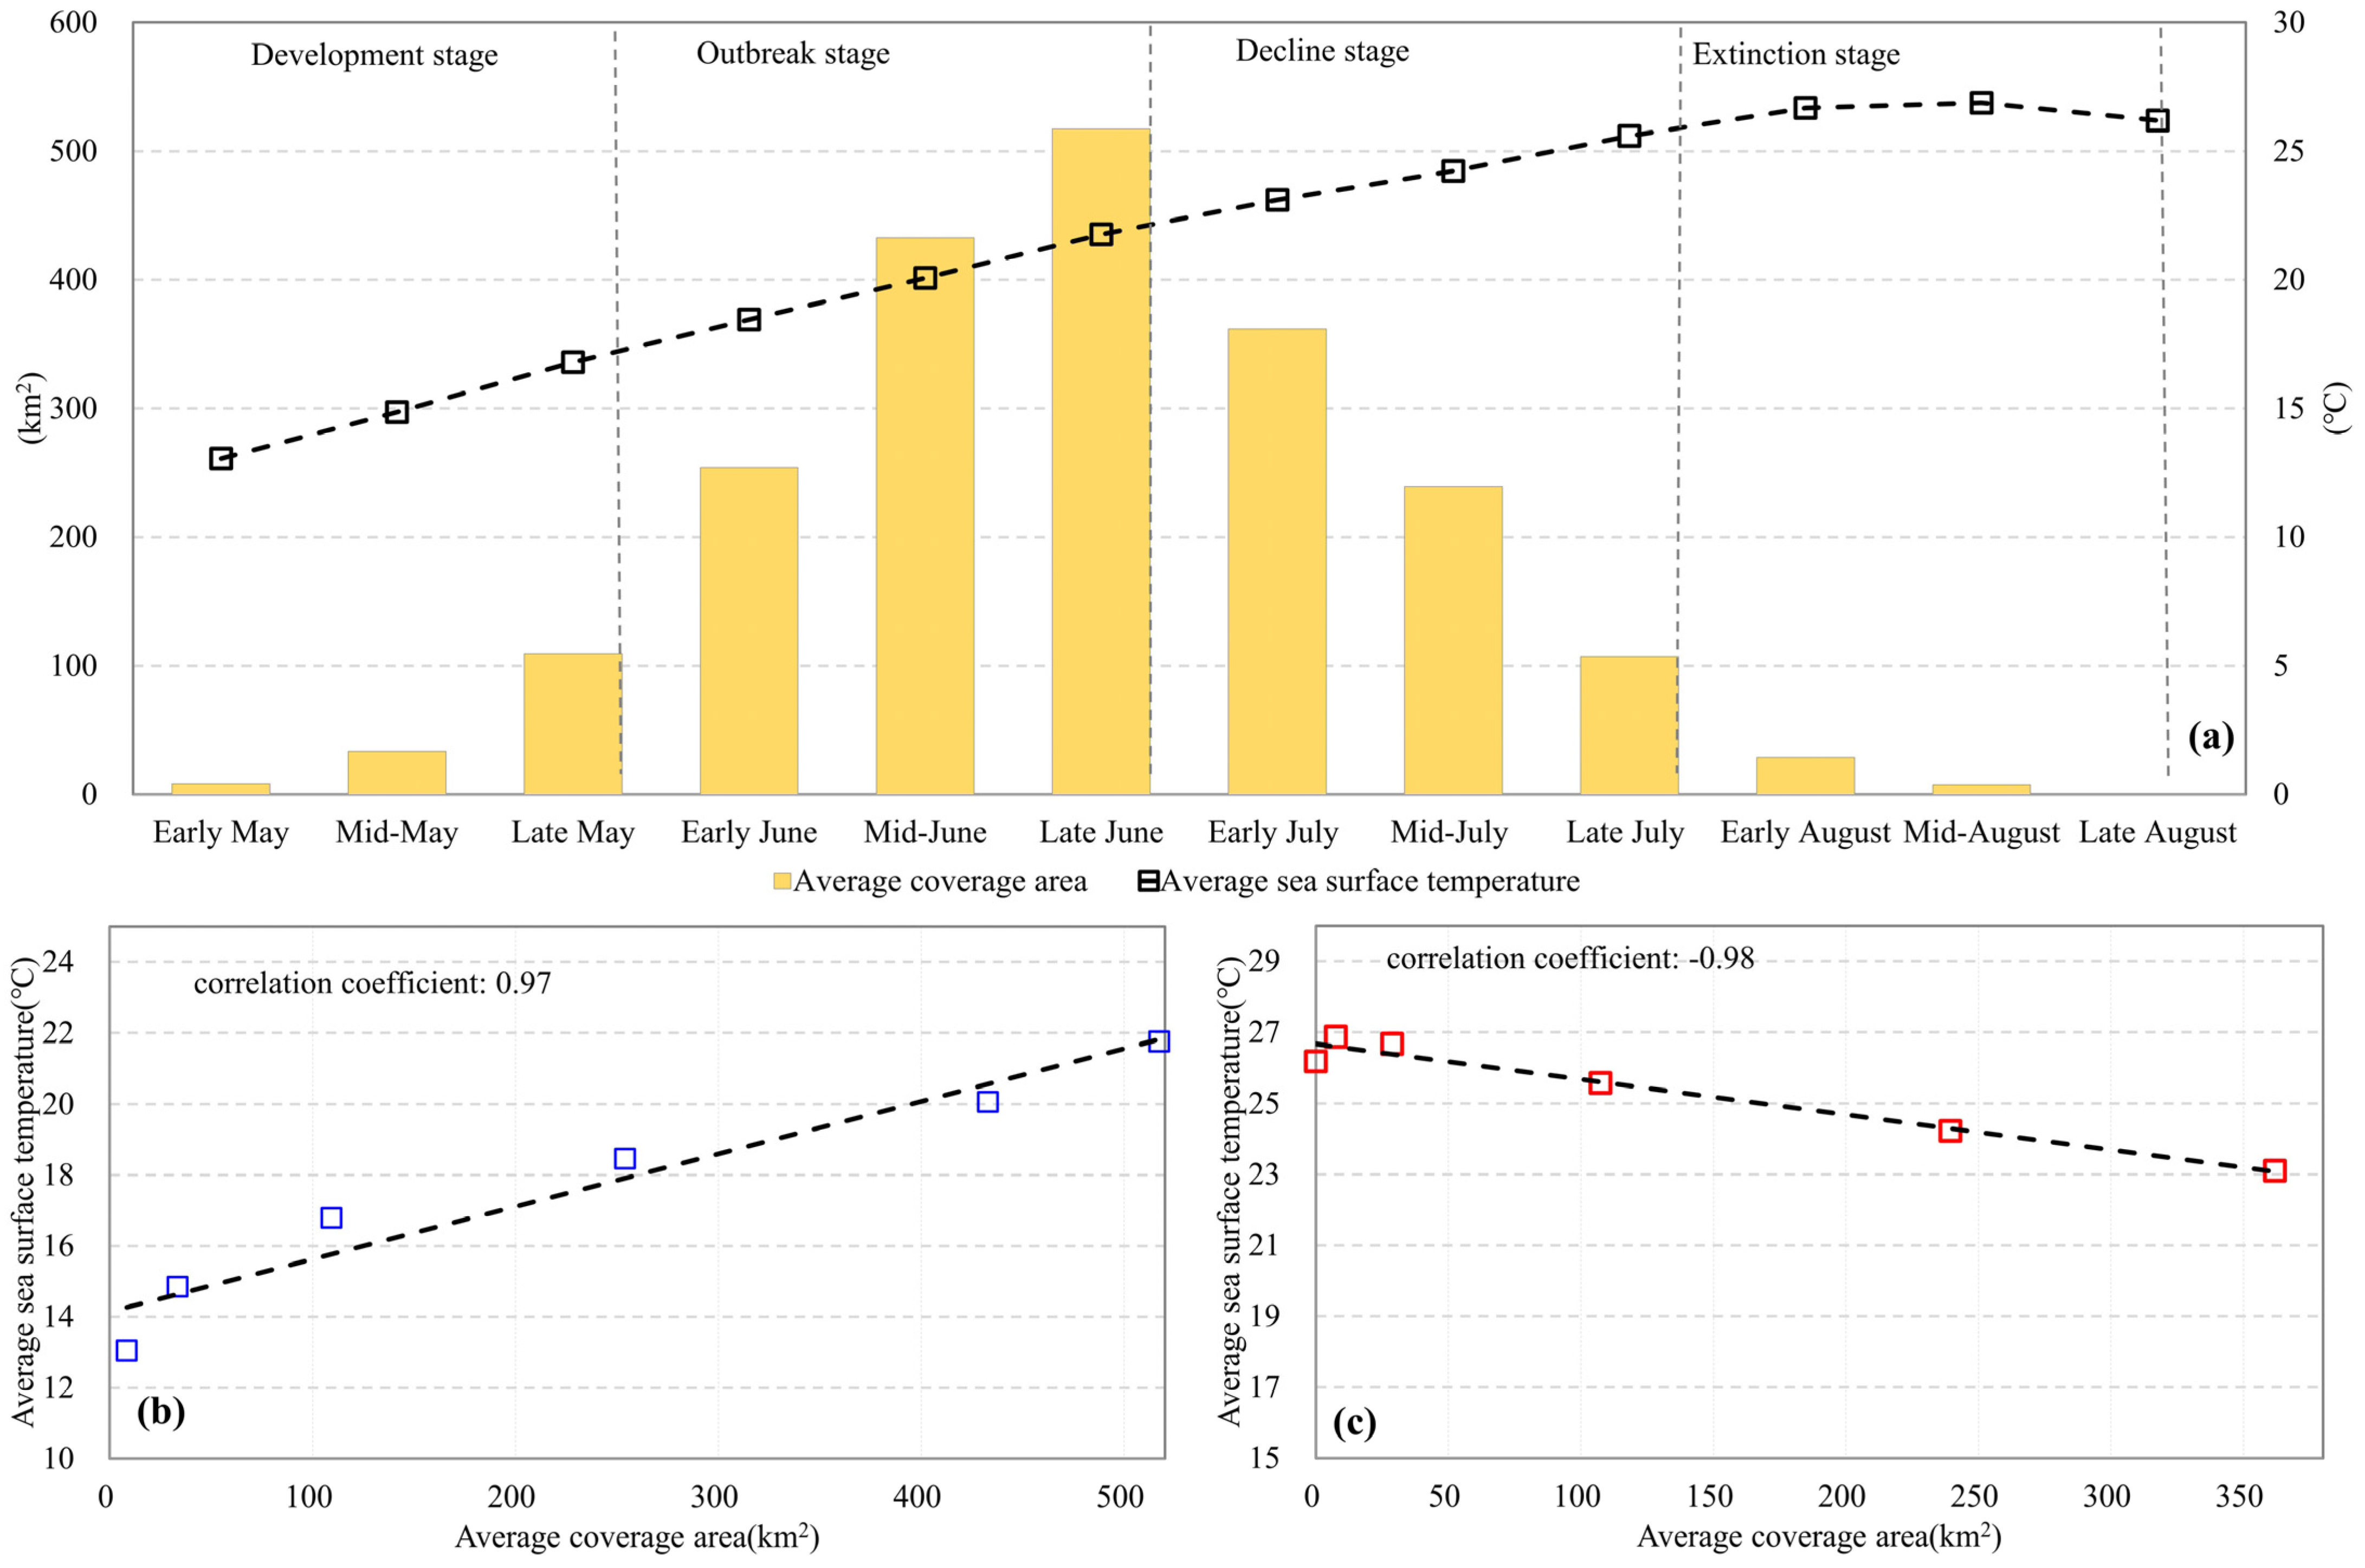
- Development stage: The monitoring results from the past 16 years show that satellite remote sensing detected the first emergence of U. prolifera in early and mid-May. Combined with the on-site drone survey results, the early U. prolifera coverage area was small and often appeared in the form of a mixed growth of Sargassum (in Figure 6a, brown is Sargassum and green is U. prolifera). Compared with other algae, U. prolifera has a strong ability to absorb nutrients and can utilize inorganic and organic nitrogen and phosphorus to achieve rapid growth [17,34]. The higher nutrient content in the coastal waters of the Yellow Sea provides rich nutrients for the growth of U. prolifera [35,36], coupled with the impact of rising sea surface temperatures, so the growth and reproduction of U. prolifera accelerates and gradually appears in sporadic flowers and spatially discrete distribution (Figure 6b). The average maximum coverage area in mid-May is about 33 km2.
- (2)
- Outbreak stage: Upon gradually entering the outbreak period, the coverage area doubled, and U. prolifera was spatially clustered into large patches (Figure 6c). It reached the annual peak coverage from late June to early July and was further spatially aggregated into a strip shape (Figure 6d), forming a large-scale green tide that stretched from several kilometers to tens of kilometers and gradually reached the nearshore beach (Figure 6e). In late May, the annual average maximum coverage area was about 109 km2, and by late June, this number was about 517 km2.
- (3)
- Decline stage: The coverage area gradually entered the decline period in July. As the sea temperature further rose and exceeded the suitable growth temperature of U. prolifera, reproduction begins to slow down. In addition, U. prolifera gradually approached the coast affected by the wind field on the sea surface and was salvaged, organized by the local management department, and the coverage area decreased rapidly by late July. It can be seen that the reduction rate was relatively consistent with the growth rate of the outbreak stage. By late July, the average maximum coverage area over the years was about 109 km2.
- (4)
- Extinction stage: In August, the coverage area continued to decrease and entered the extinction period, and the complete extinction date was mostly concentrated in the mid-to-late August.


3.2. Spatial Distribution Characteristics
- (1)
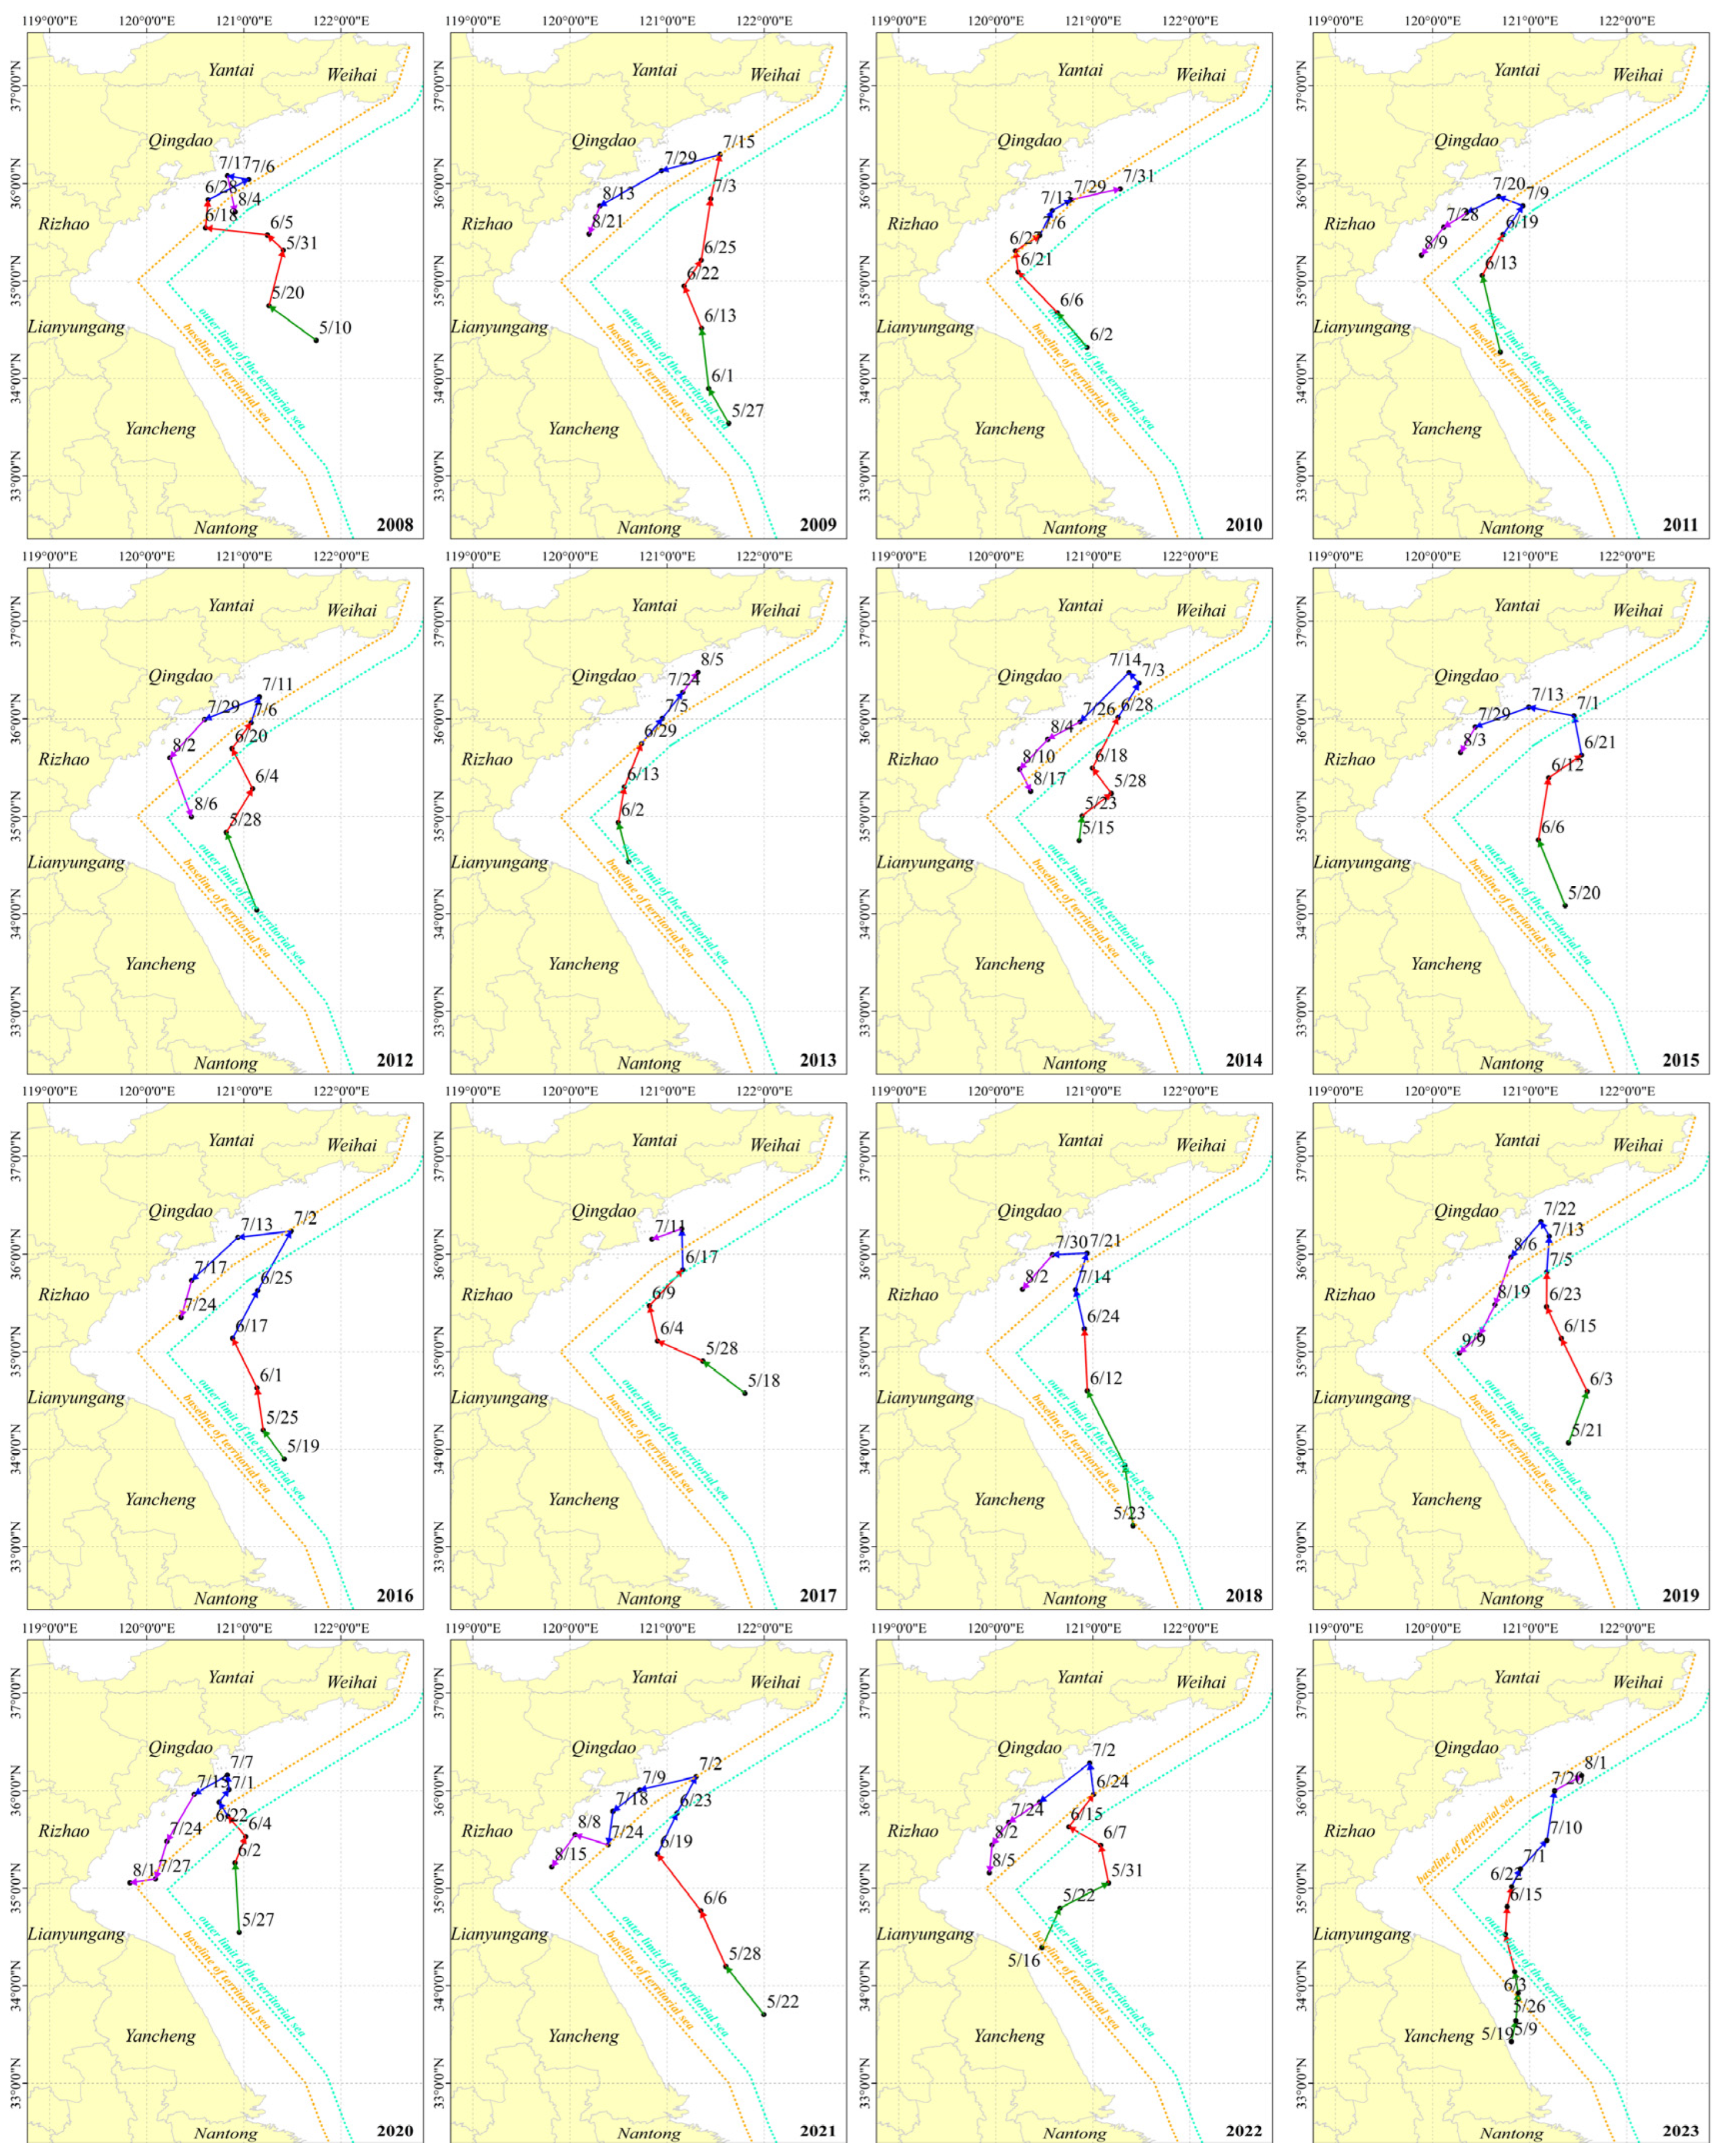
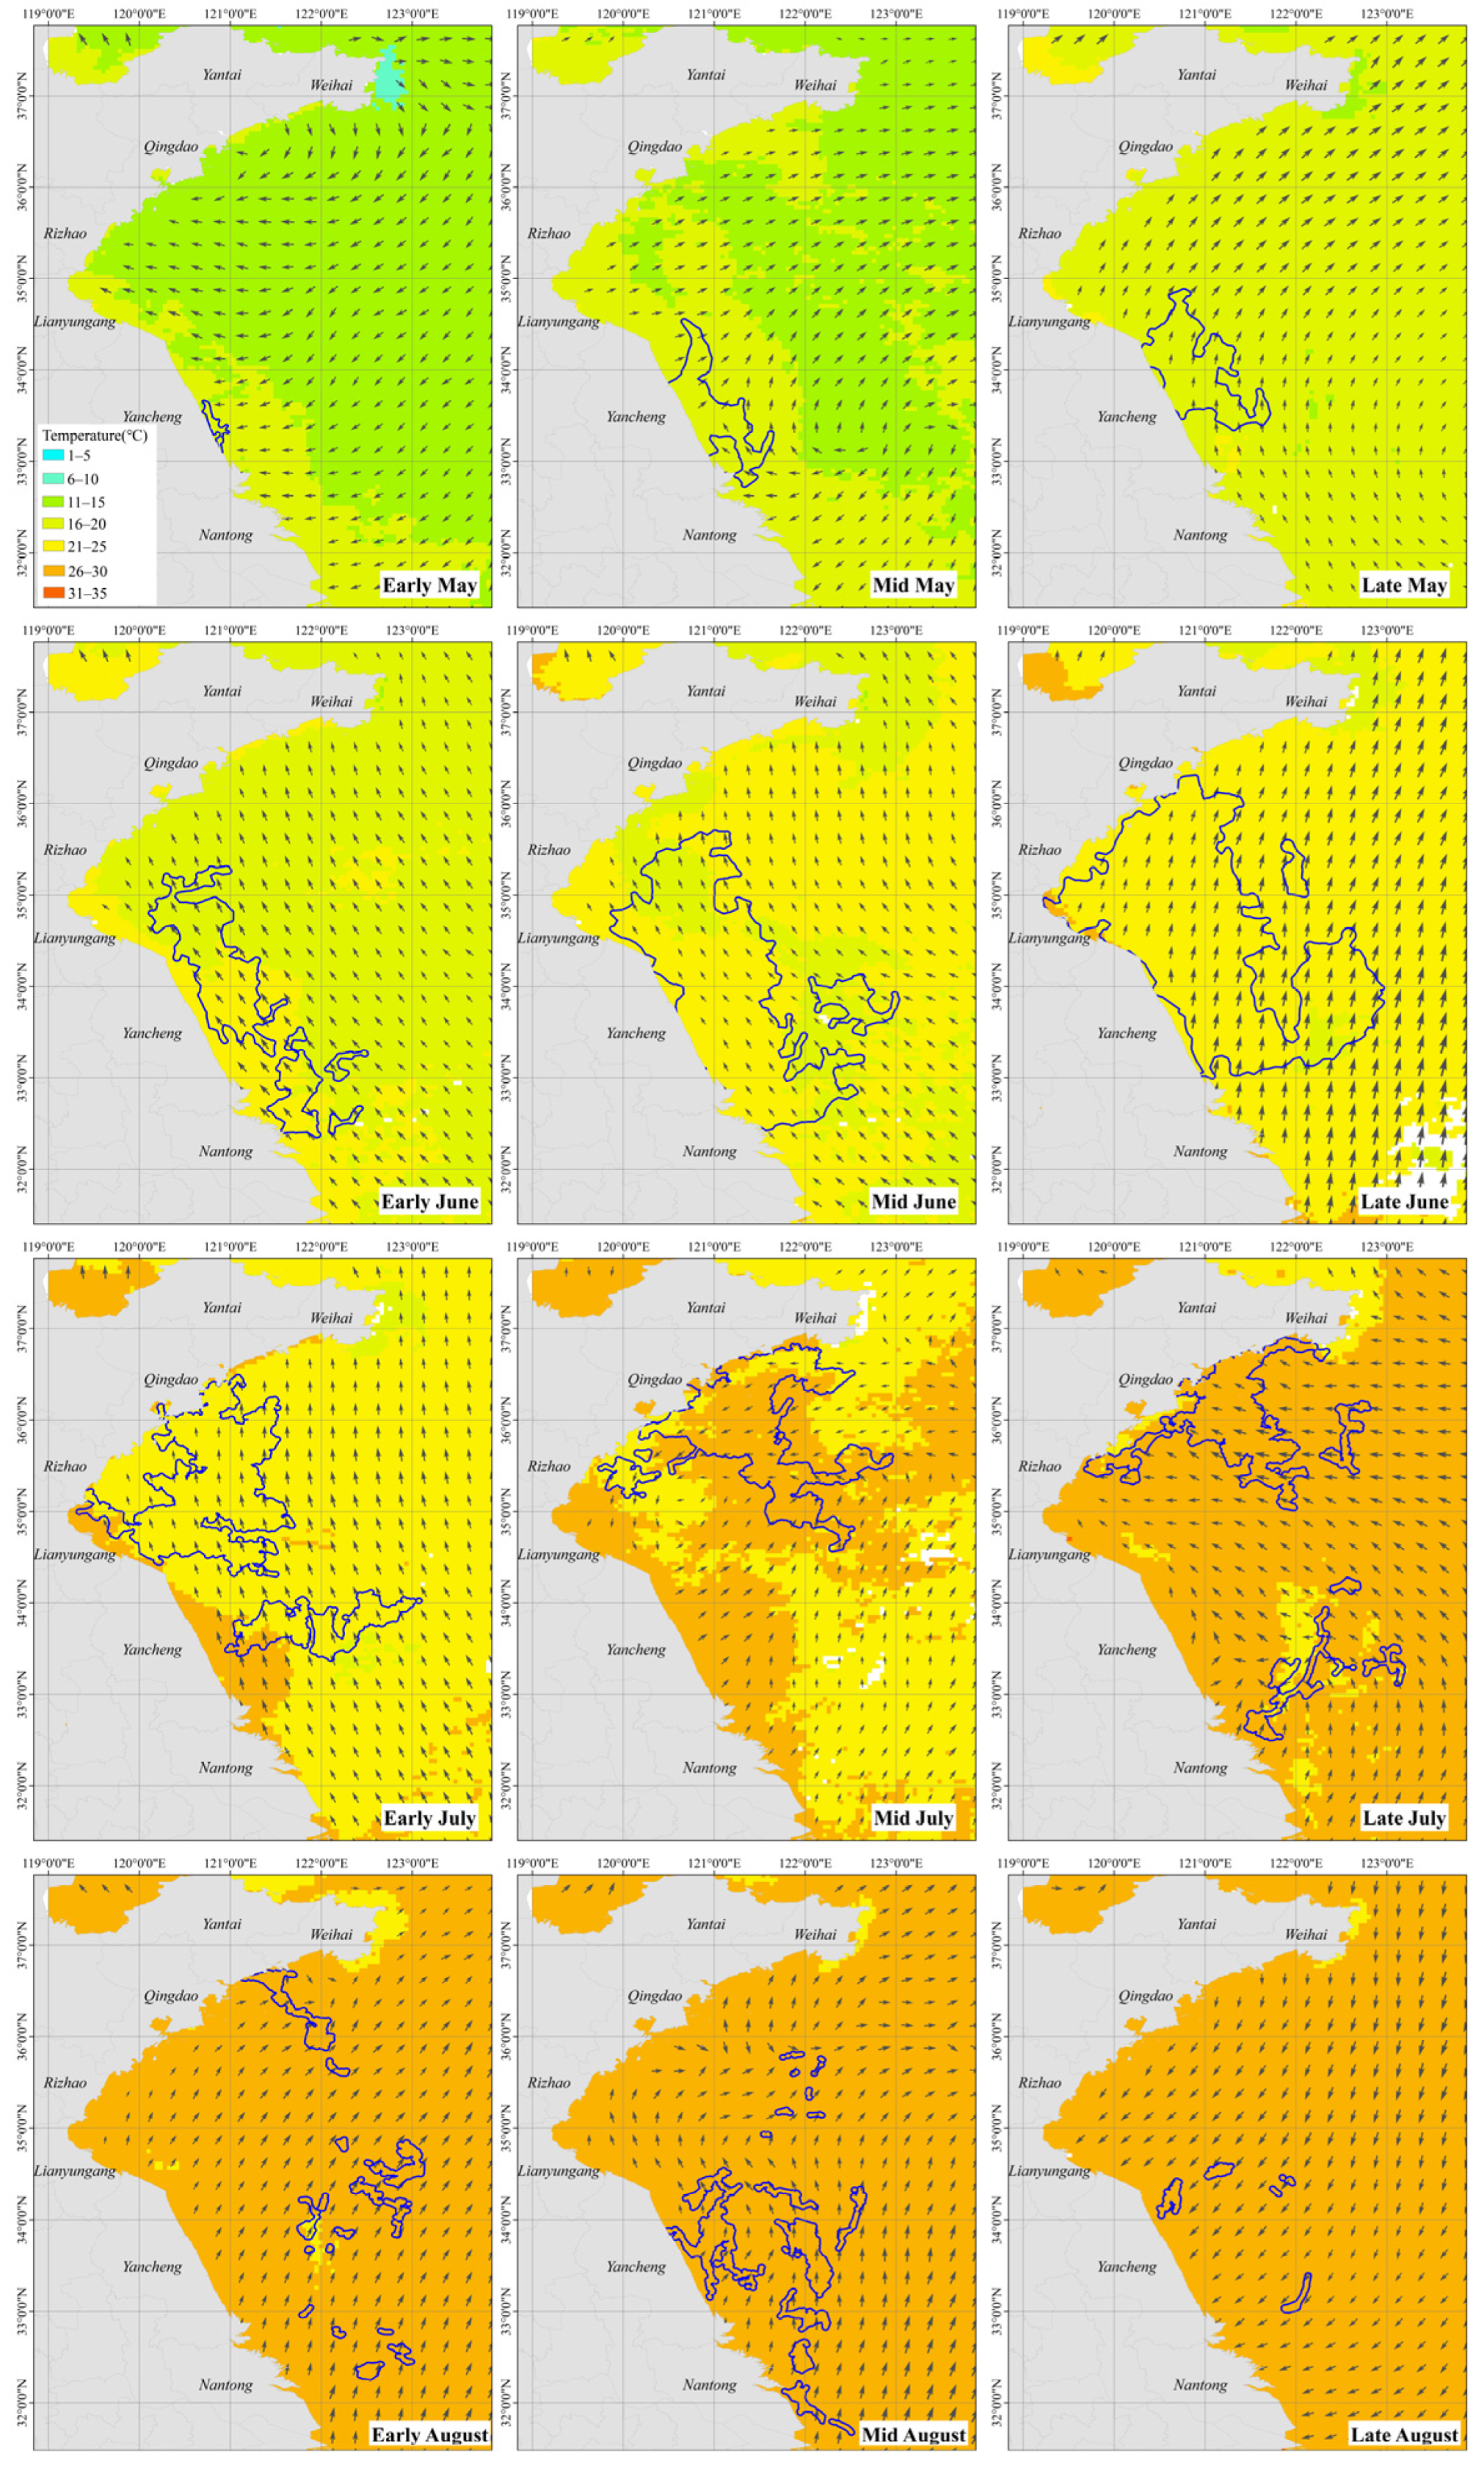
- Northward development type: In the early development stage, it was mostly found in the eastern sea of Yancheng in northern Jiangsu. The distribution center gradually moved from the eastern sea of Yancheng either to the north directly or first to the northwest and then to the northeast along the coastline. Finally, it reached the urban sea area along the southern Shandong Peninsula. During the peak period, the main body of U. prolifera was distributed in the Shandong Sea, which is mainly located on the coast around the Lianyungang, Rizhao, and Qingdao seas. The development directions in 2008, 2010, 2013, 2015, 2017, 2018, and 2023 belong to this type.
- (2)
- Northward in the early stage and southward in the later stage development type: When entering the decline and extinction periods, the distribution center of U. prolifera gradually moved southward, from the Qingdao Sea area to the Rizhao Sea area, and went a step further to the junction area around the Jiangsu–Shandong border. The process of southward movement in different years was relatively similar. It should be noted that the movement of the distribution center in the extinction period was different from those in the other periods. Variations in the distribution center in the extinction period over the years were mainly related to the extinction time sequence and decreasing rate in each sea area. The overall result over the years shows that the distribution center of U. prolifera during the outbreak period was mostly located in the sea area of Qingdao, while the final extinction area was mostly located in Rizhao, as well as in the Jiangsu–Shandong border area. The development directions in other years belong to this type.

3.3. Frequency Characteristics
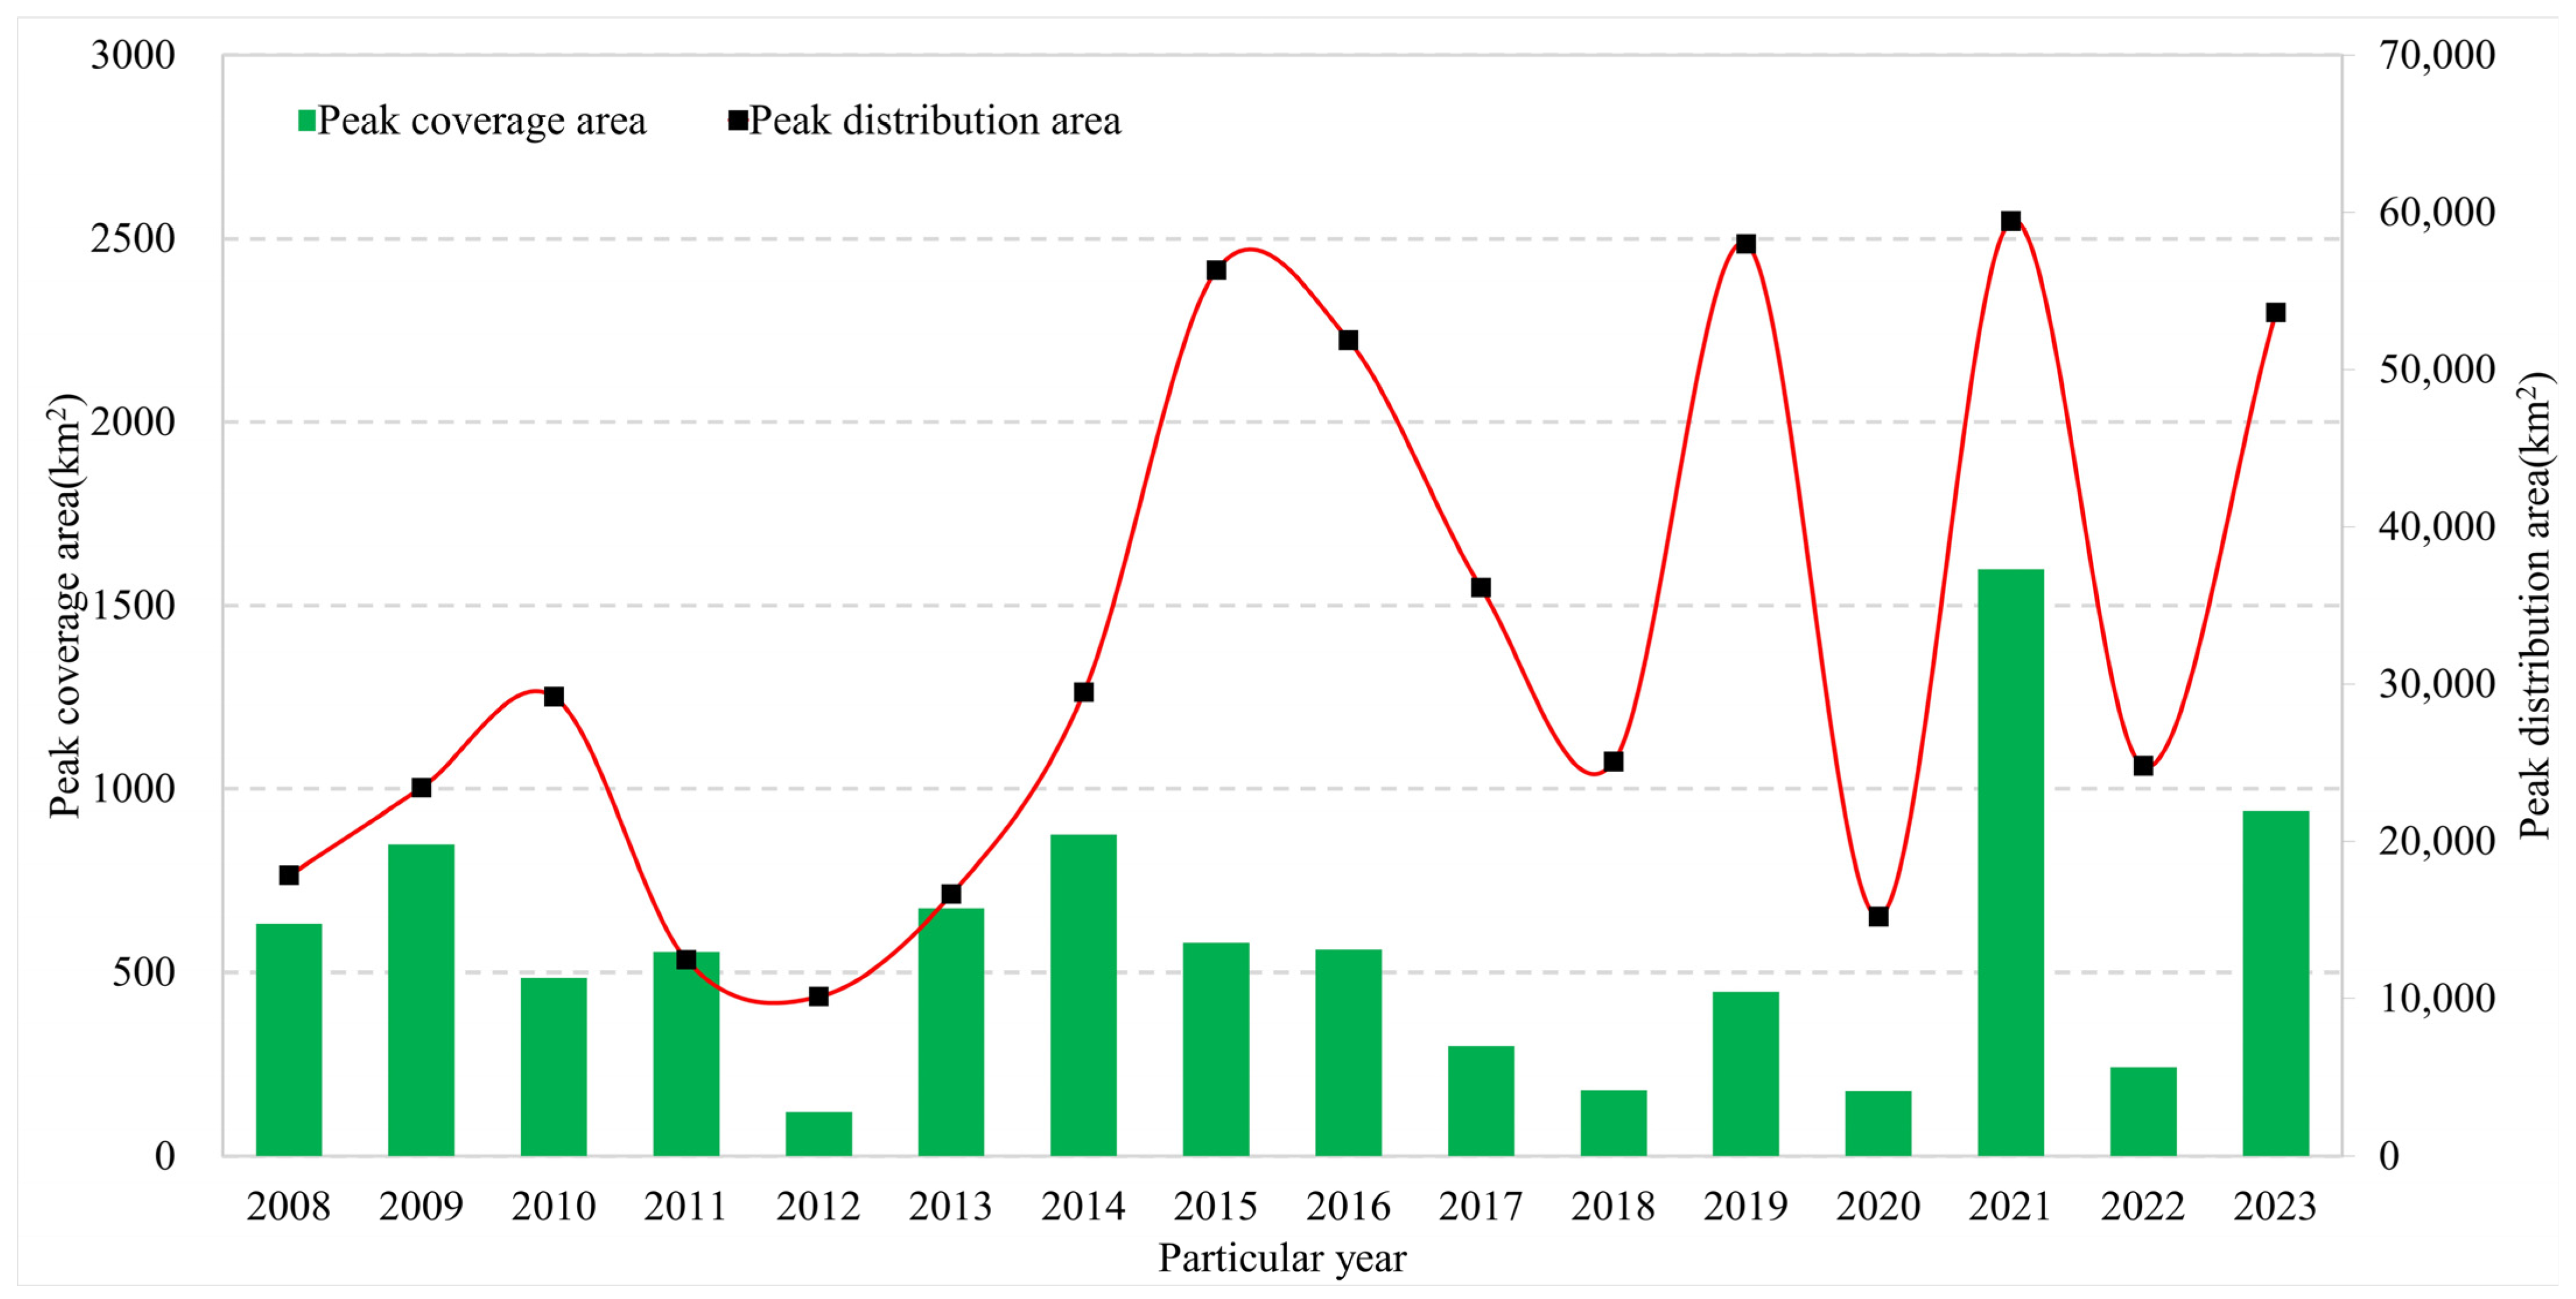
3.4. Interannual Peak Comparison
3.5. Effects of Environmental Drivers
4. Conclusions
- (1)
- U. prolifera has mainly gone through four stages over the years: the development stage in early and mid-May, the outbreak stage from late May to late June, the decline stage in July, and the extinction stage in August. The average number of days that it has lasted over the years is 92 days, and the corresponding average peak coverage area is about 517 km2.
- (2)
- The spatial distribution of U. prolifera over the years mainly includes a northward expansion stage and another southward contraction stage. It was first discovered in the waters of Yancheng, northern Jiangsu. Affected by the Yellow Sea monsoon, it develops and migrates overall either to the north directly or first to the northwest and then to the northeast. During the peak coverage period, it was mainly located in the offshore waters from Lianyungang to Qingdao. The peak coverage distribution over the years shows that the sea area affected by U. prolifera reaches as much as 9050 km2, mainly located in Qingdao waters.
- (3)
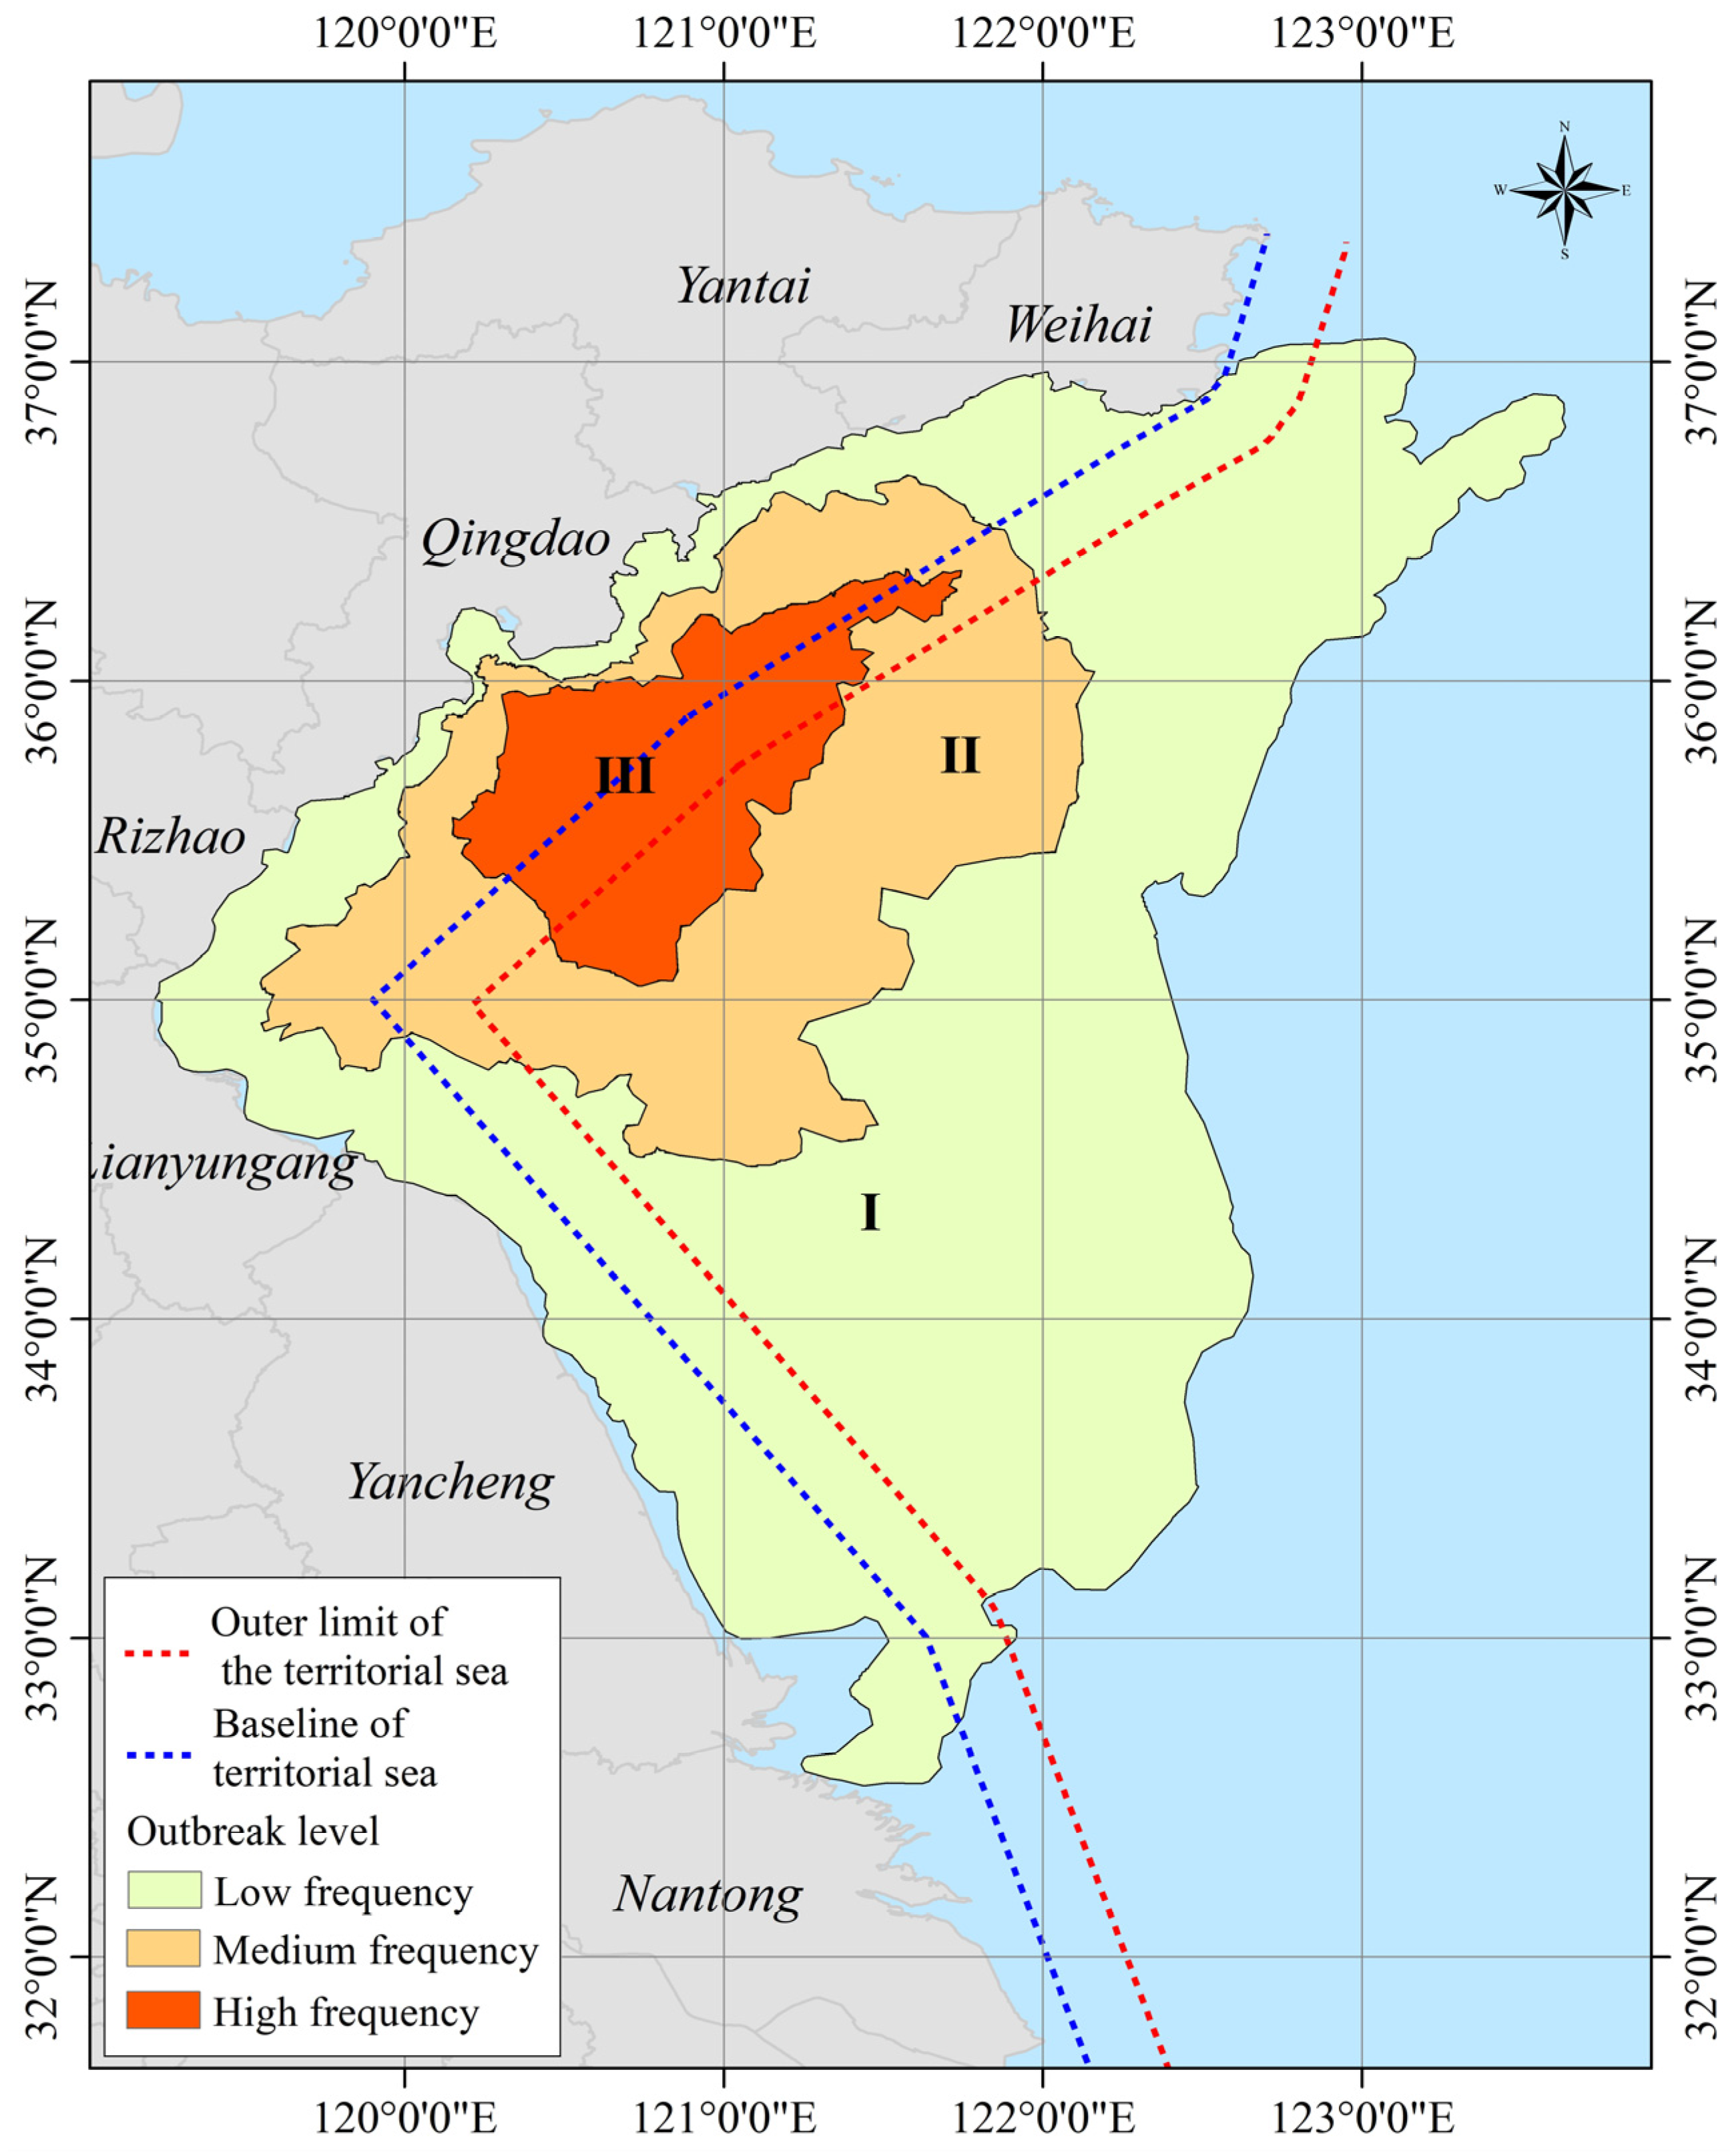
- Occurrence frequency analysis shows that a low-frequency distribution makes up about 67.5%, medium-frequency distribution accounts for about 23.1%, and high-frequency distribution makes up about 9.4%. The scope of the three divisions gradually shrinks from the far sea to the offshore sea, and the level of impact gradually increases.
- (4)
- Comparison of interannual peak coverage areas shows that since 2018, the peaks and troughs of peak coverage areas have shown signs of alternate change year by year, and the peak coverage areas in 2021 and 2023 were both at historical highs.
- (5)
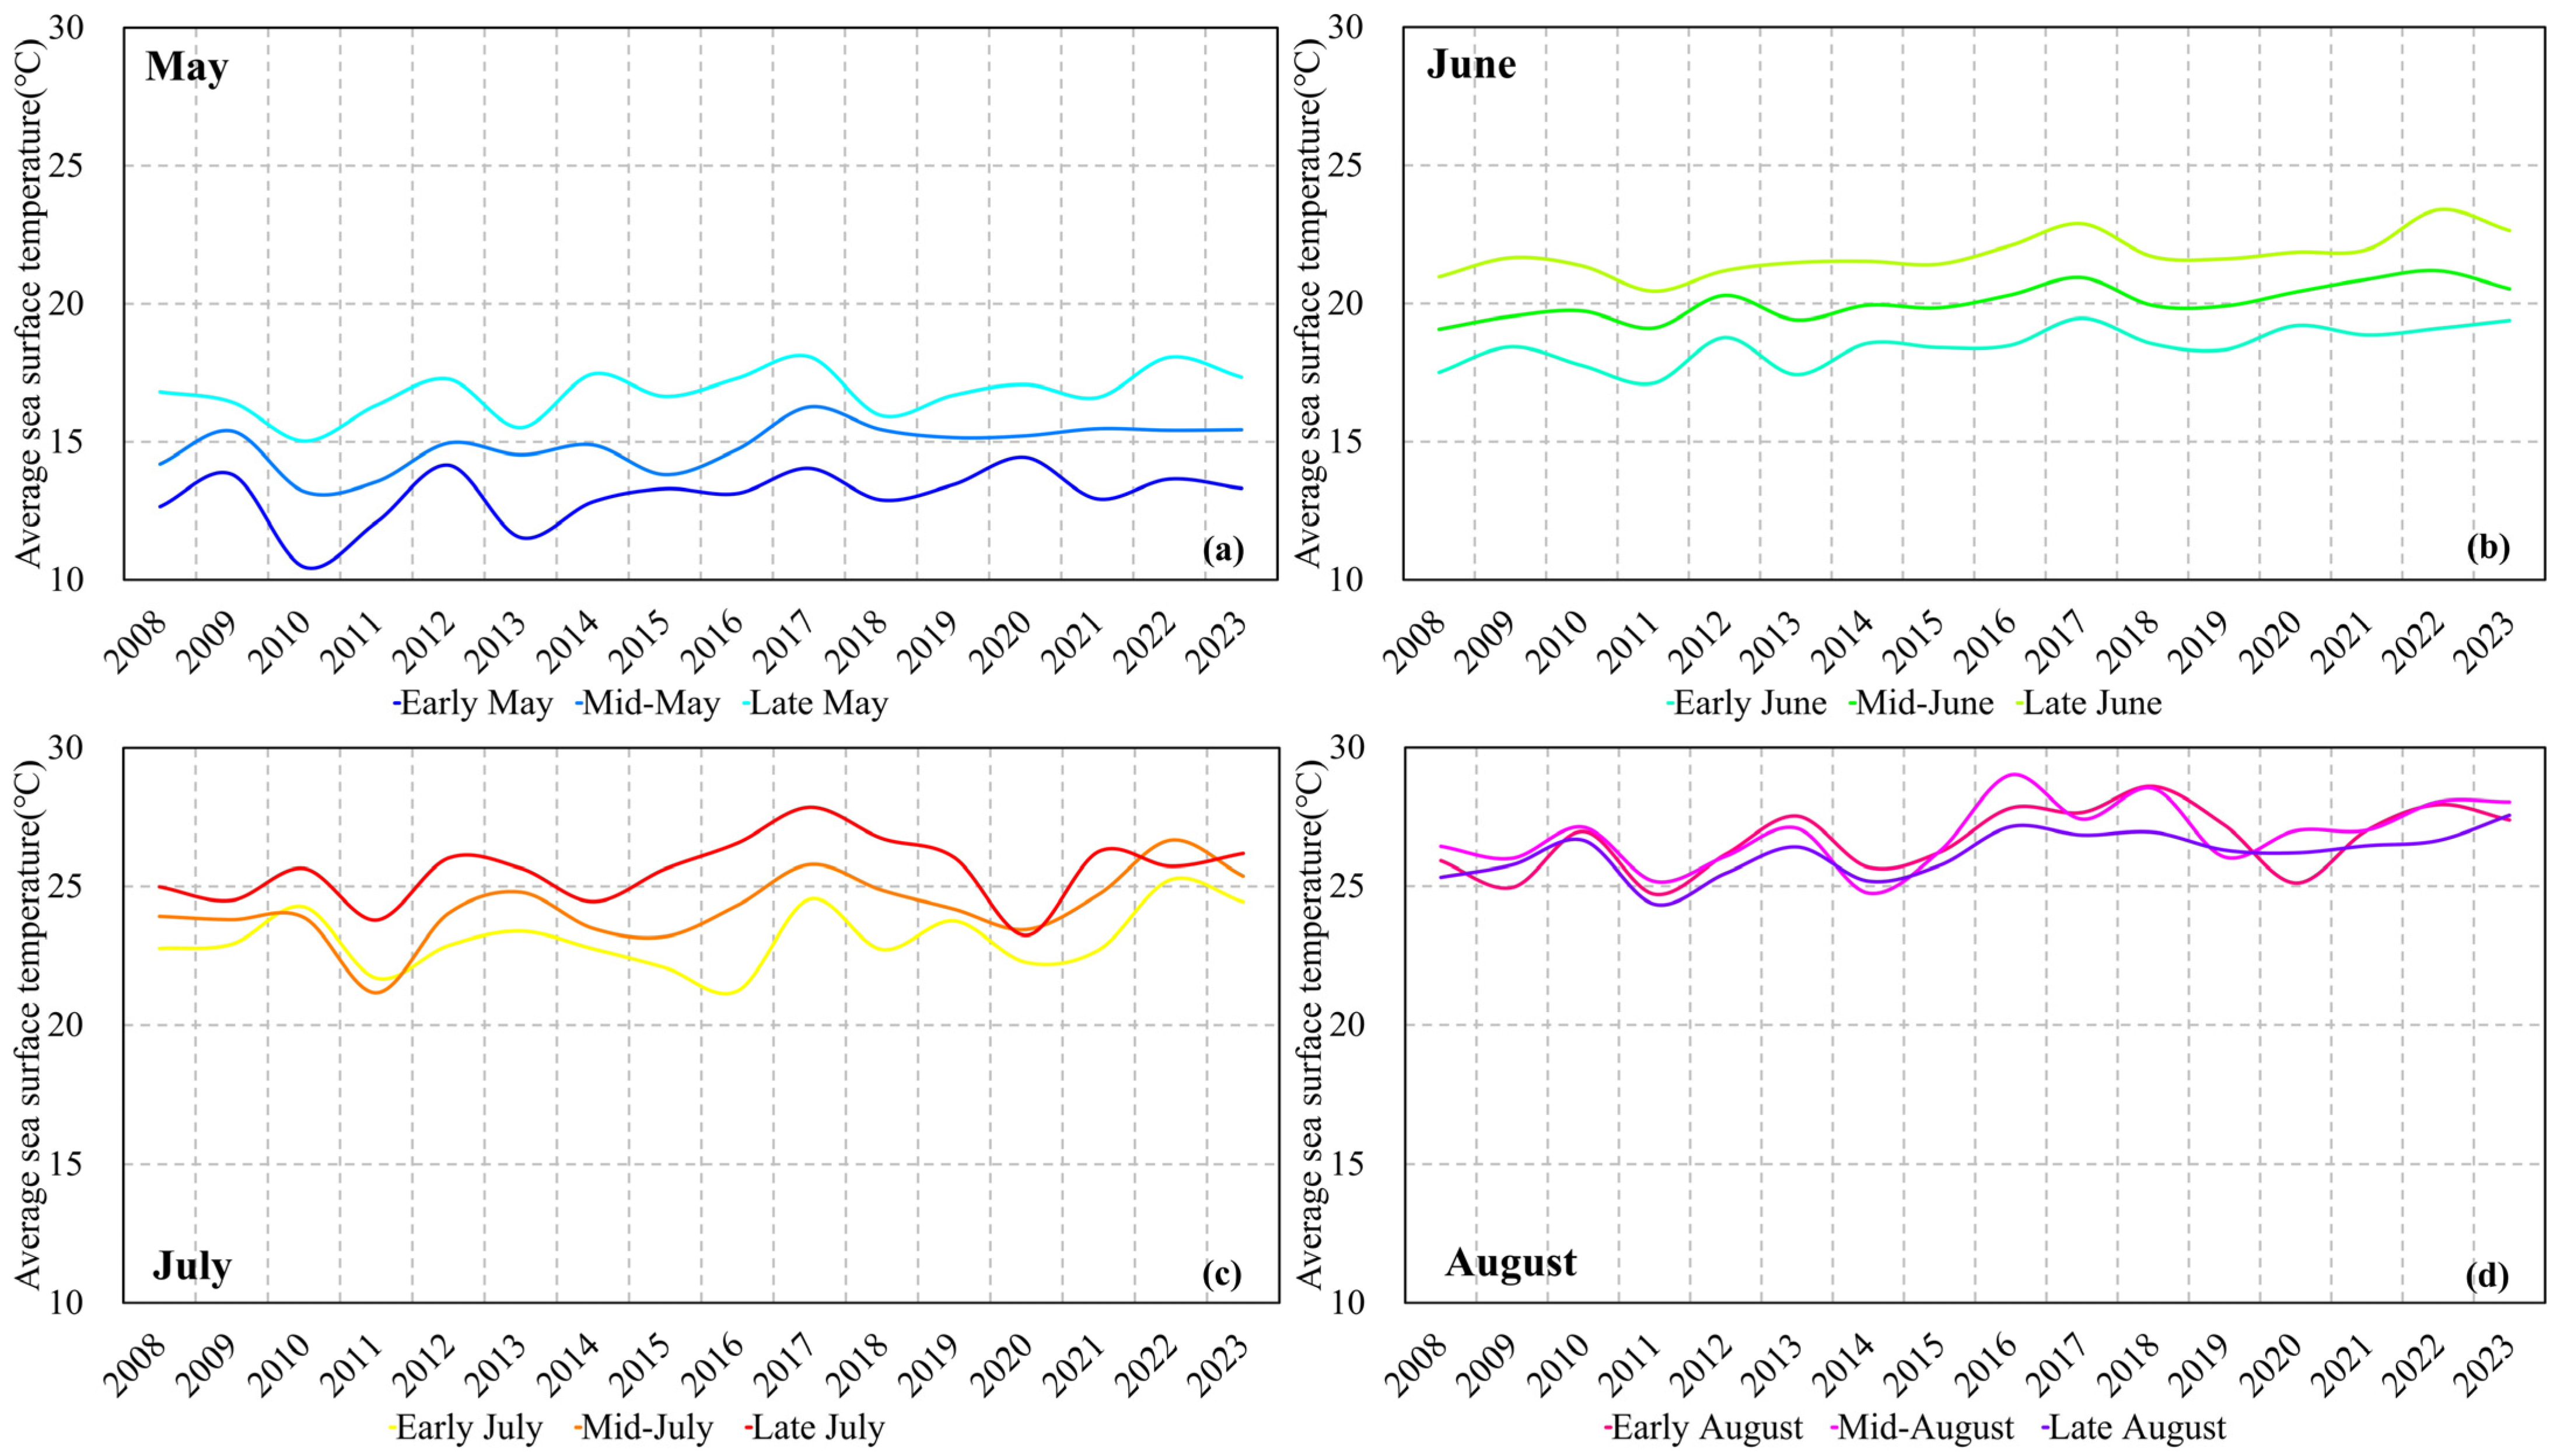
- Analysis of the average sea temperature and U. prolifera coverage area in each ten-day from May to August shows that the spatial development direction of U. prolifera is highly consistent with the distribution and changes in the sea surface wind field. The suitable growth temperature of U. prolifera is between 14 °C and 26 °C, among which the growth rate of U. prolifera was fastest when temperatures ranged from 17 °C to 22 °C.
Author Contributions
Funding
Data Availability Statement
Acknowledgments
Conflicts of Interest
References
- Ye, N.H.; Zhang, X.W.; Mao, Y.Z.; Liang, C.W.; Xu, D.; Zou, J.; Zhuang, Z.M.; Wang, Q.Y. ‘Green tides’ are overwhelming the coastline of our blue planet: Taking the world’s largest example. Ecol. Res. 2011, 26, 477–485. [Google Scholar] [CrossRef]
- Liu, D.; Keesing, J.K.; Dong, Z.; Zhen, Y.; Di, B.; Shi, Y.; Fearns, P.; Shi, P. Recurrence of the world’s largest green-tide in 2009 in Yellow Sea, China: Porphyra yezoensis aquaculture rafts confirmed as nursery for macroalgal blooms. Mar. Pollut. Bull. 2010, 60, 1423–1432. [Google Scholar] [CrossRef] [PubMed]
- Pang, S.J.; Liu, F.; Shan, T.F.; Xu, N.; Zhang, Z.H.; Gao, S.Q.; Chopin, T.; Sun, S. Tracking the algal origin of the Ulva bloom in the Yellow Sea by a combination of molecular, morphological and physiological analyses. Mar. Environ. Res. 2010, 69, 207–215. [Google Scholar] [CrossRef] [PubMed]
- Liu, F.; Pang, S.J.; Zhao, X.B.; Hu, C.M. Quantitative, molecular and growth analyses of Ulva microscopic propagules in the coastal sediment of Jiangsu province where green tides initially occurred. Mar. Environ. Res. 2012, 74, 56–63. [Google Scholar] [CrossRef] [PubMed]
- Hu, C.; Li, D.; Chen, C.; Ge, J.; Muller-Karger, F.E.; Liu, J.; Yu, F.; He, M.X. On the recurrent Ulva prolifera blooms in the Yellow Sea and East China Sea. J. Geophys. Res. Ocean. 2010, 115. [Google Scholar] [CrossRef]
- Zhang, J.; Huo, Y.; Wu, H.; Yu, K.; Kim, J.K.; Yarish, C.; Qin, Y.; Liu, C.; Xu, R.; He, P. The origin of the Ulva macroalgal blooms in the Yellow Sea in 2013. Mar. Pollut. Bull. 2014, 89, 276–283. [Google Scholar] [CrossRef] [PubMed]
- Zhao, J.; Jiang, P.; Liu, Z.; Wei, W.; Lin, H.; Li, F.; Wang, J.; Qin, S. The Yellow Sea green tides were dominated by one species, Ulva (Enteromorpha) prolifera, from 2007 to 2011. Chin. Sci. Bull. 2013, 58, 2298–2302. [Google Scholar] [CrossRef]
- Bao, M.; Guan, W.; Yang, Y.; Cao, Z.; Chen, Q. Drifting trajectories of green algae in the western Yellow Sea during the spring and summer of 2012. Estuar. Coast. Shelf Sci. 2015, 163, 9–16. [Google Scholar] [CrossRef]
- Cui, T.-W.; Zhang, J.; Sun, L.-E.; Jia, Y.-J.; Zhao, W.; Wang, Z.-L.; Meng, J.-M. Satellite monitoring of massive green macroalgae bloom (GMB): Imaging ability comparison of multi-source data and drifting velocity estimation. Int. J. Remote Sens. 2012, 33, 5513–5527. [Google Scholar] [CrossRef]
- Xu, Q.; Zhang, H.; Cheng, Y.; Zhang, S.; Zhang, W. Monitoring and tracking the green tide in the Yellow Sea with satellite imagery and trajectory model. IEEE J. Sel. Top. Appl. Earth Obs. Remote Sens. 2016, 9, 5172–5181. [Google Scholar] [CrossRef]
- Liu, X.; Wang, Z.; Fan, S.; Zhang, X.; Li, R.; Li, Y. The distribution of green algal micro-propagules and macroalgae at the early stage of green tide in the coastal area of South Jiangsu Province in 2014. J. Ocean Univ. China 2017, 16, 81–86. [Google Scholar] [CrossRef]
- Xing, Q.; An, D.; Zheng, X.; Wei, Z.; Wang, X.; Li, L.; Tian, L.; Chen, J. Monitoring seaweed aquaculture in the Yellow Sea with multiple sensors for managing the disaster of macroalgal blooms. Remote Sens. Environ. 2019, 231, 111279. [Google Scholar] [CrossRef]
- Liu, F.; Pang, S.J.; Xu, N.; Shan, T.F.; Sun, S.; Hu, X.; Yang, J.Q. Ulva diversity in the Yellow Sea during the large-scale green algal blooms in 2008–2009. Phycol. Res. 2010, 58, 270–279. [Google Scholar] [CrossRef]
- Li, Y.; Song, W.; Xiao, J.; Wang, Z.; Fu, M.; Zhu, M.; Li, R.; Zhang, X.; Wang, X. Tempo-spatial distribution and species diversity of green algae micro-propagules in the Yellow Sea during the large-scale green tide development. Harmful Algae 2014, 39, 40–47. [Google Scholar] [CrossRef]
- Duan, W.; Guo, L.; Sun, D.; Zhu, S.; Chen, X.; Zhu, W.; Xu, T.; Chen, C. Morphological and molecular characterization of free-floating and attached green macroalgae Ulva spp. in the Yellow Sea of China. J. Appl. Phycol. 2012, 24, 97–108. [Google Scholar] [CrossRef]
- Song, W.; Peng, K.; Xiao, J.; Li, Y.; Wang, Z.; Liu, X.; Fu, M.; Fan, S.; Zhu, M.; Li, R. Effects of temperature on the germination of green algae micro-propagules in coastal waters of the Subei Shoal, China. Estuar. Coast. Shelf Sci. 2015, 163, 63–68. [Google Scholar] [CrossRef]
- Qi, L.; Hu, C.; Xing, Q.; Shang, S. Long-term trend of Ulva prolifera blooms in the western Yellow Sea. Harmful Algae 2016, 58, 35–44. [Google Scholar] [CrossRef] [PubMed]
- Zhang, T.; Wang, X. Release and microbial degradation of dissolved organic matter (DOM) from the macroalgae Ulva prolifera. Mar. Pollut. Bull. 2017, 125, 192–198. [Google Scholar] [CrossRef] [PubMed]
- Song, X.K.; Shi, Y.J.; Liu, A.Y.; Xing, H.Y.; Jiang, H.C.; Wang, W.J.; Zhang, L.M. The impact of green tide on the phytoplankton community in Yellow Sea. Appl. Mech. Mater. 2013, 260, 1130–1137. [Google Scholar] [CrossRef]
- Pereira, R.; Yarish, C. The role of Porphyra in sustainable culture systems: Physiology and applications. In Seaweeds and Their Role in Globally Changing Environments; Springer: Berlin/Heidelberg, Germany, 2010; pp. 339–354. [Google Scholar]
- Kim, J.K.; Yarish, C.; Hwang, E.K.; Park, M.; Kim, Y.; Kim, J.K.; Yarish, C.; Hwang, E.K.; Park, M.; Kim, Y. Seaweed aquaculture: Cultivation technologies, challenges and its ecosystem services. Algae 2017, 32, 1–13. [Google Scholar] [CrossRef]
- Charlier, R.H.; Morand, P.; Finkl, C.W.; Thys, A.C. Dealing with green tides on Brittany and Florida Coasts. In International Symposium on Environmental Science and Technology; HAL Open Science: Lyon, France, 2007; pp. 1435–1441. [Google Scholar]
- Cai, L.; Zhou, M.; Liu, J.; Tang, D.; Zuo, J. HY-1C observations of the impacts of islands on suspended sediment distribution in Zhoushan coastal waters, China. Remote Sens. 2020, 12, 1766. [Google Scholar] [CrossRef]
- Liu, J.; Liu, J.; Ding, J.; Lu, Y. A refined imagery algorithm to extract green tide in the Yellow Sea from HY-1C satellite CZI measurements. Haiyang Xuebao 2022, 44, 1–11. [Google Scholar]
- Tang, L.; Lu, Y.; Jiao, J.; Liu, J.; Hu, L.; Ding, J.; Xing, Q.; Wang, F.; Song, Q.; Chen, Y.; et al. High-precision monitoring of green tide biomass in the Yellow Sea of China through optical remote sensing. Natl. Remote Sens. Bull. 2023, 27, 2484–2498. [Google Scholar]
- Xing, Q.; Hu, C. Mapping macroalgal blooms in the Yellow Sea and East China Sea using HJ-1 and Landsat data: Application of a virtual baseline reflectance height technique. Remote Sens. Environ. 2016, 178, 113–126. [Google Scholar] [CrossRef]
- Hu, C. A novel ocean color index to detect floating algae in the global oceans. Remote Sens. Environ. 2009, 113, 2118–2129. [Google Scholar] [CrossRef]
- Huang, S.; Tang, L.; Hupy, J.P.; Wang, Y.; Shao, G.F. A commentary review on the use of normalized difference vegetation index (NDVI) in the era of popular remote sensing. J. For. Res. 2021, 32, 1–6. [Google Scholar] [CrossRef]
- Xu, F.; Gao, Z.; Shang, W.; Jiang, X.; Zheng, X.; Ning, J.; Song, D. Validation of MODIS-based monitoring for a green tide in the Yellow Sea with the aid of unmanned aerial vehicle. J. Appl. Remote Sens. 2017, 11, 012007. [Google Scholar] [CrossRef]
- Liu, D.; Yu, J. Otsu method and K-means. In Proceedings of the 2009 Ninth International Conference on Hybrid Intelligent Systems, Shenyang, China, 12–14 August 2009; IEEE: Piscataway, NJ, USA, 2009; Volume 1, pp. 344–349. [Google Scholar]
- Gu, X.F.; Chen, X.F.; Yin, Q.; Li, Z.Q.; Xu, H.; Shao, Y.; Li, Z.W. Stereoscopic remote sensing used in monitoring enteromorpha prolifra disaster in chinese yellow sea. Spectrosc. Spectr. Anal. 2011, 31, 1627–1632. [Google Scholar]
- Kim, K.; Shin, J.; Ryu, J.H. Application of multi-satellite sensors to estimate the green-tide area. Korean J. Remote Sens. 2018, 34, 339–349. [Google Scholar]
- Yang, D.; Yuen, K.-V.; Gu, X.; Sun, C.; Gao, L. Influences of environmental factors on the dissipation of green tides in the Yellow Sea, China. Mar. Pollut. Bull. 2023, 189, 114737. [Google Scholar] [CrossRef] [PubMed]
- Hu, L.; Hu, C.; He, M.-X. Remote estimation of biomass of Ulva prolifera macroalgae in the Yellow Sea. Remote Sens. Environ. 2017, 192, 217–227. [Google Scholar] [CrossRef]
- Liu, D.; Keesing, J.K.; He, P.; Wang, Z.; Shi, Y.; Wang, Y. The world’s largest macroalgal bloom in the Yellow Sea, China: Formation and implications. Estuar. Coast. Shelf Sci. 2013, 129, 2–10. [Google Scholar] [CrossRef]
- Xiao, Y.; Zhang, J.; Cui, T.; Gong, J.; Liu, R.; Chen, X.; Liang, X. Remote sensing estimation of the biomass of floating Ulva prolifera and analysis of the main factors driving the interannual variability of the biomass in the Yellow Sea. Mar. Pollut. Bull. 2019, 140, 330–340. [Google Scholar] [CrossRef] [PubMed]
- Taylor, R.; Fletcher, R.L.; Raven, J.A. Preliminary studies on the growth of selected ‘green tide’algae in laboratory culture: Effects of irradiance, temperature, salinity and nutrients on growth rate. Bot. Mar. 2001, 44, 327–336. [Google Scholar] [CrossRef]
- Lee, J.H.; Pang, I.C.; Moon, I.J.; Ryu, J.H. On physical factors that controlled the massive green tide occurrence along the southern coast of the Shandong Peninsula in 2008: A numerical study using a particle-tracking experiment. J. Geophys. Res. Ocean. 2011, 116. [Google Scholar] [CrossRef]
- Xu, Q.; Zhang, H.; Ju, L.; Chen, M. Interannual variability of Ulva prolifera blooms in the Yellow Sea. Int. J. Remote Sens. 2014, 35, 4099–4113. [Google Scholar] [CrossRef]
- Fan, S.; Fu, M.; Wang, Z.; Zhang, X.; Song, W.; Li, Y.; Liu, G.; Shi, X.; Wang, X.; Zhu, M. Temporal variation of green macroalgal assemblage on Porphyra aquaculture rafts in the Subei Shoal, China. Estuar. Coast. Shelf Sci. 2015, 163, 23–28. [Google Scholar] [CrossRef]
- Teichberg, M.; Fox, S.E.; Olsen, Y.S.; Valiela, I.; Martinetto, P.; Iribarne, O.; Muto, E.Y.; Petti, M.A.V.; Corbisier, T.N.; Soto-Jimenez, M.F.; et al. Eutrophication and macroalgal blooms in temperate and tropical coastal waters: Nutrient enrichment experiments with Ulva spp. Glob. Change Biol. 2010, 16, 2624–2637. [Google Scholar] [CrossRef]
- Nelson, T.A.; Haberlin, K.; Nelson, A.V.; Ribarich, H.; Hotchkiss, R.; Van Alstyne, K.L.; Buckingham, L.; Simunds, D.J.; Fredrickson, K. Ecological and physiological controls of species composition in green macroalgal blooms. Ecology 2008, 89, 1287–1298. [Google Scholar] [CrossRef] [PubMed]


| Satellite | Sensor | Resolution (m) | Frequencies Used |
|---|---|---|---|
| HY-1C, HY-1D | CZI | 50 | 2019~2023 |
| Terra, Aqua | MODIS | 250 | 2008~2018 |
| GF1, GF6 | MUX | 16 | 85 scenes |
| HJ-2A, HJ-2B | MUX | 16 | 59 scenes |
| GF3, RADARSAT-2 | SAR | 10, 25 | 47 scenes |
| Years | First Appearance Date | Peak Coverage Date | Peak Coverage Area (km2) | Peak Distribution Area (km2) | Demise Date | Duration Days |
|---|---|---|---|---|---|---|
| 2008 | 10 May | 28 Jun | 633 | 17,828 | 19 Aug | 102 |
| 2009 | 27 May | 15 Jul | 848 | 23,419 | 31 Aug | 97 |
| 2010 | 2 Jun | 6 Jul | 485 | 29,199 | 9 Aug | 69 |
| 2011 | 1 Jun | 19 Jun | 555 | 12,472 | 22 Aug | 83 |
| 2012 | 17 May | 6 Jul | 120 | 10,125 | 23 Aug | 99 |
| 2013 | 22 May | 29 Jun | 674 | 16,638 | 19 Aug | 90 |
| 2014 | 15 May | 28 Jun | 875 | 29,472 | 22 Aug | 100 |
| 2015 | 20 May | 21 Jun | 581 | 56,310 | 14 Aug | 87 |
| 2016 | 19 May | 17 Jun | 562 | 51,862 | 4 Aug | 78 |
| 2017 | 18 May | 17 Jun | 299 | 36,126 | 26 Jul | 70 |
| 2018 | 23 May | 21 Jul | 179 | 25,062 | 24 Aug | 94 |
| 2019 | 12 May | 5 Jul | 447 | 58,019 | 9 Sep | 121 |
| 2020 | 27 May | 14 Jun | 176 | 15,216 | 1 Aug | 67 |
| 2021 | 21 May | 19 Jun | 1598 | 59,440 | 25 Aug | 97 |
| 2022 | 16 May | 24 Jun | 240 | 24,787 | 26 Aug | 103 |
| 2023 | 9 May | 22 Jun | 939 | 53,644 | 26 Aug | 110 |
Disclaimer/Publisher’s Note: The statements, opinions and data contained in all publications are solely those of the individual author(s) and contributor(s) and not of MDPI and/or the editor(s). MDPI and/or the editor(s) disclaim responsibility for any injury to people or property resulting from any ideas, methods, instructions or products referred to in the content. |
© 2024 by the authors. Licensee MDPI, Basel, Switzerland. This article is an open access article distributed under the terms and conditions of the Creative Commons Attribution (CC BY) license (https://creativecommons.org/licenses/by/4.0/).
Share and Cite
Zhan, Y.; Qiu, Z.; Wang, Y.; Su, Y.; Li, Y.; Cui, Y.; Qu, S.; Wang, P.; Rong, X. Long-Term Spatiotemporal Characteristics of Ulva prolifera Green Tide and Effects of Environmental Drivers on Its Monitoring by Satellites: A Case Study in the Yellow Sea, China, from 2008 to 2023. J. Mar. Sci. Eng. 2024, 12, 630. https://doi.org/10.3390/jmse12040630
Zhan Y, Qiu Z, Wang Y, Su Y, Li Y, Cui Y, Qu S, Wang P, Rong X. Long-Term Spatiotemporal Characteristics of Ulva prolifera Green Tide and Effects of Environmental Drivers on Its Monitoring by Satellites: A Case Study in the Yellow Sea, China, from 2008 to 2023. Journal of Marine Science and Engineering. 2024; 12(4):630. https://doi.org/10.3390/jmse12040630
Chicago/Turabian StyleZhan, Yating, Zhongfeng Qiu, Yujun Wang, Yiming Su, Yin Li, Yanmei Cui, Shuai Qu, Peng Wang, and Xin Rong. 2024. "Long-Term Spatiotemporal Characteristics of Ulva prolifera Green Tide and Effects of Environmental Drivers on Its Monitoring by Satellites: A Case Study in the Yellow Sea, China, from 2008 to 2023" Journal of Marine Science and Engineering 12, no. 4: 630. https://doi.org/10.3390/jmse12040630
APA StyleZhan, Y., Qiu, Z., Wang, Y., Su, Y., Li, Y., Cui, Y., Qu, S., Wang, P., & Rong, X. (2024). Long-Term Spatiotemporal Characteristics of Ulva prolifera Green Tide and Effects of Environmental Drivers on Its Monitoring by Satellites: A Case Study in the Yellow Sea, China, from 2008 to 2023. Journal of Marine Science and Engineering, 12(4), 630. https://doi.org/10.3390/jmse12040630