Article

Optimal Planning for Wind Turbines in Mega Seaports Considering Practical Application Constraints: A Case Study of Ningbo-Zhoushan Port

1
School of Transportation and Logistics Engineering, Wuhan University of Technology, 1178 Heping Street, Wuhan 430063, China
2
Ningbo Zhoushan Port Group Co., Ltd., 269 Ningdong Road, Ningbo 315100, China
3
State Key Laboratory of Maritime Technology and Safety, Wuhan University of Technology, Wuhan 430063, China
4
National Engineering Research Center for Water Transport Safety (WTS Center), Wuhan University of Technology, Wuhan 430063, China
5
Center for Research on Microgrids (CROM), AAU Energy, Aalborg University, 9220 Aalborg East, Denmark
*
Author to whom correspondence should be addressed.
J. Mar. Sci. Eng. 2024, 12(4), 631; https://doi.org/10.3390/jmse12040631
Submission received: 8 March 2024 / Revised: 3 April 2024 / Accepted: 5 April 2024 / Published: 8 April 2024
(This article belongs to the Section Ocean Engineering)

Abstract

:
In the context of global carbon neutrality, ports face significant electricity demand for cargo handling and pressure to reduce carbon emissions. The abundant wind energy resources in port areas make wind power highly promising for port applications. The optimal selection of site and turbine types for wind power systems can effectively reduce emissions in ports, achieving sustainability and improving economic benefits. The practical implementation of wind energy systems considering practical constraints holds significant research significance. Taking Ningbo-Zhoushan Port as an example, this paper analyzes the wind energy resources in the port area and provides an overview of wind power system construction sites. Based on the actual conditions of the port area, this paper comprehensively reviews the site selection of wind turbines from the perspectives of wind resources, specific climates, and noise impacts. With the consideration of engineering preferences, this paper selects performance indicators based on the four mainstream turbine models and proposes a comprehensive weight determination method using the entropy weight method and analytic hierarchy process (AHP) to determine the weights of the indicators. The Technique for Order of Preference by Similarity to Ideal Solution (TOPSIS) method is then employed to score and compare four turbine plans, enabling the turbine selection process to consider both engineering preferences and objectivity, thereby enhancing the accuracy and reliability of wind turbine planning and achieving significant ecological and economic benefits through benefit analysis.

1. Introduction

The port is the interface for maritime transportation and serves as the engine of port cities. The economic development of modern society relies heavily on ports. At the same time, ports are involved in the industrial and commercial sectors and have enormous energy demands [1,2]. With these increasing energy demands, ports face significant pressure to reduce pollution and improve economic efficiency [3]. In recent years, there has been rapid growth in the implementation of and theoretical research on wind energy, making it one of the most mature renewable energy technologies. It can provide renewable energy for industrial production and reduce energy consumption and emissions [4]. The key to the efficient utilization of wind energy lies in the design and layout of wind turbine systems. Therefore, designing efficient, reliable, and economically viable wind power systems has become an important research topic [5,6].
In recent years, the construction of wind power systems in ports has gradually developed in response to greening efforts. Unlike on land and offshore, port areas have more compact site utilization and harsher surrounding climatic conditions, with diverse variations in wind speed and wind energy [7]. When designing wind power systems, there are more complex factors to consider [8,9]. The construction of wind power systems in ports also faces difficulties and challenges in terms of safety and site utilization [10,11].
Some scholars have conducted research on the site selection of wind turbines. For example, Kazak [12] proposed a selection method based on spatial decision characteristics. They established an optimization model for selecting the optimal location of wind turbines based on spatial location factors and their weights for target site selection. Rodrigo [13] developed an evaluation method for wind turbine siting based on wind resources, considering the trade-off between the accuracy of wind conditions and costs. They analyzed wind turbine layout from the perspective of atmospheric boundary layer driving factors and site characteristics. Golestani [14] proposed a decision framework based on a game theory approach to determine the best location for installing offshore wind farms, while considering the relevant objectives of finance, performance, and availability.
In terms of wind turbine selection, Gualtieri [15] proposed a method based on the characteristics of commercial wind turbines to determine the optimal layout for onshore wind farms. Narayanamoorthy [16] in order to handle the various ambiguities and complex hesitancies caused by the selection of turbine models, employs the newly proposed Normal Wiggly Hesitant Fuzzy (NWHF) method for criterion importance through intercriteria correlation (NWHF-CRITIC) and the Normal Wiggly Hesitant Fuzzy multi-attribute utility theory (NWHF-mat). These methods are used to rank turbine models based on criteria such as quality, power level, voltage, and capacity. Xu [17] established a comprehensive evaluation model for wind turbine selection based on BP neural networks and optimized it using the particle swarm algorithm. However, the diversity of evaluation criteria, uncertainty in the decision environment, and different risk preferences of decision-makers can all influence wind turbine selection. To address such issues, Yang [18] proposed a hybrid multi-criteria decision-making framework and validated its robustness and reliability through sensitivity and comparative analysis. Pang [19] clarified the relationships between evaluation indicators and introduced triangular fuzzy numbers to accurately reflect experts’ preference information. They combined fuzzy preference programming with network analysis to construct a fuzzy analytic network process model for wind turbine selection. Li [20] proposed a selection decision system for offshore wind turbines that combines principal component analysis with D numbers theory to reduce the subjectivity and uncertainty of expert judgment. Wang et al. [21] used the Dempster–Shafer evidence theory to handle uncertain information in the selection process and combined it with multi-criteria decision-making methods to establish a decision model for offshore wind turbine selection.
Based on the analysis above, it can be seen that most of the current research focuses on the design of onshore or offshore wind turbines, with relatively little emphasis on wind turbine design specifically for port environments. Coastal ports, as important hubs for sea and land transportation, have unique geographical locations, complex climatic environments, high site utilization rates, and existing port machinery and power infrastructure. These factors present more challenging issues in terms of wind turbine siting and selection. In this study, we focus on the Chuanshan Port Area of Ningbo-Zhoushan Port as the research object. Firstly, we analyze the basic requirements for wind turbine selection and siting in port environments. Based on these requirements, we select four types of commercial wind turbines and use a multi-criteria decision-making method to choose the optimal wind turbine type.
The rest of the paper is organized as follows. Section 2 introduces the studied port in the present research. The basic requirements for the site and type selection of wind turbines are introduced in Section 3, and then, the type selection of wind turbines is determined based on the proposed AHP–entropy weight–TOPSIS method in Section 4. In Section 5, the proposed method is applied to the case of Ningbo-Zhoushan Port, and the whole work is concluded in Section 6.

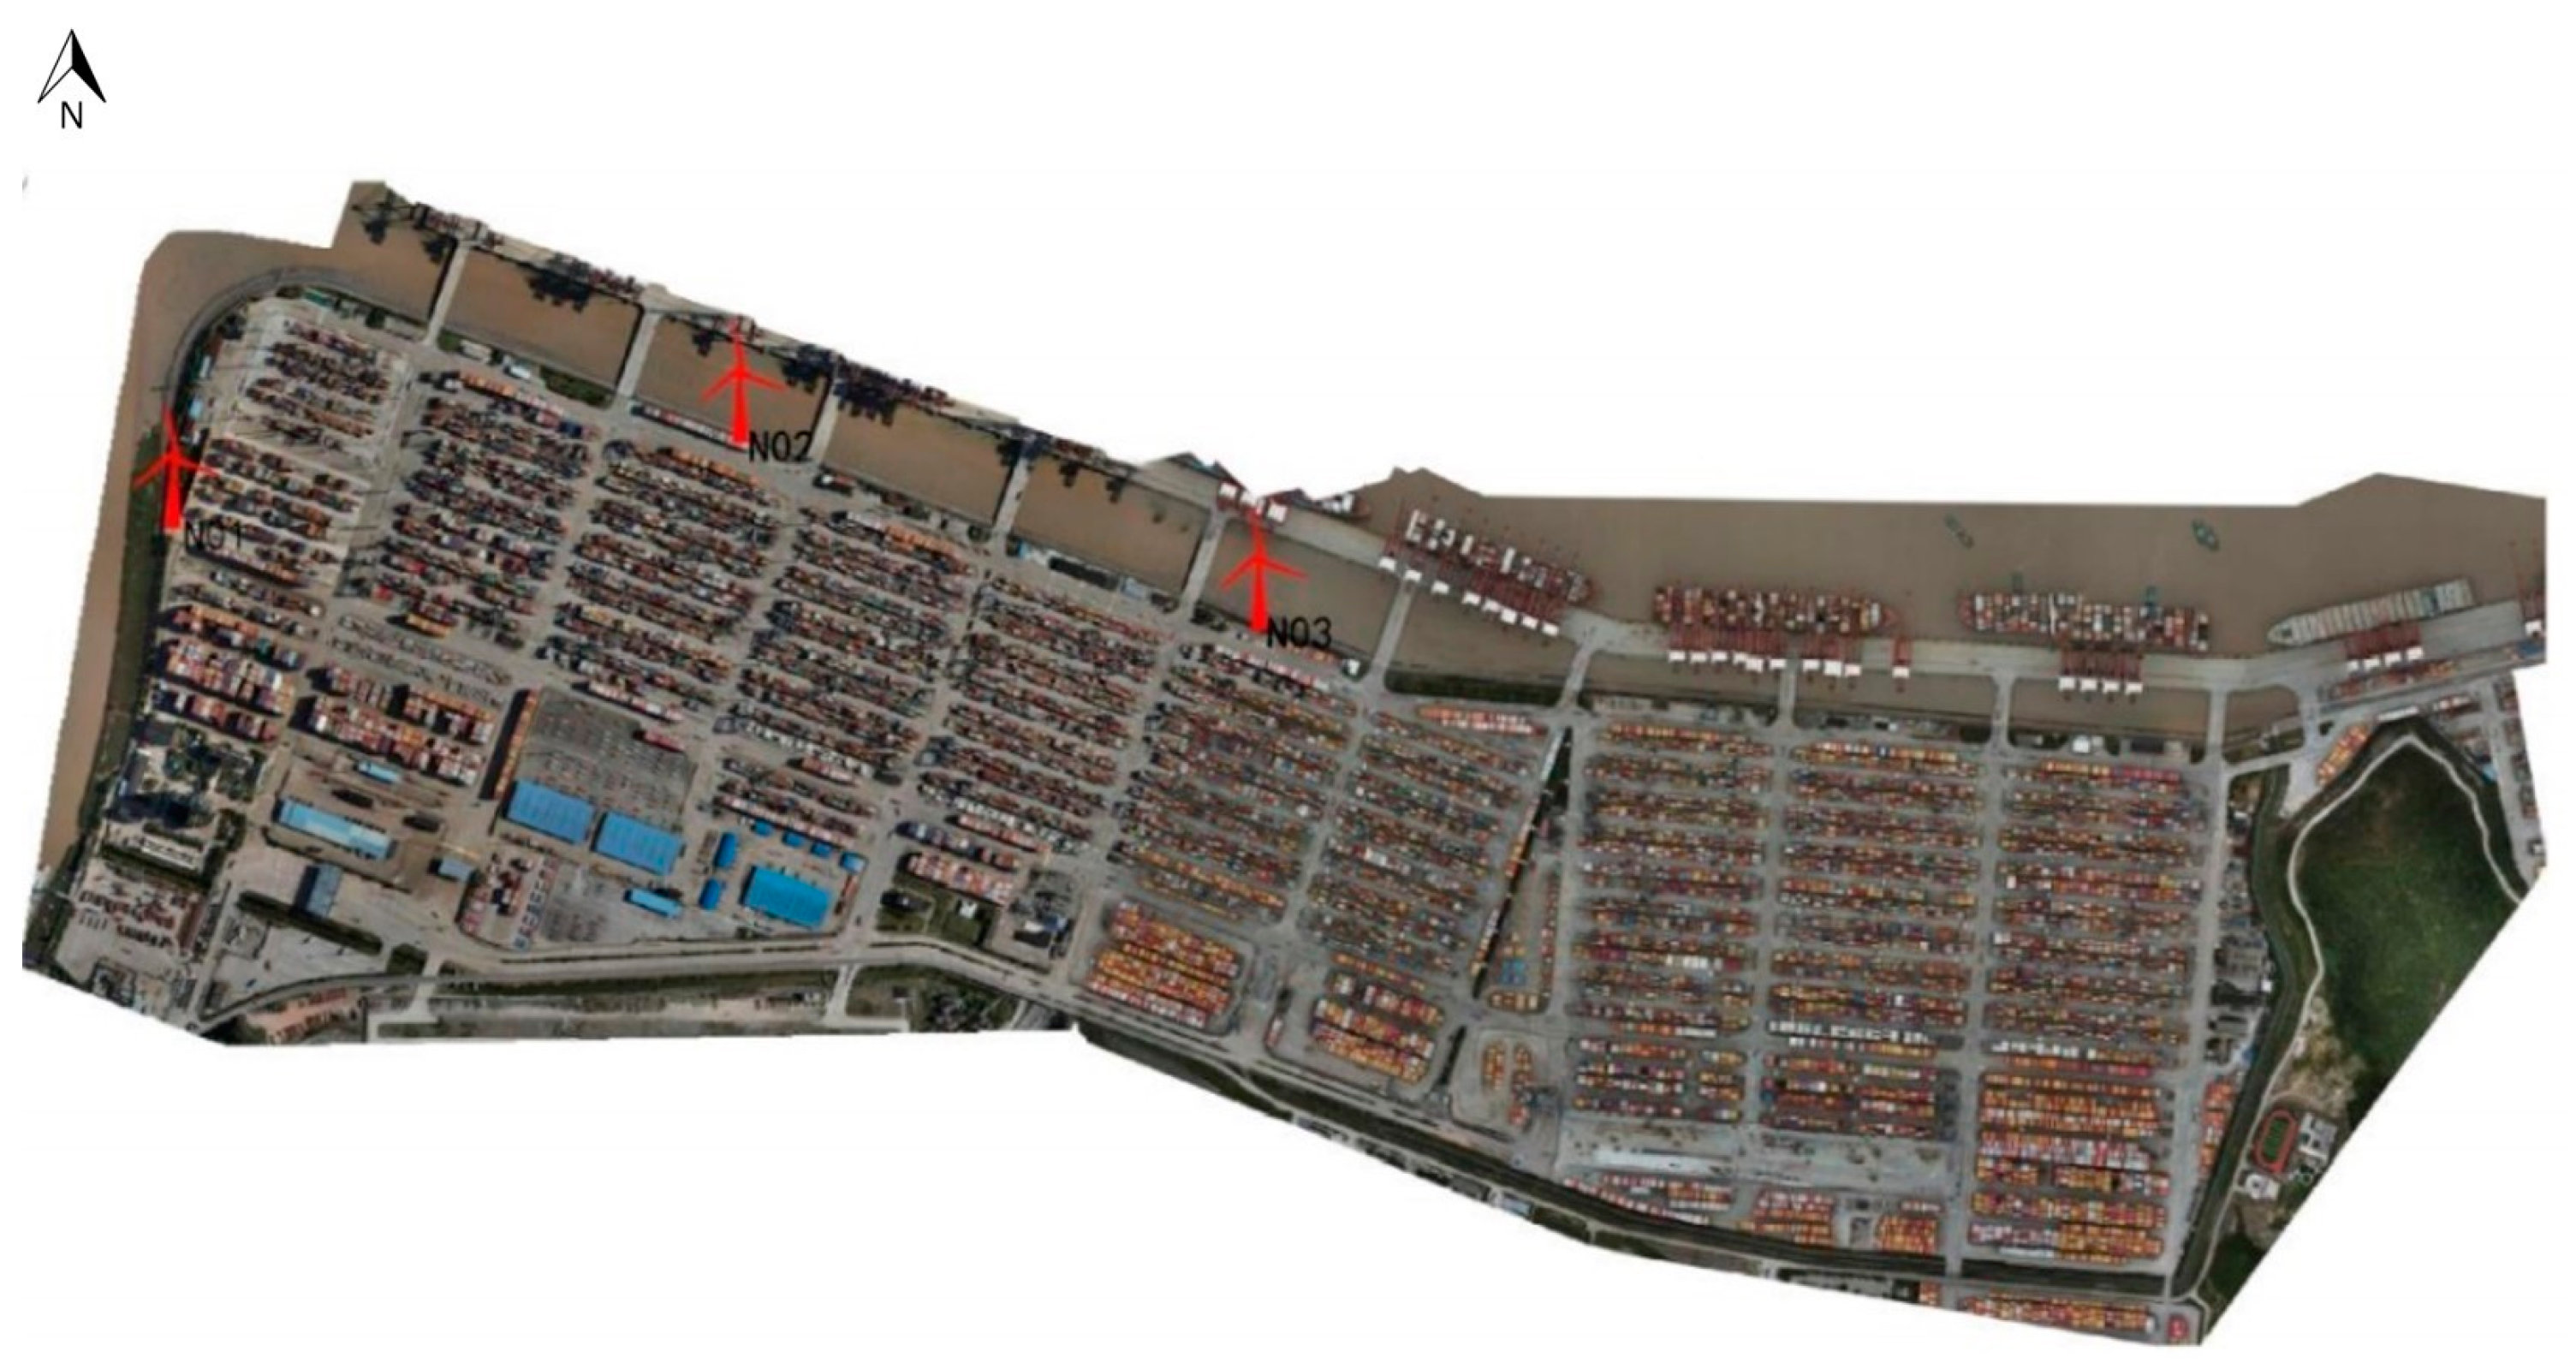
2. Overview of the Considered Port

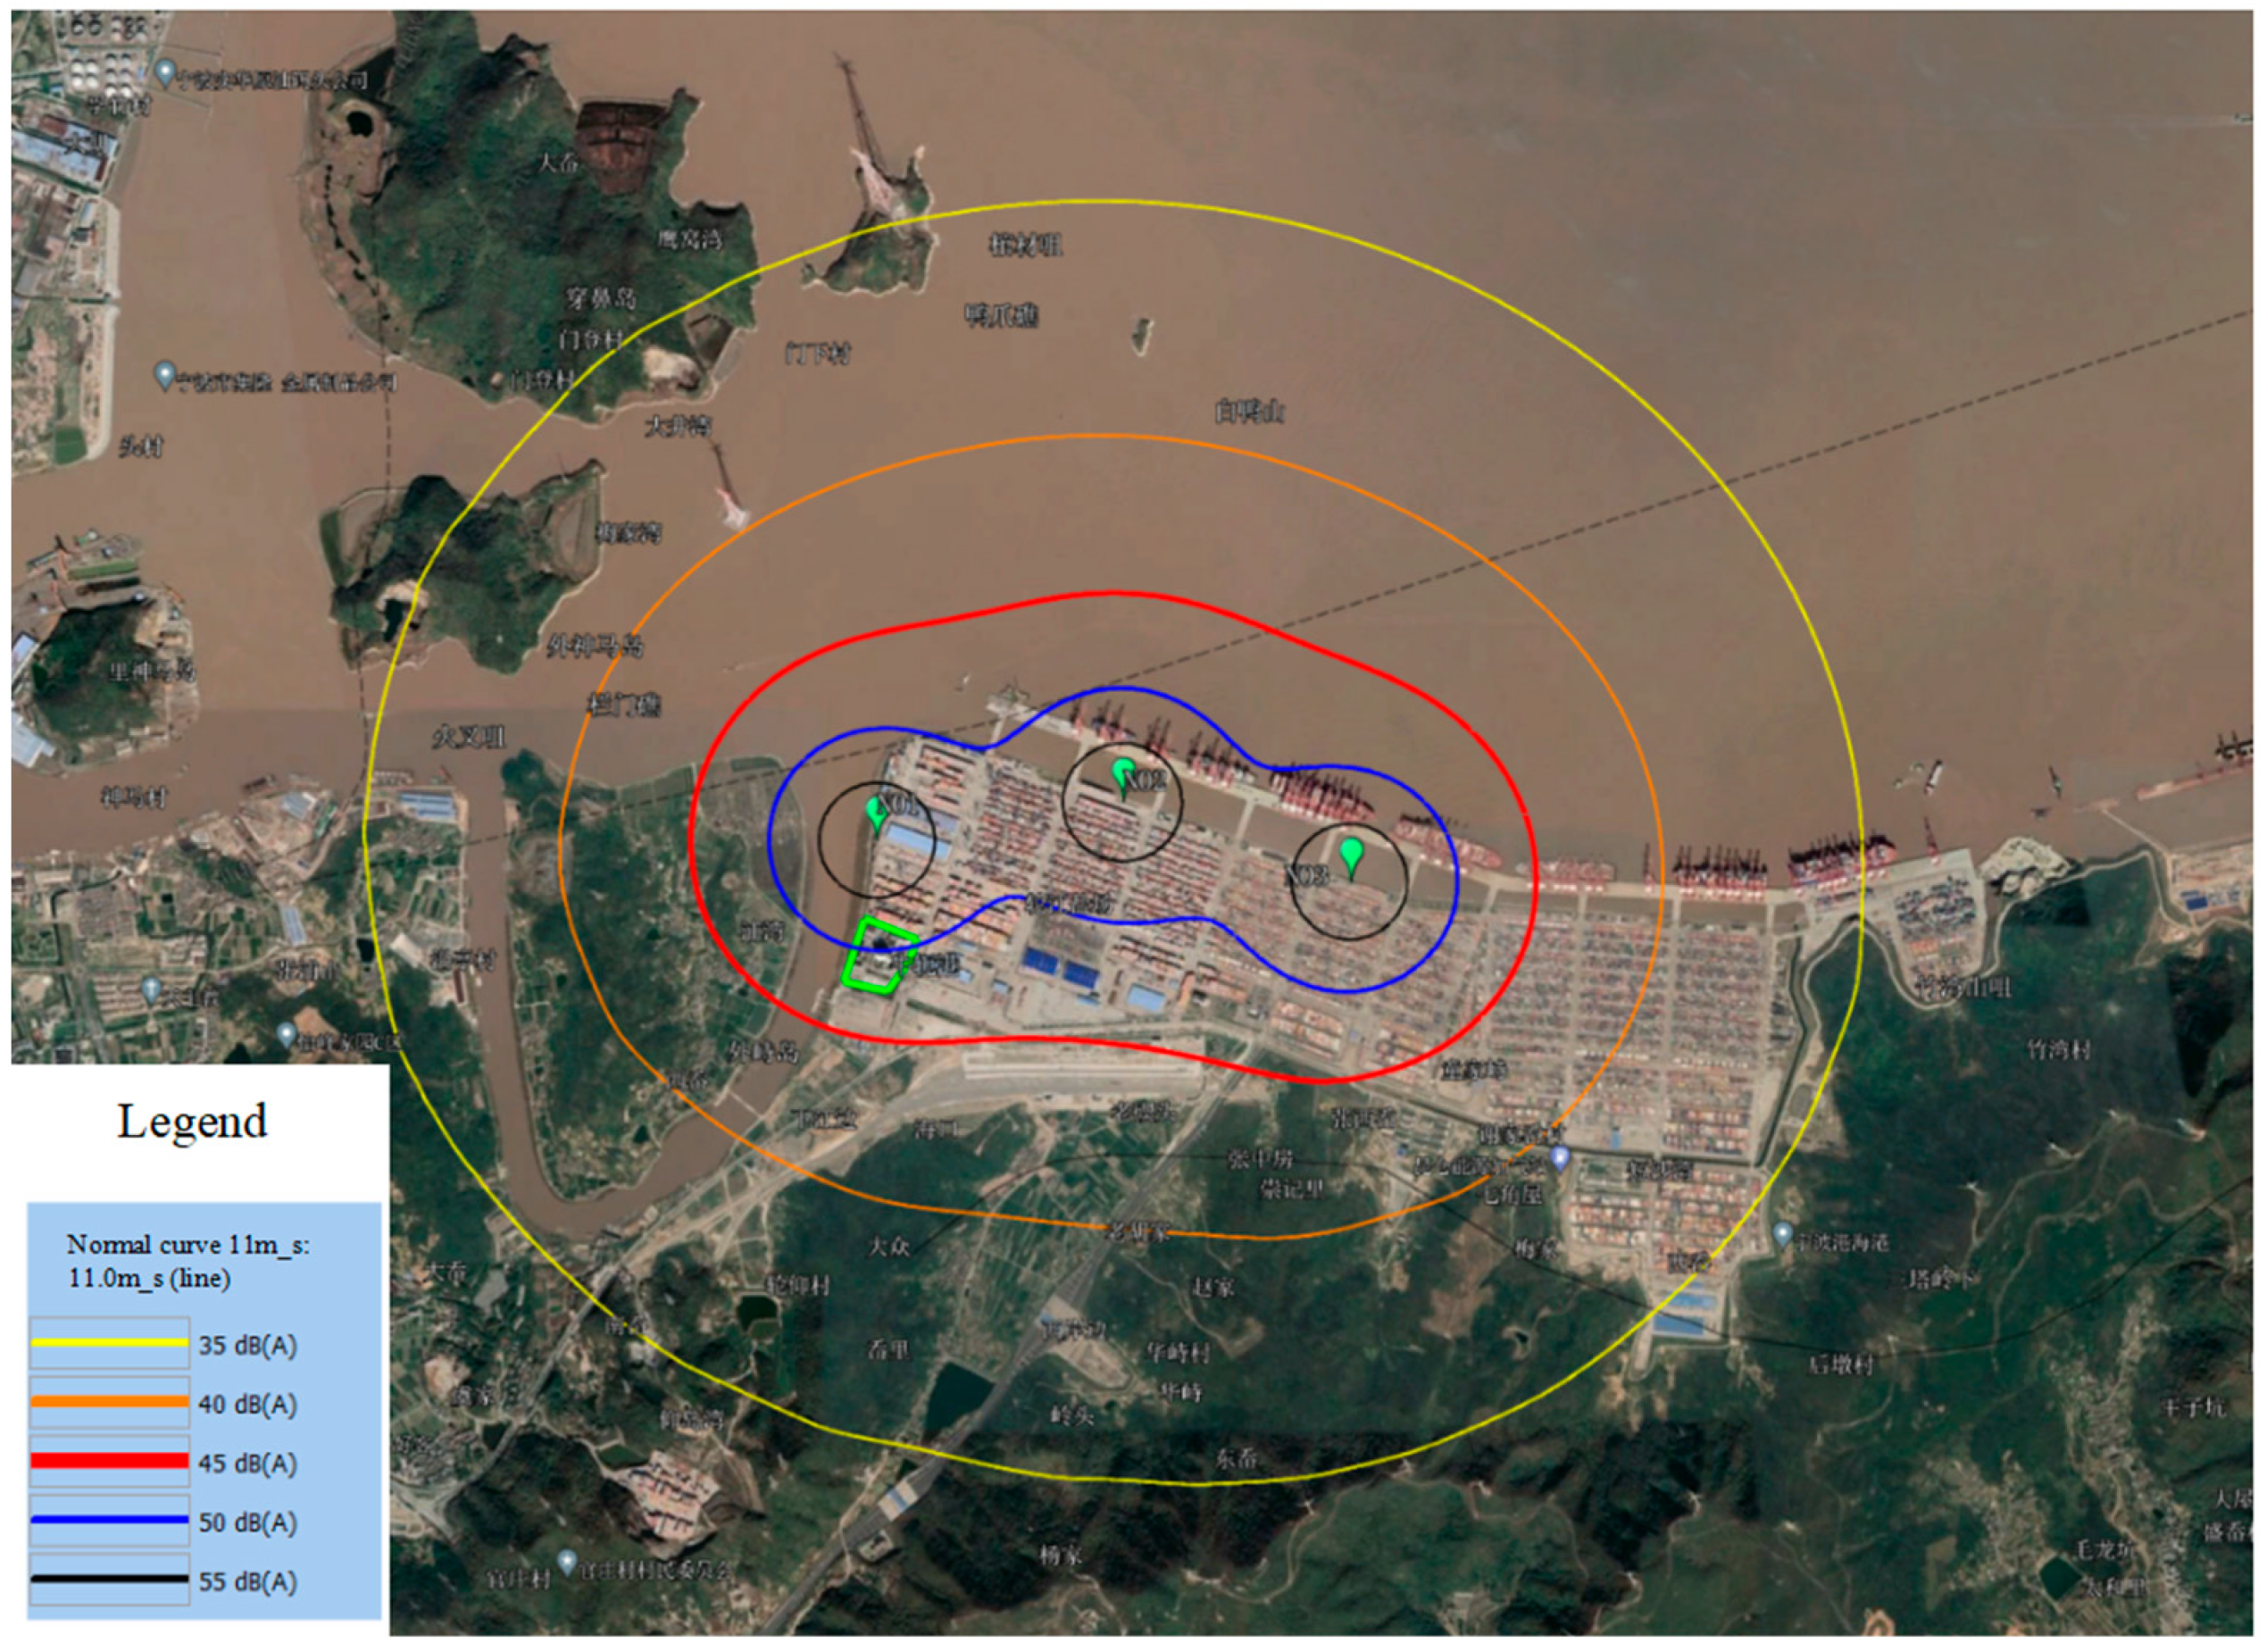
Ningbo-Zhoushan Port is the largest port in the world, and the Chuanshan Port Area is the largest port area under Zhoushan Port. The port area has a storage yard area of 1.837 million square meters, with a total of 163 gantry cranes, 49 bridge cranes, and a total quay length of 3740 m. Additionally, it is the second-largest container terminal globally, accounting for nearly 40% of the annual container volume of the entire Ningbo-Zhoushan Port. Since 2017, it has been handling over 10 million standard containers in transshipments annually. The port area has a front water depth of 17–22 m and is equipped with 11 deep-water berths for containers, capable of simultaneously berthing multiple large container vessels.
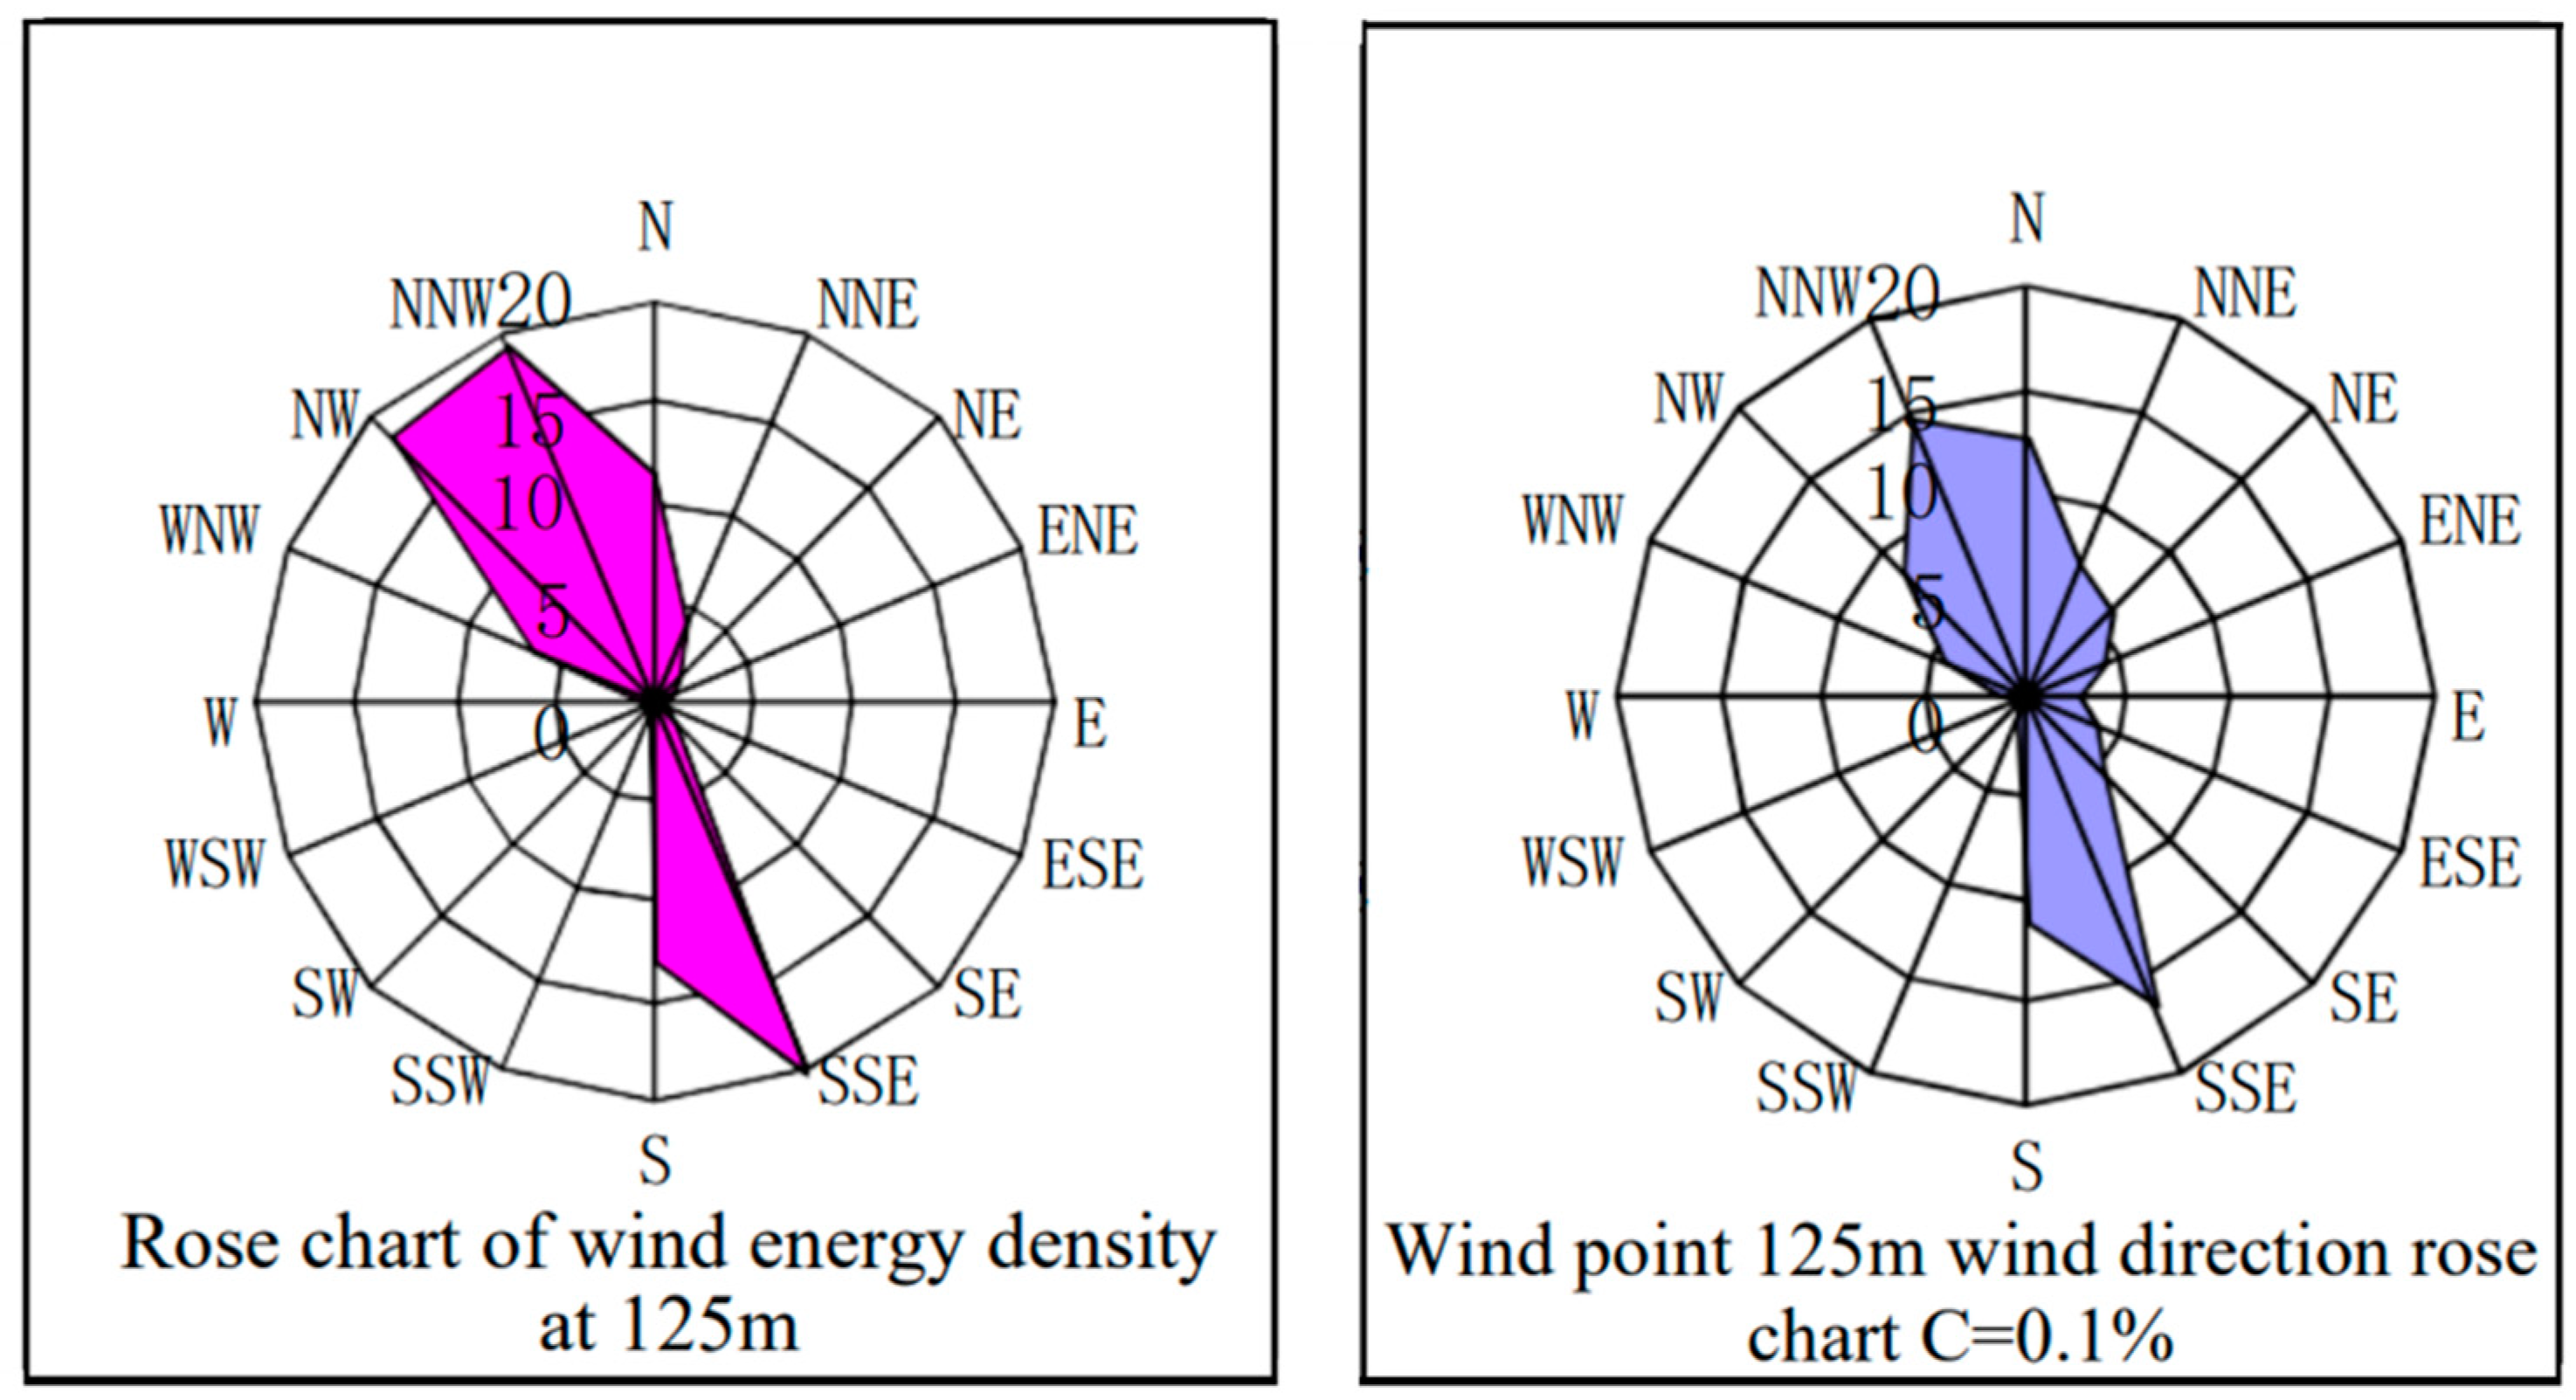
Figure 1 shows the distribution of wind speed and wind direction in the Chuanshan Port Area of Ningbo-Zhoushan Port in 2022. From the figure, it can be observed that the prevailing wind directions in the Chuanshan Port Area in 2022 were NNW (north–northwest) and SSE (south–southeast), while the predominant wind energy directions were NW (northwest) and NNW. The distribution of wind energy density follows a similar pattern to the frequency of wind directions, indicating a higher concentration compared to the wind directions [22,23]. 
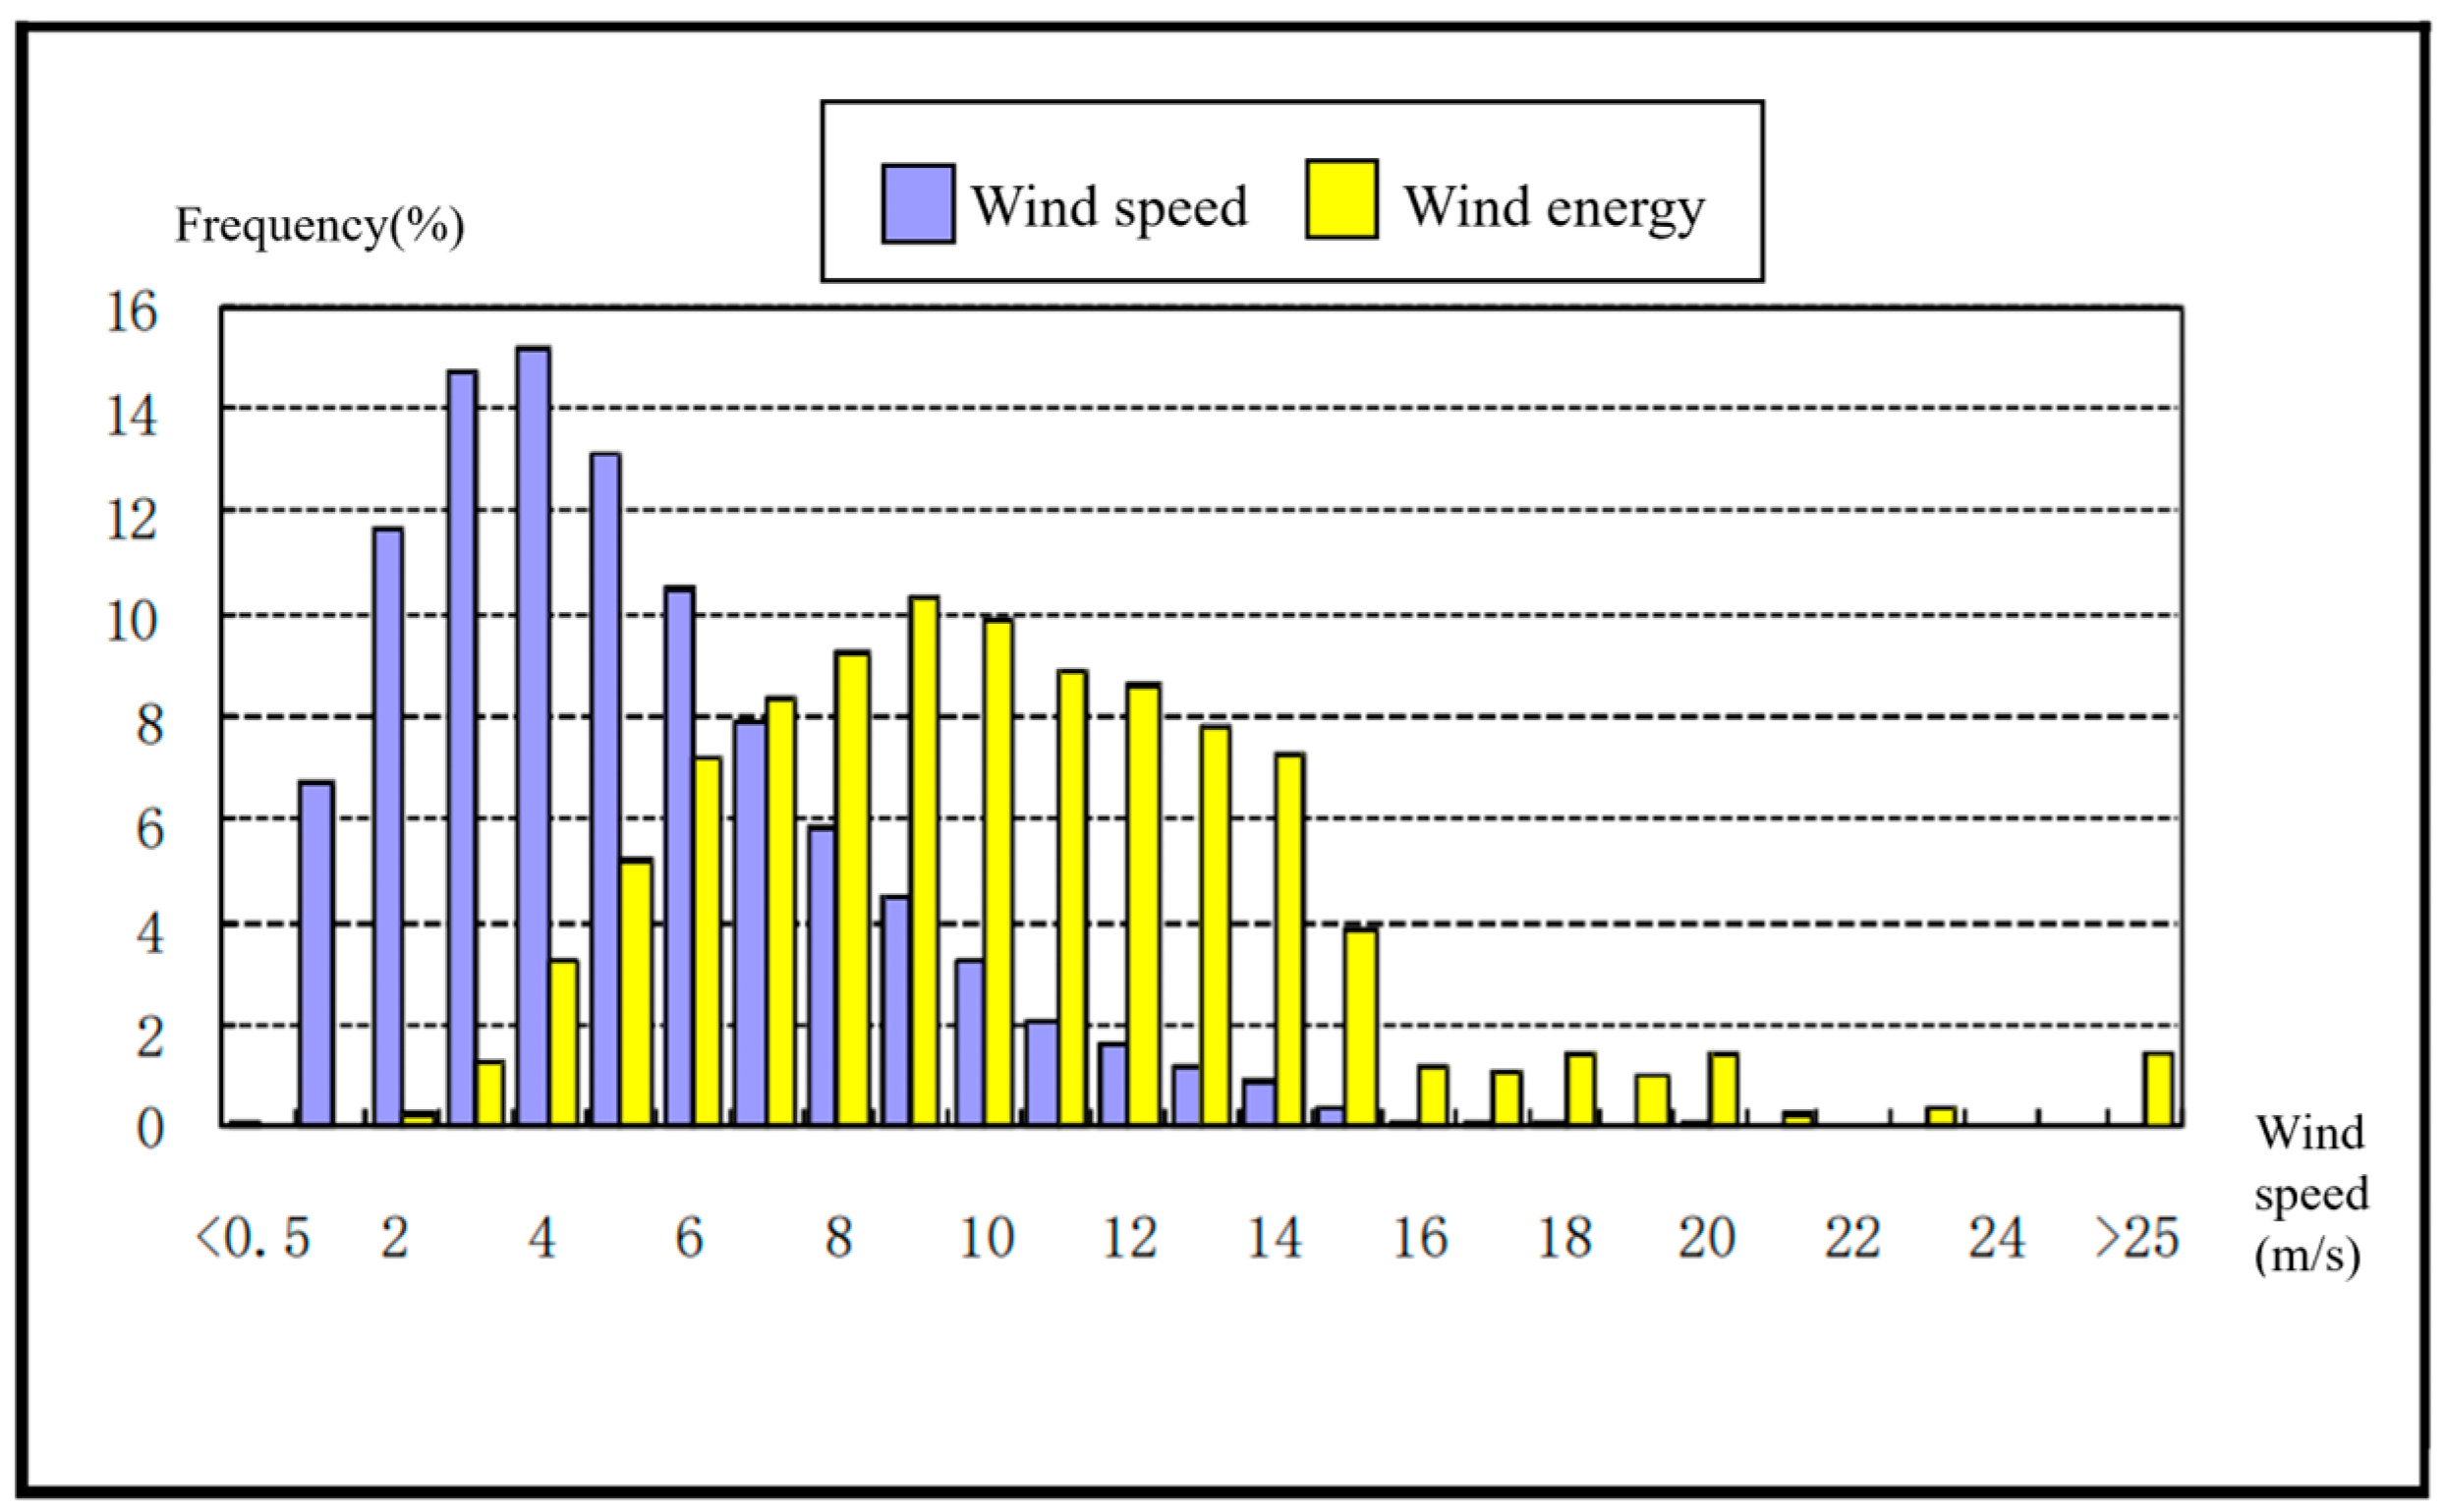
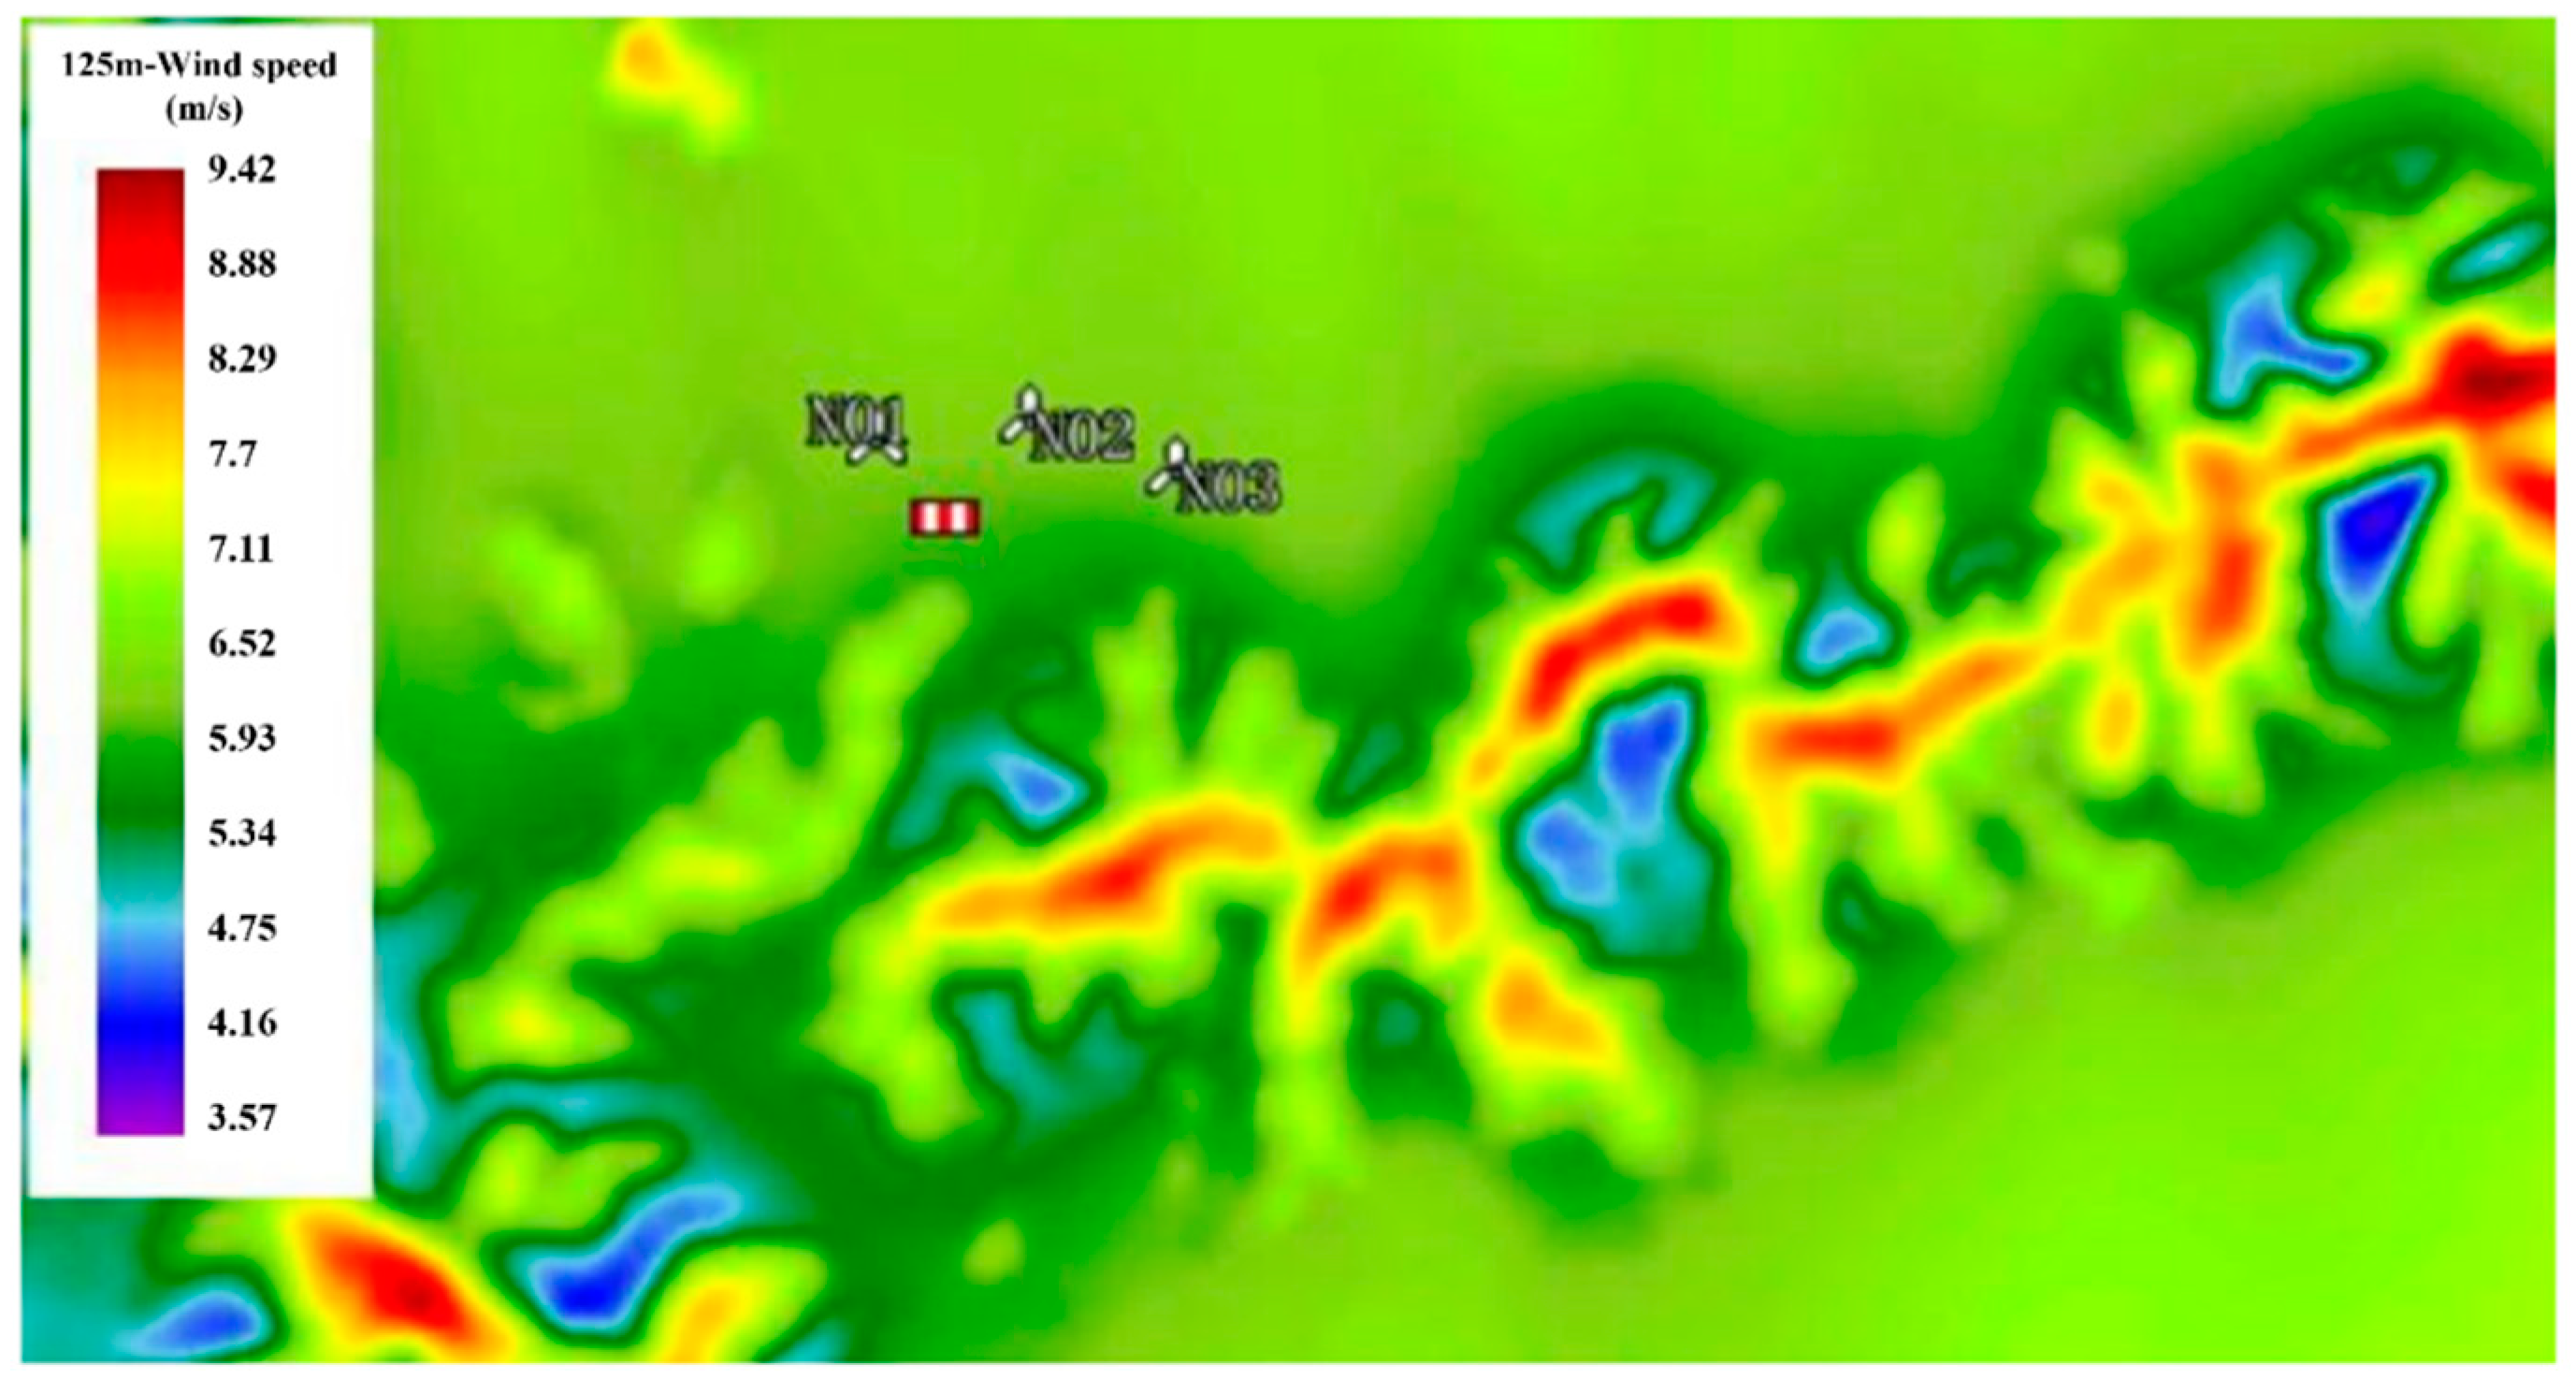
Figure 2 displays the distribution of wind speed and wind energy at a height of 125 m in the Chuanshan Port Area of Ningbo-Zhoushan Port. It can be observed that the wind speeds mainly range from 2 to 8 m/s, with an annual average wind speed of 5.03 m/s. The average wind power is calculated to be 197 W/m2.

3. Basic Requirements for Wind Turbine Planning

3.1. Safety Analysis

The port area has a dense layout with high land utilization and clear functional zoning. Wind turbines, being large-scale energy equipment, can pose safety hazards to the operation of equipment within the port area. Therefore, there are higher requirements for the spatial location and safety of wind turbine construction sites. This study selects potential wind turbine construction sites in the port area from the perspective of the safety distance of wind turbines and conducts a simulation analysis on the blade tip vortices generated by the turbines. Typically, the preliminary selection of wind turbine locations needs to meet the following three criteria: not interfering with the normal operation of cargo handling equipment in the storage yard, staying away from hazardous materials, and having a relatively large open area. Therefore, the space between the quay and yard sides is suitable for wind turbine installation. To study the influence of container-handling equipment (CHE), the wind turbine with the largest rotor diameter among mainstream models on the market is selected as a reference. Even under these conditions, selecting other turbine models would still meet the distance requirements. Figure 3 illustrates the mutual influence between wind turbines in one of the target areas and other operating equipment within the port area.
From Figure 3, it can be observed that installing wind turbines in the target area allows for a safety distance of 20 m from the port buildings while maintaining a significant safety distance from the quay cranes, without affecting operation in the port area. To provide a clearer visualization of the relative positions of the wind turbines, port buildings, and operating equipment, a three-dimensional positioning of the wind turbine in the port area is shown in Figure 4.
From Figure 4, it is evident that the wind turbines maintain a safe distance from the port buildings in both horizontal and vertical dimensions. The safe operation of the wind turbines indicates that the chosen sites meet the safety requirements for the construction of wind turbine units. Based on the analysis process described above, three potential construction sites that comply with the preliminary screening criteria have been identified. The coordinates for these sites are as follows: the planned construction location for the first turbine is 29.893986, 122.034032; for the second turbine, it is 29.895043, 122.04509; and for the third turbine, it is 29.888718, 122.042381. The construction locations within the port area are shown in Figure 5.
Tip vortices affect the airflow around wind turbine blades, leading to changes in the flow pattern in the tip region. These tip vortices can propagate to surrounding buildings, affecting the air flow characteristics near these structures. Such aerodynamic interference may result in changes in the pressure distribution on the surfaces of buildings, thereby affecting their aerodynamic stability and structural safety. Moreover, as tip vortices propagate, they generate noise, which may disrupt the living or working environment within nearby buildings. Therefore, further analysis of wind turbine tip vortices is crucial to ensure safety. By simulating the wind speed on the surface of the wind turbine blades, as shown in Figure 6, the influence range of the tip vortices can be determined to be approximately 1.07 times the rotor diameter (L ≈ 1.07 d). For example, when the rotor diameter is 156 m, the influence range of the tip vortices extends to 166.9 m. Similarly, when the rotor diameter is 190 m, the influence range of the tip vortices is 203.3 m. Figure 7 presents the wind speed distribution, wind direction changes, turbulence intensity, and aerodynamic parameters of the blades provided by the manufacturer at the hub height (125 m) for statistical analysis. The simulated vorticity distribution shows that the intensity of the tip vortices within the wind turbine is relatively low (0–2/s) and dissipates over a short distance (less than 1D). Therefore, the safety hazards caused by the distance between the wind turbine blade tips and surrounding buildings, as shown in Figure 3, can be considered negligible, further ensuring the safety of the engineering project.

3.2. Noise Analysis

According to the relevant regulations of GB3096-2008 [24], Chinese wind farms generally implement environmental noise limit requirements. The acoustic environment function is divided into five levels. Among them, the port area and its administrative office buildings belong to the first-level noise standard area and its implementation standards. The sound limit decibel value during the day (6:00–22:00) is 55 dB(A). The sound limit decibel value at night (22:00–6:00 the next day) is 45 dB(A) [25].
Taking the turbine model considered in this study as an example, an analysis of the noise impact of wind turbines on the office building is conducted. A turbine noise curve is shown in Figure 8. According to the standards, the office area is assessed based on Class 1 noise criteria. This noise analysis only includes the cumulative impact of turbine noise and does not consider background noise [26]. A noise contour map for the site is shown in Figure 9, with the black line representing the 55 dB(A) contour level.
From the Figure 9, it can be observed that the proposed construction sites meet the Class 1 sound environment standards, and the noise impact on sensitive areas is compliant with the requirements. Additionally, the noise levels within a 300 m radius of the turbine location are controlled below 55 dB(A).

3.3. Wind Resource Analysis

Based on Section 2 it is determined that the prevailing wind directions at a height of 125 m in the wind farm area are NNE and N, with corresponding frequencies of 12.6% and 11.7%, respectively. The main wind energy directions at a height of 125 m are NNW and N, with corresponding frequencies of 16.3% and 15.9%, respectively. In this section, a specific analysis of wind energy resources at different locations within the port area at a height of 125 m is conducted, and the wind speed distribution is shown in Figure 10. From the figure, it can be observed that the three selected turbine construction sites have similar wind speeds with no significant differences.

3.4. Extreme Climate Conditions

The studied port area is located in the southeastern region of Zhejiang Province, China. The special climatic factors that affect wind turbines in this area mainly include strong cold air outbreaks and tropical cyclones.
Taking the center of the Chuanshan Port Area as the reference point, a statistical area with a radius of 100 km is designated as the region for tracking tropical cyclones. The monthly distribution of tropical cyclones during the period from 1949 to 2021 is shown in Figure 11. From the Figure, it can be observed that the time period when tropical cyclones affect the port area is from May to September each year. The peak period of impact is in July, August, and June, with 11, 9, and 6 occurrences, respectively.
For all tropical cyclones that entered the statistical area, their intensities were categorized based on the maximum wind speed within the statistical area. The results show that typhoons have a frequency of 29%, followed by severe tropical storms at 25.8%. Tropical storms and tropical depressions have a frequency of 19.4% each, as shown in Figure 12.
In addition, another factor that influences the selection of wind turbines is the maximum wind speed with a return period of 50 years. Based on meteorological statistics, the maximum wind speed with a return period of 50 years in the port area is estimated to be around 52.1 m/s [27].
According to the design standards outlined in IEC 61400-1:2019 [28], the basic parameters for wind turbine selection should take into account wind resources, special climatic conditions, and other meteorological factors. It is recommended to choose wind turbines with typhoon-resistant special designs that meet IEC Class I or higher, or those that satisfy the typhoon resistance requirements of Class S. The relevant numerical requirements are that the extreme 10 min average wind speed at the hub height over 50 years should reach 57 m/s. Based on preliminary numerical analysis and actual measurement data in the port area, it is inferred that when the average wind speed is 15 m/s, the turbulence intensity at a height of 125 m in the port area is below Class C, which is below the standard of 0.12 for vertical acceleration [29].

4. The Proposed Method for Wind Turbine Selection

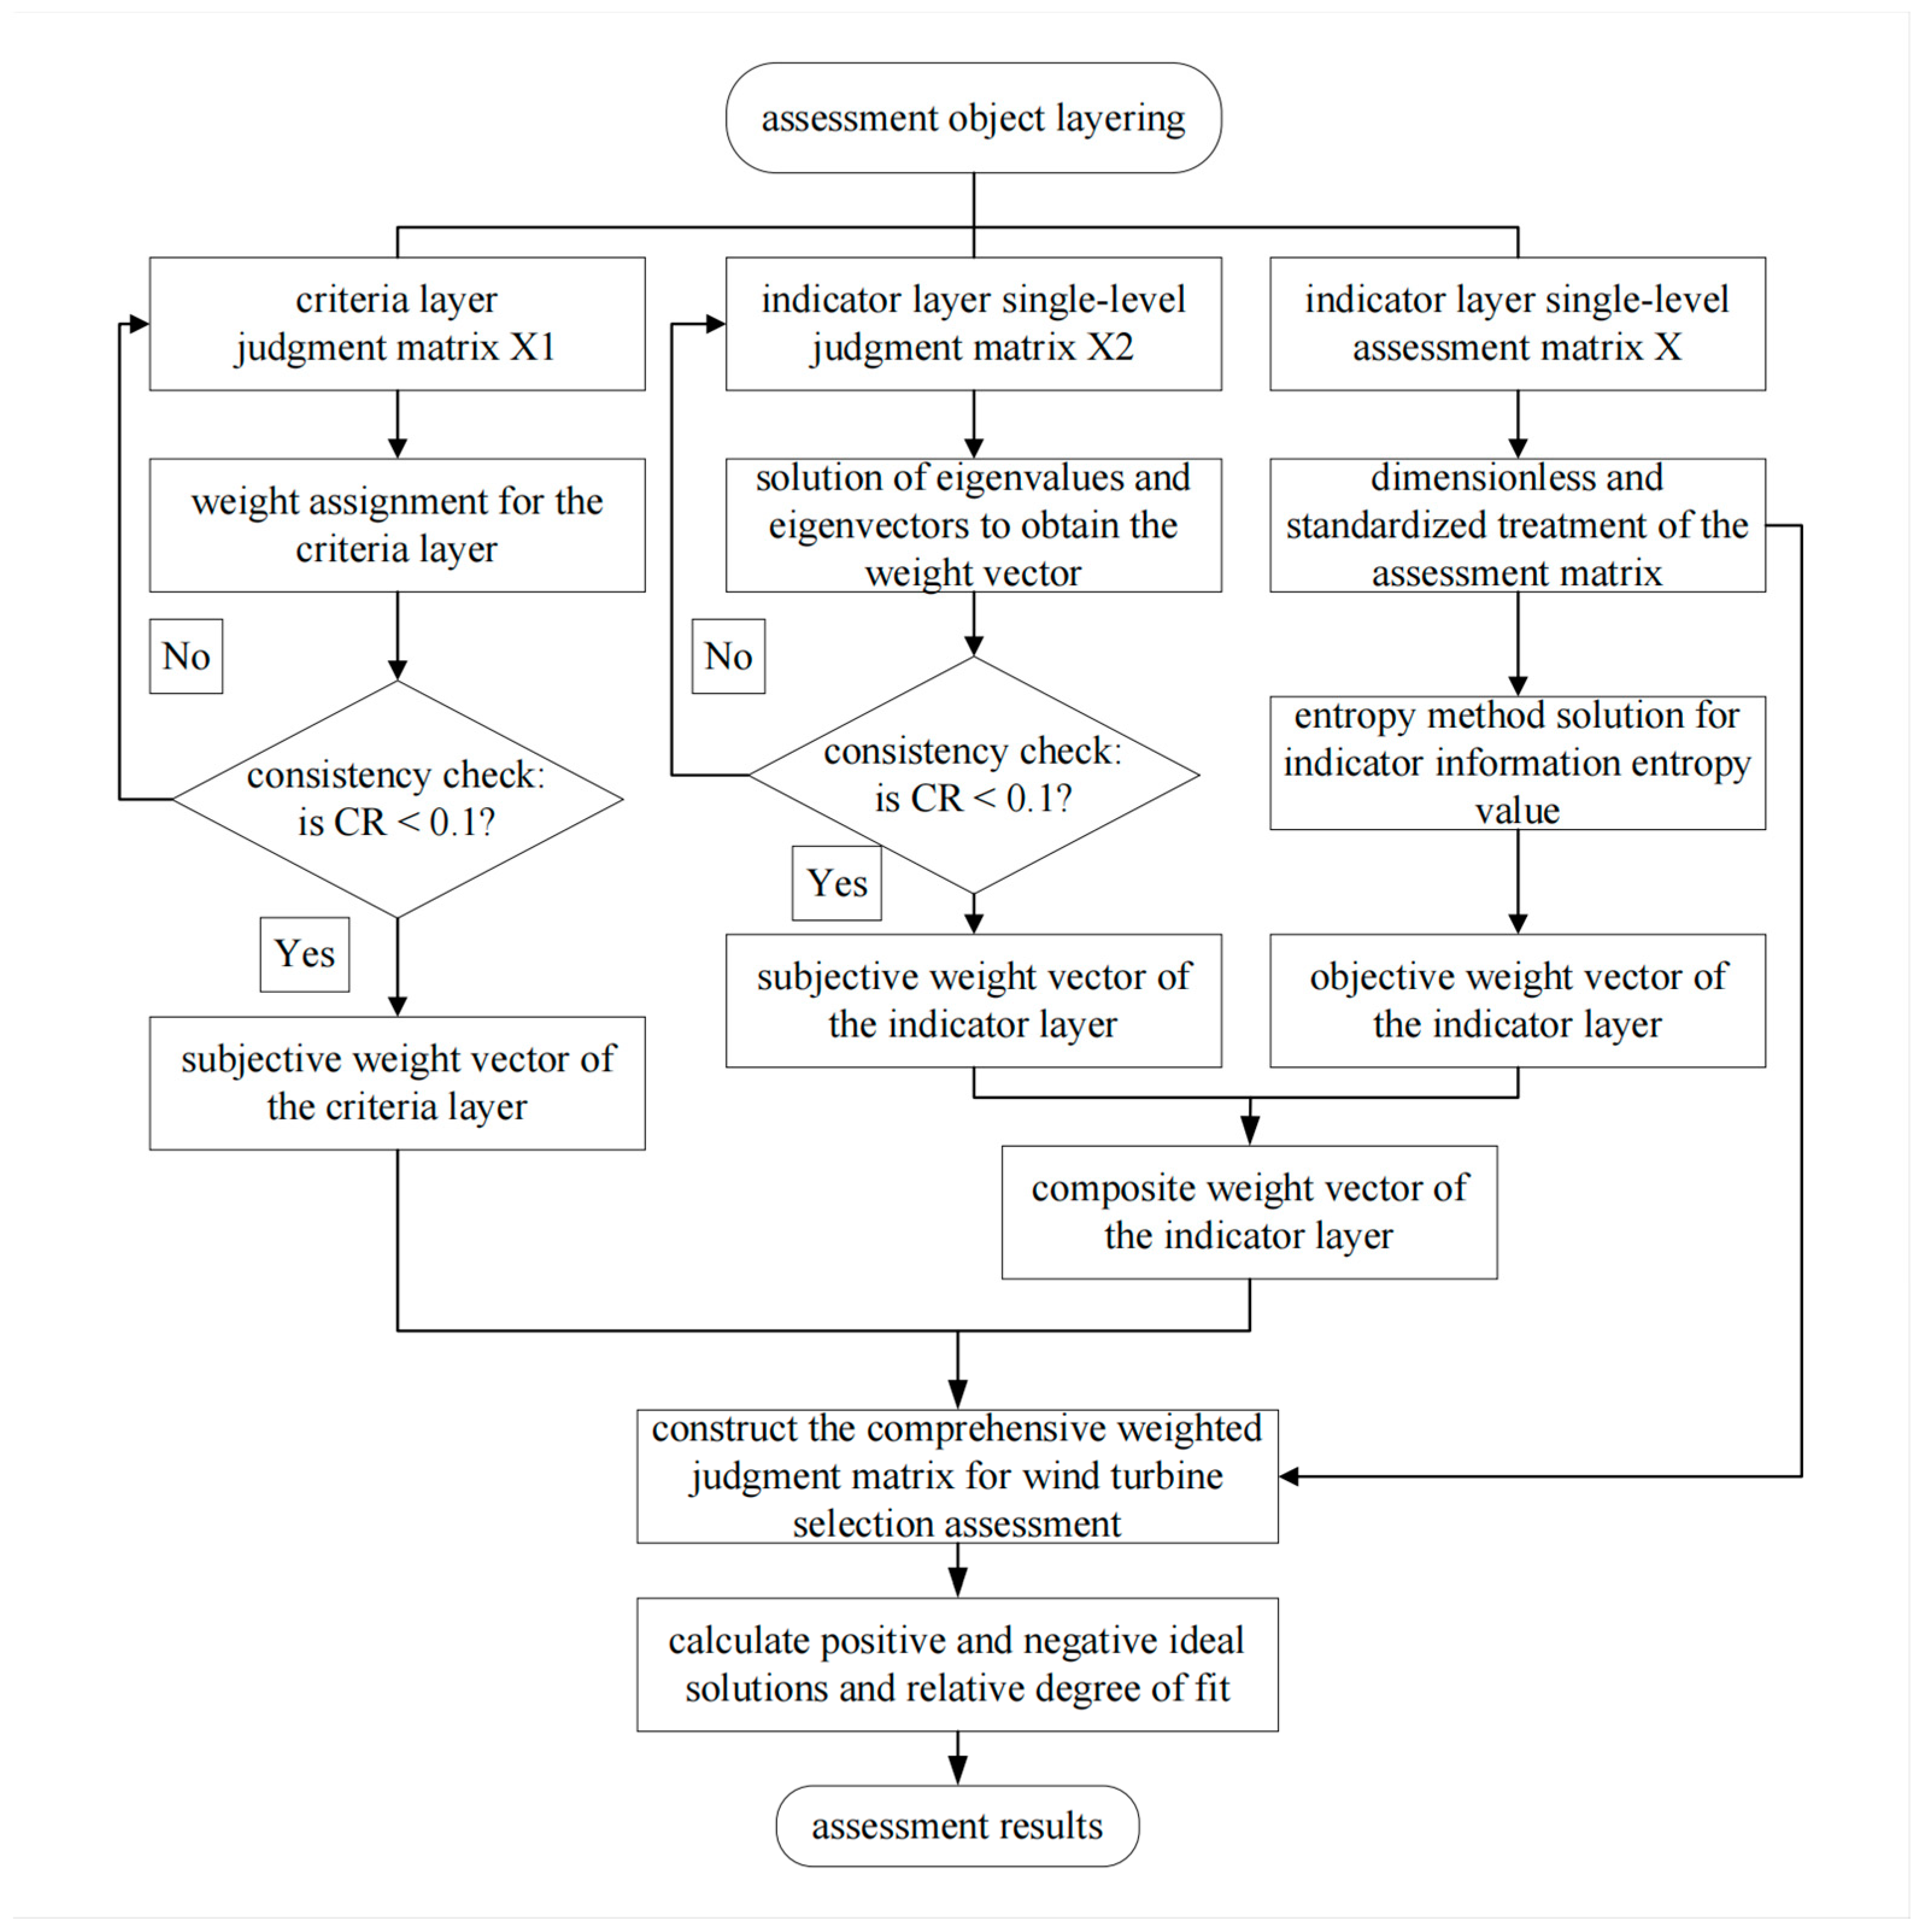
Under the conditions of meeting the aforementioned wind turbine selection types, a multi-criteria decision-making method is employed to select specific wind turbine design solutions. In order to improve the accuracy and universality of wind turbine selection, this study considers both the inherent statistical regularities and authority of the evaluation criteria when selecting evaluation indicators and allocating weights to them. It also reflects the degree of importance placed by decision-makers on different indicators, aiming to control subjective randomness within a certain range. Therefore, this study proposes a comprehensive weight method using AHP–entropy, which serves as the weight input for the TOPSIS method in wind turbine comparison. The specific implementation steps are shown in Figure 13.
The relevant parameters of the comprehensive evaluation model are shown in Table 1.

4.1. Comprehensive Weighting Method

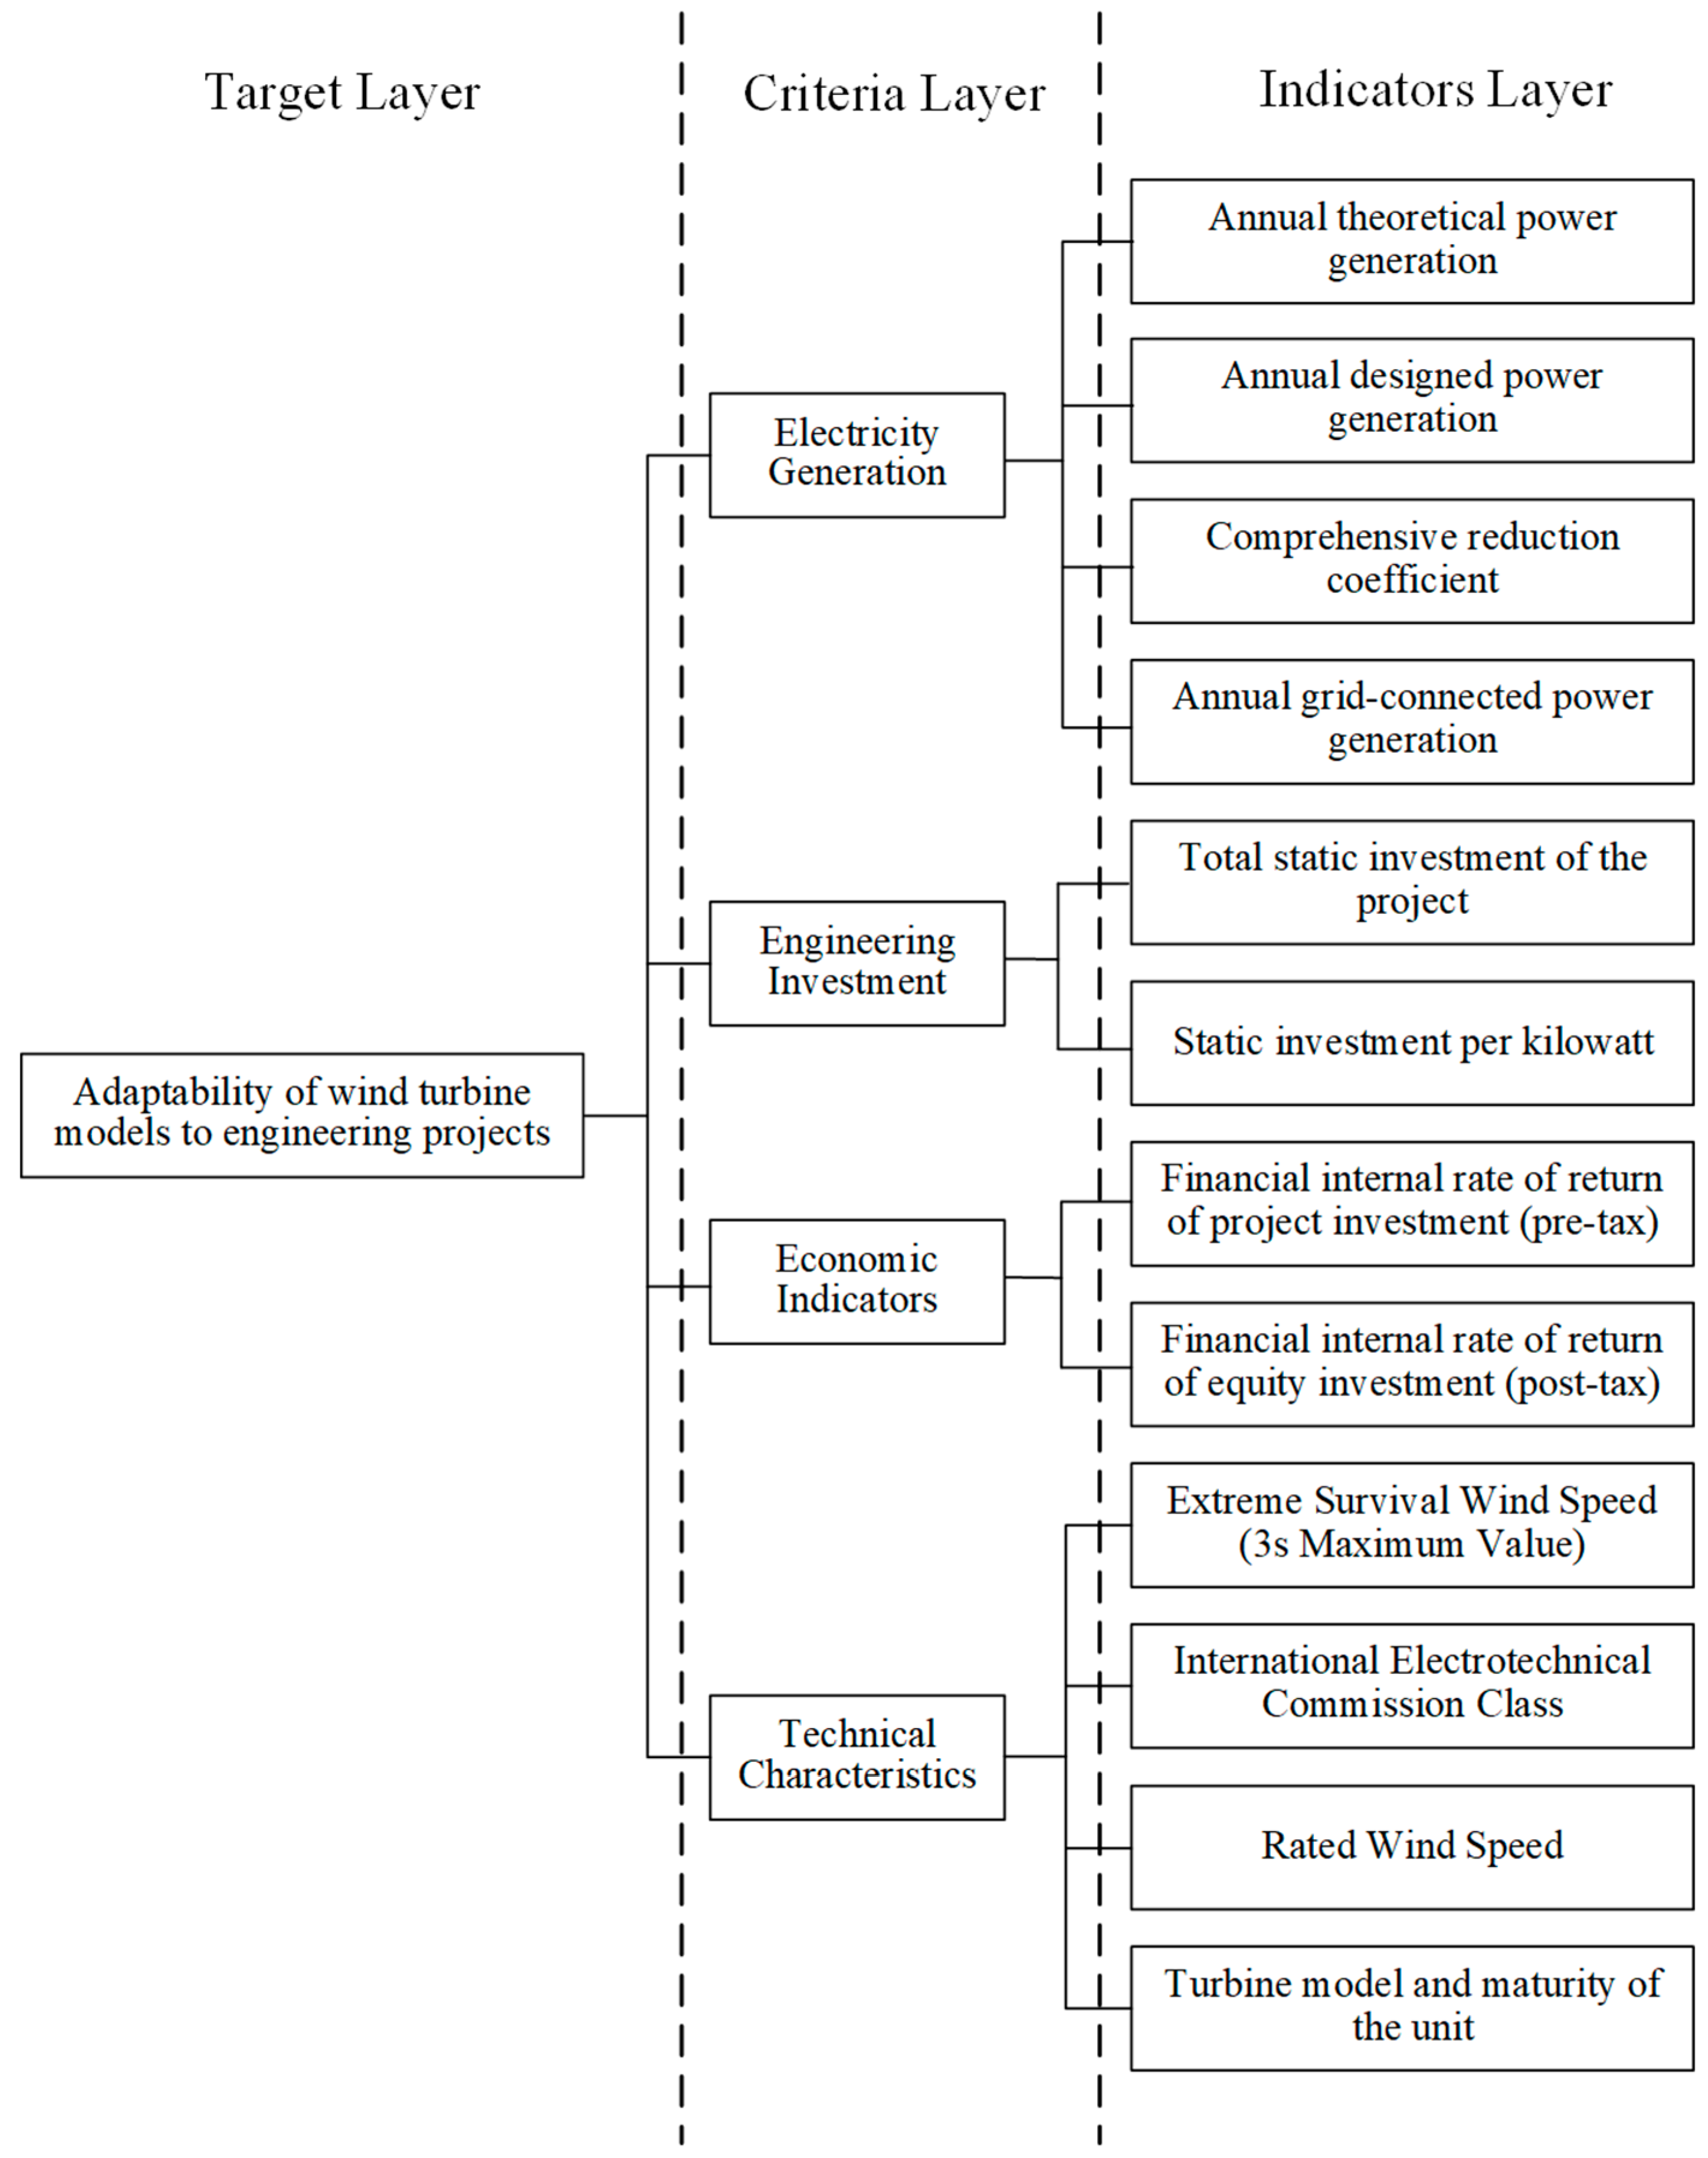
The evaluation criteria system for wind turbine selection is divided into the target layer, criteria layer, and indicator layer. The criteria layer consists of four key factors: electricity generation, engineering investment, economic indicators, and technical characteristics. In addition, practical indicators related to the project are incorporated into the four criteria, establishing a connection between adjacent levels. The structure of the wind turbine selection criteria system is shown in Figure 14.
1.
Weight Calculation using Entropy Method
The weights of the evaluation criteria are determined using the entropy method, and the specific process is as follows:
(1) Since different indicators have differences in dimensions and values, it is necessary to standardize the data. The specific calculation method is as follows:
For benefit-type indicators,
Y i j = x i j min x i max x i min x i
In this equation, “ Y i j ” represents the standardized value of the j-th indicator for the i-th evaluation object; “ X i j ” represents the original value of the j-th indicator for the i-th evaluation object; max x i represents the maximum value of the j-th indicator; and min x i represents the minimum value of the j-th indicator.
For cost-type indicators,
Y i j = min x i x i j max x i min x i
(2) The specific calculation method to indicate the information entropy and weights is shown in Equations (3)–(5):
P ij = Y i j i = 1 m Y i j
E j = 1 ln m i = 1 m p i j ln p i j
W j 1 = 1 E j = 1 n ( 1 E j )
In these equations, “ P ij ” represents the feature weight of the indicator; m represents the number of evaluation objects; “ E j ” represents the entropy value; “ W j 1 ” represents the objective weight; and n represents the number of evaluation indicators [30].
2.
Construction of AHP Judgment Matrix Based on Entropy Weighting Method
The AHP judgment matrix is used to represent the relative importance of a certain criterion at the previous level for each criterion at different levels [31]. In this study, the objective weights provided by the entropy weighting method are used as the basis for judgment. Pairwise comparisons of indicators within the same level are conducted, and the relative coefficients in the matrix are assigned using the 1–9 scale method. The specific coefficients and their meanings are shown in Table 2 [32].
In the consistency test of AHP, the ratio of the consistency index (CI) to the average random index (RI) of the judgment matrix of the same order represents the random consistency ratio of the judgment matrix. When the random consistency ratio is less than 0.1, the consistency of the judgment matrix considered to be within an acceptable range. Otherwise, it is necessary to reconstruct the judgment matrix. The consistency index and the ratio of random consistency can be obtained using Equations (6) and (7), respectively:
C I = λ max n n 1
C R = C I R I
In these equations, C I represents the consistency index, λ max represents the maximum eigenvalue, CR represents the random consistency ratio, and RI represents the random consistency index. The order value is determined as shown in Table 3.
To make the weightings of various criteria in wind turbine selection more scientifically sound and in line with actual engineering conditions, the objective weights obtained from the entropy weighting method are coupled with the subjective weights obtained from the AHP method. The combined weight “ W j ” is calculated based on Equation (8).
W j = W j 1 W j 2 j = 1 n W j 1 W j 2

4.2. TOPSIS Method

The TOPSIS method, also known as the Technique for Order of Preference by Similarity to Ideal Solution, is an effective ranking method that utilizes the information from the original data to accurately reflect the differences between evaluation alternatives [33]. The steps of the TOPSIS method are as follows:
(1). Construct the evaluation matrix for wind turbine selection. Assuming the set of wind turbine selection alternatives is M = ( M 1 , M 2 M m ) , and the set of evaluation criteria is ( D 1 , D 2 D n ) , the evaluation matrix is defined as follows:
X = x 1 , 1 x 1 , 2 x 1 , n x 2 , 1 x 2 , 2 x 2 , n x m , 1 x m , 2 x m , n
where x i j represents the value of evaluation criterion D j in the wind turbine selection alternative M m .
(2). Normalize the evaluation matrix. Since different evaluation criteria may have different scales, it is necessary to normalize the evaluation matrix according to Equations (1) and (2).
(3). Construct the weighted decision matrix. The weighted decision matrix is calculated by multiplying the combined weights from the AHP method and the entropy weighting method with the normalized decision matrix, as shown in Equation (10).
r i j = Y i j W j ( i = 1 , 2 , , m ; j = 1 , 2 , n ) R = Y 1 , 1 Y 1 , 2 Y 1 , n Y 2 , 1 Y 2 , 2 Y 2 , n Y m , 1 Y m , 2 Y m , n W 1 0 0 0 W 2 0 0 0 W n = r 1 , 1 r 1 , 2 r 1 , n r 2 , 1 r 2 , 2 r 2 , n r m , 1 r m , 2 r m , n
(4). Calculate the positive and negative ideal solutions. The equation for calculating the positive and negative ideal solutions for each wind turbine selection alternative are shown in Equation (11).
f j + = max 1 i m r i j , j = 1 , 2 , n f j = min 1 i m r i j , j = 1 , 2 , n
(5). Calculate the Euclidean distance. The Euclidean distances between each wind turbine selection alternative and the positive and negative ideal solutions are calculated using Equations (12) and (13), respectively.
f d i + = j = 1 n ( f j + r i j ) 2 , i = 1 , 2 , , m
f d i = j = 1 n ( f j r i j ) 2 , i = 1 , 2 , , m
(6). Calculate the comprehensive evaluation value. The comprehensive evaluation value reflects the superiority or inferiority of wind turbine selection alternatives in practical engineering. The calculation formula is as follows [34]:
S c o r e i = f d i f d i + f d i + , i = 1 , 2 , , m
(7). Based on the comprehensive evaluation values, rank the alternatives in descending order. The alternative with the highest evaluation value is considered the optimal solution.

5. Case Study

In consideration of the available wind turbine sites, this study considers four wind power generation options, denoted as WTG1 to WTG4, as shown in Table 4.
To evaluate the four options, the indicator parameters are constructed as shown in Table 5.

5.1. Indicator Weighting

According to the statistical selection indicators, the total static investment and unit kilowatt static investment belong to cost-type indicators and require positive normalization. Based on the entropy weighting method for wind turbine selection indicator weighting, the entropy weights of each indicator are obtained using Equations (1)–(5). Wj1 = [0.0799, 0.0798, 0, 0.0798, 0.0645, 0.0663, 0.0754, 0.0755, 0.3081, 0, 0.0708, 0.0999].
A method combining expert scoring and a literature review is used to determine the relative importance of each element on the upper-level element, and the judgment matrices for each level are obtained. One-time consistency checks are conducted to determine the weights of each level’s indicators. Table 6 presents the relative importance of the indicators at the criterion level based on the objective of wind turbine model comparison. Table 7, Table 8, Table 9 and Table 10 further divide the indicators at the criterion level into indicators of power generation, engineering investment, economic indicators, and technical characteristics.
Taking the relative importance at the criterion level as an example, starting from the four aspects of power generation, engineering investment, economic indicators, and technical characteristics in wind turbine selection, the following judgment matrix is obtained using Table 6:
A = 1 1 2 1 4 1 3 2 1 1 2 2 3 4 2 1 4 3 3 3 2 3 4 1
Through calculation, the eigenvalue of matrix A, λ m a x , is determined to be 4.
C I = λ max n n 1 = 4 4 3 = 0
The consistency test is passed.
C R = C I R I = 0 < 0.1
Therefore, the weight vector for the first-level indicators is W1= [0.1, 0.2, 0.4, 0.3]. From this vector, it can be concluded that economic indicators are the most important factor in the initial selection of wind turbines. The weight vector for the power generation level indicators is W2 = [0.1164, 0.1164, 0.1017, 0.6654]; for the engineering investment level indicators is W3 = [0.25, 0.75]; for the economic indicator level is W4 = [0.25, 0.75]; and for the technical parameters level is W5 = [0.1765, 0.0588,0.0272, 0.0353]. By combining the weights from the first-level and second-level analytic hierarchy processes, the final weights for each indicator are obtained as shown in Table 11 with the weight vector Wj2.
Finally, by coupling the weights Wj1 and Wj2 according to Formula (8), the comprehensive indicator weights Wj based on the entropy weighting method and AHP method are obtained. The calculation results are shown in Table 11.
The calculated comprehensive indicator weights, can be used as inputs for the weights of each indicator in the TOPSIS method. By assigning weights to the indicator parameters, the relative closeness can be calculated.

5.2. Analysis Results

Before conducting scoring using the TOPSIS method, the evaluation indicators in Table 5 are first standardized. The results are shown in Table 12.
After processing the wind turbine evaluation indicators according to Equation (10) and assigning the comprehensive weights Wj, the positive and negative ideal solutions for each selection alternative are obtained through comparison. The Euclidean distances between the wind turbine types and the positive and negative ideal solutions are calculated using Equations (12) and (13) [35,36], as shown in Table 13.
The relative closeness of each wind turbine type is calculated according to Formula (14), and the results are shown in Table 14.
Based on the calculated relative closeness, the wind turbine WTG2 is the optimal choice for the project, followed by the WTG4. Based on this analysis, the project plans to install two wind turbines, with the WTG2 model generating an annual electricity output of 23.39 GWh. If the construction cost of the wind turbine is not considered, the reduction in carbon emissions Q and the decrease in economic costs E compared to a conventional coal-fired power plant with the same electricity generation capacity can be calculated using Equations (17) and (18).
Q = t W T P W T Δ t ε 1 P WT Δ t ε 2
E = t W T P W T Δ t φ 1 P WT Δ t φ 2
in which, P W T represents the grid-connected electricity output of the WTG2 wind turbine (kWh); Δ t represents the statistical time interval; ε 1 and ε 2 represent the carbon emissions of grid-supplied electricity (581 g/kWh) and wind turbine electricity generation (25 g/kWh) [37]; and φ 1 and φ 2 represent the cost of grid-supplied electricity (0.95 yuan/kWh) and wind turbine electricity generation (0.685 yuan/kW·day). By using this equation, the annual reduction in carbon emissions is calculated to be 13,000 tons, and the savings in electricity costs amount to 21.6 million yuan. This demonstrates significant economic and ecological benefits.

6. Conclusions

This article proposes an engineering design and analysis method for large-scale wind turbine units in the context of a port scenario. The relevant conclusions are as follows:
(1).
The potential wind energy resources in the Chuanshan Port Area of Ningbo-Zhoushan Port were analyzed. At a height of 125 m, the predominant wind directions were found to be N and NNE. The wind direction and wind energy in the port area exhibited seasonal variations and variations at different times of the day.
(2).
In terms of site selection, three potential sites suitable for the construction of large-scale wind turbine units were identified, taking into consideration constraints such as seawalls, port office buildings, power lines, and roads, as well as the layout of the port’s storage yards. The three sites were further analyzed in terms of wind resources, special weather conditions, and noise impacts. The results showed that all three construction sites met the criteria in these three aspects and received favorable evaluations.
(3).
For wind turbine selection in the port, four mainstream turbine models that meet the requirements in the market were analyzed and compared. A comprehensive indicator weighting system was constructed using the entropy weighting method and the analytic hierarchy process, considering technical investment, power generation capacity, engineering construction, and turbine maturity. The TOPSIS method was used to calculate the relative closeness for the four turbine models. This approach ensured that turbine selection tokes into account engineering preferences and maintain objectivity, resulting in more accurate results. The final turbine selection is determined to be WTG2.
(4).
An analysis of the benefits of implementing the selected wind turbine units was conducted. By deploying two WTG2 wind turbines, an annual grid-connected electricity output of 23.39 GWh can be achieved, resulting in a reduction in carbon emissions of 13,000 tons and cost savings of 21.6 million yuan. This demonstrates significant economic and ecological benefits.

Author Contributions

Q.Z.: Software, Validation, Writing—Original Draft. Y.J.: Data Curation, Resources, Writing—Original Draft. H.T.: Visualization, Writing—Original Draft. H.R.: Conceptualization, Funding Acquisition, Writing—Original Draft. J.M.G.: Supervision, Writing—Review and Editing. D.T.: Data Curation, Formal Analysis, Resources, Supervision, Writing—Review and Editing. C.Y.: Supervision. All authors have read and agreed to the published version of the manuscript.

Funding

This work was financially supported by National Key Research and Development Program of China under Grant No. 2021YFB2601605, and the Key Laboratory of Transport Industry of Port Cargo Handling Technology, Ministry of Transport, PRC under Grant No. GKZX2023002.

Institutional Review Board Statement

Not applicable.

Informed Consent Statement

Not applicable.

Data Availability Statement

The data in the article are private and will not be published for the time being.

Conflicts of Interest

Authors Qianneng Zhang, Yipeng Jiang, Haidong Ren and Daogui Tang are employed in Ningbo Zhoushan Port Group Co., Ltd. The remaining authors declare that the research was conducted in the absence of any commercial or financial relationships that could be construed as a potential conflict of interest.

References

  1. Tang, D.; Chen, Z.; Xu, C.; Yuan, Y.; Zhong, X.; Yuan, C. Energy consumption and emissions analysis of large container seaports considering the impact of COVID-19: A case study of Ningbo Zhoushan Port. Ocean Coast. Manag. 2023, 244, 106781. [Google Scholar] [CrossRef]
  2. Tang, D.; Jiang, T.; Xu, C.; Chen, Z.; Yuan, Y.; Zhao, W.; Guerrero, J.M. Assessing the Potential for Energy Efficiency Improvement through Cold Ironing: A Monte Carlo Analysis with Real Port Data. J. Mar. Sci. Eng. 2023, 11, 1780. [Google Scholar] [CrossRef]
  3. Chen, S.; Xiao, Y.; Zhang, C.; Lu, X.; He, K.; Hao, J. Cost dynamics of onshore wind energy in the context of China’s carbon neutrality target. Environ. Sci. Ecotechnol. 2024, 19, 100323. [Google Scholar] [CrossRef] [PubMed]
  4. Iris, Ç.; Lam, J.S.L. A review of energy efficiency in ports: Operational strategies, technologies and energy management systems. Renew. Sustain. Energy Rev. 2019, 112, 170–182. [Google Scholar] [CrossRef]
  5. Perez-Moreno, S.S.; Dykes, K.; Merz, K.O.; Zaaijer, M.B. Multidisciplinary design analysis and optimisation of a reference offshore wind plant. J. Phys. Conf. Ser. 2018, 1037, 042004. [Google Scholar] [CrossRef]
  6. Perez-Moreno, S.S.; Zaaijer, M.B.; Bottasso, C.L.; Dykes, K.; Merz, K.O.; Réthoré, P.-E.; Zahle, F. Roadmap to the multidisciplinary design analysis and optimisation of wind energy systems. J. Phys. Conf. Ser. 2016, 753, 062011. [Google Scholar] [CrossRef]
  7. Tang, D.; Wang, H. Energy management strategies for hybrid power systems considering dynamic characteristics of power sources. IEEE Access 2021, 9, 158796–158807. [Google Scholar] [CrossRef]
  8. Jiang, Z. Installation of offshore wind turbines: A technical review. Renew. Sustain. Energy Rev. 2021, 139, 110576. [Google Scholar] [CrossRef]
  9. Stehly, T.J.; Beiter, P.C.; Heimiller, D.M.; Scott, G.N. 2017 Cost of Wind Energy Review; Technical Report; NREL/TP-6A20-72167; NREL: Denver, CO, USA, 2018.
  10. Sifakis, N.; Konidakis, S.; Tsoutsos, T. Hybrid renewable energy system optimum design and smart dispatch for nearly Zero Energy Ports. J. Clean. Prod. 2021, 310, 127397. [Google Scholar] [CrossRef]
  11. Chen, K.; Peng, H.; Gao, Z.; Zhang, J.; Chen, P.; Ruan, J.; Li, B.; Wang, Y. Day-Ahead Operation Analysis of Wind and Solar Power Generation Coupled with Hydrogen Energy Storage System Based on Adaptive Simulated Annealing Particle Swarm Algorithm. Energies 2022, 15, 9581. [Google Scholar] [CrossRef]
  12. Kazak, J.; Hoof, V.J.; Szewranski, S. Challenges in the wind turbines location process in Central Europe–The use of spatial decision support systems. Renew. Sustain. Energy Rev. 2017, 76, 425–433. [Google Scholar] [CrossRef]
  13. Rodrigo, J.S.; Arroyo, R.C.; Gancarski, P.; Guillén, F.B.; Avila, M.; Barcons, J.; Folch, A.; Cavar, D.; Allaerts, D.; Meyers, J.; et al. Comparing Meso-Micro Methodologies for Annual Wind Resource Assessment and Turbine Siting at Cabauw. J. Phys. Conf. Ser. 2018, 1037, 072030. [Google Scholar] [CrossRef]
  14. Golestani, N.; Arzaghi, E.; Abbassi, R.; Garaniya, V.; Abdussamie, N.; Yang, M. The Game of Guwarra: A game theory-based decision-making framework for site selection of offshore wind farms in Australia. J. Clean. Prod. 2021, 326, 129358. [Google Scholar] [CrossRef]
  15. Gualtieri, G. A novel method for wind farm layout optimization based on wind turbine selection. Energy Convers. Manag. 2019, 193, 106–123. [Google Scholar] [CrossRef]
  16. Narayanamoorthy, S.; Ramya, L.; Kang, D.; Baleanu, D.; Kureethara, J.V.; Annapoorani, V. A new extension of hesitant fuzzy set: An application to an offshore wind turbine technology selection process. IET Renew. Power Gener. 2021, 15, 2340–2355. [Google Scholar] [CrossRef]
  17. Zhipeng, X.; Wei, S. Wind Turbine Generator Selection and Comprehensive Evaluation Based on BPNN Optimized by PSO. Int. J. Appl. Decis. Sci. 2017, 10, 364–381. [Google Scholar]
  18. Yu, Y.; Wu, S.; Yu, J.; Xu, Y.; Song, L.; Xu, W. A hybrid multi-criteria decision-making framework for offshore wind turbine selection: A case study in China. Appl. Energy 2022, 328, 120173. [Google Scholar] [CrossRef]
  19. Pang, N.; Nan, M.; Meng, Q.; Zhao, S. Selection of wind turbine based on fuzzy analytic network process: A case study in China. Sustainability 2021, 13, 1792. [Google Scholar] [CrossRef]
  20. Xu, L.; Wang, J.; Ou, Y.; Fu, Y.; Bian, X. A novel decision-making system for selecting offshore wind turbines with PCA and D numbers. Energy 2022, 258, 124818. [Google Scholar] [CrossRef]
  21. Wang, J.; Xu, L.; Cai, J.; Fu, Y.; Bian, X. Offshore wind turbine selection with a novel multi-criteria decision-making method based on Dempster-Shafer evidence theory. Sustain. Energy Technol. Assess. 2022, 51, 101951. [Google Scholar] [CrossRef]
  22. Gu, Y.; Xu, W.; Tang, D.; Yuan, Y.; Chai, Z.; Ke, Y.; Guerrero, J.M. A Combined Wind Forecasting Model Based on SSA and WNN: Application on Real Case of Ningbo Zhoushan Port. J. Mar. Sci. Eng. 2023, 11, 1636. [Google Scholar] [CrossRef]
  23. Wang, X.; Wang, J.; Niu, X.; Wu, C. Novel wind-speed prediction system based on dimensionality reduction and nonlinear weighting strategy for point-interval prediction. Expert Syst. Appl. 2024, 241, 122477. [Google Scholar] [CrossRef]
  24. GB 3096-2008; Environmentalquality Standard Fornoise. Standards Press of China: Beijing, China, 2008.
  25. Chen, Y.; Liu, Y.; Han, S.; Qiao, Y. Multi-component condition monitoring method for wind turbine gearbox based on adaptive noise reduction. IET Renew. Power Gener. 2023, 17, 2613–2624. [Google Scholar] [CrossRef]
  26. Liu, W.Y. A review on wind turbine noise mechanism and de-noising techniques. Renew. Energy 2017, 108, 311–320. [Google Scholar] [CrossRef]
  27. Tang, D.; Xiao, Z.; Li, J.; Zhang, Q.; Zhang, X.; Yang, S. Assessment of coastal wind energy resources in Ningbo Zhoushan Port Area based on WRF model and MERRA-2 data. In Proceedings of the 2023 7th International Conference on Transportation Information and Safety (ICTIS), Xi’an, China, 4–6 August 2023; pp. 19–24. [Google Scholar]
  28. IEC 61400-1:2019; Wind Turbines-Part 1: Design Requirements. International Electrotechnical Commission (IEC): Geneva, Switzerland, 2019.
  29. IEC61400-1:2019; Design Requirements for Wind Turbines. International Electrotechnical Commission (IEC): Geneva, Switzerland, 2019.
  30. Losada, I.J.; Toimil, A.; Munoz, A.; Garcia-Fletcher, A.P.; Diaz-Simal, P. A planning strategy for the adaptation of coastal areas to climate change: The Spanish case. Ocean Coast. Manag. 2019, 182, 104983. [Google Scholar] [CrossRef]
  31. Lyu, H.M.; Zhou, W.H.; Shen, S.L.; Zhou, A.-N. Inundation risk assessment of metro system using AHP and TFN-AHP in Shenzhen. Sustain. Cities Soc. 2020, 56, 102103. [Google Scholar] [CrossRef]
  32. Du, Y.W.; Cao, W.M. DEPD model for evaluating marine ranching ecological security and its application in Shandong, China. Ocean Coast. Manag. 2022, 224, 106206. [Google Scholar] [CrossRef]
  33. Zhang, N.; Gao, J.; Xu, S.; Tang, S.; Guo, M. Establishing an evaluation index system of Coastal Port shoreline resources utilization by objective indicators. Ocean Coast. Manag. 2022, 217, 106003. [Google Scholar] [CrossRef]
  34. Wen, H.; Hu, K.; Nghiem, X.H.; Acheampong, A.O. Urban climate adaptability and green total-factor productivity: Evidence from double dual machine learning and differences-in-differences techniques. J. Environ. Manag. 2024, 350, 119588. [Google Scholar] [CrossRef]
  35. Jin, J.; Quan, Y. Assessment of marine ranching ecological development using DPSIR-TOPSIS and obstacle degree analysis: A case study of Zhoushan. Ocean Coast. Manag. 2023, 244, 106821. [Google Scholar] [CrossRef]
  36. Chen, M.H.; Chen, F.; Tang, C.J.; Lu, Y.; Feng, Y.-X. Integration of DPSIR framework and TOPSIS model reveals insight into the coastal zone ecosystem health. Ocean Coast. Manag. 2022, 226, 106285. [Google Scholar] [CrossRef]
  37. Jacobson, M.Z. Evaluation of nuclear power as a proposed solution to Global warming, Air pollution, and energy security. In 100% Clean, Renewable Energy and Storage for Everything; Cambridge University Press: New York, NY, USA, 2019. [Google Scholar]
Figure 1. Chuanshan Port Area wind direction and wind energy distribution map at 125 m height for 2022.
Jmse 12 00631 g001
Figure 2. Wind speed and wind energy frequency distribution map of Chuanshan Port Area for the year 2022.
Jmse 12 00631 g002
Figure 3. Schematic diagram of safety distance for wind turbine construction.
Jmse 12 00631 g003
Figure 4. Schematic diagram of NO. 2 wind turbine’s three-dimensional positioning.
Jmse 12 00631 g004
Figure 5. Layout of wind turbine array positions.
Jmse 12 00631 g005
Figure 6. Wind speed map.
Jmse 12 00631 g006
Figure 7. Vorticity map.
Jmse 12 00631 g007
Figure 8. WTG2 unit noise curve.
Jmse 12 00631 g008
Figure 9. Noise contour map of the considered sites.
Jmse 12 00631 g009
Figure 10. Wind energy resource distribution map at 125 m height in the considered port area.
Jmse 12 00631 g010
Figure 11. Monthly distribution of tropical cyclones from 1949 to 2021.
Jmse 12 00631 g011
Figure 12. Climatic characteristics of maximum wind speed in the statistical region.
Jmse 12 00631 g012
Figure 13. Flowchart of the proposed method.
Jmse 12 00631 g013
Figure 14. The wind turbine selection criteria system.
Jmse 12 00631 g014
Table 1. Parameter descriptions.
Method ModelsParameterParameter Description
Entropy weight method Y i j The standardized value of the j-th index for the i-th evaluation object
X i j The original value of the j-th index for the i-th evaluation object
X max The maximum value of the j-th index
X m i n The minimum value of the j-th index
P i j The index weight of the j-th parameter for the i-th evaluation object
mNumber of evaluation objects
E j The entropy value of the j-th index
nNumber of evaluation indicators
W j 1 The objective weight of the j-th index
Analytic hierarchy process (AHP)CIConsistency index
λ max The maximum eigenvalue of the judgment matrix
R I Random consistency index
C R Random consistency ratio
W j 2 The subjective weight of the j-th index
W j The comprehensive weight of the j-th index
TOPSIS methodRThe comprehensive weighted judgment matrix
r i j The index parameters after comprehensive weighting
f j + The positive ideal solution of the j-th index
f j The negative ideal solution of the j-th index
f d i + The Euclidean distance between the i-th evaluation object and the positive ideal solution
f d i The Euclidean distance between the i-th evaluation object and the negative ideal solution
S c o r e i The relative closeness degree of the i-th evaluation object
Table 2. Explanation of relative coefficients.
CoefficientMeaning
1The two indices are equally important
3Comparing the two indices, the former is slightly more important than the latter
5Comparing the two indices, the former is more important than the latter
7Comparing the two indices, the former is very important compared to the latter
9Comparing the two indices, the former is much more important than the latter
2, 4, 6, 8The intermediate value of the above scale
Table 3. Values of random consistency index.
Matrix Order123456789
RI000.580.901.121.241.321.411.45
Table 4. Four wind turbine schemes.
IndexWTG1WTG2WTG3WTG4
OverviewSingle-unit capacity (MW)4.56.256.256.25
Rotor diameter (m)156190172172
Hub height (m)125125125125
Number of installed units3222
Total installed capacity (MW)13.512.512.512.5
Table 5. Indicator layer parameters of wind turbine schemes for different models.
Criteria Layer Indicator LayerWTG1WTG2WTG3WTG4
Electricity generationAnnual theoretical power generation (×104 kWh)3388321529012615
Annual designed power generation (×104 kWh)3371319128862599
Comprehensive reduction coefficient0.760.760.760.76
Annual grid-connected power generation (×104 kWh)2562242521931975
Engineering investmentTotal static investment of the project (×104 RMB)12,20710,65310,53310,374
Static investment per kilowatt (RMB/kW)9042852284268299
Economic indicatorsFinancial internal rate of return of project investment (pre-tax) (%)17.2919.1916.8514.68
Financial internal rate of return of equity investment (post-tax) (%)15.3817.1514.9712.97
Technical characteristicsRated Wind Speed (m/s)9.59.511.810.5
IEC ClassSSSS
Extreme Survival Wind Speed (3 s Maximum Value) (m/s)7073.57070
Maturity and certification of the turbine (score)785.56
Table 6. Relative importance of criteria layer.
IndicatorsPower GenerationEngineering InvestmentEconomic IndicatorsTechnical Characteristics
Power generation11/21/41/3
Engineering investment21 1/22/3
Economic indicators421 4/3
Technical characteristics33/23/41
Table 7. Relative importance of electricity generation level indicators.
IndicatorsAnnual Theoretical Power Generation Annual Design Power Generation Comprehensive Reduction CoefficientAnnual Grid-Connected Capacity
Annual theoretical power generation1111/7
Annual design power generation1111/5
Comprehensive reduction coefficient1111/9
Annual grid-connected capacity7591
Table 8. Relative importance of engineering investment level.
IndicatorTotal Static Investment of the ProjectStatic Investment per Kilowatt
Total static investment of the project11/3
Static investment per kilowatt31
Table 9. Relative importance of economic indicator level.
IndicatorFinancial Internal Rate of Return on Project InvestmentFinancial Internal Rate of Return on Capital
Financial internal rate of return of project investment (pre-tax)11/3
Financial internal rate of return of equity investment (post-tax)31
Table 10. Relative importance of technical characteristics.
IndicatorsExtreme Survival Wind SpeedIEC ClassRated Wind SpeedUnit Maturity
Extreme Survival Wind Speed1365
IEC Class1/3125/3
Rated Wind Speed1/61/215/6
Unit Maturity1/53/56/51
Table 11. Indicator weights for wind turbine selection.
Criteria Layer WeightIndicator Layer W j 1 W j 2 W j
Electricity generation0.0769Annual theoretical power generation0.07990.01160.0353
Annual design power generation0.07980.01160.0353
Engineering investment0.1538Comprehensive reduction coefficient00.01020.0000
Annual grid-connected capacity0.07980.06650.0843
Total static investment of the project0.06450.05000.0657
Static investment per kilowatt0.06630.15000.1154
Economic indicators0.4615Financial internal rate of return of project investment (pre-tax)0.07540.10000.1005
Financial internal rate of return of equity investment (post-tax)0.07550.30000.1742
Technical characteristics0.3077Extreme Survival Wind Speed0.30810.17650.2698
IEC Class00.05880.0000
Rated Wind Speed0.07080.02720.0508
Unit Maturity0.09990.03530.0687
Table 12. Standardized results of evaluation indicators for each wind turbine scheme.
Assessment IndicatorsWTG1WTG2WTG3WTG4
Annual theoretical power generation0.55650.52810.47650.4295
Annual design power generation0.55700.52720.47680.4294
Comprehensive reduction coefficient0.50000.50000.50000.5000
Annual grid-connected capacity0.55700.52720.47680.4294
Total static investment of the project0.00000.53060.57160.6259
Static investment per kilowatt0.00000.47430.56190.6777
Financial internal rate of return of project investment (pre-tax)0.50620.56180.49330.4298
Financial internal rate of return of equity investment (post-tax)0.50620.56450.49270.4269
Extreme Survival Wind Speed0.49370.51840.49370.4937
IEC Class0.50000.50000.50000.5000
Rated Wind Speed0.65660.65660.00000.3711
Unit Maturity0.52280.59750.41080.4481
Table 13. Euclidean distance between wind turbine types and positive/negative ideal solutions.
Type of Wind TurbineWTG1WTG2WTG3WYG4
f d i + 0.28320.07420.16900.1158
f d i 0.16420.27470.24370.2930
Table 14. Relative comprehensive evaluation scores for each wind turbine selection.
Type of Wind TurbineWTG1WTG2WTG3WYG4
Relative Degree of Fit0.14910.31980.23990.2912
Disclaimer/Publisher’s Note: The statements, opinions and data contained in all publications are solely those of the individual author(s) and contributor(s) and not of MDPI and/or the editor(s). MDPI and/or the editor(s) disclaim responsibility for any injury to people or property resulting from any ideas, methods, instructions or products referred to in the content.

