
Numerical Investigation on Mooring Line Configurations of a Semisubmersible Fish Farm for Global Performance

Abstract
:1. Introduction
2. Materials and Methods
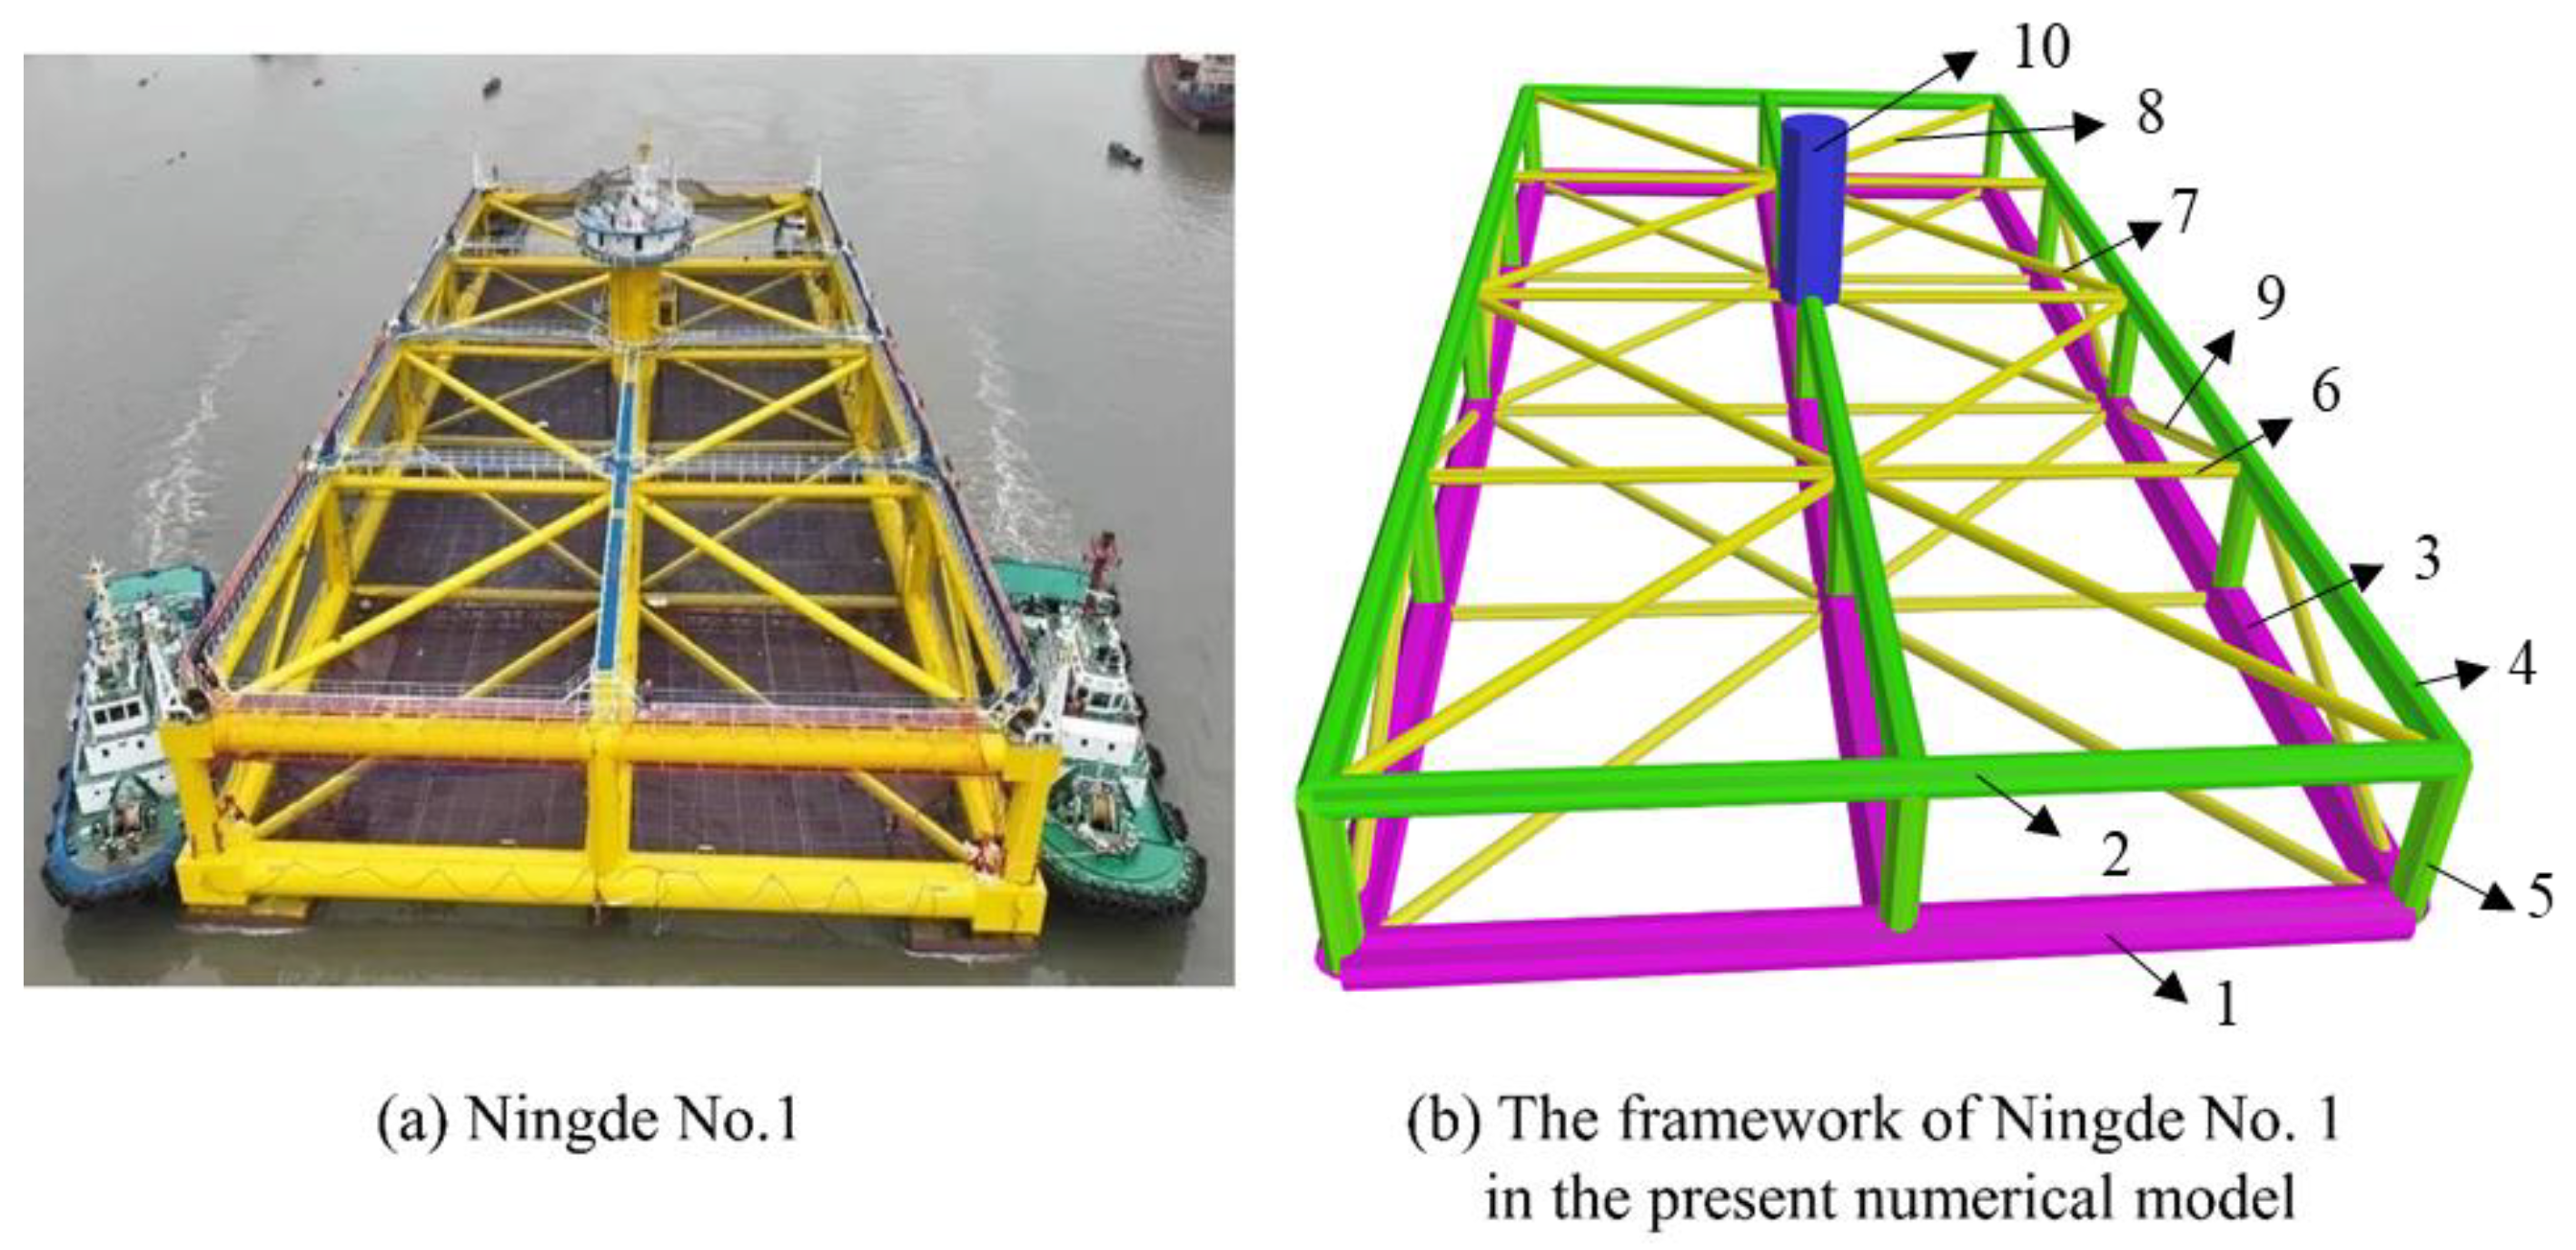
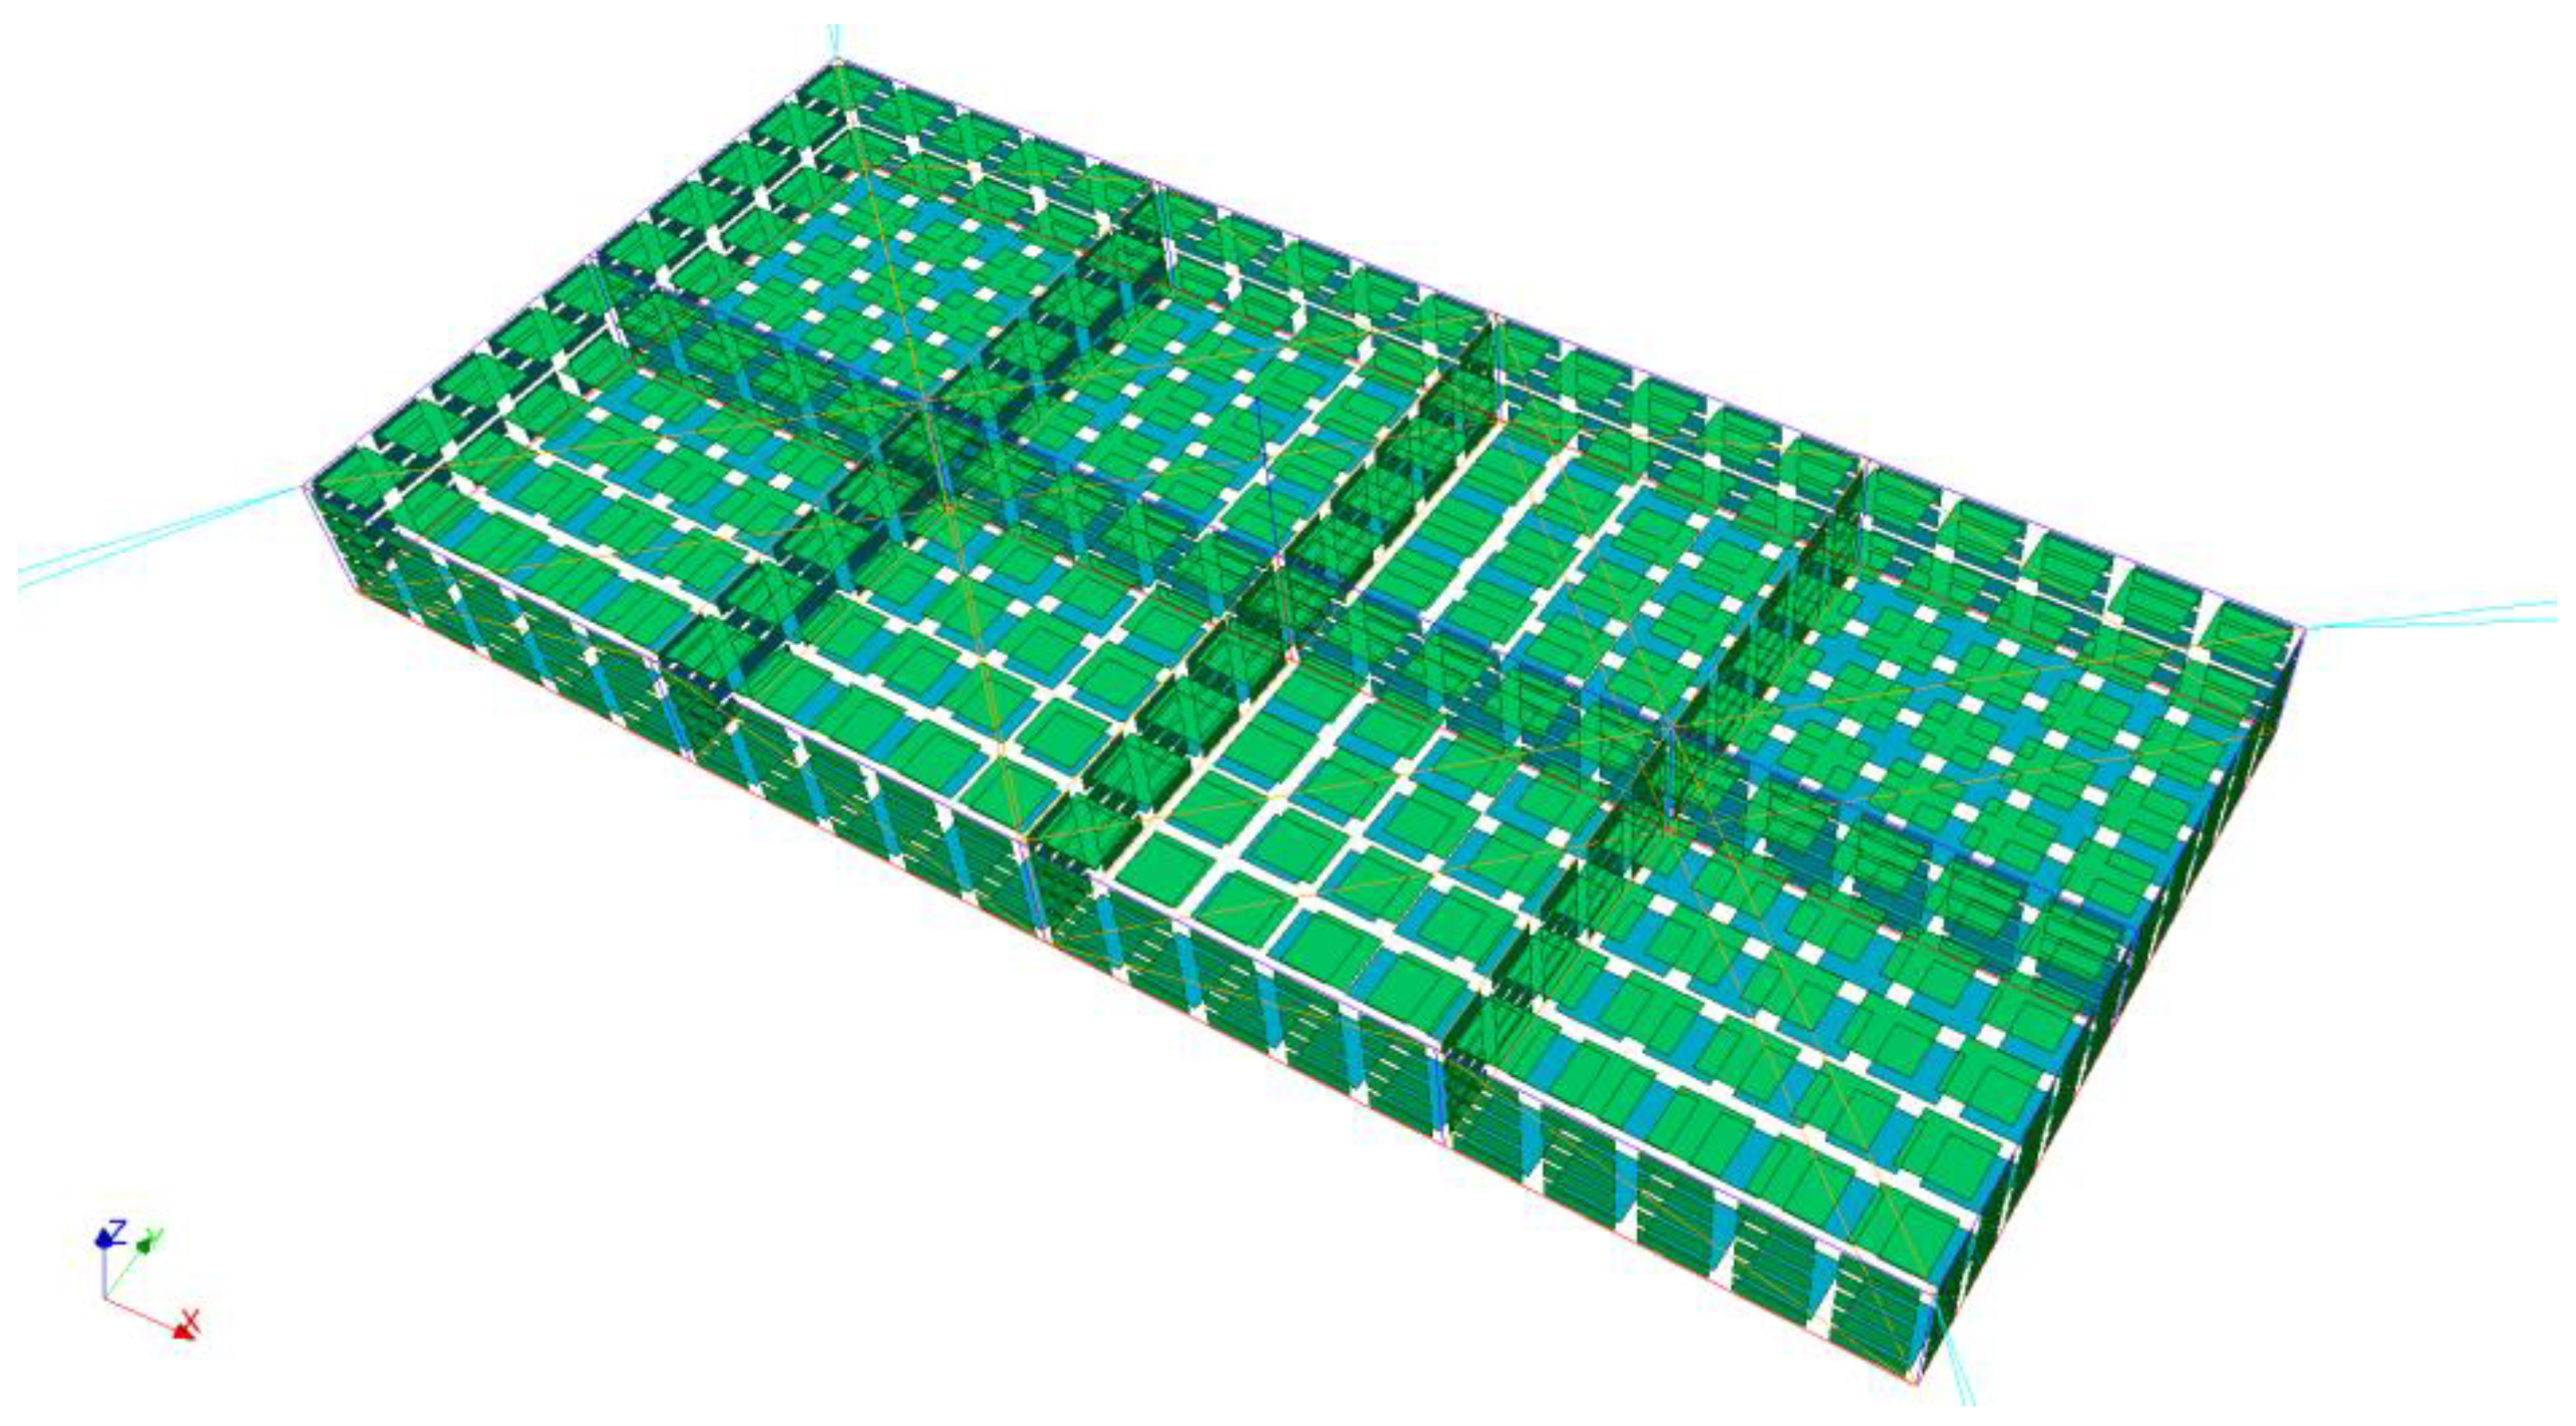
2.1. Description of the Offshore Aquaculture Structure
2.1.1. Main Framework
2.1.2. Net System
2.1.3. Mooring System
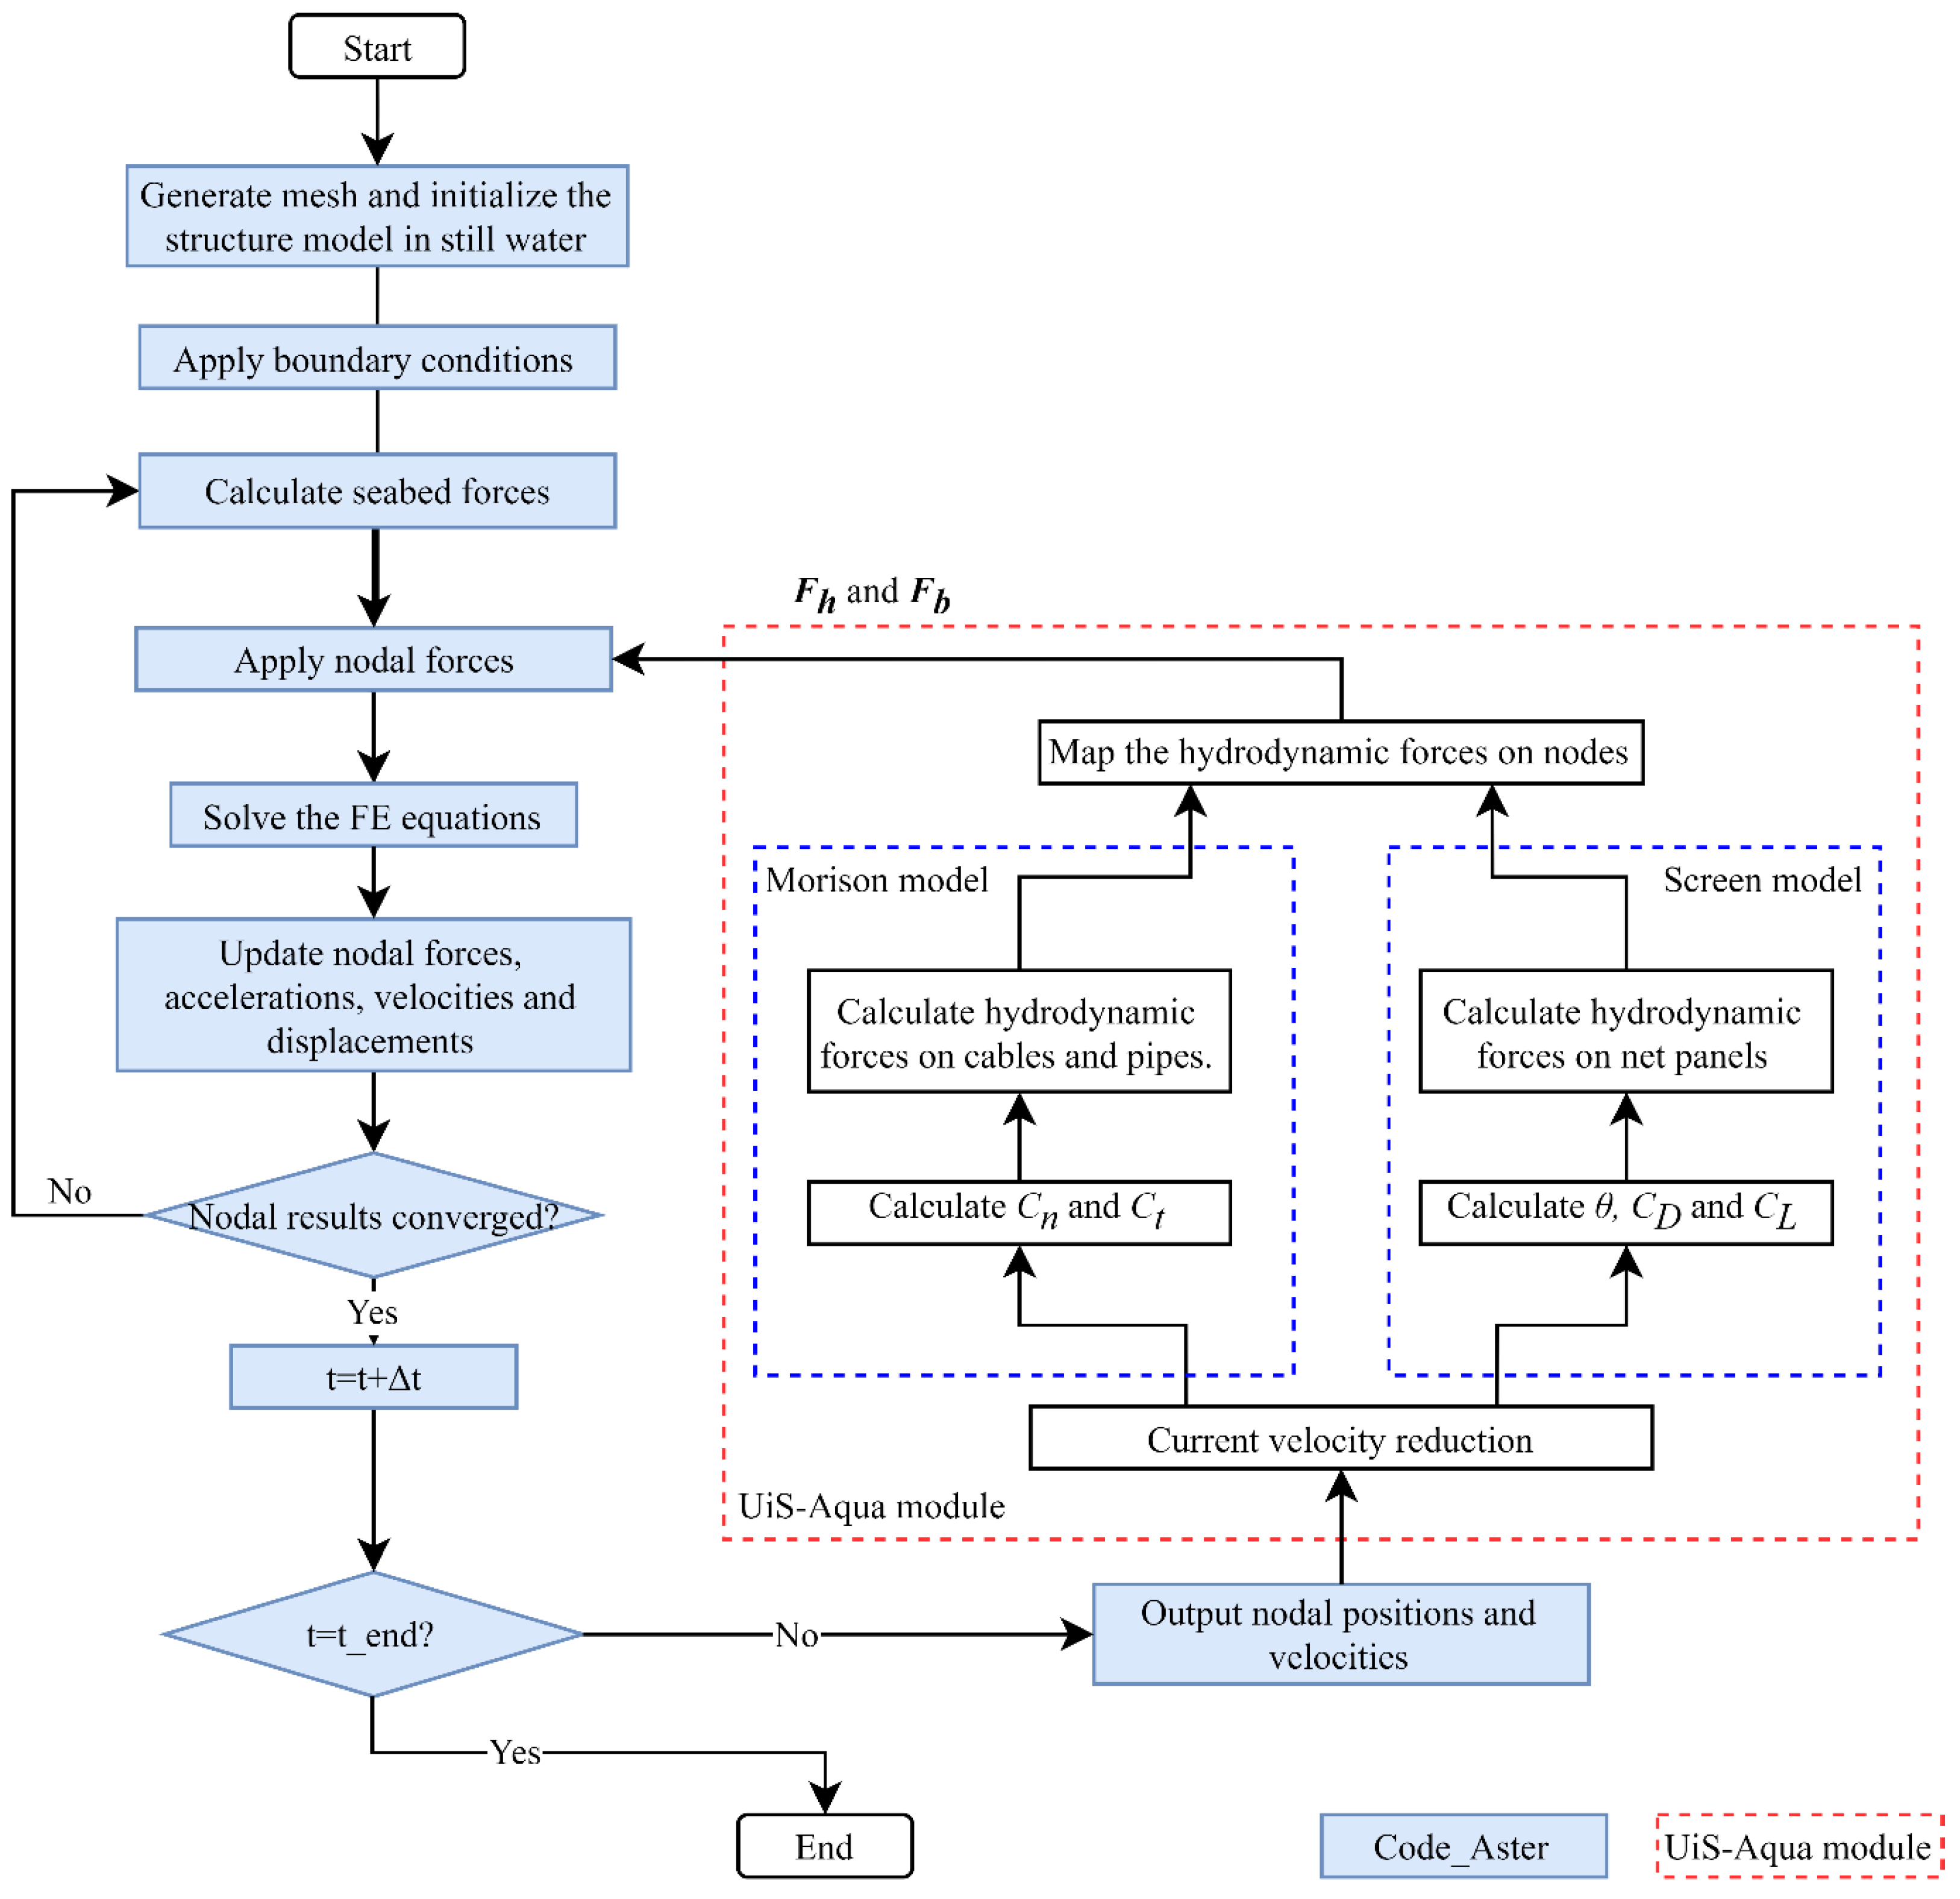
2.2. Numerical Modeling Method
2.2.1. Structural Model
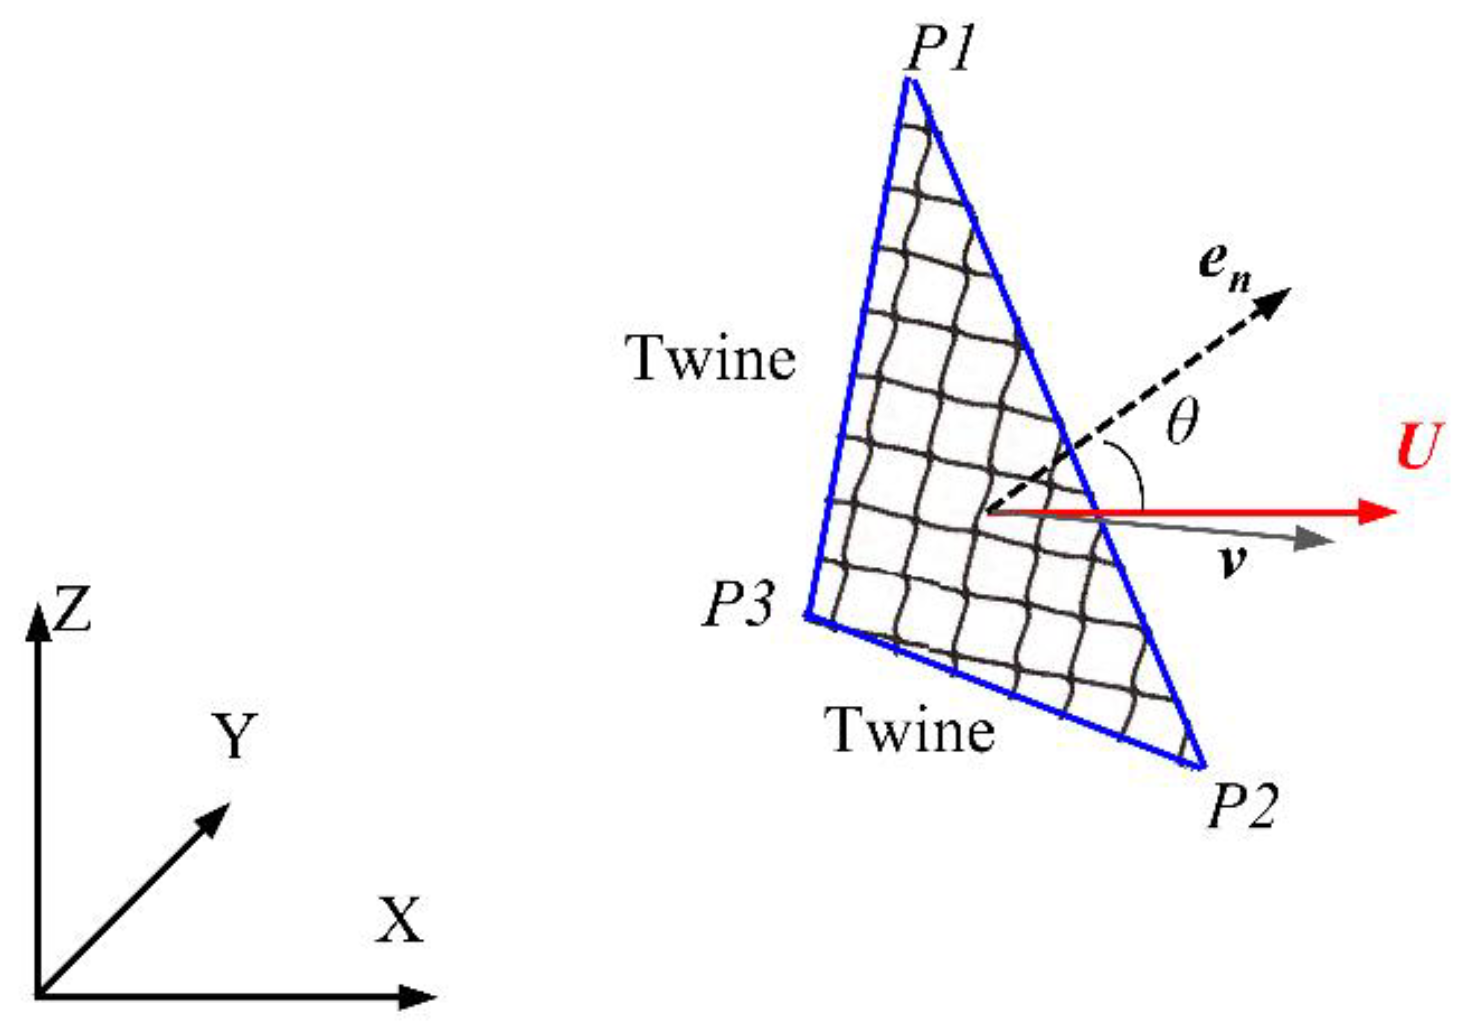
2.2.2. Hydrodynamic Loads on Net
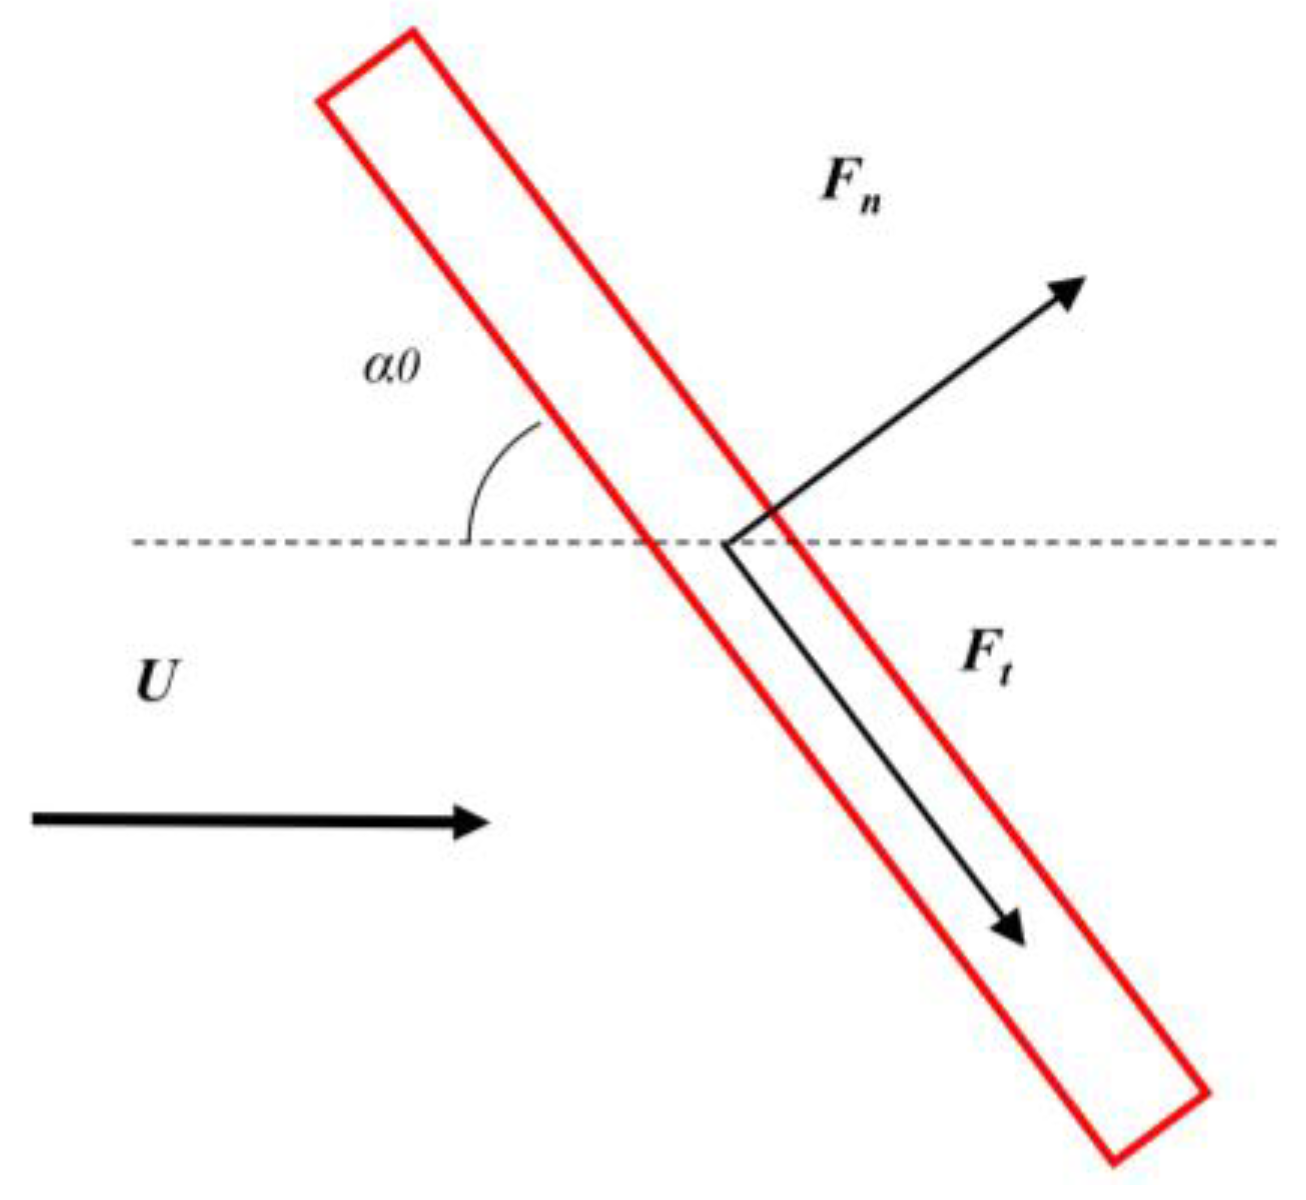
2.2.3. Hydrodynamic Loads on Mooring Lines and Framework
2.2.4. Wake Effect
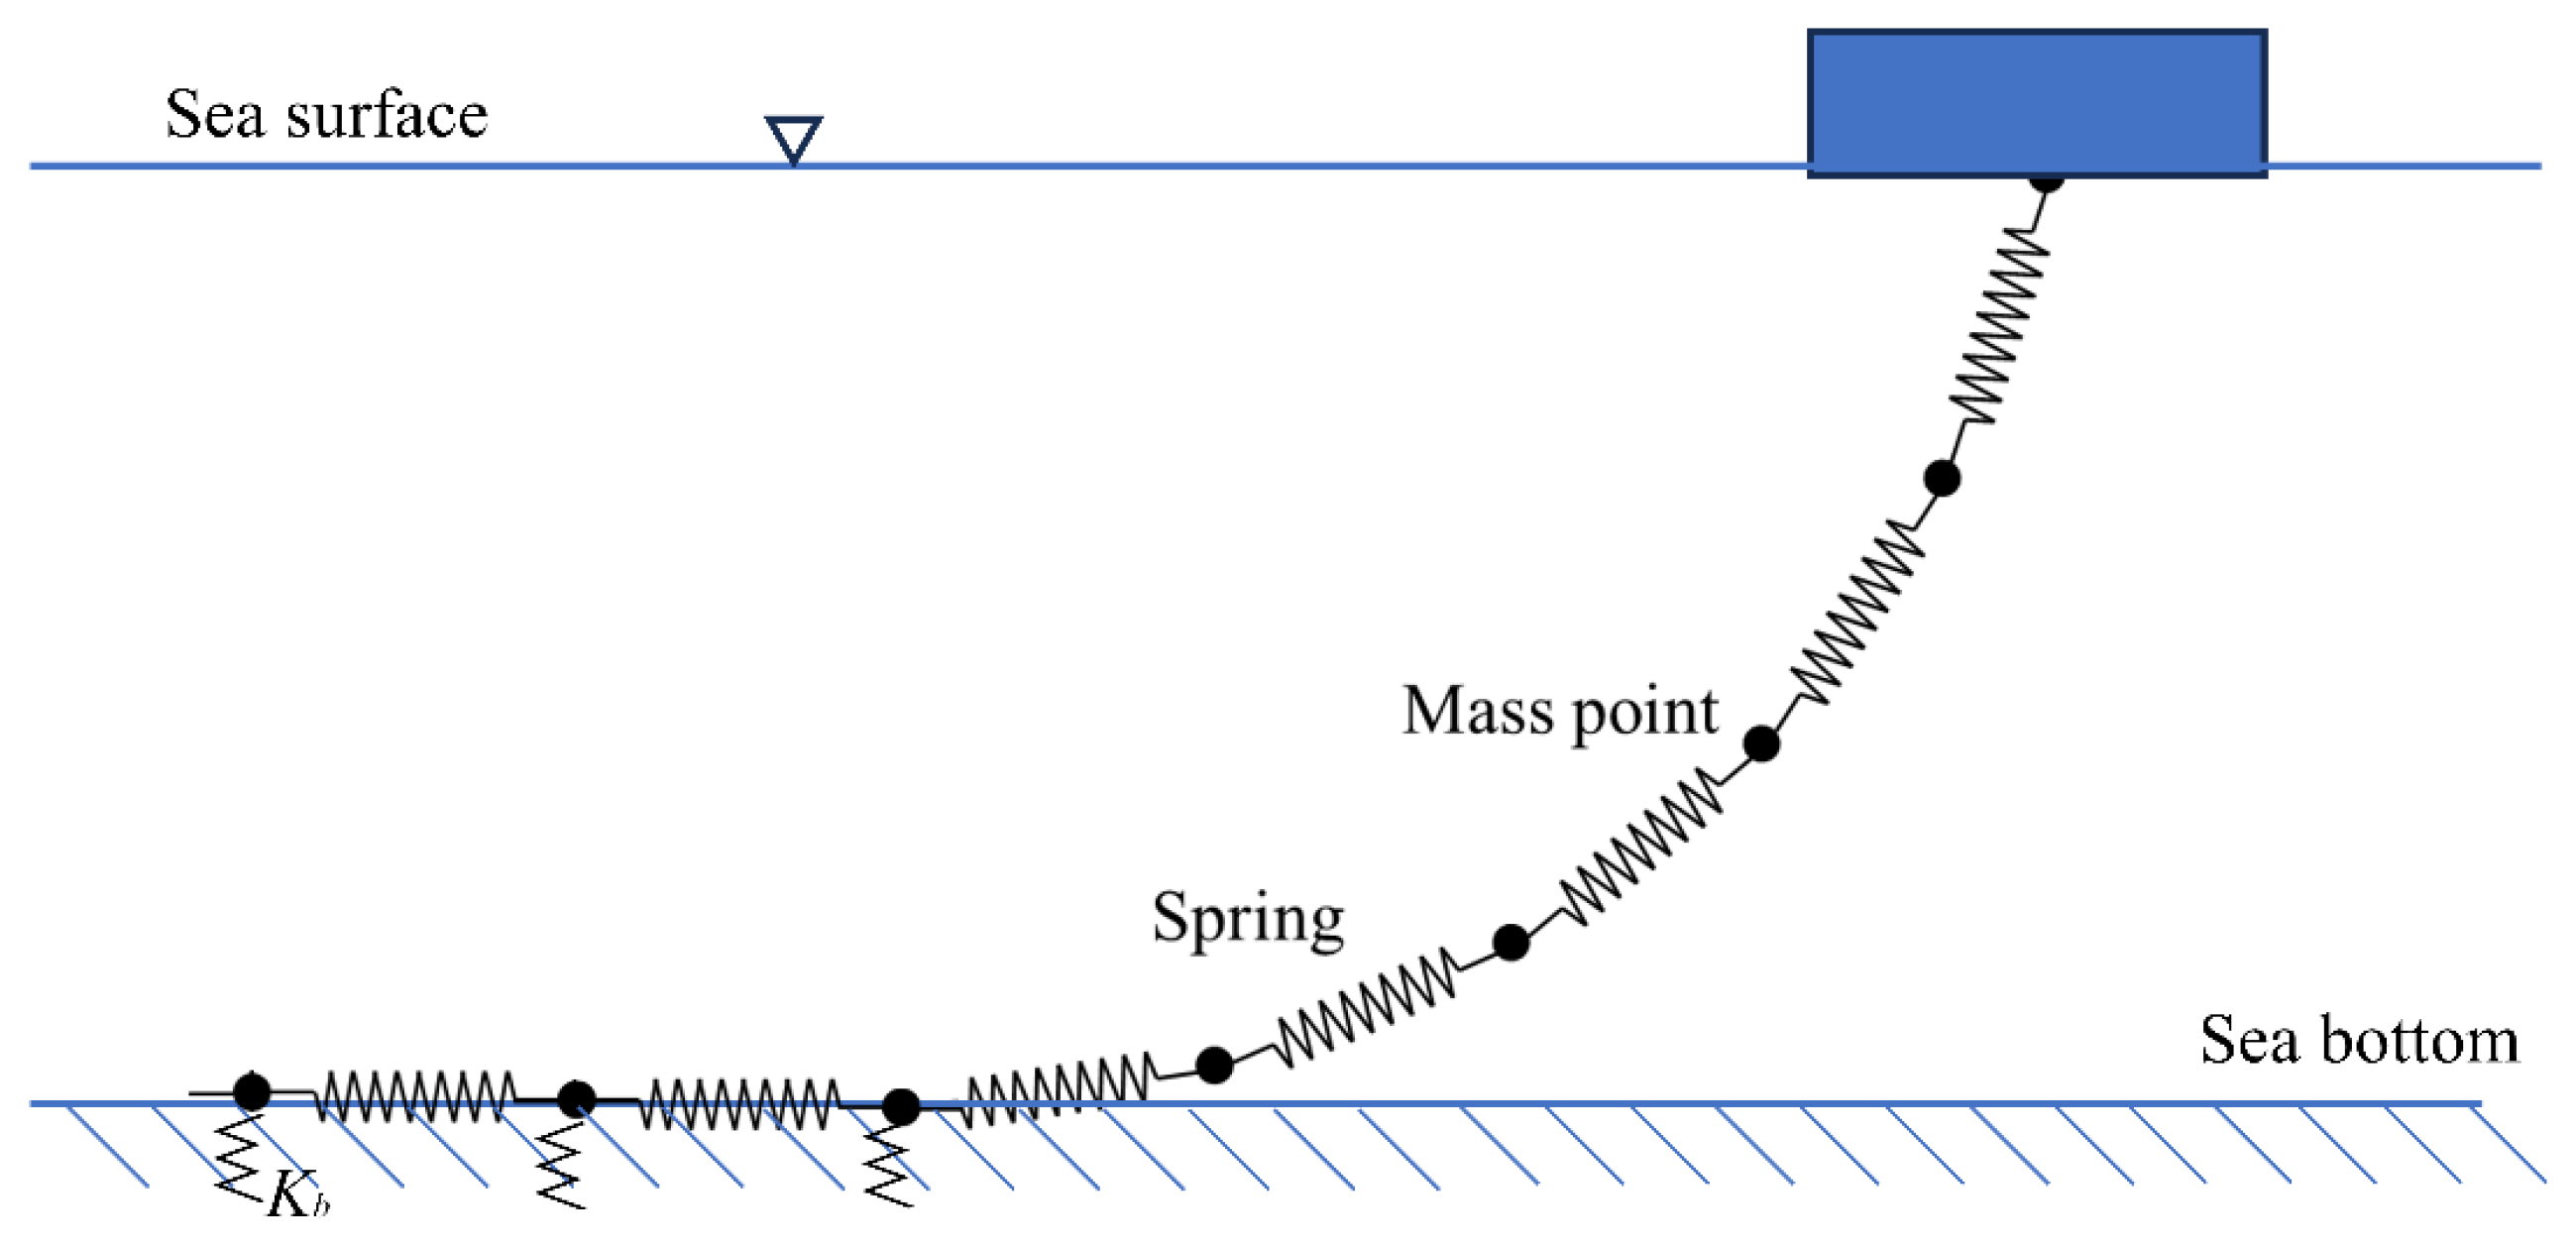
2.2.5. Seabed Model
2.3. Environmental Conditions
3. Results and Discussion
3.1. Motion Responses under Regular Wave Conditions
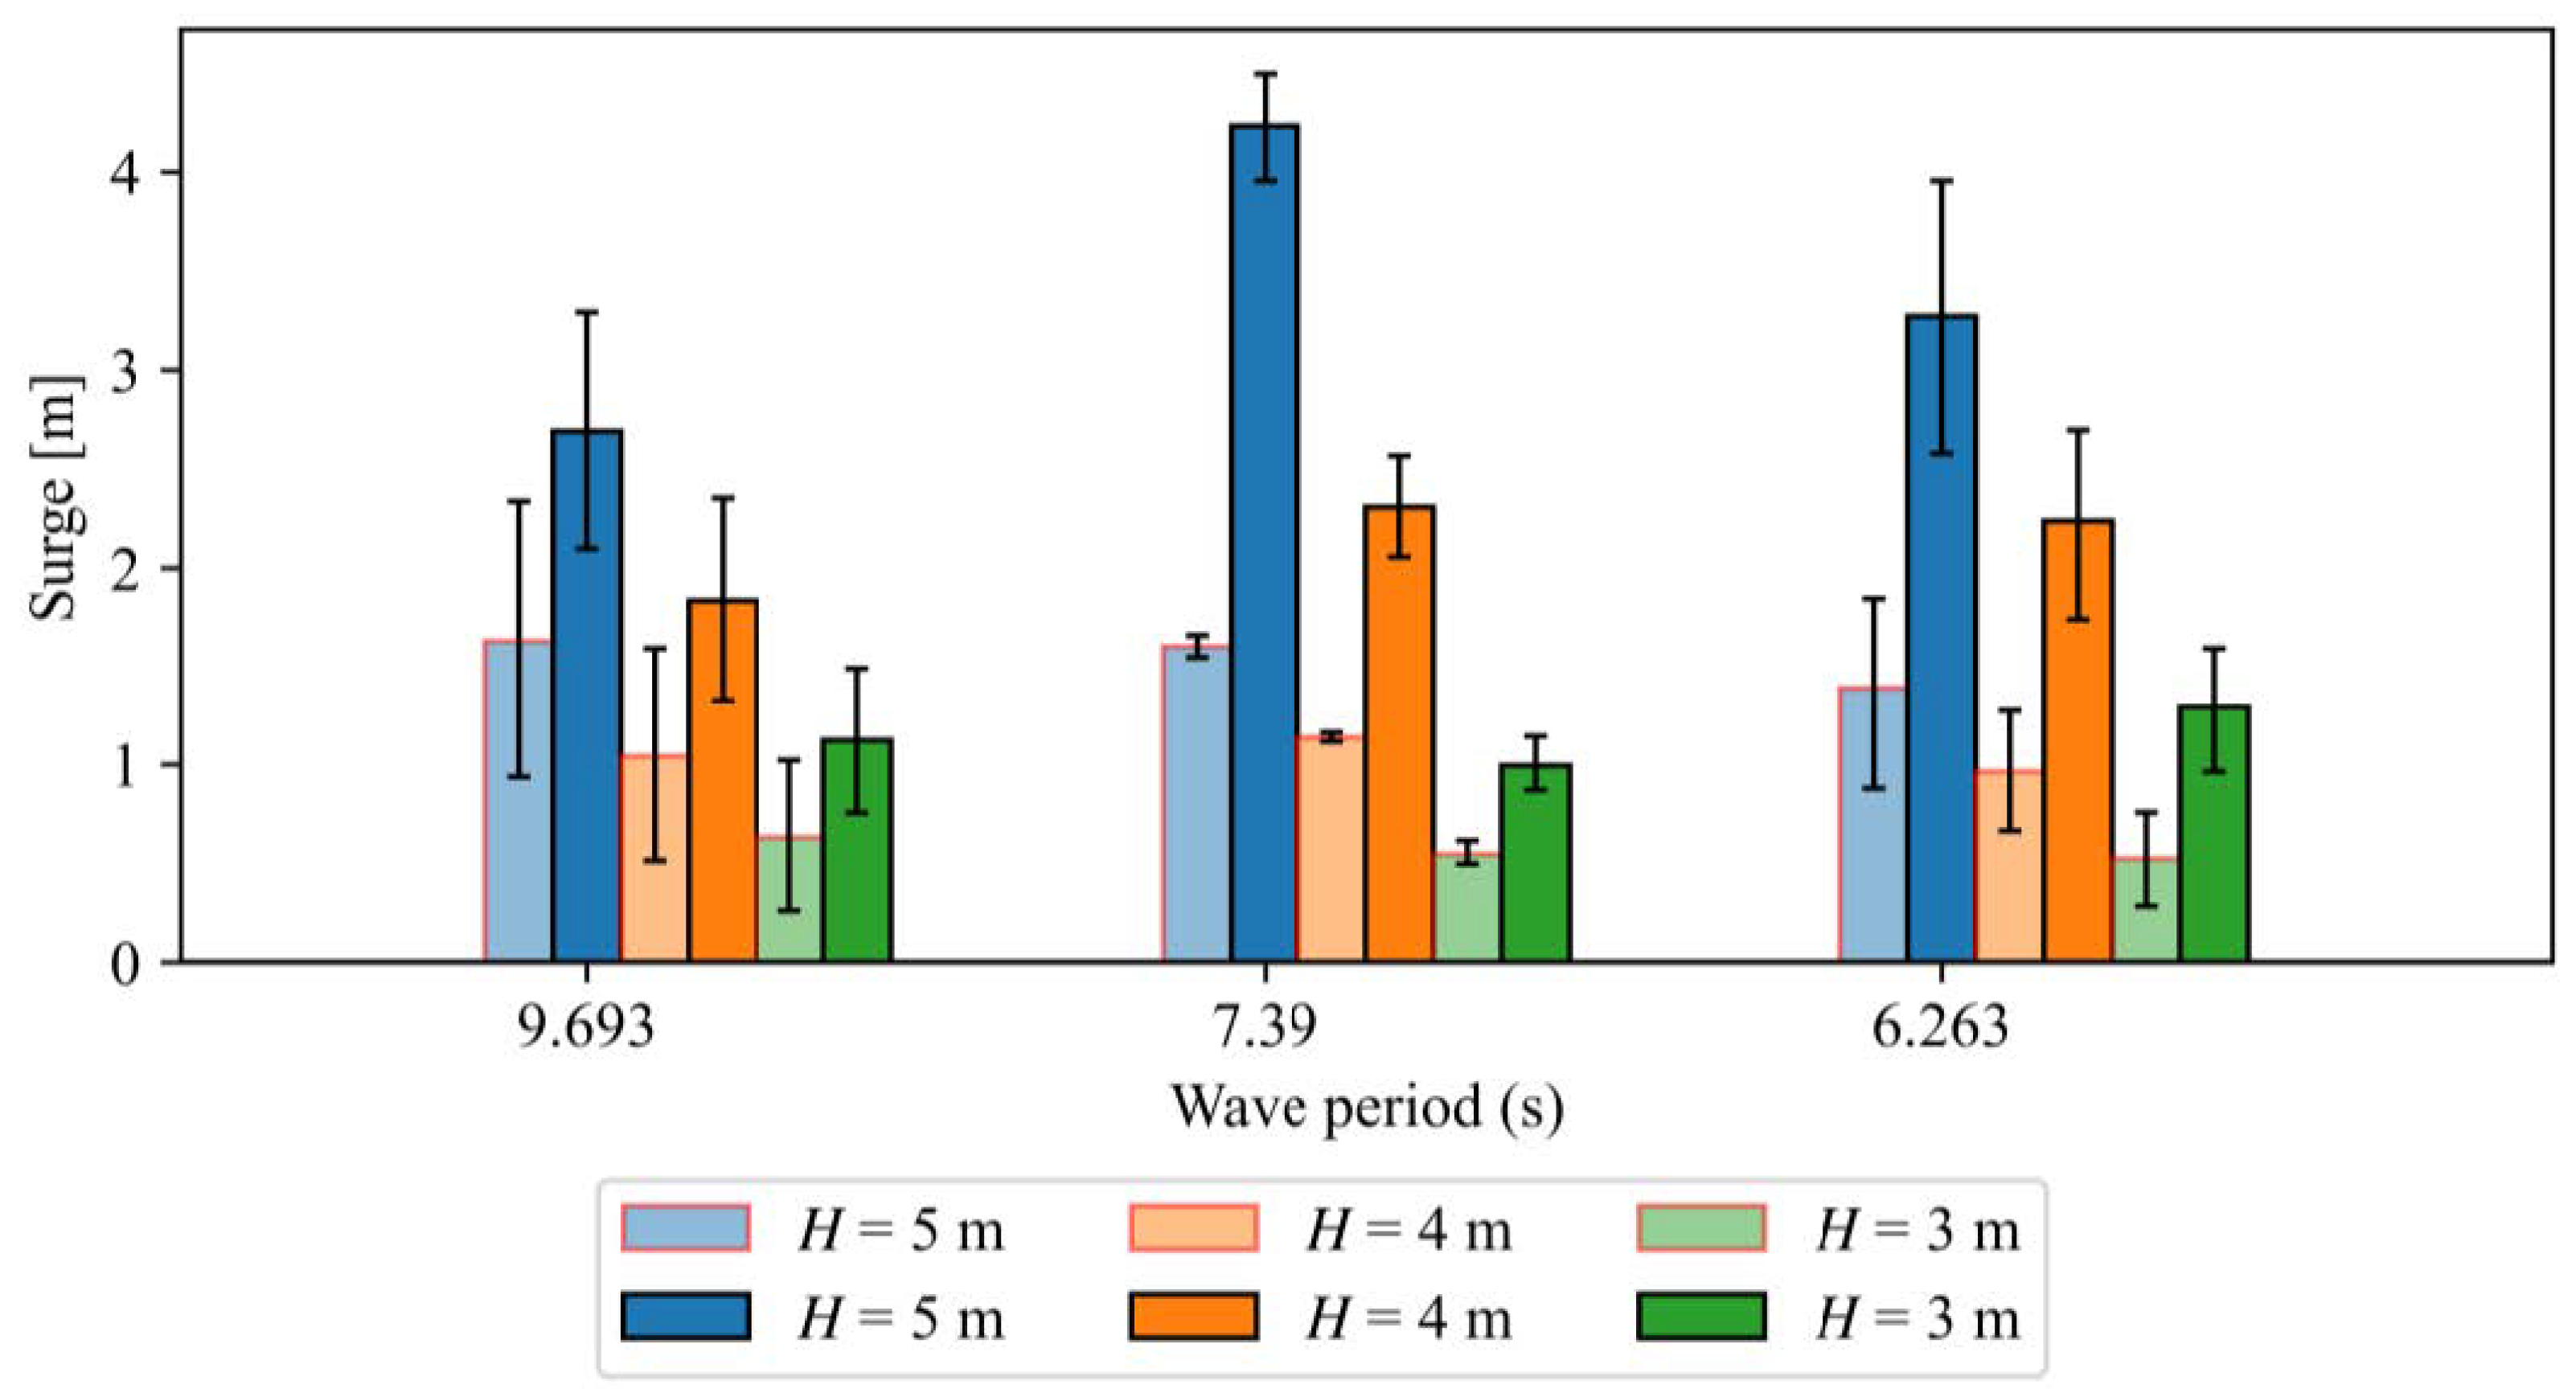
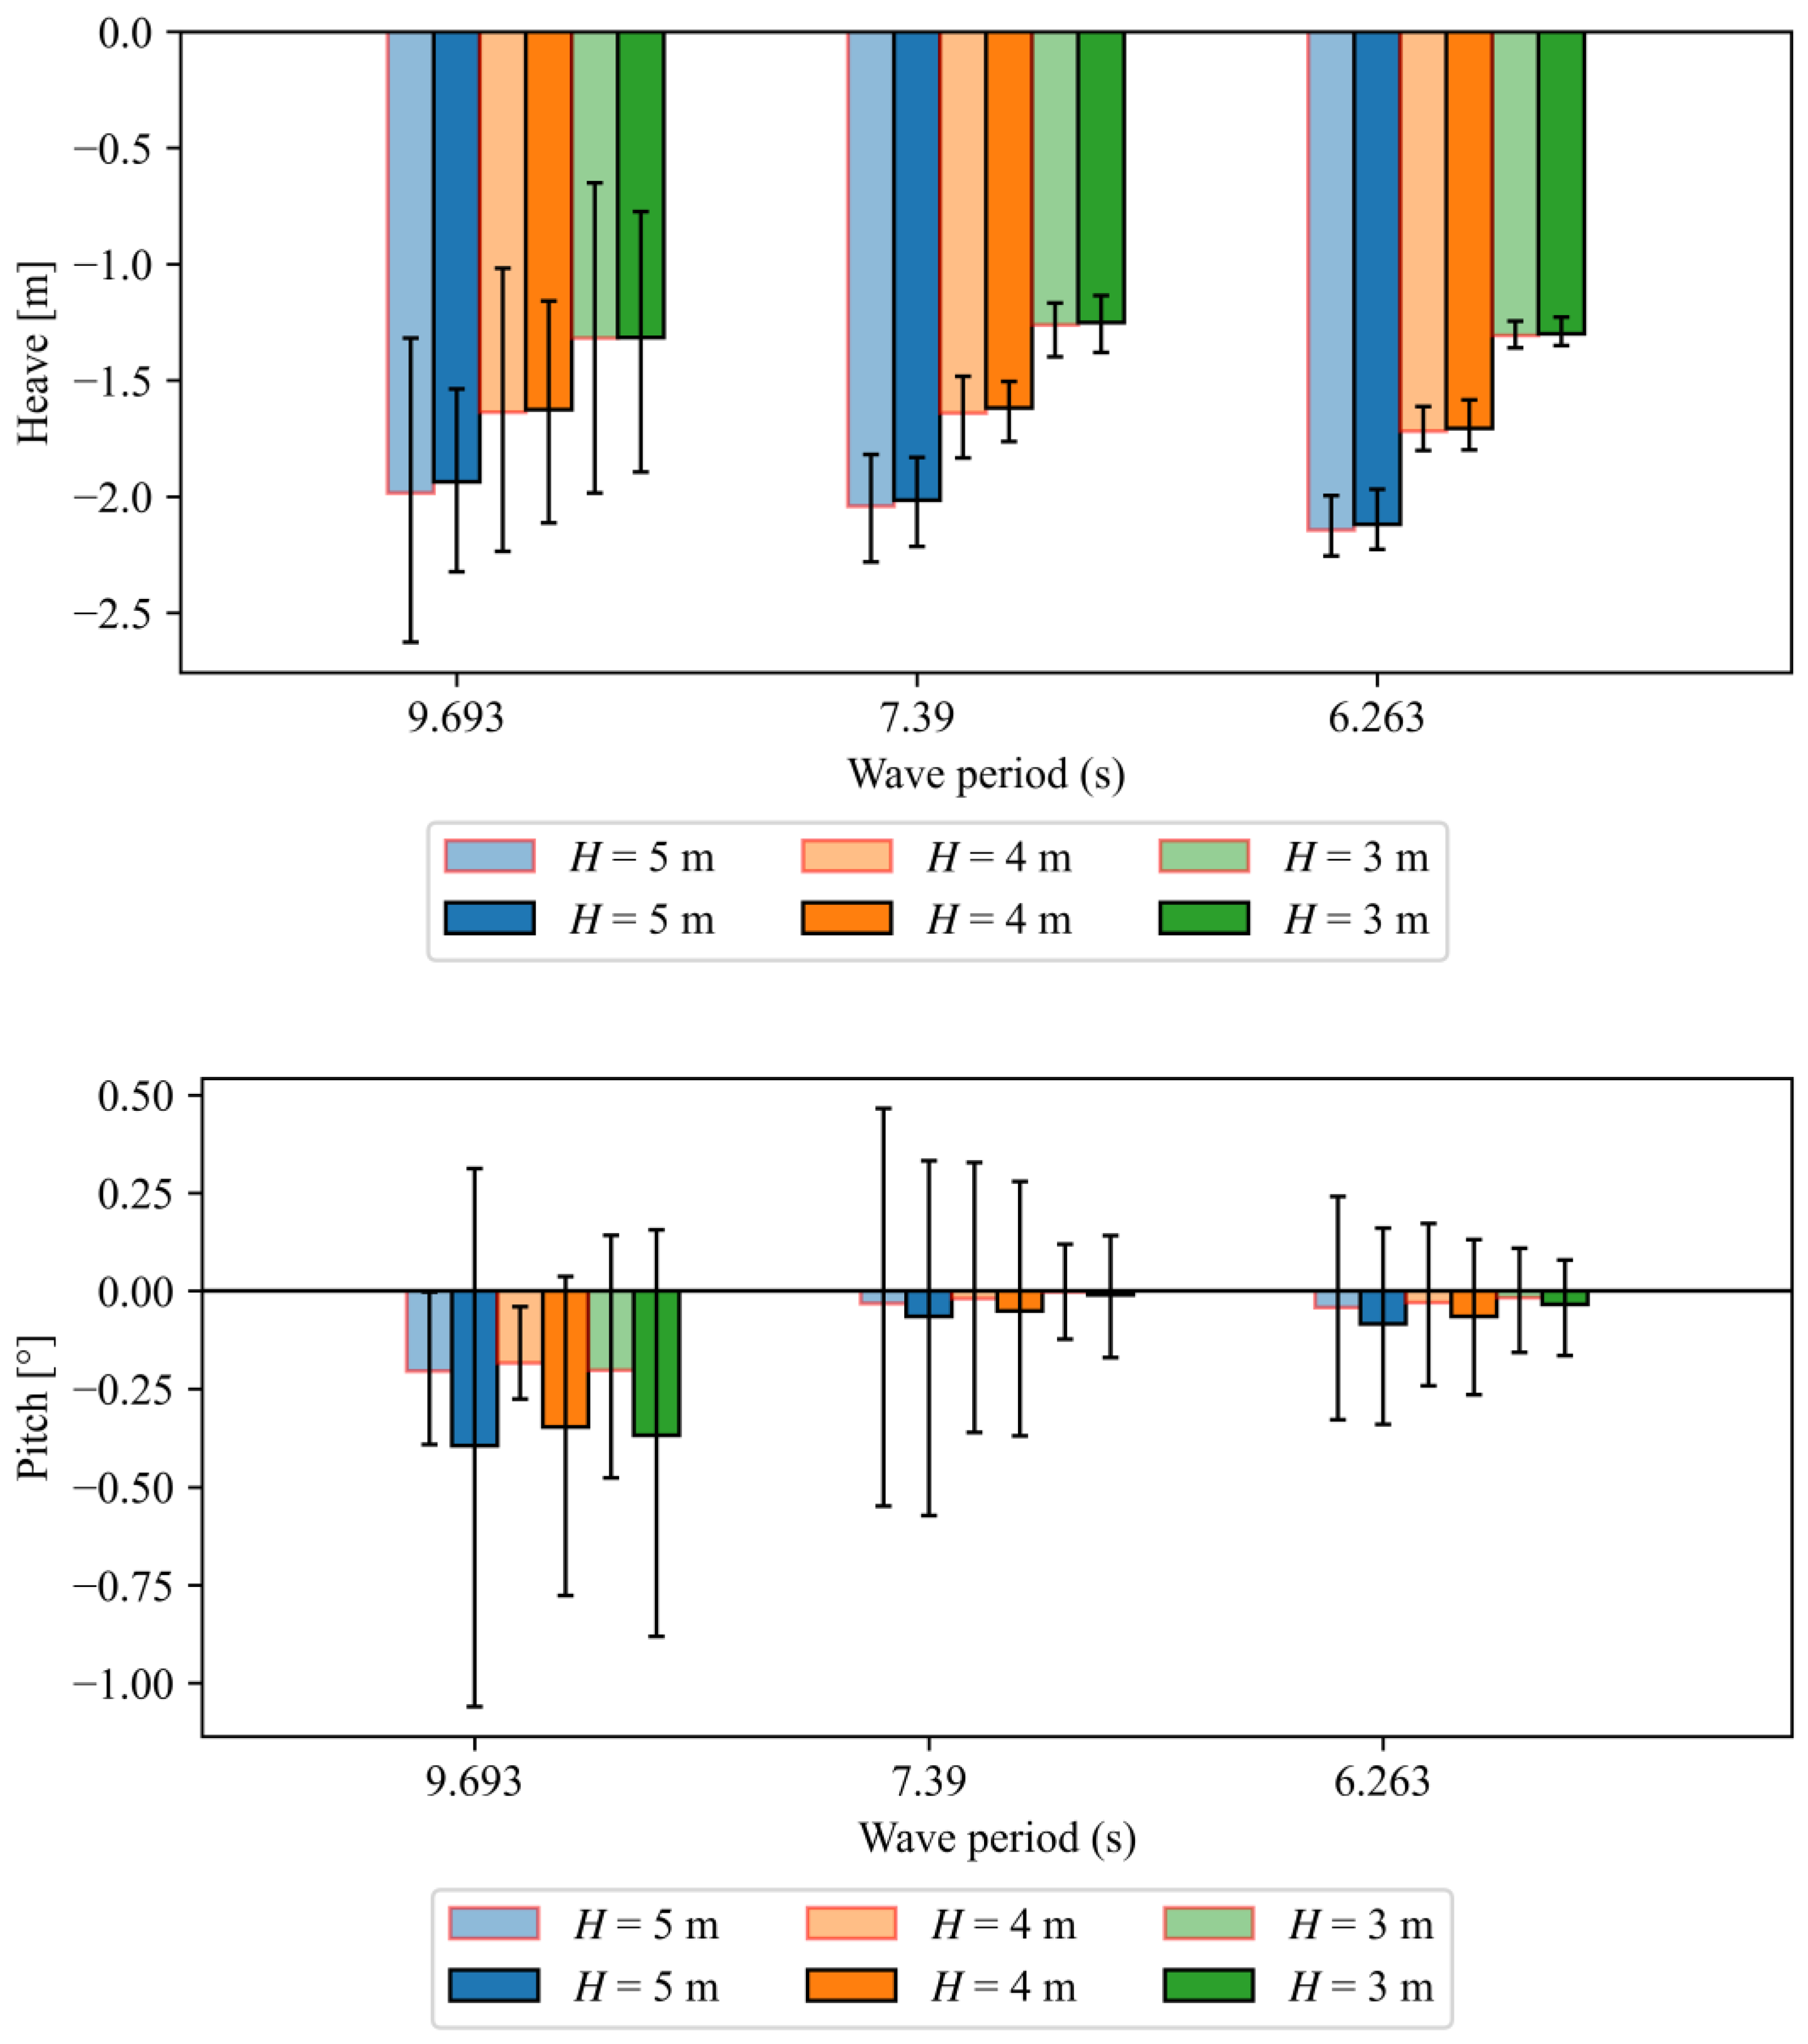
3.1.1. When the Wave Heading Direction Is 0°
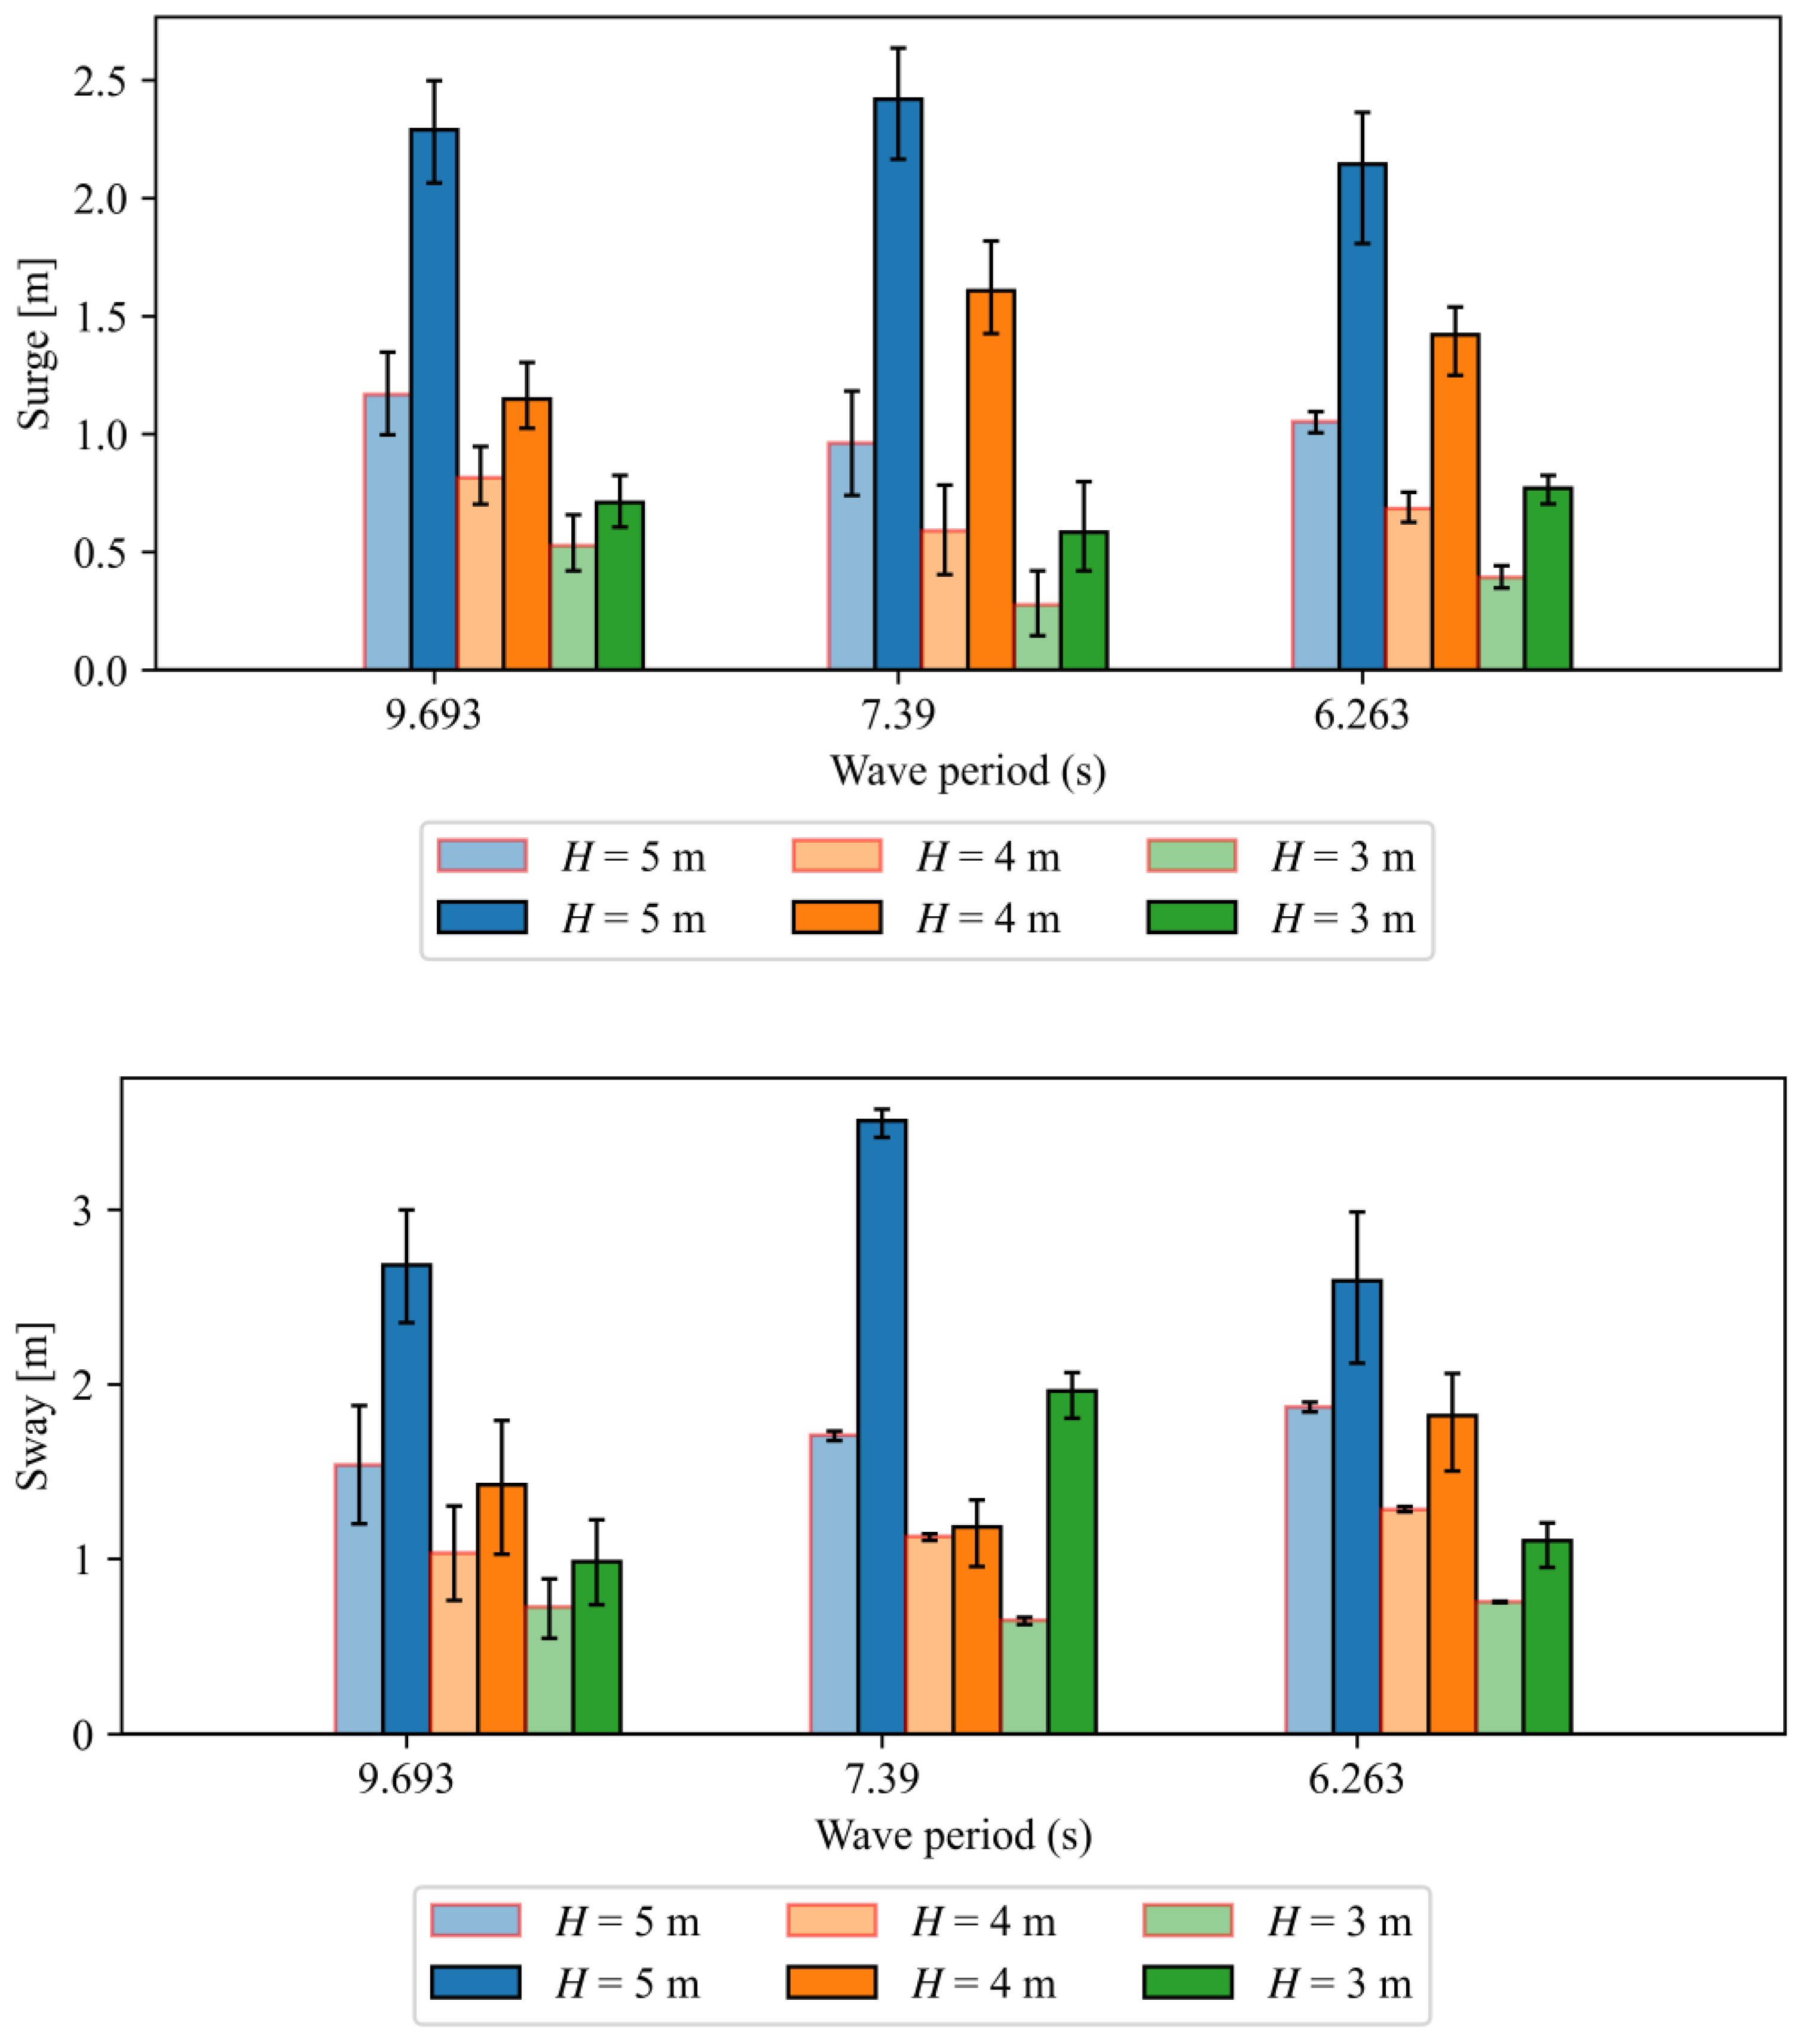
3.1.2. When the Wave Heading Direction Is 90°
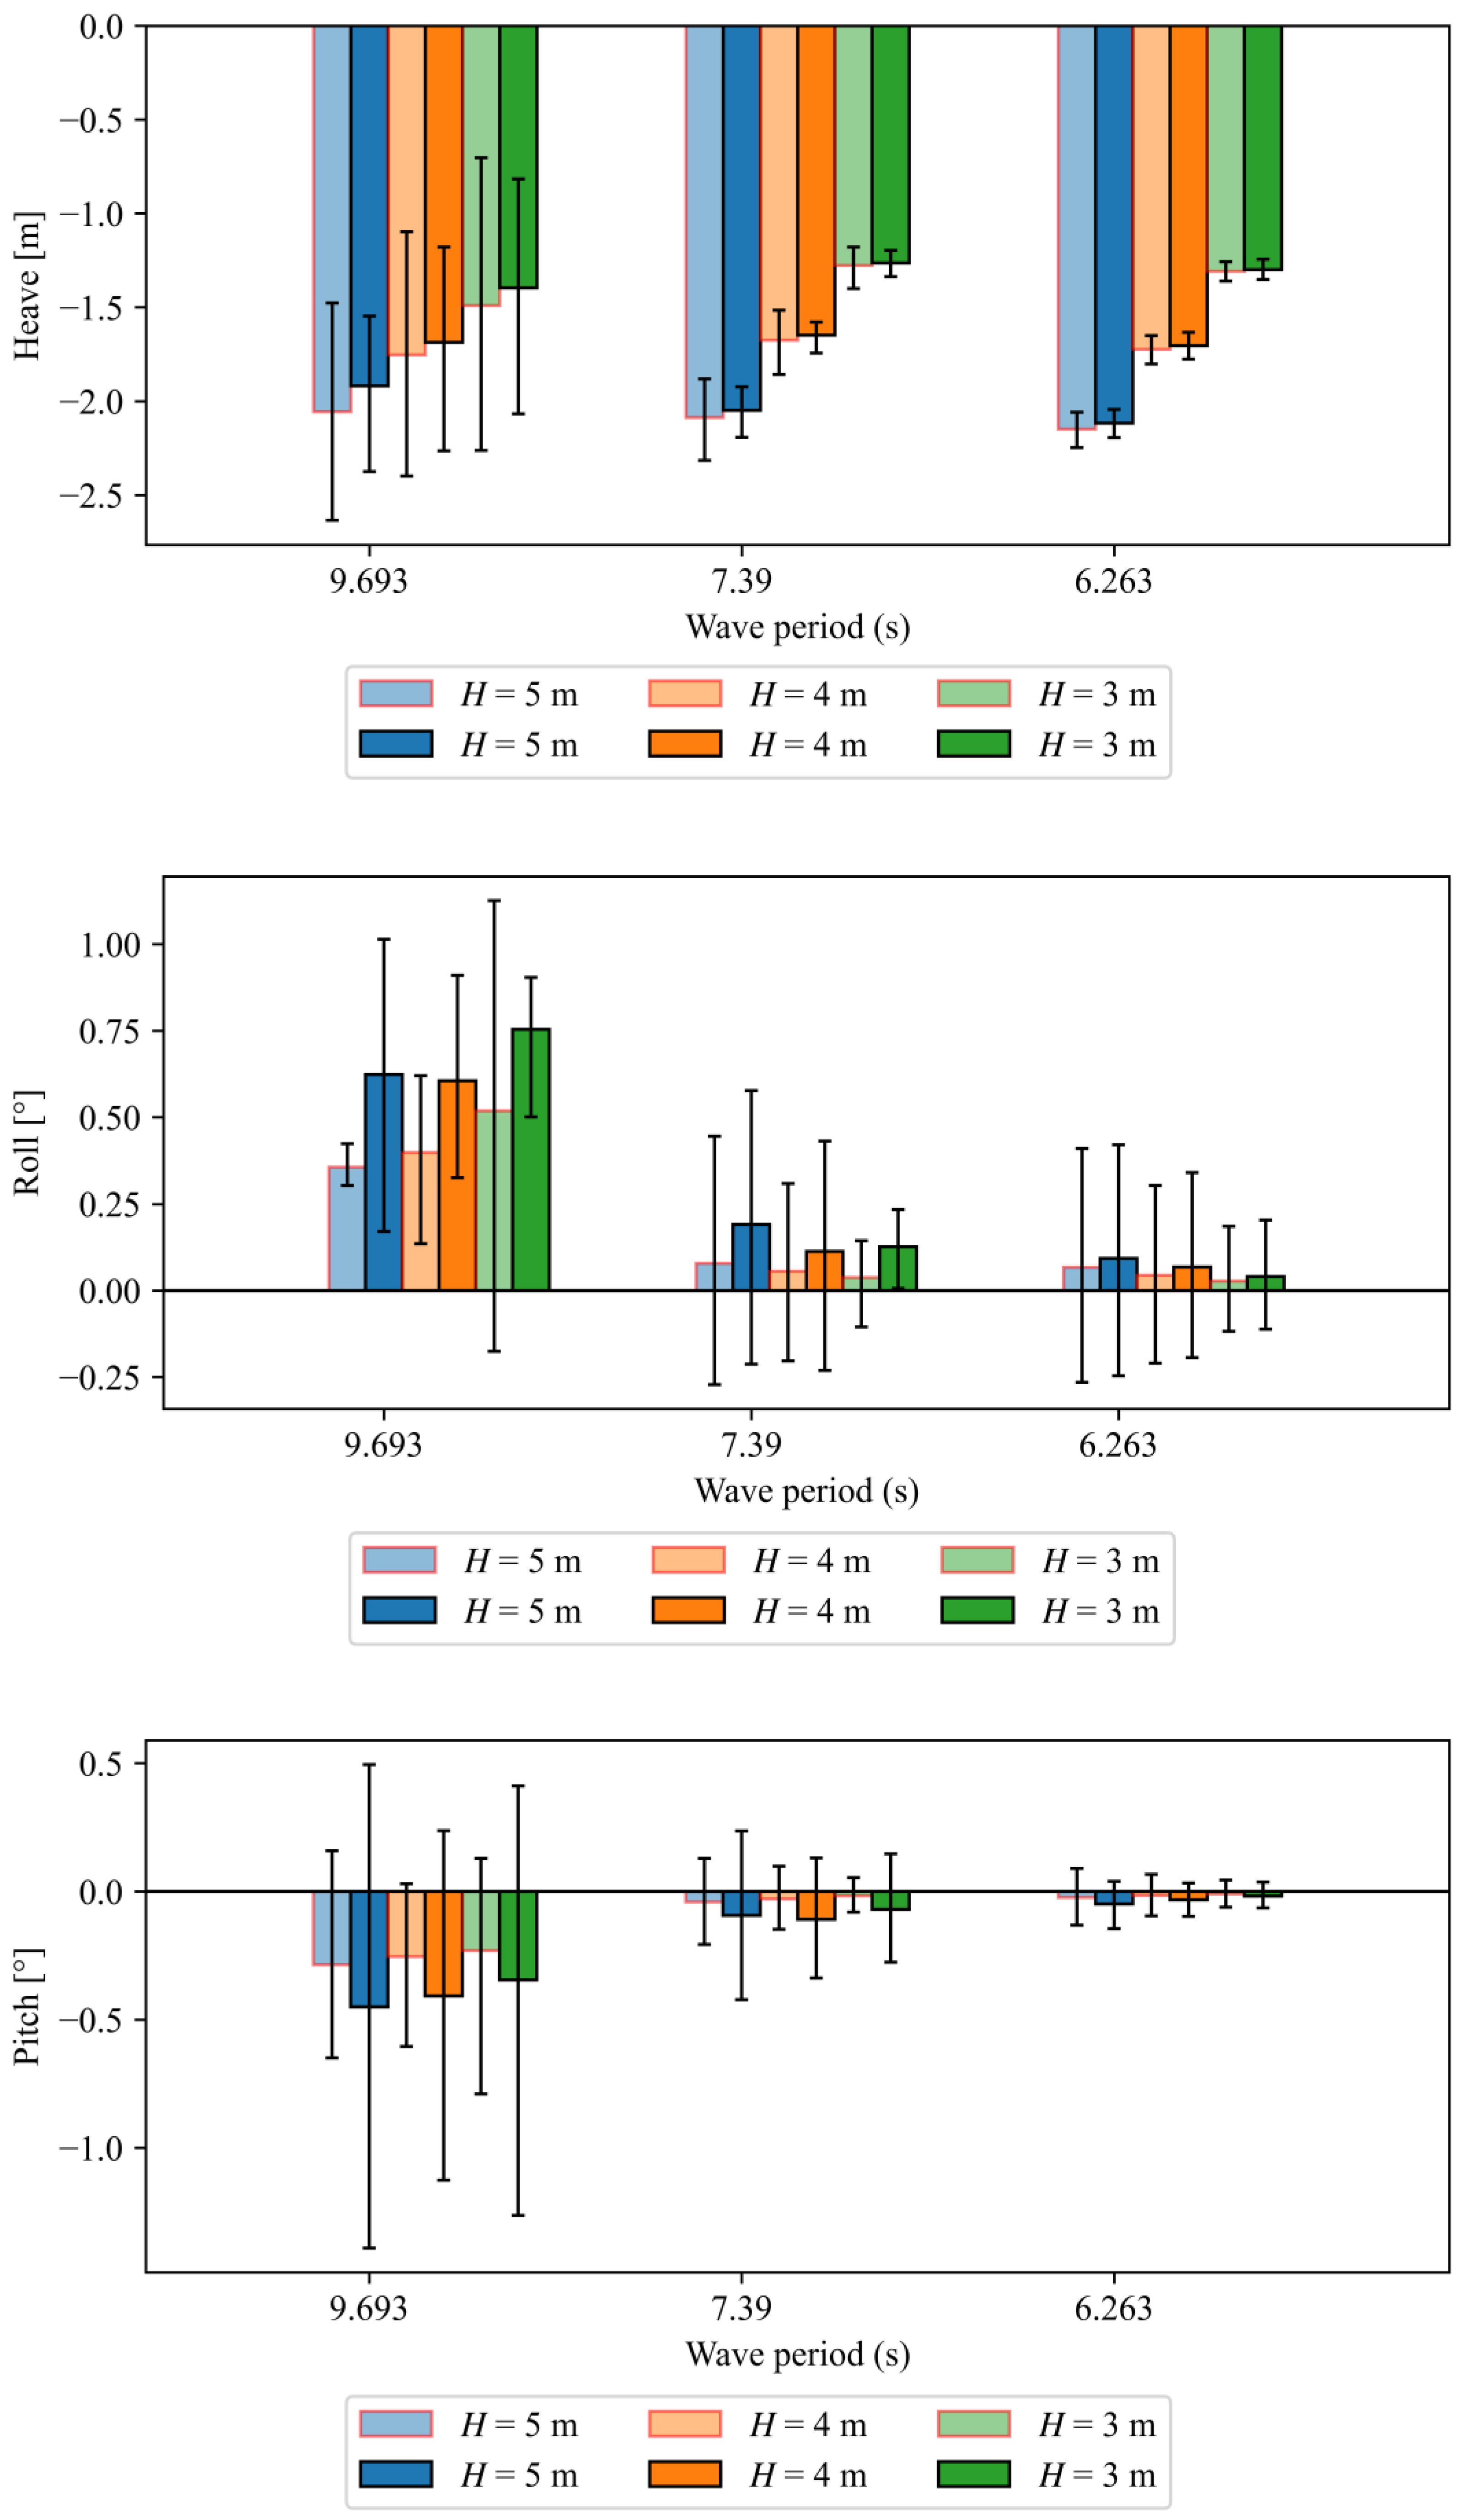
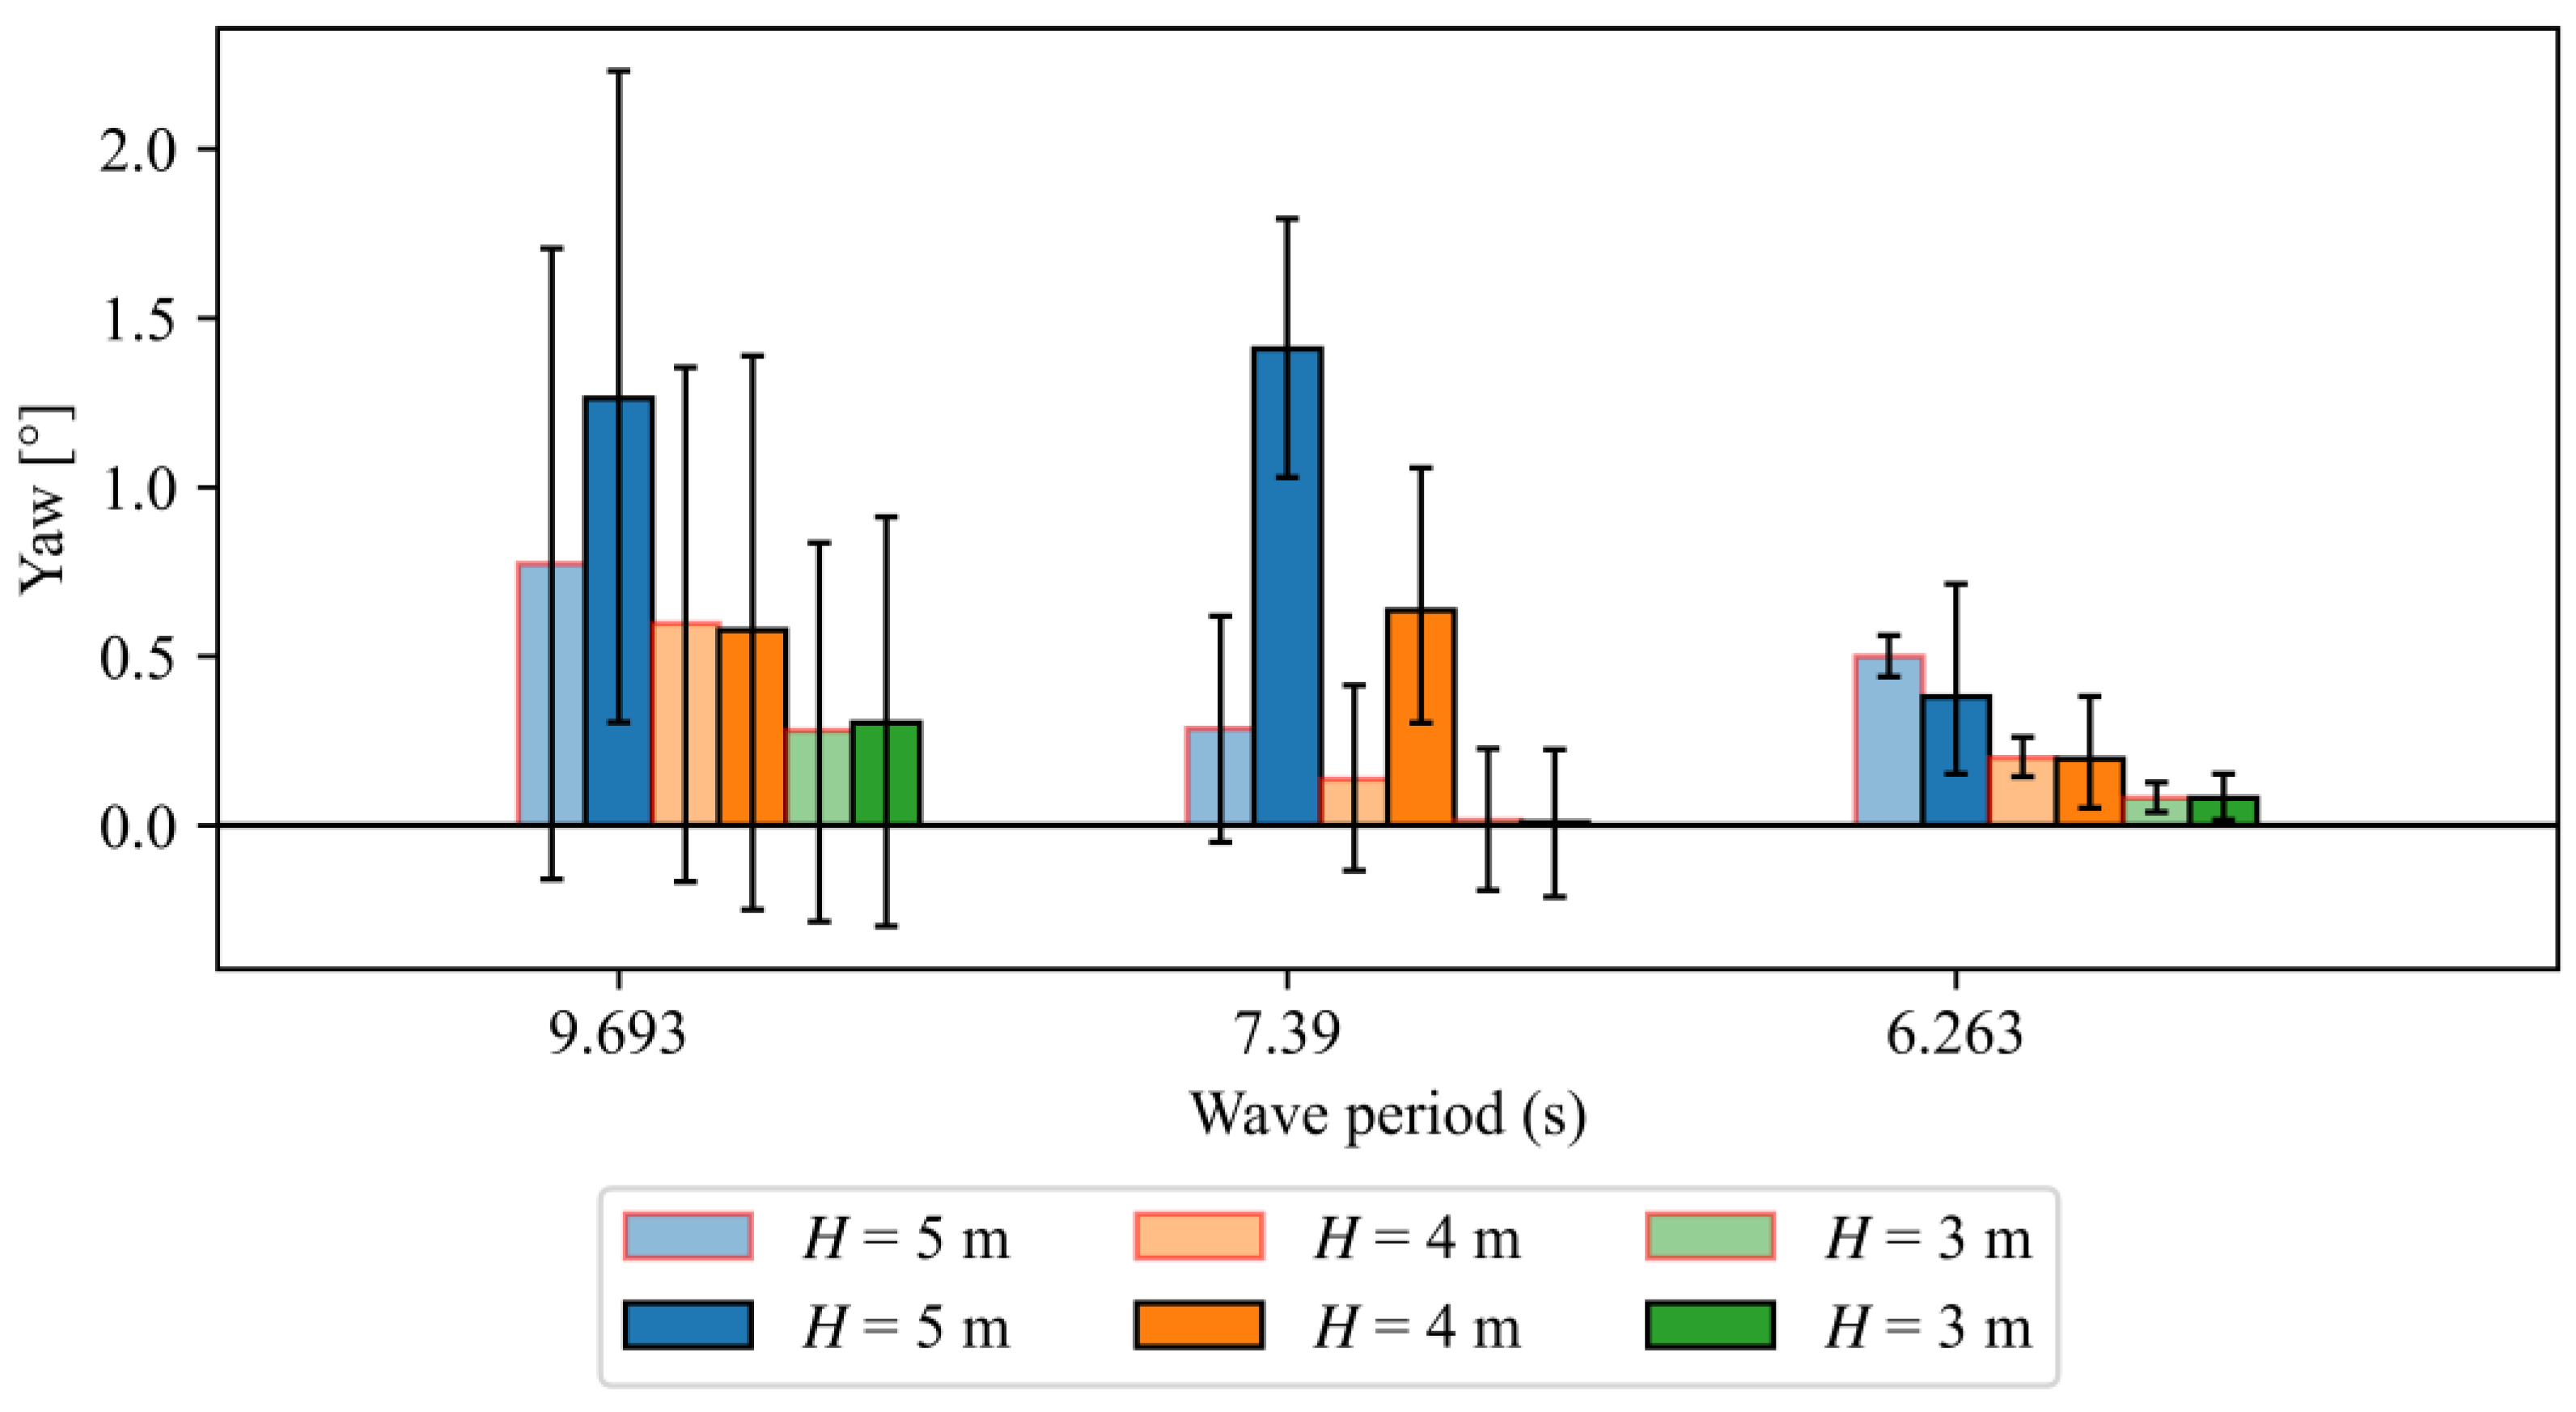
3.1.3. When the Wave Heading Direction Is 45°
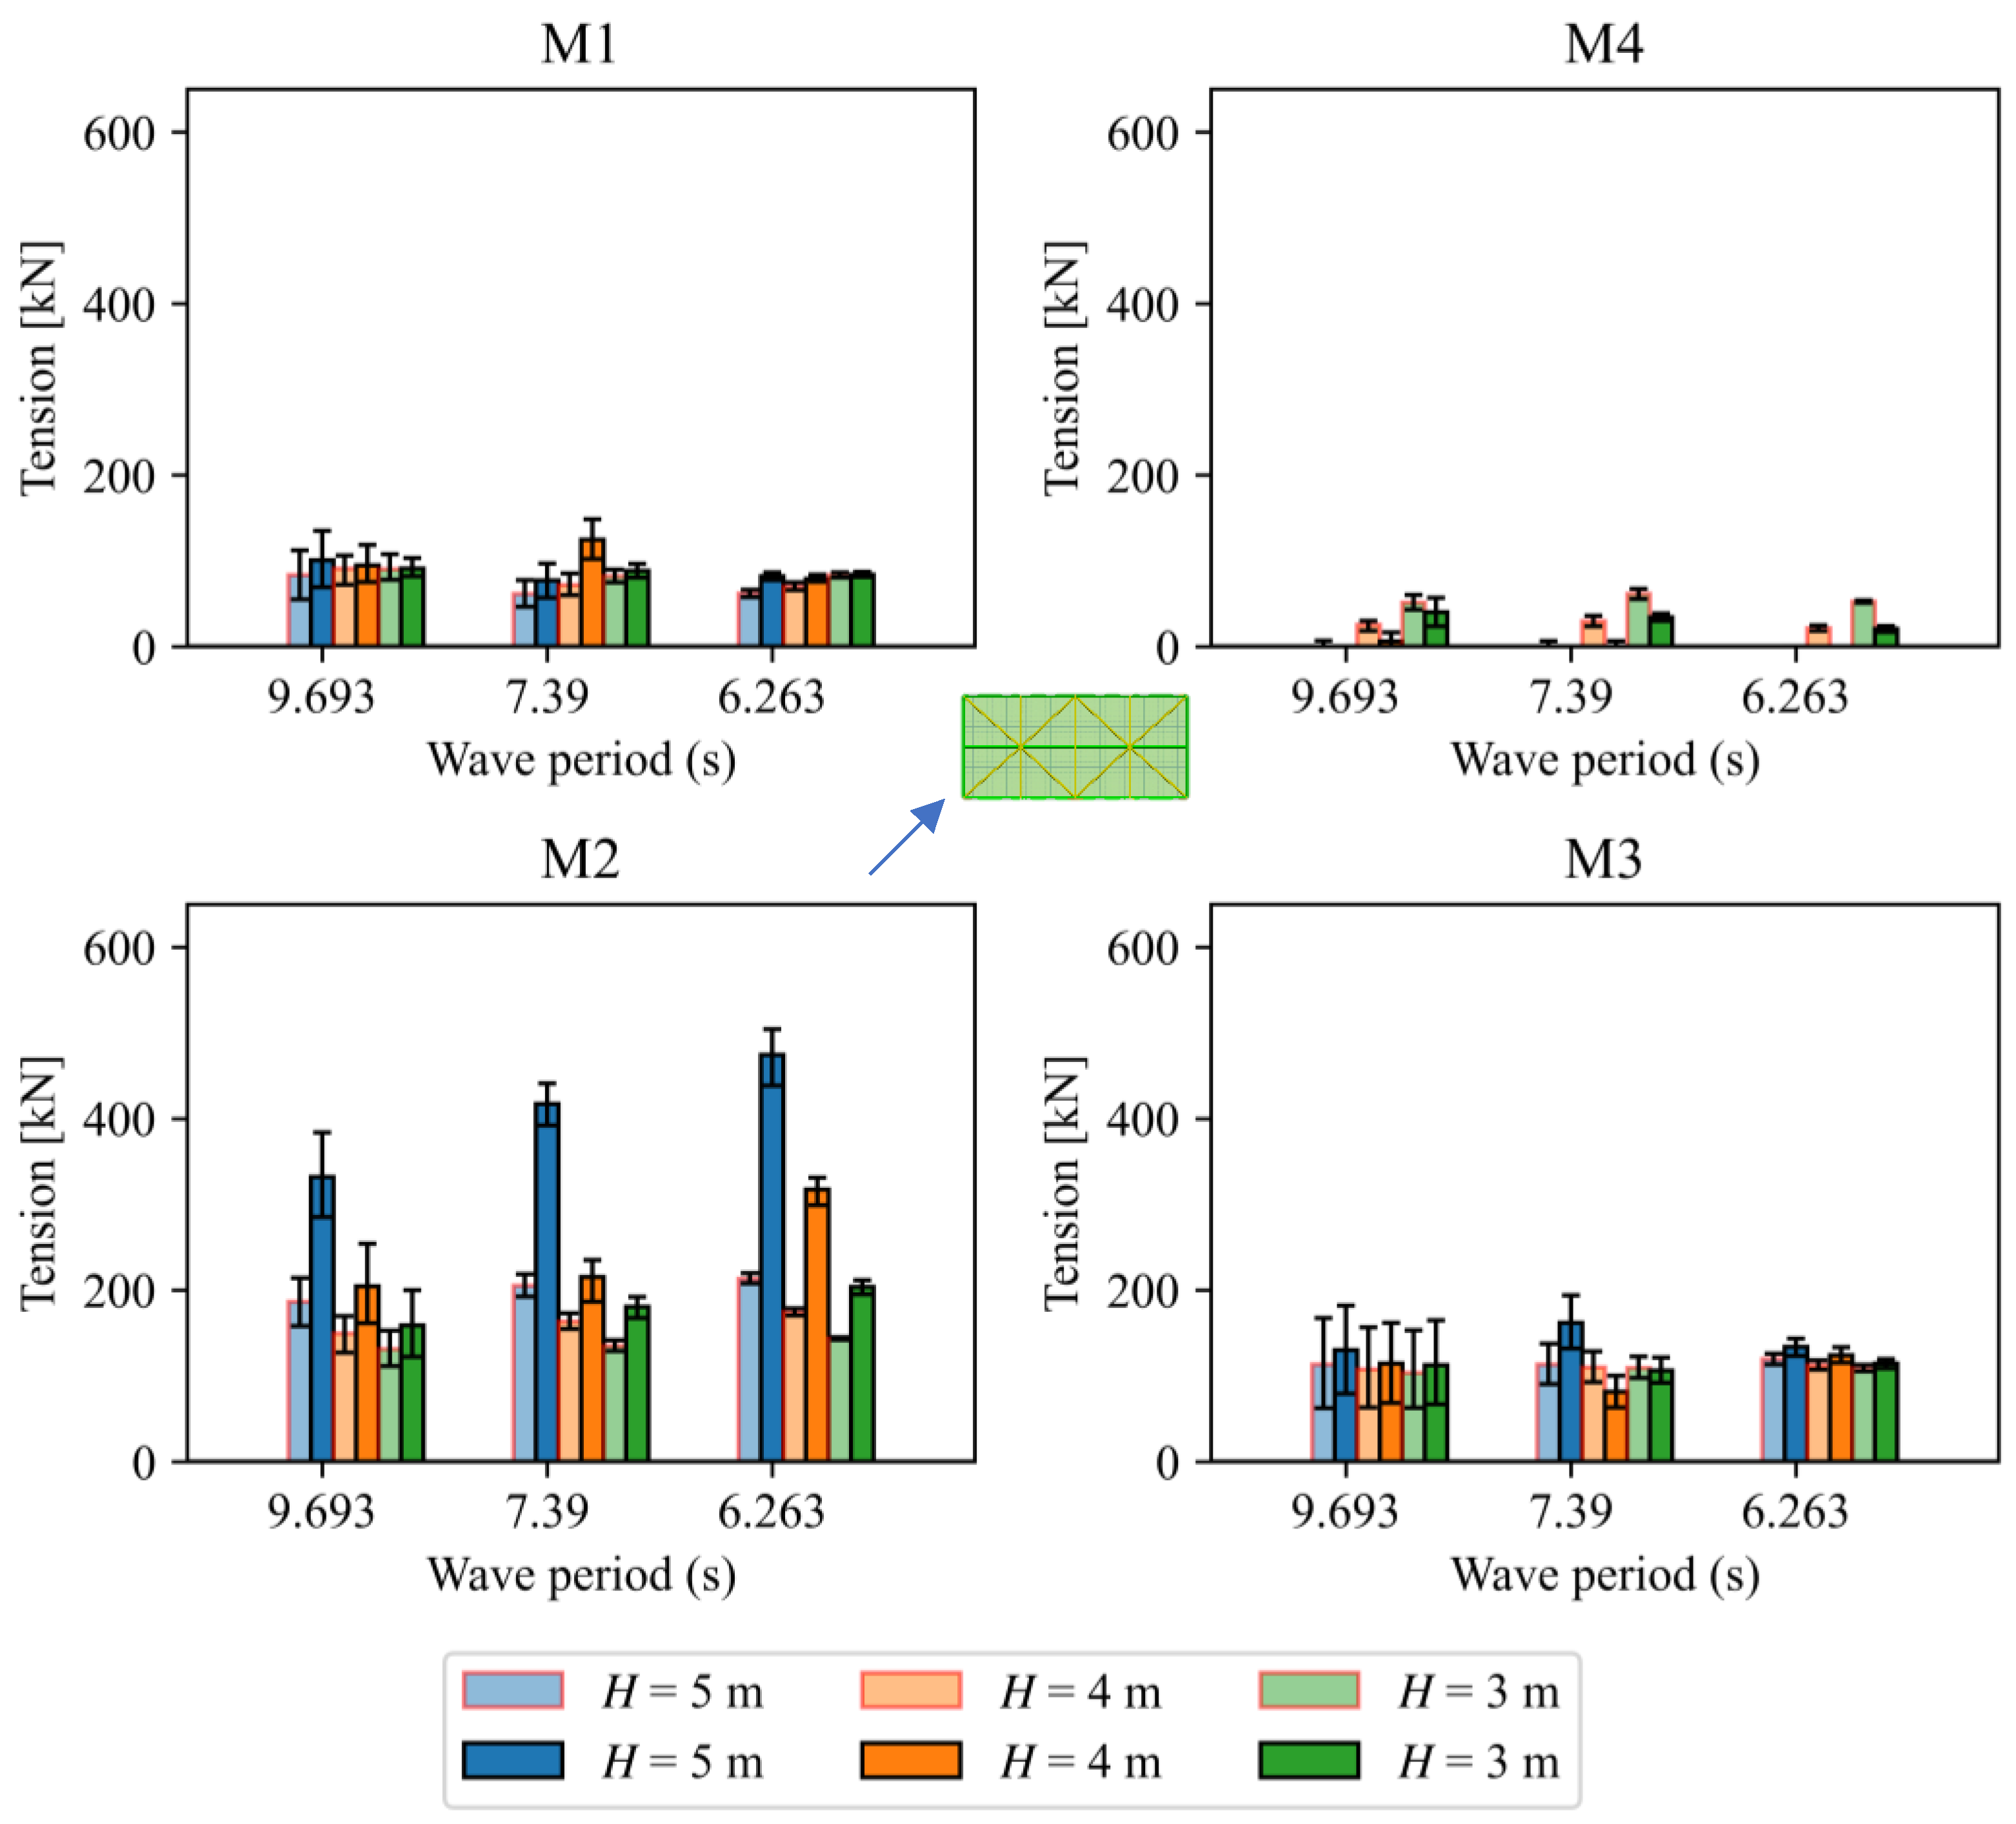
3.2. Tension Force under Regular Wave Conditions
3.2.1. When the Wave Heading Direction Is 0°
3.2.2. When the Wave Heading Direction Is 90°
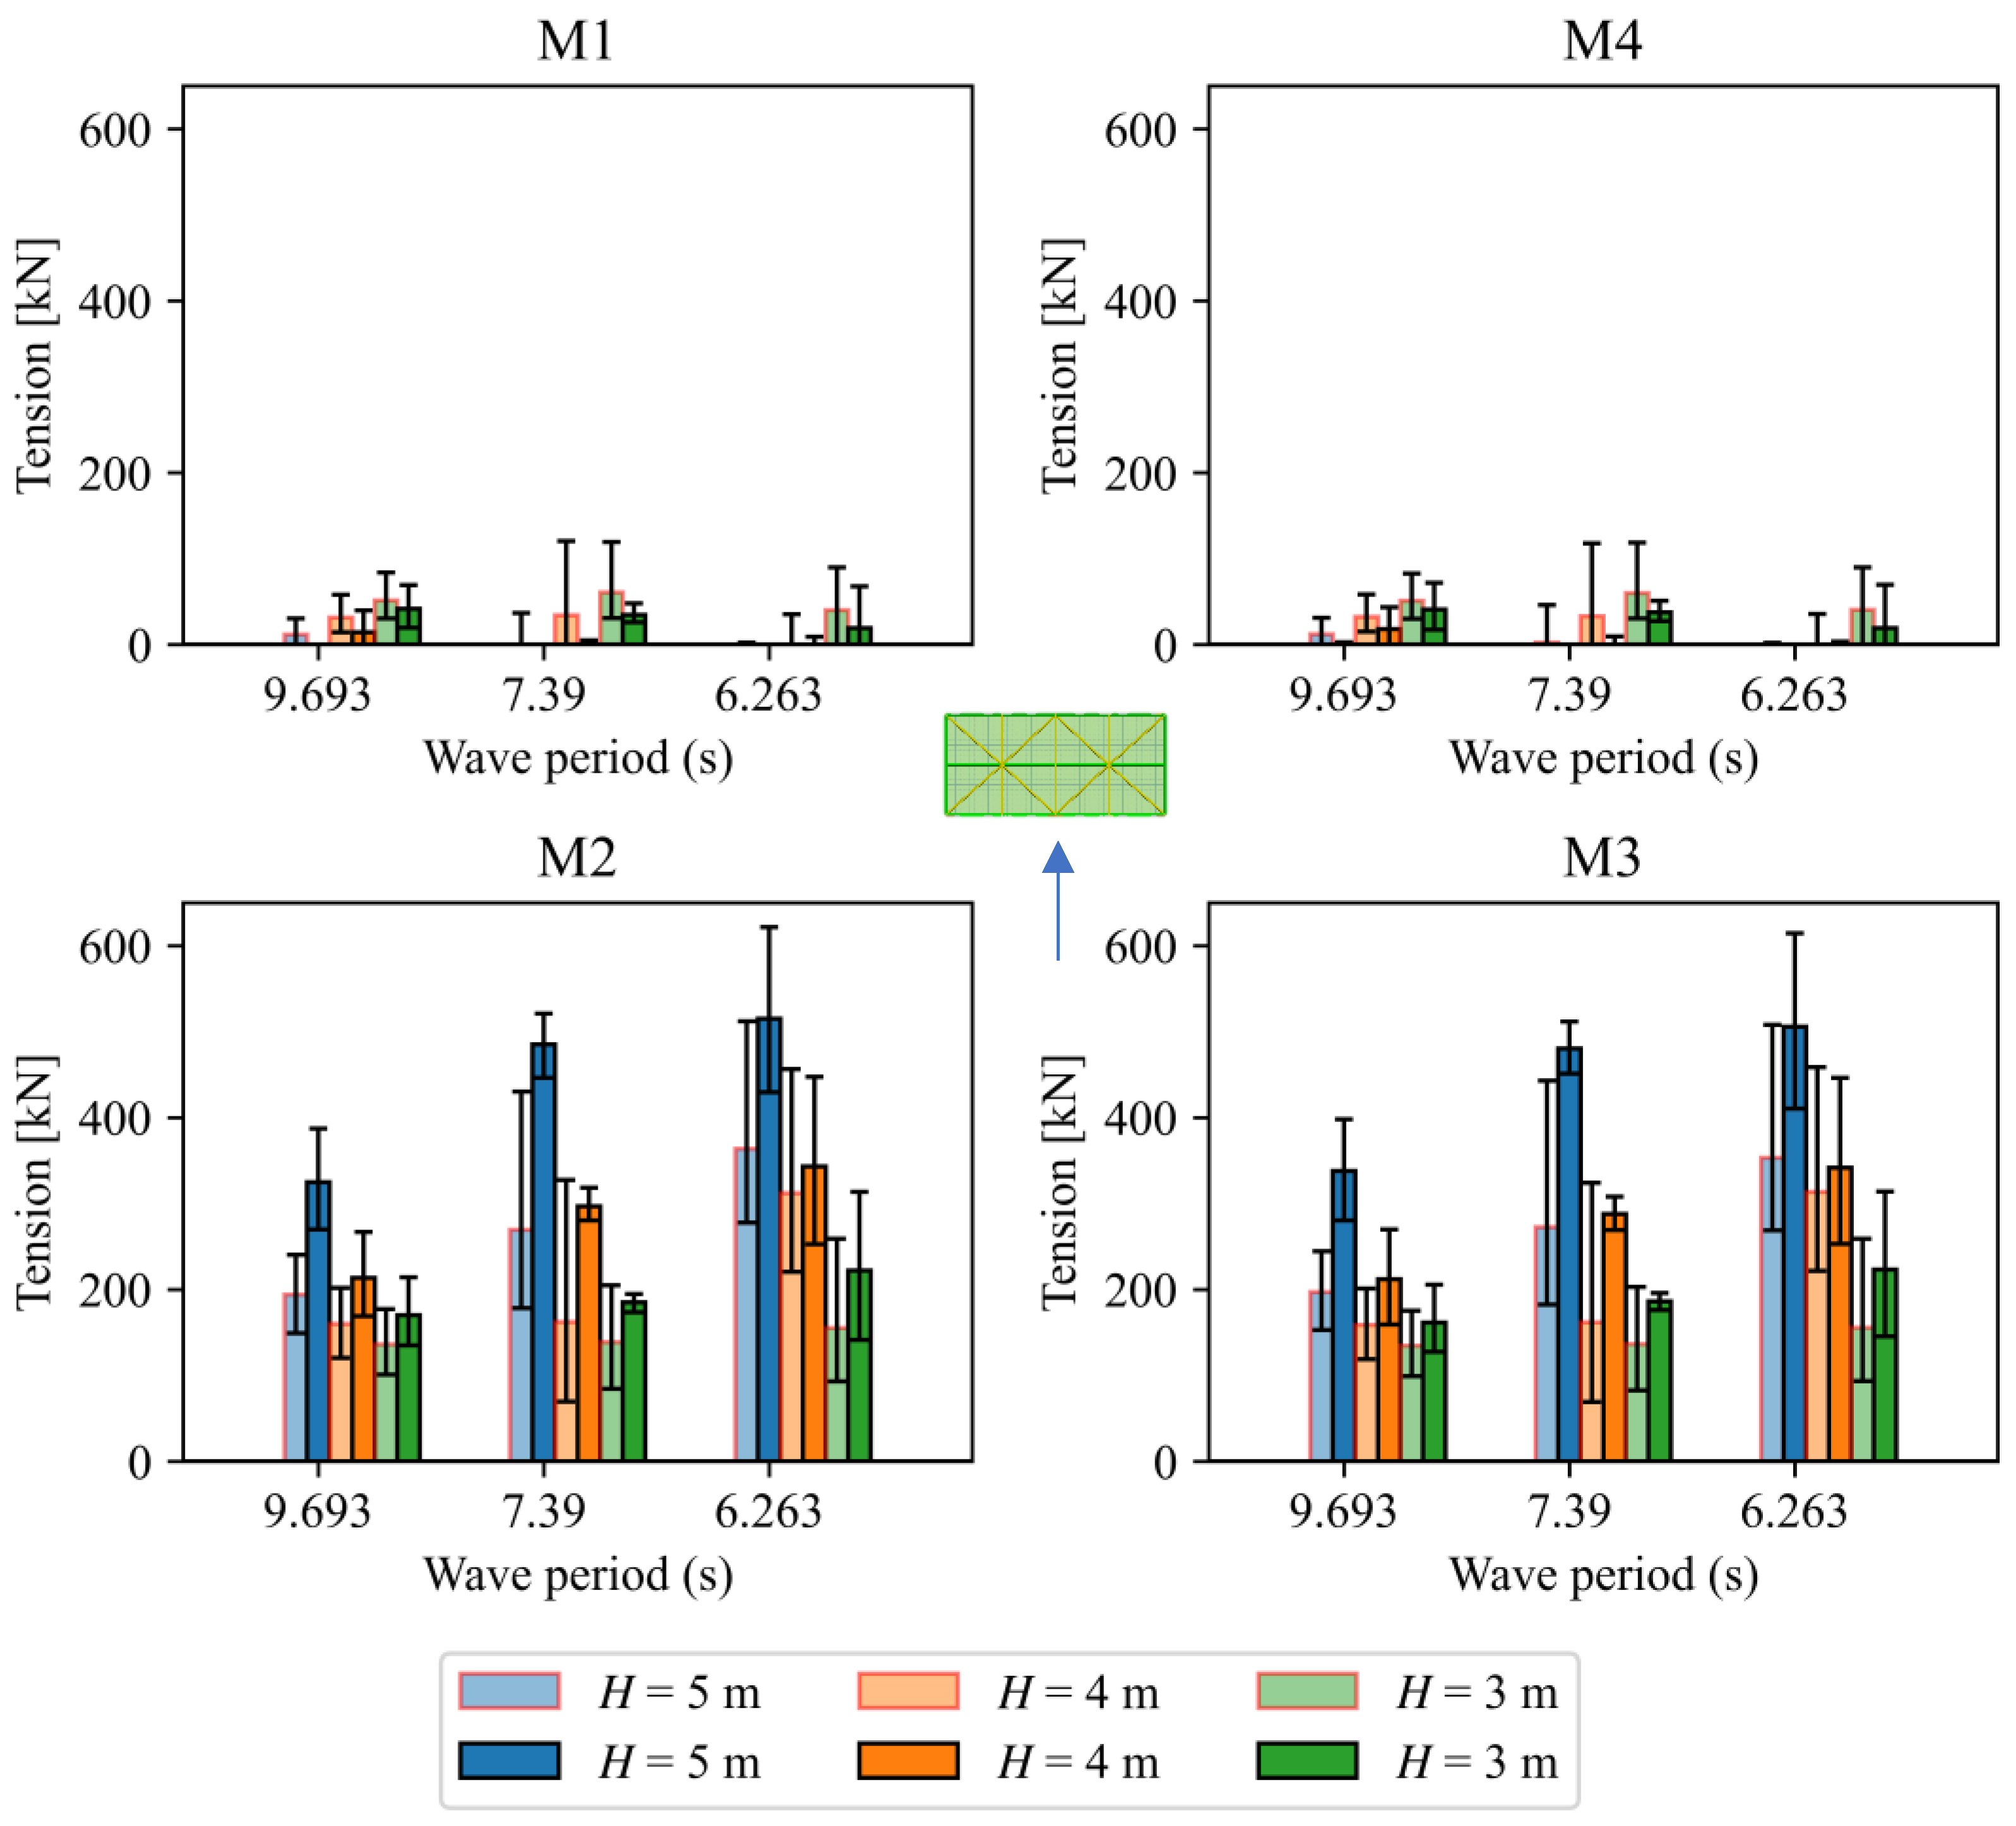
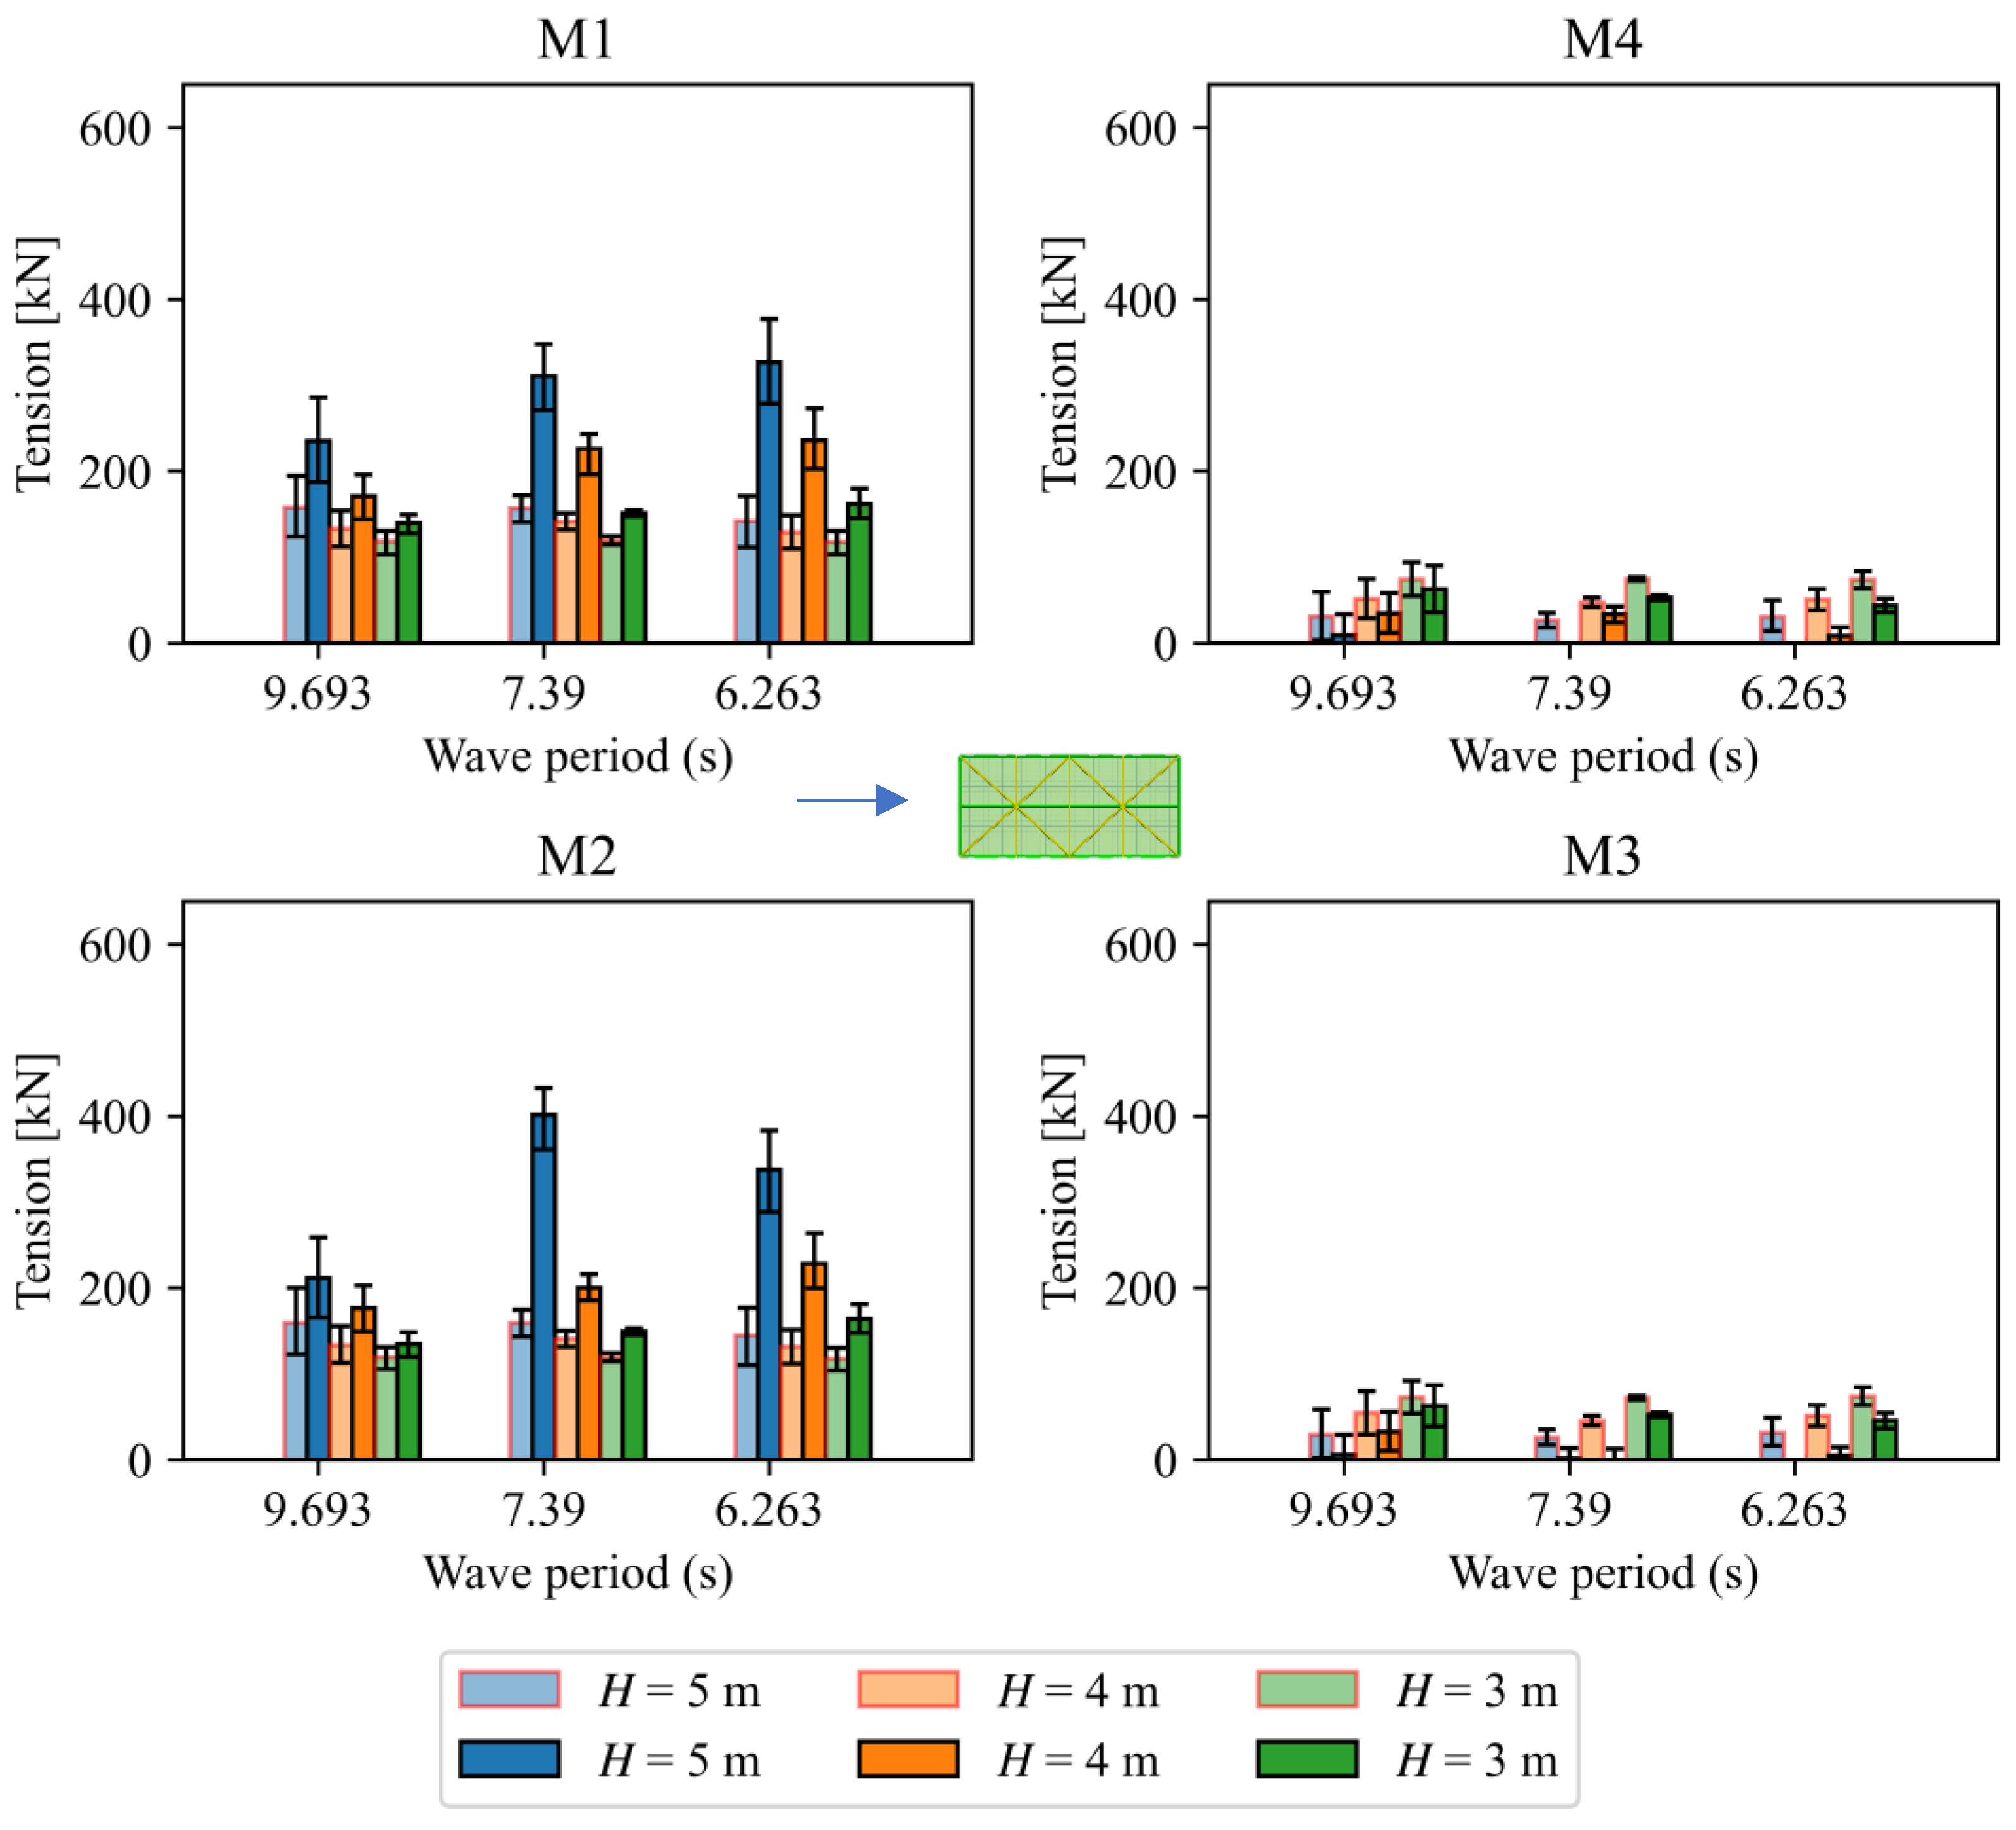
3.2.3. When the Wave Heading Direction Is 45°
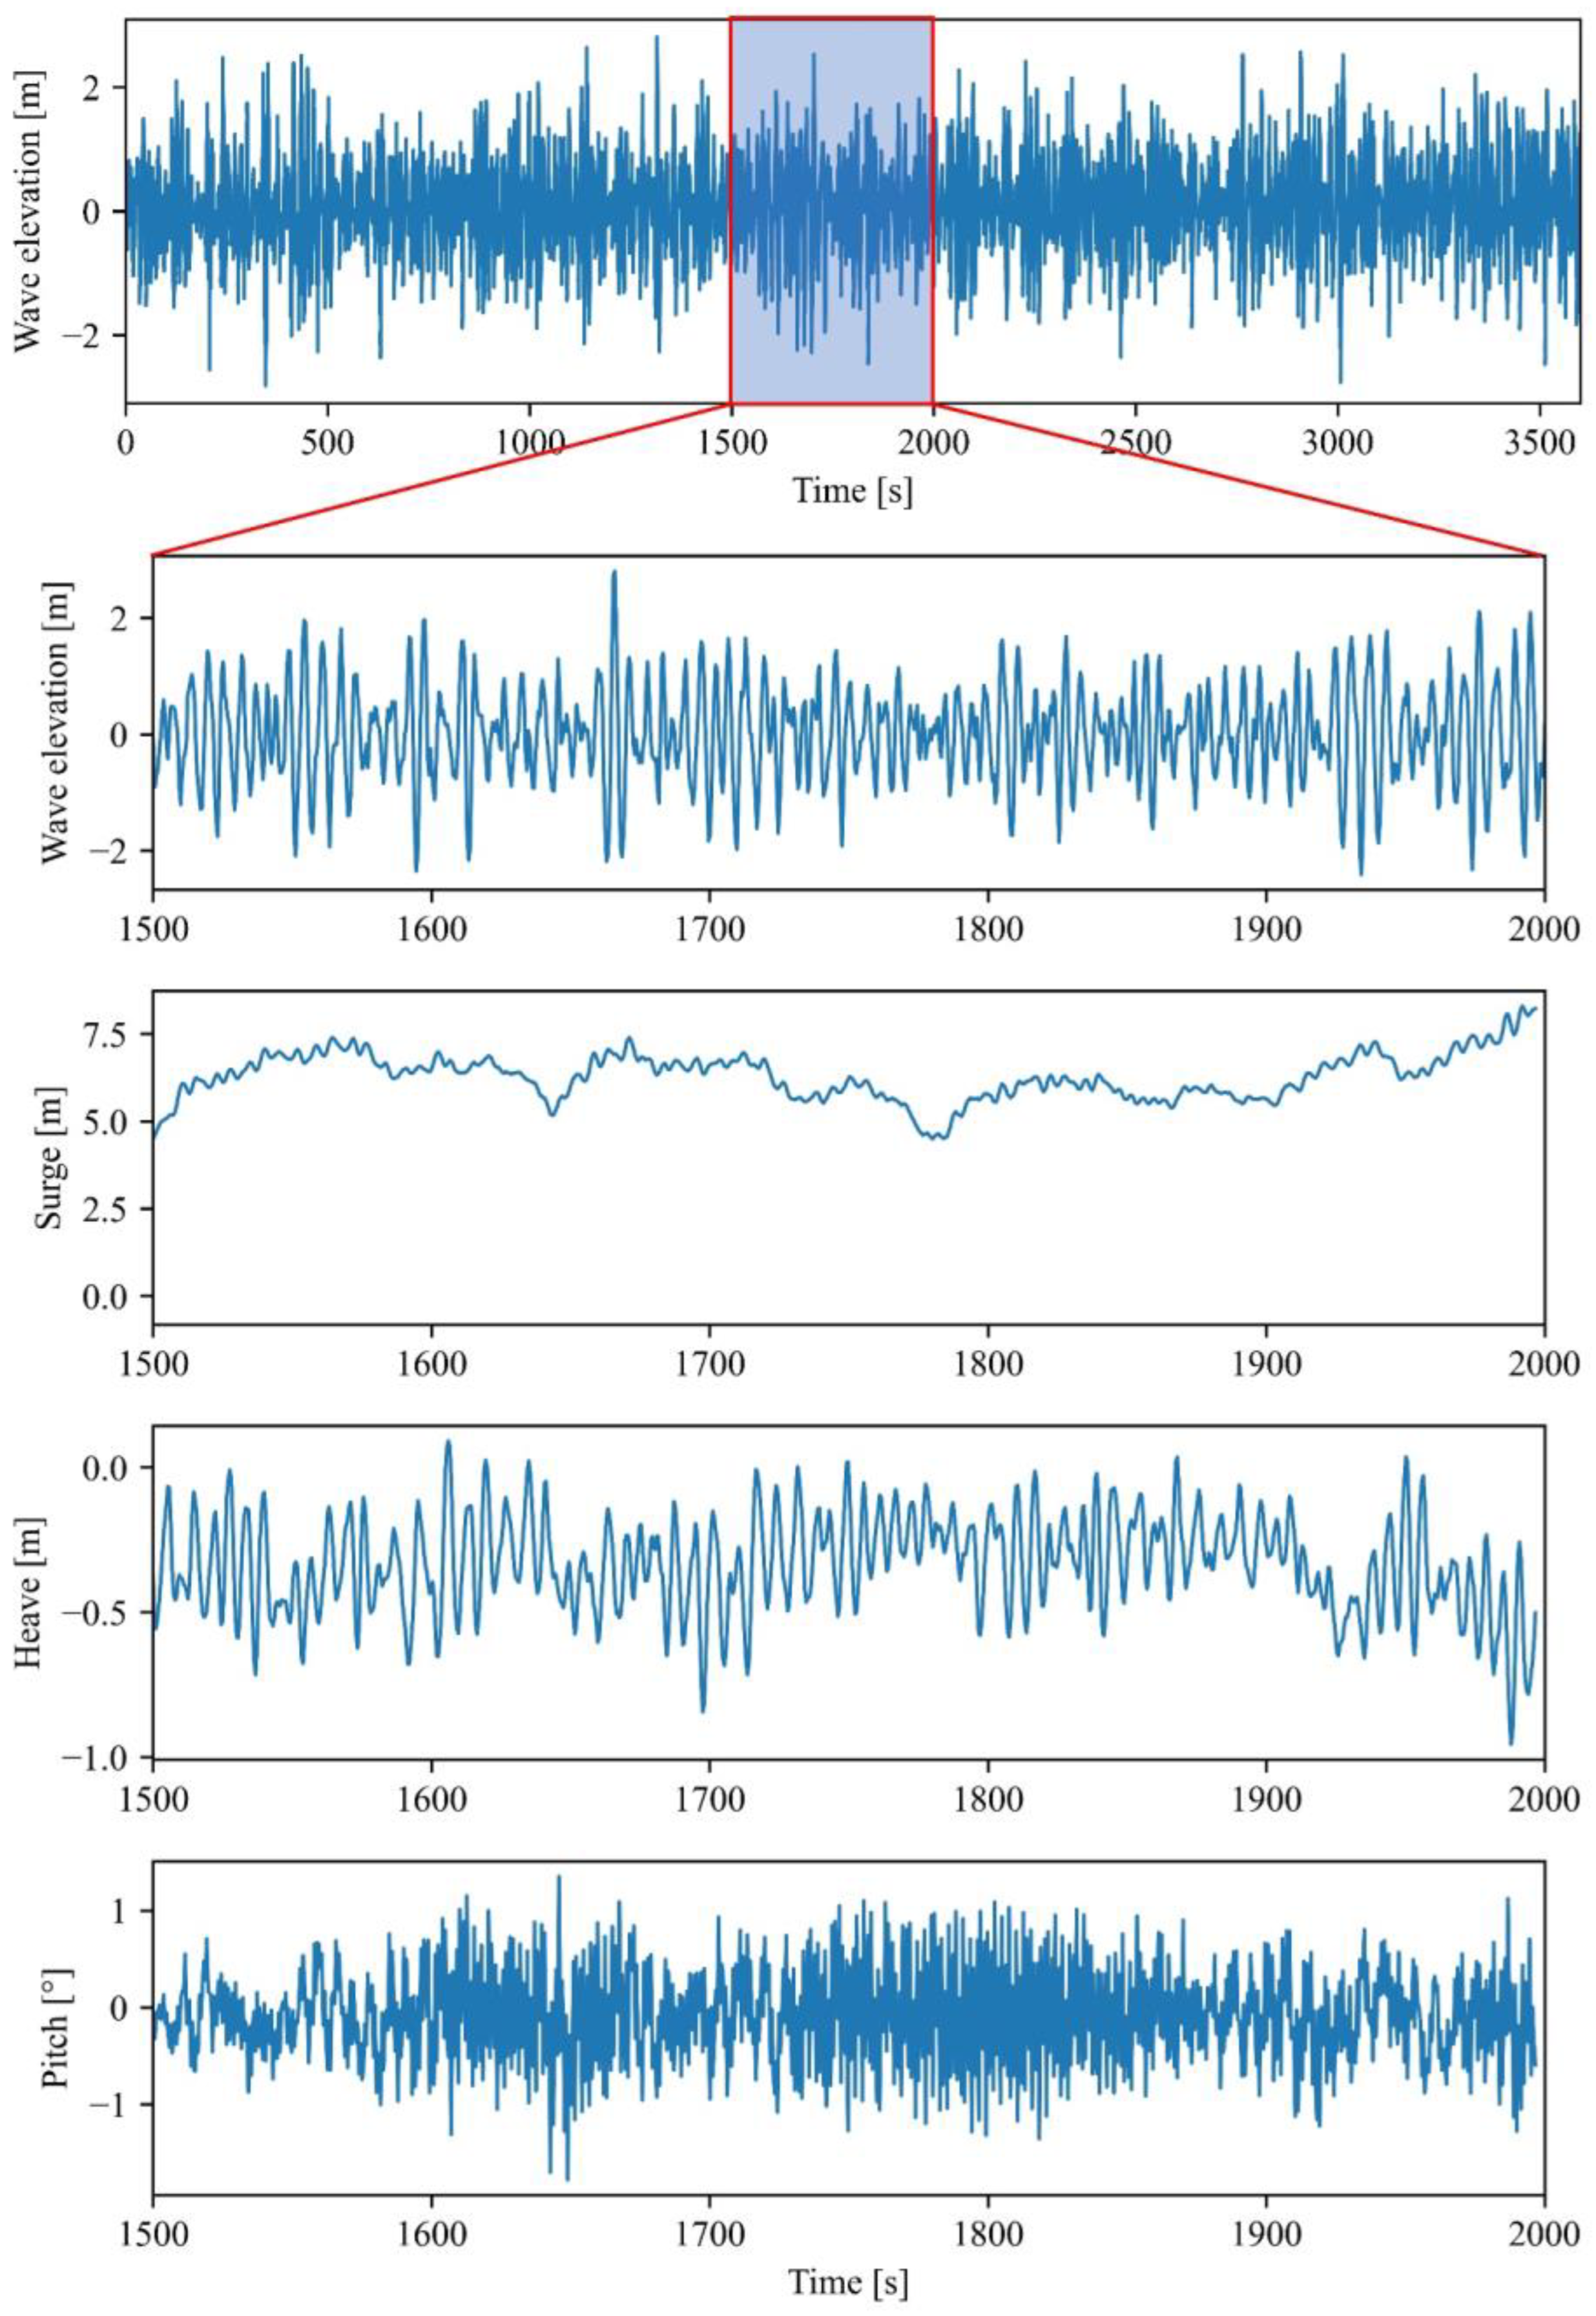
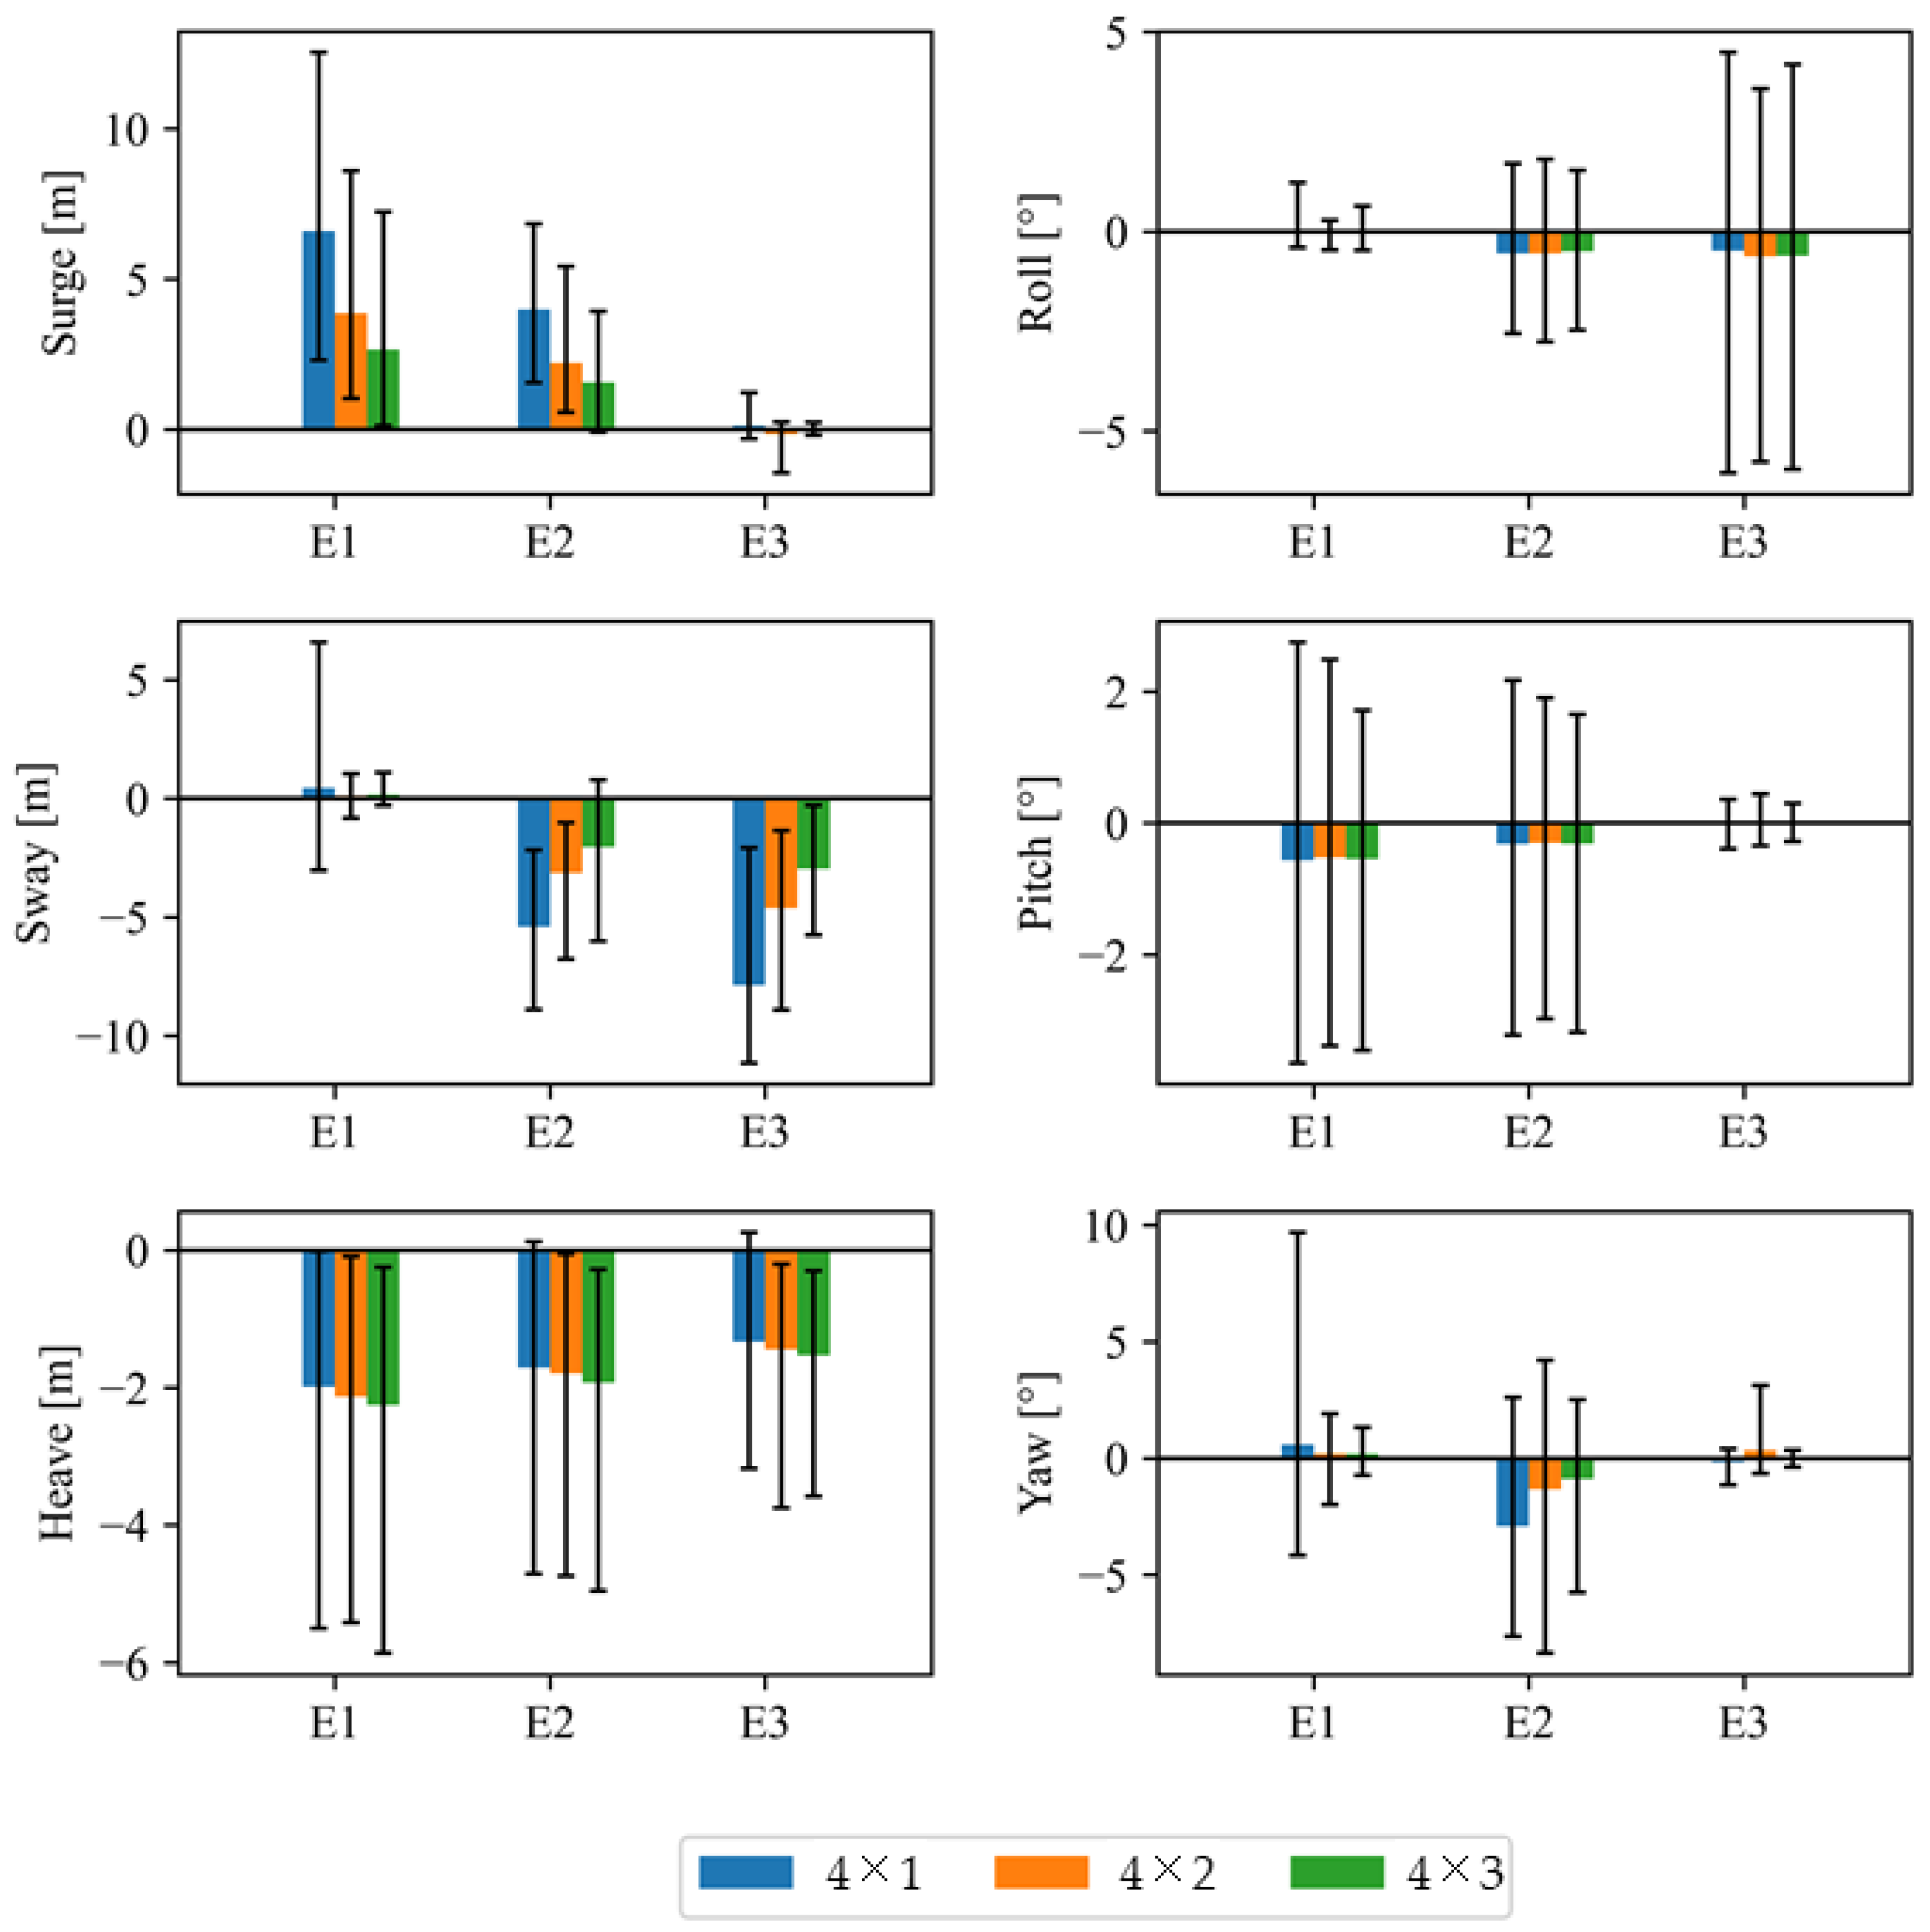
3.3. Structural Responses under Extreme Weather Conditions
3.3.1. Motion Responses
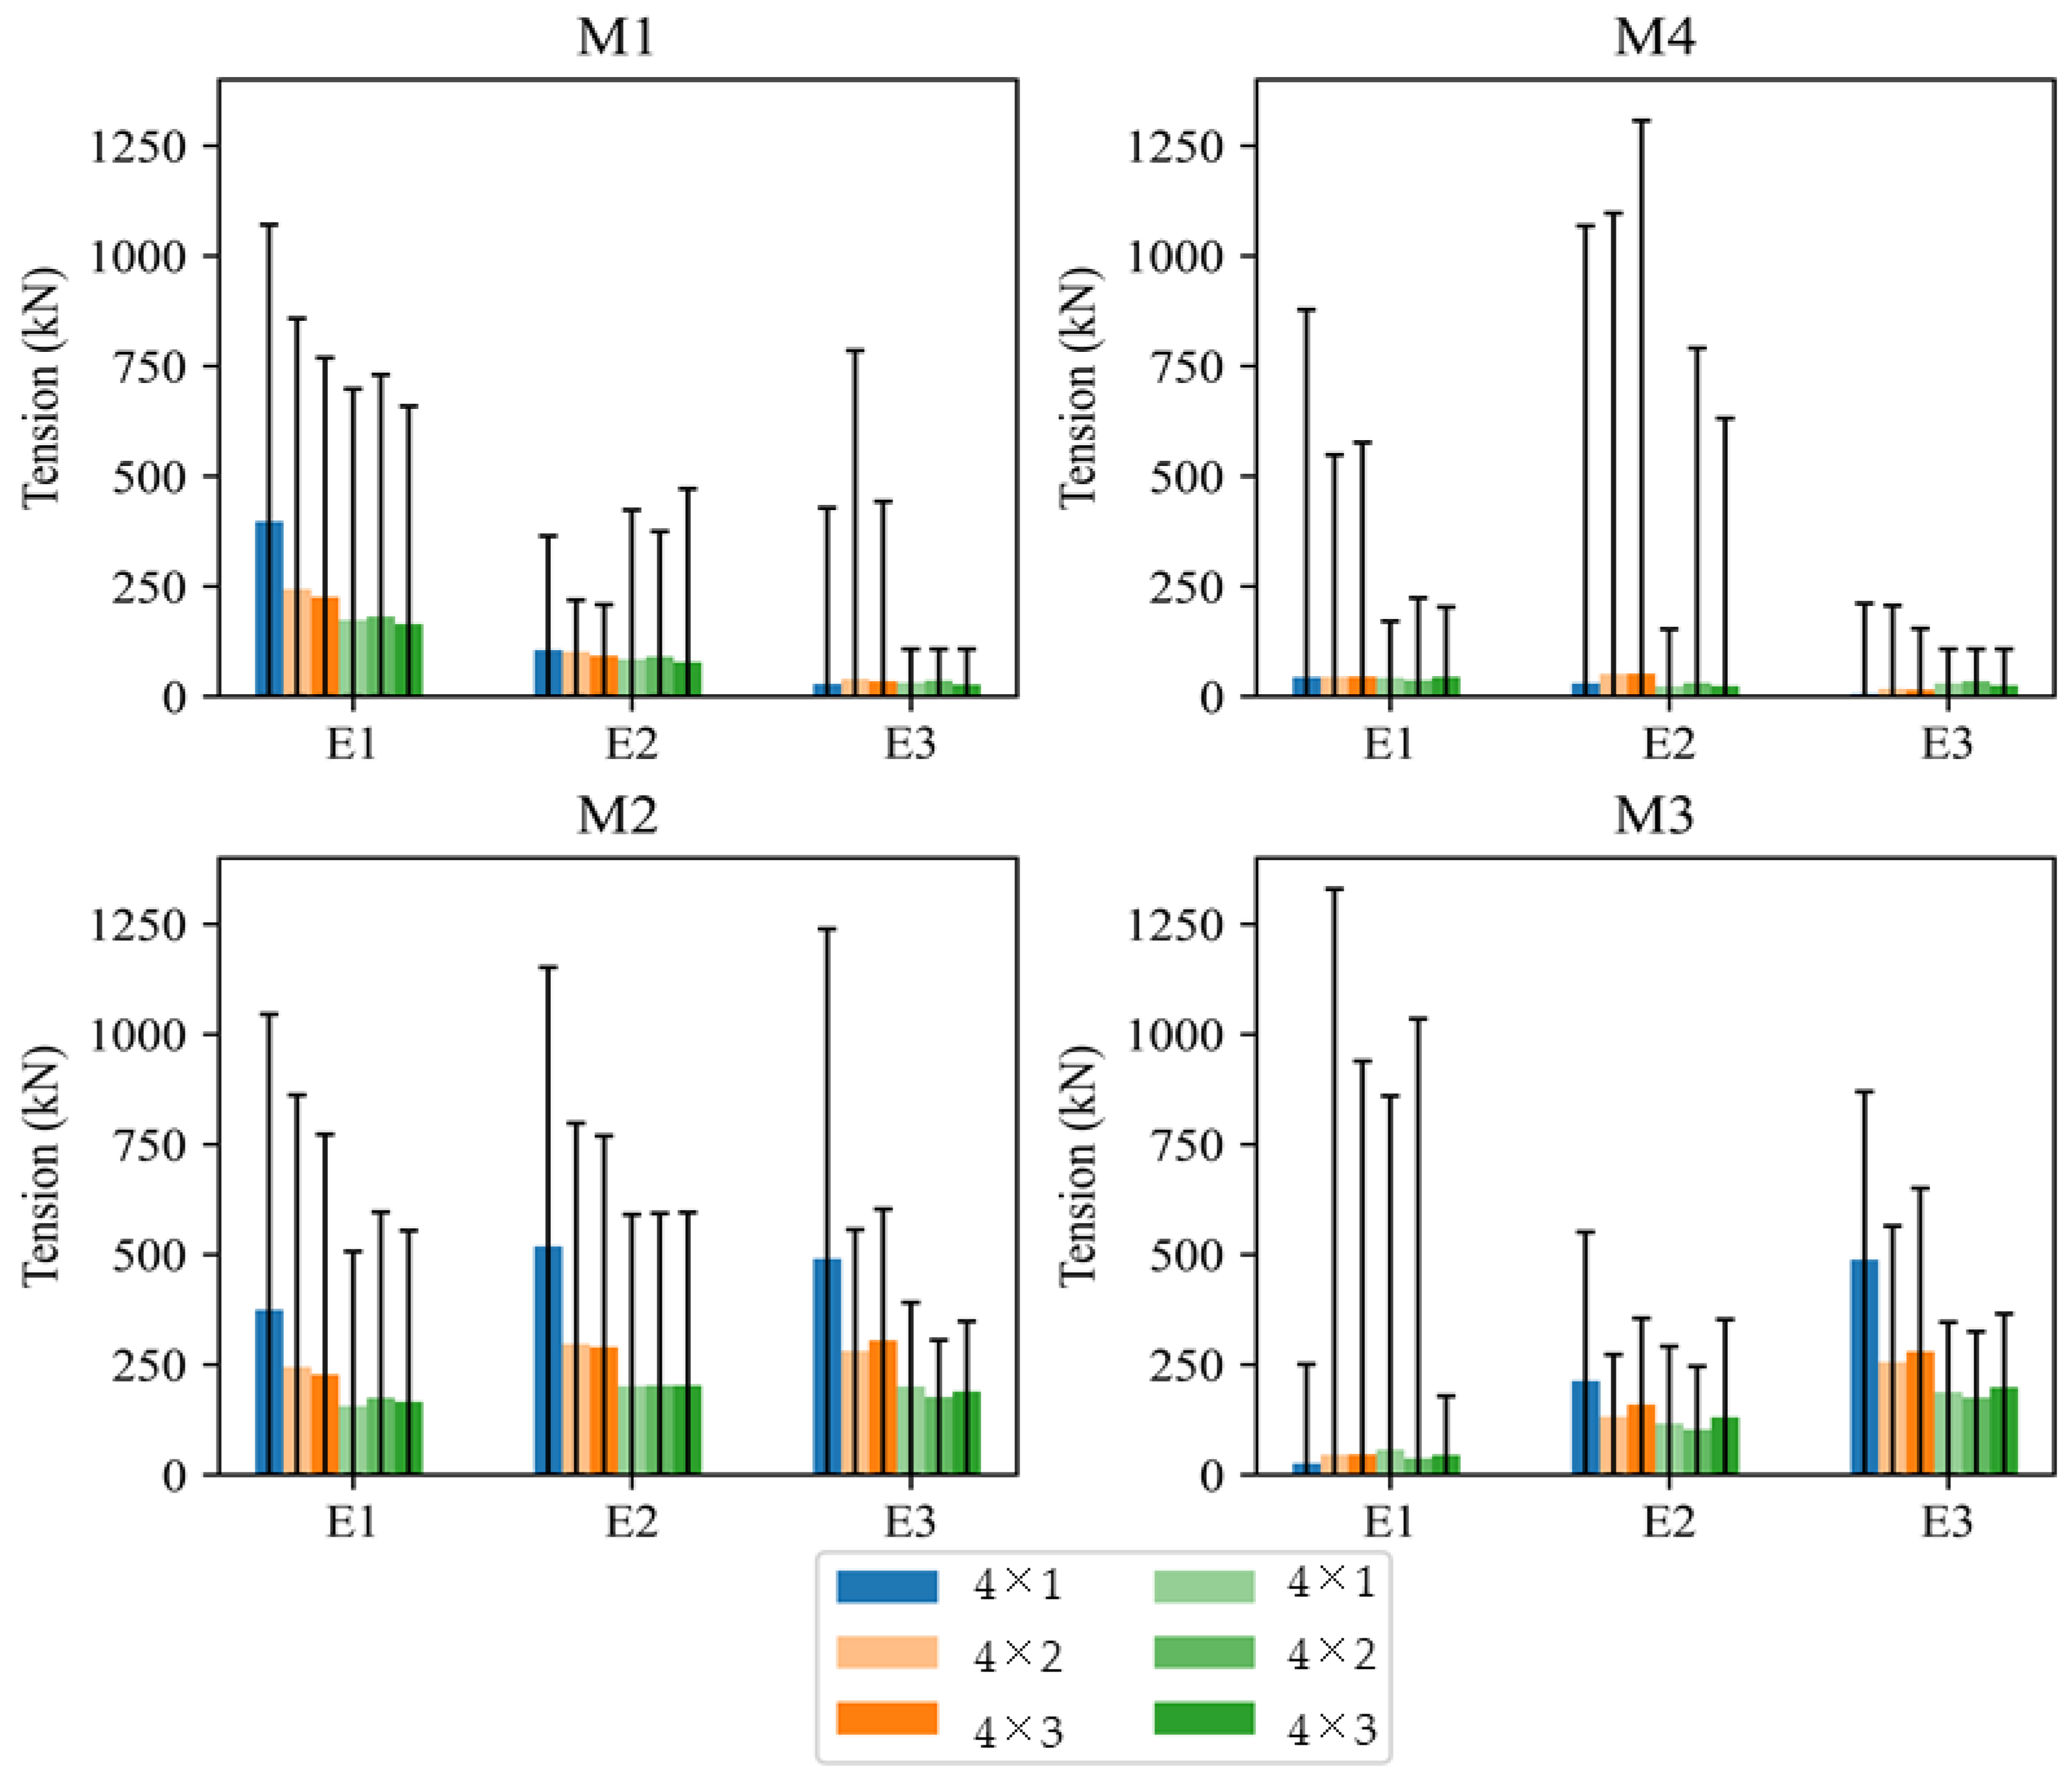
3.3.2. Tension Force in Mooring Lines
4. Conclusions
- (1)
- When nets are included in the analysis, the mean motion response will increase, but the dynamic ranges of response are reduced.
- (2)
- When the wave heading angle is 0°and 90°, the horizontal motion (sway and surge) of the main framework is positively correlated with the wave height and wave period.
- (3)
- The heave motion of the main frame is positively correlated with the wave height, but is insensitive to the wave period.
- (4)
- The rotational motion (roll, pitch, and yaw) of the main frame is not sensitive to the wave height but is sensitive to the wave period.
- (5)
- The presence of fishing nets significantly increases the average values of the horizontal and rotational motion of the main frame but decreases the average value of its heave motion.
- (6)
- Increasing the number of mooring lines can reduce the mean and extreme tension in individual mooring lines and suppress the horizontal motions, but bring neglectable effects on the rotational responses.
Author Contributions
Funding
Institutional Review Board Statement
Informed Consent Statement
Data Availability Statement
Conflicts of Interest
References
- Subasinghe, R.; Soto, D.; Jia, J. Global Aquaculture and Its Role in Sustainable Development. Rev. Aquac. 2009, 1, 2–9. [Google Scholar] [CrossRef]
- Boyd, C.E.; D’Abramo, L.R.; Glencross, B.D.; Huyben, D.C.; Juarez, L.M.; Lockwood, G.S.; McNevin, A.A.; Tacon, A.G.J.; Teletchea, F.; Tomasso, J.R.; et al. Achieving Sustainable Aquaculture: Historical and Current Perspectives and Future Needs and Challenges. J. World Aquac. Soc. 2020, 51, 578–633. [Google Scholar] [CrossRef]
- Morro, B.; Davidson, K.; Adams, T.P.; Falconer, L.; Holloway, M.; Dale, A.; Aleynik, D.; Thies, P.R.; Khalid, F.; Hardwick, J.; et al. Offshore Aquaculture of Finfish: Big Expectations at Sea. Rev. Aquac. 2021, 14, 791–815. [Google Scholar] [CrossRef]
- Chu, Y.I.; Wang, C.M.; Park, J.C.; Lader, P.F. Review of Cage and Containment Tank Designs for Offshore Fish Farming. Aquaculture 2020, 519, 734928. [Google Scholar] [CrossRef]
- Moe, H.; Fredheim, A.; Hopperstad, O.S. Structural Analysis of Aquaculture Net Cages in Current. J. Fluids Struct. 2010, 26, 503–516. [Google Scholar] [CrossRef]
- Zhao, Y.-P.; Guan, C.-T.; Bi, C.-W.; Liu, H.-F.; Cui, Y. Experimental Investigations on Hydrodynamic Responses of a Semi-Submersible Offshore Fish Farm in Waves. J. Mar. Sci. Eng. 2019, 7, 238. [Google Scholar] [CrossRef]
- Yu, S. Nonlinear Vertical Accelerations and Mooring Loads of a Semi-Submersible Offshore Fish Farm under Extreme Conditions. Aquac. Eng. 2021, 95, 102193. [Google Scholar] [CrossRef]
- Huang, X.-H. Hydrodynamic Performance of a Semi-Submersible Offshore Fish Farm with a Single Point Mooring System in Pure Waves and Current. Aquac. Eng. 2020, 90, 102075. [Google Scholar] [CrossRef]
- Cheng, H.; Ong, M.C.; Li, L. Dynamic Simulation of an Offshore Aquaculture Structure Subjected to Combined Wave and Current Conditions. J. Offshore Mech. Arct. Eng. 2023, 146, 011301. [Google Scholar] [CrossRef]
- Klebert, P.; Lader, P.; Gansel, L.; Oppedal, F. Hydrodynamic Interactions on Net Panel and Aquaculture Fish Cages: A Review. Ocean Eng. 2013, 58, 260–274. [Google Scholar] [CrossRef]
- Ruzzo, C.; Muggiasca, S.; Malara, G.; Taruffi, F.; Belloli, M.; Collu, M.; Li, L.; Brizzi, G.; Arena, F. Scaling Strategies for Multi-Purpose Floating Structures Physical Modeling: State of Art and New Perspectives. Appl. Ocean Res. 2021, 108, 102487. [Google Scholar] [CrossRef]
- Li, L.; Jiang, Z.; Høiland, A.V.; Ong, M.C. Numerical Analysis of a Vessel-Shaped Offshore Fish Farm. J. Offshore Mech. Arct. Eng. 2018, 140, 041201. [Google Scholar] [CrossRef]
- Li, L.; Ong, M.C. A Preliminary Study of a Rigid Semi-Submersible Fish Farm for Open Seas; American Society of Mechanical Engineers Digital Collection: Trondheim, Norway, 2017. [Google Scholar]
- Tsukrov, I.; Eroshkin, O.; Fredriksson, D.; Swift, M.R.; Celikkol, B. Finite Element Modeling of Net Panels Using a Consistent Net Element. Ocean Eng. 2003, 30, 251–270. [Google Scholar] [CrossRef]
- Zhao, Y.-P.; Li, Y.-C.; Dong, G.-H.; Gui, F.-K.; Teng, B. A Numerical Study on Dynamic Properties of the Gravity Cage in Combined Wave-Current Flow. Ocean Eng. 2007, 34, 2350–2363. [Google Scholar] [CrossRef]
- Zhao, Y.-P.; Wang, X.-X.; Decew, J.; Tsukrov, I.; Bai, X.-D.; Bi, C.-W. Comparative Study of Two Approaches to Model the Offshore Fish Cages. China Ocean Eng. 2015, 29, 459–472. [Google Scholar] [CrossRef]
- Reite, K.-J.; Føre, M.; Aarsæther, K.G.; Jensen, J.; Rundtop, P.; Kyllingstad, L.T.; Endresen, P.C.; Kristiansen, D.; Johansen, V.; Fredheim, A. FHSIM—Time Domain Simulation of Marine Systems; American Society of Mechanical Engineers Digital Collection: San Francisco, CA, USA, 2014. [Google Scholar]
- Su, B.; Kelasidi, E.; Frank, K.; Haugen, J.; Føre, M.; Pedersen, M.O. An Integrated Approach for Monitoring Structural Deformation of Aquaculture Net Cages. Ocean Eng. 2021, 219, 108424. [Google Scholar] [CrossRef]
- Su, B.; Reite, K.-J.; Føre, M.; Aarsæther, K.G.; Alver, M.O.; Endresen, P.C.; Kristiansen, D.; Haugen, J.; Caharija, W.; Tsarau, A. A Multipurpose Framework for Modelling and Simulation of Marine Aquaculture Systems; American Society of Mechanical Engineers Digital Collection: Glasgow, Scotland, UK, 2019. [Google Scholar]
- Cheng, H. Development of Advanced Numerical Tools for Dynamic Analysis of Aquaculture Structures. Ph.D. Thesis, University of Stavanger, Stavanger, Norway, 2022. [Google Scholar]
- Cheng, H.; Li, L.; Aarsæther, K.G.; Ong, M.C. Typical Hydrodynamic Models for Aquaculture Nets: A Comparative Study under Pure Current Conditions. Aquac. Eng. 2020, 90, 102070. [Google Scholar] [CrossRef]
- Antonutti, R.; Peyrard, C.; Incecik, A.; Ingram, D.; Johanning, L. Dynamic Mooring Simulation with Code_Aster with Application to a Floating Wind Turbine. Ocean Eng. 2018, 151, 366–377. [Google Scholar] [CrossRef]
- Fan, Z.-Q.; Liang, Y.-H.; Zhao, Y.-P. Review of the Research on the Hydrodynamics of Fishing Cage Nets. Ocean Eng. 2023, 276, 114192. [Google Scholar] [CrossRef]
- Kristiansen, T.; Faltinsen, O.M. Modelling of Current Loads on Aquaculture Net Cages. J. Fluids Struct. 2012, 34, 218–235. [Google Scholar] [CrossRef]
- Mjåtveit, M.A.; Cheng, H.; Ong, M.C.; Lee, J. Comparative Study of Two Typical Gravity-Based Fish Cages with Different Dimensions under Pure Current Conditions. Aquac. Eng. 2021, 96, 102223. [Google Scholar] [CrossRef]
- Shimizu, H.; Mizukami, Y.; Kitazawa, D. Experimental Study of the Drag on Fine-Mesh Netting. Aquac. Eng. 2018, 81, 101–106. [Google Scholar] [CrossRef]
- DeCew, J.; Tsukrov, I.; Risso, A.; Swift, M.R.; Celikkol, B. Modeling of Dynamic Behavior of a Single-Point Moored Submersible Fish Cage under Currents. Aquac. Eng. 2010, 43, 38–45. [Google Scholar] [CrossRef]
- DNV GL. DNVGL-RP-C205 Environmental Conditions and Environmental Loads; DNV GL: Høvik, Norway, 2010. [Google Scholar]


| No. | Component | Length (m) | Diameter (mm) | Thickness (mm) |
|---|---|---|---|---|
| 1 | Bottom horizontal column | 56.00 | 3000 | 12 |
| 2 | Top horizontal column | 56.00 | 2000 | 12 |
| 3 | Bottom longitudinal column | 120.00 | 3000 | 12 |
| 4 | Top longitudinal column | 120.00 | 2000 | 12 |
| 5 | Vertical column | 12.50 | 2000 | 12 |
| 6 | Top horizontal beam | 28.00 | 1000 | 10 |
| 7 | Top diagonal beam | 41.00 | 1000 | 10 |
| 8 | Side diagonal beam 1 | 30.67 | 1000 | 10 |
| 9 | Side diagonal beam 2 | 32.50 | 1000 | 10 |
| 10 | Center column | 14.50 | 5000 | 12 |
| Property | Unit | |
|---|---|---|
| Length | 300 | m |
| Nominal diameter | 100 | mm |
| Weight in the air | 219 | kg/m |
| Elasticity EA | 62,000 | kN |
| Breaking strength | 7061 | kN |
| NO. | Wave Height [m] | Wave Period [s] | Wave Direction [°] |
|---|---|---|---|
| N1 | 5.00 | 9.693 | 0.00 |
| N2 | 4.00 | 9.693 | 0.00 |
| N3 | 3.00 | 9.693 | 0.00 |
| N4 | 5.00 | 7.390 | 0.00 |
| N5 | 4.00 | 7.390 | 0.00 |
| N6 | 3.00 | 7.390 | 0.00 |
| N7 | 5.00 | 6.263 | 0.00 |
| N8 | 4.00 | 6.263 | 0.00 |
| N9 | 3.00 | 6.263 | 0.00 |
| N10 | 5.00 | 9.693 | 45.00 |
| N11 | 4.00 | 9.693 | 45.00 |
| N12 | 3.00 | 9.693 | 45.00 |
| N13 | 5.00 | 7.390 | 45.00 |
| N14 | 4.00 | 7.390 | 45.00 |
| N15 | 3.00 | 7.390 | 45.00 |
| N16 | 5.00 | 6.263 | 45.00 |
| N17 | 4.00 | 6.263 | 45.00 |
| N18 | 3.00 | 6.263 | 45.00 |
| N19 | 5.00 | 9.693 | 90.00 |
| N20 | 4.00 | 9.693 | 90.00 |
| N21 | 3.00 | 9.693 | 90.00 |
| N22 | 5.00 | 7.390 | 90.00 |
| N23 | 4.00 | 7.390 | 90.00 |
| N24 | 3.00 | 7.390 | 90.00 |
| N25 | 5.00 | 6.263 | 90.00 |
| N26 | 4.00 | 6.263 | 90.00 |
| N27 | 3.00 | 6.263 | 90.00 |
| E1 | Uc = 0.46 m/s, Hs = 7.64 m, Tp = 12.13 s, θw = 0° |
| E2 | Uc = 0.46 m/s, Hs = 6.36 m, Tp = 11.06 s, θw = 45° |
| E3 | Uc = 0.46 m/s, Hs = 4.57 m, Tp = 8.10 s, θw = 90° |
Disclaimer/Publisher’s Note: The statements, opinions and data contained in all publications are solely those of the individual author(s) and contributor(s) and not of MDPI and/or the editor(s). MDPI and/or the editor(s) disclaim responsibility for any injury to people or property resulting from any ideas, methods, instructions or products referred to in the content. |
© 2024 by the authors. Licensee MDPI, Basel, Switzerland. This article is an open access article distributed under the terms and conditions of the Creative Commons Attribution (CC BY) license (https://creativecommons.org/licenses/by/4.0/).
Share and Cite
Chen, M.; Huang, L.; Cheng, H.; Wu, Q. Numerical Investigation on Mooring Line Configurations of a Semisubmersible Fish Farm for Global Performance. J. Mar. Sci. Eng. 2024, 12, 880. https://doi.org/10.3390/jmse12060880
Chen M, Huang L, Cheng H, Wu Q. Numerical Investigation on Mooring Line Configurations of a Semisubmersible Fish Farm for Global Performance. Journal of Marine Science and Engineering. 2024; 12(6):880. https://doi.org/10.3390/jmse12060880
Chicago/Turabian StyleChen, Mingjia, Liuyi Huang, Hui Cheng, and Qianli Wu. 2024. "Numerical Investigation on Mooring Line Configurations of a Semisubmersible Fish Farm for Global Performance" Journal of Marine Science and Engineering 12, no. 6: 880. https://doi.org/10.3390/jmse12060880