Article

Mussel Culture Activities Facilitate the Export and Burial of Particulate Organic Carbon

1
Key Laboratory of Marine Ecosystem Dynamics, Second Institute of Oceanography, Ministry of Natural Resources, Hangzhou 310012, China
2
Southern Marine Science and Engineering Guangdong Laboratory (Zhuhai), Zhuhai 519099, China
3
Observation and Research Station of Yangtze River Delta Marine Ecosystems, Ministry of Natural Resources, Zhoushan 316021, China
4
Key Laboratory of Ocean Space Resource Management Technology, Ministry of Natural Resources, Marine Academy of Zhejiang Province, Hangzhou 310012, China
5
Fishery College, Zhejiang Ocean University, Zhoushan 316022, China
*
Authors to whom correspondence should be addressed.
J. Mar. Sci. Eng. 2024, 12(6), 910; https://doi.org/10.3390/jmse12060910
Submission received: 8 May 2024 / Revised: 22 May 2024 / Accepted: 27 May 2024 / Published: 29 May 2024

Abstract

:
The recent expansion of shellfish mariculture could significantly impact the ocean carbon cycle and its associated biogeochemical processes. To understand the source and fate of particulate organic carbon (POC), a summer cruise was conducted from September 8 to 10, 2022, at a mussel farm on Gouqi Island and its adjacent areas located in the East China Sea. Parameters included in situ temperature and salinity, contents of dissolved oxygen (DO), suspended particulate matter (SPM), POC, and chlorophyll a (Chl a), as well as the stable carbon isotopic composition (δ13C) of organic matter in particle and sediment samples, which were analyzed to facilitate a comparative assessment of the areas inside and outside the mussel farm. The POM was much fresher (POC/Chl a < 150) inside the farm with little impact from sediment resuspension (lower SPM content, 11.6 ± 6.6 mg/L), while a significant influence of sediment resuspension was found outside the farm (SPM > 20 mg/L, POC/Chl a > 150). A two end-member mixing model showed that 82.0 ± 6.0% of POC originated from marine algae within the farm, much higher than that outside the farming area (66.1 ± 7.8%). Moreover, elevated DO saturation but relatively low Chl a concentration within the farm suggested continuous algae consumption following potential high productivity. The averaged δ13C values were similar among suspended POC, sinking POC, and sedimentary organic carbon within the farm, implying the fast export and burial of POC. This is likely due to the filter-feeding habits of mussels, who ingest fresh POC and then pack it as fecal pellets that rapidly settle into the sediment. This study sheds light on the distribution and sources of POM inside and outside the mussel farm on Gouqi Island, enhancing our understanding of the marine carbon cycle on shellfish farms and providing insights into the underlying biogeochemical processes.

1. Introduction

Mariculture products, such as shellfish and fish, are rich in high-quality proteins and satisfy societal dietary needs beyond their traditional market value. Moreover, they act as a climate-friendly product as they generate less greenhouse gas emissions (e.g., carbon dioxide and methane) compared to livestock farming on land [1,2]. Among mariculture products, bivalve filter feeders, requiring no additional feed, account for the largest area farmed and the highest production, having expanded continuously since the 1990s [3,4].
While meeting the growing food demands of the population, bivalves may influence the carbon cycling of farming areas through physiological activities like filtration and excretion [5,6,7]. As filter feeders, shellfish can rapidly filter and consume particulate organic matter (POM) in the water column to facilitate the growth of soft tissues [8,9]. After digestion and assimilation, the remaining organic matter is integrated and excreted in large fecal pellets with rapid sedimentation [10,11,12]. For instance, the sediment trap results for the oyster farms of Shizugawa Bay showed that the sinking particle fluxes within the aquaculture area could be between 2 and 18 times that outside the aquaculture area [13]. Similarly, in the Rías Baixas of Spain, the sinking particle flux within mussel aquaculture areas was four times that of the reference station [14]. Under this rapid export mechanism, in bivalve aquaculture areas such as Sanggou Bay in China, the 13C of the sediment organic carbon was found to be heavier than that outside the aquaculture area [15,16]. These biogeochemical processes suggest that shellfish mariculture may have a significant impact on carbon cycling and carbon sinks. However, the biogeochemical processes associated with offshore shellfish mariculture and their potential effect on POM are not fully understood, and there exists a knowledge gap regarding the connections between particulate organic carbon (POC), sinking particulate organic carbon, and sedimentary organic carbon within aquaculture areas. Therefore, identifying the sources of POM and elucidating the associated biogeochemical processes on shellfish farms located in typical estuaries are crucial for a comprehensive understanding of the carbon cycle and carbon sinks in these areas.
Shallow marine environments, including estuaries, bays, and adjacent continental shelves, provide optimal conditions for shellfish mariculture where the dynamics of POM are complex. Substantial terrestrial nutrients (e.g., nitrogen, phosphorus, and silica) from rivers foster the proliferation of phytoplankton, such as diatoms and dinoflagellates, which are important food sources for shellfish [17,18,19]. Moreover, a variety of terrestrial POM (e.g., higher plant debris, soil, and organic matter from human activities) can also be delivered to mariculture farms via ocean currents, tides, and resuspension processes, potentially contributing as an additional food source for shellfish [20,21,22]. Carbon and nitrogen are primary components of POM [23]. Distinctive δ13C and δ15N signatures help trace the origins and pathways of POM in marine environments [24]. Analyzing δ13C and δ15N in the POM from shellfish farms offers insight into the sources of POM and associated biogeochemical cycles in these environments.
Gouqi Island, located in the northeastern part of the islands in Zhoushan City, Zhejiang Province, China, is a typical region for shellfish mariculture. This island is at the heart of the Zhoushan Fishery, boasting a mussel farming area exceeding 12 km2 and annual production of over 180,000 tons [25]. The dominant species, Mytilus coruscus, is cultivated using raft culture techniques that do not require additional feed. The marine areas near Gouqi Island are influenced by tides and diluted water from the Changjiang River, accompanied by relatively high contents of particulate matter and nutrients, as well as high primary productivity [26,27,28]. Furthermore, the interaction between local topography and dynamic hydrology processes generates an upwelling near the estuary of the Changjiang River [29,30]. The core area of the upwelling is located in the northeastern region of the islands in Shengsi County, overlapping with the location of Gouqi Island from June to October [31,32,33,34]. This upwelling process forces high-concentration nutrients, particularly phosphate, from deeper waters into the euphotic zone, promoting the growth of phytoplankton [35,36,37] and supporting the thriving mussel farming industry of Gouqi Island. This area is also influenced by a substantial influx of terrestrial POM and nutrients from the Changjiang River [38,39]. Additionally, the island benefits from riverine inputs and coastal upwelling that enriches the surrounding sea areas with nutrients essential for phytoplankton growth [39,40]. Therefore, the mussel farm located near Gouqi Island and its surrounding sea areas provides an ideal natural laboratory for studying the influence of Mussel culture activities on the marine carbon cycle.
Mussel filtration can promote the turnover rate of phytoplankton [41], which may lead to a greater source of marine organic matter within the aquaculture area. In addition, under the influence of mussel filtration and excretion, marine organic matter may be rapidly exported to the seabed. To further understand the cycling of organic carbon within the kelp mussel aquaculture area of Gouqi Island, the primary objectives of this study were to (1) assess the distribution and sources of POC inside and outside mussel culture areas, (2) investigate the connection between SPM, sinking particulate matter, and sediment under the influence of mussel filter feeding, and (3) explore the potential biogeochemical processes that exist in the aquaculture area to improve our understanding of the organic carbon cycle in shellfish aquaculture areas.

2. Materials and Methods

2.1. Sampling

From September 8 to 10, 2022, a sampling expedition was conducted at a mussel farm located near Gouqi Island and its adjacent areas in the East China Sea. Samples were collected from a total of 20 stations—7 located within the farm and 13 in the adjacent areas (Figure 1). In situ seawater temperature and salinity were measured using a 48M multi-parameter probe (Sea & Sun, Trappenkamp, Germany). Water samples were collected using a 5 L water sampler (Hydro-Bios, Altenholz, Germany) equipped with the data acquisition software OceanLab 3 (Version 3.5.7.0) from three depths (0.5 m and 10 m below the sea surface and 2 m above the seabed) at each station. In a land-based laboratory, these samples were then analyzed for dissolved oxygen (DO), chlorophyll a (Chl a), suspended particulate matter (SPM), the stable isotopic compositions of particulate organic carbon (δ13CPOC), and particulate nitrogen (δ15NPN) of SPM. Surface sediment samples were retrieved using a Van Veen metal grab and immediately stored after sampling at −20 °C for subsequent analysis. A total of 12 time-series sinking particle samples from 4 October 2022 to 20 December 2022 were collected at 2 m above the seabed using a bottom-anchored sediment trap (MST 12 multi-sediment trap, Hydro-Bios, Germany). Before deployment, 11 sampling bottles with a capacity of 250 mL were filled with a seawater-based solution of sodium chloride (NaCl, 35 g/L) and mercury chloride (HgCl2, 3.3 g/L) to reduce diffusion and inhibit microbial growth [42,43].

2.2. Methodology

DO samples were stabilized on site and immediately transported to the land-based laboratory for analysis using the Winkler titration method [44]. Other collected water samples were immediately filtered through 0.7 μm GF/F glass fiber membranes (pre-combusted at 450 °C for 4 h, Whatman, Chicago, IL, USA). To determine the SPM concentration, 1–1.5 L of seawater was filtered. For POC, δ13CPOC, and δ15NPN measurements, 0.20–0.5 L of seawater was filtered for each, while 100 mL was filtered to determine Chl a concentration. The membranes were then stored at −20 °C in the dark for subsequent analyses. Surface sediment samples were freeze-dried, passed through a 1 mm sieve, and then ground for subsequent treatment. Trap samples were passed through a 1 mm pore-size sieve and divided into four aliquots, all samples were freeze-dried and weighed to obtain total mass flux, and one of the aliquots was ground for further measurements.
SPM concentration was calculated by dividing the difference in weight of the dried membrane before and after filtration by the volume of filtered seawater. For the pretreatment of POC and δ13CPOC analysis, the filter samples were dried and placed in a desiccator containing concentrated hydrochloric acid for 48 h to remove inorganic carbon. The membranes were carefully rinsed three times with deionized water to remove the extra acid, dried, and wrapped in tin capsules. For δ15NPN analysis, the dried membranes were directly wrapped in tin capsules without acid fumigation. The sediment and sinking particle samples were weighed, dried, ground, and placed in pre-combusted silver capsules. These capsules were then placed in a desiccator containing concentrated hydrochloric acid for 72 h (60 °C) to remove inorganic carbon, followed by 72 h neutralization with NaOH at 60 °C. Afterward, the samples were dried and wrapped in tin capsules for the determination of POC content and δ13CPOC value. POC content was measured using a Vario EL cube elemental analyzer (Elementar, Langenselbold, Germany) and calculated according to a calibration curve established using acetanilide as a standard. The relative standard deviation of acetanilide analysis was less than 0.3%. The prepared samples for δ13CPOC and δ15NPN measurement were analyzed at Guangdong Ocean University using a 253 Plus stable isotope mass spectrometer (Thermo Scientific, Waltham, MA, USA), with isotope calibration curves established using international reference materials USG61, USG62, and USG63 (United States Geological Survey, Liston, VA, USA) for quality control. The relative standard deviations of δ13CPOC and δ15NPN were less than 0.3‰. Chl a samples were extracted with a 90% acetone solution for 24 h at 4 °C in the dark and then measured using a fluorometer (Turner Design, San Jose, CA, USA) according to Welschmeyer’s (1994) protocol [45].

2.3. Two End-Member Mixing Model

In this study, the organic matter in all samples was assumed to be a mixture of terrestrial and marine organic matter and a two end-member mixing model was employed for quantitative analysis:
ft + fm = 1
ft × δ13Ct + fm × δ13Cm = δ13Cs
where ft and fm denote the fractions of terrestrial and marine organic matter, respectively. δ13Ct and δ13Cm represent the δ13C values of terrestrial and marine organic matter end-members, respectively, while δ13Cs refers to the δ13CPOC of suspended particulate matter. The ranges of δ13CPOC and δ15NPN values within Changjiang River Estuary are quite extensive. The carbon and nitrogen isotope compositions of terrestrial organic matter are −30‰ to −28‰ and 0.0‰ to 2.5‰, respectively, while the carbon and nitrogen isotope compositions of marine organic matter are −22‰ to −19‰ and 5.5‰ to 7.5‰, respectively [24,46,47]. Referring to previous studies, the compositions of the end-members are assumed to have a δ13Cm value of −20.5‰ and a δ13Ct value of −28.5‰, respectively [48,49].

3. Results

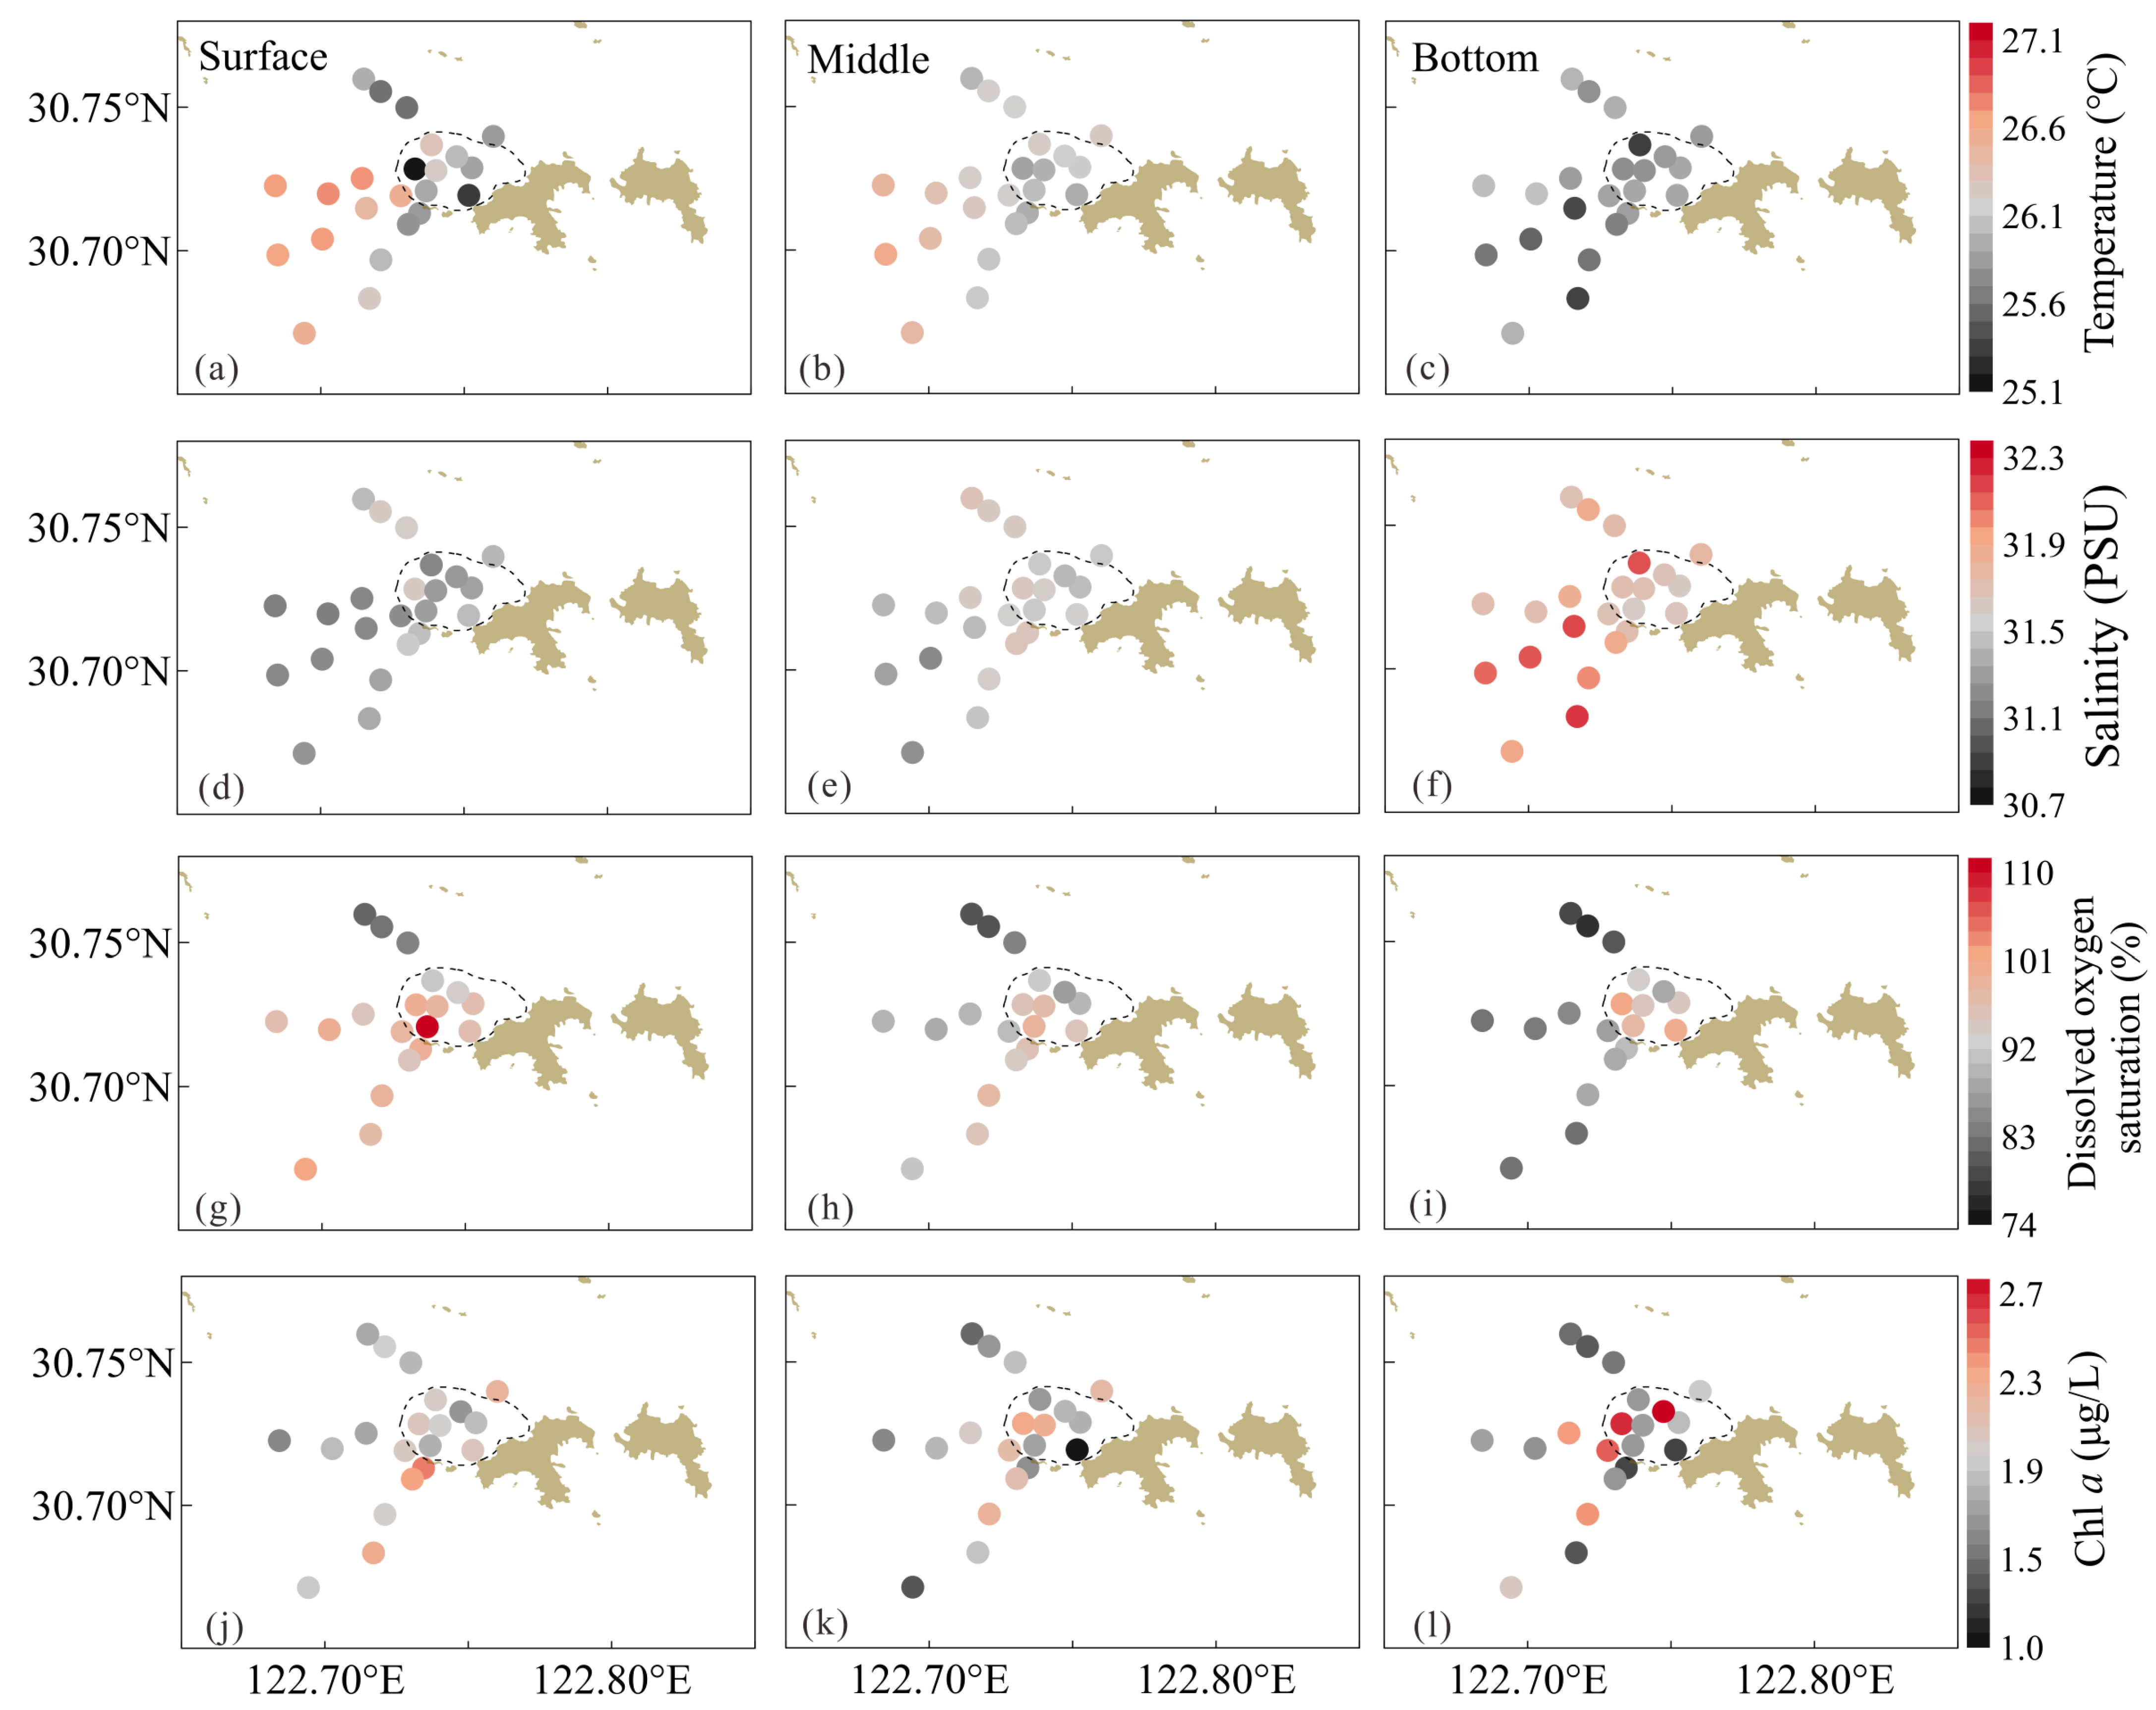
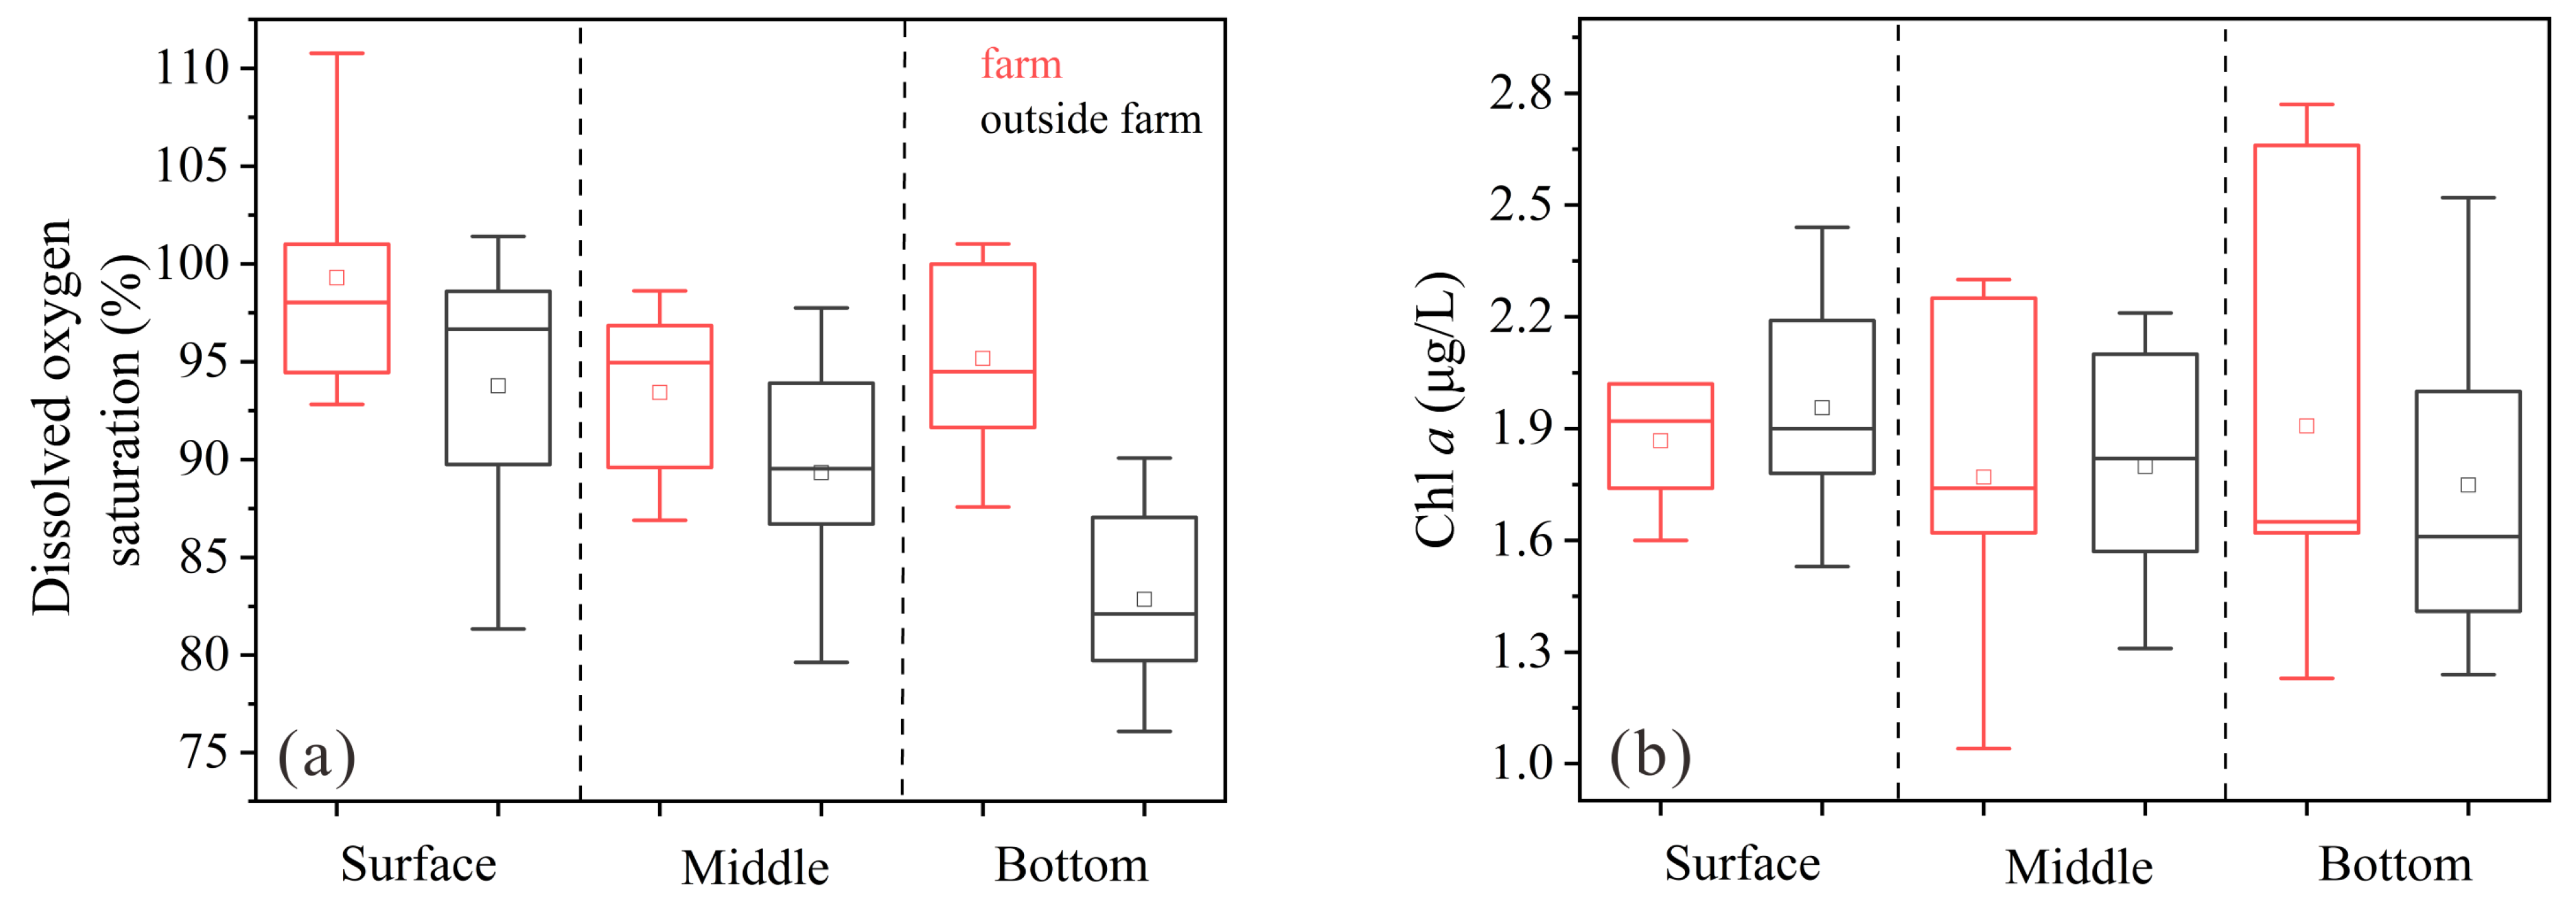
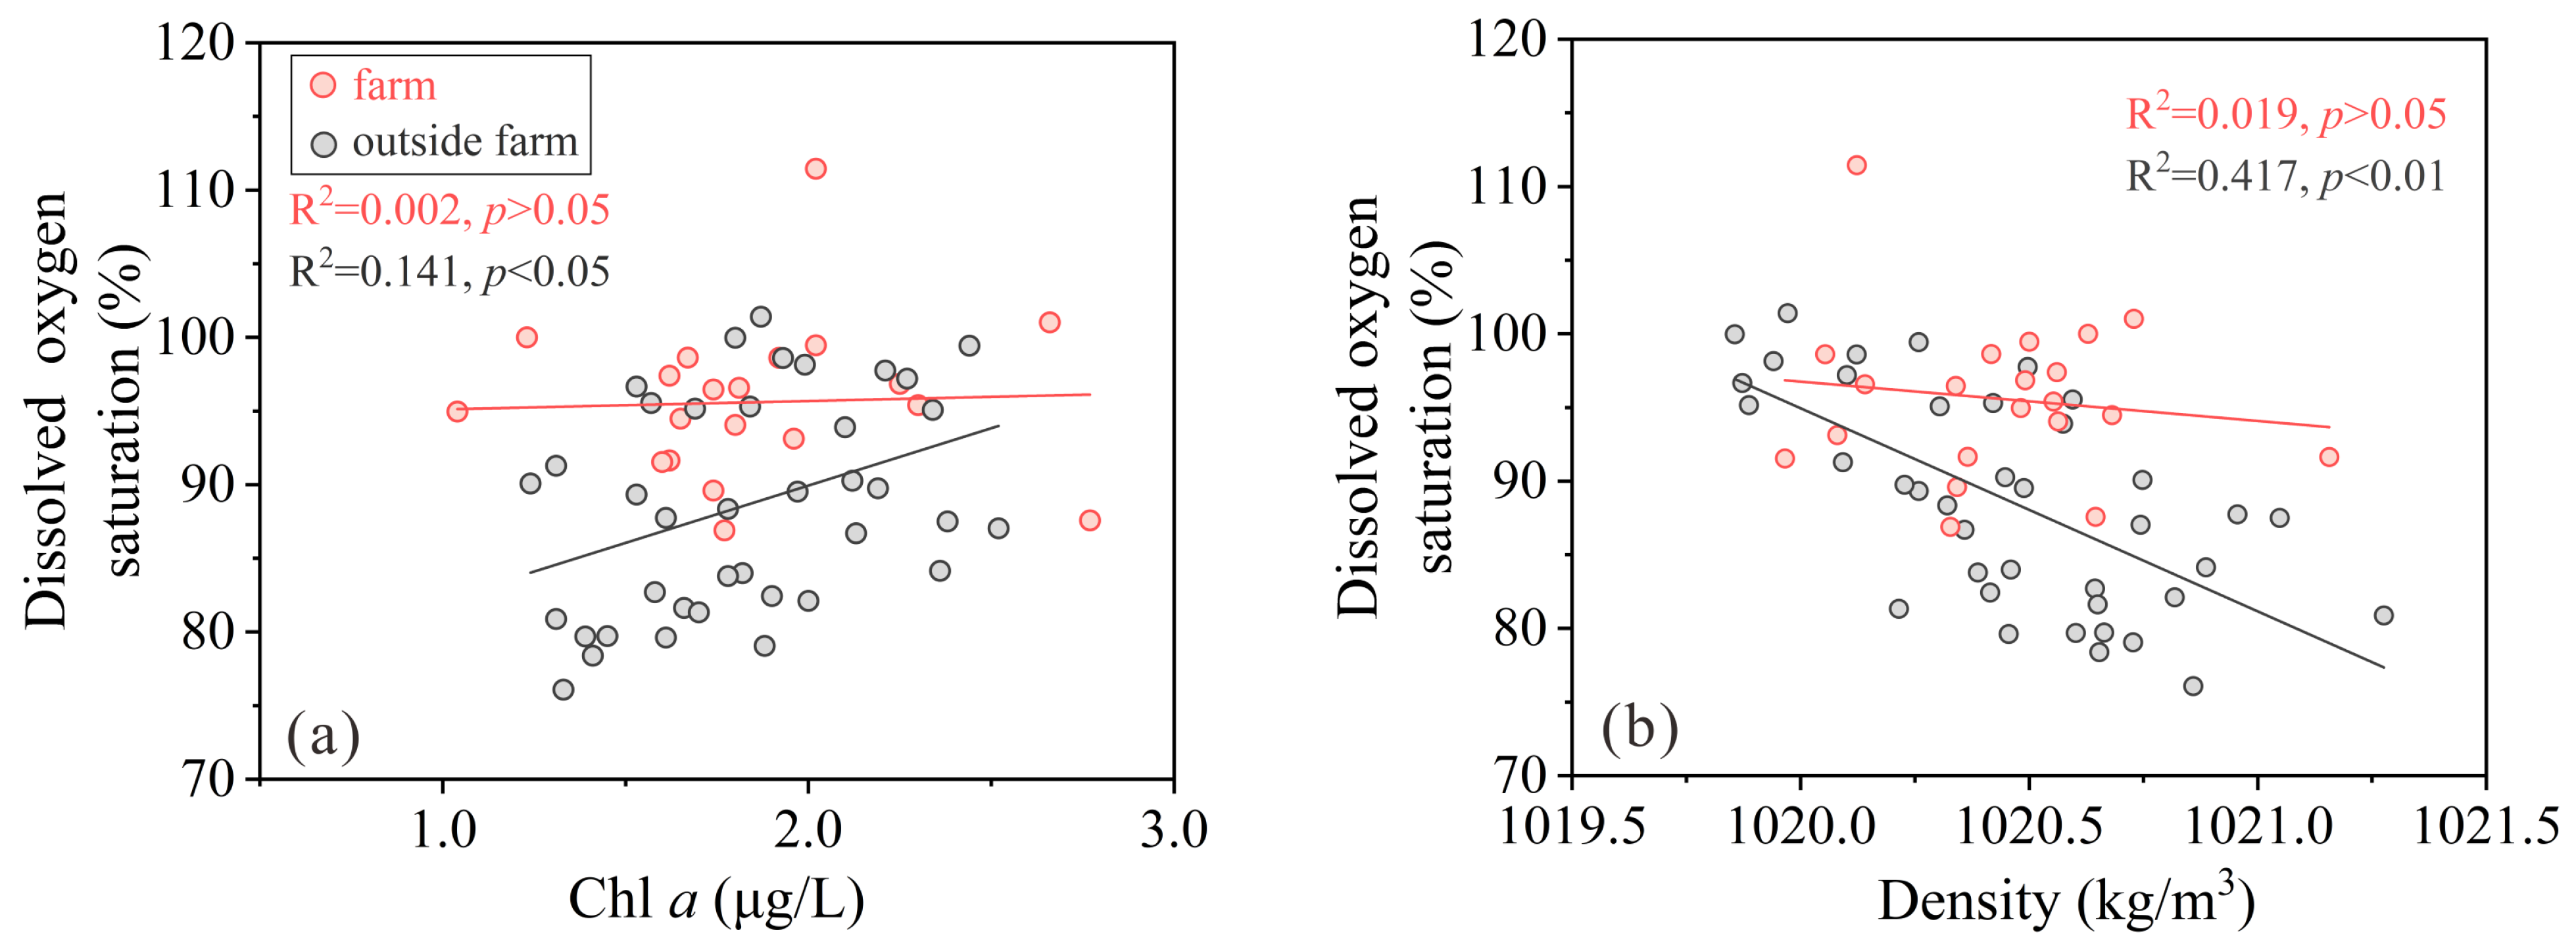
3.1. Hydrological Conditions, DO, and Chl a

Figure 2a–f illustrates the spatial variations in temperature and salinity, with the temperature ranging from 25.5 to 26.9 °C (mean 26.1 ± 0.3 °C) and the salinity ranging from 30.5 to 31.9 (mean 31.4 ± 0.3). Typically, surface water is characterized by higher temperature and lower salinity, contrasting with the cooler and saltier deep water. The mussel farm and its surrounding areas were classified into three distinct water masses according to the T-S diagram (Figure 3): Changjiang diluted water (CDW), shelf surface water (SSW), and shelf bottom water (SBW) [50]. The water samples collected at the mussel farm were intermediary among the three end-members and were therefore a mixture of CDW, SSW, and SBW.
The DO concentration ranged from 5.03 to 7.52 mg/L (mean 6.00 ± 0.54 mg/L). As shown in Figure 2g–i, the water column-averaged value of DO saturation was higher inside the farm (94.22 ± 5.71%) than outside (85.83 ± 7.92%). Vertically, DO saturation decreased with depth outside the farm, while inside the farm, high saturation levels were maintained across various depths. Figure 4a displays the distribution of DO across different layers. DO saturation within the aquaculture area was higher than that outside the aquaculture area at all layers. Specifically, the highest DO saturation was observed at the surface layer of the farm, reaching a mean value of 97.5 ± 5.4%.
The spatial distribution of Chl a concentration is shown in Figure 2j–l, with it varying from 1.0 to 2.8 μg/L (mean value of 1.8 ± 0.4 μg/L). There were no significant differences (p > 0.05) in the Chl a concentration between the water columns inside and outside the farm. Figure 4b displays the distribution of the Chl a concentration across different layers. The average values of Chl a in both the surface and middle layers of the aquaculture area were slightly lower than those outside the aquaculture area. Nonetheless, the highest concentrations of Chl a were recorded in the bottom layers at three stations on the farm (Figure 2j–l).
As shown in Figure 5, a significant negative correlation was exhibited between DO saturation and density (R2 = 0.417, p < 0.01) outside the mussel farm, while a significant positive correlation was observed between DO saturation and Chl a (R2 = 0.141, p < 0.05). Inside the farm, however, DO saturation was neither significantly correlated with water density nor Chl a (Figure 5).

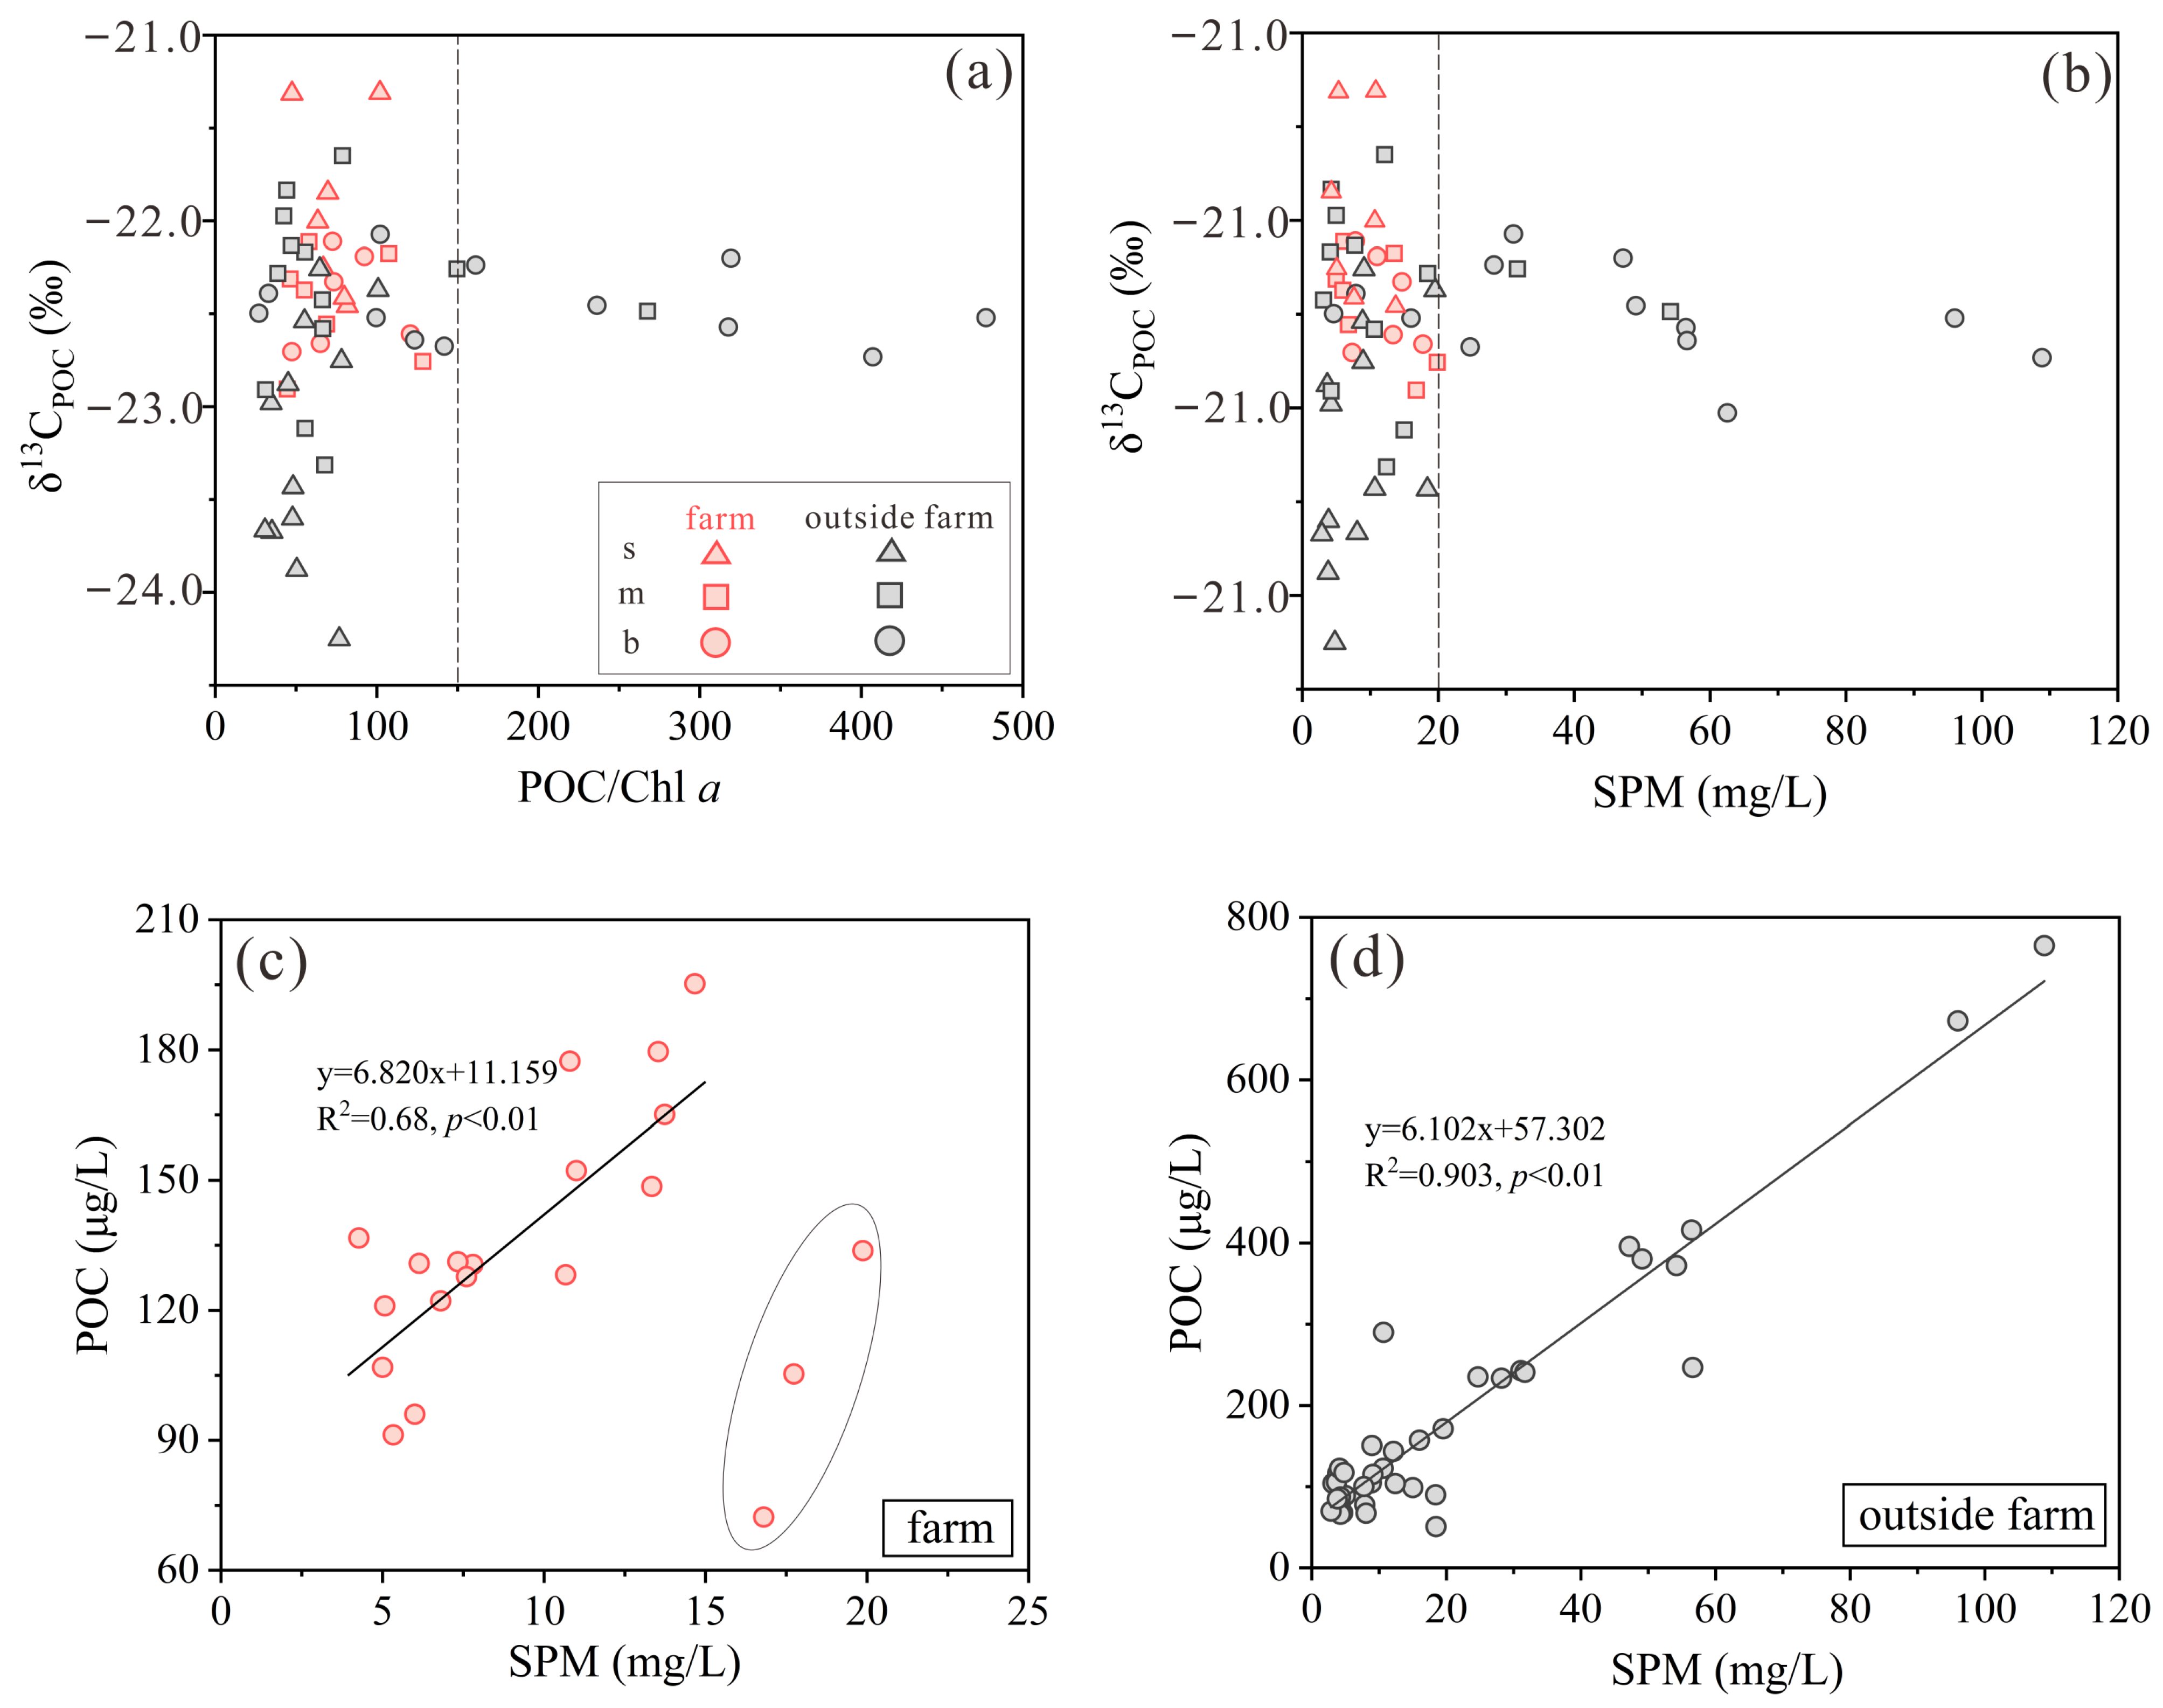
3.2. SPM, POC, δ13CPOC, and δ15NPN

The SPM concentration was relatively low in the surface and middle layers but increased significantly in the bottom layer (Figure 6a–c). The average SPM concentrations over the entire study area were 9.8 ± 6.0, 14.8 ± 12.0, and 31.4 ± 26.6 mg/L in the surface, middle, and bottom layers, respectively. Significant discrepancies (p < 0.05) in the SPM concentrations of the bottom layer were observed between the areas inside and outside the farm. Outside the farm, the SPM concentration increased with depth and reached 41.1 ± 28.7 mg/L in the bottom layer, while inside the farm, the SPM concentration remained relatively stable across depth (14.0 ± 7.1 mg/L in the bottom layer). In general, the water column-averaged value of SPM concentration was significantly lower inside the farm (11.6 ± 6.6 mg/L) than that outside the farm (22.6 ± 22.8 mg/L). The spatial distribution of POC concentration followed a similar pattern to that of SPM in the study area (Figure 6d–f). The mean POC concentrations in the surface, middle, and bottom layers were 134.6 ± 56.0, 129.8 ± 67.5, and 244.3 ± 171.9 μg/L, respectively. It was higher in the bottom layer compared to that of the surface and middle layers, and significant differences (p < 0.05) in the bottom layer were found between the areas inside and outside the farm. Outside the farm, the POC concentration varied greatly with depth, particularly at the bottom, where the POC concentration was notably higher (293.1 ± 196.2 μg/L) than that inside the farm (161.3 ± 68.8 μg/L). Overall, the water column-averaged POC concentration was lower inside the farm (135.9 ± 48.8 μg/L) than outside the farm (207.5 ± 206.6 μg/L).
As shown in Figure 7a, POC/Chl a was lower inside the farm, ranging from 44.6 to 128.6, with a mean of 74.6 ± 24.5. However, values of POC/Chl a weight ratio outside the farm varied in a large amplitude between 27.0 and 737 with a mean of 112.8 ± 110.1. The samples with higher POC/Chl a (>150) came from the bottom and middle layers outside the farm, and the 13CPOC of these samples was relatively stable. Similarly, samples with SPM concentrations higher than 20 mg/L also came from the bottom and middle layers outside the culture area and had a stable 13C value.
As shown in Figure 7c,d, there was no significant correlation between the POC and SPM within the farm (R2 = 0.013, p > 0.05), whereas a significant positive correlation was observed outside the farm (R2 = 0.903, p < 0.01). However, after excluding three outliers from the middle and bottom layers of the mussel farm (Figure 7c), a significant linear relationship emerged between POC and SPM (R2 = 0.68, p < 0.01).
As shown in Figure 6g–i, the mean values of δ13CPOC presented slight variations across the different layers, with the values of −22.9 ± 0.9‰, −22.4 ± 0.5‰, and −22.4 ± 0.5‰ in the surface, middle, and bottom layers, respectively. Notably, spatial variability in δ13CPOC was observed, with higher surface δ13CPOC inside the farm (−22.2 ± 0.7‰) and lower values outside the farm (−23.4 ± 0.6‰). However, there were no distinct differences in δ13CPOC between the inside and outside of the farm in both the middle and bottom layers. The spatial distribution of δ15NPN paralleled that of δ13CPOC (Figure 6j–l), with significantly higher values in the surface layer inside the farm (mean 5.6 ± 1.1‰) than outside (mean 4.5 ± 1.0‰). Similar to δ13CPOC, δ15NPN increased with depth outside the farm but remained consistent among the depths inside.

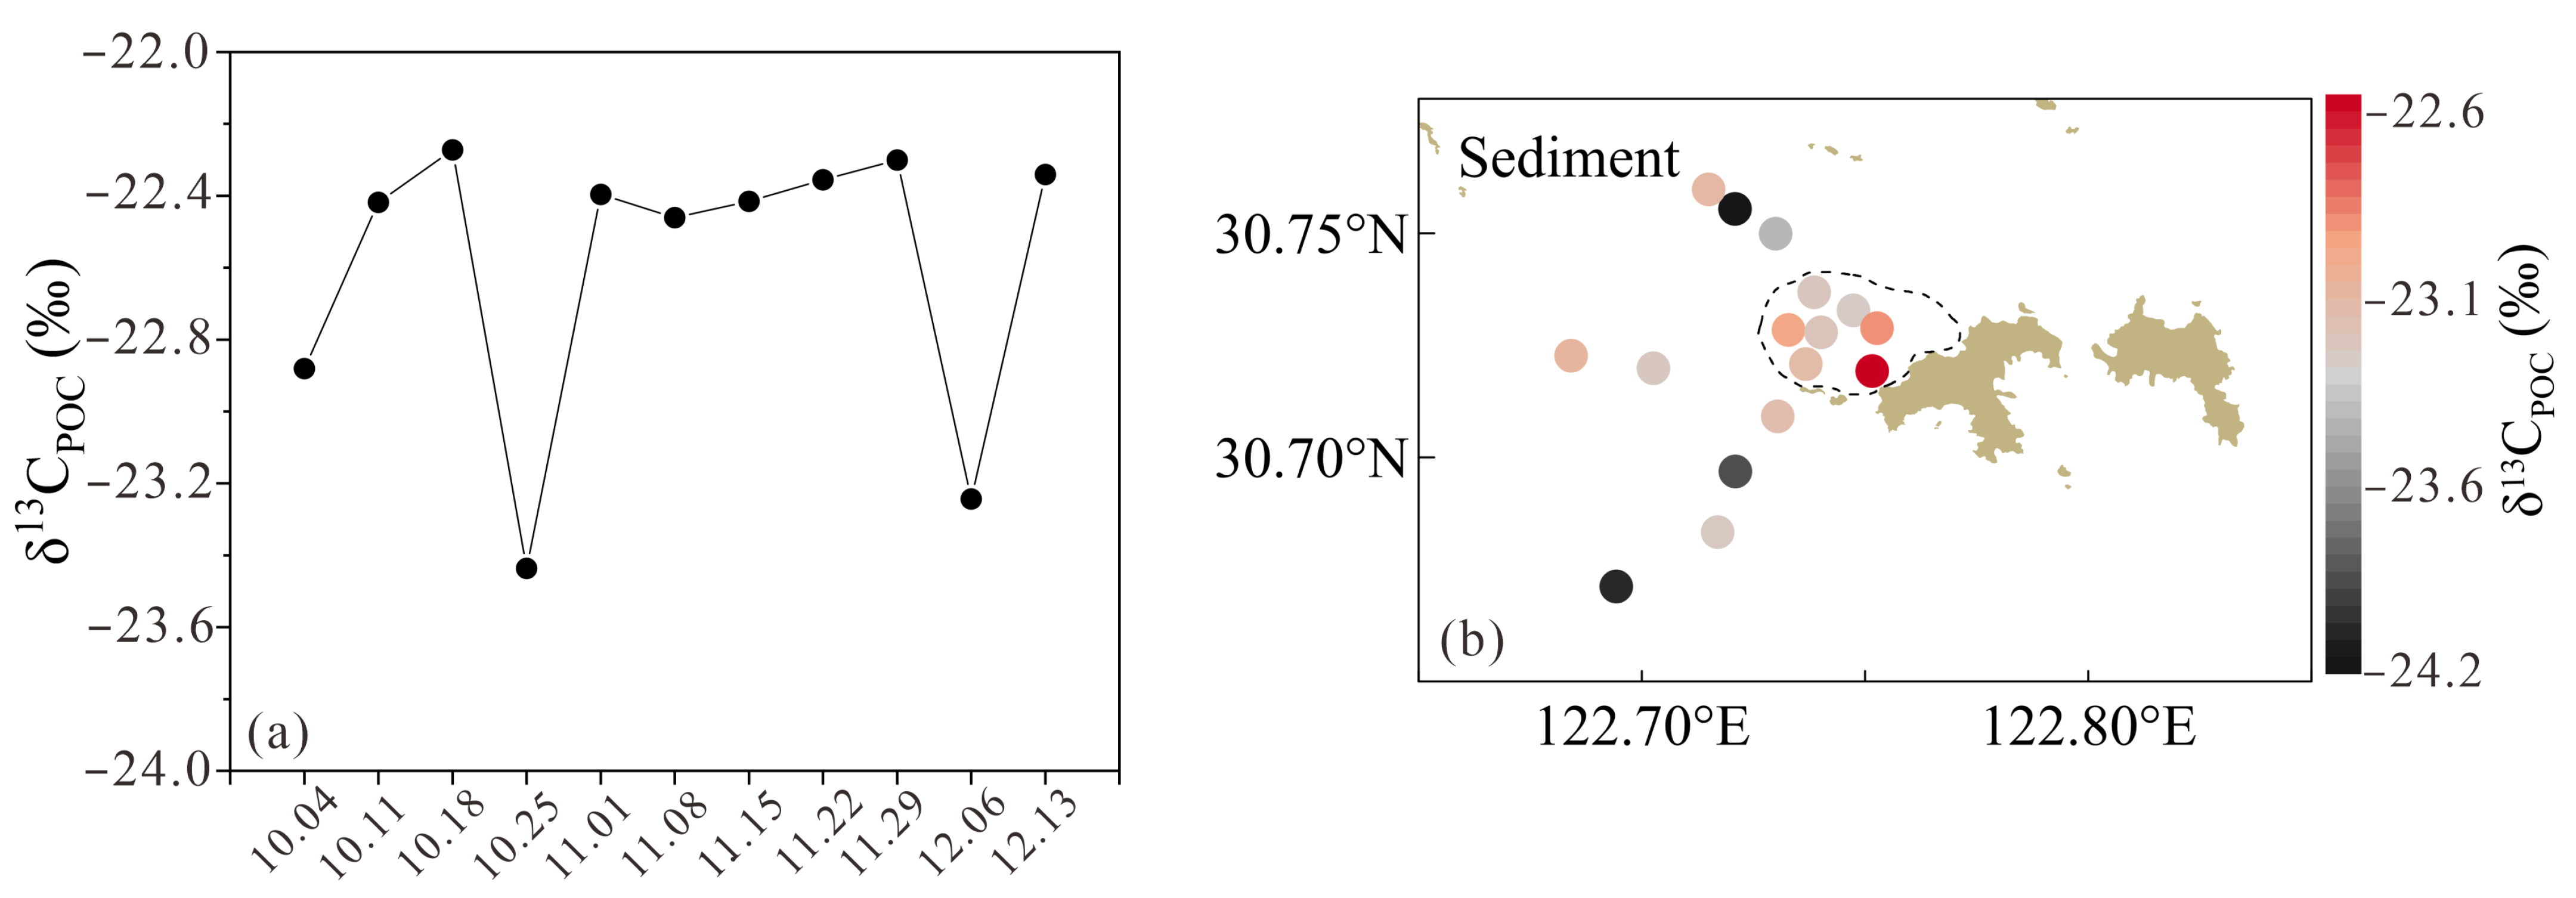
3.3. δ13CPOC of Sinking Particles and Surface Sediments

The δ13CPOC values of sinking particles within the mussel farm varied between −23.4‰ and −22.3‰ (mean: −22.6 ± 0.4‰) (Figure 8a), resembling the δ13CPOC values of suspended particles in the mussel farm (mean: −22.3 ± 0.4‰). Figure 8b indicates that the δ13CPOC values of surface sediment ranged from −23.3‰ to −22.6‰ inside the mussel farm compared to a range of −24.2‰ to −23.1‰ outside the farm. The average δ13CPOC value of surface sediment was slightly higher inside the farm (−23.0 ± 0.3‰) than outside (−23.5 ± 0.4‰).

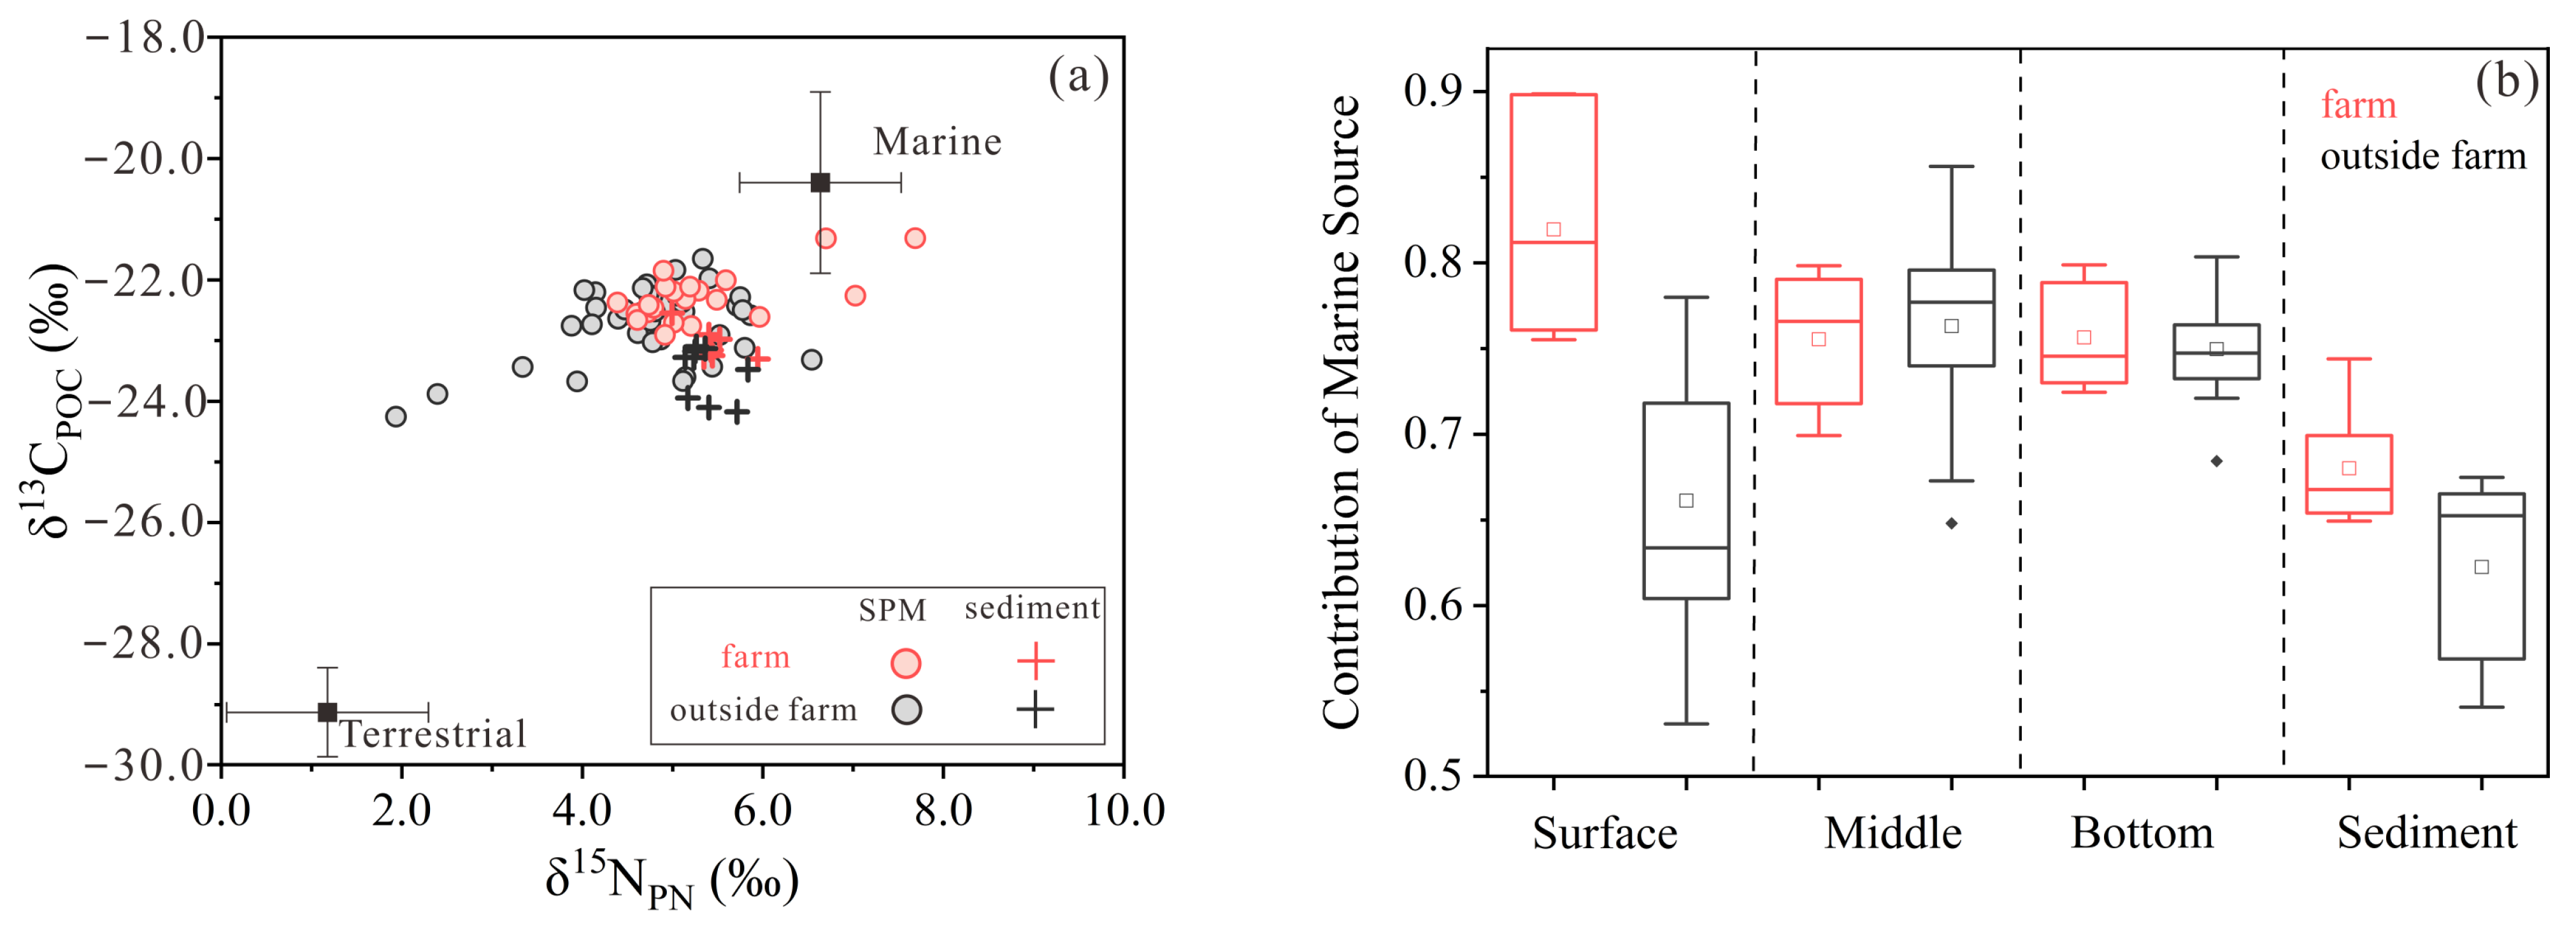
3.4. The Proportion of Marine Organic Matter in Suspended Particulate Matter and Sediment

As depicted in Figure 9a, the isotopic composition of suspended particulate matter and sediment within the aquaculture area more closely resembles that of marine-derived organic matter. The quantitative calculation results of the calculations for the source of organic matter from Equations (1) and (2) are shown in Figure 9b. In the study area, the organic matter was predominantly of marine origin. It is noteworthy that the proportions of marine organic carbon in the surface layer and sediment within the farm area were higher than those outside the farm area. Specifically, 82.0 ± 6.0% of the particulate organic carbon (POC) in the surface water is of marine origin. In the sediment, the proportion of marine organic matter inside the farm was also higher than that outside the farm (68.1% ± 3.4% compared to 62.2% ± 5.4%).

4. Discussion

4.1. Preservation of Particulate Organic Matter and the Effects of Sediment Resuspension

Given the higher degradation rate of Chl a compared to POC, the mass ratio of POC/Chl a serves as a reliable indicator for assessing the freshness of POM [51]. Typically, the POC/Chl a ratio of fresh organic matter, such as that from phytoplankton, is below 150. A ratio above 150 suggests that the organic matter has undergone degradation during transport, settlement, or resuspension [52,53]. Figure 7a demonstrates that some samples from the middle and bottom layers outside the mussel farm exhibited ratios above 150, with a peak value of 477.1, signaling considerable degradation of organic matter. In contrast, the ratios inside the mussel farm were below 150, suggesting the presence of fresh organic matter. Thus, it can be inferred that the POM within the mussel farm is fresher than that in the adjacent marine environments.
In estuaries and continental shelf seas, the shallow water depths enhance sediment resuspension due to tidal forces and other dynamic processes, often causing elevated SPM concentrations near the seabed [22,46], which also influence the POC characteristic in the water column, especially in the bottom layer. As shown in Figure 7c, after excluding three outliers from the middle and bottom layers of the mussel farm, a significant linear relationship emerged between POC and SPM (R2 = 0.68, p < 0.01). Moreover, the steeper slope inside the farm (6.82) compared to outside (6.10) suggests the distinct characteristics of POM. Given the low SPM inside the farm versus the high SPM in the bottom layer outside the farm, we speculated that the sediment resuspension influence within the farm was minimal. Hydrodynamic conditions are pivotal in influencing sediment resuspension. Field observation and numerical simulation revealed that the current velocities at the surface, middle, and bottom layers in the mussel farms decreased by 80%, 55%, and 45%, respectively, attributable to the presence of culture rafts and ropes [25,54]. Therefore, a mussel farm with stable hydrodynamic conditions inhibits the resuspension of surface sediments, leading to lower SPM levels and high organic matter preservation within the mussel farm.
Figure 7a shows wide variation in δ13CPOC (from −24.3‰ to −21.3‰) when the SPM concentration was below 20 mg/L. Conversely, when the SPM concentration was above 20 mg/L, δ13CPOC showed narrower fluctuations, spanning from −22.2‰ to −23.0‰; these samples were predominantly from the middle and bottom layers outside the farm, akin to the δ13CPOC in surface sediments from the Changjiang River Estuary and East China Sea shelf (from −23.0‰ to −22.0‰) [55,56]. This similarity suggests that the SPM in the middle and bottom layers outside the farm is influenced by surface sediment resuspension. Notably, the relatively high POC/Chl a ratios in the SPM from the middle and bottom layers outside the farm (Figure 7b) indicate massive degradation of POM, likely due to the presence of degraded organic matter resulting from sediment resuspension.

4.2. Sources of Particulate Organic Matter

The origin of POM could be indicated by the carbon and nitrogen isotopic compositions [56]. In estuaries and adjacent continental shelves, POM is usually mixtures originating from various sources, including fresh organic matter produced by phytoplankton and highly degraded terrestrial organic matter transported over long distances [51], which have distinctive δ13CPOC and δ15NPN values [57,58,59,60].
The isotopic composition varied between the inside and outside of the aquaculture area. Inside the farm, the surface mean δ13CPOC was higher (−22.2 ± 0.7‰) than outside (−23.4 ± 0.6‰), suggesting a predominant marine organic matter influence. The surface δ13CPOC value outside the mussel farm more closely resembled the terrestrial end-member, indicating a stronger terrestrial influence. Despite Gouqi Island being more than 100 km from the mainland, the Changjiang diluted water, traveling over 250 km, facilitates the transportation of terrestrial organic matter to the study area [38,61]. The carbon stable isotope values of our samples were between those of the end-members of terrestrial and marine organic matter (Figure 9a). This aligns with previous research conducted in the Changjiang River Estuary and adjacent continental shelf sea [24,48,62], underscoring the contribution of both terrestrial and marine sources.
The calculated results indicate that marine organic matter was the predominant origin of organic matter in SPM samples both inside and outside the farm, accounting for 76.5 ± 7.1% and 72 ± 8.2%, respectively. This is consistent with the data reported by an earlier study, in which the contribution of marine POC was 50–80% in the continental shelf sea adjacent to the Changjiang River Estuary [49]. Further analysis revealed that the proportion of marine organic matter was significantly higher in the surface layer inside the farm (82.0 ± 6.0%) than that outside (66.1 ± 7.8%), implying the dominance of marine POC in the surface water of the mussel farm. The relatively high proportion of marine organic matter is likely due to the process which bivalves promote the regeneration of ammonia and the turnover of phytoplankton rate through feeding and excretion, which positively affects primary production [63]. In the middle and bottom layers with no mussel facilities, the contribution of marine organic matter to the SPM did not show significant differences between the inside and outside of the farm (Figure 9b). However, in surface sediments, the proportion of marine organic matter was also higher inside the farm (68.1 ± 3.4%) than outside the farm (62.2 ± 5.4%). The calculation results showed characteristic differences between the two areas. Comparatively, more marine-originated organic matter was produced in the upper water column and buried in the sediment inside the farm. This difference could be attributed to the process of shellfish filtering phytoplankton which accelerates the export of organic carbon, thereby increasing the contribution of marine organic matter to the sediment [15,64].

4.3. Effects of Mussel Feeding

In order to elucidate the potential influence of mussel feeding on organic matter export and burial, the co-variation of Chl a content and DO saturation was also studied. The proportion of marine organic matter was higher and the organic matter was fresher inside the farm than outside, despite minimal Chl a variations between these areas (Figure 2j–l). Additionally, the DO saturation inside the farm was higher than that outside the farm across all layers, particularly in the bottom layer (Figure 4a). These results indicate the presence of potential high productivity within the aquaculture area. As shown in Figure 5, the significant negative correlation between DO saturation and density and the significant positive correlation between DO saturation and Chl a, indicated that water stratification and primary production by phytoplankton jointly shaped the distribution of DO outside the aquaculture farm. Inside the farm, however, DO saturation was neither significantly correlated with water density nor Chl a (Figure 5). It has been reported that the filter-feeding of shellfish not only reduces the biomass of phytoplankton on mussel farms but also stimulates phytoplankton growth yet accelerates their turnover rate [19,65,66]. Therefore, we believe that the relatively high level of DO saturation coupled with no significant increase in Chl a content inside the farm hints at the increased primary productivity and subsequent consumption of phytoplankton by mussels’ filter feeding, potentially explaining the decoupling between the values of DO saturation and Chl a content. Moreover, the maximum concentrations of Chl a were recorded at the bottom layers of three stations inside the mussel farm, likely resulting from reduced SPM concentrations due to mussel feeding and minimal sediment resuspension, which enhanced light penetration and thus boosted the primary production in the bottom layer.
POM filtered and digested by shellfish is packed into fecal pellets, settling rapidly downward [13,67,68] The average δ13C values of suspended POC (−22.3 ± 0.4‰) and sinking POC (−22.6 ± 0.4‰), as well as the sedimentary organic carbon (−23.0 ± 0.3‰) within the farming area, were similar (Figure 6 and Figure 8), indicating rapid settling and limited alteration of particulates from the water column to the sediments within the mussel farming area. This was also confirmed by the end-member analysis results which revealed a marginally higher marine organic matter proportion in the surface sediments inside the farm than outside (Figure 9b). In general, the POM produced from increased primary production within the mussel farm likely experiences swift deposition via filter feeding, complemented by limited sediment resuspension. This process accelerates the accumulation of fresh organic matter in the sediment.

5. Conclusions

Compared to the adjacent areas, the POM within the farm was much fresher, evidenced by the lower POC/Chl a ratios (<150). Conversely, elevated SPM content and POC/Chl a in the bottom layer outside the farm, along with δ13C values, suggested the resuspension of bottom sediments, a phenomenon not observed within the farm. This was likely due to the stabilizing effect of the farm’s infrastructure on hydrodynamic conditions. Additionally, isotopic analysis revealed a significantly higher proportion of marine organic matter in the surface water column and surface sediments inside the farm compared to outside. Specifically, the percentages were 82.0% and 65.1% for the water column and surface sediments inside the mussel farm, respectively, compared to 66.1% and 62.2% for the outside area. Simultaneously, the DO saturation levels within the water column of the farming area were higher than those outside the farming zone. The elevations in both δ13C and DO are likely attributable to the positive role of bivalves in promoting phytoplankton turnover and primary production. The filtration of particulate matter by mussels results in rapid settling of POM in the form of fecal pellets, which accelerates the accumulation of fresh organic matter in the sediment within the mussel farming area, with minimal isotopic alteration. This study provides new insights into the sources of POM and its associated biogeochemical processes within the mussel farm of Gouqi Island. As mussel farming activities increase and their significance in carbon sequestration becomes more evident, broader surveys of water and sediments should be further explored to assess the impact of shellfish farming on the carbon cycle.

Author Contributions

Conceptualization, L.H., J.Z., and H.L.; methodology, L.H., J.Y., and X.H.; software, L.H., X.W. and Z.W.; validation, L.H., J.Z., and H.L.; formal analysis, L.H.; investigation, L.H., Q.L., X.H., X.Y., Y.W. and Z.W.; resources, L.H., J.Z., and H.L.; data curation, L.H.; writing—original draft preparation, L.H.; writing—review and editing, L.H., J.Z., C.L., W.L., Y.L., and H.L.; visualization, L.H.; supervision, J.Z. and H.L.; project administration, J.Z. and H.L.; funding acquisition, H.L. All authors have read and agreed to the published version of the manuscript.

Funding

This study was supported by the Natural Science Foundation of Zhejiang Province (No. LDT23D06023D06), the Scientific Research Fund of the Second Institute of Oceanography, MNR (No. SZ2403; JG2213), and the Southern Marine Science and Engineering Guangdong Laboratory (Zhuhai) (No. SML2021SP207).

Institutional Review Board Statement

Not applicable.

Informed Consent Statement

Not applicable.

Data Availability Statement

Data are contained within the article.

Acknowledgments

We would like to thank Chunqing Chen from Guangdong Ocean University for technical support with the stable isotope measurements.

Conflicts of Interest

The authors declare no conflicts of interest.

References

  1. Lubchenco, J.; Haugan, P.M.; Pangestu, M.E. Five priorities for a sustainable ocean economy. Nature 2020, 588, 30–32. [Google Scholar] [CrossRef] [PubMed]
  2. MacLeod, M.J.; Hasan, M.R.; Robb, D.H.; Mamun-Ur-Rashid, M. Quantifying greenhouse gas emissions from global aquaculture. Sci. Rep. 2020, 10, 11679. [Google Scholar] [CrossRef] [PubMed]
  3. van der Schatte Olivier, A.; Jones, L.; Vay, L.L. Christie, A global review of the ecosystem services provided by bivalve aquaculture. Rev. Aquacult. 2020, 12, 3–25. [Google Scholar] [CrossRef]
  4. Pan, Z.; Tan, Y.M.; Gao, Q.F.; Dong, S.L.; Fang, X.D.; Yan, J.L. A 120-year record of burial fluxes and source apportionment of sedimentary organic carbon in Alian Bay, China: Implication for the influence of mariculture activities, and regional environment changes. Aquaculture 2021, 535, 736421. [Google Scholar] [CrossRef]
  5. Dame, R.F.; Zingmark, R.G.; Haskin, E. Oyster reefs as processors of estuarine materials. J. Exp. Mar. Biol. Ecol. 1984, 83, 239–247. [Google Scholar] [CrossRef]
  6. Martini, A.; Calì, M.; Capoccioni, F.; Martinoli, M.; Pulcini, D.; Buttazzoni, L.; Moranduzzo, T.; Pirlo, G. Environmental performance and shell formation-related carbon flows for mussel farming systems. Sci. Total Environ. 2022, 831, 154891. [Google Scholar] [CrossRef] [PubMed]
  7. Tamburini, E.; Turolla, E.; Lanzoni, M.; Moore, D.; Castaldelli, G. Manila clam and Mediterranean mussel aquaculture is sustainable and a net carbon sink. Sci. Total Environ. 2022, 848, 157508. [Google Scholar] [CrossRef] [PubMed]
  8. Liu, Q.; Liao, Y.; Zhu, J.; Shi, X.; Shou, L.; Zeng, J.; Chen, Q.; Chen, J. Influence of biodeposition by suspended cultured oyster on the distributions of trace elements in multiple media in a semi-enclosed bay of China. J. Hazard. Mater. 2023, 443, 130347. [Google Scholar] [CrossRef] [PubMed]
  9. Jacobs, P.; Riegman, R.; van der Meer, J. Impact of the blue mussel Mytilus edulis on the microbial food web in the western Wadden Sea, The Netherlands. Mar. Ecol. Prog. Ser. 2015, 527, 119–131. [Google Scholar] [CrossRef]
  10. Morris, J.P.; Humphreys, M.P. Modelling seawater carbonate chemistry in shellfish aquaculture regions: Insights into CO2 release associated with shell formation and growth. Aquaculture 2019, 501, 338–344. [Google Scholar] [CrossRef]
  11. Jaramillo, E.; Bertran, C.; Bravo, A. Mussel biodeposition in an estuary in southern Chile. Mar. Ecol. Prog. Ser. 1992, 82, 85–94. [Google Scholar] [CrossRef]
  12. Zhong, W.; Lin, J.; Zou, Q.; Yamazaki, H.; Yang, W.; Yang, G. Impacts of large-scale suspended mussel farm on seston depletion. Estuar. Coast. Shelf Sci. 2024, 300, 108710. [Google Scholar] [CrossRef]
  13. Hatakeyama, Y.; Kawahata, T.; Fujibayashi, M.; Nishimura, O.; Sakamaki, T. Sources and oxygen consumption of particulate organic matter settling in oyster aquaculture farms: Insights from analysis of fatty acid composition. Estuar. Coast. Shelf Sci. 2021, 254, 107328. [Google Scholar] [CrossRef]
  14. Froján, M.; Figueiras, F.G.; Zúñiga, D.; Alonso-Pérez, F.; Arbones, B.; Castro, C.G. Influence of Mussel Culture on the Vertical Export of Phytoplankton Carbon in a Coastal Upwelling Embayment (Ría de Vigo, NW Iberia). Estuaries Coasts 2016, 39, 1449–1462. [Google Scholar] [CrossRef]
  15. Xia, B.; Cui, Y.; Chen, B.; Cui, Z.; Qu, K.; Ma, F. Carbon and nitrogen isotopes analysis and sources of organic matter in surface sediments from the Sanggou Bay and its adjacent areas, China. Acta Oceanlol. Sin. 2014, 33, 48–57. [Google Scholar] [CrossRef]
  16. Sui, J.; Zhang, J.H.; Ren, S.J.; Lin, F. Organic Carbon in the Surface Sediments from the Intensive Mariculture Zone of Sanggou Bay: Distribution, Seasonal Variations and Sources. J. Ocean Univ. China 2019, 18, 985–996. [Google Scholar] [CrossRef]
  17. Jiao, M.; Zhou, W.; Long, C.; Zhang, L.; Xu, P.; Li, H.Y.; Suo, A.; Yue, W. Dietary reconstruction and influencing factors of oysters cultured in a typical estuarine bay of South China. J. Clean. Prod. 2024, 449, 141773. [Google Scholar] [CrossRef]
  18. Kotta, J.; Futter, M.; Kaasik, A.; Liversage, K.; Ratsep, M.; Barboza, F.R.; Bergstrom, L.; Bergstrom, P.; Bobsien, I.; Diaz, E.; et al. Cleaning up seas using blue growth initiatives: Mussel farming for eutrophication control in the Baltic Sea. Sci. Total Environ. 2020, 709, 136144. [Google Scholar] [CrossRef]
  19. Jiang, Z.; Du, P.; Liao, Y.; Liu, Q.; Chen, Q.; Shou, L.; Zeng, J.; Chen, J. Oyster farming control on phytoplankton bloom promoted by thermal discharge from a power plant in a eutrophic, semi-enclosed bay. Water Res. 2019, 159, 1–9. [Google Scholar] [CrossRef]
  20. Middelburg, J.J.; Herman, P.M. Organic matter processing in tidal estuaries. Mar. Chem. 2007, 106, 127–147. [Google Scholar] [CrossRef]
  21. Wang, X.C.; Chen, R.F.; Gardner, G.B. Sources and transport of dissolved and particulate organic carbon in the Mississippi River estuary and adjacent coastal waters of the northern Gulf of Mexico. Mar. Chem. 2004, 89, 241–256. [Google Scholar] [CrossRef]
  22. Ge, J.; Torres, R.; Chen, C.; Liu, J.; Xu, Y.; Bellerby, R.; Shen, F.; Bruggeman, J.; Ding, P. Influence of suspended sediment front on nutrients and phytoplankton dynamics off the Changjiang Estuary: A FVCOM-ERSEM coupled model experiment. J. Mar. Syst. 2020, 204, 103292. [Google Scholar] [CrossRef]
  23. Barth, J.A.; Veizer, J.; Mayer, B. Origin of particulate organic carbon in the upper St. Lawrence: Isotopic constraints. Earth Planet. Sci. Lett. 1998, 162, 111–121. [Google Scholar] [CrossRef]
  24. Wu, Y.; Zhang, J.; Li, D.J.; Wei, H.; Lu, R.X. Isotope variability of particulate organic matter at the PN section in the East China Sea. Biogeochemistry 2003, 65, 31–49. [Google Scholar] [CrossRef]
  25. Zhong, W.; Lin, J.; Zou, Q.; Wen, Y.; Yang, W.; Yang, G. Hydrodynamic effects of large-scale suspended mussel farms: Field observations and numerical simulations. Front. Mar. Sci. 2022, 9, 973155. [Google Scholar] [CrossRef]
  26. Liu, L.; Zhou, J.; Zheng, B.; Cai, W.; Lin, K.; Tang, J. Temporal and spatial distribution of red tide outbreaks in the Yangtze River Estuary and adjacent waters, China. Mar. Pollut. Bull. 2013, 72, 213–221. [Google Scholar] [CrossRef]
  27. Qian, W.; Dai, M.; Xu, M.; Kao, S.J.; Du, C.; Liu, J.; Wang, H.; Guo, L.; Wang, L. Non-local drivers of the summer hypoxia in the East China Sea off the Changjiang Estuary. Estuar. Coast. Shelf Sci. 2017, 198, 393–399. [Google Scholar] [CrossRef]
  28. Wu, D.; Chen, J.; Wang, K.; Ni, X.; Li, D.; Zeng, D.; Fan, W.; Xu, D. The Changjiang River plume shifts from carbon source to sink when net community production exceeds a threshold in early autumn. Sci. Total Environ. 2023, 888, 164126. [Google Scholar] [CrossRef] [PubMed]
  29. Pei, S.; Shen, Z.; Laws, E.A. Nutrient Dynamics in the Upwelling Area of Changjiang (Yangtze River) Estuary. J. Coast. Res. 2009, 25, 569–580. [Google Scholar] [CrossRef]
  30. Yang, D.; Yin, B.; Sun, J.; Zhang, Y. Numerical study on the origins and the forcing mechanism of the phosphate in upwelling areas off the coast of Zhejiang province, China in summer. J. Mar. Syst. 2013, 123–124, 1–18. [Google Scholar] [CrossRef]
  31. Lü, X.; Qiao, F.; Xia, C.; Zhu, J.; Yuan, Y. Upwelling off Yangtze River estuary in summer. J. Geophys. Res. Ocean. 2006, 111, C11. [Google Scholar] [CrossRef]
  32. Qiao, L.; Huang, L.; Wang, Z.; Yao, Z.; Liu, S. Flux and its seasonal variation of suspended particulate matter in the Bohai Sea, Yellow Sea and East China Sea. Geol. J. 2016, 51, 22–34. [Google Scholar] [CrossRef]
  33. Yin, W.; Ma, Y.; Wang, D.; He, S.; Huang, D. Surface Upwelling off the Zhoushan Islands, East China Sea, from Himawari-8 AHI Data. Remote Sens. 2022, 14, 3261. [Google Scholar] [CrossRef]
  34. Xu, M.; Wang, Y.; Feng, Z.; Wu, H. Rapid variations of phytoplankton blooms and their dynamics off the Changjiang River Estuary. Front. Mar. Sci. 2024, 11, 1345940. [Google Scholar] [CrossRef]
  35. Chen, Y.L.L.; Chen, H.Y.; Gong, G.C.; Lin, Y.H.; Jan, S.; Takahashi, M. Phytoplankton production during a summer coastal upwelling in the East China Sea. Cont. Shelf Res. 2004, 24, 1321–1338. [Google Scholar] [CrossRef]
  36. Gong, G.C.; Chen, Y.L.L.; Liu, K.K. Chemical hydrography and chlorophyll a distribution in the East China Sea in summer: Implications in nutrient dynamics. Cont. Shelf Res. 1996, 16, 1561–1590. [Google Scholar] [CrossRef]
  37. Tseng, Y.F.; Lin, J.; Dai, M.; Kao, S.J. Joint effect of freshwater plume and coastal upwelling on phytoplankton growth off the Changjiang River. Biogeosciences 2014, 11, 409–423. [Google Scholar] [CrossRef]
  38. Wang, X.; Ma, H.; Li, R.; Song, Z.; Wu, J. Seasonal fluxes and source variation of organic carbon transported by two major Chinese Rivers: The Yellow River and Changjiang (Yangtze) River. Glob. Biogeochem. Cycles 2012, 26, GB2025. [Google Scholar] [CrossRef]
  39. Zhang, X.; Liu, J.; Saito, Y.; Xu, G.; Chen, B.; Chen, L. Sedimentary signals of the upwelling along the Zhejiang coast, China. Estuar. Coast. Shelf Sci. 2020, 232, 106396. [Google Scholar] [CrossRef]
  40. Song, S.; Li, Z.; Li, C.; Yu, Z. The response of spring phytoplankton assemblage to diluted water and upwelling in the eutrophic Changjiang (Yangtze River) Estuary. Acta Oceanlol. Sin. 2017, 36, 101–110. [Google Scholar] [CrossRef]
  41. Maar, M.; Larsen, J.; Schourup-Kristensen, V. Intensified Mussel Farming; Impacts on Nutrient Budgets and Ecology in a Eutrophic Semi-Enclosed Fjord System. J. Geophys. Res. Biogeosciences 2023, 128, e2022JG007312. [Google Scholar] [CrossRef]
  42. Wiesner, M.G.; Zheng, L.; Wong, H.K.; Wang, Y.; Chen, W. Fluxes of particulate matter in the South China Sea. Part. Flux Ocea 1996, 57, 293–309. [Google Scholar]
  43. Li, H.; Zhang, J.; Xuan, J.; Wu, Z.; Ran, L.; Wiesner, M.G.; Chen, J. Asymmetric response of the biological carbon pump to the ENSO in the South China Sea. Geophys. Res. Lett. 2022, 49, e2021GL095254. [Google Scholar] [CrossRef]
  44. Carpenter, J.H. The accuracy of the winkler method for dissolved oxygen analysis. Limnol. Oceanogr. 1965, 10, 135–140. [Google Scholar] [CrossRef]
  45. Welschmeyer, N.A. Fluorometric analysis of chlorophyll a in the presence of chlorophyll b and pheopigments. Limnol. Oceanogr. 1994, 39, 1985–1992. [Google Scholar] [CrossRef]
  46. Murrell, M.C.; Hollibaugh, J.T. Distribution and Composition of Dissolved and Particulate Organic Carbon in Northern San Francisco Bay During Low Flow Conditions. Estuar. Coast. Shelf Sci. 2000, 51, 75–90. [Google Scholar] [CrossRef]
  47. Wu, Y.; Zhang, J.; Liu, S.M.; Zhang, Z.F.; Yao, Q.Z.; Hong, G.H.; Cooper, L. Sources and distribution of carbon within the Yangtze River system. Estuar. Coast. Shelf Sci. 2007, 71, 13–25. [Google Scholar] [CrossRef]
  48. Yan, X.; Yang, J.Y.T.; Xu, M.N.; Wang, H.; Dai, M.; Kao, S.J. Nitrogen isotope constraint on the zonation of multiple transformations between dissolved and particulate organic nitrogen in the Changjiang plume. Sci. Total Environ. 2022, 818, 151678. [Google Scholar] [CrossRef]
  49. Liang, S.; Li, S.; Guo, J.; Yang, Y.; Xu, Z.; Zhang, M.; Li, H.; Yu, X.; Wang, X. Source, composition, and reactivity of particulate organic matter along the Changjiang Estuary salinity gradient and adjacent sea. Mar. Chem. 2023, 252, 104245. [Google Scholar] [CrossRef]
  50. Miao, Y.; Wang, B.; Li, D.; Sun, X.; Xu, Z.; Sun, Q.; Jiang, Z.; Ma, X.; Jin, H.; Chen, J. Observational studies of the effects of wind mixing and biological process on the vertical distribution of dissolved oxygen off the Changjiang Estuary. Front. Mar. Sci. 2023, 10, 1081688. [Google Scholar] [CrossRef]
  51. Zhou, X.; Jin, G.; Li, J.; Song, Z.; Zhang, S.; Chen, C.; Zhu, Q.; Meng, Y. Effects of Typhoon Mujigae on the Biogeochemistry and Ecology of a Semi-Enclosed Bay in the Northern South China Sea. J. Geophys. Res. Biogeosci. 2021, 126, e2020JG006031. [Google Scholar] [CrossRef]
  52. Cifuentes, L.A.; Sharp, J.H.; Fogel, M.L. Stable carbon and nitrogen isotope biogeochemistry in the Delaware estuary. Limnol. Oceanogr. 1988, 33, 1102–1115. [Google Scholar] [CrossRef]
  53. Guo, W.; Ye, F.; Xu, S.; Jia, G. Seasonal variation in sources and processing of particulate organic carbon in the Pearl River estuary, South China. Estuar. Coast. Shelf Sci. 2015, 167, 540–548. [Google Scholar] [CrossRef]
  54. Lin, J.; Li, C.; Zhang, S. Hydrodynamic effect of a large offshore mussel suspended aquaculture farm. Aquaculture 2016, 451, 147–155. [Google Scholar] [CrossRef]
  55. Kao, S.J.; Lin, F.J.; Liu, K.K. Organic carbon and nitrogen contents and their isotopic compositions in surficial sediments from the East China Sea shelf and the southern Okinawa Trough. Deep Sea Res. Part II Top. Stud. Oceanogr. 2003, 50, 1203–1217. [Google Scholar] [CrossRef]
  56. Tan, F.C.; Cai, D.L.; Edmond, J.M. Carbon isotope geochemistry of the Changjiang estuary. Estuar. Coast. Shelf Sci. 1991, 32, 395–403. [Google Scholar] [CrossRef]
  57. Huang, C.; Chen, F.; Zhang, S.; Chen, C.; Meng, Y.; Zhu, Q.; Song, Z. Carbon and nitrogen isotopic composition of particulate organic matter in the Pearl River Estuary and the adjacent shelf. Estuar. Coast. Shelf Sci. 2020, 246, 107003. [Google Scholar] [CrossRef]
  58. Gao, L.; Li, D.; Ishizaka, J. Stable isotope ratios of carbon and nitrogen in suspended organic matter: Seasonal and spatial dynamics along the Changjiang (Yangtze River) transport pathway. J. Geophys. Res. Biogeosci. 2014, 119, 1717–1737. [Google Scholar] [CrossRef]
  59. Lamb, A.L.; Wilson, G.P.; Leng, M.J. A review of coastal palaeoclimate and relative sea-level reconstructions using δ13C and C/N ratios in organic material. Earth-Sci. Rev. 2006, 75, 29–57. [Google Scholar] [CrossRef]
  60. Ye, F.; Guo, W.; Shi, Z.; Jia, G.; Wei, G. Seasonal dynamics of particulate organic matter and its response to flooding in the Pearl River Estuary, China, revealed by stable isotope (δ13C and δ15N) analyses. J. Geophys. Res. Ocean. 2017, 122, 6835–6856. [Google Scholar] [CrossRef]
  61. Hu, L.; Shi, X.; Yu, Z.; Lin, T.; Wang, H.; Ma, D.; Guo, Z.; Yang, Z. Distribution of sedimentary organic matter in estuarine–inner shelf regions of the East China Sea: Implications for hydrodynamic forces and anthropogenic impact. Mar. Chem. 2012, 142–144, 29–40. [Google Scholar] [CrossRef]
  62. Sun, X.; Fan, D.; Cheng, P.; Hu, L.; Sun, X.; Guo, Z.; Yang, Z. Source, transport and fate of terrestrial organic carbon from Yangtze River during a large flood event: Insights from multiple-isotopes (δ13C, δ15N, Δ14C) and geochemical tracers. Geochim. Cosmochim. Acta 2021, 308, 217–236. [Google Scholar] [CrossRef]
  63. Gallardi, D. Effects of bivalve aquaculture on the environment and their possible mitigation: A review. Fish. Aquac. J. 2014, 5, 1–8. [Google Scholar] [CrossRef]
  64. Malet, N.; Sauriau, P.G.; Ryckaert, M.; Malestroit, P.; Guillou, G. Dynamics and sources of suspended particulate organic matter in the Marennes-Oléron oyster farming bay: Insights from stable isotopes and microalgae ecology. Estuar. Coast. Shelf Sci. 2008, 78, 576–586. [Google Scholar] [CrossRef]
  65. Newell, R.I.E. Ecosystem influences of natural and cultivated populations of suspension-feeding bivalve molluscs: A review. J. Shellfish Res. 2004, 23, 51–61. [Google Scholar]
  66. Nizzoli, D.; Welsh, D.T.; Bartoli, M.; Viaroli, P. Impacts of mussel (Mytilus galloprovincialis) farming on oxygen consumption and nutrient recycling in a eutrophic coastal lagoon. Hydrobiologia 2005, 550, 183–198. [Google Scholar] [CrossRef]
  67. Souchu, P.; Vaquer, A.; Collos, Y.; Landrein, S.; Deslous-Paoli, J.M.; Bibent, B. Influence of shellfish farming activities on the biogeochemical composition of the water column in Thau Lagoon. Mar. Ecol. Prog. Ser. 2001, 218, 141–152. [Google Scholar] [CrossRef]
  68. Hartstein, N.D.; Stevens, C.L. Deposition beneath long-line mussel farms. Aquac. Eng. 2005, 33, 192–213. [Google Scholar] [CrossRef]
Figure 1. Map showing the sampling area. Black symbols indicate sampling stations outside the mussel farm, red symbols indicate sampling stations inside the mussel farm area, and the yellow symbol indicates the sediment trap station (°N, °E). The mussel farm is located in the area enclosed by the red dotted lines. CDW: Changjiang diluted water. Bathymetry is shown as blue contours.
Jmse 12 00910 g001
Figure 2. Distribution patterns of temperature (ac), salinity (df), dissolved oxygen saturation (gi), and chlorophyll a (jl) at the surface, middle, and bottom of the water column.
Jmse 12 00910 g002
Figure 3. Scatter plot of potential temperature and salinity. The blue dots are the data from this study. The data indicated by the black dots are from Miao et al., 2023 [50]. CDW: Changjiang diluted water, SSW: shelf surface water, and SBW: shelf bottom water.
Jmse 12 00910 g003
Figure 4. Box pattern of dissolved oxygen saturation (a) and Chl a concentration (b). The horizontal lines on the upper and lower edges of the box diagram represent the maximum and minimum values of the data, respectively; the upper and lower edges of the box represent the upper and lower quartiles, respectively; the straight line in the middle of the box represents median of the data in the group; and the square point in the middle of the box represents the average value of the data in the group.
Jmse 12 00910 g004
Figure 5. (a) Scatter plot of dissolved oxygen saturation and Chl a concentration. (b) Scatter plot of dissolved oxygen saturation and density. Red data points and black data points represent samples from inside the mussel farm area and outside the farm area, respectively.
Jmse 12 00910 g005
Figure 6. Distribution patterns of suspended particulate matter concentration (ac), particulate organic carbon concentration (df), δ13CPOC (gi), and δ15NPN (jl) at the surface, middle, and bottom of the water column.
Jmse 12 00910 g006
Figure 7. Scatter plots of various parameters in this study, including (a) δ13CPOC vs. SPM, (b) δ13CPOC vs. POC/Chl a, (c) POC vs. SPM inside the farm, and (d) POC vs. SPM outside the farm. In (a) and (b), red data points and black data points represent samples from inside the mussel farm area and outside the farm area, respectively. The triangle, square, and circle symbols represent samples from the surface, middle, and bottom layers, respectively.
Jmse 12 00910 g007
Figure 8. (a) δ13CPOC of sinking particles inside the mussel farm and (b) distribution of δ13CPOC in sediments. In (b), the dotted line indicates the boundary of the breeding area.
Jmse 12 00910 g008
Figure 9. (a) Scatter plot between δ13CPOC and δ15NPN and (b) the contribution of the marine POC source. Data from inside the farm and outside the farm are represented in red and black, respectively. The horizontal lines on the upper and lower edges of the box diagram represent the maximum and minimum values of the data, respectively; the upper and lower edges of the box represent the upper and lower quartiles, respectively; the straight line in the middle of the box represents the median of the data in the group; the square point in the middle of the box represents the average value of the data in the group; and the solid rhomboid point outside the box represents the outlier.
Jmse 12 00910 g009
Disclaimer/Publisher’s Note: The statements, opinions and data contained in all publications are solely those of the individual author(s) and contributor(s) and not of MDPI and/or the editor(s). MDPI and/or the editor(s) disclaim responsibility for any injury to people or property resulting from any ideas, methods, instructions or products referred to in the content.

