Abstract
Large waves pose a significant threat to the safety of low-laying coastal bridges. In 2004 and 2005, many coastal bridges were destroyed by the large waves generated by Hurricane Ivan and Katrina. A series of studies have been conducted to investigate the wave action on bridge decks. However, the effect of seabed topography on wave forces is seldom considered. In this study, a numerical model of wave impact on bridge decks located close to a sloping seabed was set up based on OpenFOAM-v1912. The reliability of the present numerical model was checked against published experimental results. The wave forces acting on the bridge decks located before and after the sloping seabed were compared with a bridge deck located above a flat bottom. With the validated numerical model, the effect of the wave properties, coefficient of submergence, and the inclination on wave forces were investigated. The results show that the wave forces on the bridge are affected by the interaction among the incident and reflected waves, the position of the bridge relative to the sloping seabed, and the inclination. These findings emphasize the complex dynamic effects of wave forces on bridges and the importance of considering seabed topography in bridge design and strengthening strategies. This research contributes to an improvement in the safety of coastal bridges, especially in the face of increasing threats from climate change and sea level rise, as well as promotes the development of more resilient infrastructures.
1. Introduction
Coastal bridges are essential for supporting the economy and facilitating travel. However, the intensification of weather phenomena such as hurricanes and typhoons, attributed to global warming, poses a significant threat to these structures. The formidable power of storms can generate massive waves, causing extensive damage to coastal bridges. The vulnerability of bridges near the Gulf of Mexico was highlighted during the 2004 Hurricane Ivan and the 2005 Hurricane Katrina, both of which caused severe damage. The devastation was so profound that it nearly paralyzed transportation in the affected regions, a concern documented by Hagy et al. [1].
In coastal structures, the vertical forces are typically more pronounced than the horizontal ones, risking the structures’ stability. When these forces become excessively strong, structural damage may ensue. Stability is primarily maintained through support, friction, and components such as shear keys. The structure’s own weight also plays a crucial role in countering vertical forces. Occasionally, the assembly method contributes to this resistance. As Tang et al. [2] points out, storm surges can induce wave forces surpassing the structure’s weight, potentially displacing it from its support. Such scenarios can lead to the overturning of bridges or dislocation of their components, as documented by Robertson et al. [3]. Azadbakht and Yim [4] evaluated tsunami forces on Californian bridges, proposing a design procedure for estimating impacts during the initial and full inundation stages. The study by Nakamura et al. [5] proposed an estimation formulae for predicting the temporal changes in the tsunami forces on bridge superstructures.
Wave flume experiments have emerged as a pivotal tool in exploring the impact of waves on bridge superstructures, offering a direct and efficient methodology for understanding the intricate dynamics between wave forces and bridges. These experiments facilitate detailed investigations into the aggressive wave forces that bridges are subjected to. Notable contributions in this field have been made by scholars such as Guo et al. [6], Huang et al. [7], and Zhang et al. [8]. The genesis of this research area can be traced back to the 1970s with Denson [9] pioneering the use of small-scale bridge models to analyze wave forces, leading to the development of predictive formulas based on wave characteristics. The significant damage to bridges caused by Hurricane Ivan prompted further research by Istrati et al. [10], who conducted additional experiments to refine the understanding of wave–bridge interactions, resulting in new formulas for forecasting wave forces on bridges. Comprehensive studies by researchers like Bradner et al. [11] have also delved into the effects of storm surges and substantial waves on coastal bridges, thereby enriching the body of knowledge in this domain. Istrati and Buckle [12] investigated tsunami-induced loads on coastal bridges, revealing that trapped air significantly alters wave–structure interactions and increases the uplift forces and overturning moments, suggesting new design considerations for elastomeric bearings based on these findings. Istrati et al. [10] examined tsunami impacts on bridges, emphasizing the need for refined design strategies to manage localized uplift and overturning forces.
In terms of numerical simulation, advancements in Computational Fluid Dynamics (CFD) and improved computational performance have rendered it a more cost-effective alternative to traditional experimental approaches. Enhanced computing capabilities continue to highlight the cost-effectiveness of numerical simulation over traditional cost-intensive experimental methods. Consequently, numerical simulation has become the preferred technique for analyzing wave loading on bridge superstructures. Given the high costs associated with conventional experimental research, numerical simulation presents significant economic advantages. It has established itself as a dependable method for assessing the effects of wave loads on bridge superstructures, gaining widespread acceptance among researchers. This is supported by the work of scholars such as Xu and Cai [13], Xu et al. [14], and Qu et al. [15] who have extensively utilized numerical simulations to investigate wave forces on bridge superstructures.
Greco and Lonetti [16] set a foundational precedent by implementing a two-phase fluid flow numerical model, adeptly simulating the interaction between fluid dynamics and structural mechanics through the innovative use of the Arbitrary Lagrangian–Eulerian (ALE) strategy, thereby exposing the inadequacies of current design codes in predicting the maximum design effects under flood events.
Building on this methodological groundwork, Han et al. [17] introduced a safety assessment framework employing the Tsunami Squares (TS) meshless numerical approach, offering a nuanced evaluation of box-girder bridge superstructures’ vulnerability to landslide tsunamis. This was complemented by Wang et al. [18], who, through the RANS equation and k-ε turbulence model, investigated the mitigation potential of floating breakwaters against extreme wave action, thereby elucidating the significant reduction in wave forces achievable through such interventions. Moideen et al. [19] contributed to this burgeoning field by employing the REEF3D CFD model to generate solitary waves, exploring the vertical impact forces on coastal bridge decks and demonstrating the efficacy of varying girder spacings and depths in diminishing peak vertical impact forces. Finally, Song et al. [20] extended these insights through the development of a 3D dam-break wave model, using OpenFOAM-v1912 to examine the effects of bridge deck superelevation on tsunami-like wave impacts, thereby uncovering the proportional relationship between the tsunami force and relative wave height, alongside the nuanced effects of upstream and downstream water depths.
In recent years, the use of box girders in coastal bridge construction projects has become more and more common due to their high torsional stiffness. The study by Fang et al. [21] experimentally investigated the effects of wave action on coastal bridges using Periodic Focused Waves (PFW), where the wave force was measured by modeling a coastal bridge that included a bridge deck and a box girder in a wave flume. Their experimental results showed that the maximum horizontal and vertical wave forces occurred simultaneously when the bridge deck was completely submerged, and the wave water started to cover the bridge deck. In addition, Zhang et al. [8] investigated the effects of hurricane-induced wave forces on the box girder decks of coastal bridges through experimental tests and numerical simulations, demonstrating five submergence coefficients for different deck heights, wave heights, and water depth conditions.
Further, Wu and Garlock [22] evaluated the effect of box-girder bridges with different geometries under wave forces through smooth particle hydrodynamics (SPH) modeling, focusing on the angular differences between the netting and the top chord as well as the effect of the integration of a parapet on the wave forces. They limited their study to tsunami-induced waves and used isolated waves for their experiments. Finally, Chen et al. [23] developed a numerical model to directly compare the dynamic wave–deck interactions of T- and box girder decks under the same wave conditions, and investigated the dynamic responses of the two types of bridge decks and the effects of hydrodynamic parameters on the wave–deck interactions under different wave conditions through 54 numerical experiments based on this model.
In addressing the challenge of bridge superstructures subjected to hurricane waves and storm surges, current studies have applied a mix of experimental and numerical simulation methods to examine the impact of wave forces on bridge superstructures. However, the focus of these studies lay predominantly on the plate-ribbed girder structure. There exists a noticeable gap in the research concerning the box girder, which is a prevalent structural form for bridges spanning the sea. Moreover, the primary environment considered in these studies is that of a flat seabed. This contrasts with the more complex and realistic conditions of the undulating seabed characteristic of coastal regions.
In view of the deficiencies in the above research status quo, this study primarily focuses on the extreme wave force situation experienced by the box-girder bridge superstructure. It considers the influence of multiple wave–current parameters on the wave–bridge superstructure actions through a test of extreme wave actions on the box girder, it also verifies its validity in combination with the experimental data and analyzes the dynamic response of the box girder structure using the regular wave time range loads obtained by the potential flow theoretical computational method. The main research content of this paper includes the following:
- (1)
- A 1:30 numerical model is established using the potential flow theory method to study the force mechanism of the box girder structure under the action of hurricane waves and verify its validity with test data.
- (2)
- A numerical simulation of the regular waves on the box girder superstructure is carried out to study the influence of parameters such as slope gradient, distance of box-girder bridge from the slope, inundation depth, effective wave height, and effective period of the wave force on the box girder structure, as well as analyze the characteristics of the wave force.
The focus of this paper is on structural loading effects, and an approximate simulation model based on regular waves is constructed in Section 2. Section 3 confirms the accuracy of the model by comparing it with the experimental data. In Section 4, the effects of wave loading on the box girder superstructure are deeply investigated by changing the parameters such as the inclination of the sloping seabed, the distance between the bridge and the slope, the coefficient of submergence, the effective wave height, and the effective period. This section provides an in-depth study of the time–distance characteristics, frequency-domain characteristics, statistical laws, and force mechanisms of box girder structures under hurricane wave conditions.
2. Numerical Model
2.1. Governing Equation
The current numerical model employs the Reynolds-averaged Stress (RAS) and the standard k-omega turbulence models, previously validated in studies on wave impact structures. It should be recognized that utilizing a Large Eddy simulation (LES) turbulence model could enhance the accuracy and precision of the simulations. Furthermore, the k-omega model was chosen for this study due to several reasons. Firstly, the k-omega model offers a good balance between computational cost and accuracy, which is crucial for extensive parametric studies [24]. Secondly, the k-omega model is well validated for various engineering applications, including wave–structure interactions, providing reliable results with reasonable computational resources [25,26]. Lastly, the k-omega model’s ability to handle both high Reynolds number flows and accurately capture flow characteristics near walls makes it suitable for the wave impact scenarios considered in this research [27,28].
In this study, water is treated as an incompressible viscous fluid. The fluid motion is described using the Reynolds-averaged Navier–Stokes (RANS) equations as follows:
In these equations, denotes the directional axis in the Cartesian coordinate framework, symbolizes the averaged velocity component along the axis, and represents the velocity fluctuations in the direction. stands for the density of the fluid, is the average pressure, denotes the dynamic viscosity of the fluid, signifies the moment source in the direction, and is the Reynolds’ stress computed as per the equation below:
In this context, is the turbulent viscosity, and is the Kronecker delta function [19] (when , , when , ).
In this context, is the turbulent viscosity, and is the Kronecker delta function.
To resolve the RANS equations, this study employs a shear stress transport (SST) k-ω turbulence model within the fluid-structure interaction (FSI) framework. Recognized for its proficiency in handling flows with high Reynolds’ numbers as well as accurately capturing the flow characteristics in the low Reynolds’ number regions near the walls, this turbulence model is extensively utilized. It includes the transport equations for turbulent kinetic energy k and the rate of turbulent dissipation ω, as delineated below:
where and signify the effective diffusivities of and , respectively. and are the production terms of and , attributed to the mean velocity gradients, whereas and relate to the dissipation rates of and . denotes the cross-diffusion term. Additionally, and are user-specified source terms. The fluid’s governing equations are discretized using the Finite Volume (FV) method, and the interface between water and air is modeled using the Volume of Fluid (VOF) approach [29].
According to Le Méhauté [30], Stokes and elliptical cosine waves are bounded by , where and waves have wavelengths and wave heights in still water and is the depth of still water. The wave parameters of the regular wave used in this paper satisfy , which belongs to the applicable range of Stokes wave. In this study, this parameter is . Therefore, the Stokes wave theory is chosen to generate the regular wave in the numerical model. For the second-order Stokes wave, the corresponding source function is as follows:
where denotes the wave phase velocity, denotes the area of the source term region, denotes the wave height, denotes the wave number, denotes the denotes the wave frequency, and denotes the depth. The above values of , and are the corresponding parameters in still water [8].
2.2. Model Setup
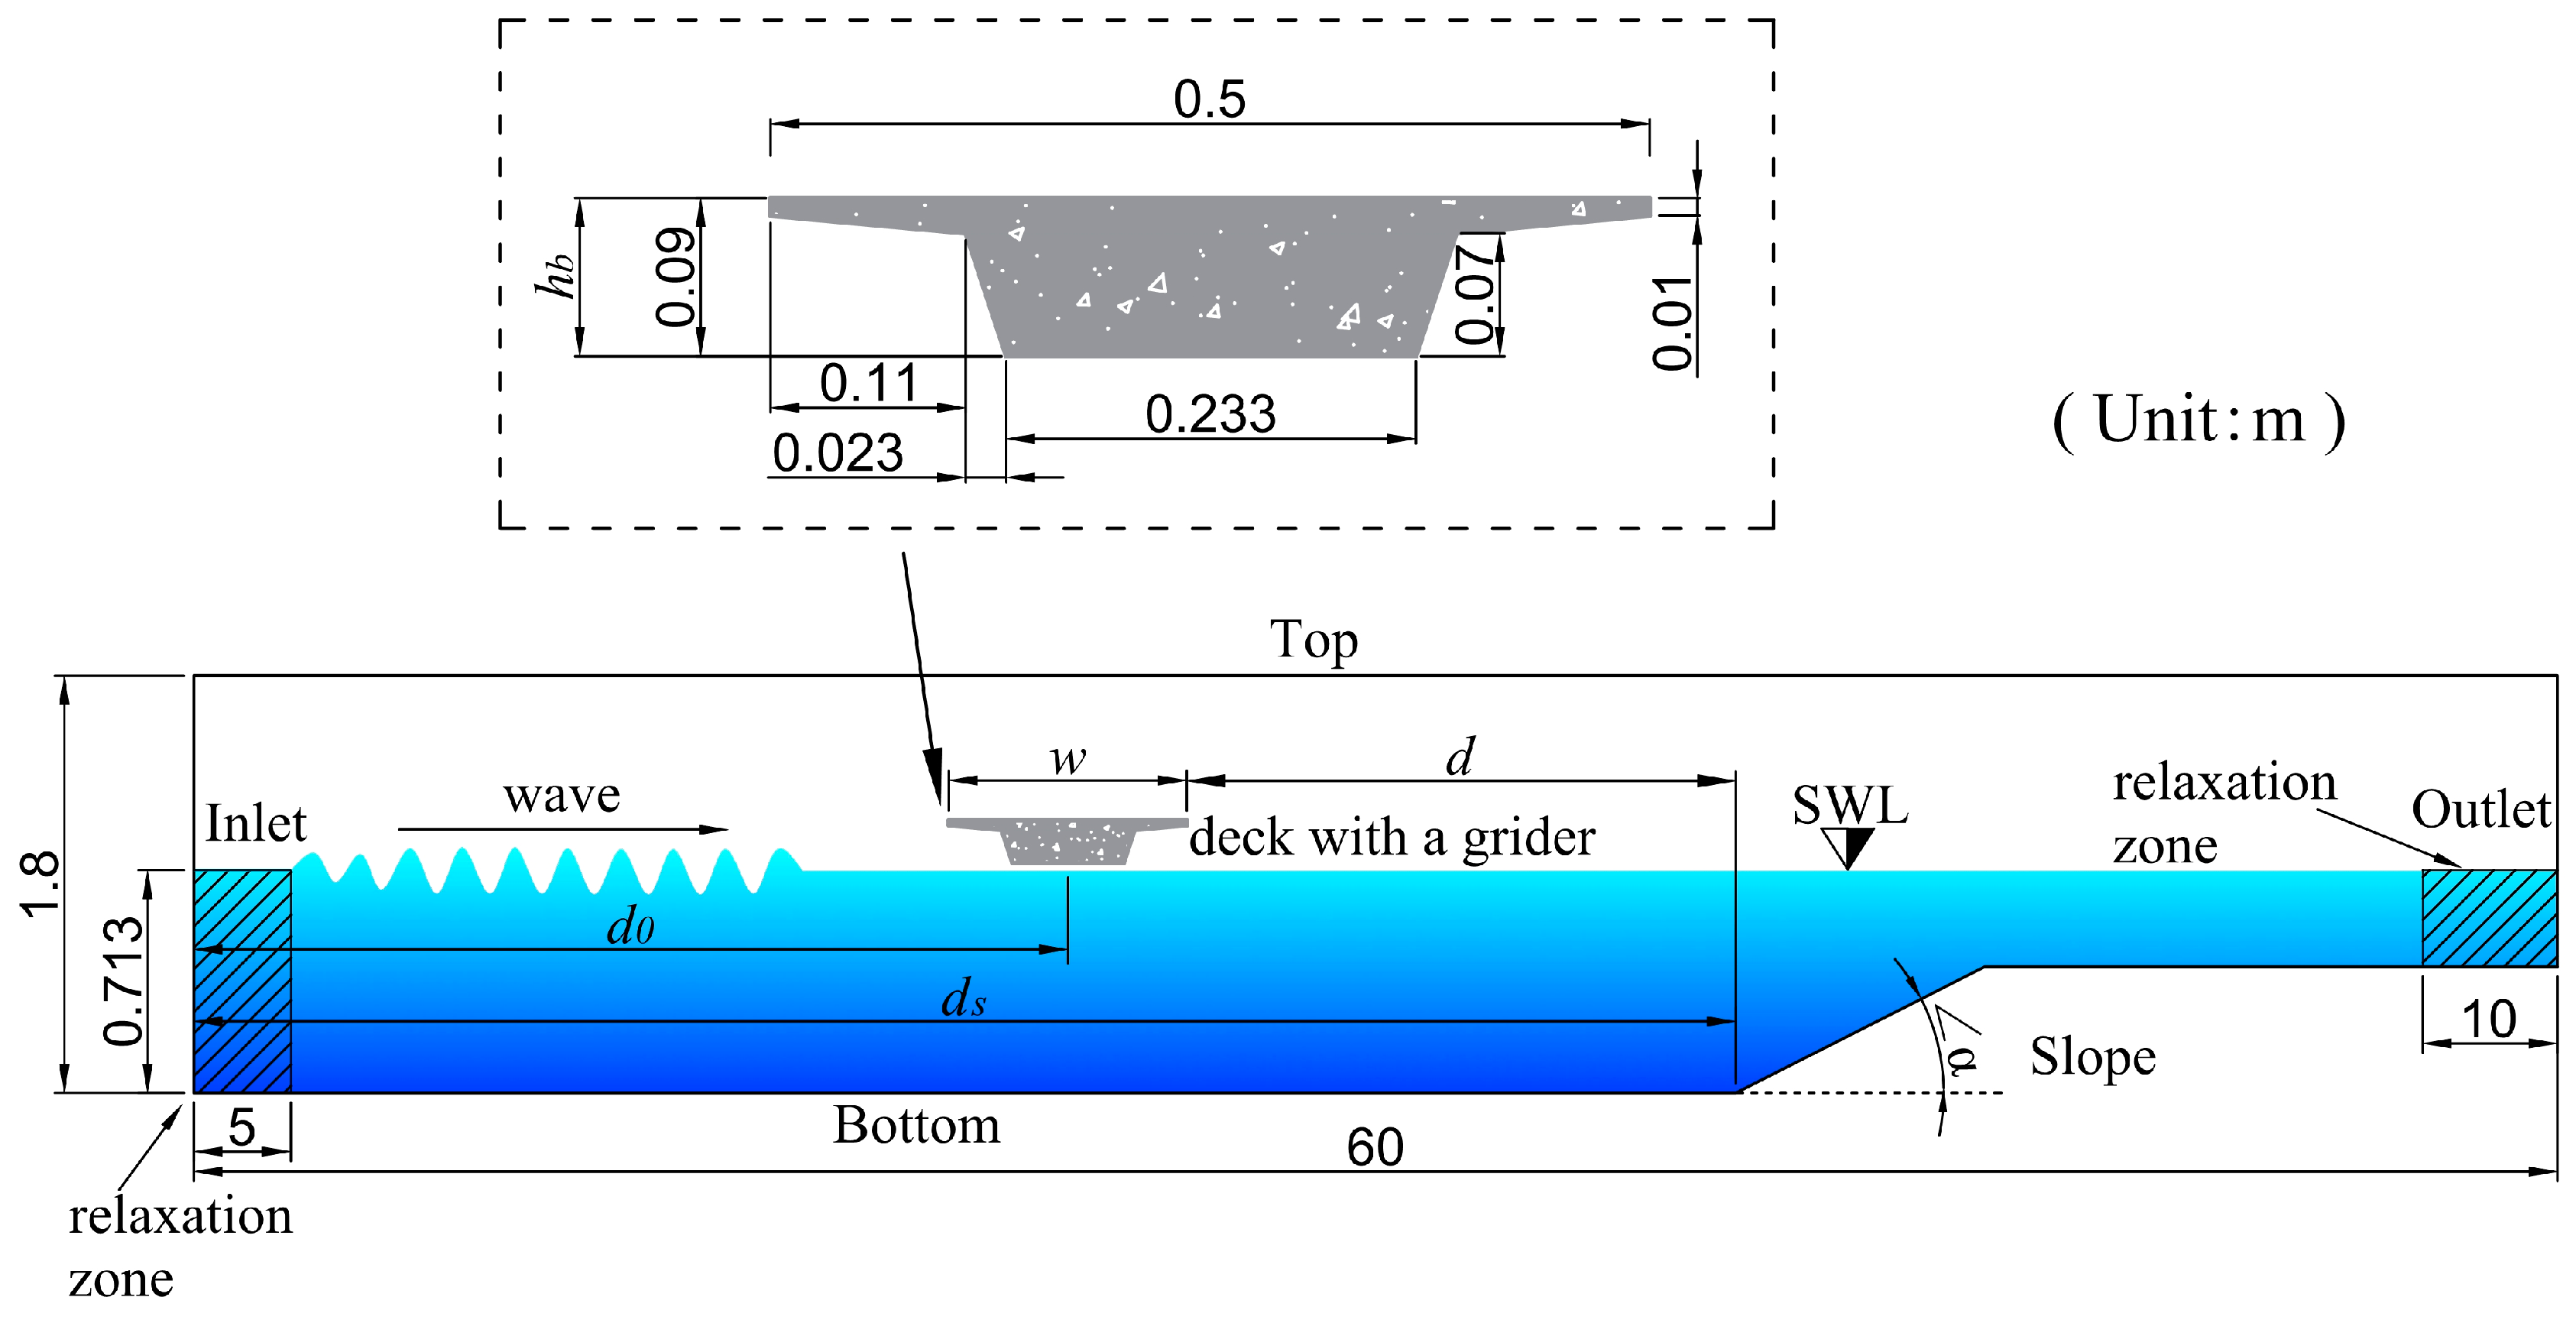
The 2D numerical wave tank is depicted in Figure 1, with the dimensions of 60 m in length and 1.8 m in height. Given that OpenFOAM-v1912 operates within a 3D Cartesian coordinate system, defining the third dimension’s size is essential. For this model, the third dimension is chosen as 1.2 m. To simulate a 2D environment, the model sets the third dimension’s mesh count to 1 and labels the third dimension’s boundary as “empty”. This approach effectively transforms the 3D model into a 2D model, allowing for the calculation of structural properties, like mass, and hydrodynamic forces on the beam, assuming a uniform length of 1 m.
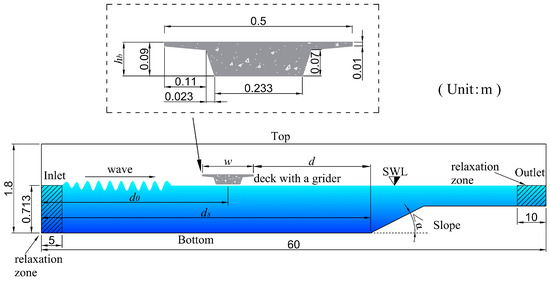
Figure 1.
Sketch of arrangements in the wave flume and the superstructure.
The tank’s inlet is designed as a velocity inlet boundary, while its top is defined as “total pressure” to align the gas-phase pressure with the operational pressure. A relaxation technique is employed to minimize the reflected wave effects, installing relaxation zones of 5 m and 10 m lengths downstream of the inlet and upstream of the outlet, respectively. In this study, the seabed was simplified to a single slope to focus on the interaction of wave forces with bridge decks, which is a common practice in hydrodynamic simulations [25]. With this simplification, it is possible to carry out a detailed parametric analysis of wave impact on the bridge deck located ahead of the slope, similar to the treatments employed by Fang et al. [31] and Gao et al. [32]. It is suggested to study the influence of the real-world seabed on wave forces in the future [33].
The beam model is positioned 28.5 m downstream from the inlet, with its elevation adjusted based on the beam sinking factor, which is the ratio of the distance from the beam’s bottom surface to the static water level, compared to the beam’s depth. The water depth is maintained at 0.713 m, with the beam’s total depth fixed at 9 cm. This study considers four beam sinking coefficients (Cs = 0, 0.25, 0.5, 1).
A schematic of the numerical wave flume shows the girder’s box cross-section design, typical of a sea-crossing bridge’s approach bridge. The girder measures 0.5 m in width, 9 cm in height, with a deck thickness of 1 cm, and a base plate width of 23.3 cm. Further details on the 2D numerical wave flume’s dimensions are elaborated upon below:
2.3. Mesh Update Method
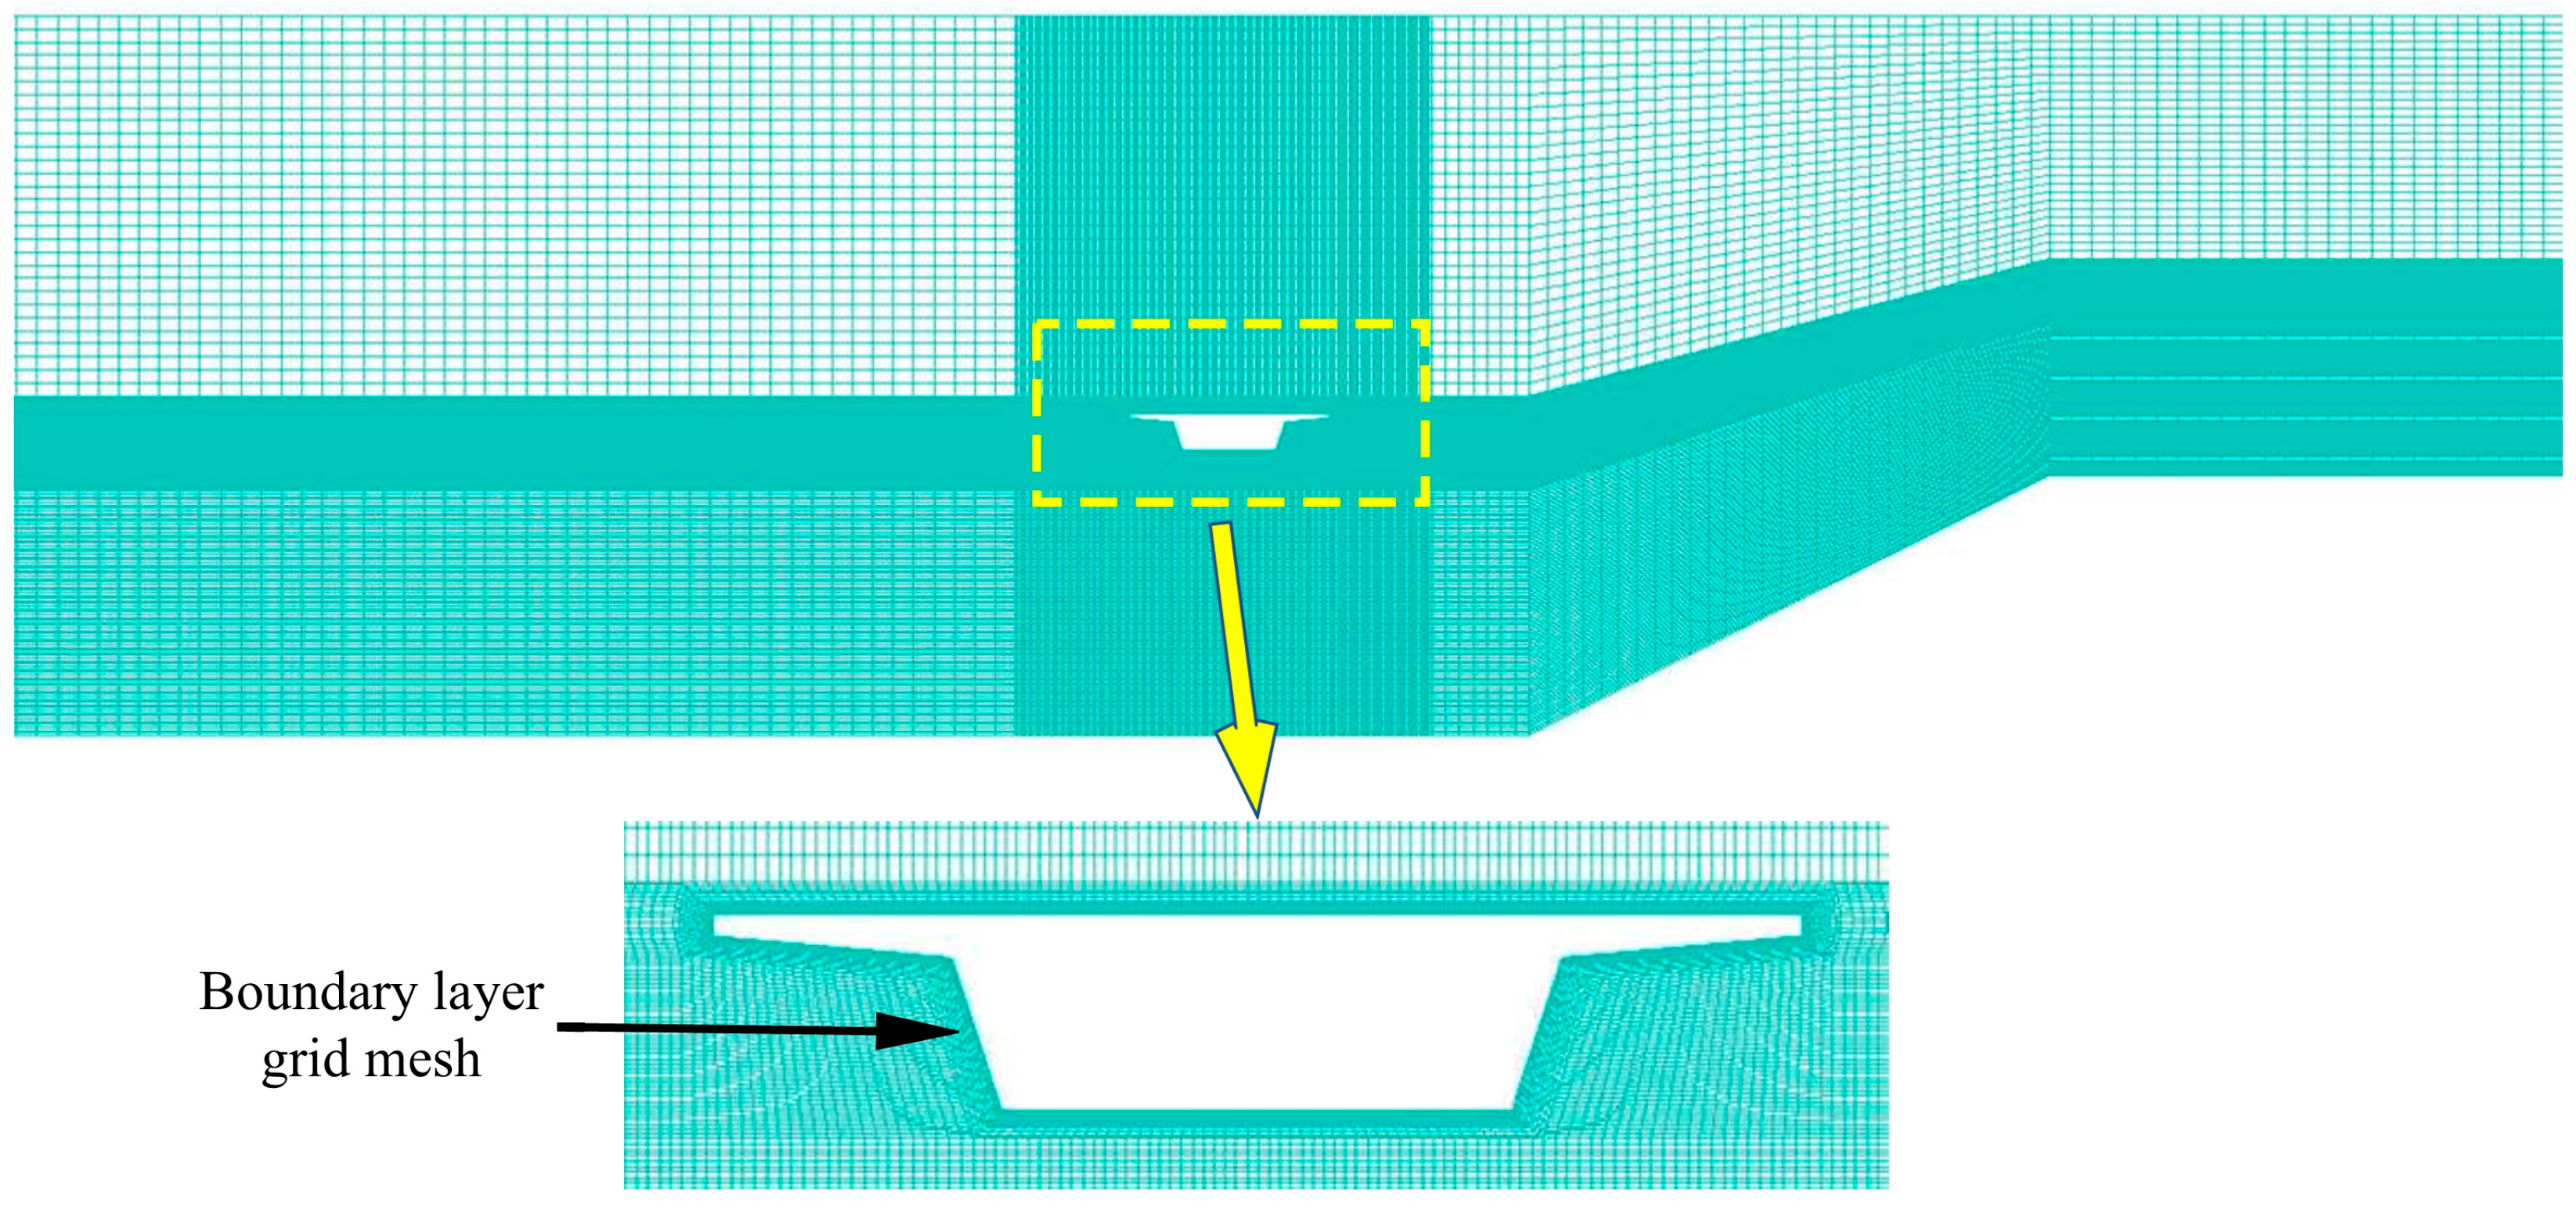
The calculations used a structured grid with a detailed boundary layer grid right next to the structural model’s walls, as shown in Figure 2. The first grid cell’s height was determined by the y+ value, a dimensionless boundary distance, ensuring that it was around 30. This control over the y+ value and the use of the Scalable wall function help maintain the accuracy of the velocity and pressure fields close to the wall. Before the final calculations, preliminary tests with different mesh sizes were conducted to determine how sensitive the results were to changes in the mesh. These tests varied the mesh size in the x-direction (dx = 0.01 m, dx = 0.005 m, dx = 0.0025 m) and in the y-direction (dy = 0.05 m, dy = 0.025 m, dy = 0.002 m, dy = 0.001 m) to see how they affected wave force calculations. Table 1 lists the cell information, computation time, and maximum vertical wave force for each grid setup under wave conditions of H = 0.1 m, T = 1.68 s, and Cs = 1. It is important to note that dx and dy refer to the grid sizes near the structure as mentioned in Table 1, with the surrounding grid sizes being consistent. The findings indicate little difference in the wave forces between Trial Case 3 and Trial Case 4, and the wave heights had a margin of error of within 5%. Thus, for accuracy and efficiency, the final numerical simulation adopted specific grid parameters as follows: dx = 0.05 m, 0.005 m, and 0.05 m for the horizontal grid scale across the three areas near the velocity inlet, near the structure, and in the far-field area, respectively. The vertical grid scales were set to dy = 0.02 m for the air region, dy = 0.002 m for the gas–liquid interface near the structure, and dy = 0.005 m for the deepwater area. The grid length-to-width ratios were kept at 2.5, and the timestep was fixed at 0.001 s. The height of the first grid cell by the box girder boundary, aligning with a y+ value of about 30, ensures the model’s accuracy.
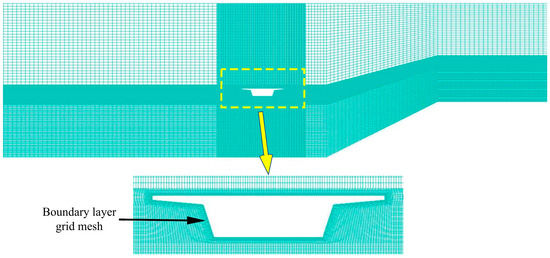
Figure 2.
Grid mesh near the bridge model.

Table 1.
Mesh information.
2.4. Test Plan
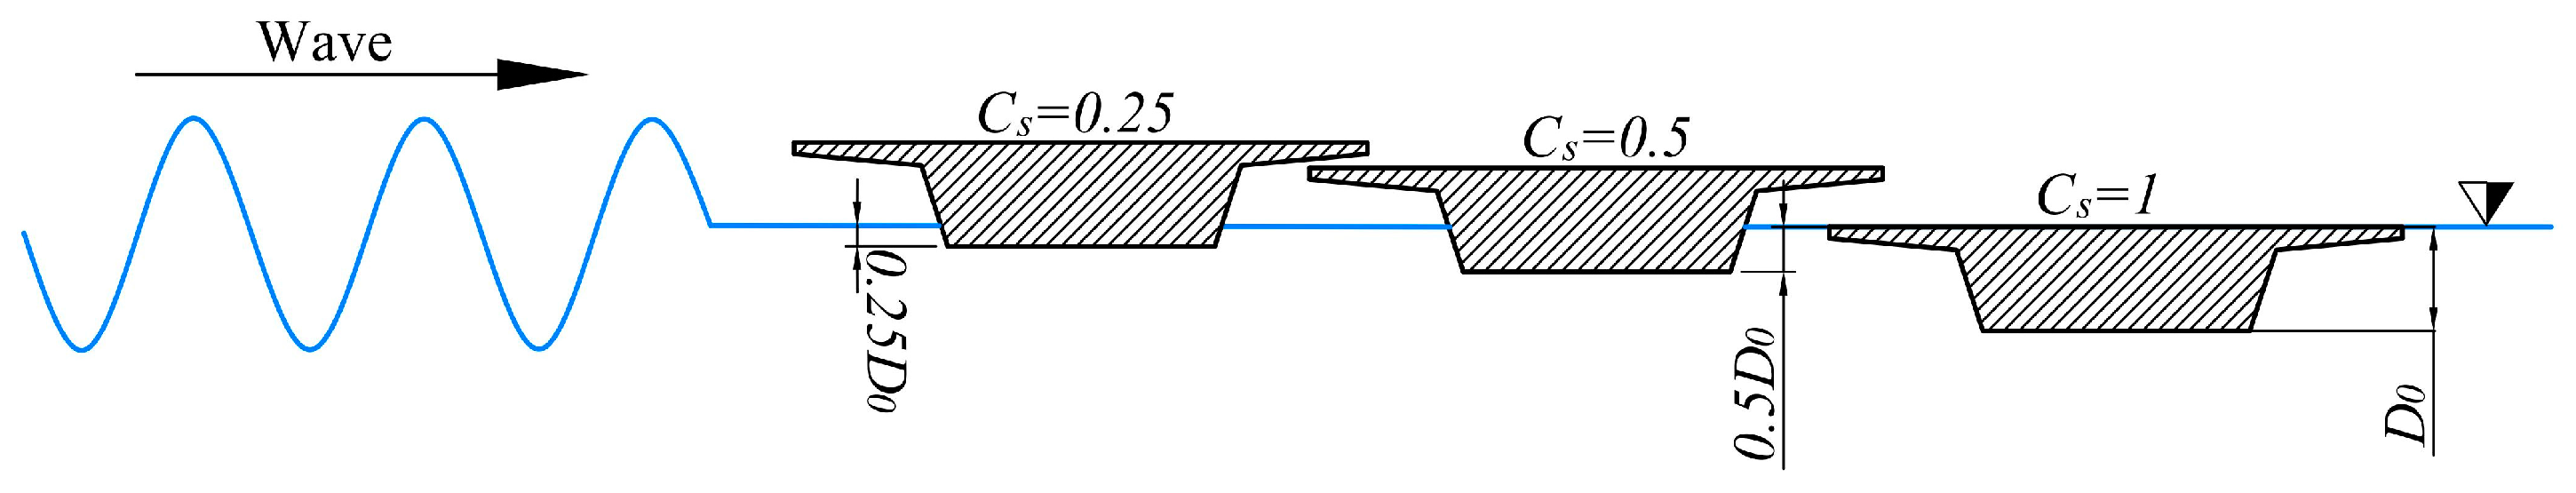
In this study, the extreme wave conditions were simulated using water depth d = 0.713 m, generating Stokes order II waves with the wave height H = 0.1 m and period T = 1.68 s. For the flume section, the slope gradient had a large influence on the geometric properties of the flume, which in turn affected the wave characteristics, considering that the six gradients of the slope from 1:1 to 1:6, which are reflected in Table 2, and the distance between the slope and the bridge model affect the superposition of the waves at the bridge’s location, which in turn affects the performance of the girder in the waves’ action. Furthermore, the distance between the bridge model and the slope was from 0.5 to 5.5 m for a total of 6, which is reflected in Table 3 and normalized to ε. As for the girder model, three submergence coefficients Cs = 0.5, 0.25, and 1 were considered. Figure 1 provides a visualization of distance and slope, while Figure 3 provides a clear visual representation of the submergence coefficients. The submergence coefficients are defined as the ratio of the distance between the bottom plate of the girder and the hydrostatic level to the total height of the girder.
Table 2.
Inclination of the sloping seabed.
Table 3.
The distance between the bridge deck and the sloping seabed.
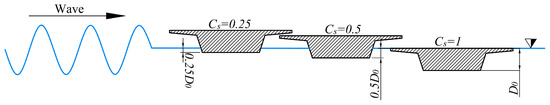
Figure 3.
Schematic diagram illustrating the coefficient of submergence.
3. Model Validation
The study carried out multiple validation exercises to evaluate the accuracy and reliability of its methods. These exercises concentrated on two primary areas, namely wave surface characteristics and wave force components.
3.1. Wave Surface Characteristics
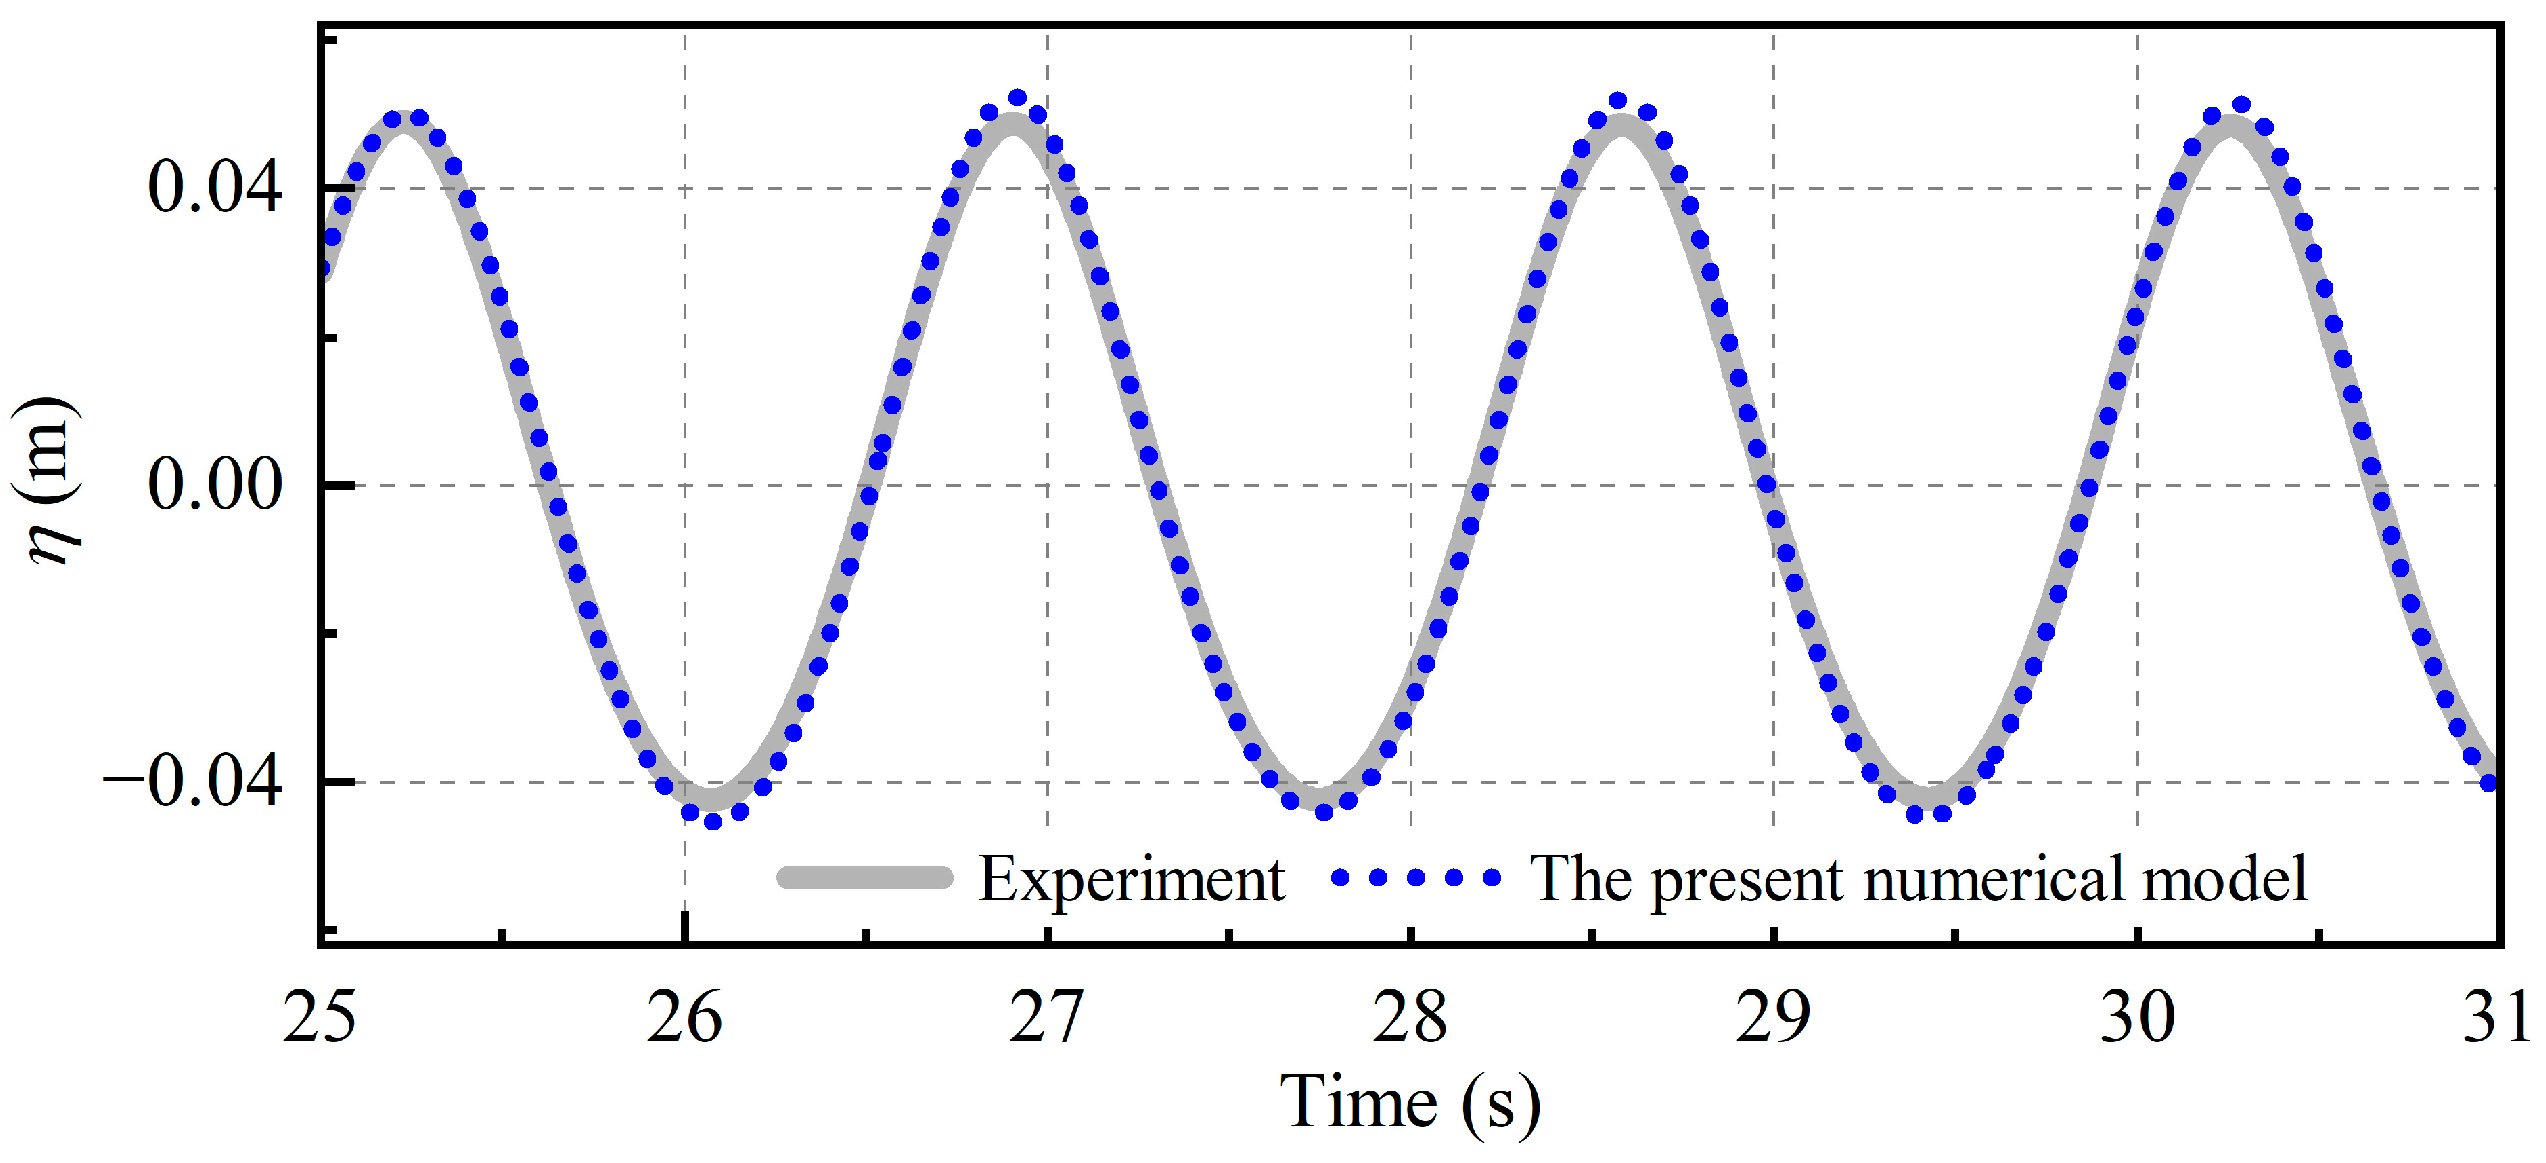
In this investigation, we simulated regular wave conditions with a peak wave height of H = 0.1 m and a wave period of T = 1.68 s, while maintaining a constant water depth of d = 0.1 m. To assess the accuracy of the wave simulations, the wavefront at x = 30 m was monitored without incorporating a beam representation. Figure 4 presents a comparison between the numerically simulated experimental data from Zhang et al. [8] and the analyzed wave height.
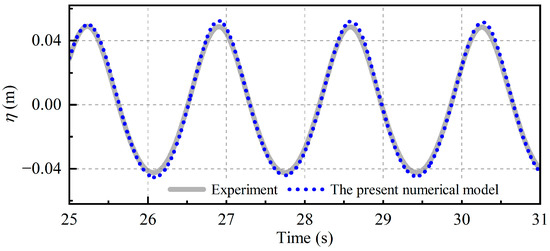
Figure 4.
Time series of free-surface wave elevations for a wave with H = 0.1 m and T = 1.68 s.
The comparison reveals a strong alignment in both the wave shape and peak values, with the greatest difference in magnitude being merely 4.3%. This validation process demonstrates that our numerical model precisely replicates the characteristics of the waves.
3.2. Wave Force
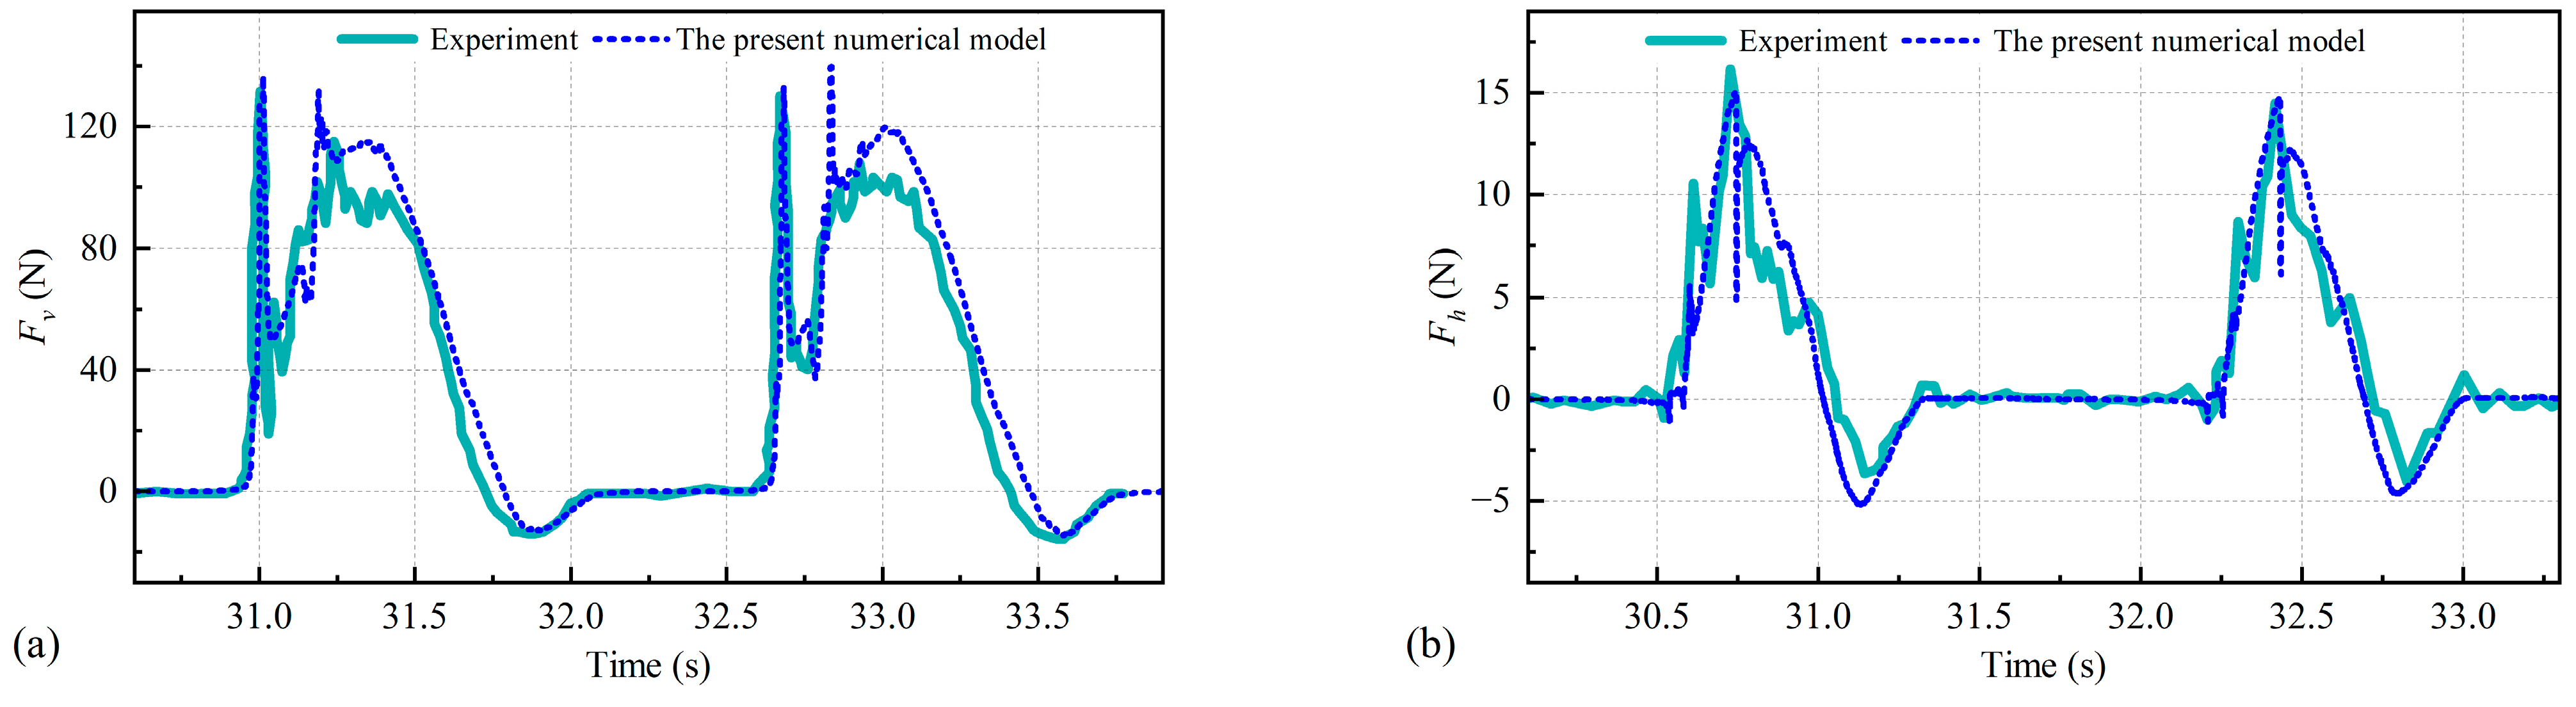
Analyzing the components of wave force facilitates an understanding of the dynamics of the wave force variations. This section provides a preliminary analysis of the wave force timeline obtained from testing, with Figure 5 displaying the variation in the wave force overtime on a box girder that was subjected to various degrees of inundation and flow velocities under the wave conditions of H = 0.1 m and T = 1.68 s. The wave force data align with test measurements on a per linear meter basis. The overall force trend reveals a composition of a quasi-static force that slowly changes with the wave period and a high frequency slamming force, markedly exceeding the wave frequency. Previous experimental studies have attributed the low-frequency quasi-static force to the prolonged action of waves, whereas the high-frequency slamming force results from the momentum transfer on the wave surface. The accuracy of the calculated wave force is confirmed by comparison with experimental data from Zhang et al. [8].
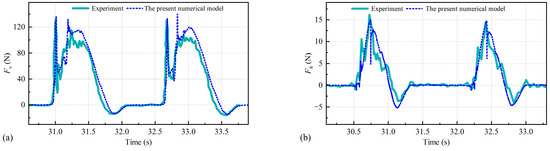
Figure 5.
Comparison of (a) vertical and (b) horizonal wave forces acting on the bridge deck between the numerical and experimental results.
4. Results and Discussion
4.1. Comparative Analysis
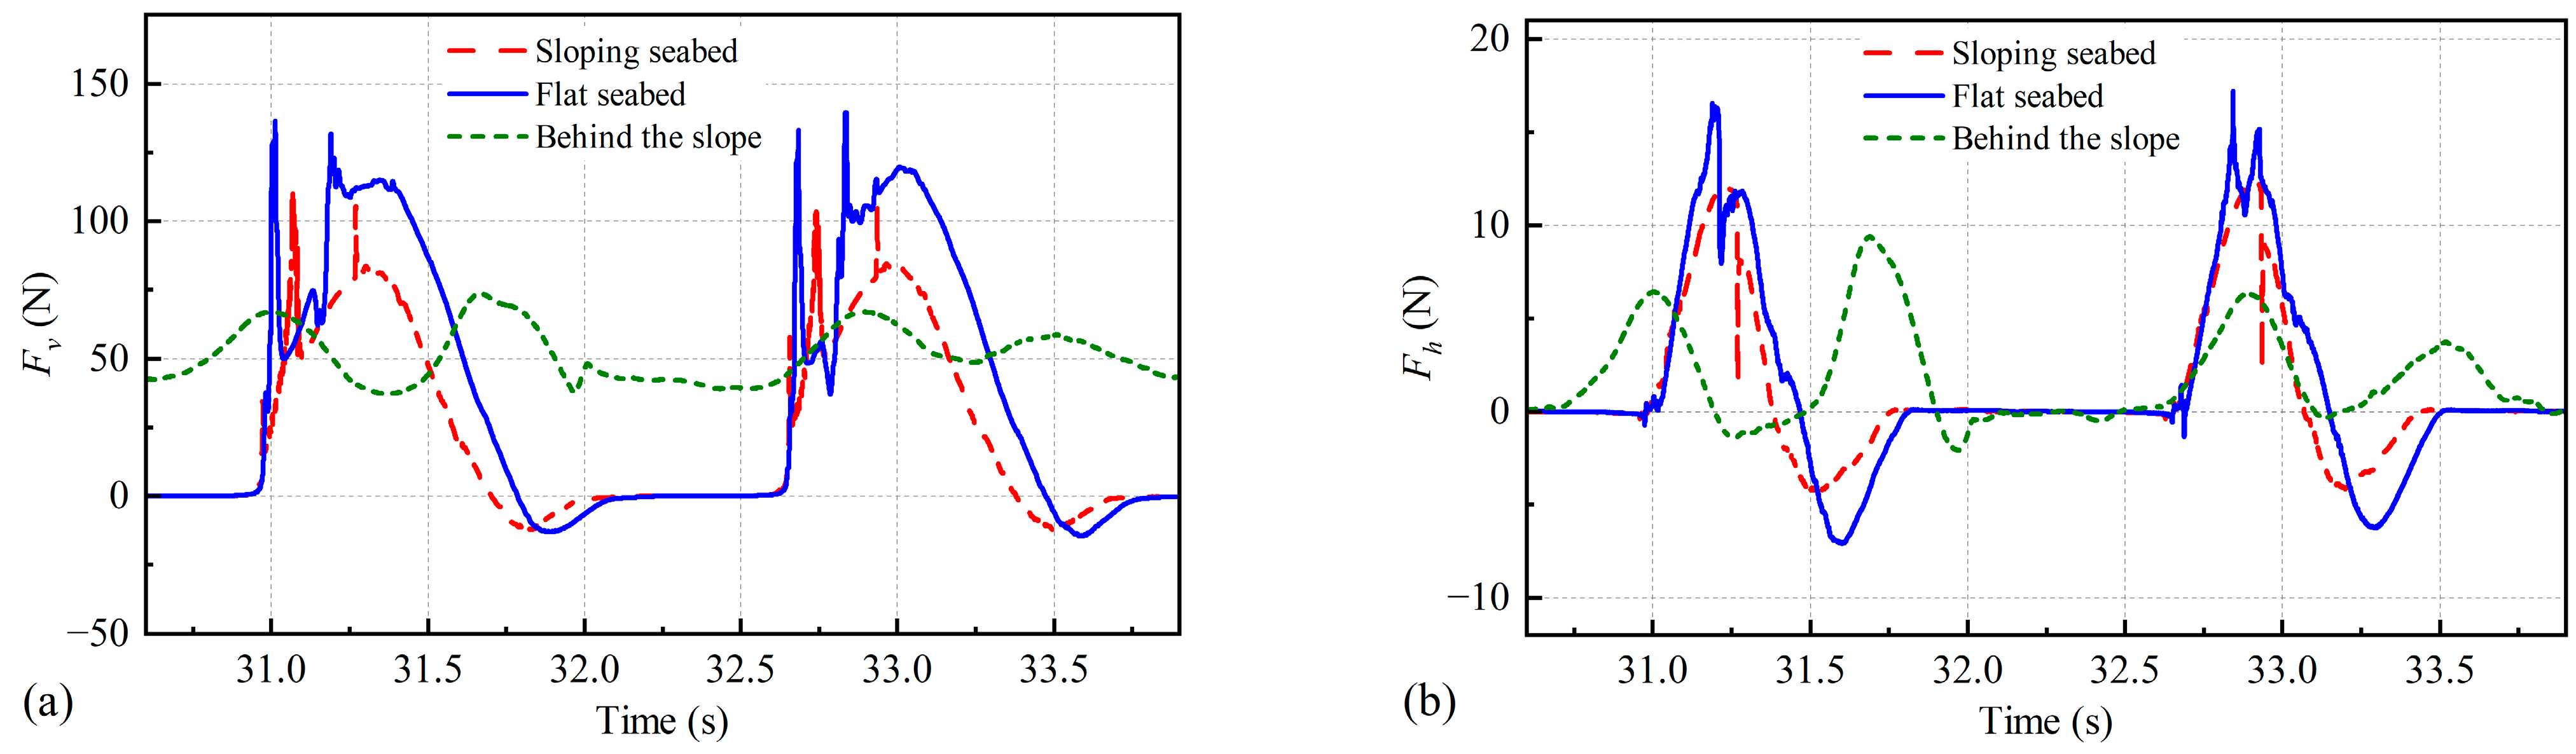
Figure 6 shows three different simulated experimental conditions (flat bottom, bridge before the slope, bridge after the slope) for the same wave parameters, submersion coefficient, and slope (inclination is 1:2, wave height H = 0.1 m, the wave period is 1.68 s, the coefficient of submergence is Cs = 0) and the time history diagram of vertical and horizontal forces. The influence of wave force on the box-girder bridge under the condition of the sloping seabed is different from that of the flat seabed, especially in terms of the characteristics of wave force and maximum force.
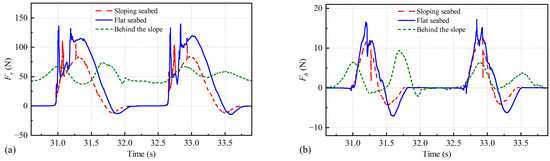
Figure 6.
Comparison of (a) vertical wave forces and (b) horizontal wave forces acting on bridges with the flat bottom, before the slope, and after the slope.
From a vertical force (Fv) perspective, the peak value is higher on a flat seabed than on a sloping seabed. This is due to the reflection of the incident wave on the slope surface, and the superposition of the reflected wave and the incident wave, resulting in a reduction in wave height. The peak value of the wave force on the bridge behind the slope is lower than that at the front of the slope. The wave height generally increases with the decrease in water depth due to wave shoaling. However, as waves propagate towards the shore, several factors contribute to the loss of wave energy and subsequent decrease in wave height. One of the primary factors is bottom friction, which occurs due to the interaction between the wave and the seabed. Bottom friction dissipates wave energy, resulting in a reduction in wave height as waves travel over a sloping seabed [34]. Additionally, wave breaking significantly contributes to energy loss. When waves break, the energy is dissipated as turbulence and spray, leading to a reduction in wave height [35].
Furthermore, the scattering effect caused by the sloped seabed also plays a crucial role. As wave energy is dispersed in various directions due to the slope and seabed texture, the coherent wave fronts are disrupted, leading to irregular wave patterns and a decrease in overall wave height [36,37].
From the perspective of horizontal force (Fh), the relative magnitude of its peak value is the same as that of the vertical force. However, the relative difference is smaller than the vertical force. This is because the change in the force-bearing area of the horizontal force is less obvious than the change in the action area of the vertical force with the wave height, so the relative difference of the horizontal force is small.
4.2. Dimensionless Treatment
In this study, we divided the force for each working condition by the corresponding force of the flat-bottomed model at Cs = 0, wave height of 0.1 m, and wave period T = 1.68 s.
The specific treatment was as follows:
where represents the maximum value of vertical quasi-static force for each condition, represents the maximum value of downward vertical quasi-static force for each condition, is the maximum value of horizontal quasi-static force to the right, represents the maximum value of upward quasi-static force for the flat-bottom condition, represents the maximum value of downward quasi-static force for the flat-sea-bottom condition, and represents the maximum value of horizontal quasi-static force to the right for the flat-sea-bottom condition.
4.3. The Influence of the Slope Inclination
When there is an undulation of the seabed, a certain inclination is inevitably formed. As waves propagate up the sloping seabed, reflected waves inevitably occur due to changes in water depth. The superposition of waves will result in the amplification of or reduction in wave height. Due to the different inclinations, the effect of wave reflection will be different.
Figure 7 shows the peak wave force data of different wave heights and inclination under the conditions of wave period T = 1.68 s, coefficient of submergence Cs = 0, and distance ε = 10. It can be seen from the figure that the greater the wave height, the greater the wave force the bridge will experience. The changing rules of wave force with inclination are the same for bridges with different wave heights. It can be found that the wave force significantly changes from 1:1 to 1:2. This is because in this interval, the slope is steeper, so its reflection effect is greater; thus, the steeper the slope, the higher the reflectivity. However, it can be found that the influence of different wave heights on horizontal forces is much greater than the influence of forces in other directions. Moreover, the vertical force changes little when the wave height ranges from 0.1 m to 0.15 m. This is because when the wave height is 0.15, the stress area of the bridge when it is subjected to the maximum force does not increase significantly compared to when the wave height is 0.1 m. This can be seen from Figure 8.
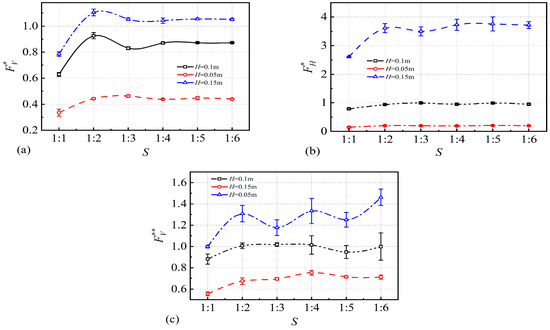
Figure 7.
Maximum (a) vertical upward (b) horizontal (c) vertical downward wave force variations at different wave heights H and heel angles when Cs = 0 and T = 1.68s.
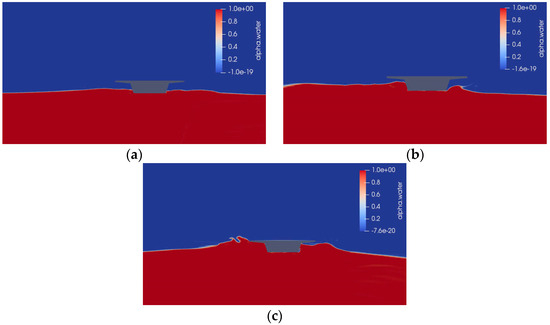
Figure 8.
Two-phase diagram at wave force maximum at three different H for S = 1:2; (a) H = 0.05 m (b) H = 0.1 m (c) H = 0.15 m.
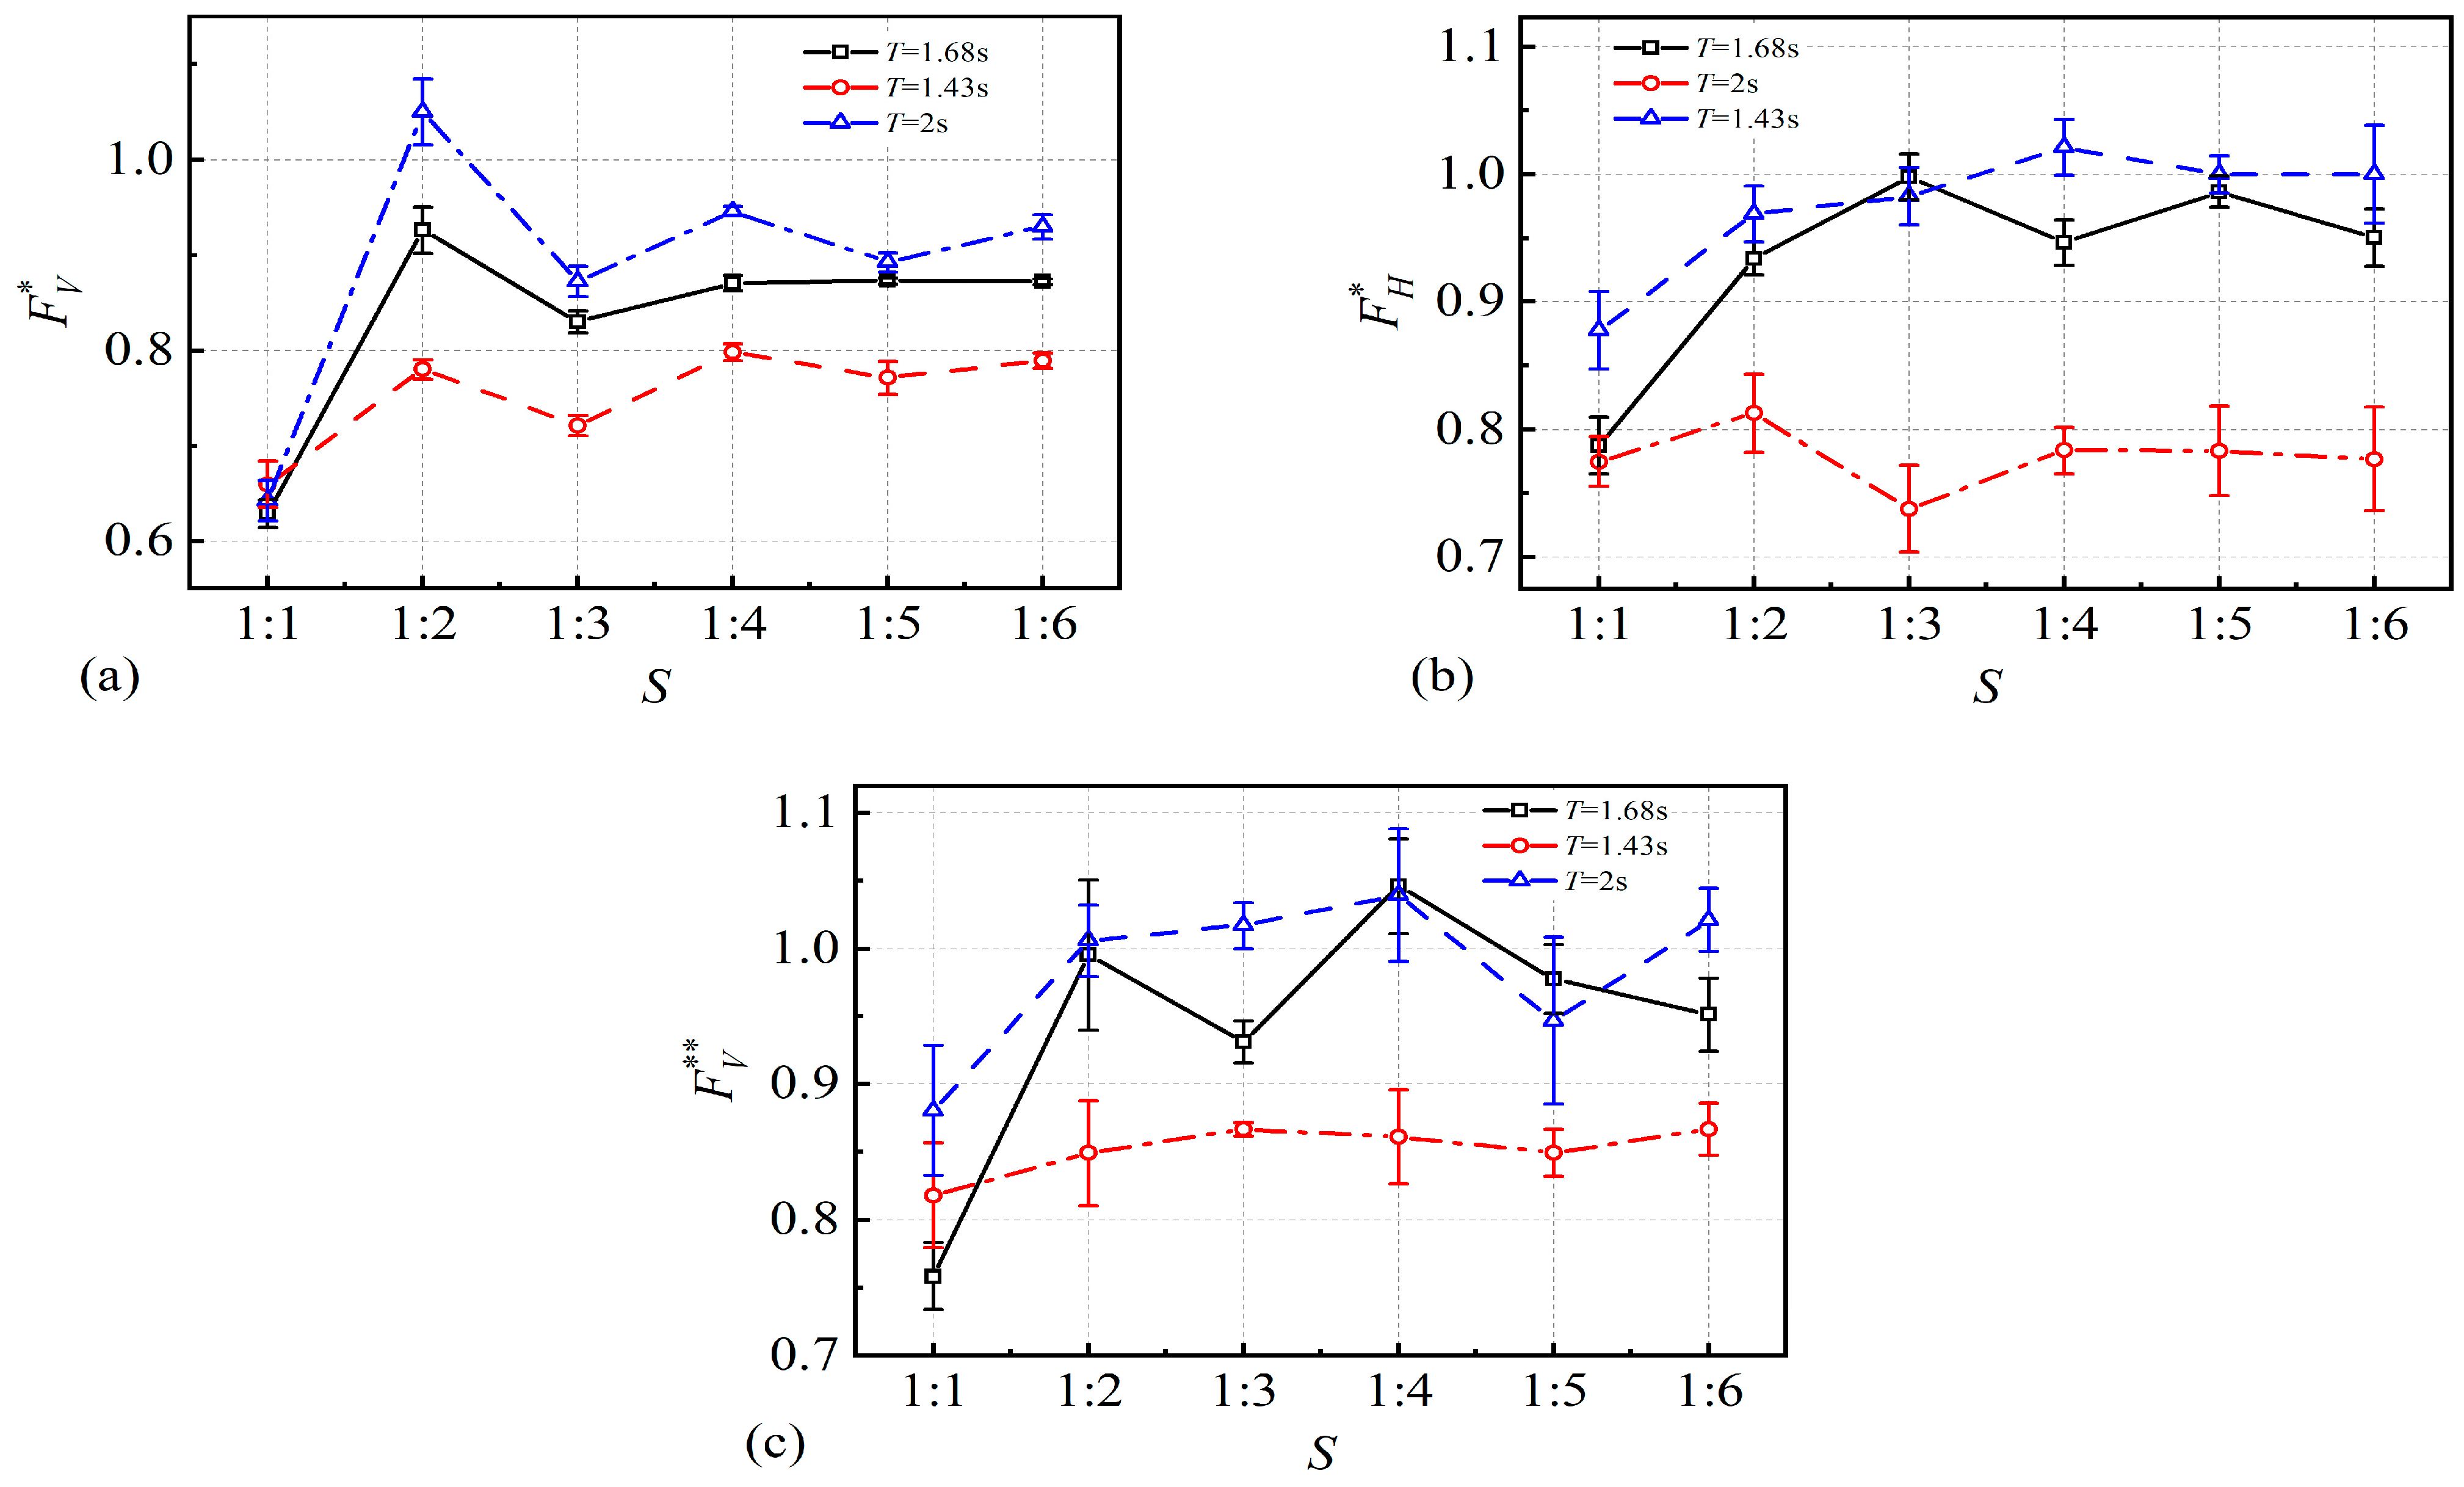
In order to study the influence of inclination on wave forces of different periods, Figure 9 shows the peak wave force data of different wave periods and inclination under the conditions of wave height H = 0.1 m, coefficient of submergence Cs = 0, and distance ε = 10. The wave force is as shown in Figure 9, the peak wave force on the box-girder bridge increases with the increase in wave period. It can be seen from the figure that the vertical wave force on the box-girder bridge increases with the increase in wave period, while the horizontal wave force decreases with the increase in the wave period. This is due to wave superposition caused by the reflection of waves on the slope. Due to the reflection of waves on the slope, the waves are superimposed at the location of the bridge (a horizontal distance of 5 m from the bottom of the slope) and the wave height is reduced. The changing trend of wave force under different wave periods is basically the same under the change in inclination. The higher the period, the greater the vertical force and the smaller the horizontal force.
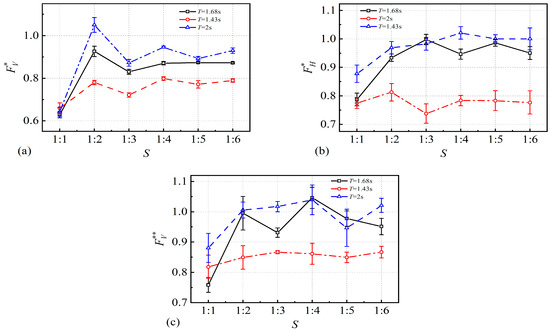
Figure 9.
Variations of the maximum (a) vertical upward, (b) horizontal, and (c) vertical downward wave forces at different wave periods and inclinations when H = 0.1 m and Cs = 0.
On the other hand, the wave period also has a great influence on the bridge stress. Taking the wave period of 2 s as an example, the horizontal force shows a relatively complex change pattern as the inclination increases. Within a certain inclination range, the change in the horizontal force is not monotonous, which may be related to the complexity of energy distribution during wave propagation. In addition, when S = 1:3, the force is always relatively small, and when S = 1:2, the force is always relatively large. This may be related to the reflection effect of the slope.
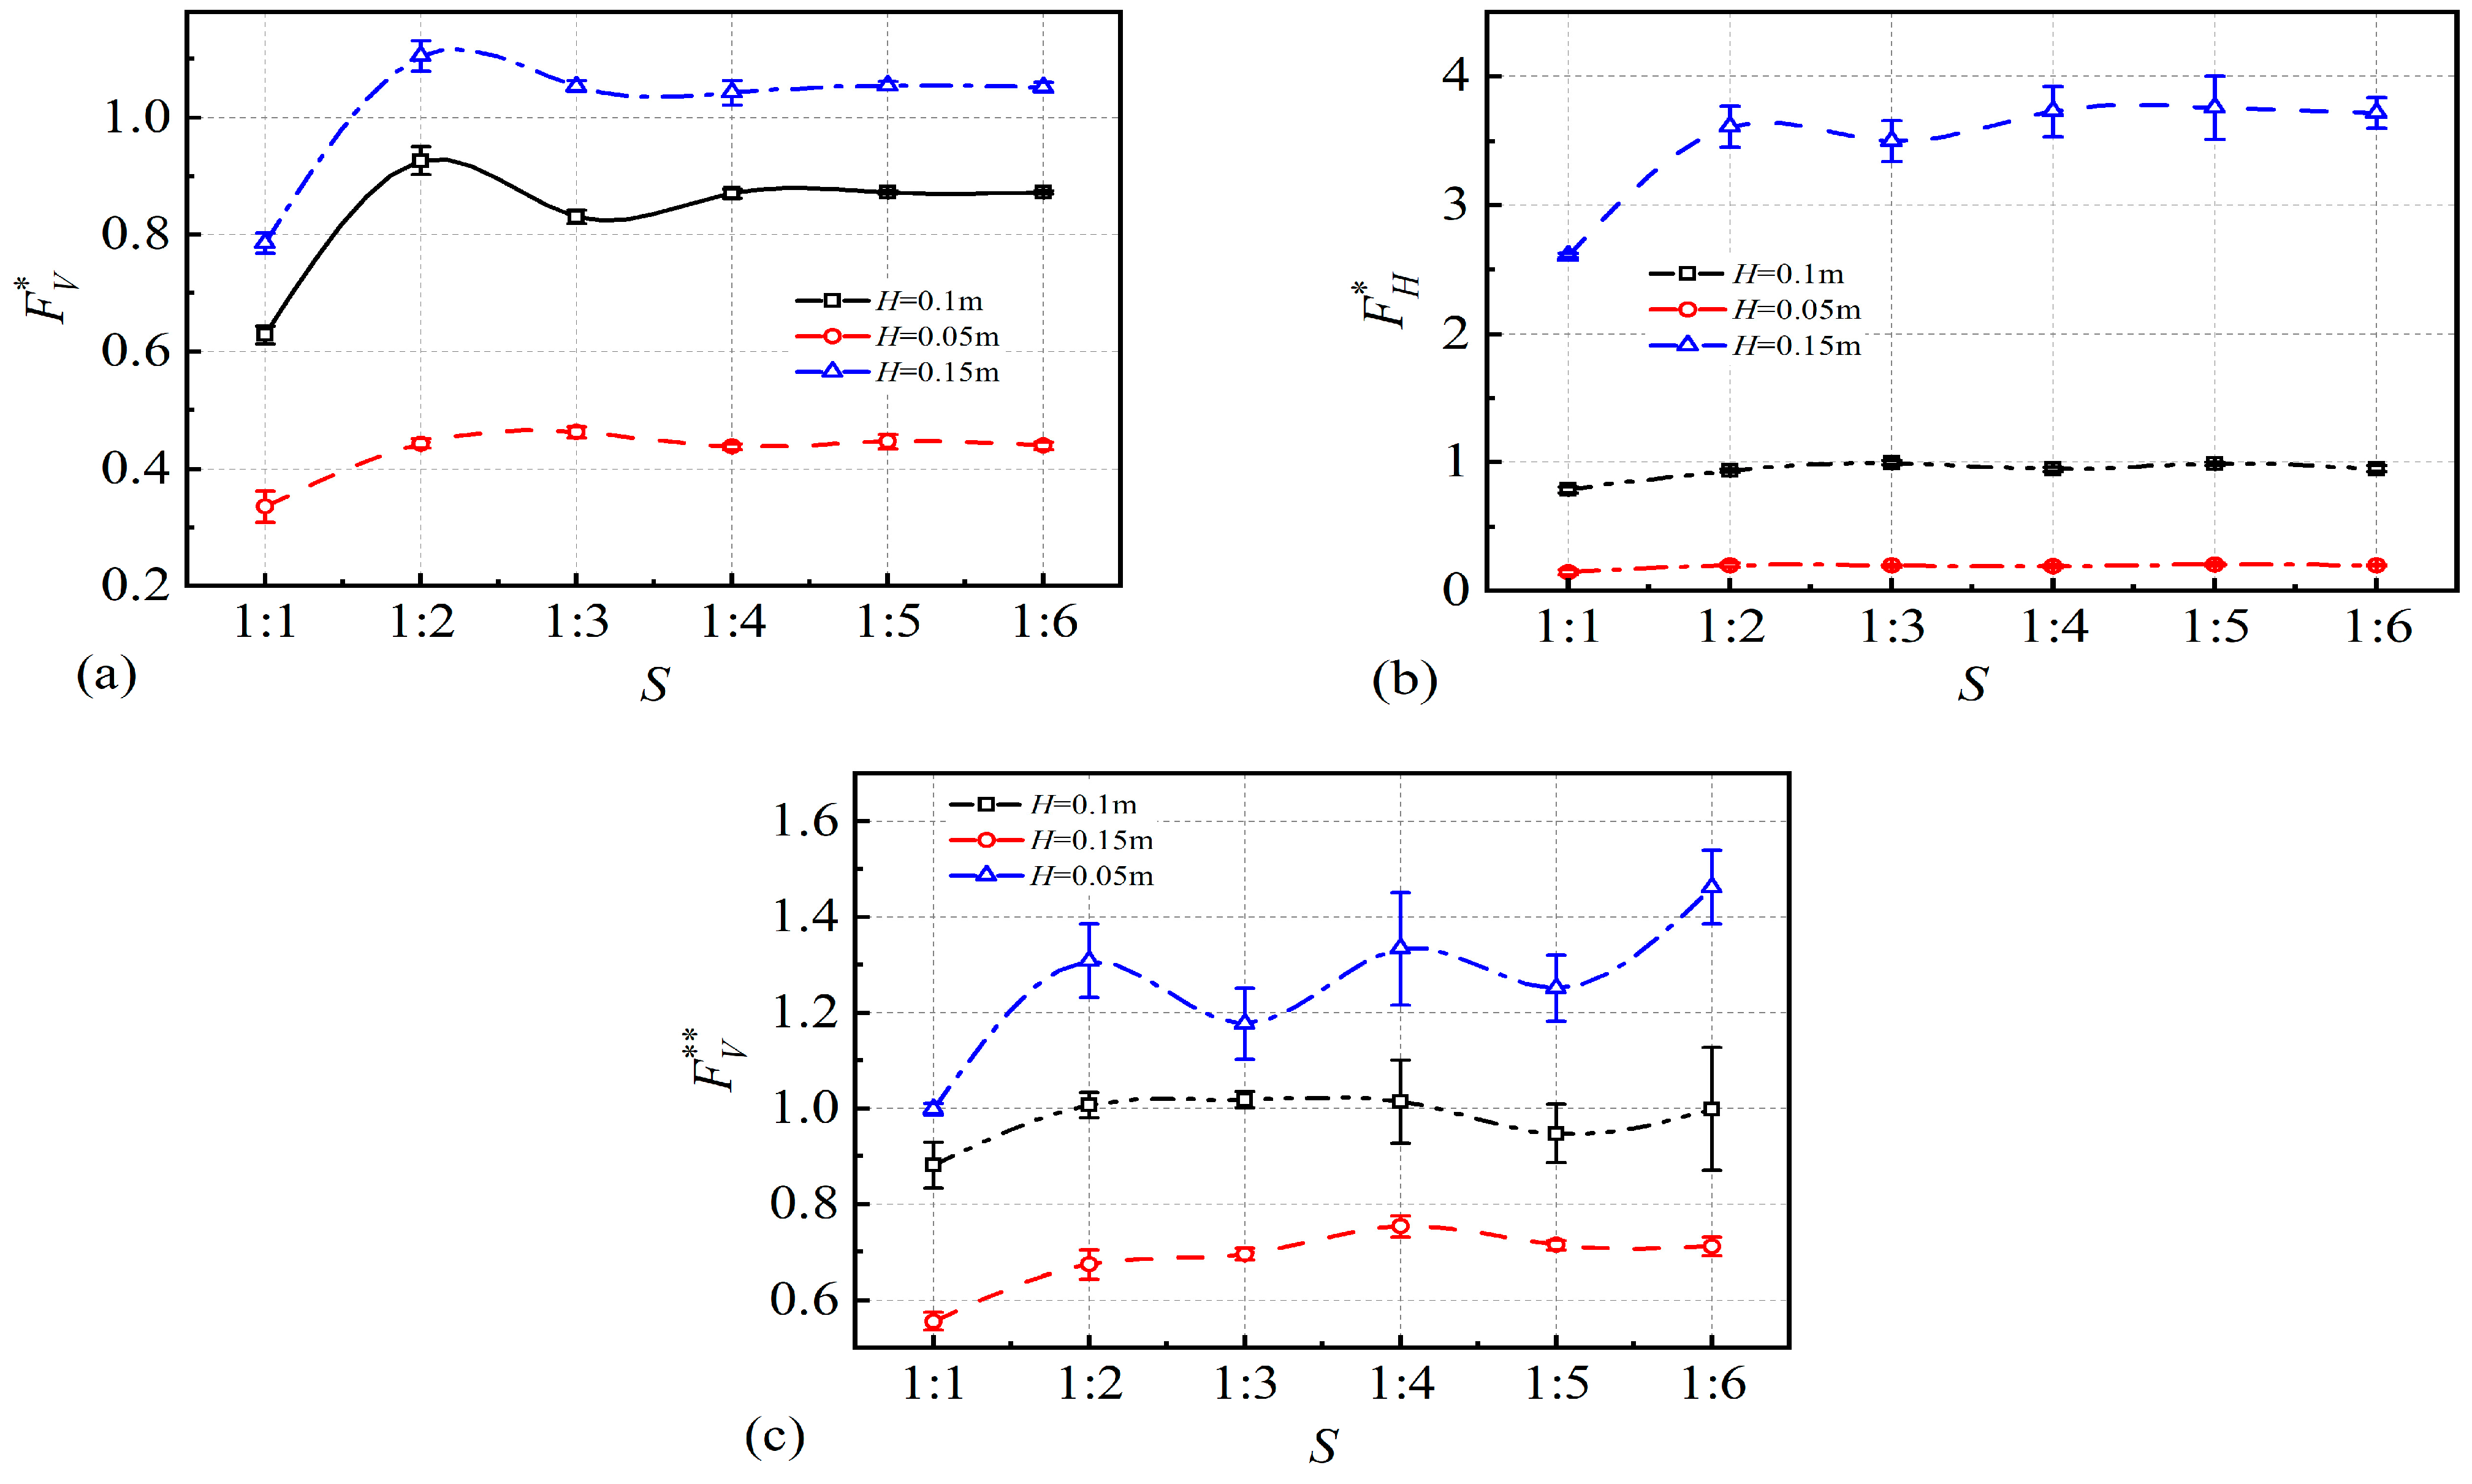
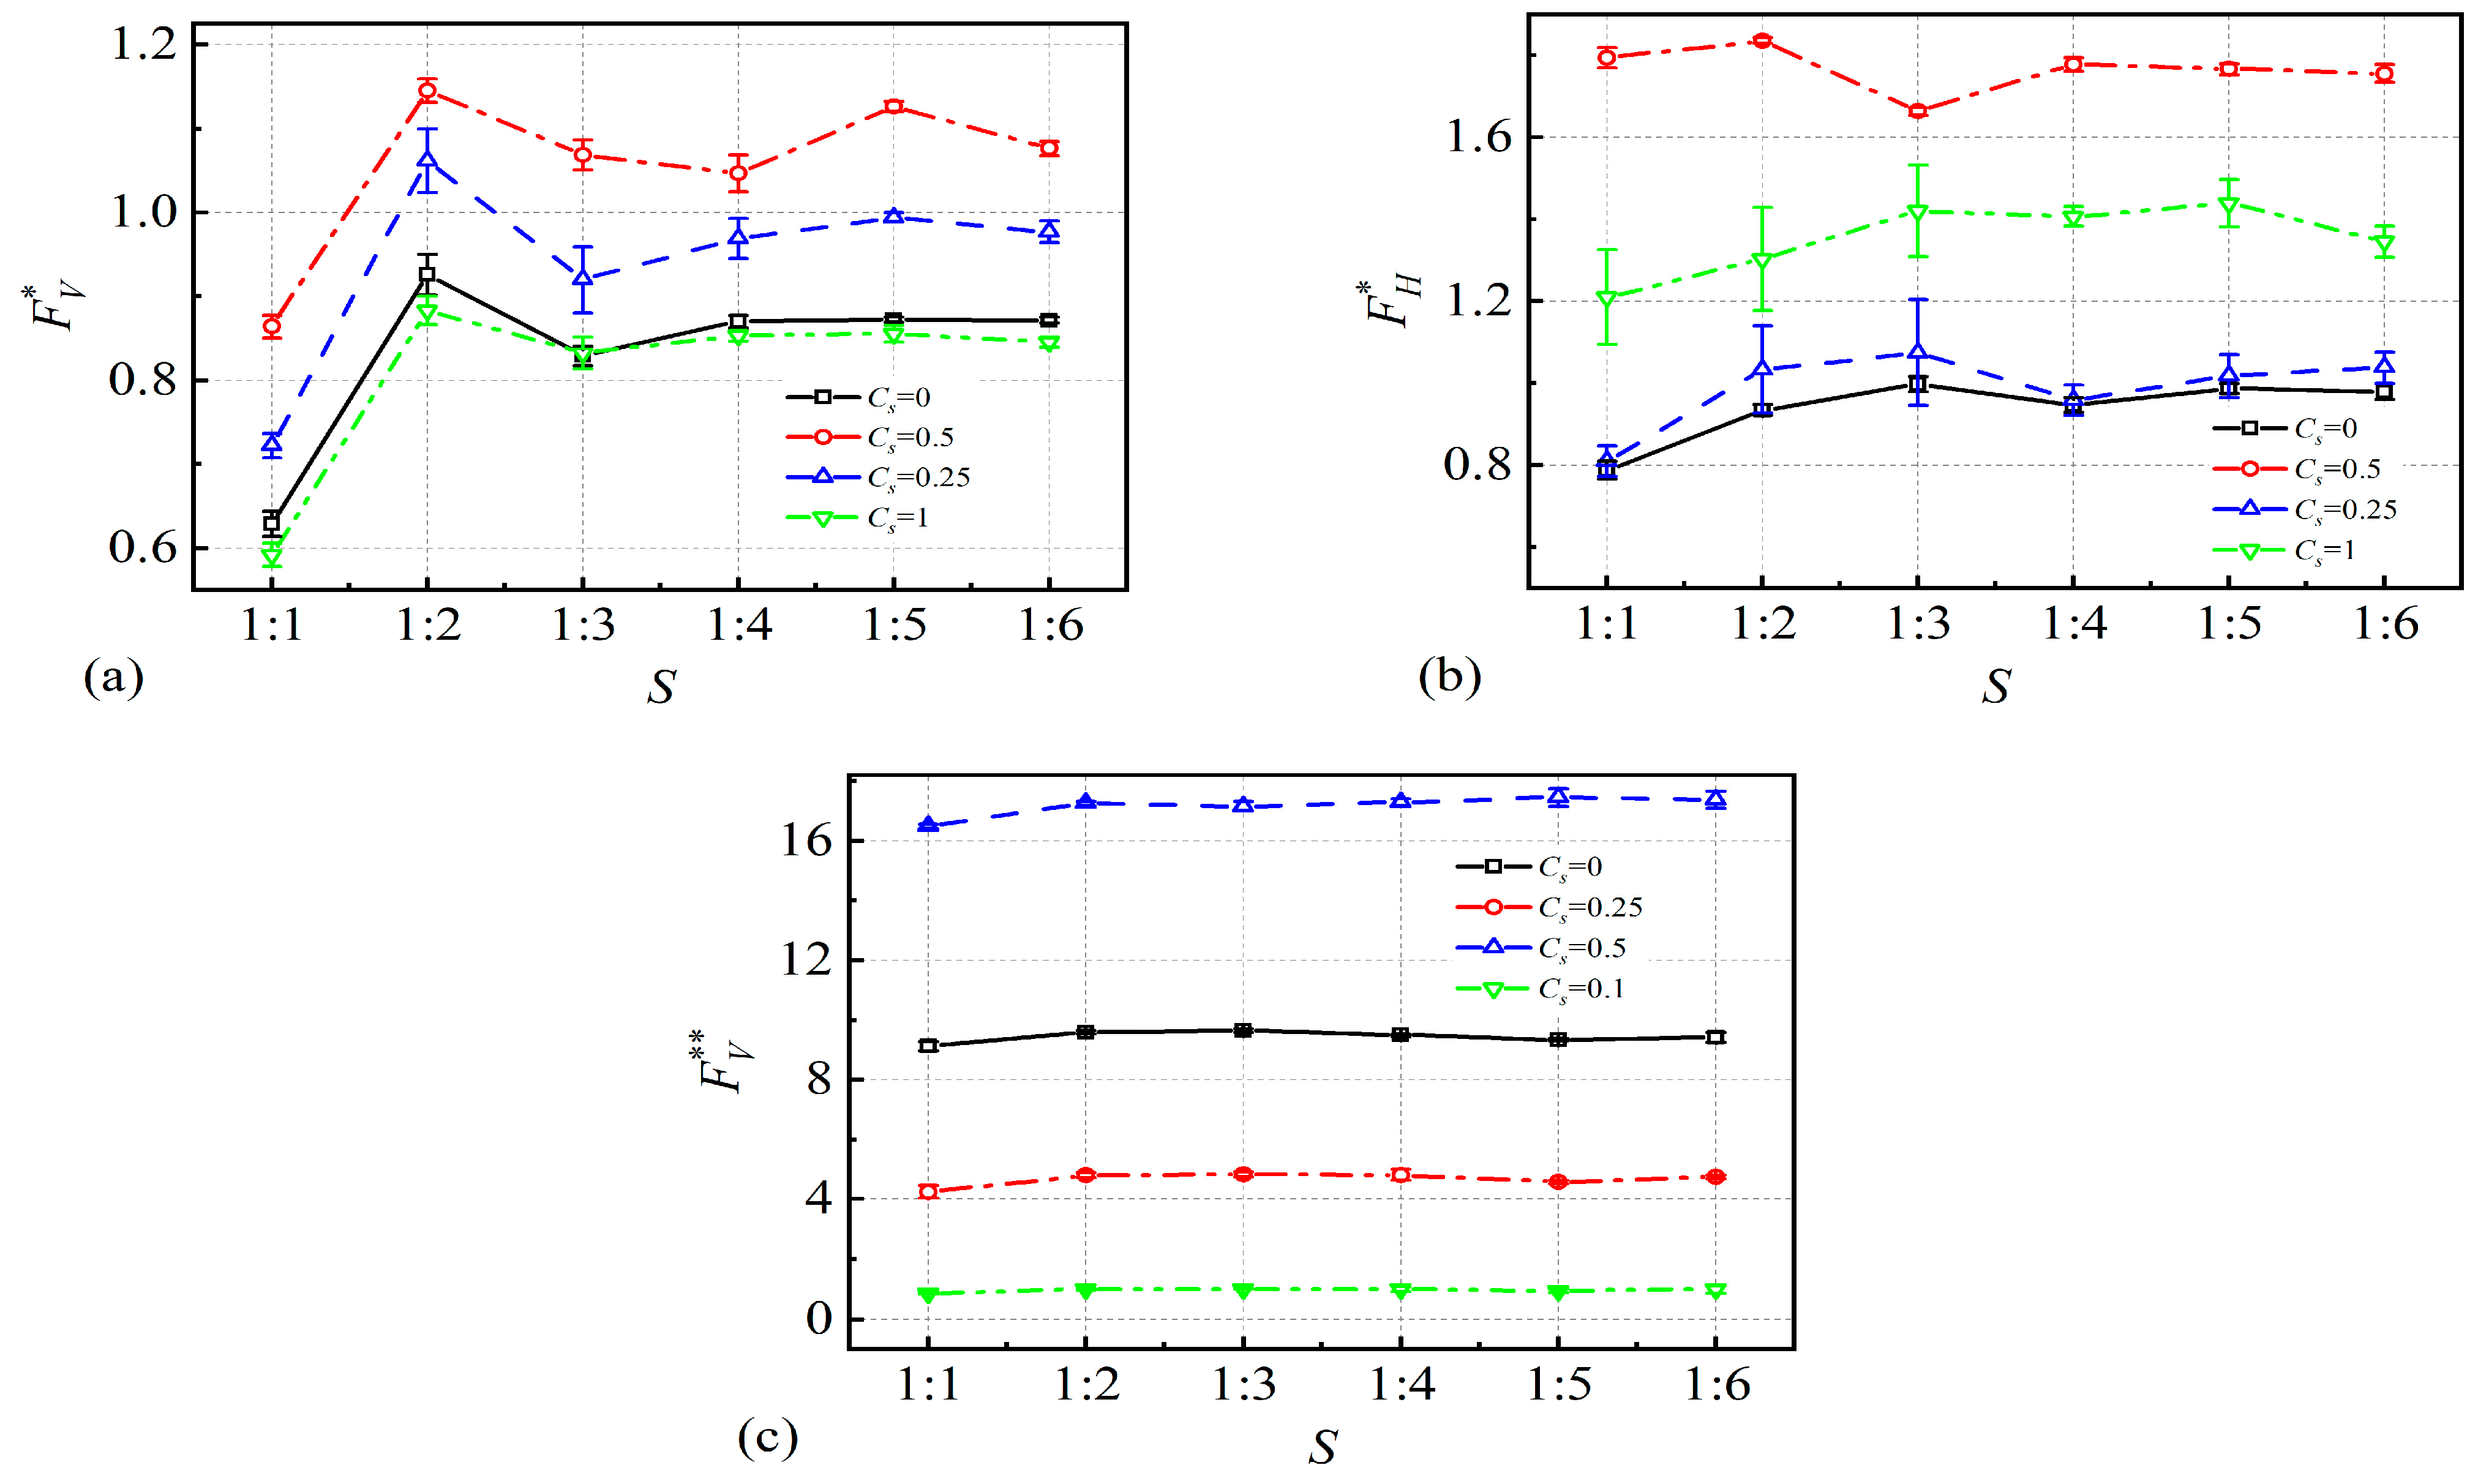
For the analysis of the effect of the seafloor on the wave force, the peak wave force and the coefficient of submergence at different inclinations under the experimental conditions of H = 0.1 m, T = 1.68 s, and ε = 10 were statistically analyzed for the wave working conditions. As shown in Figure 10, it can be seen from the figure that when the coefficient of submergence Cs = 0, the vertical wave force shows an obvious increasing trend between the inclination of 1:1 and 1:2 and is stable below 1:2. Furthermore, there is a slight downward trend. The maximum value of vertical wave force occurs near the inclination of 1:2. According to Figure 11, under the condition of Cs = 0, the wave crest under pure wave conditions can just reach the extreme position near the fold, the angle between the upper flange and the box-girder web. Therefore, changes in the wave height significantly affect the area where the waves interact with the box-girder structure, making the peak values of vertical and horizontal forces more sensitive to changes in wave height caused by inclination changes.
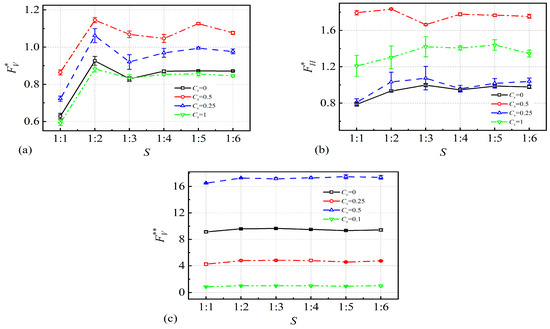
Figure 10.
Changes in the maximum wave force (a) vertically upward, (b) horizontally, and (c) vertically downward under different submergence coefficients when H = 0.1 m and T = 1.68 s.
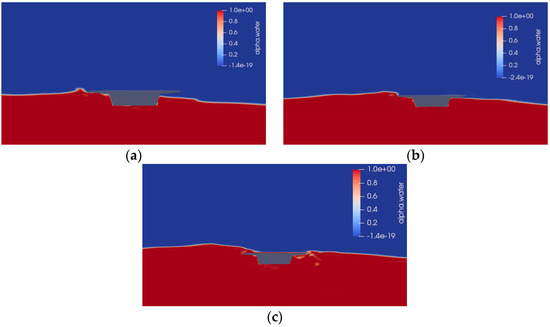
Figure 11.
Two-phase diagram at wave force maximum for S = 1:2 at three different Cs factors; (a) Cs = 0.25 (b) Cs = 0.5 (c) Cs = 1.
The downward peak wave force increases slightly as the inclination ranges from 1:1 to 1:2. Beyond 1:2, as the inclination further decreases, the change in peak wave force becomes very small. This is because when the coefficient of submergence is zero, the area subject to a downward wave force is very small and is therefore less sensitive to changes in wave height caused by changes in the slope.
In the underwater condition with Cs = 0.25, the wave crest reaches the lower edge of the box girder in all conditions. The shielding effect of the edge on the wave field causes wave breaking in the area where the box girder faces the waves, resulting in a vertical wave force peak value greater than Cs = 0. Vertical wave force changes with wave height, and the action area increases significantly, making it more sensitive to changes in the slope. However, the area of action of the peak horizontal force does not increase significantly with wave height, so the change is small.
When Cs = 0.5, the wave peak reaches the upper edge of the box girder in all conditions. The contact area with the edge is larger than when Cs = 0 and Cs = 0.25. The resulting upward wave force and peak horizontal force are greater than the two previously mentioned cases. In addition, the area affected by the vertical downward wave force also increases, resulting in a larger peak downward wave force than the two previous cases.
The peak value of the upward vertical force is at its minimum when Cs = 1. The reason for this phenomenon is that the wave force reaches its maximum value when the wave hits the upper edge, and the surge currently above the box girder then causes changes. In the flow field above the structure, the influence of the waves near the upper edge is weakened. At this coefficient of submergence, the wave crest exceeds the upper edge of the box girder, and the downward vertical force peak is mainly affected by the water flow above said box girder. The forward current reduces the wave height and downward vertical force peaks. On the other hand, the peak positive vertical force (excluding buoyancy force) for this coefficient of submergence is smaller than the corresponding values for the other submerged factors. The maximum downward vertical force is reached because the downward vertical force has the largest area of effect.
In general, the changes in upward vertical wave force and horizontal force with Cs and inclination are generally consistent. In the range of 1:1 to 1:2, the wave force gradually increases. Below 1:2, the change in wave force with slope changes is very small because the reflected waves are superimposed at the bridge’s location, resulting in a reduction in wave height. Between 1:1 and 1:2, the wave reflection is stronger due to the higher slope. After 1:2, the slope becomes smaller, the reflection effect of waves weakens, the damping effect of superimposed waves weakens, the wave height increases, and the wave force increases. At the same time, the downward force of waves increases as the coefficient of submergence. This is mainly because the more submerged, the larger the force-bearing area, and therefore the greater the downward force.
4.4. Influence of Distance from Bridge Deck to Slope
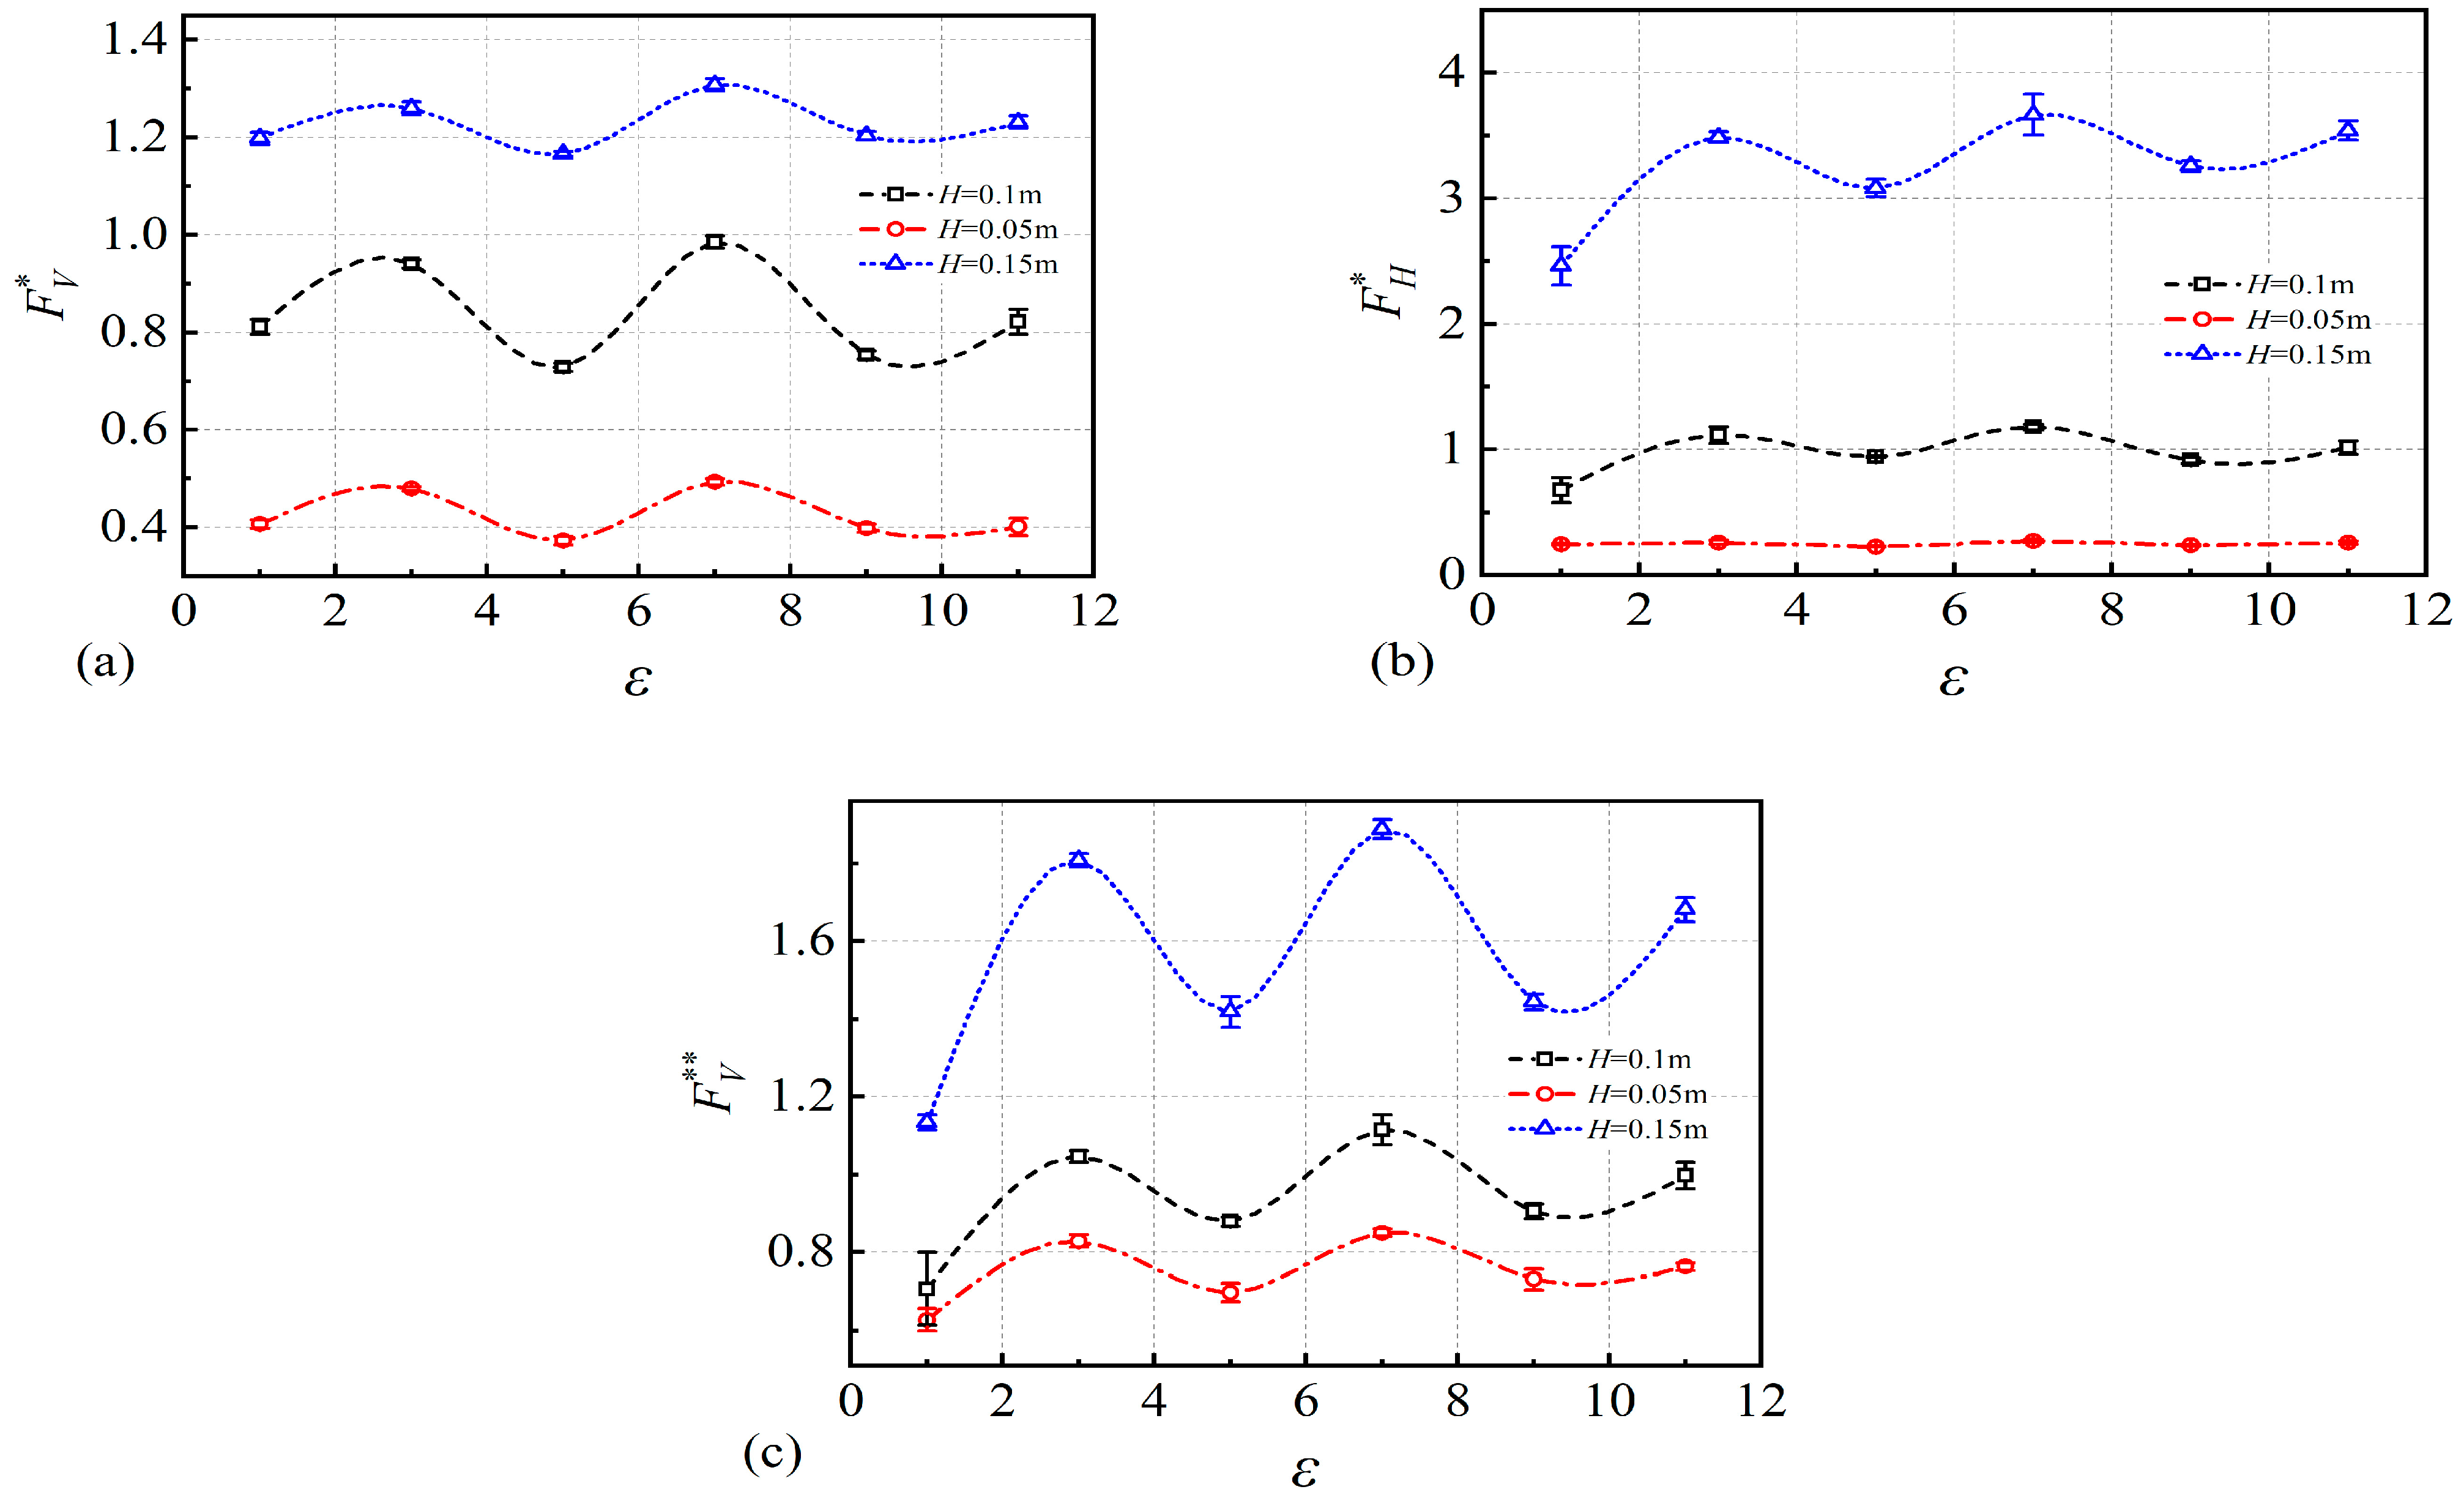
In this study of how waves affect box-girder bridges, we examined the stresses that these bridges are subjected to at different wave heights (H) and distances (ε). We used numerical simulations for the analysis. Figure 12 shows the peak wave force data for different heights (H) and distances (ε), for the following specific conditions: wave period (T) of 0.1 m, coefficient of submergence (Cs) of 0, and inclination of 1:2. The results outline how wave height affects the horizontal (Fh) and vertical (Fv) forces acting on the bridges.
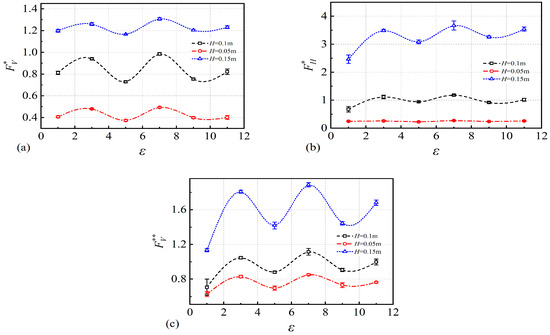
Figure 12.
Maximum (a) vertical upward, (b) horizontal, and (c) vertical downward wave force variations at different H and distance ε when Cs = 0 and T = 1.68 s.
The interaction of the wave dynamics with the sloped seabed introduces markedly more complex patterns of reflection compared to those observed against vertical walls. While vertical walls tend to reflect waves in a relatively uniform and predictable manner, a sloped seabed modifies wave behavior through angular dispersion and energy dissipation, resulting in a more heterogeneous wave field. The complexity arises from the gradient of the slope, which affects the angle at which waves are reflected and subsequently the coherence of the wave fronts [36,37].
Due to the inclined nature of the seabed, wave energy is not reflected symmetrically but is instead scattered in various directions depending on the slope angle and seabed texture. This scattering effect disrupts the formation of classical standing waves, commonly characterized by distinct nodes and antinodes, and instead produces irregular wave patterns that vary both spatially and temporally [38].
The data show that at a wave height of 0.1 m, the horizontal force gradually increases with distance (ε) until it levels off. At a wave height of 0.15 m, we observed that the horizontal force was higher and lower, peaking at certain distances. This pattern may be related to how the impact of the wave interacts with the bridge because of how the impact of the wave passes through the bridge structure. The horizontal force is significantly lower when the wave height is 0.05 m. This suggests that lower wave heights have less impact on bridges.
In terms of vertical forces, all the wave heights led to fluctuations in forces as the distance (ε) increased. The fluctuations were most pronounced at a wave height of 0.15 m. This indicates that the larger the wave height, the more complex the effect on the vertical stresses on the bridge. This shows the nonlinear nature of the interaction of wave forces with the bridge structure, which is due to the nonlinear variation in its force area, as shown in Figure 13.
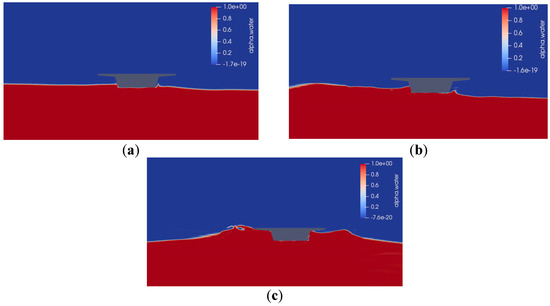
Figure 13.
Two-phase diagram at wave force maximum at three different H factors for ε = 5; (a) H = 0.05 m (b) H = 0.1 m (c) H = 1.5 m.
Wave height primarily affects the variation in wave forces across a bridge. The presence of slopes causes wave reflection. The different superposition states of the incident and reflected waves result in an increase or decrease in the change in wave height at the location of the bridge, which in turn results in a change in the wave force on the bridge. The position of the bridge relative to the slope and the wavelength has a significant effect on the forces applied to the bridge. This effect is compounded by the complexity of the slope and wave interactions. The key factors affecting this complexity are the wavelength and the distance between the bridge and the inclination.
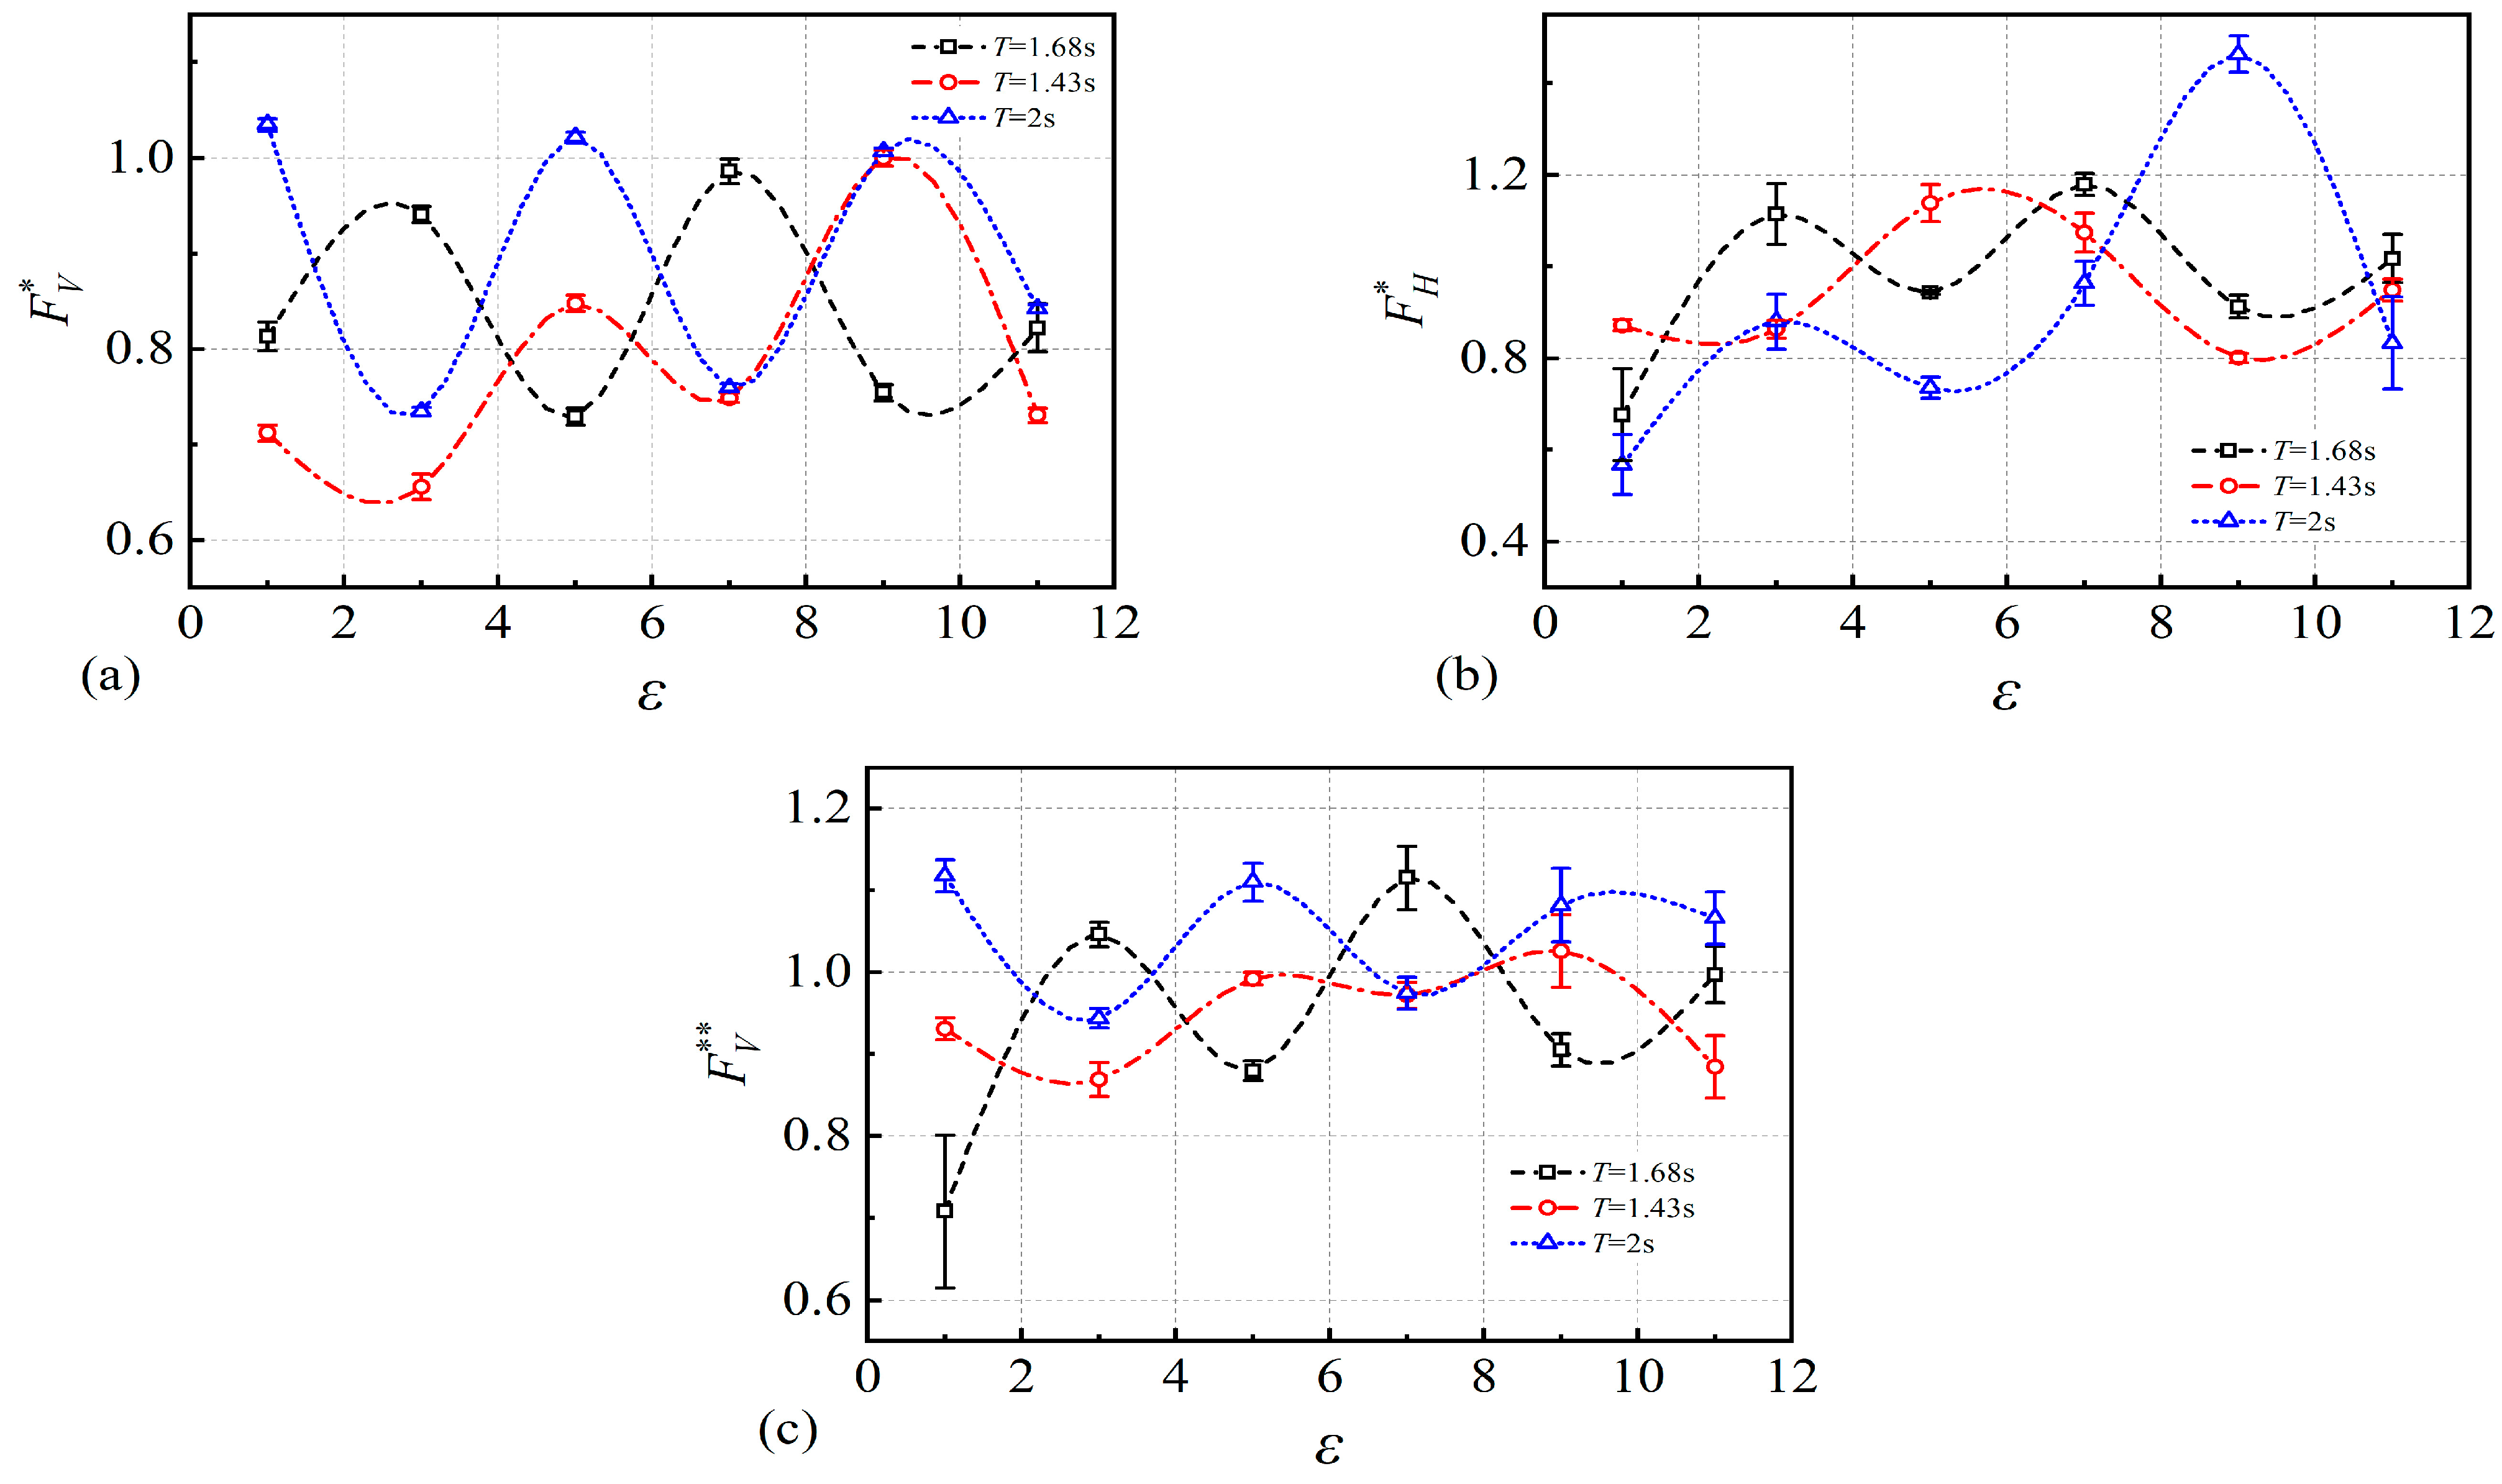
For the purpose of investigating the variation in wave forces on slopes at different wave periods, Figure 14 shows the peak wave force data for different wavelengths and distances (ε), for specific conditions as follows: a wave height (H) of 0.1 m, a coefficient of submergence (Cs) of 0, and a slope gradient of 1:2. The wave force on the bridge fluctuates with distance and has a pattern similar to that of a sine–cosine wave. This is because the distance (ε) basically determines the height of the wave at the bridge location for a constant wavelength, which leads to alternately increasing and decreasing wave forces.
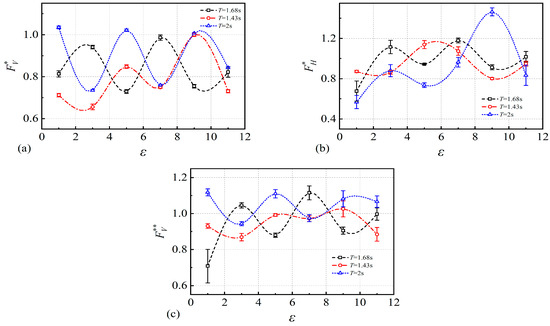
Figure 14.
Variations of the maximum (a) vertical upward, (b) horizontal, and (c) vertical downward wave forces at different wave heights H and distances ε when Cs = 0 and T = 1.68 s.
Under different wave periods, such as T = 1.68s and other two wave periods, due to different wavelengths, the wave force trend changes with the change in distance (ε) thus forming different superposition states. The wave force trends are similar at T = 2 s and T = 1.43 s, probably because the wavelengths are almost multiples of each other under these conditions, resulting in similar wave superposition states at the bridge location.
The average wave force magnitudes for different periods are consistent with the pattern observed at constant distance; the larger the wave period, the greater the vertical force and the smaller the horizontal force.
It can be seen that the wave period and distance (ε) are interrelated factors that affect the wave force on the bridge.
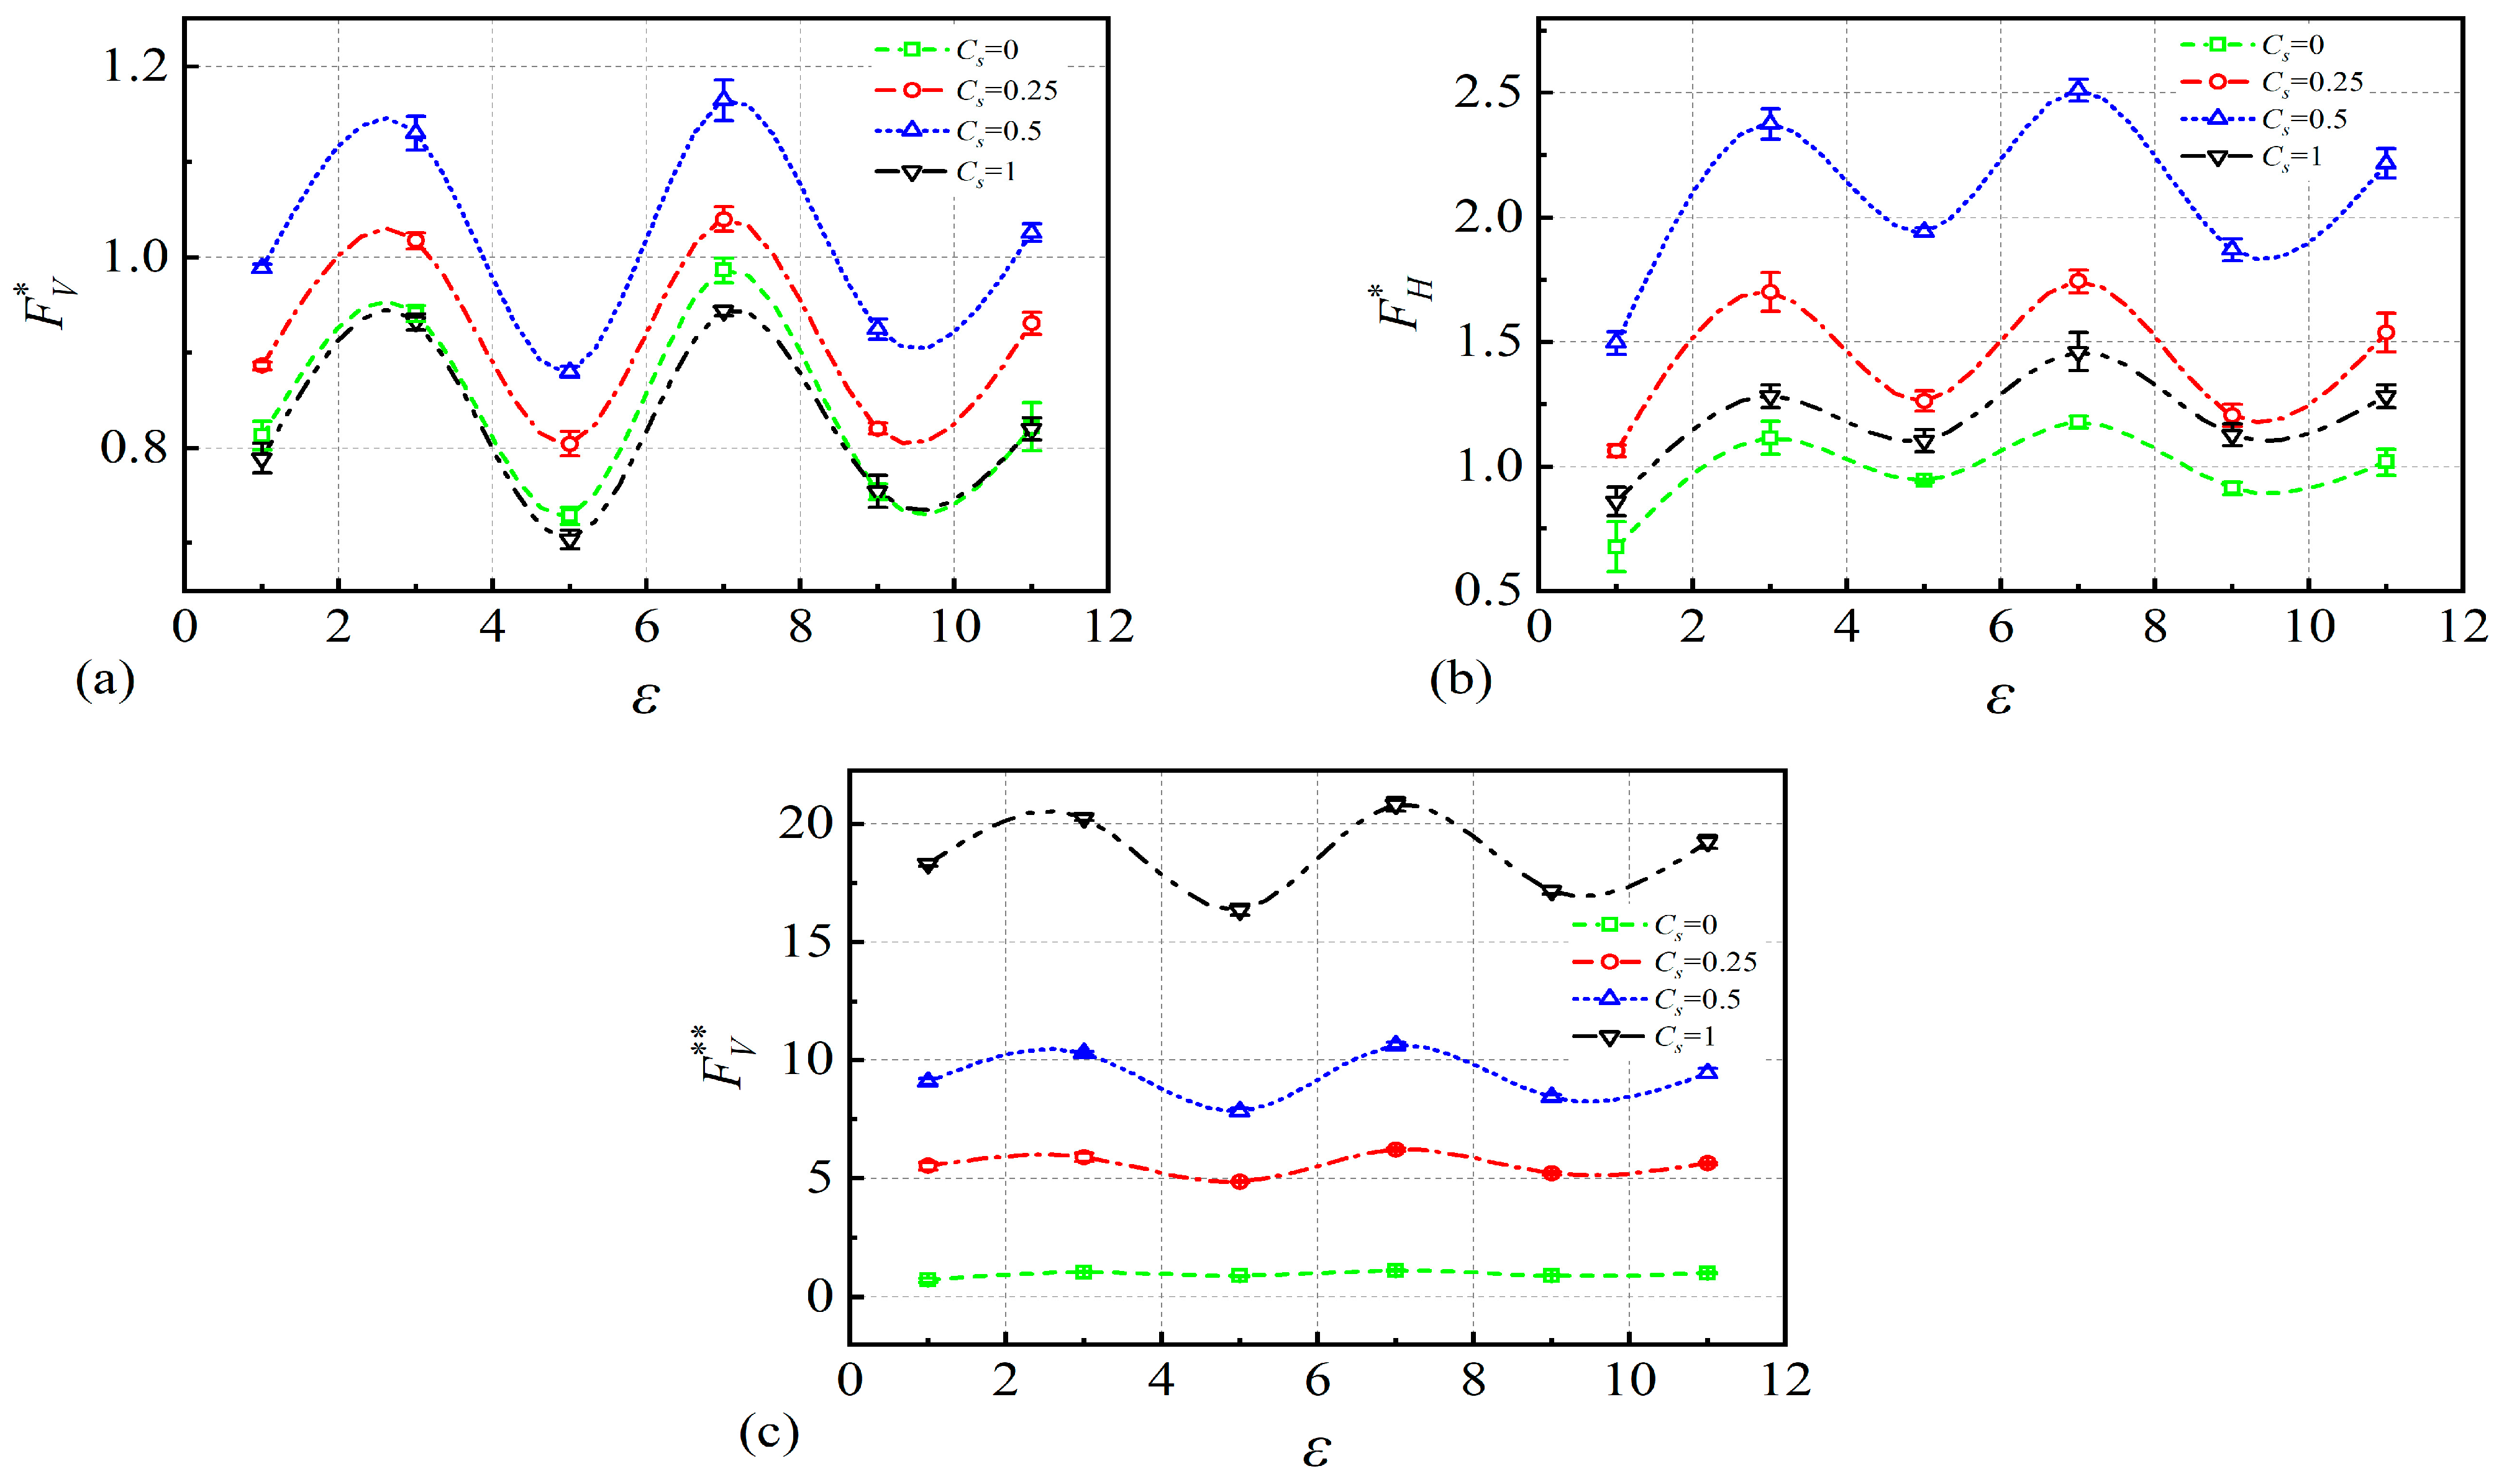
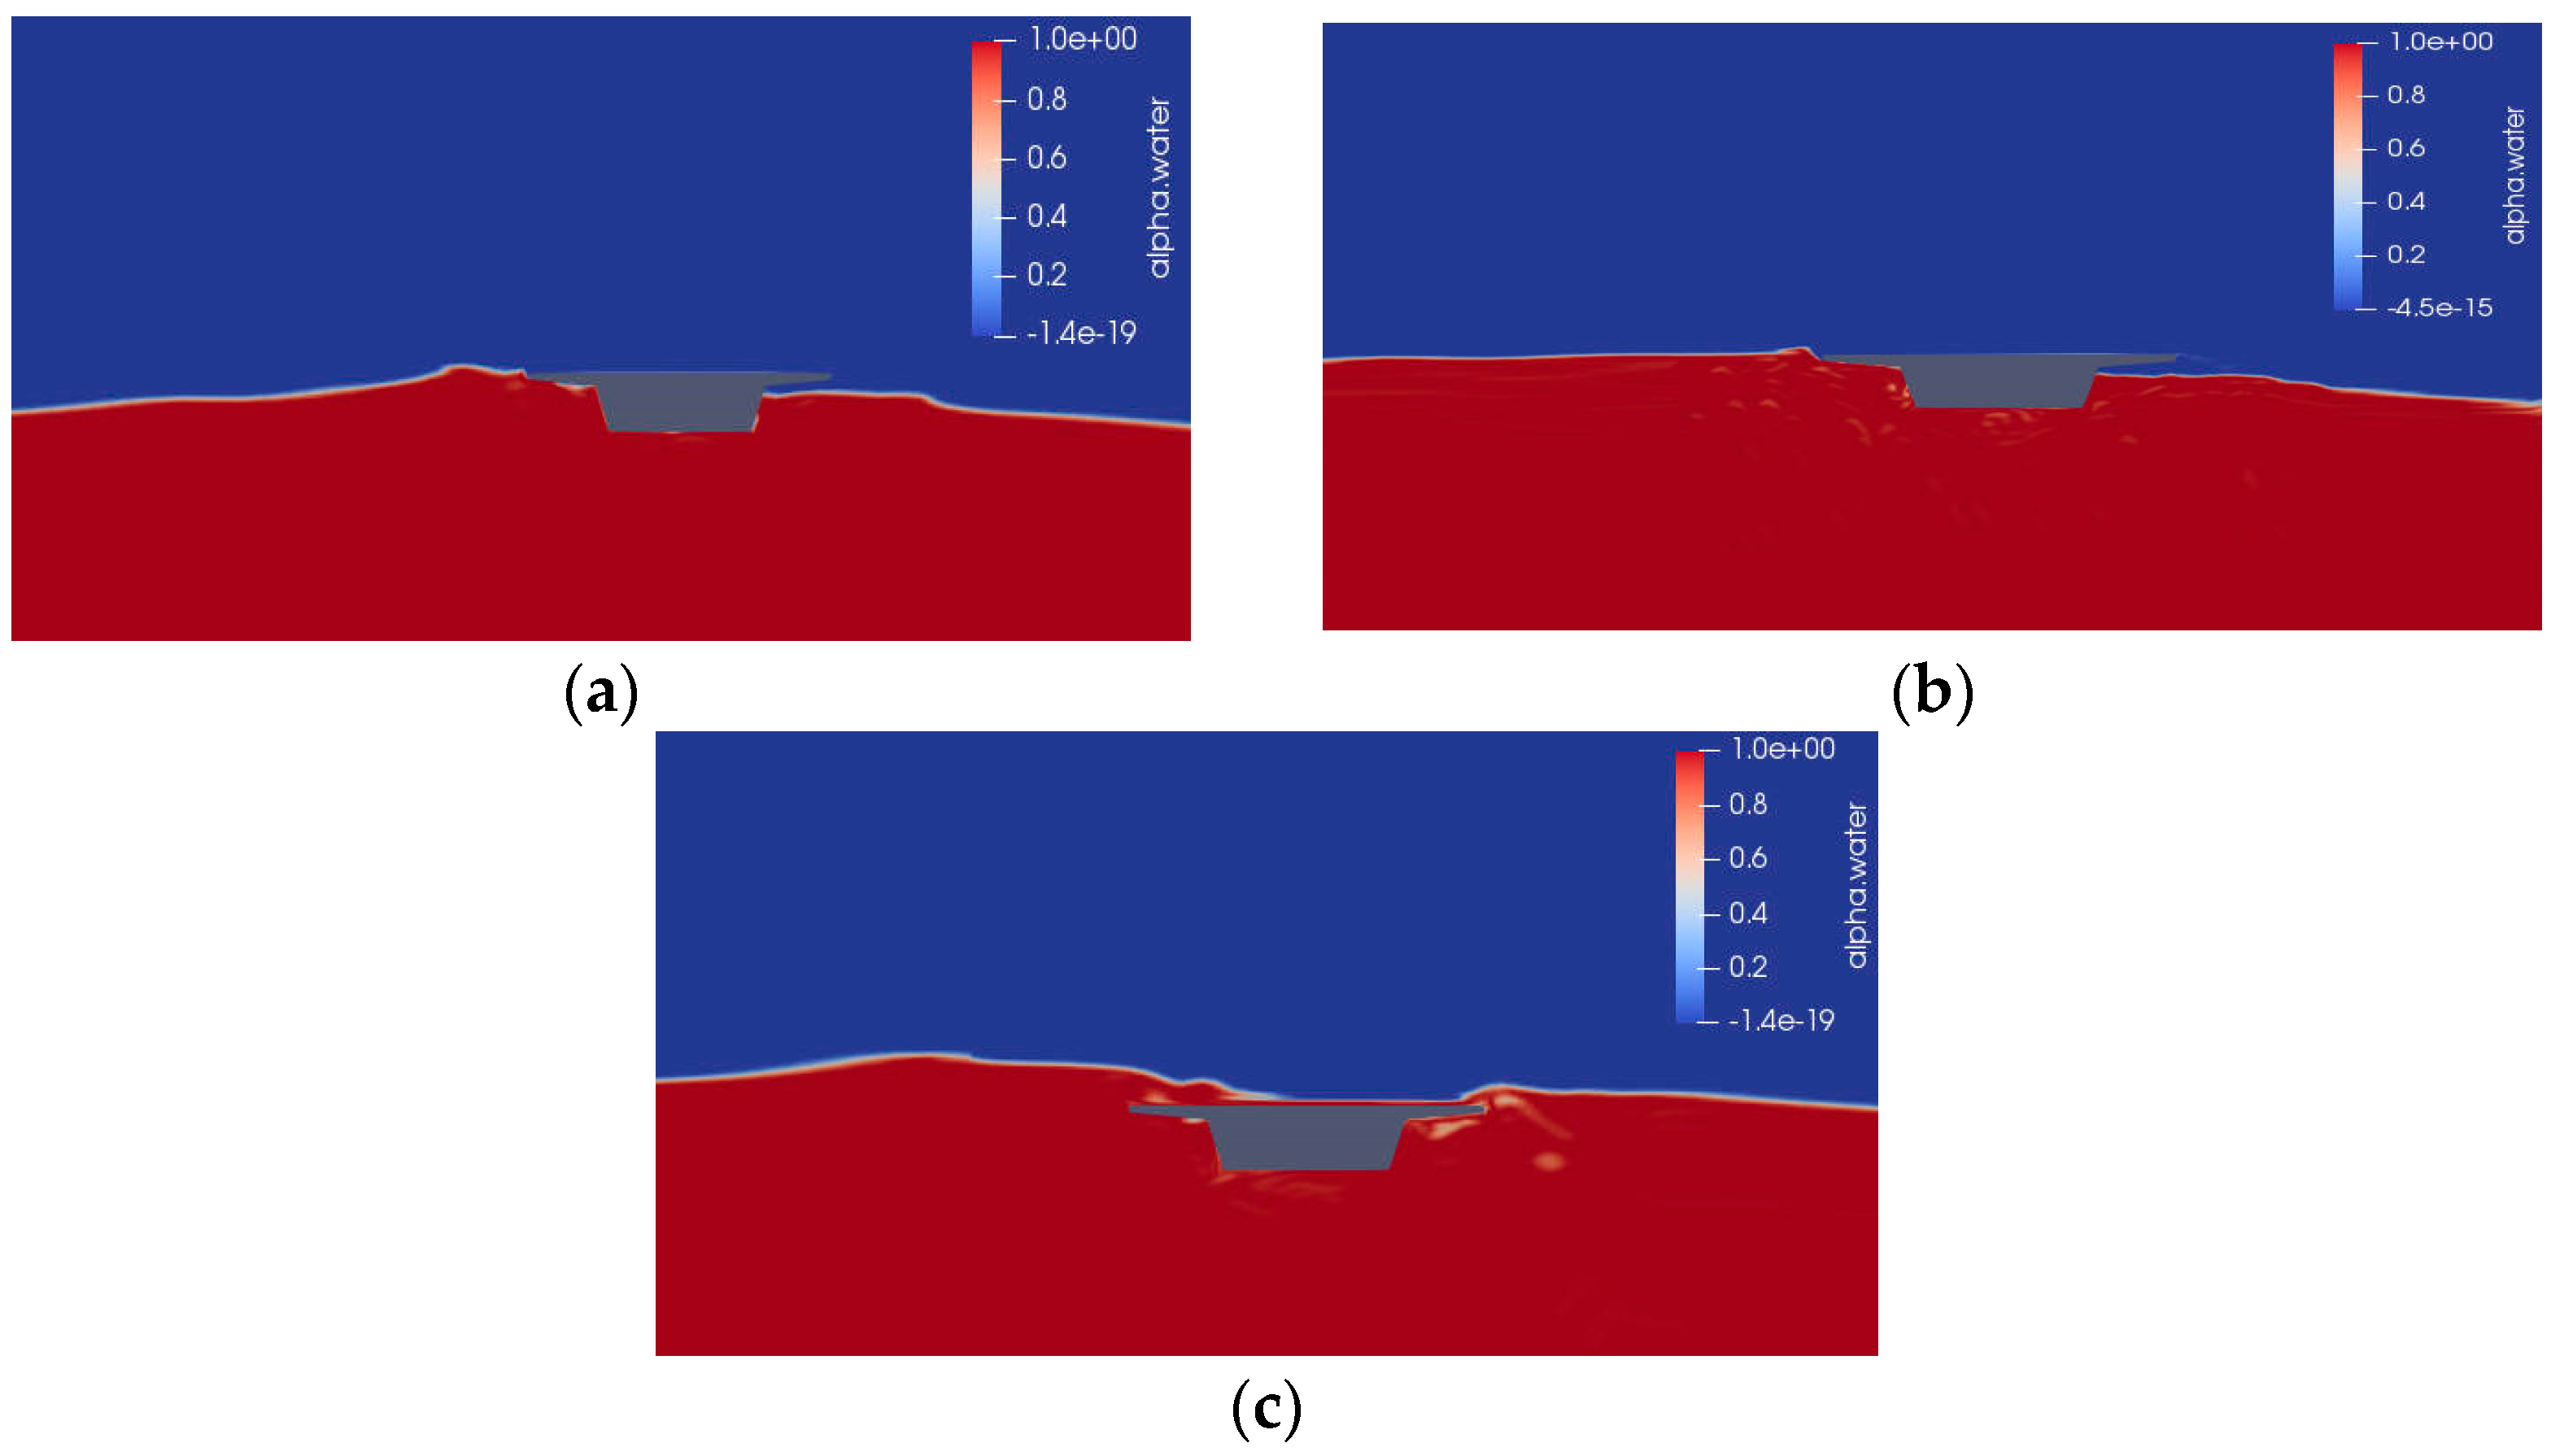
To explore how distance ε affects the wave force at different underwater depths, Figure 15 shows the wave force peak data under the conditions of wave height H of 0.1 m, period T of 1.68, and inclination (S) of 1:2. It can be seen from the figure that the wave force on the bridge changes regularly with the distance ε at different coefficients of submergence. This indicates that the distance and coefficient of submergence have independent effects on wave force. The observed pattern is like the distance variation in the static distance and slope variation experiments, indicating that the wave force is at its maximum when the coefficient of submergence Cs is 0.5. When Cs = 0.5, the wave force is greater. As shown in Figure 16, this is because it has the largest area affected by the force and therefore the wave force generated under these conditions is also the largest. On the other hand, the wave force is at its minimum at Cs = 0 and Cs = 1. This is because the main considerations for bridge safety are usually vertical lift and horizontal forces. Therefore, from the perspective of minimizing the risk of overturning, the bridge is safest at these two immersion levels.
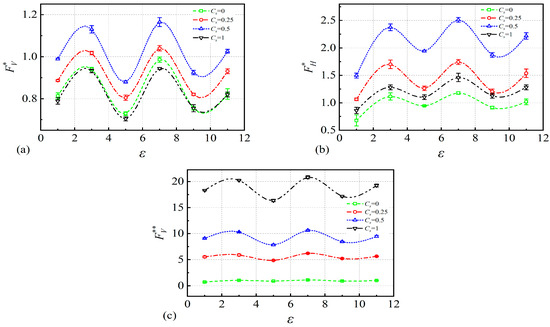
Figure 15.
Variations of the maximum (a) vertical upward, (b) horizontal, and (c) vertical downward wave forces at different Cs and distance ε when Cs = 0 and T = 1.68s.

Figure 16.
Two-phase diagram at wave force maximum at three different Cs factors for ε = 5; (a) Cs = 0.25 (b) Cs = 0.5 (c) Cs = 1.
5. Conclusions
This study utilizes a numerical model created with OpenFOAM-v1912 software to investigate the influence of a sloping seabed on wave forces acting on coastal bridges. The reliability of the numerical model is confirmed by comparing it with published experimental results. The study compares the wave forces acting on bridges located in front of and behind a sloping seabed and a flat seabed and examines in detail the effects of wave characteristics, bridge gaps, and inclination on the wave forces. The major conclusions drawn from this study can be summarized as follows:
- (1)
- The analysis of the wave force time history curve shows that the wave force on the bridge deck is mainly divided into two parts—quasi-static force and impact force.
- (2)
- Due to the sloping seabed, waves will be reflected by the sloping seabed on the sloped surface. The superposition of incident waves and reflected waves will affect the wave force on the bridge to a certain extent.
- (3)
- When the bridge is located behind the sloping seabed: The wave propagates from the deep-water area to the shallow-water area through the climb, breaking in the shallow-water area and causing the water body in front of the wave to be pushed forward and accumulated. This accumulation effect can cause an increase in water depth in a short time. This in turn causes the submergence coefficient of the bridge to increase and the impact force on the bridge to disappear. Moreover, due to the energy loss caused by climbing, the wave height is reduced, and the quasi-static force on the bridge is reduced, so the bridge in the shallow water area behind the sloping seabed is relatively safe.
- (4)
- The inclination of the sloping seabed has a certain degree of influence on the wave force acting on the bridge. The influence of the inclination on the wave force acting on the bridge is non-linear. Beyond a ratio of 1:2, the steeper the slope, the more obvious the reflection of waves and thus the more significant the impact on the wave force acting on the bridge, causing the change to become steeper as the inclination increases. This characteristic is shown under different submersion depths, wave periods, and wave heights.
- (5)
- The distance between the bridge and the sloping seabed shows non-linear fluctuations. This is mainly due to the different positions of the bridge relative to the sloping seabed, which may result in it being located in areas with different wave superposition effects. The changing rules are different under different periods. This is because the two factors of distance and period are coupled. Under different wave heights and submersion coefficients, the changing rules are the same.
In this study, we utilized OpenFOAM-v1912 with the k-omega turbulence model for our simulations, which provided a balance between computational efficiency and the accuracy required for simulating wave–structure interactions. It should be admitted that the k-omega turbulence model could miss some details of the highly turbulent and complex flow structures, even if it is widely applied in wave–structure interactions. Furthermore, the present numerical simulations employed the simplified boundary conditions of the uniformity in wave patterns and seabed topology. This approach is computationally feasible but does not fully reproduce the heterogeneous and complex marine environments. As such, those limitations need further investigation.
Author Contributions
C.T.: Writing—Original Draft, Visualization, Data Curation, Methodology; Q.Z.: Visualization; L.W.: Data Curation; Z.C.: Project Administration, Supervision; Q.F.: Methodology, Data Curation, Funding Acquisition, Writing—Original Draft. All authors have read and agreed to the published version of the manuscript.
Funding
This research was funded by the National Key R&D Program of China (2023YFB2604400), the National Natural Science Foundation of China (52178128), and Shandong Provincial Higher Education Institutions Youth Plan Team (2022KJ081).
Institutional Review Board Statement
Not applicable.
Informed Consent Statement
Not applicable.
Data Availability Statement
The data presented in this study are available on request.
Conflicts of Interest
The authors declare no conflicts of interest.
References
- Hagy, J.D.; Lehrter, J.C.; Murrell, M.C. Effects of hurricane Ivan on water quality in Pensacola Bay, Florida. Estuaries Coasts 2006, 29, 919–925. [Google Scholar] [CrossRef]
- Tang, H.S.; Chien, S.I.-J.; Temimi, M.; Blain, C.A.; Ke, Q.; Zhao, L.; Kraatz, S. Vulnerability of population and transportation infrastructure at the east bank of Delaware Bay due to coastal flooding in sea-level rise conditions. Nat. Hazards 2013, 69, 141–163. [Google Scholar] [CrossRef]
- Robertson, I.N.; Riggs, H.R.; Yim, S. Lessons from Hurricane Katrina storm surge on bridges and buildings. J. Waterw. Port Coast. Ocean Eng. 2007, 133, 463–483. [Google Scholar] [CrossRef]
- Azadbakht, M.; Yim, S.C. Simulation and estimation of tsunami loads on bridge superstructures. J. Waterw. Port Coast. Ocean Eng. 2015, 141, 04014031. [Google Scholar] [CrossRef]
- Nakamura, T.; Sawa, Y.; Mizutani, N. Study on the evaluation of temporal change in horizontal and vertical tsunami forces acting on a bridge superstructure. Coast. Eng. J. 2016, 58, 1640020-1–1640020-27. [Google Scholar] [CrossRef]
- Guo, A.; Fang, Q.; Bai, X.; Li, H. Hydrodynamic experiment of the wave force acting on the superstructures of coastal bridges. J. Bridge Eng. 2015, 20, 04015012. [Google Scholar] [CrossRef]
- Huang, B.; Zhu, B.; Cui, S.; Duan, L.; Zhang, J. Experimental and numerical modelling of wave forces on coastal bridge superstructures with box girders, Part I: Regular waves. Ocean Eng. 2018, 149, 53–77. [Google Scholar] [CrossRef]
- Zhang, J.; Zhu, B.; Kang, A.; Yin, R. Experimental and numerical investigation of wave-current forces on coastal bridge superstructures with box girders. Adv. Struct. Eng. 2020, 23, 1438–1453. [Google Scholar] [CrossRef]
- Denson, K.H. Wave Forces on Causeway-Type Coastal Bridges; NASA STI/Recon Technical Report N; NASA: Washington, DC, USA, 1978. [Google Scholar]
- Istrati, D.; Buckle, I.; Lomonaco, P.; Yim, S. Deciphering the tsunami wave impact and associated connection forces in open-girder coastal bridges. J. Mar. Sci. Eng. 2018, 6, 148. [Google Scholar] [CrossRef]
- Bradner, C.; Schumacher, T.; Cox, D.; Higgins, C. Experimental setup for a large-scale bridge superstructure model subjected to waves. J. Waterw. Port Coast. Ocean Eng. 2011, 137, 3–11. [Google Scholar] [CrossRef]
- Istrati, D.; Buckle, I. Role of trapped air on the tsunami-induced transient loads and response of coastal bridges. Geosciences 2019, 9, 191. [Google Scholar] [CrossRef]
- Xu, G.; Cai, C. Numerical simulations of lateral restraining stiffness effect on bridge deck–wave interaction under solitary waves. Eng. Struct. 2015, 101, 337–351. [Google Scholar] [CrossRef]
- Xu, G.; Cai, C.; Deng, L. Numerical prediction of solitary wave forces on a typical coastal bridge deck with girders. Struct. Infrastruct. Eng. 2017, 13, 254–272. [Google Scholar] [CrossRef]
- Qu, K.; Tang, H.; Agrawal, A.; Cai, Y.; Jiang, C. Numerical investigation of hydrodynamic load on bridge deck under joint action of solitary wave and current. Appl. Ocean Res. 2018, 75, 100–116. [Google Scholar] [CrossRef]
- Greco, F.; Lonetti, P. Vulnerability Analysis of Structural Systems under Extreme Flood Events. J. Mar. Sci. Eng. 2022, 10, 1121. [Google Scholar] [CrossRef]
- Han, W.; Xu, X.; Wang, J.; Xiao, L.; Zhou, K.; Guo, X. Safety Assessment of Coastal Bridge Superstructures with Box Girders under Potential Landslide Tsunamis. J. Mar. Sci. Eng. 2023, 11, 1062. [Google Scholar] [CrossRef]
- Wang, S.; Liu, S.; Xiang, C.; Li, M.; Yang, Z.; Huang, B. Prediction of Wave Forces on the Box-Girder Superstructure of the Offshore Bridge with the Influence of Floating Breakwater. J. Mar. Sci. Eng. 2023, 11, 1326. [Google Scholar] [CrossRef]
- Moideen, R.; Ranjan Behera, M.; Kamath, A.; Bihs, H. Effect of girder spacing and depth on the solitary wave impact on coastal bridge deck for different airgaps. J. Mar. Sci. Eng. 2019, 7, 140. [Google Scholar] [CrossRef]
- Song, Y.; Jia, J.; Liu, H.; Chen, F.; Fang, Q. Numerical Study on Tsunami Force on Coastal Bridge Decks with Superelevation. J. Mar. Sci. Eng. 2023, 11, 824. [Google Scholar] [CrossRef]
- Fang, Q.; Liu, J.; Hong, R.; Guo, A.; Li, H. Experimental investigation of focused wave action on coastal bridges with box girder. Coast. Eng. 2021, 165, 103857. [Google Scholar] [CrossRef]
- Wu, G.; Garlock, M. Investigating the effects of box girder bridge geometry on solitary wave force using SPH modeling. Coast. Eng. 2024, 187, 104430. [Google Scholar] [CrossRef]
- Chen, X.; Xu, W.; Lin, C.; Sun, H.; Zeng, X.; Liu, Q.; Chen, S. A comparative study on wave-deck interactions of T-type and box girder decks under regular waves. Ocean Eng. 2021, 231, 109067. [Google Scholar] [CrossRef]
- Larsen, B.E.; Fuhrman, D.R.; Roenby, J. Performance of interFoam on the simulation of progressive waves. Coast. Eng. J. 2019, 61, 380–400. [Google Scholar] [CrossRef]
- Jacobsen, N.G.; Fuhrman, D.R.; Fredsøe, J. A wave generation toolbox for the open-source CFD library: OpenFoam®. Int. J. Numer. Methods Fluids 2012, 70, 1073–1088. [Google Scholar] [CrossRef]
- Kamath, A.; Chella, M.A.; Bihs, H.; Arntsen, Ø.A. Breaking wave interaction with a vertical cylinder and the effect of breaker location. Ocean Eng. 2016, 128, 105–115. [Google Scholar] [CrossRef]
- Grue, J.; Huseby, M. Higher-harmonic wave forces and ringing of vertical cylinders. Appl. Ocean Res. 2002, 24, 203–214. [Google Scholar] [CrossRef]
- Honda, T.; Mitsuyasu, H. Experimental study of breaking wave force on a vertical circular cylinder. Coast. Eng. Jpn. 1974, 17, 59–70. [Google Scholar] [CrossRef]
- Yang, Z.; Zhu, B.; Huang, B.; Hou, J.; Zhang, Y.; Li, L. Numerical study on the behaviors of coastal bridges with box girder under the action of extreme waves. Ocean Eng. 2023, 286, 115683. [Google Scholar] [CrossRef]
- Le Méhauté, B. An Introduction to Hydrodynamics and Water Waves; Springer Science & Business Media: Berlin/Heidelberg, Germany, 2013. [Google Scholar]
- Fang, Q.; Wang, H.; Wang, Z.; Liu, C. Wave Forces on a Submerged Bridge Deck with a Box Girder Situated over a Step Bottom. J. Bridge Eng. 2024, 29, 04024033. [Google Scholar] [CrossRef]
- Gao, H.; Song, Y.; Fang, Q.; Li, S. Wave forces on box-girder-type bridge deck located behind trench or breakwater. Ocean Eng. 2021, 237, 109618. [Google Scholar] [CrossRef]
- Guanche, R.; Losada, I.J.; Lara, J.L. Numerical analysis of wave loads for coastal structure stability. Coast. Eng. 2009, 56, 543–558. [Google Scholar] [CrossRef]
- Dean, R.G.; Dalrymple, R.A. Water Wave Mechanics for Engineers and Scientists; World Scientific Publishing Company: Singapore, 1991; Volume 2. [Google Scholar]
- Iafrati, A. Numerical study of the effects of the breaking intensity on wave breaking flows. J. Fluid Mech. 2009, 622, 371–411. [Google Scholar] [CrossRef]
- Xie, J.-J. Long wave reflection by an array of submerged trapezoidal breakwaters on a sloping seabed. Ocean Eng. 2022, 252, 111138. [Google Scholar] [CrossRef]
- Dou, Y.; Guo, Z.; Gao, Y.; Wang, L.; Yang, H.; Liu, Z. Experimental investigations on the stability of clayey sloping seabed under wave actions. Ocean Eng. 2021, 239, 109805. [Google Scholar] [CrossRef]
- Peregrine, D. Water-wave impact on walls. Annu. Rev. Fluid Mech. 2003, 35, 23–43. [Google Scholar] [CrossRef]


Disclaimer/Publisher’s Note: The statements, opinions and data contained in all publications are solely those of the individual author(s) and contributor(s) and not of MDPI and/or the editor(s). MDPI and/or the editor(s) disclaim responsibility for any injury to people or property resulting from any ideas, methods, instructions or products referred to in the content. |
© 2024 by the authors. Licensee MDPI, Basel, Switzerland. This article is an open access article distributed under the terms and conditions of the Creative Commons Attribution (CC BY) license (https://creativecommons.org/licenses/by/4.0/).