Article

Evaluation of Thermal and Mechanical Properties of Foamed Phosphogypsum-Based Cementitious Materials for Well Cementing in Hydrate Reservoirs

1
Institute for Advanced Marine Research, China University of Geosciences, Guangzhou 511462, China
2
National Center for International Research on Deep Earth Drilling and Resource Development, Faculty of Engineering, China University of Geosciences, Wuhan 430074, China
3
College of Earth Science and Engineering, Shandong University of Science and Technology, Qingdao 266590, China
4
PetroChina Tarim Oilfield Company, Korla 841000, China
*
Authors to whom correspondence should be addressed.
J. Mar. Sci. Eng. 2024, 12(7), 1056; https://doi.org/10.3390/jmse12071056
Submission received: 30 May 2024 / Revised: 16 June 2024 / Accepted: 21 June 2024 / Published: 23 June 2024
(This article belongs to the Special Issue Production Prediction in Onshore and Offshore Tight Reservoirs)

Abstract

:
As detrimental byproduct waste generated during the production of fertilizers, phosphogypsum can be harmlessly treated by producing phosphogypsum-based cementitious materials (PGCs) for offshore well cementing in hydrate reservoirs. To be specific, the excellent mechanical properties of PGCs significantly promote wellbore stability. And the preeminent temperature control performance of PGCs helps to control undesirable gas channeling, increasing the formation stability of natural gas hydrate (NGH) reservoirs. Notably, to further enhance temperature control performance, foaming agents are added to PGCs to increase porosity, which however reduces the compressive strength and increases the risk of wellbore instability. Therefore, the synergetic effect between temperature control performance and mechanical properties should be quantitatively evaluated to enhance the overall performance of foamed PGCs for well cementing in NGH reservoirs. But so far, most existing studies of foamed PGCs are limited to experimental work and ignore the synergetic effect. Motivated by this, we combine experimental work with theoretical work to investigate the correlations between the porosity, temperature control performance, and mechanical properties of foamed PGCs. Specifically, the thermal conductivity and compressive strength of foamed PGCs are accurately determined through experimental measurements, then theoretical models are proposed to make up for the non-repeatability of experiments. The results show that, when the porosity increases from 6% to 70%, the 7 d and 28 d compressive strengths of foamed PGCs respectively decrease from 21.3 MPa to 0.9 MPa and from 23.5 MPa to 1.0 MPa, and the thermal conductivity decreases from 0.33 W·m−1·K−1 to 0.12 W·m−1·K−1. Additionally, an overall performance index evaluation system is established, advancing the application of foamed PGCs for well cementing in NGH reservoirs and promoting the recycling of phosphogypsum.

1. Introduction

As a kind of potential alternative energy source, natural gas hydrate (NGH) has drawn worldwide attention nowadays due to its characteristics of high energy density and low carbon [1,2,3]. Well cementing is one of the most crucial procedures of the well construction process during NGH exploitation, and it is the prerequisite for subsequent NGH production. However, well cementing is confronted with the problems of wellbore instability and undesirable gas channeling during NGH exploitation [4,5], which should be urgently resolved. As an effective solution, the substitution of phosphogypsum-based cementitious materials (PGCs) for traditional well cementing materials can advance wellbore stability and reduce gas channeling channels during the NGH exploitation process, promoting safe and stable NGH exploitation [6]. Phosphogypsum is a byproduct waste of wet acid production of chemical fertilizer, which is also a type of pollution damaging the ecological environment and human health [7,8]. Notably, certain properties of cementitious materials can be improved after adding phosphogypsum, e.g., mechanical properties and temperature control performance [9,10,11,12,13,14,15]. Therefore, by using it as an additive for engineered cementitious materials, the recycling of phosphogypsum has been realized in the fields of building materials [16,17], road foundation materials [18,19], and offshore well cementing materials [6]. Consequently, the application of PGCs in well cementing materials can not only reduce the severe detrimental effects of phosphogypsum but also enhance the safe, stable, and effective exploitation of NGH reservoirs.
Specifically, phosphogypsum has good mechanical potential due to its strong bonding properties after drying and dehydration processes [9,20], leading to larger compressive strength of PGCs than traditional cementing materials, which is beneficial for wellbore stability under the high pressure conditions of offshore NGH exploitation [21,22]. And great efforts have been made to investigate the mechanical properties of phosphogypsum-based cementitious materials [6,11,12,23,24,25]. For instance, Zhou et al. [12] prepared non-fired bricks with exceptional mechanical properties using 75% phosphogypsum through their unique hot-drying and water-immersing processes during hydration–recrystallization. Recently, Liao et al. [26] proved that the addition of phosphogypsum significantly increased the compressive strength of cementitious materials. And Ding et al. [11] found that, when the phosphogypsum content increased from 60% to 90%, the compressive strength of over-dry PGCs decreased from 16.5 MPa to 3.9 MPa, which quantitatively revealed the correlation between compressive strength and phosphogypsum content.
A huge amount of heat accumulates due to cement hydration during the well cementing process, which may transfer to the formation near the wellbore and cause the temperature to rise, resulting in the instability of hydrates in the formation [27]. Under this circumstance, the dissociation of hydrates generates gas channeling channels near the wellbore, critically influencing the quality of cementing and sealing or even leading to the failure of well cementing [27,28]. Thus, well cementing materials are expected to have good temperature control performance to prevent the heat inside the well from transferring to the NGH formation outside the well. That is, the temperature rise of the formation near the wellbore should be controlled to reduce hydrate dissociation. Since the application of PGCs with better temperature control performance instead of traditional cementing materials can reduce the hydration heat and control the heat transfer from the wellbore to the NGH reservoir outside the wellbore [9,23,25], it consequently decreases the dissociation of hydrates near the wellbore, leading to less undesirable gas channeling and better formation stability. Hence, in addition to their mechanical properties, the temperature control performance of PGCs should also be deeply investigated [9,23]. It is noteworthy that, as the thermal conductivity represents the heat transfer capacity, the temperature control performance of PGCs is always studied by investigating their thermal conductivity [29], and lower thermal conductivity corresponds with better temperature control performance [9,23]. Experiments were carried out by Tian et al. [30] to determine the thermal conductivity of PGCs with different proportions of phosphogypsum, cement, and lime, which showed that different proportions have crucial effects on the thermal conductivity. In practice, to further enhance temperature control performance, foaming agents are added to increase the porosity of PGCs [9,23,25]. In detail, the thermal conductivity of physically foamed PGCs was quantitatively measured by Wang et al. [25], who found that the thermal conductivity of PGCs was significantly reduced after adding a physical foaming agent, leading to better temperature control performance. In addition, it is also reported by Feng et al. [23] that the thermal conductivity decreased from 0.46 W·m−1·K−1 to 0.15 W·m−1·K−1 when the foam volume increased up to 60% of the material with 10% cement content; thus, the temperature control performance of foamed PGCs showed a positive correlation with foam volume. Nevertheless, with the increase in porosity, the compressive strength of foamed PGCs decreases [9,25], which increases the risk of wellbore instability. Thus, the synergetic effect between mechanical properties and temperature control performance should be quantitatively evaluated to study the overall performance of foamed PGCs, which was rarely investigated in most accessible research. Additionally, most existing studies about the mechanical properties and temperature control performance of foamed PGCs were limited to experimental studies and ignored theoretical model derivations [9,23,25].
Notably, the pore structures of foamed PGCs are extremely complicated and significantly influence the mechanical properties and temperature control performance, and there exists a competitive state between the mechanical properties and temperature control performance of foamed PGCs with increasing porosity [9,23]. In pursuit of foamed PGCs with the best overall performance, the pore structure of foamed PGCs should be quantitatively characterized, and the impacts of foam dosage on porosity and mechanical and thermal properties need to be revealed. And the synergetic effect between the mechanical properties and temperature control performance of foamed PGCs should be accurately evaluated. Moreover, different foaming methods also exert crucial influences on pore distribution and porosity [9,31]. As presented in the existing literature, the physical foaming method [23,25,32] and the chemical foaming method [33,34] have proved to be effective in increasing the porosity of various cementitious materials. Thus, in this work, these two foaming methods are applied to increase the porosity of foamed PGCs for well cementing in hydrate reservoirs, and the foaming effects of different foaming methods are quantitatively tested.
In general, experiments can precisely determine the thermal conductivity and the compressive strength of foamed PGCs; however, it is quite hard to replicate experiments in the laboratory to quantitatively analyze the influences of different parameters on various properties. Hence, in addition to laboratory tests, theoretical models are derived in this paper to make up for the limitations of experimental work. And the predicted results of the theoretical models are validated against our experimental data, which advances the reasonability of the models. Furthermore, based on the contributions of the experimental work and theoretical work, the overall performance of foamed PGCs for well cementing in hydrate reservoirs considering both mechanical and thermal properties is quantitatively evaluated. In comparison with former studies, this work not only elucidates the effects of porosity on thermal conductivity and compressive strength but also provides suggestions on foaming agent dosages for well cementing PGCs, which makes a contribution to promoting the recycling of phosphogypsum and enhancing safe and stable NGH exploitation as well.

2. Experimental Work

2.1. Experimental Materials

The thermal conductivity and compressive strength of foamed PGCs are tested to evaluate the relationship between porosity, mechanical properties, and thermal properties. It is noteworthy that quicklime, cement, and fly ash are added to hemihydrate phosphogypsum (HPG) to optimize the properties of PGCs for well cementing in NGH reservoirs. The phosphogypsum used in the study is produced in Kaiyang, Guizhou province. Based on the existing research results of Zheng et al. [35], the phosphogypsum directly obtained from the factory is roasted for two hours at 160 °C for further use. The cement used in this study is conch P.O.42.5 ordinary Portland cement, and its main performance indexes are shown in Table 1. In addition, the fly ash (FA) used is provided by Jianshi Mineral Powder Factory in Hebei, China, which is the same as in a previous study [9], and its main chemical composition is shown in Table 2. Furthermore, the CaO content of the quicklime used is more than 97%, and the admixtures used in this experiment are polycarboxylic acid water reducer and gypsum retarder. The experimental composition of PGCs in this work is shown in Table 3.
Notably, the chemical foaming agent used in this work is hydrogen peroxide solution (H2O2) with 30% mass fraction, which was purchased from the market. When preparing foamed PGCs through the chemical foaming method, the required hydrogen peroxide solution is first weighed. Then, the weighed hydrogen peroxide solution is poured into the slurry, quickly stirred, and evenly mixed to foam sufficiently. Moreover, the physical foaming agent is produced by Hefei Bailer Energy Equipment Co., Ltd. (Hefei, China), and uniform physical foam is produced by mixing water and the foaming agent at a foaming agent–water ratio of 1:21 in a foaming machine. Then, the uniform physical foam is added to the slurry and evenly mixed to foam sufficiently.
The preparation steps of foamed PGC specimens are as follows: (1) Weigh the HPG, cement, fly ash, quicklime, and other materials and stir them in an electric mixer for 2 min to obtain a uniform dry powder mixture. (2) Weigh the required quantity of water according to the water–cement mass ratio of 0.3 and mix it with the powder. Stir with an electric mixer at low speed for 30 s, and then stir at high speed for 90 s to obtain a uniform slurry. (3) Weigh the required quantity of foaming agent according to the ratio in Table 3. Pour it into the slurry and evenly stir it. (4) Pour the evenly mixed foam slurry into the test mold for leveling, and cure the prepared specimens in the standard environment for 24 h. (5) Then, demold the specimens and place them in a climate-controlled chamber, and cure the specimens according to the standard ‘Gypsum plasters—determination of mechanical properties’ [36] for the test ages (7 d and 28 d). (6) Place the specimens in the oven and bake them at 42 ± 3 °C for desiccation until the weight is stable. (7) Repeat the above steps to prepare various samples with different foaming agent dosages to quantitatively investigate the properties of foamed PGCs with different porosities.

2.2. Experimental Methods

2.2.1. Porosity

The determination of porosity is based on direct calculations using the mass–volume method, which is expressed as follows [37]:
φ = ( 1 M V · ρ S ) × 100 % ,
where φ denotes the porosity, M is the absolute dry mass of the test sample, V represents the volume of the sample, and ρS is the density of the solid base material. It is worth noting that the solid base material is the PGC without a foaming agent in the present work, which is also called the matrix phase. The volume of the PGC without any foaming agent (the base material) is measured by the drainage method. To be specific, PGC without a foaming agent is first ground, then the base material is passed through a square hole sieve with a side length of 0.16 mm. Moreover, the mass m and volume v of the PGC are measured using an electronic scale and a graduated cylinder, respectively. Finally, the density of the PGC is calculated by the equation ρ S = m / v .

2.2.2. Thermal Conductivity

The thermal conductivity is tested according to the standard ‘Thermal insulation-determination of steady-state thermal resistance and related properties-guarded hot plate apparatus’ [38]. And the test apparatus is the CD-DR3030 thermal conductivity tester produced by China Shenyang Ziwei Heng Testing Equipment Co., Ltd. (Shenyang, China). Notably, the hot plate temperature is 35 °C and the cold plate temperature is 15 °C.

2.2.3. Compressive Strength

The 7 d and 28 d compressive strengths of PGC specimens are tested according to the standard ‘Gypsum plasters-determination of mechanical properties’ [36]. The experimental equipment is the YA-300 microcomputer-controlled electro-hydraulic servo pressure testing machine produced by Changchun Kexin Testing Instrument Co., Ltd. (Changchun, China).

2.3. Experimental Results

Figure 1 depicts the test results of the thermal conductivity and porosity of foamed PGCs obtained through different foaming methods. It can be seen from Figure 1a that the porosity increases with increasing physical foam dosage. Specifically, as the physical foam content added to the PGCs increases from 2% to 6%, the porosity increases rapidly by 15.69% and 9.81%. However, as the foam dosage increases continuously from 6% to 14%, the growth rate slows down, increasing by 3.91%, 3.35%, 7.58%, and 5.23%, respectively. This phenomenon is attributed to both the inherent instability of the foam and the constant stirring process, and the physical foam tends to break when the foam agent increases up to a certain value [9]; hence, the increase in porosity is less obvious. Moreover, the thermal conductivity of foamed PGCs gradually decreases as the physical foam dosage increases. That is because, as the physical foam dosage increases, the pore space in foamed PGCs continues to increase, which has a good insulation effect on heat transfer [9]. Additionally, the thermal conductivity of the pore space is much lower than that of the matrix phase; thus, the thermal conductivity of foamed PGCs decreases with increasing porosity [39,40].
It can be seen from Figure 1b that, with increasing chemical foam content, the chemical foaming agent is fully decomposed in PGCs, and the porosity exhibits rapid growth. To be specific, the porosity of PGCs increases up to about 65% with a chemical foaming agent dosage of merely 2.4%. Moreover, the thermal conductivity gradually decreases, and the decrease rate accelerates. This is because, during the decomposition of hydrogen peroxide, due to different hydrogen peroxide contents and slurry resistances in different gas cores, the air pressure differs with different pores, which aggravates the pore aggregation phenomenon. Thus, the thermal conductivity shows an accelerating decrease rate because of pore aggregation and pore connection.
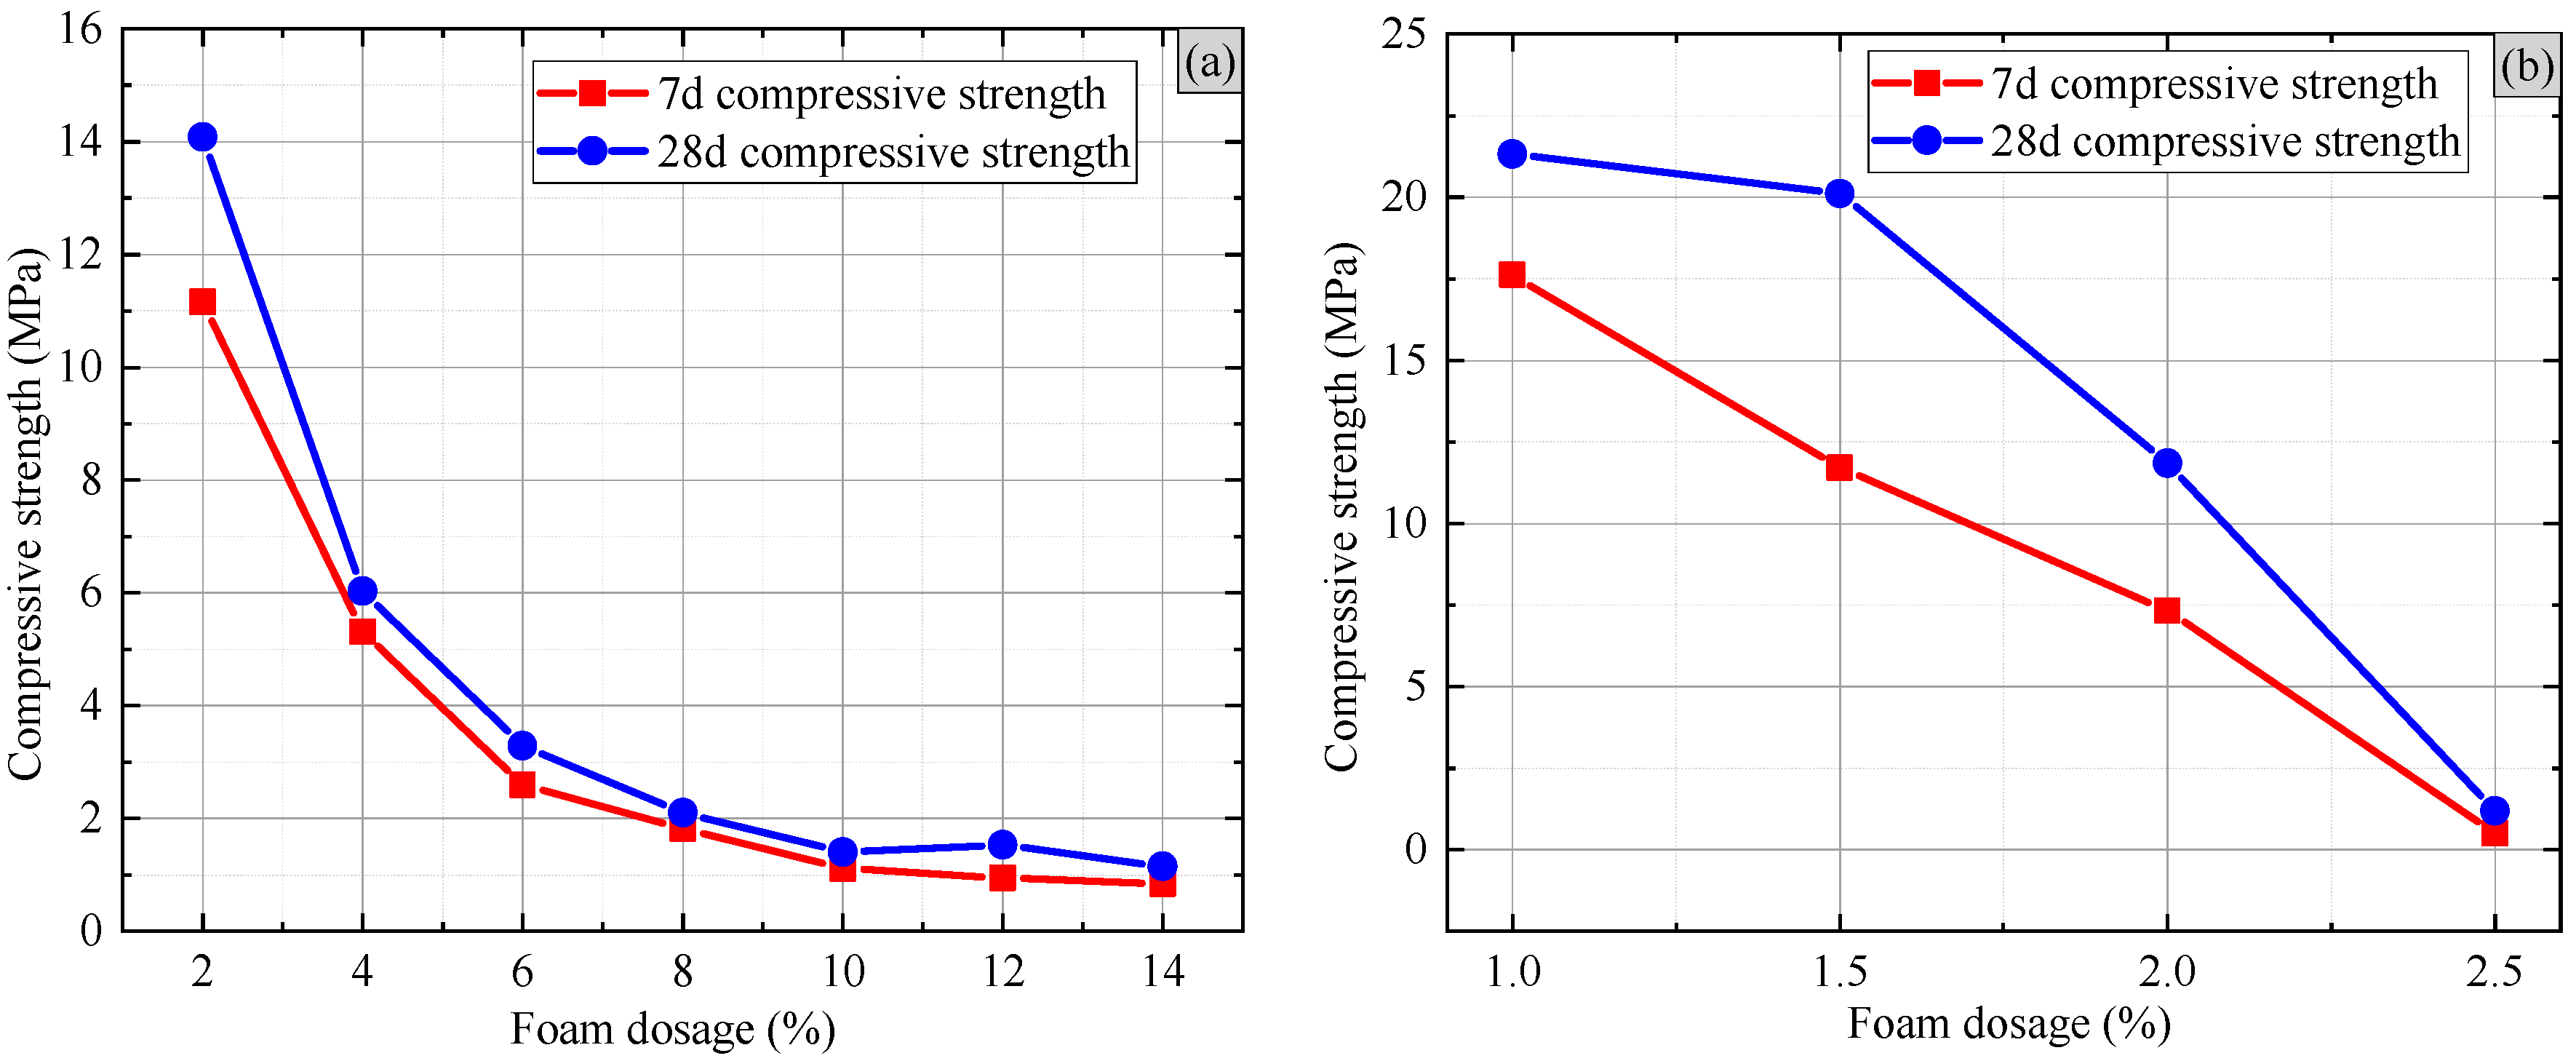
Figure 2 shows the experimental results of the 7 d and 28 d compressive strengths of foamed PGCs obtained through different foaming methods. As depicted in Figure 2a, the compressive strength decreases with physical foam dosage. This phenomenon is attributed to the fact that, as the foaming agent dosage increases, the pores in foamed PGCs increase, leading to a smaller distance between pores. As a result, during the loading process in the compressive strength tests, the stress concentration phenomenon around the solid phase between pores is serious, resulting in quick destruction [9,23]. And the macroscopic performance of the stress concentration phenomenon is expressed as reduced compressive strength. Furthermore, as shown in Figure 2a, the compressive strength of foamed PGCs is improved from 7 d to 28 d. Specifically, the specimen with 2% foam content exhibits the greatest increase in compressive strength during the curing time, which increases by 2.91 MPa. This is because, under lower porosity conditions, there are larger proportions of cement particles and phosphogypsum participating in the hydration process in per unit volume, leading to a greater compressive strength increase [41,42].
As depicted in Figure 2b, the compressive strength decreases with increasing chemical foam dosage and increases from 7 d to 28 d. This phenomenon is attributed to the fact that, as the content of hydrogen peroxide increases, the pore size of foamed PGCs increases, and the macroscopic performance manifests in reduced compressive strength due to stress concentration, which is similar to Figure 2a. Compared with the physical foaming method, the effect of the chemical foaming method on the compressive strength of foamed PGCs is more obvious. The probable reason is that, during the chemical foaming process, the distribution of foaming agent H2O2 cannot be completely uniform in the slurry. Therefore, the foaming agent content in various pores is different, which generates pores with different sizes, resulting in pressure difference between pores [9,43]. Then the pores with low pressure tend to gather with pores with high pressure, which means that pore aggregation occurs. Due to the pore aggregation phenomenon, there may exist pores with excessive sizes [9,43], which significantly increase the stress concentration and decrease the compressive strength of foamed PGCs for well cementing in NGH reservoirs.

3. Theoretical Work

3.1. Thermal Conductivity Model

The pore structures of cementitious materials are extremely complicated and significantly influence their temperature control performance [9,23]. Thus, to precisely evaluate temperature control performance, the pore structure of foamed PGCs should be quantitatively characterized. It has been reported in previous studies that the pore structures of cementitious materials exhibit fractal features and satisfy the fractal theory [44,45,46]. Hence, the fractal theory is applied to characterize the pore structures of foamed PGCs for simplification in this work.
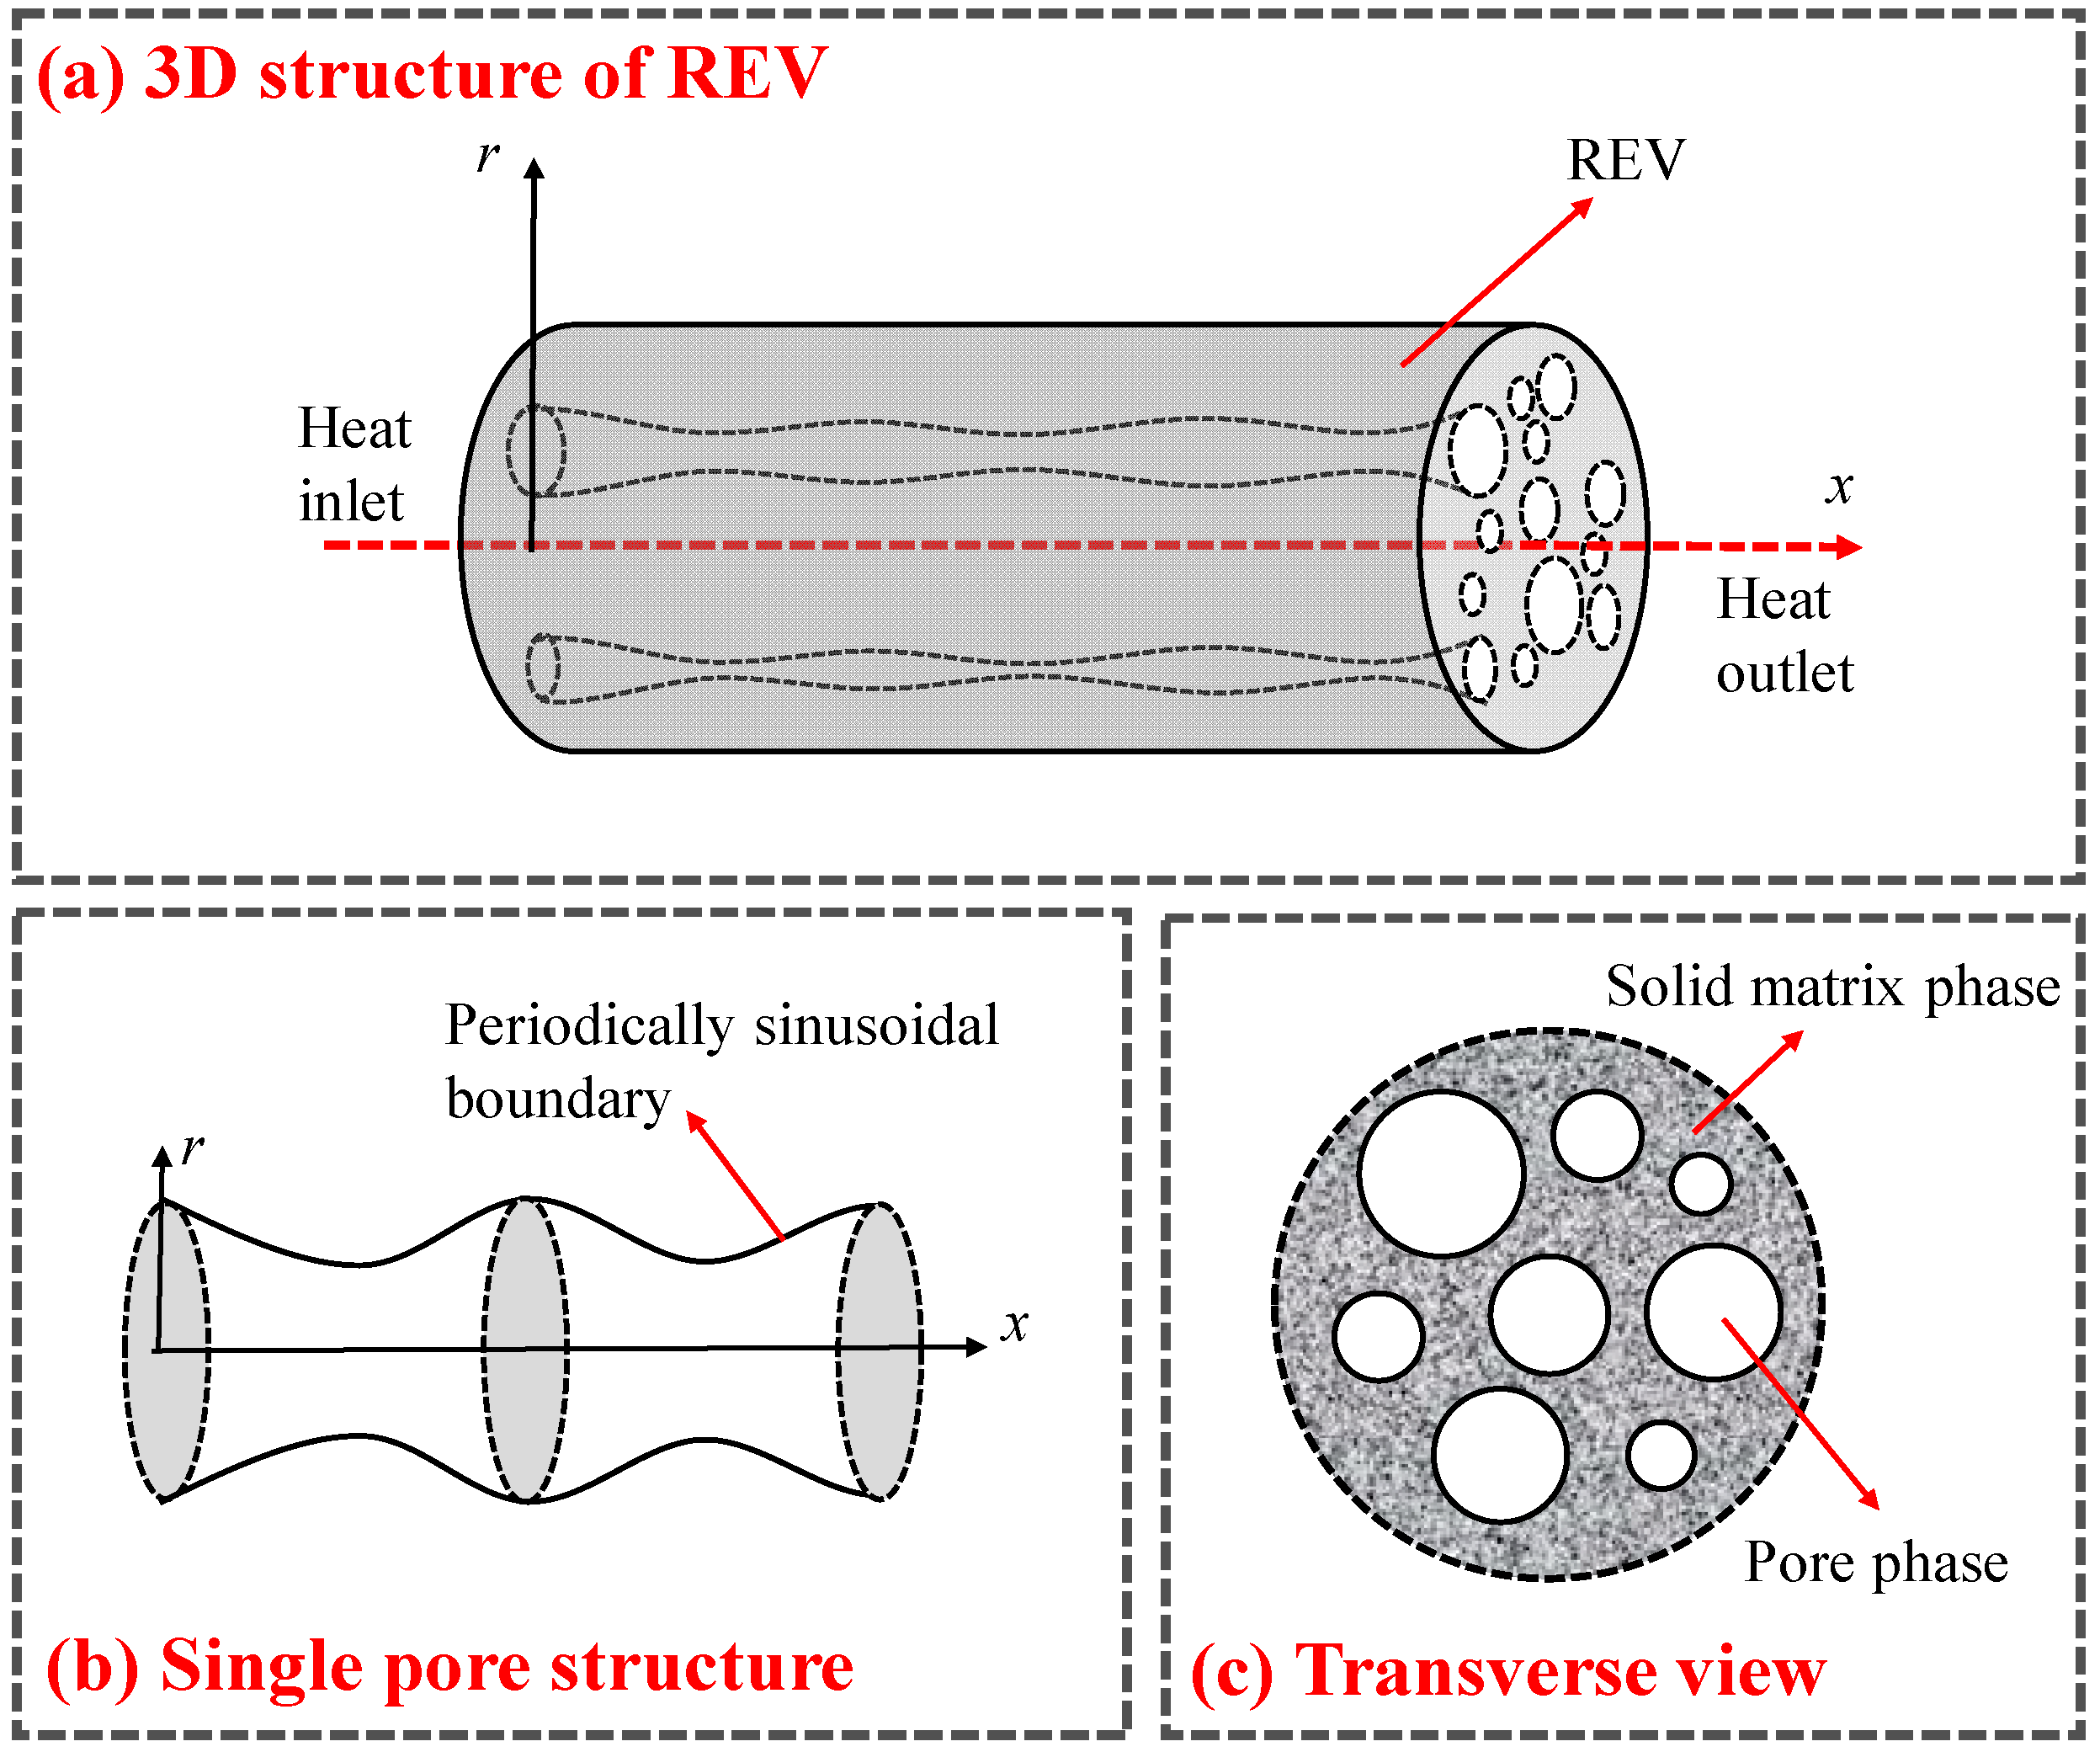
As depicted in Figure 3a, during the heat conduction process, we focus on the physical property parameter of cylindrical representative elementary volume (REV) to represent the whole foamed PGC [39,40]. In this paper, the analytical thermal conductivity model of foamed PGCs is developed based on the following assumptions:
(1)
The boundaries of the pores in foamed PGCs are not straight but periodically sinusoidal along their lengthwise direction (x-direction in Figure 3b). That is, the pore radius changes in a single pore [39,47].
(2)
As the preparation technology of foamed PGCs includes the sample drying process [9], the residual water in the composite cementitious material is neglected in this work.
(3)
Each single unit cell in Figure 3c shares the same porosity, and the pores are air-filled. In addition, foamed PGC unit cells are statistically self-similar (satisfy the fractal theory) [48].
Based on the assumption that the pores in foamed PGCs satisfy the fractal theory, the pore fractal dimension Df is given by [48,49]:
D f = 2 ln φ ln ( d min / d max ) ,
where dmin and dmax denote the minimum and the maximum pore diameters, respectively; and φ is the porosity of foamed PGCs.
The representative elementary volume (REV) is the smallest volume over which a measurement or simulation can be carried out to produce a result that is representative of the macroscopic properties [50,51]. Since the pore structure of foamed PGCs is extremely complicated [9], this work focuses on the REV of foamed PGCs to reduce the difficulty in pore characterization. However, the direct determination of REV always depends on continually repeating experiments or massive calculations of numerical simulation, which consumes much time [50,51]. As an alternative, the REV of foamed PGCs can be determined based on the fractal theory, which has been widely accepted in existing studies on heat and mass transfer in porous materials [44,45,46]. Additionally, according to the existing literature, the REV of porous materials can be cylindrical [40,47] or cubic [52,53]. As the samples of PGCs are cylindrical [11,18], to simulate the real conditions of PGC samples, a cylindrical REV is applied in present work. To be specific, the characteristic length of the cylindrical REV of foamed PGCs L0 can be determined as follows [39,40,47]:
L 0 = D f ( 1 φ ) φ ( 2 D f ) d max .
Moreover, the diameter of the cylindrical REV is equal to its characteristic length L0 [39,47].
And the tortuosity fractal dimension of the pores DT is given by [48,54]:
D T = ( 3 D f ) + ( 2 D f ) ln D f ln ( D f 1 ) ln φ .
According to the derivation in Appendix A, the total thermal resistances of the pore phase Rp and matrix phase Rm in foamed PGCs can be obtained by the following equation:
{ R p = 4 L 0 D T ( 1 + D T D f ) k p π ( 1 a 2 ) 3 / 2 D f d max 1 + D T [ 1 ( d min / d max ) 1 + D T D f ] R m = L 0 ( 1 φ ) A c ξ k m ,
where kp and km represent the thermal conductivities of the pore phase and the matrix phase, respectively; parameter a is the radius fluctuation amplitude; and ξ denotes the correction parameter considering other additives. And parameter Ac is the cross-sectional area of the cylindrical REV in foamed PGCs, which can be calculated by A c = π L 0 2 / 4 [47].
It can be assumed that, during the heat transfer process in foamed PGCs, the thermal resistances of different phases are parallel with each other [40,47]. Hence, the total thermal resistance of foamed PGCs Rt satisfies the following relationship:
1 R t = 1 R p + 1 R m .
Combining the definition of the thermal conductivity with Equation (6), the thermal conductivity of foamed PGCs for well cementing in NGH reservoirs can be determined as follows:
k e = L 0 A c 1 R t = L 0 A c ( 1 R p + 1 R m ) = ξ ( 1 φ ) k m + k p ( 1 a 2 ) 3 / 2 D f d max 1 + D T [ 1 ( d min / d max ) 1 + D T D f ] L 0 D T + 1 ( 1 + D T D f ) .

3.2. Compressive Strength Model

A compressive strength model of composite cementitious materials was proposed by Popovics and Ujhelyi [55], which considers the effects of the water–cement ratio and volume fraction of air on strength and is expressed as follows [55]:
f c = A B [ ( w / c ) + m c ] × 10 100 γ φ ,
where fc′ denotes the compressive strength, A represents the maximum strength-developing capacity of the cement, and B denotes the water sensitivity of cement. It is noteworthy that parameters A and B are empirical parameters that are independent of the strength and water–cement ratio w/c [55]. In addition, c is the cement content ratio, γ is an experimental parameter that is independent of the strength and the curing time [55], and m denotes the empirical parameter obtained by curve fitting, which can be determined as 0.000636 m3/kg [55].
Notably, as a kind of composite cementitious material, the compressive strength of foamed PGCs can be predicted by Equation (8).

3.3. Workflow of Theoretical Models

The determination process for the thermal conductivity and the compressive strength of foamed PGCs for well cementing in NGH reservoirs is illustrated in Figure 4. The main workflow can be outlined as follows:
Step 1: Input the relevant data into the theoretical models, including the radius fluctuation amplitude a, the thermal conductivities of matrix phase km and pore phase kp, the porosity φ, the minimum pore diameter dmin and the maximum pore diameter dmax, a correction factor considering the inter-phase heat exchange ξ, the maximum strength-developing capacity of the cement A, the water sensitivity of the cement B, the water–cement ratio w/c, the cement content c, and experimental parameters γ and m. The parameters mentioned above are divided into undetermined parameters and determined parameters. It is worth noting that a = 0.1 [47], dmin/dmax = 0.001 [39,47], A = 47.31 MPa [55], γ = 0.0215, and m = 0.000636 m3/kg [55] in this work. Other determined parameters are identical to the experimental conditions. Nevertheless, parameters ξ and B are quite hard to obtain; hence, they are considered as undetermined parameters, which are firstly given initial estimations.
Step 2: Obtain the pore fractal dimension using Equation (2). Moreover, determine parameters L0 and DT using Equations (3) and (4), respectively. Then, calculate the thermal resistances of the pore phase Rp and matrix phase Rm using Equation (5).
Step 3: Then, the thermal conductivity and compressive strength of foamed PGCs are obtained by Equations (7) and (8), respectively. If the predicted results are unsatisfactory with the test data, update the undetermined parameters, and repeat the steps mentioned above until the predictions well agree with the experimental results. By combining the calibrated parameters with Equations (7) and (8), the thermal conductivity and compressive strength of foamed PGCs under different porosity, water–cement ratio, and dosage of raw materials conditions can be predicted.

4. Results and Discussion

4.1. Model Validation against Experimental Results

4.1.1. Validation of Thermal Conductivity

The proposed thermal conductivity model is validated against our experimental data, and the comparison results are shown in Figure 5. According to the experimental results, the thermal conductivity of the matrix phase without adding a foaming agent is km = 0.3383 W·m−1·K−1. Furthermore, parameter kp = 0.026 W·m−1·K−1 [56] is used in the model calculations, and because there are no other additives mixing into the matrix phase, parameter km does not need to be corrected, i.e., the correction factor ξ = 1 in this case. As depicted in Figure 5, the thermal conductivity of foamed PGCs decreases with increasing porosity. That is because, as the porosity increases, the pore space volume fraction increases, and the matrix phase volume fraction decreases. In addition, the thermal conductivity of the pore phase is lower than that of matrix phase; hence, the thermal conductivity of the composite cementitious material declines. Figure 5 also indicates that, under identical porosity conditions, the thermal conductivity of the chemically foamed sample is slightly larger than that of the physically foamed sample. The probable reason is that the chemical foaming method is uncontrollable, which may result in more connective pores with larger sizes, which enhances convective heat transfer, leading to larger thermal conductivity [9]. Notably, the predicted thermal conductivity results are well in agreement with our test data, which suggests the accuracy of our derived theoretical model. Hence, foamed PGCs with larger porosity correspond with better temperature control performance, which are preferred for well cementing in NGH reservoirs to retard heat transfer between the wellbore and the formation, reducing undesirable gas channeling.
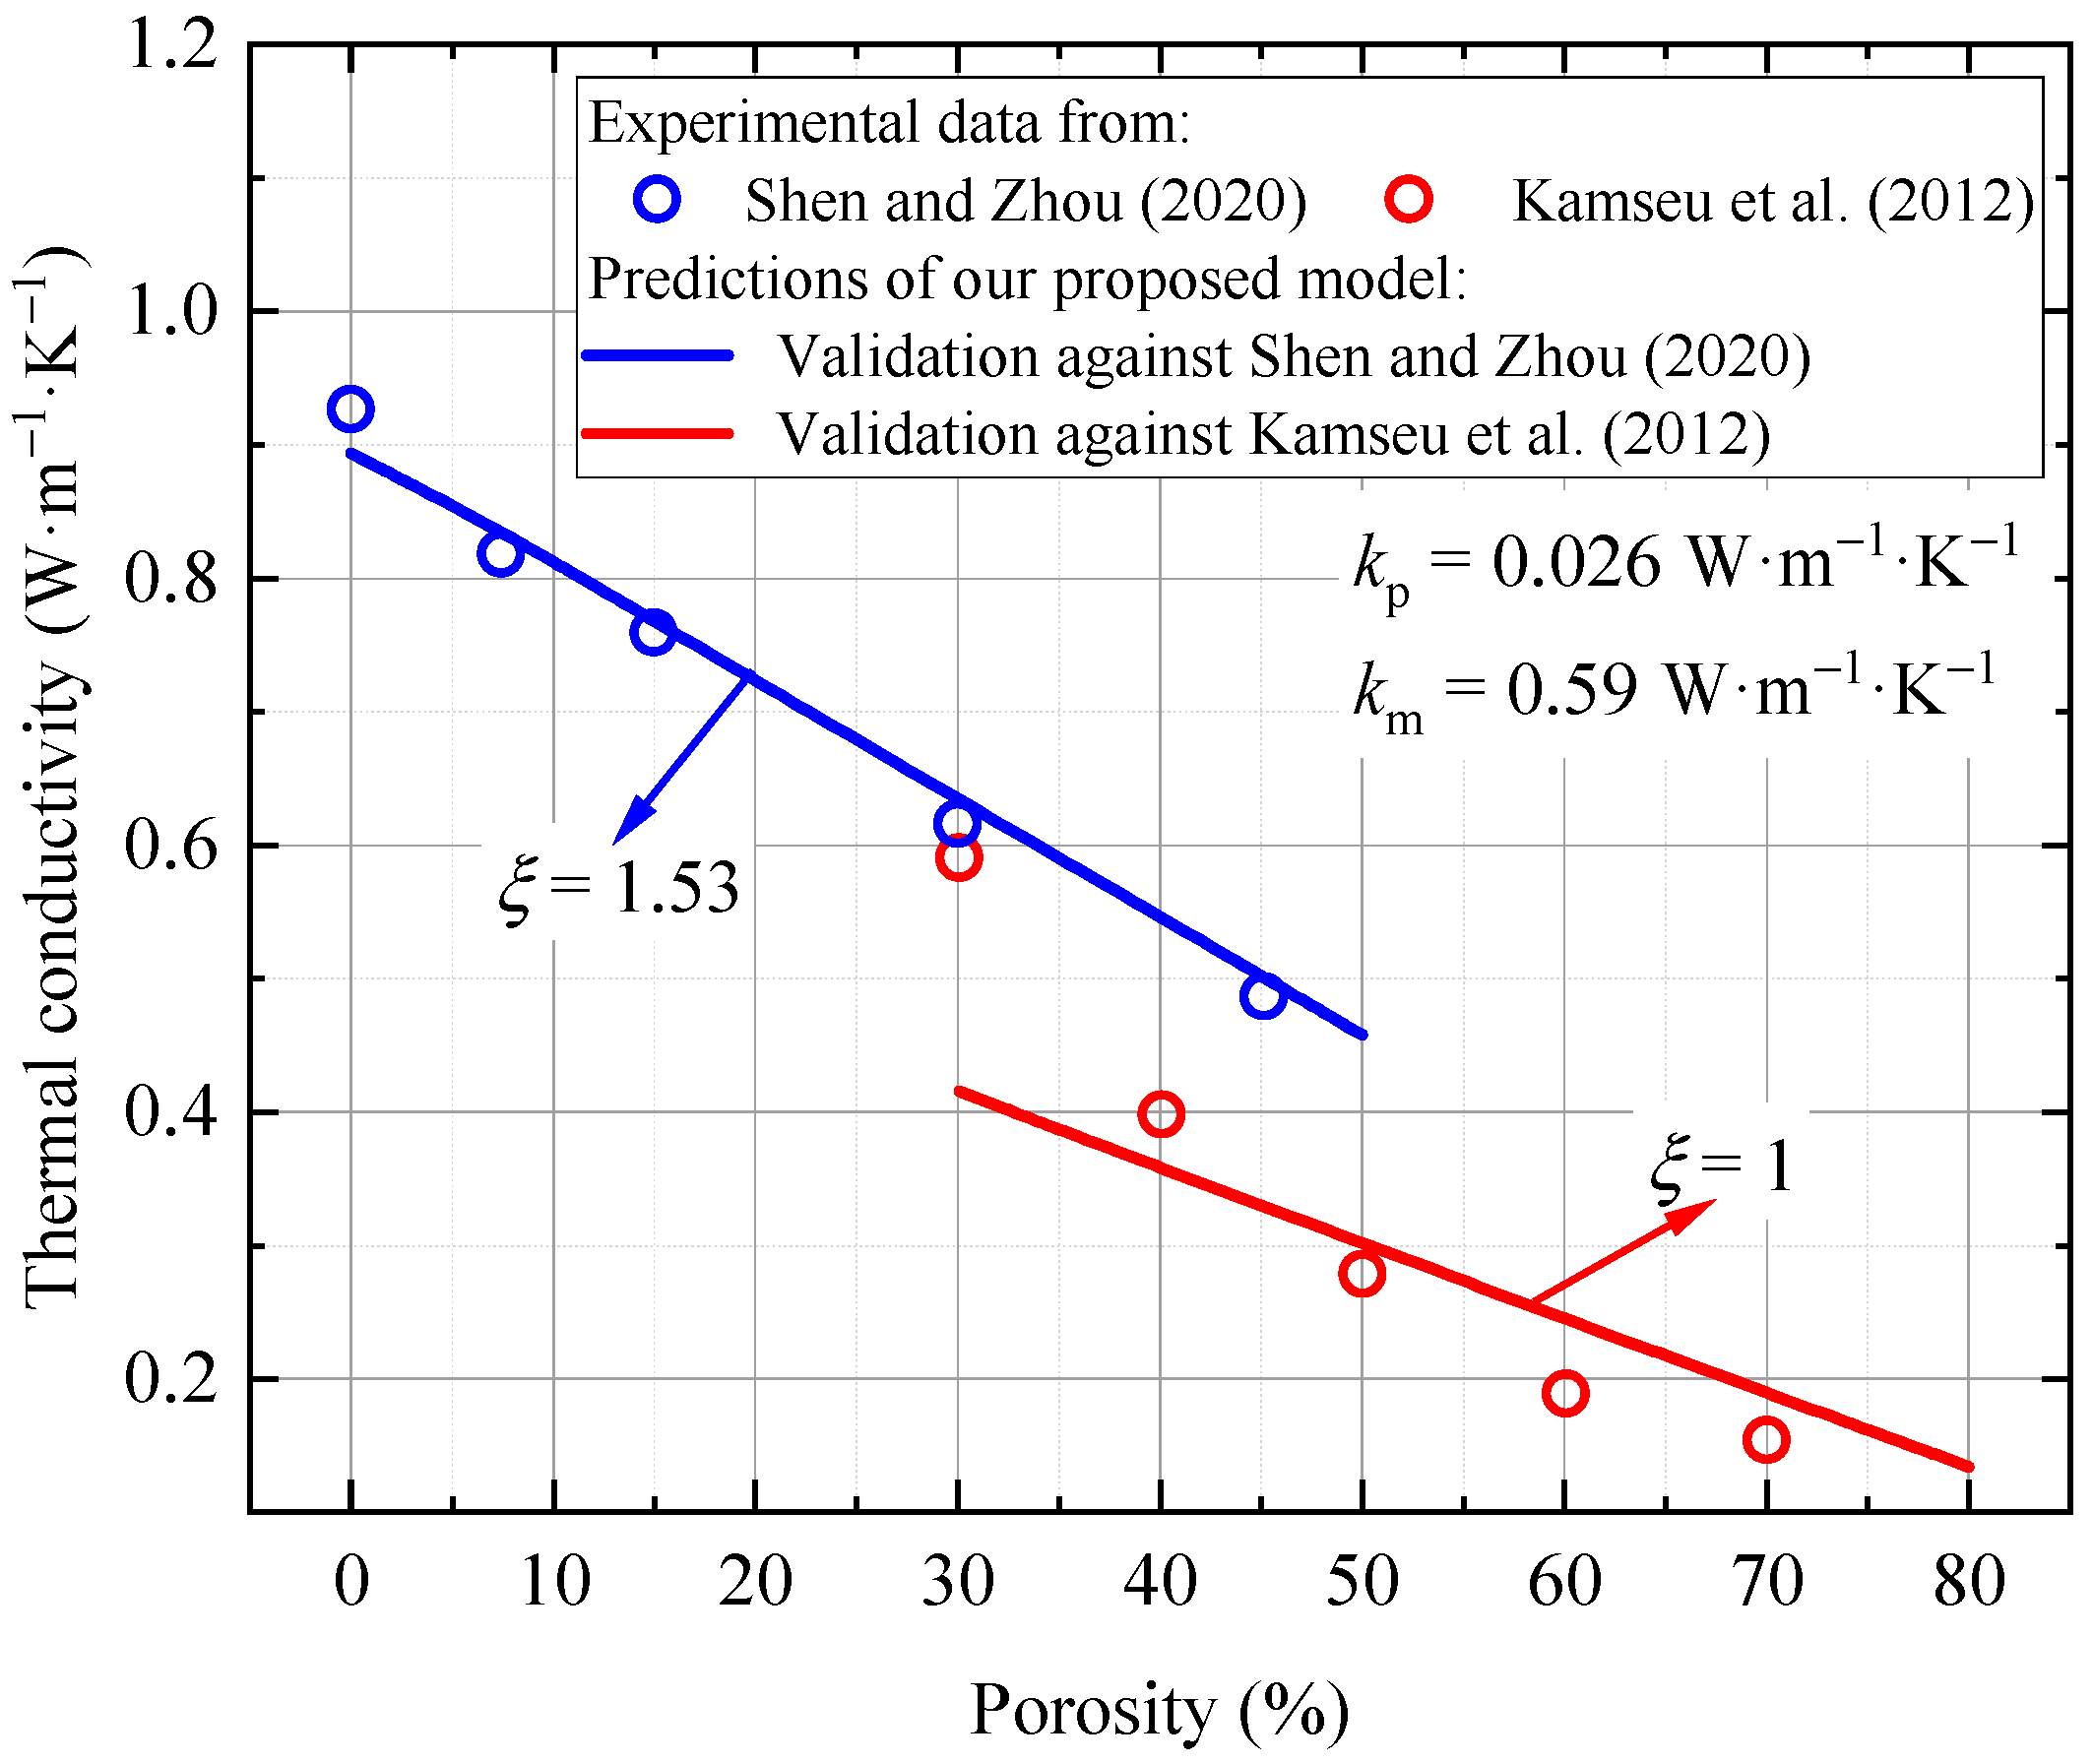
To further validate our proposed thermal conductivity model, the predicted results are compared with two groups of experimental data from accessible research in Figure 6 [57,58]. To simulate the experimental conditions, parameter km = 0.59 W·m−1·K−1 [57] is applied in these cases, and parameter kp is determined as 0.026 W·m−1·K−1 [56]. The parameter ξ = 1 is applied in the validation against test data of porous inorganic polymer cements from Kamseu et al. [57] because there exist no other additives in the matrix phase. However, the correction factor ξ = 1.53 is used in the validation against the experimental data of Shen and Zhou [58] due to the addition of microparticles, the thermal conductivity of which is much larger than that of the cementitious composite matrix. Figure 6 demonstrates that the thermal conductivity of cementitious composite materials decreases with increasing porosity, for a similar reason as was elaborated in Figure 5. Figure 6 also shows that the calculation results fit well with the test data, which certifies that the derived theoretical model can be effectively applied to other cementitious composite materials, and it indicates that the determination of undetermined parameters is reasonable.
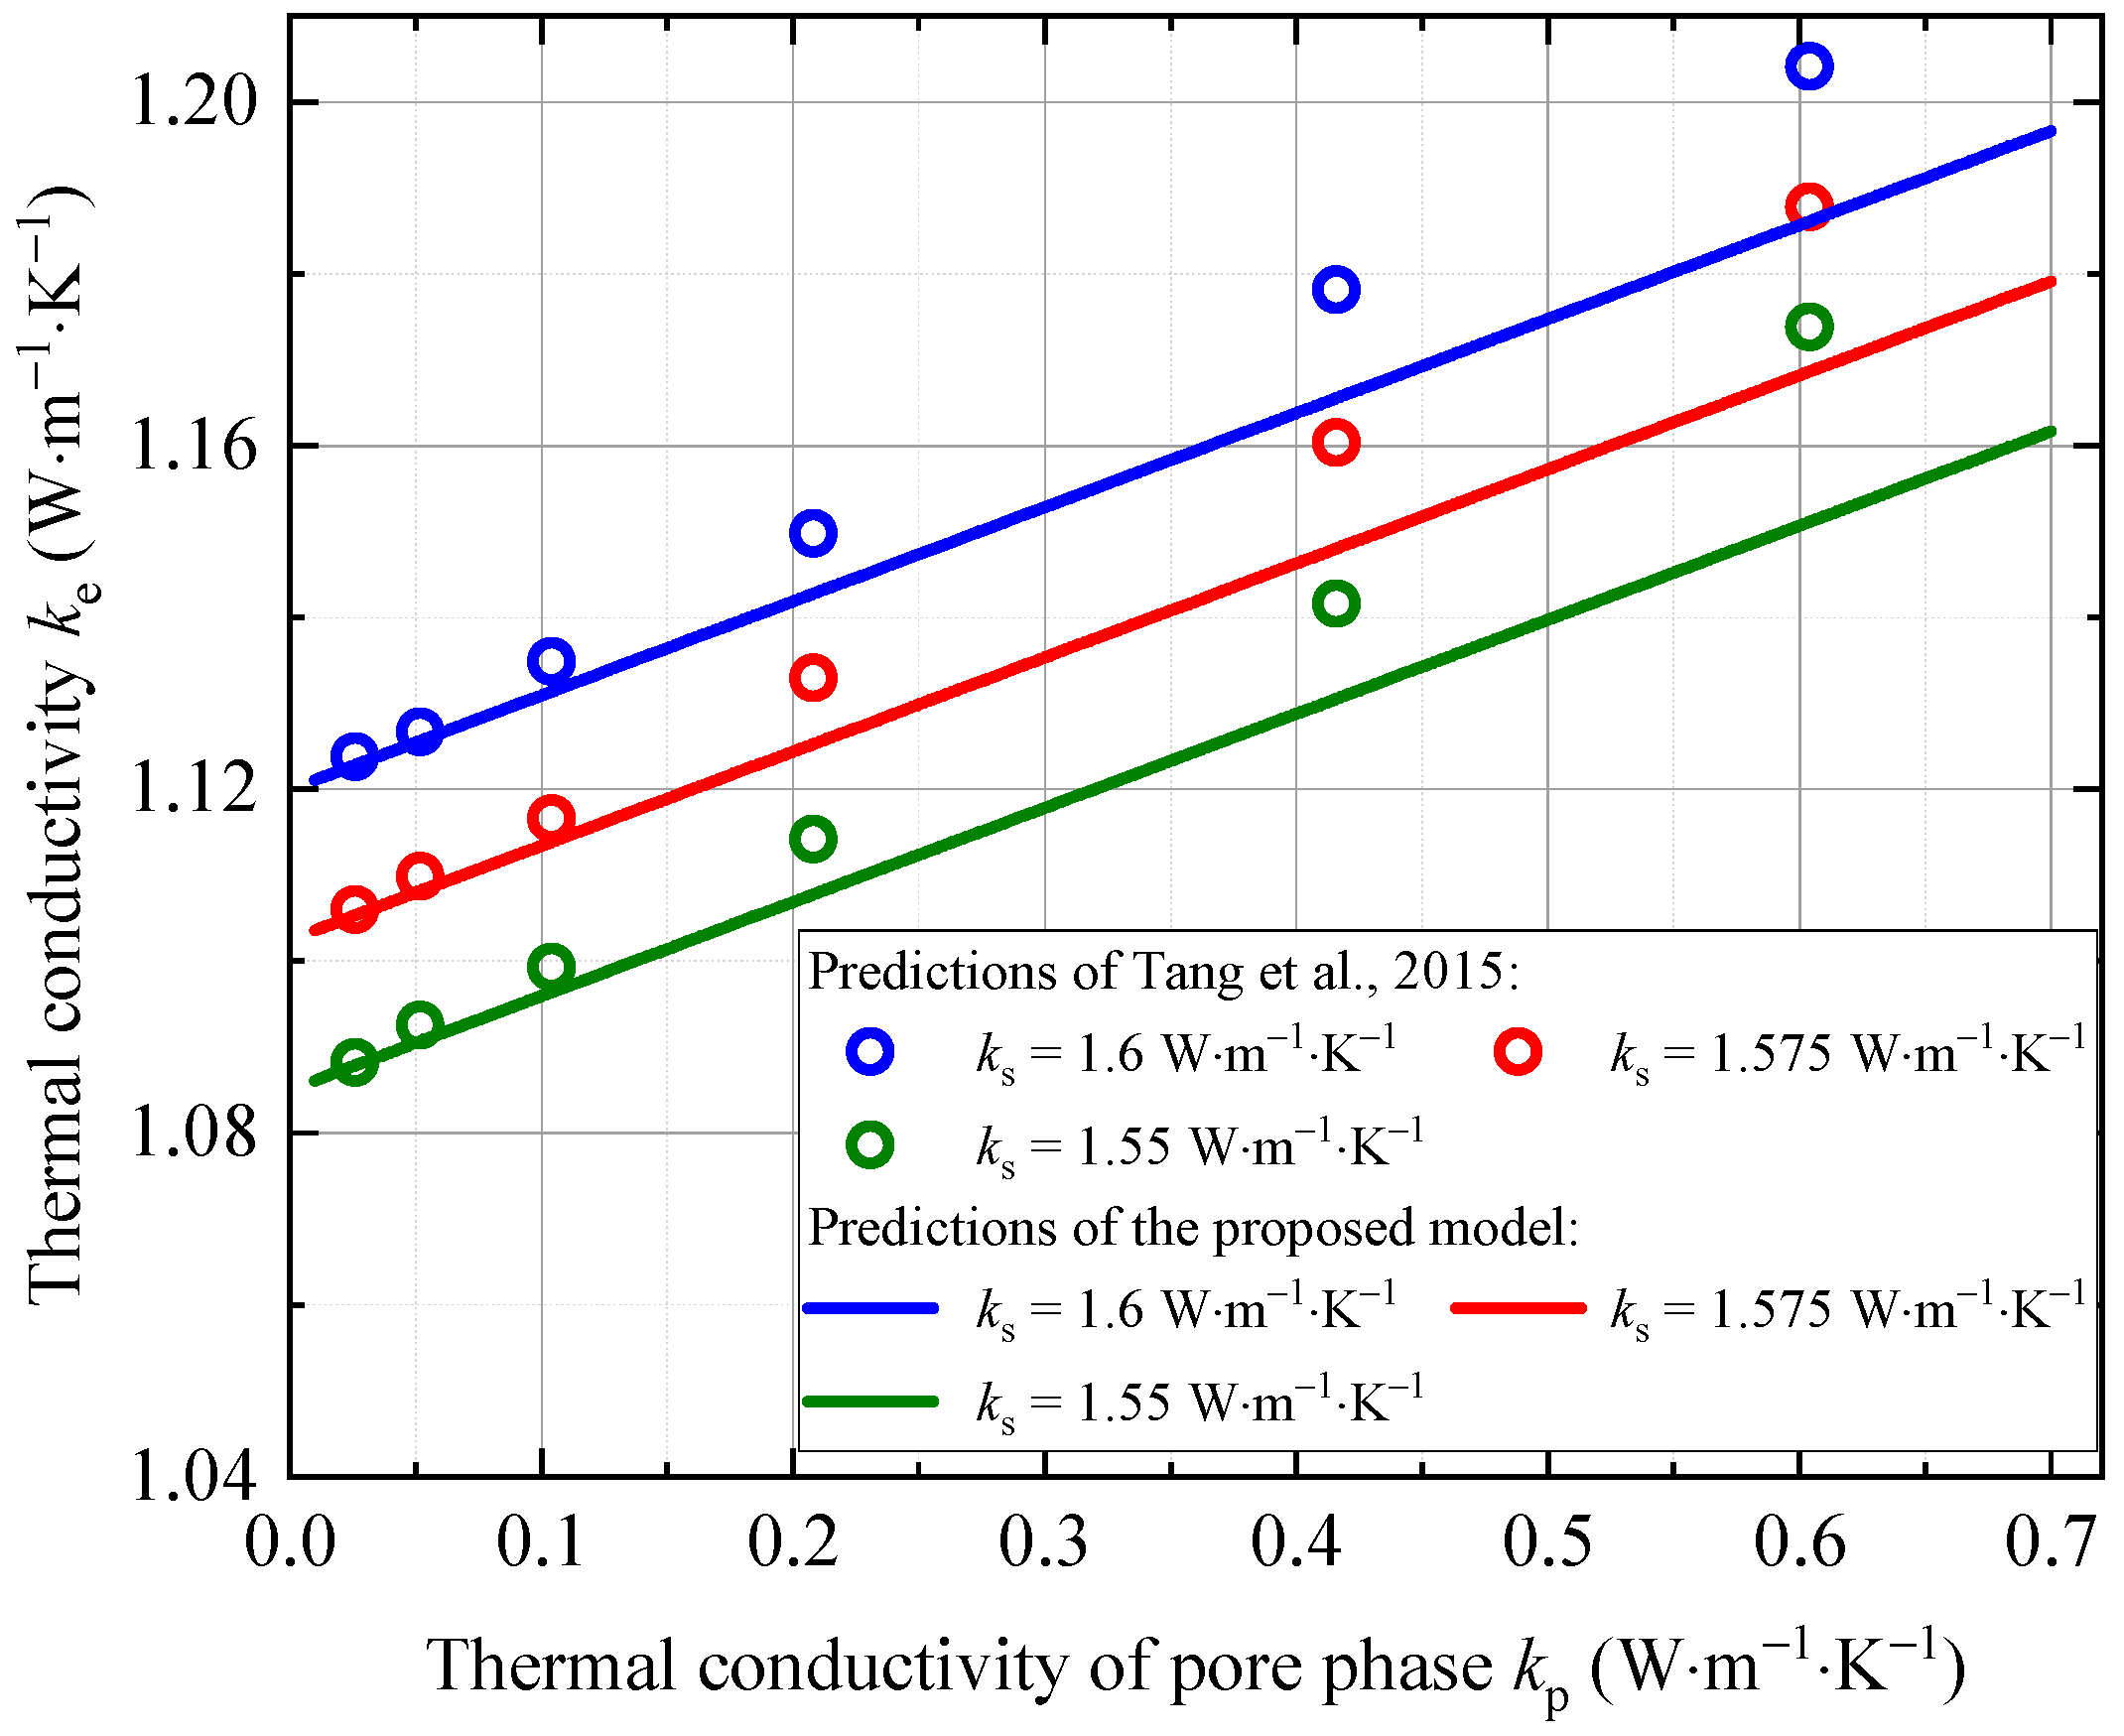
In addition, the predicted results of the proposed thermal conductivity model are compared with the predictions of the previous model by Tang et al. [59], and the comparison results are shown in Figure 7. In this case, the porosity of cementitious materials is determined as 30% according to Tang et al. [59]. Notably, since there is no other additive in the cementitious materials, the correction parameter ξ is equal to unity during model calculations. As depicted in Figure 7, the thermal conductivity predictions of the proposed model are obviously lower than those of the previous model. This phenomenon may be attributed to the fact that the pores are considered as tortuous capillaries in the present work, which is closer to actual pore structures. Instead, the pores in the model by Tang et al. [59] are assumed to be straight capillaries. Since the tortuosity of pores significantly retards the heat conduction process and increases the thermal resistance of the pore phase Rp [39,47], the previous model by Tang et al. [59] underestimated Rp, resulting in overestimated thermal conductivity results for cementitious materials. Hence, the predicted results are more reasonable and can provide a more accurate thermal conductivity of cementitious materials.

4.1.2. Validation of Compressive Strength

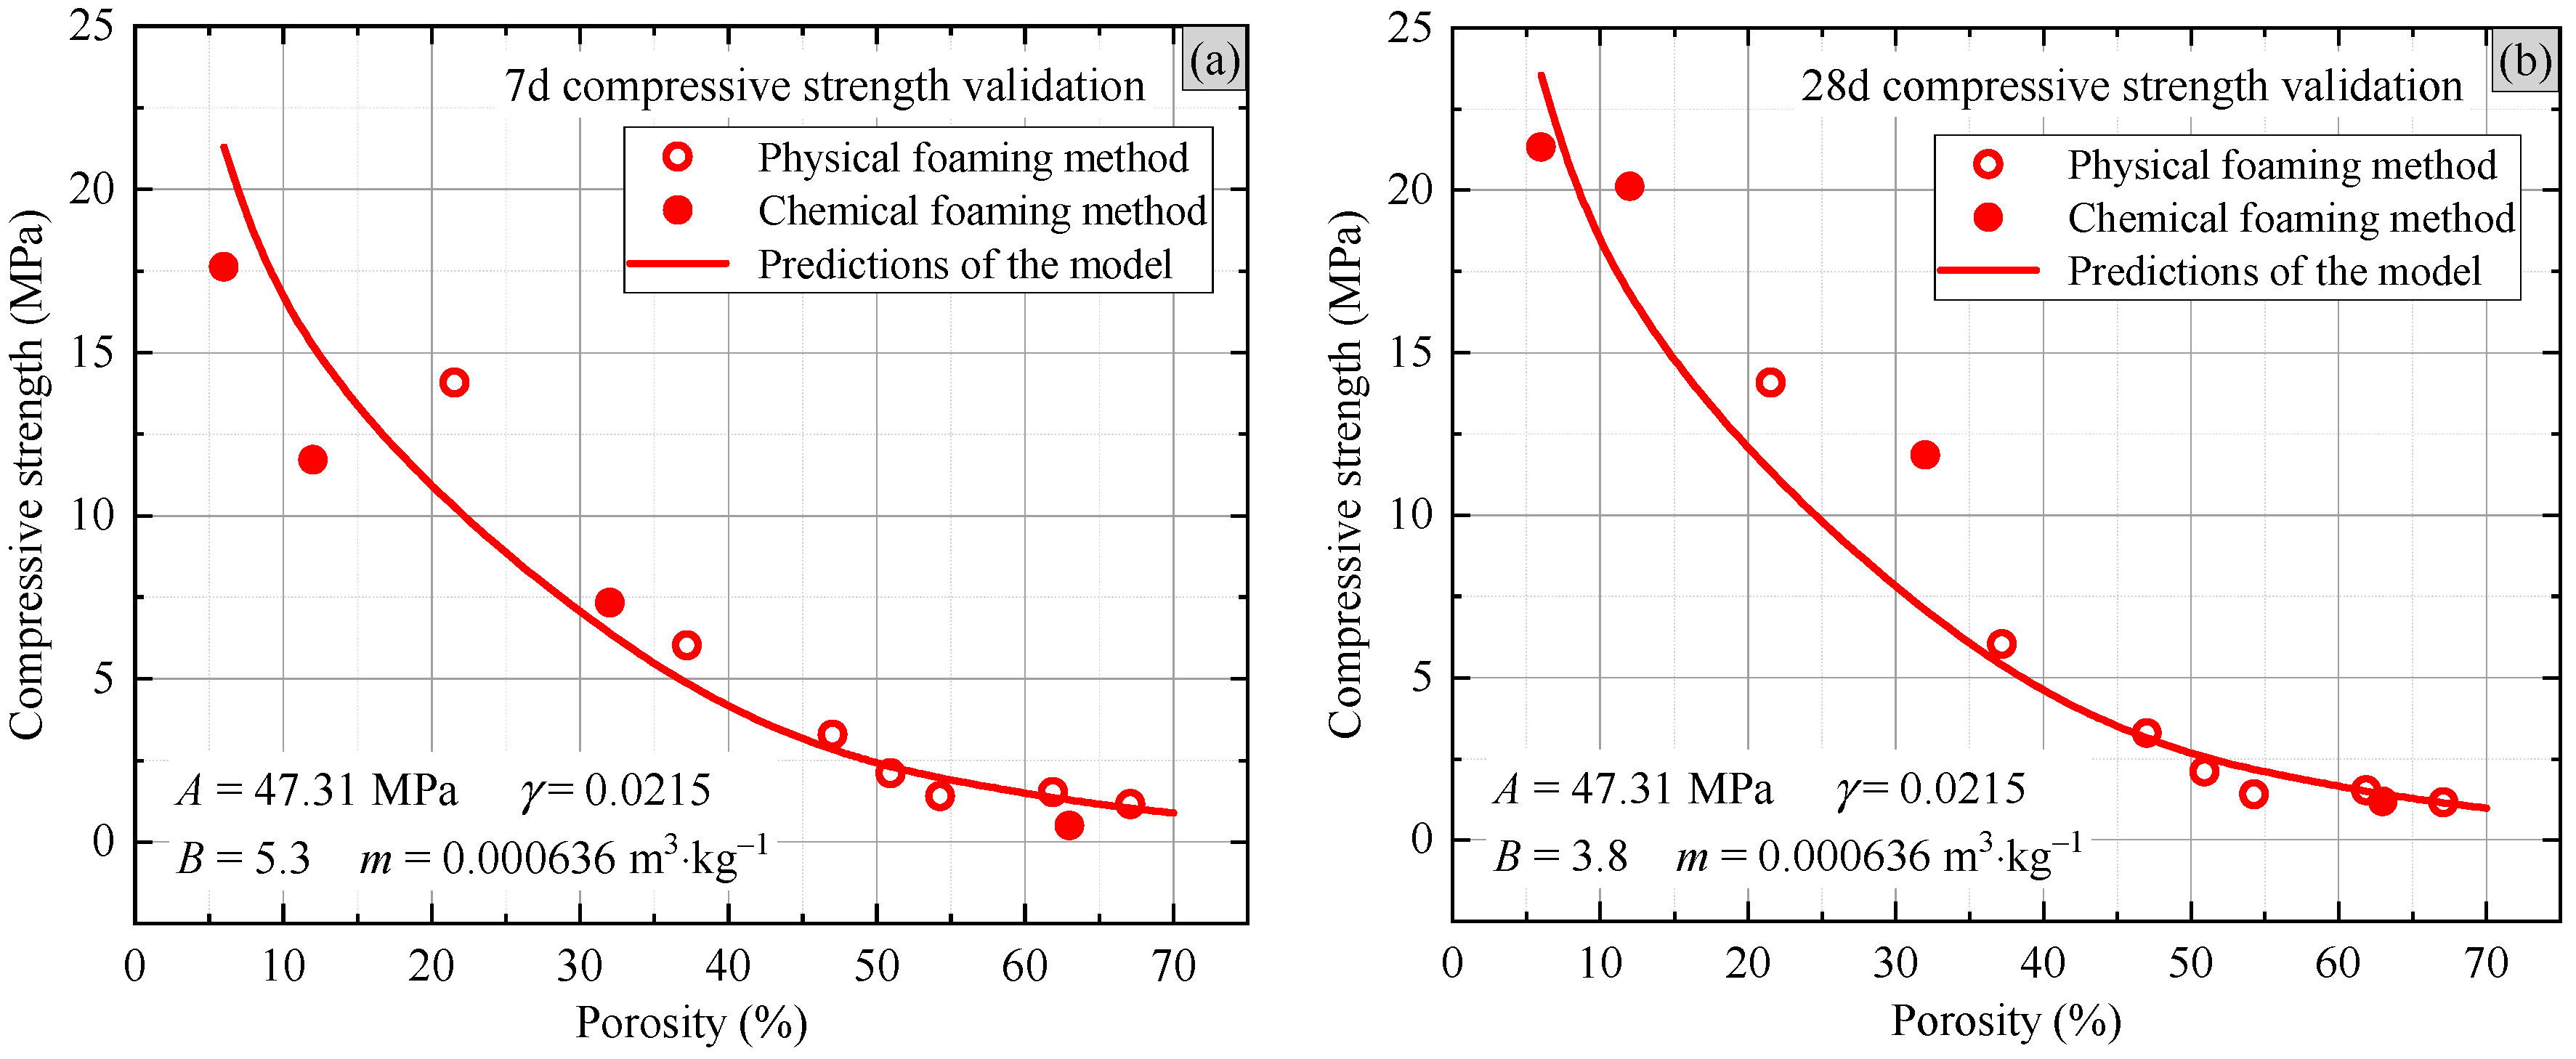
To validate the compressive strength model of foamed PGCs for well cementing in NGH reservoirs, a comparison between the predicted compressive strength and our experimental results (physical and chemical foaming methods) is presented in Figure 8. As mentioned in Table 3, the water–cement ratio w/c = 0.3 and the cement content ratio c = 0.7 for the tested foamed PGCs. To match the test conditions, these parameters are applied in the theoretical model calculations in this case. In addition, as parameter γ is independent of age [55], γ is determined as 0.0215 for both 7 d and 28 d compressive strength validations. Although the water sensitivity of cement B is independent of the strength and water–cement ratio, it is strong related to age and materials [55]. As the curing age increases, hydration of the cement constantly occurs, and the water sensitivity of cement decreases. Thus, parameter B is applied as 5.3 for 7 d samples and 3.8 for 28 d samples in the model calculations, which is reasonable. It is noteworthy that all of the parameters used in this validation are considered to be independent of the foaming method (physical or chemical foaming method).
As depicted in Figure 8a,b, the 7 d and 28 d compressive strengths show a negative correlation with porosity. This is because, as the porosity increases, the proportion of pore space increases. And the pore space cannot provide enough strength; thus, the material fails to support high pressure, leading to lower compressive strength. In addition, the 7 d compressive strength is much lower than 28 d compressive strength. This is because, with increasing curing age, hydration of the cement constantly occurs and foamed PGCs harden, resulting in larger compressive strength. It is also shown in Figure 8a,b that the results of the theoretical compressive strength model are satisfactory with our experimental data, which indicates that the model is effective in predicting the compressive strength of foamed PGCs under different curing age conditions. Moreover, the results manifest that compressive strength is independent of the foaming method. As the mechanical properties of foamed PGCs deteriorate with increasing porosity, the application of foamed PGCs with lower porosity can enhance wellbore stability in NGH exploitation.

4.2. Overall Performance Index Evaluation

When foamed PGCs are utilized as well cementing materials for NGH exploitation, they are expected to have better mechanical properties (i.e., larger compressive strength) and better temperature control performance (i.e., lower thermal conductivity) [6,9]. Nevertheless, as depicted in Figure 6, Figure 7 and Figure 8, both compressive strength and thermal conductivity decrease with the addition of a foaming agent. That is, the larger porosity of PGCs corresponds with better temperature control performance but worse mechanical properties. Hence, an overall performance index τ is introduced to consider the synergetic effect between mechanical and thermal properties and describe the competitive system.
The mechanical properties of foamed PGCs are represented by the normalized 28 d compressive strength Cc, which is calculated as follows:
C c = f c f cmin f cmax f cmin ,
where f cmin and f cmax denote the minimum and the maximum 28 d compressive strength within the scope of the dataset, respectively.
However, the temperature control performance of foamed PGCs is represented by the inverse membership degree parameter Ct of the normalized thermal conductivity. The reason is that a larger thermal conductivity corresponds with worse temperature control performance and a low score. Thus, parameter Ct can be determined as follows [60]:
C t = 1 k e k emin k emax k emin ,
where kemin and kemax denote the minimum and the maximum thermal conductivity within the scope of the dataset, respectively.
Based on Equations (9) and (10), the overall performance index τ is given by:
τ = C t λ t · C c λ c ,
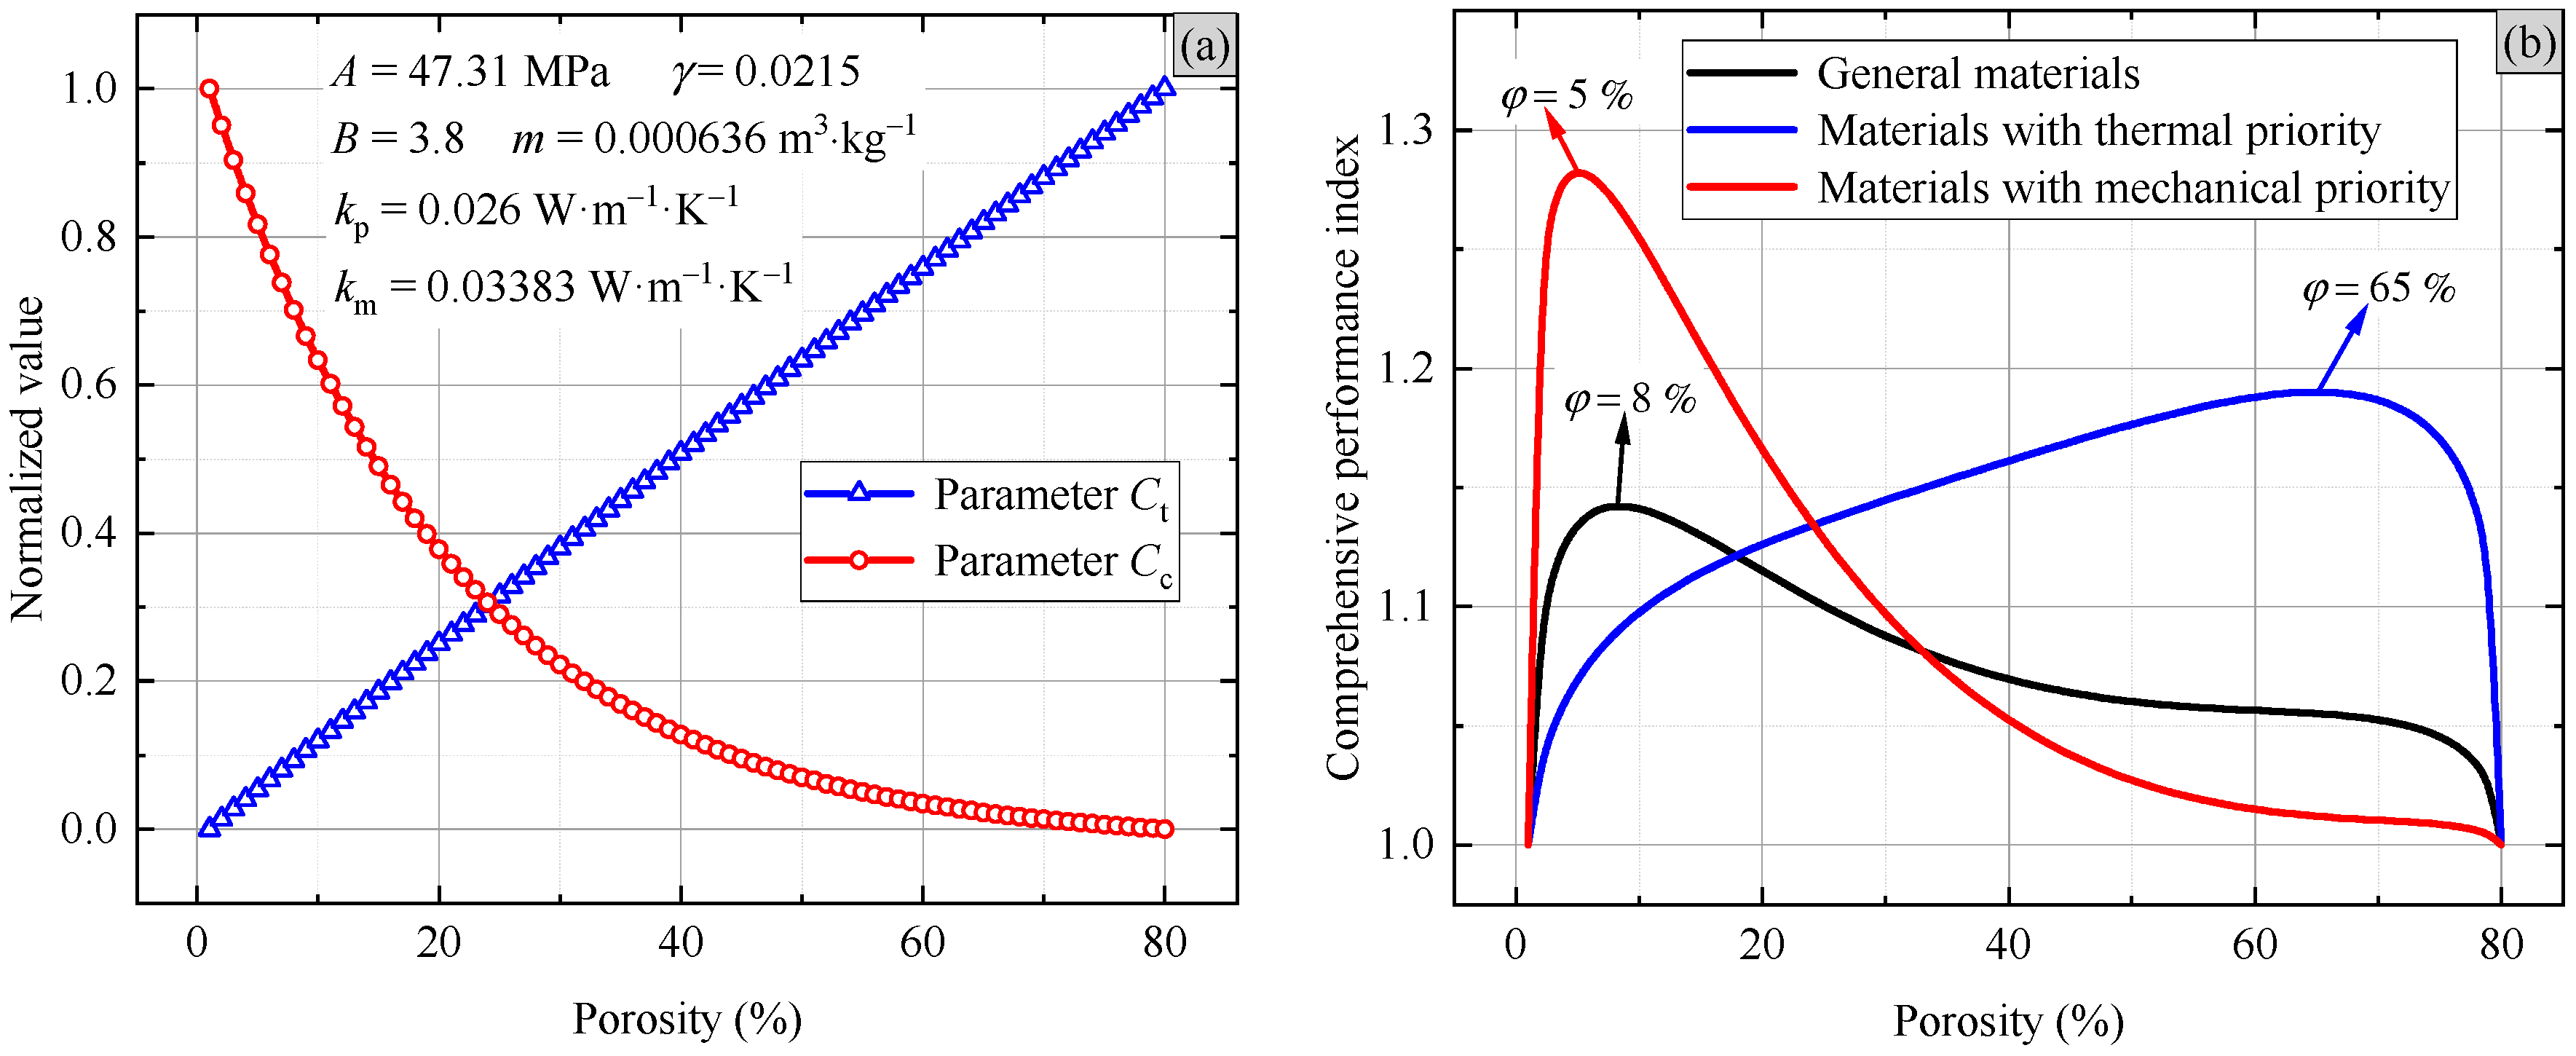
where λt and λc denote the weighting parameters of temperature control performance and mechanical property, respectively, and λt + λc = 1. It is worth noting that, for general materials of well cementing, the temperature control performance and mechanical properties of foamed PGCs for well cementing are of equal significance. Thus, under the general circumstance, λt = λc = 0.5 in the calculations. However, natural gas hydrate exploitation is always deep ocean work [5,61] and confronted with high pressure. It is more likely to result in well instability during NGH production under this condition [28]. In this case, foamed PGCs for well cementing in NGH exploitations should have mechanical priority, where the weighting of parameter λc should be larger than the weighting of parameter λt. Hence, as an example, parameters λt = 0.3 and λc = 0.7 are applied for materials with mechanical priority in the present work for simplification, which are reasonable to some extent. Nevertheless, the exact values of parameters λt and λc vary with the specific requirements of well cementing in the field. On the contrary, for those formations with poor stability, hydrates easily dissociate with increasing temperature [27,62]. Foamed PGCs for well cementing should have thermal priority to retard heat conduction and control the temperature increment; thus, parameters λt = 0.7 and λc = 0.3 are applied as an example under this circumstance. Additionally, the calculation parameters in this evaluation are consistent with the model validation in Figure 5 and Figure 8b, and the porosity varies from 1% to 80%.
The results of parameters Cc and Ct are shown in Figure 9a, and the parameters used in the model calculations are summarized in the figure. As can be seen in Figure 9a, parameter Cc shows a negative correlation with the porosity of foamed PGCs, which indicates that, with the addition of a foaming agent, the mechanical properties deteriorate. However, the value of parameter Ct increases with porosity. This means that the temperature control performance of foamed PGCs develops with the addition of a foaming agent, which is anticipated [9,30].
As depicted in Figure 9b, the results of the overall performance index τ versus the porosity of foamed PGCs are summarized. For general foamed PGCs for well cementing in NGH reservoirs (λt = λc = 0.5), the best overall performance corresponds with a porosity φ = 8%. And for materials with mechanical priority (λt = 0.3, λc = 0.7), the best performance corresponds with porosity φ = 5%. Due to the incipient rapid decline in compressive strength with increasing porosity, the mechanical properties of foamed PGCs quickly deteriorate [9]. Thus, the porosity of the materials with the best overall performance corresponds with small values. However, for foamed PGCs with thermal priority, the best porosity is 65%. The main reason is that materials with thermal priority are more concerned about temperature control performance [9], which steadily increases with increasing porosity. Thus, the porosity of the materials with the best overall performance corresponds with large values.
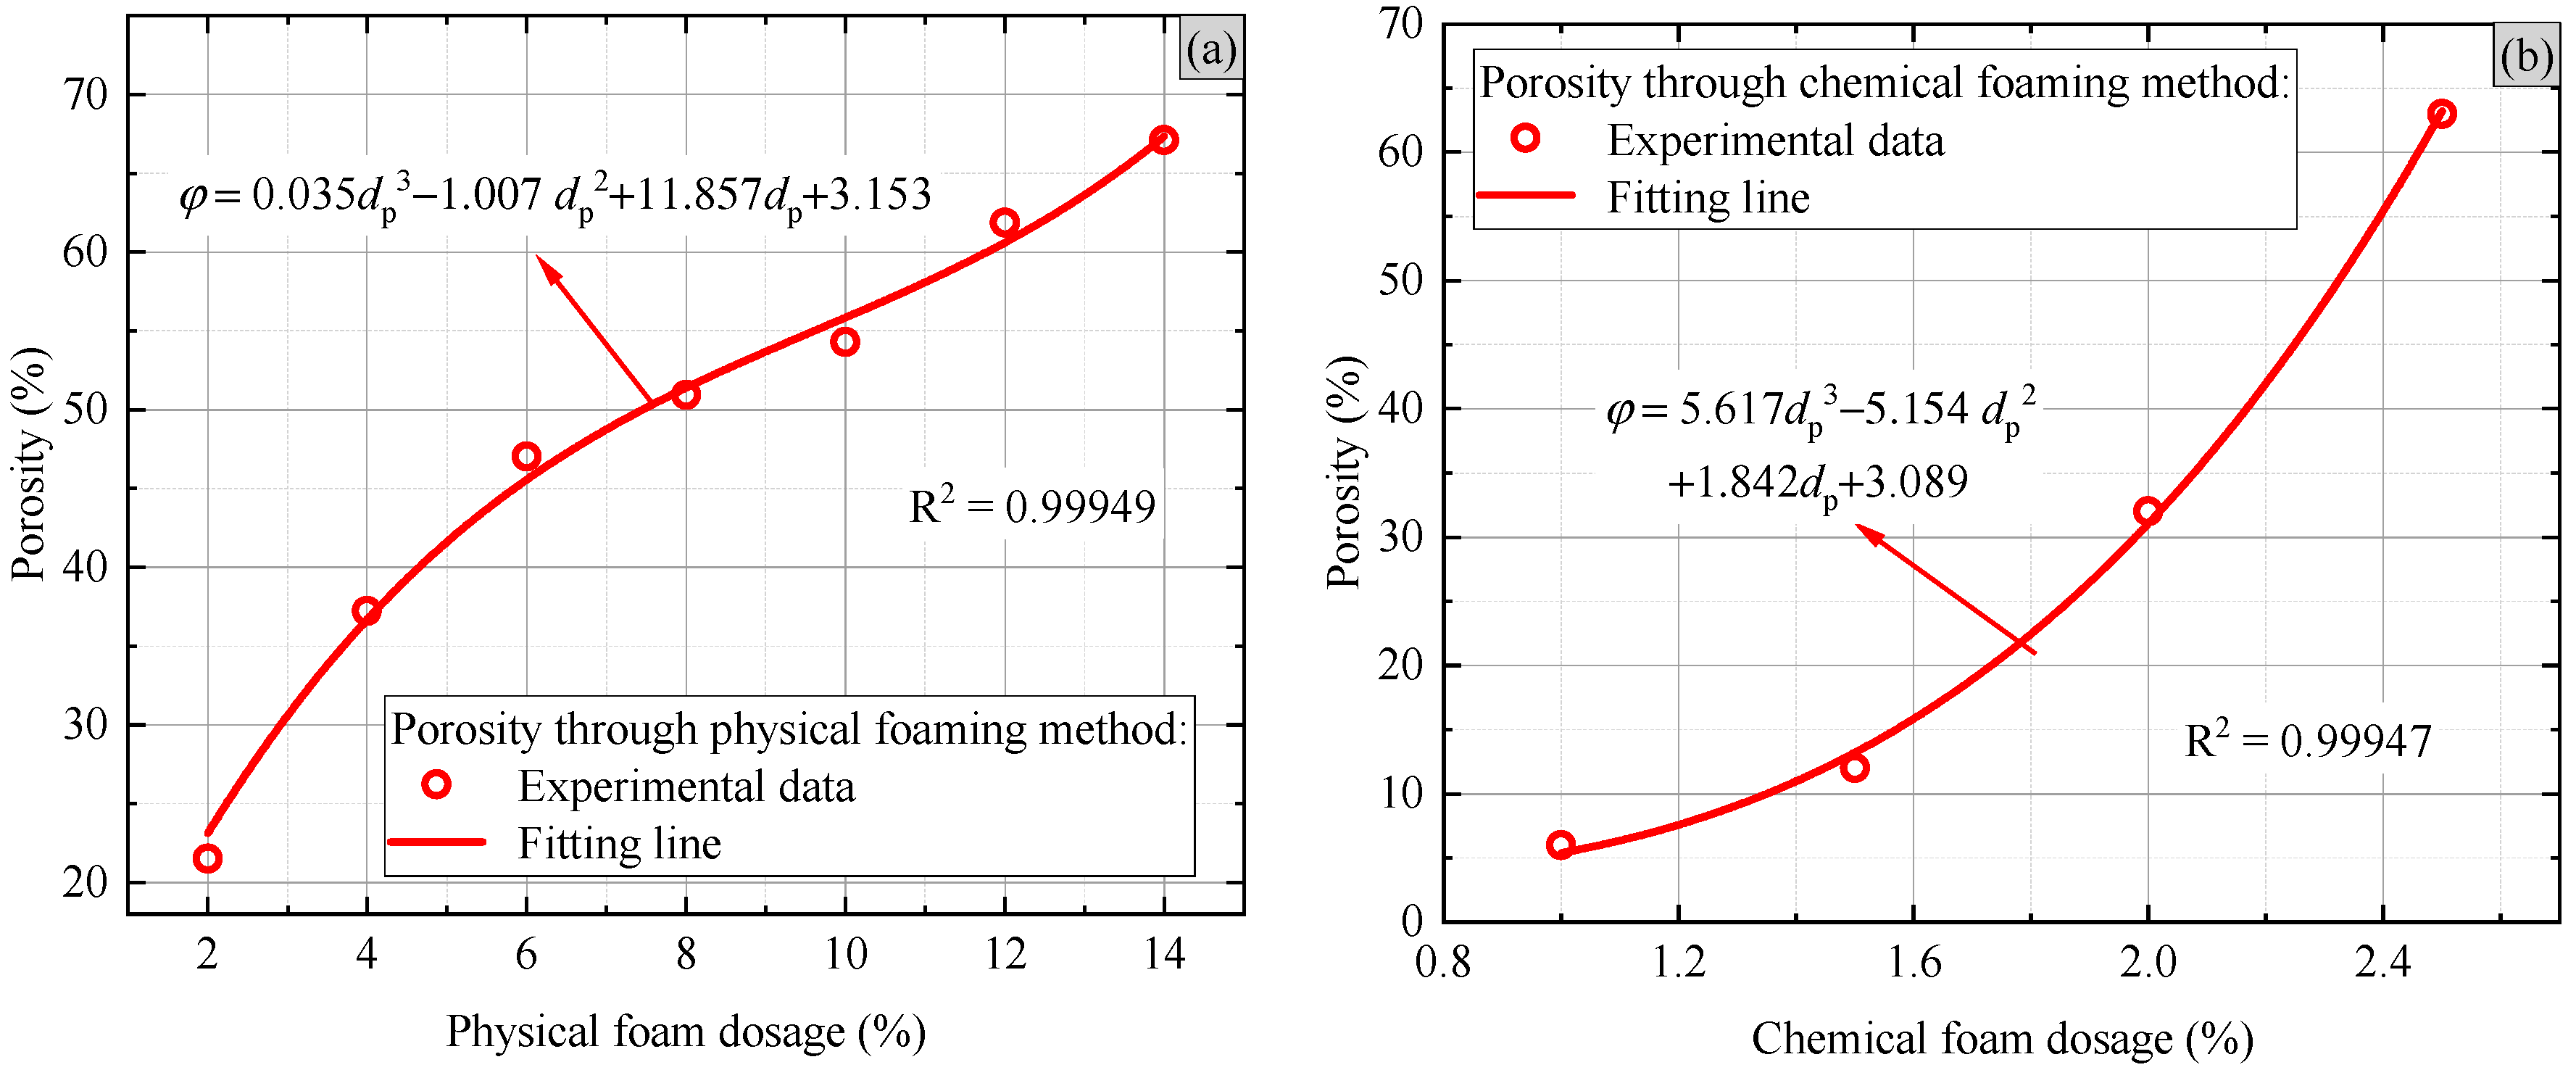
To determine the best foaming agent dosage of foamed PGCs for well cementing, the correlation between porosity and foam dosage using different foaming methods is further investigated by polynomial fitting based on the experimental data in Figure 1. The fitting results of different foaming methods are shown in Figure 10. The correlation between porosity φ and physical foam dosage can be described as φ = 0.035 d p 3 1.007 d p 2 + 11.857 d p + 3.153 (%), and that between parameter φ and chemical foam dosage is φ = 5.617 d c 3 5.154 d c 2 + 1.842 d c + 3.089 (%), where dp and dc denote the physical and chemical foam dosages, respectively. In addition, the coefficient of determination R2 of the fitting results is 0.99949 for the physical foaming method and 0.99947 for the chemical foaming method, respectively. As R2 is quite close to unity, the fitting results are reasonable to some extent. According to the fitting results and the best porosity shown in Figure 9, the corresponding foam dosages with the best overall performance are dp = 0.424% and dc = 1.229% for general materials; dp = 0.158% and dc = 0.950% for materials with mechanical priority; and dp = 13.282% and dc = 2.521% for materials with thermal priority. It is noteworthy that, since the experimental data are limited, the fitting equations can be diverse, and the equations applied in the present work are only examples. More experiments will be carried out in future work to more accurately determine potential correlations between foaming agent dosage and the porosity of foamed PGCs.

4.3. Advantages and Limitations

Compared with previous studies, this study combines experimental work with theoretical work to investigate the correlations between the porosity and mechanical and thermal properties of foamed PGCs for well cementing in NGH reservoirs. On the one hand, experimental work can accurately determine the thermal conductivity and the compressive strength, providing relevant test data for subsequent model validation and overall performance index evaluation. On the other hand, theoretical work is carried out to make up for the non-repeatability of experiments and precisely predict the thermal conductivity and the compressive strength under various porosity conditions with few calculations. Moreover, the overall performance index evaluation system is established, and the best porosity and foam dosage (physical foaming agent and chemical foaming agent) of various materials are obtained, offering suggestions for the application of foamed PGCs in the well cementing process during NGH production.
In the current work, the experimental samples are limited to foamed PGC materials with identical water–cement ratios and HPG contents. However, the water–cement ratio and the HPG content significantly influence the compressive strength and thermal conductivity [9,11]; hence, relevant research should be carried out in the future. Additionally, in the current work, the tortuosity of the pores is characterized by the tortuosity fractal dimension though an approximate equation i.e., Equation (4) [54]. As the random walker algorithm has been proven to be effective in obtaining the tortuosity [63], it will be further applied to determine the tortuosity of the pores in foamed PGCs in future work. Moreover, because the compressive strength growth mechanism is extremely complicated and strongly related to the curing time and the hydration degree of cement [24,64], the present theoretical model of compressive strength is optimized based on the semi-empirical model proposed by Popovics and Ujhelyi [55], which contains some empirical parameters. Hence, a better theoretical model considering the hydration mechanism and detailed pore structures should be established. And in the present work, the effect of additives on thermal conductivity is considered by introducing the correction parameter ξ. However, the effects of detailed mechanisms of the additives (e.g., the alignment of the additive) on the compressive strength and thermal conductivity should be quantitatively characterized and studied [65]. Moreover, future efforts should be made to establish models based on the effective medium theory [66,67,68], and the calculated results from the present model and the future model will be compared to promote the accuracy of predicting compressive strength and thermal conductivity for PGCs. Since the property priorities of foamed PGCs vary with the different application scenarios [12,24,25], the determination of weighting parameter values considering the overall performance should be further studied and discussed.

5. Conclusions

In this study, the mechanical properties and temperature control performance of foamed PGCs for well cementing in natural gas hydrate (NGH) reservoirs are sufficiently investigated through the combination of experimental work and theoretical work. Specifically, the porosity, thermal conductivity, and 7 d and 28 d compressive strengths of foamed PGCs are tested under different foaming methods and foam dosages. Additionally, a theoretical model of thermal conductivity considering pore structure is derived, and a model of compressive strength considering curing time is obtained. Notably, our experimental results are applied to validate the proposed model, and they indicate that the theoretical models are effective in predicting the compressive strength and thermal conductivity of foamed PGCs. Moreover, an overall performance index evaluation system is proposed to reveal the best porosity and foam dosage for well cementing materials under various conditions. Some significant conclusions are summarized as follows:
(1)
The predicted results of the derived thermal conductivity model of foamed PGCs for well cementing in NGH reservoirs are more accurate in comparison with previous fractal models because the tortuosity of the pores in foamed PGCs is taken into account.
(2)
As the foam dosage increases, the porosity increases. Under identical dosage conditions, the chemical foaming method is more effective than the physical foaming method, leading to larger porosity. To be specific, when the porosity of foamed PGCs increases up to about 65%, the dosage of the chemical foaming agent is only about 2.4%; however, that of the physical foaming agent is about 14%. Nevertheless, the chemical foaming method is more uncontrollable, which tends to generate aggregated and connected pores.
(3)
Affected by increasing porosity, the mechanical properties of foamed PGCs deteriorate rapidly in the early stage and the deterioration rate slows down gradually, but the temperature control performance steadily enhances. Thus, the mechanical properties and the temperature control performance of foamed PGCs for well cementing in NGH reservoirs can be described as a competitive system. Additionally, foamed PGCs for welling cement are expected to have larger compressive strength and lower thermal conductivity in NGH exploitation to enhance wellbore stability and prevent gas channeling.
(4)
For general foamed PGCs for well cementing, the best overall performance corresponds with porosity φ = 8% (dp = 0.424%, dc = 1.229%). And in deep ocean work confronted with high pressure, the best porosity for foamed PGCs is φ = 5% (dp = 0.158%, dc = 0.950%). In addition, for foamed PGCs for well cementing in formations with poor thermal stability, the best porosity is φ = 65% (dp = 13.282%, dc = 2.521%).

Author Contributions

J.T.: Conceptualization, Methodology, Visualization, Writing—original draft. Y.Z.: Software, Writing—original draft, Validation. W.C.: Investigation, Funding acquisition. T.L.: Resources, Supervision. G.Y.: Investigation, Writing—review & editing. M.C.: Investigation, Data curation. G.L.: Project administration, Funding acquisition, Writing—review & editing. J.X.: Investigation, Project administration. Y.H.: Resources, Funding acquisition. All authors have read and agreed to the published version of the manuscript.

Funding

The authors are grateful for financial support from the Natural Science Foundation of Guangdong Province, China (Grant No. 2024A1515012905), the National Natural Science Foundation of China (Grant No. 52074250), the Open Research Fund of Key Laboratory of Gas Hydrate, Ministry of Natural Resources (Grant No. KLGH-2023-10), the Qiankehe Foundation (Grant No. ZK [2021] General 067), Fundamental Research Funds for the Central Universities, China University of Geosciences (Wuhan) (Grant No. 107-G1323523046), and “CUG Scholar” Scientific Research Funds at China University of Geosciences (Wuhan) (Grant No. 2021216).

Data Availability Statement

Data will be made available upon request.

Conflicts of Interest

Authors Jian Xu and Yongning Huang was employed by the company PetroChina Tarim Oilfield Company. The remaining authors declare that the research was conducted in the absence of any commercial or financial relationships that could be construed as a potential conflict of interest.

Nomenclature

Latin symbols
aRadius fluctuation amplitude (dimensionless)
AMaximum strength-developing capacity of the cement (MPa)
AcCross-sectional area of the REV in porous composite cementitious material (μm2)
BWater sensitivity of cement (dimensionless)
cCement content ratio (dimensionless)
CcNormalized 28 d compressive strength (dimensionless)
CtInverse membership degree parameter of normalized thermal conductivity (dimensionless)
dPore diameter (μm)
dcChemical foam dosage (%)
dpPhysical foam dosage (%)
DfPore fractal dimension (dimensionless)
DTTortuosity fractal dimension of pores (dimensionless)
fcCompressive strength (MPa)
mMass of PGC without foaming agent (kg)
MAbsolute dry mass of test sample (kg)
keThermal conductivity of porous composite cementitious material (W·m−1·K−1)
kmThermal conductivity of the matrix phase (W·m−1·K−1)
kpThermal conductivity of the pore phase (W·m−1·K−1)
L0Characteristic length of composite cementitious material REV (μm)
mEmpirical parameter (m3/kg)
RmTotal thermal resistance of the matrix phase (K·W−1)
RpTotal thermal resistance of the pore phase (K·W−1)
RtTotal thermal resistance of composite cementitious material (K·W−1)
vVolume of PGC without foaming agent (m3)
VVolume of the sample (m3)
w/cWater–cement ratio (Dimensionless)
Greek symbols
γExperimental parameter (dimensionless)
λcWeighting parameter of mechanical properties (dimensionless)
λtWeighting parameter of temperature control performance (dimensionless)
ξCorrection parameter considering other additives (dimensionless)
ρsDensity of base solid material (kg/m3)
τOverall performance index (dimensionless)
φPorosity of composite cementitious material (dimensionless)
Subscript
maxMaximum value
minMinimum value

Appendix A. Derivations of Thermal Resistances

As illustrated in Figure 3b, the pores in foamed PGCs are considered to have periodically sinusoidal boundaries along their lengthwise direction. And for a single pore with diameter d, its radius r(x) is given by [47]:
r ( x ) = d 2 [ 1 + a sin ( 2 π W x ) ] ,
where W denotes the sinusoidal wavelength, and a represents the radius fluctuation amplitude.
Based on Equation (A1) and the definition of the thermal resistance, the thermal resistance of a pore with diameter d can be obtained as follows [47]:
R p , d = L t W 0 W d x π r 2 ( x ) k p = 4 L 0 D T k p ( 1 a 2 ) 3 / 2 d D T + 1 ,
where Rp,d denotes the thermal resistance of a single pore, parameter Lt is the actual length of the pore, and parameter L0 is the characteristic length of the cylindrical representative elementary volume (REV), which can be determined by Equation (3). Furthermore, parameter DT is the tortuosity fractal dimension, and kp is the thermal conductivity of pore space.
And the actual length of the pore with pore diameter d in Equation (A2) can be obtained as follows [48,53]:
L t = d 1 D T L 0 D T .
Based on Equation (A2), the total thermal resistance of pore phase Rp satisfies the following equation [39,40,47]:
1 R p = d min d max 1 R p , d D f d max D f d ( D f + 1 ) d d ,
where Df is the pore fractal dimension, which can be calculated by Equation (2). In addition, parameters dmax and dmin represent the maximum and minimum pore diameters, respectively. By solving Equation (A4a), parameter Rp can be determined as follows:
R p = 4 L 0 D T ( 1 + D T D f ) k p π ( 1 a 2 ) 3 / 2 D f d max 1 + D T [ 1 ( d min / d max ) 1 + D T D f ] .
In essence, the thermal resistance of the matrix phase in foamed PGCs Rm can be given by:
R m = L 0 ( 1 φ ) A c k m .
where km is the matrix phase thermal conductivity, φ denotes the porosity of foamed PGCs, and Ac represents the cross-sectional area of cylindrical REV, which is A c = π L 0 2 / 4 [47].
Under some circumstances, other additives are mixed into the matrix phase, e.g., microparticles [58], rubber waste particles [69], waste lightweight aggregate [70], etc. And the additives exert an influence on the thermal conductivity of the matrix phase. Therefore, the thermal conductivity of the matrix phase should be modified as: k me = ξ k m , where kme denotes the thermal conductivity of the matrix phase, and ξ is the correction factor. Consequently, Equation (A5) can be modified as follows:
R m = L 0 ( 1 φ ) A c ξ k m .

References

  1. Dai, S.; Santamarina, J.C.; Waite, W.F.; Kneafsey, T.J. Hydrate morphology: Physical properties of sands with patchy hydrate saturation. J. Geophys. Res. Solid Earth 2012, 117, B11205. [Google Scholar] [CrossRef]
  2. Sloan, E.D. Fundamental principles and applications of natural gas hydrates. Nature 2003, 426, 353–359. [Google Scholar] [CrossRef]
  3. Cui, Y.; Lu, C.; Wu, M.; Peng, Y.; Yao, Y.; Luo, W. Review of exploration and production technology of natural gas hydrate. Adv. Geo-Energy Res. 2018, 2, 53–62. [Google Scholar] [CrossRef]
  4. Wang, X.; Liu, D.; Sun, B.; Liu, S.; Wang, Z.; Gao, Y. Investigation of multi-field coupling mechanisms during well cement through gas hydrate layer in horizontal well. Constr. Build. Mater. 2023, 407, 133505. [Google Scholar] [CrossRef]
  5. Zhang, W.; Liang, J.; Wan, Z.; Su, P.; Huang, W.; Wang, L.; Lin, L. Dynamic accumulation of gas hydrates associated with the channel-levee system in the Shenhu area, northern South China sea. Mar. Pet. Geol. 2020, 117, 104354. [Google Scholar] [CrossRef]
  6. Hua, S.; Wang, K.; Yao, X. Developing high performance phosphogypsum-based cementitious materials for oil-well cementing through a step-by-step optimization method. Cem. Concr. Compos. 2016, 72, 299–308. [Google Scholar] [CrossRef]
  7. Da Silva, G.A.; Kulay, L.A. Environmental performance comparison of wet and thermal routes for phosphate fertilizer production using LCA—A brazilian experience. J. Clean. Prod. 2005, 13, 1321–1325. [Google Scholar] [CrossRef]
  8. Geraldo, R.H.; Costa, A.R.D.; Kanai, J.; Silva, J.S.; Souza, J.D.; Andrade, H.M.C.; Gonçalves, J.P.; Fontanini, P.S.P.; Camarini, G. Calcination parameters on phosphogypsum waste recycling. Constr. Build. Mater. 2020, 256, 119406. [Google Scholar] [CrossRef]
  9. Chen, M.; Liu, P.; Kong, D.; Wang, Y.; Wang, J.; Huang, Y.; Yu, K.; Wu, N. Influencing factors of mechanical and thermal conductivity of foamed phosphogypsum-based composite cementitious materials. Constr. Build. Mater. 2022, 346, 128462. [Google Scholar] [CrossRef]
  10. Zhou, J.; Li, X.; Zhao, Y.; Shu, Z.; Wang, Y.; Zhang, Y.; Shen, X. Preparation of paper-free and fiber-free plasterboard with high strength using phosphogypsum. Constr. Build. Mater. 2020, 243, 118091. [Google Scholar] [CrossRef]
  11. Ding, C.; Sun, T.; Shui, Z.; Xie, Y.; Ye, Z. Physical properties, strength, and impurities stability of phosphogypsum-based cold-bonded aggregates. Constr. Build. Mater. 2022, 331, 127307. [Google Scholar] [CrossRef]
  12. Zhou, J.; Gao, H.; Shu, Z.; Wang, Y.; Yan, C. Utilization of waste phosphogypsum to prepare non-fired bricks by a novel hydration–recrystallization process. Constr. Build. Mater. 2012, 34, 114–119. [Google Scholar] [CrossRef]
  13. Singh, M.; Garg, M. Phosphogypsum—Fly ash cementitious binder—Its hydration and strength development. Cem. Concr. Res. 1995, 25, 752–758. [Google Scholar] [CrossRef]
  14. Hermawan; Djayaprabha, H.S.; Nguyen, H.A. Utilizing phosphogypsum waste to improve the mechanical and durability performances of cement-free structural mortar containing ground granulated blast furnace slag and calcium oxide. J. Build. Eng. 2023, 72, 106557. [Google Scholar] [CrossRef]
  15. Zhang, L.; Mo, K.H.; Yap, S.P.; Gencel, O.; Ling, T.C. Effect of fibers addition on mechanical properties of eco-friendly phosphogypsum-based composite at high temperatures. J. Build. Eng. 2022, 61, 105247. [Google Scholar] [CrossRef]
  16. Kacimi, L.; Simon-Masseron, A.; Ghomari, A.; Derriche, Z. Reduction of clinkerization temperature by using phosphogypsum. J. Hazard. Mater. 2006, 137, 129–137. [Google Scholar] [CrossRef] [PubMed]
  17. Calderón-Morales, B.R.S.; García-Martínez, A.; Pineda, P.; García-Tenório, R. Valorization of phosphogypsum in cement-based materials: Limits and potential in eco-efficient construction. J. Build. Eng. 2021, 44, 102506. [Google Scholar] [CrossRef]
  18. Meskini, S.; Samdi, A.; Ejjaouani, H.; Remmal, T. Valorization of phosphogypsum as a road material: Stabilizing effect of fly ash and lime additives on strength and durability. J. Clean. Prod. 2021, 323, 129161. [Google Scholar] [CrossRef]
  19. Meskini, S.; Remmal, T.; Ejjaouani, H.; Samdi, A. Formulation and optimization of a phosphogypsum—Fly ash—Lime composite for road construction: A statistical mixture design approach. Constr. Build. Mater. 2022, 315, 125786. [Google Scholar] [CrossRef]
  20. Pereira, V.M.; Geraldo, R.H.; Cruz, T.A.M.; Camarini, G. Valorization of industrial by-product: Phosphogypsum recycling as green binding material. Clean. Eng. Technol. 2021, 5, 100310. [Google Scholar] [CrossRef]
  21. Zhang, L.; Cao, P.; Radha, K.C. Evaluation of rock strength criteria for wellbore stability analysis. Int. J. Rock Mech. Min. Sci. 2010, 47, 1304–1316. [Google Scholar] [CrossRef]
  22. Ma, X.; Jiang, Y.; Yan, P.; Luan, H.; Wang, C.; Shan, Q.; Cheng, X. A review on submarine geological risks and secondary disaster issues during natural gas hydrate depressurization production. J. Mar. Sci. Eng. 2024, 12, 840. [Google Scholar] [CrossRef]
  23. Feng, L.; Jin, K.; Wang, H. Research on the thermal conductivity and water resistance of foamed phosphogypsum. Coatings 2021, 11, 802. [Google Scholar] [CrossRef]
  24. Wang, Q.; Jia, R. A novel gypsum-based self-leveling mortar produced by phosphorus building gypsum. Constr. Build. Mater. 2019, 226, 11–20. [Google Scholar] [CrossRef]
  25. Wang, T.; Gao, X.; Wang, J. Preparation of foamed phosphogypsum lightweight materials by incorporating cementitious additives. Mater. Sci. 2019, 25, 340–347. [Google Scholar] [CrossRef]
  26. Liao, Y.; Yao, J.; Deng, F.; Li, H.; Wang, K.; Tang, S. Hydration behavior and strength development of supersulfated cement prepared by calcined phosphogypsum and slaked lime. J. Build. Eng. 2023, 80, 108075. [Google Scholar] [CrossRef]
  27. Xue, Y.; Wang, C.; Chen, Z.; Yang, S.; Chen, L.; Wang, E.; Li, Y. Enhanced cement formation for well completion in gas hydrates reservoirs. Geoenergy Sci. Eng. 2023, 230, 212258. [Google Scholar] [CrossRef]
  28. Wang, X.; Sun, B.; Gao, Y.; Wang, Z.; Li, H.; Chen, Y. Numerical simulation of the stability of hydrate layer during well cementing in deep-water region. J. Petrol. Sci. Eng. 2019, 176, 893–905. [Google Scholar] [CrossRef]
  29. Zhang, W.; Zhao, R.; Cheng, W.L. Temperature control performance of a spaceborne PTC heating system: Dynamic modeling and parametric analysis. Therm. Sci. Eng. Prog. 2023, 44, 102062. [Google Scholar] [CrossRef]
  30. Tian, T.; Yan, Y.; Hu, Z.; Xu, Y.; Chen, Y.; Shi, J. Utilization of original phosphogypsum for the preparation of foam concrete. Constr. Build. Mater. 2016, 115, 143–152. [Google Scholar] [CrossRef]
  31. Falliano, D.; De Domenico, D.; Ricciardi, G.; Gugliandolo, E. Experimental investigation on the compressive strength of foamed concrete: Effect of curing conditions, cement type, foaming agent and dry density. Constr. Build. Mater. 2018, 165, 735–749. [Google Scholar] [CrossRef]
  32. Capasso, I.; Pappalardo, L.; Romano, R.A.; Iucolano, F. Foamed gypsum for multipurpose applications in building. Constr. Build. Mater. 2021, 307, 124948. [Google Scholar] [CrossRef]
  33. Zhang, X.; Zhang, X.; Li, X.; Ma, M.; Zhang, Z.; Ji, X. Slurry rheological behaviors and effects on the pore evolution of fly ash/metakaolin-based geopolymer foams in chemical foaming system with high foam content. Constr. Build. Mater. 2023, 379, 131259. [Google Scholar] [CrossRef]
  34. Pasupathy, K.; Ramakrishnan, S.; Sanjayan, J. Enhancing the chemical foaming process using superplasticizer in aerated geopolymer concrete. Constr. Build. Mater. 2022, 324, 126535. [Google Scholar] [CrossRef]
  35. Zheng, T.; Lu, Y.; Luo, S.; Kong, D.; Fu, R. Effect of the phosphogypsum calcination time on the compressive mechanical properties of phosphogypsum-based composite cementitious materials. Mater. Res. Express 2022, 9, 035506. [Google Scholar] [CrossRef]
  36. GB/T 17669.3-1999[S]; Gypsum Plasters-Determination of Mechanical Properties. The State Bureau of Quality and Technical Supervision: Beijing, China, 1999.
  37. Xu, X.; Shu, X.; Pei, Q.; Qin, H.; Guo, R.; Wang, X.; Wang, Q. Effects of porosity on the tribological and mechanical properties of oil-impregnated polyimide. Tribol. Int. 2022, 170, 107502. [Google Scholar] [CrossRef]
  38. GB/T 10294-2008[S]; Thermal Insulation-Determination of Steady-State Thermal Resistance and Related Properties-Guarded Hot Plate Apparatus. General Administration of Quality Supervision, Inspection and Quarantine of the People’s Republic of China, Standardization Administration of the People’s Republic of China: Beijing, China, 2008.
  39. Lei, G.; Tang, J.; Zhang, L.; Wu, Q.; Li, J. Effective thermal conductivity for hydrate-bearing sediments under stress and local thermal stimulation conditions: A novel analytical model. Energy 2024, 288, 129704. [Google Scholar] [CrossRef]
  40. Tang, J.; Lei, G.; Li, X.; Zhang, L.; Cheng, W.; Pang, J.; Jiang, G. A novel analytical model of the effective thermal conductivity of porous materials under stress. Fractals 2023, 31, 2340176. [Google Scholar] [CrossRef]
  41. Liu, S.; Wang, L.; Yu, B. Effect of modified phosphogypsum on the hydration properties of the phosphogypsum-based supersulfated cement. Constr. Build. Mater. 2019, 214, 9–16. [Google Scholar] [CrossRef]
  42. Yu, R.; Spiesz, P.; Brouwers, H.J.H. Effect of nano-silica on the hydration and microstructure development of ultra-high performance concrete (UHPC) with a low binder amount. Constr. Build. Mater. 2014, 65, 140–150. [Google Scholar] [CrossRef]
  43. Hao, Y.; Yang, G.; Liang, K. Development of fly ash and slag based high-strength alkali-activated foam concrete. Cem. Concr. Compos. 2022, 128, 104447. [Google Scholar] [CrossRef]
  44. Li, Y.; Zhang, H.; Huang, M.; Yin, H.; Jiang, K.; Xiao, K.; Tang, S. Influence of different alkali sulfates on the shrinkage, hydration, pore structure, fractal dimension and microstructure of low-heat Portland cement, medium-heat Portland cement and ordinary Portland cement. Fractal Fract. 2021, 5, 79. [Google Scholar] [CrossRef]
  45. Wang, L.; Zeng, X.; Li, Y.; Yang, H.; Tang, S. Influences of MgO and PVA fiber on the abrasion and cracking resistance, pore structure and fractal features of hydraulic concrete. Fractal Fract. 2022, 6, 674. [Google Scholar] [CrossRef]
  46. Wang, L.; Huang, Y.; Zhao, F.; Huo, T.; Chen, E.; Tang, S. Comparison between the influence of finely ground phosphorous slag and fly ash on frost resistance, Pore structures and fractal features of hydraulic concrete. Fractal Fract. 2022, 6, 598. [Google Scholar] [CrossRef]
  47. Zeng, Y.; Ji, B.; Zhang, Y.; Feng, J.; Luo, J.; Wang, M. A fractal model for effective thermal conductivity in complex geothermal media. Front. Earth Sci. 2022, 10, 786290. [Google Scholar] [CrossRef]
  48. Yang, S.; Liang, M.; Yu, B.; Zou, M. Permeability model for fractal porous media with rough surfaces. Microfluid. Nanofluid. 2015, 18, 1085–1093. [Google Scholar] [CrossRef]
  49. Yu, B.; Li, J. Some fractal characters of porous media. Fractals 2001, 09, 365–372. [Google Scholar] [CrossRef]
  50. Al-Raoush, R.; Papadopoulos, A. Representative elementary volume analysis of porous media using X-Ray computed tomography. Powder Technol. 2010, 200, 69–77. [Google Scholar] [CrossRef]
  51. Yio, M.H.N.; Wong, H.S.; Buenfeld, N.R. Representative elementary volume (REV) of cementitious materials from three-dimensional pore structure analysis. Cem. Concr. Res. 2017, 102, 187–202. [Google Scholar] [CrossRef]
  52. Lei, G.; Qu, J.; Wu, Q.; Pang, J.; Su, D.; Guan, J.; Lu, C. Theoretical analysis of threshold pressure in tight porous media under stress. Phys. Fluids 2023, 35, 073313. [Google Scholar] [CrossRef]
  53. Qin, X.; Zhou, Y.; Sasmito, A.P. An effective thermal conductivity model for fractal porous media with rough surfaces. Adv. Geo-Energy Res. 2019, 3, 149–155. [Google Scholar] [CrossRef]
  54. Wei, W.; Cai, J.; Hu, X.; Han, Q. An Electrical conductivity model for fractal porous media. Geophys. Res. Lett. 2015, 42, 4833–4840. [Google Scholar] [CrossRef]
  55. Popovics, S.; Ujhelyi, J. Contribution to the concrete strength versus water-cement ratio relationship. J. Mater. Civil. Eng. 2008, 20, 459–463. [Google Scholar] [CrossRef]
  56. Andersland, O.B.; Ladanyi, B. Frozen Ground Engineering; John Wiley & Sons: Hoboken, NJ, USA, 2003. [Google Scholar]
  57. Kamseu, E.; Nait-Ali, B.; Bignozzi, M.C.; Leonelli, C.; Rossignol, S.; Smith, D.S. Bulk composition and microstructure dependence of effective thermal conductivity of porous inorganic polymer cements. J. Eur. Ceram. Soc. 2012, 32, 1593–1603. [Google Scholar] [CrossRef]
  58. Shen, Z.; Zhou, H. Predicting effective thermal and elastic properties of cementitious composites containing polydispersed hollow and core-shell micro-particles. Cem. Concr. Compos. 2020, 105, 103439. [Google Scholar] [CrossRef]
  59. Tang, S.W.; Chen, E.; Shao, H.Y.; Li, Z.J. A fractal approach to determine thermal conductivity in cement pastes. Constr. Build. Mater. 2015, 74, 73–82. [Google Scholar] [CrossRef]
  60. Cheng, Y.; Li, L.; Zhou, P.; Zhang, Y.; Liu, H. Multi-objective optimization design and test of compound diatomite and basalt fiber asphalt mixture. Materials 2019, 12, 1461. [Google Scholar] [CrossRef]
  61. Dong, L.; Wu, N.; Zhang, Y.; Liao, H.; Hu, G.; Li, Y. Improved Duncan-Chang model for reconstituted hydrate-bearing clayey silt from the South China Sea. Adv. Geo-Energy Res. 2023, 8, 136–140. [Google Scholar] [CrossRef]
  62. Hyodo, M.; Yoneda, J.; Yoshimoto, N.; Nakata, Y. Mechanical and dissociation properties of methane hydrate-bearing sand in deep seabed. Soils Found. 2013, 53, 299–314. [Google Scholar] [CrossRef]
  63. Zhou, Y.; Li, W.; Peng, Y.; Tang, S.; Wang, L.; Shi, Y.; Li, Y.; Wang, Y.; Geng, Z.; Wu, K. Hydration and fractal analysis on low-heat Portland cement pastes using thermodynamics-based methods. Fractal Fract. 2023, 7, 606. [Google Scholar] [CrossRef]
  64. Wang, Y.; Hu, Y.; He, X.; Su, Y.; Strnadel, B.; Miao, W. Hydration and compressive strength of supersulfated cement with low-activity high alumina ferronickel slag. Cem. Concr. Compos. 2023, 136, 104892. [Google Scholar] [CrossRef]
  65. Yan, Y.; Tian, L.; Zhao, W.; Lazaro, S.A.M.; Li, X.; Tang, S. Dielectric and mechanical properties of cement pastes incorporated with magnetically aligned reduced graphene oxide. Dev. Built Environ. 2024, 18, 100471. [Google Scholar] [CrossRef]
  66. Aria Hosseini, S.; Khanniche, S.; Alex Greaney, P.; Romano, G. Universal effective medium theory to predict the thermal conductivity in nanostructured materials. Int. J. Heat Mass Tran. 2022, 183, 122040. [Google Scholar] [CrossRef]
  67. Berthier, S.; Lafait, J. Effective medium theory: Mathematical determination of the physical solution for the dielectric constant. Opt. Commun. 1980, 33, 303–306. [Google Scholar] [CrossRef]
  68. Gong, L.; Wang, Y.; Cheng, X.; Zhang, R.; Zhang, H. A novel effective medium theory for modelling the thermal conductivity of porous materials. Int. J. Heat Mass Tran. 2014, 68, 295–298. [Google Scholar] [CrossRef]
  69. Benazzouk, A.; Douzane, O.; Mezreb, K.; Laidoudi, B.; Quéneudec, M. Thermal conductivity of cement composites containing rubber waste particles: Experimental study and modelling. Constr. Build. Mater. 2008, 22, 573–579. [Google Scholar] [CrossRef]
  70. Akçaözoğlu, S.; Akçaözoğlu, K.; Atiş, C.D. Thermal Conductivity, Compressive strength and ultrasonic wave velocity of cementitious composite containing waste pet lightweight aggregate (WPLA). Compos. Part B-Eng. 2013, 45, 721–726. [Google Scholar] [CrossRef]
Figure 1. Experimental results of porosity and thermal conductivity versus foam dosage: (a) physical foaming method; (b) chemical foaming method.
Jmse 12 01056 g001
Figure 2. Experimental results of 7d and 28d compressive strengths under different foam dosage conditions: (a) physical foaming method; (b) chemical foaming method.
Jmse 12 01056 g002
Figure 3. Model diagram of heat conduction process through the REV of foamed PGCs for well cementing in NGH reservoirs: (a) 3D structure of the REV; (b) single pore structure characterization; (c) transverse view of the REV.
Jmse 12 01056 g003
Figure 4. Workflow of the theoretical model for foamed PGCs.
Jmse 12 01056 g004
Figure 5. Comparison of predicted thermal conductivity from the proposed model with our test data. Experimental data are represented by points, and results from the proposed model are represented by solid lines.
Jmse 12 01056 g005
Figure 6. Comparison of predicted thermal conductivity from the proposed model with test data from Shen and Zhou [58] and Kamseu et al. [57] Experimental data are represented by points, and results from the proposed model are represented by solid lines.
Jmse 12 01056 g006
Figure 7. Comparison of proposed model with the model by Tang et al. [59]. Predicted results of previous model are represented by points, and results from the proposed model are represented by solid lines.
Jmse 12 01056 g007
Figure 8. Comparison of predicted compressive strength from the theoretical model with our test data: (a) Experimental data of 7 d samples. (b) Experimental data of 28 d samples. Experimental data are represented by points, and results from the theoretical model are represented by solid lines.
Jmse 12 01056 g008
Figure 9. Establishment of overall performance index: (a) normalized value of parameters Cc and Ct versus porosity; (b) overall performance index τ versus porosity.
Jmse 12 01056 g009
Figure 10. Experimental results of porosity and the fitting lines versus foam dosage: (a) physical foaming method; (b) chemical foaming method.
Jmse 12 01056 g010
Table 1. Cement-related performance indicators.
Cement Strength GradeChemical Evaluation Index
(%)
Finess (mm)Setting Time (min)Flexural Strength (MPa)Compressive Strength (MPa)
MgOSO3Loss on IgnitionClInitial Setting TimeFinal Setting Time3 d28 d3 d28 d
42.55.003.505.000.060.08456003.506.5016.0042.50
Table 2. Composition analysis of fly ash (wt./%).
CaOSO3Al2O3SiO2P2O5Fe2O3Na2OK2OTiO2SrOClMgOOther
5.221.2436.8749.100.403.130.340.981.830.030.050.680.13
Table 3. Experimental composition of phosphogypsum-based cementitious materials.
SampleHPG (1) (%)FA (2) (%)Quicklime (%)Cement (%)Water–Cement
Ratio
Foaming Agent (%)
Physical foaming methodP-160308700.3002
P-24
P-36
P-48
P-510
P-612
P-714
Chemical foaming methodC-160308700.3001
C-21.5
C-32
C-42.5
(1) HPG is the abbreviation for hemihydrate phosphogypsum. (2) FA is the abbreviation for fly ash.
Disclaimer/Publisher’s Note: The statements, opinions and data contained in all publications are solely those of the individual author(s) and contributor(s) and not of MDPI and/or the editor(s). MDPI and/or the editor(s) disclaim responsibility for any injury to people or property resulting from any ideas, methods, instructions or products referred to in the content.